Exhibit 99.2
Exhibit 99.2
SALLIE MAE
Investor Presentation
APRIL 2014
Forward-Looking Statements
The following information is current as of April 17, 2014 (unless otherwise noted) and should be read in connection with the Annual Report on Form 10-K for the year ended December 31, 2013 filed by SLM Corporation (“Sallie Mae”) with the SEC on February 19, 2014 (the “2013 Form 10-K”), the Registration Statement on Form 10, as amended (the “Form 10”), filed by Navient Corporation (“Navient”) with the Securities and Exchange Commission (the “SEC”) on April 10, 2014, and subsequent reports filed by Sallie Mae and Navient with the SEC. Definitions for capitalized terms in this presentation not defined herein can be found in the 2013
Form 10-K. This presentation contains forward-looking statements and information based on management’s current expectations as of the date of this presentation. Statements that are not historical facts, including statements about the beliefs and expectations of Sallie Mae and statements that assume or are dependent upon future events, are forward-looking statements. Forward-looking statements are subject to risks, uncertainties, assumptions and other factors that may cause actual results to be materially different from those reflected in such forward-looking statements. These factors include, among others: the risks and uncertainties set forth in Item 1A “Risk Factors” and elsewhere in the 2013 Form 10-K, in Risk Factors in the Form 10, and the subsequent filings of Sallie Mae and Navient with the SEC; increases in financing costs; limits on liquidity; increases in costs associated with compliance with laws and regulations; changes in accounting standards and the impact of related changes in significant accounting estimates; any adverse outcomes in any significant litigation to which Sallie Mae is a party; credit risk associated with exposure to third parties, including counterparties to derivative transactions; and changes in the terms of student loans and the educational credit marketplace (including changes resulting from new laws and the implementation of existing laws). Sallie Mae could also be affected by, among other things: changes in its funding costs and availability; reductions to its credit ratings or the credit ratings of the United States of America; failures of operating systems or infrastructure, including those of third-party vendors; damage to business reputation; failures to successfully implement cost-cutting and adverse effects of such initiatives on business; risks associated with restructuring initiatives, including the separation of Sallie Mae and Navient into two distinct publicly traded companies; changes in the demand for educational financing or in financing preferences of lenders, educational institutions, students and their families; changes in law and regulations with respect to the student lending business and financial institutions generally; increased competition from banks and other consumer lenders; the creditworthiness of customers; changes in the general interest rate environment, including the rate relationships among relevant money-market instruments and those of earning assets vs. funding arrangements; changes in general economic conditions; and changes in the demand for debt management services. The preparation of Sallie Mae’s consolidated financial statements also require management to make certain estimates and assumptions, including estimates and assumptions about future events. These estimates or assumptions may prove to be incorrect. All forward-looking statements contained in this release are qualified by these cautionary statements and are made only as of the date of this release. Sallie Mae does not undertake any obligation to update or revise these forward-looking statements to conform the statement to actual results or changes in expectations.
For additional information on the proposed separation of Sallie Mae and Navient, please see the 2013 Form 10-K and Form 10 of Sallie Mae and Navient, respectively.
2
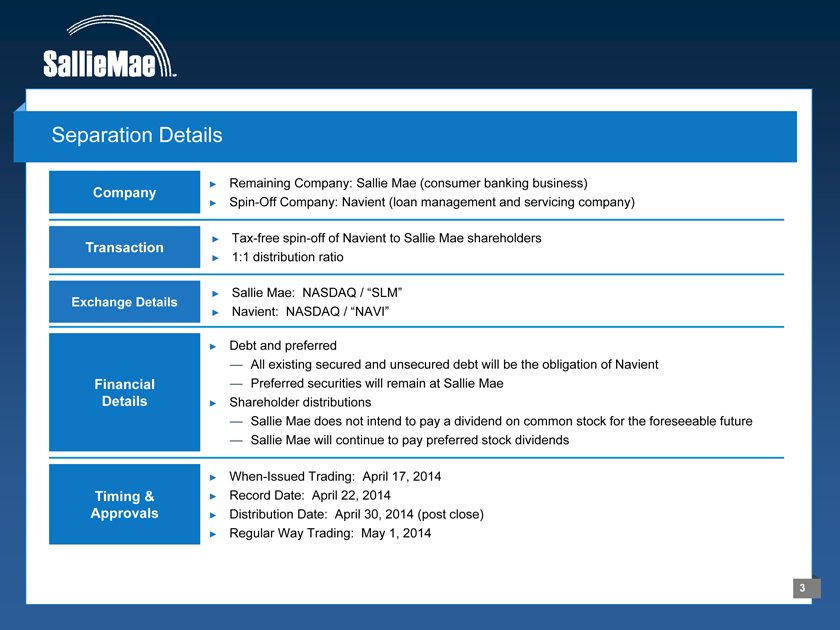
Separation Details
Company
Remaining Company: Sallie Mae (consumer banking business)
Spin-Off Company: Navient (loan management and servicing company)
Transaction
Tax-free spin-off of Navient to Sallie Mae shareholders
1:1 distribution ratio
Exchange Details
Sallie Mae: NASDAQ / “SLM”
Navient: NASDAQ / “NAVI”
Financial Details
Debt and preferred
— All existing secured and unsecured debt will be the obligation of Navient
— Preferred securities will remain at Sallie Mae
Shareholder distributions
— Sallie Mae does not intend to pay a dividend on common stock for the foreseeable future
— Sallie Mae will continue to pay preferred stock dividends
Timing & Approvals
When-Issued Trading: April 17, 2014
Record Date: April 22, 2014
Distribution Date: April 30, 2014 (post close)
Regular Way Trading: May 1, 2014
3
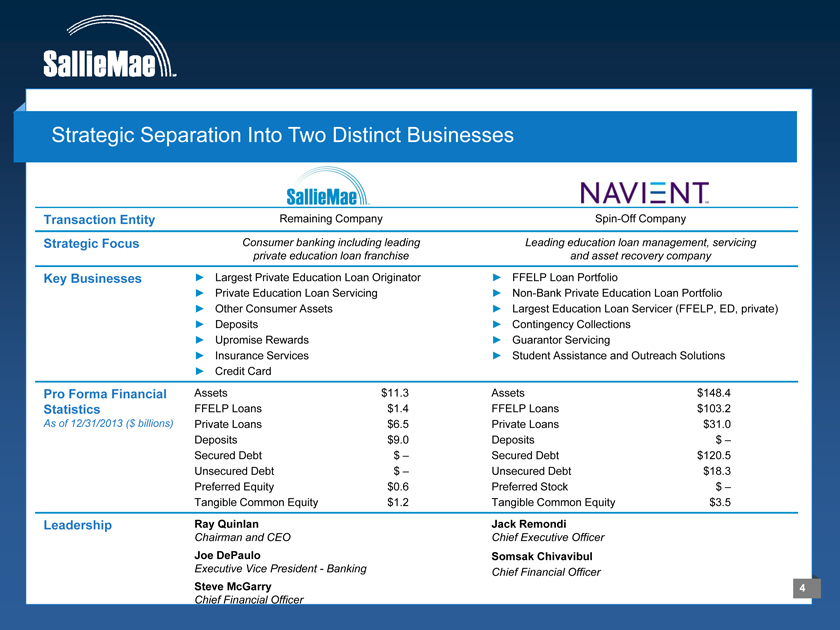
Strategic Separation Into Two Distinct Businesses
Transaction Entity Remaining Company Spin-Off Company
Strategic Focus Consumer banking including leading Leading education loan management, servicing private education loan franchise and asset recovery company
Key Businesses
Largest Private Education Loan Originator
Private Education Loan Servicing
Other Consumer Assets
Deposits
Upromise Rewards
Insurance Services
Credit Card
FFELP Loan Portfolio
Non-Bank Private Education Loan Portfolio
Largest Education Loan Servicer (FFELP, ED, private)
Contingency Collections
Guarantor Servicing
Student Assistance and Outreach Solutions
Pro Forma Financial Statistics
As of 12/31/2013 ($ billions)
Assets $11.3 FFELP Loans $1.4 Private Loans $6.5 Deposits $9.0 Secured Debt $ – Unsecured Debt $ – Preferred Equity $0.6 Tangible Common Equity $1.2
Assets $148.4 FFELP Loans $103.2 Private Loans $31.0 Deposits $ – Secured Debt $120.5 Unsecured Debt $18.3 Preferred Stock $ –Tangible Common Equity $3.5
Leadership
Ray Quinlan
Chairman and CEO
Joe DePaulo
Executive Vice President - Banking
Steve McGarry
Chief Financial Officer
Jack Remondi
Chief Executive Officer
Somsak Chivavibul
Chief Financial Officer
Sallie Mae Investment Highlights
1 Experienced management team with deep industry knowledge
Average of 30+ years of banking and financial services experience
2 Leading brand in the education lending market
40+ years serving the education lending market
50% private education lending market share
3 Simple low cost delivery system
Multi-channel delivery system (on-campus, direct)
40% customer serialization rate and improving
4 Attractive customer base
Higher employment rates for college graduates
90% of portfolio has cosigners; 746 average FICO
Disciplined approach to credit
Robust proprietary scorecard
Strong SmartOption performance; 0.6% ‘13 charge-offs
Strong capital position and 6 funding capabilities
14%+ Total Capital Ratio; all capital ratios significantly in excess of well capitalized
Retail direct deposits; future securitizations
7 Targeting high growth and high return business
Long-term earnings growth target of 20%+
Long-term ROE target of 15%+
Management Presenters
Experienced management team with extensive asset knowledge and industry expertise
Raymond Quinlan
Chairman &
Chief Executive Officer
30+ years of banking and financial services experience
Joined Sallie Mae in 2014
Previously Executive Vice President of Banking at CIT
Previously Chairman & CEO of Citigroup Retail Financial Services
Joseph DePaulo
Executive Vice President—Banking
30+ years of banking and financial services experience
Joined Sallie Mae in 2009 as Executive Vice President & Chief Marketing Officer
Previously Co-Founder & CEO of Credit One Financial Services
Previously U.S. Card group executive at MBNA
Steven McGarry
Chief Financial Officer
30+ years of banking and financial services experience
Joined Sallie Mae in 1997 as a member of the corporate finance team and later took leadership of equity and fixed income investor relations
Previously held various positions in Toronto Dominion’s treasury department
6
Favorable Student Loan Market Trends
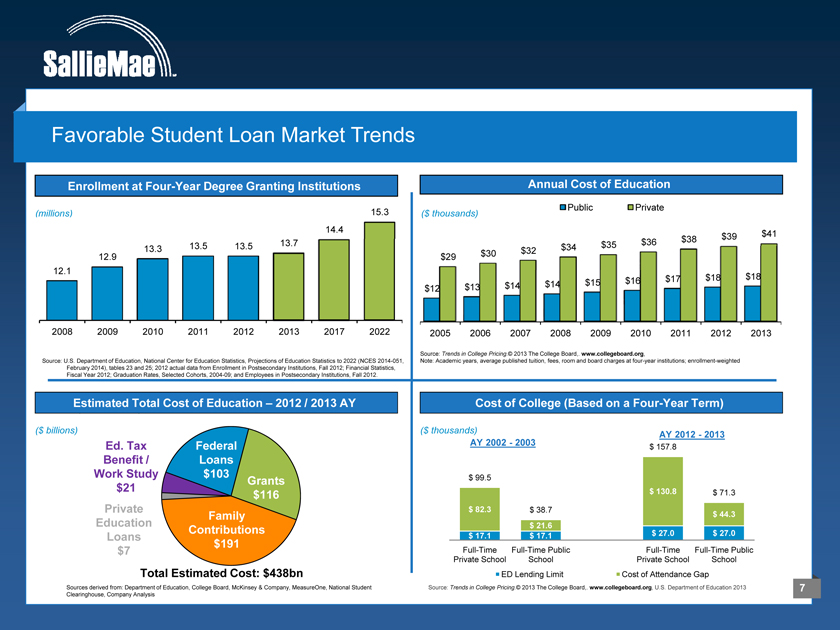
Enrollment at Four-Year Degree Granting Institutions
(millions) 15.3
14.4
13.5 13.5 13.7
12.9 13.3
12.1
2008 2009 2010 2011 2012 2013 2017 2022
Source: U.S. Department of Education, National Center for Education Statistics, Projections of Education Statistics to 2022 (NCES 2014-051, February 2014), tables 23 and 25; 2012 actual data from Enrollment in Postsecondary Institutions, Fall 2012; Financial Statistics, Fiscal Year 2012; Graduation Rates, Selected Cohorts, 2004-09; and Employees in Postsecondary Institutions, Fall 2012.
Annual Cost of Education
Public Private
($ thousands)
$39 $41
$36 $38
$34 $35
$30 $32 $29
$16 $17 $18 $18
$14 $14 $15
$12 $13
2005 2006 2007 2008 2009 2010 2011 2012 2013
Source: Trends in College Pricing.© 2013 The College Board,. www.collegeboard.org,
Note: Academic years, average published tuition, fees, room and board charges at four-year institutions; enrollment-weighted
Estimated Total Cost of Education – 2012 / 2013 AY
($ billions)
Ed. Tax Federal Benefit / Loans Work Study $103 Grants $21 $116 Private Family Education Contributions Loans $191 $7 Total Estimated Cost: $438bn
Sources derived from: Department of Education, College Board, McKinsey & Company, MeasureOne, National Student Clearinghouse, Company Analysis
Cost of College (Based on a Four-Year Term)
($ thousands) AY 2012—2013 AY 2002—2003 $ 157.8
$ 99.5 $ 130.8 $ 71.3
$ 82.3 $ 38.7
$ 44.3
$ 21.6 $ 27.0 $ 27.0
$ 17.1 $ 17.1
Full-Time Full-Time Public Full-Time Full-Time Public Private School School Private School School ED Lending Limit Cost of Attendance Gap
Source: Trends in College Pricing.© 2013 The College Board,. www.collegeboard.org, U.S. Department of Education 2013
Higher Education Value Proposition
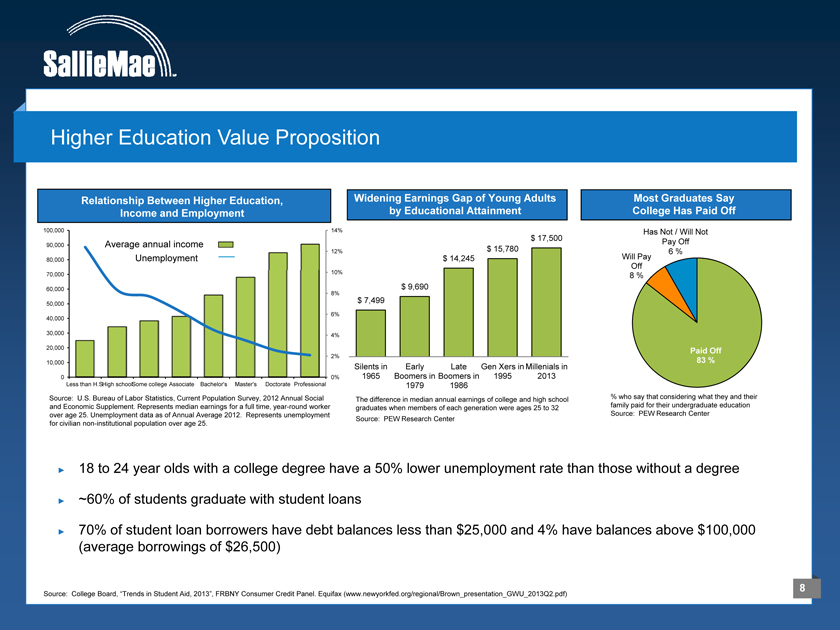
Relationship Between Higher Education, Income and Employment
100,000 14%
90,000 Average annual income
Unemployment 12%
80,000
70,000 10%
60,000
8% 50,000 6% 40,000
30,000 4% 20,000 2% 10,000
0 0% Less than H.SHigh . schoolSome college Associate Bachelor’s Master’s Doctorate Professional
Source: U.S. Bureau of Labor Statistics, Current Population Survey, 2012 Annual Social and Economic Supplement. Represents median earnings for a full time, year-round worker over age 25. Unemployment data as of Annual Average 2012. Represents unemployment for civilian non-institutional population over age 25.
Widening Earnings Gap of Young Adults by Educational Attainment
$ 17,500 $ 15,780 $ 14,245
$ 9,690 $ 7,499
Silents in Early Late Gen Xers in Millenials in 1965 Boomers in Boomers in 1995 2013 1979 1986
The difference in median annual earnings of college and high school graduates when members of each generation were ages 25 to 32 Source: PEW Research Center
Most Graduates Say College Has Paid Off
Has Not / Will Not Pay Off
6 % Will Pay Off
8 %
Paid Off
83 %
% who say that considering what they and their family paid for their undergraduate education Source: PEW Research Center
18 to 24 year olds with a college degree have a 50% lower unemployment rate than those without a degree
~60% of students graduate with student loans
70% of student loan borrowers have debt balances less than $25,000 and 4% have balances above $100,000 (average borrowings of $26,500)
Source: College Board, “Trends in Student Aid, 2013”, FRBNY Consumer Credit Panel. Equifax (www.newyorkfed.org/regional/Brown_presentation_GWU_2013Q2.pdf)
The Sallie Mae Brand
#1 saving, planning and paying for education company with 40-years of leadership in the education lending market
Top ranked brand: 6 out of 10 consumers of education finance recognize the Sallie Mae brand
Industry leading market share in private education lending; 50% market share for 2012 / 2013 AY
Over 2,400 actively managed university relationships across the U.S.
Complementary consumer product offerings
Over one million long-term engaged customers across the Sallie Mae brands
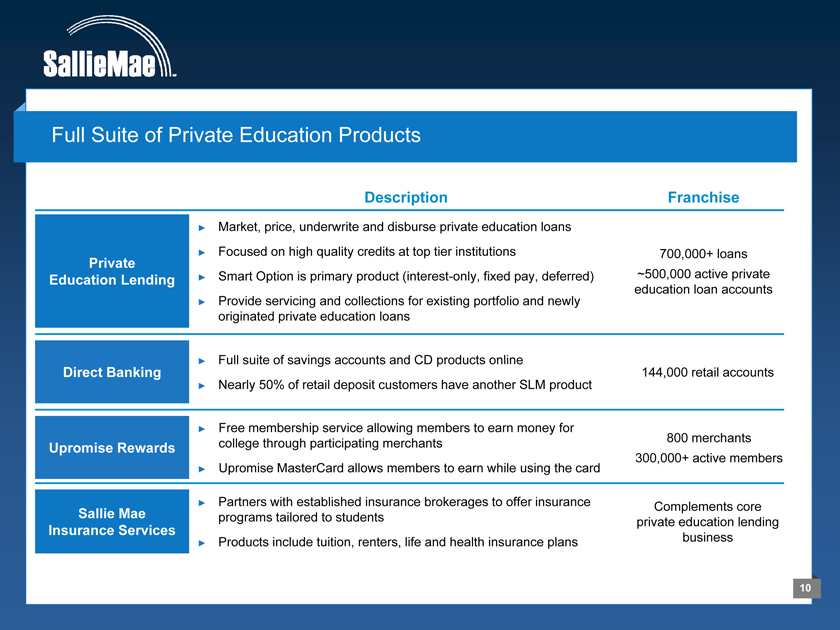
Full Suite of Private Education Products
Description Franchise
Private Education Lending
Market, price, underwrite and disburse private education loans
Focused on high quality credits at top tier institutions
Smart Option is primary product (interest-only, fixed pay, deferred)
Provide servicing and collections for existing portfolio and newly originated private education loans
700,000+ loans
~500,000 active private education loan accounts
Direct Banking
Full suite of savings accounts and CD products online
Nearly 50% of retail deposit customers have another SLM product
144,000 retail accounts
Upromise Rewards
Free membership service allowing members to earn money for college through participating merchants
Upromise MasterCard allows members to earn while using the card
800 merchants 300,000+ active members
Sallie Mae Insurance Services
Partners with established insurance brokerages to offer insurance programs tailored to students
Products include tuition, renters, life and health insurance plans
Complements core private education lending business
10
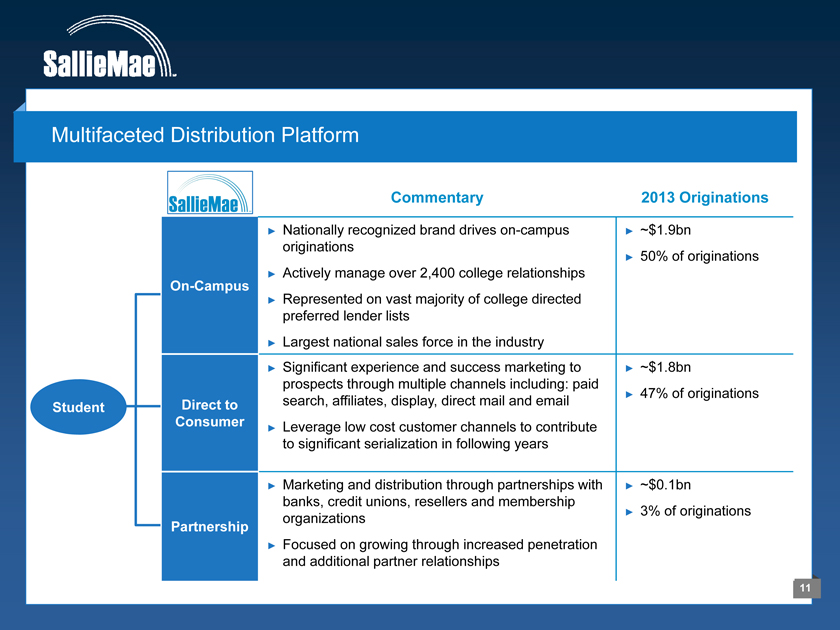
Multifaceted Distribution Platform
Commentary
2013 Originations
Student
On-Campus
Nationally recognized brand drives on-campus originations
Actively manage over 2,400 college relationships
Represented on vast majority of college directed preferred lender lists
Largest national sales force in the industry
~$1.9bn
50% of originations
Direct to Consumer
Significant experience and success marketing to prospects through multiple channels including: paid search, affiliates, display, direct mail and email
Leverage low cost customer channels to contribute to significant serialization in following years
~$1.8bn
47% of originations
Partnership
Marketing and distribution through partnerships with banks, credit unions, resellers and membership organizations
Focused on growing through increased penetration and additional partner relationships
~$0.1bn
3% of originations
11
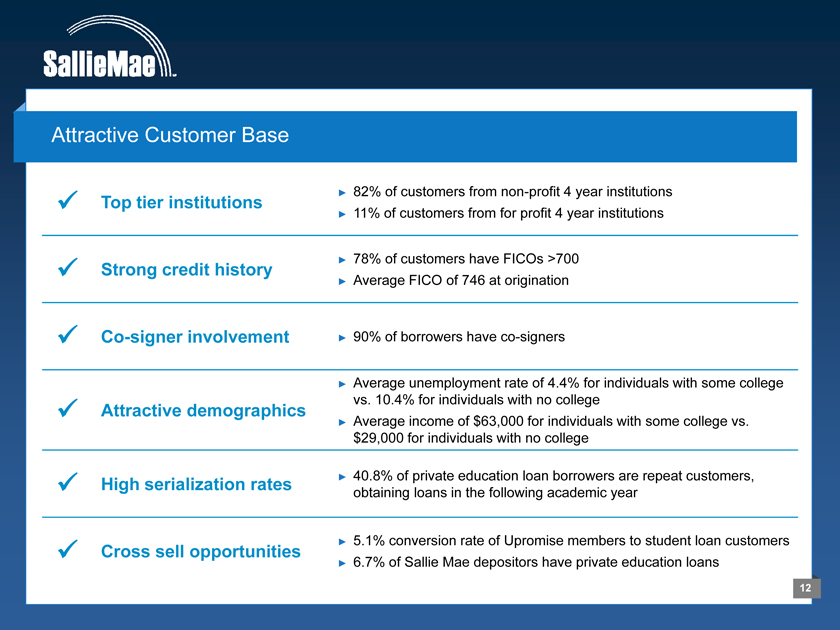
Attractive Customer Base
Top tier institutions
82% of customers from non-profit 4 year institutions
11% of customers from for profit 4 year institutions
Strong credit history
78% of customers have FICOs >700
Average FICO of 746 at origination
Co-signer involvement
90% of borrowers have co-signers
Attractive demographics
Average unemployment rate of 4.4% for individuals with some college vs. 10.4% for individuals with no college
Average income of $63,000 for individuals with some college vs. $29,000 for individuals with no college
High serialization rates
40.8% of private education loan borrowers are repeat customers, obtaining loans in the following academic year
Cross sell opportunities
5.1% conversion rate of Upromise members to student loan customers
6.7% of Sallie Mae depositors have private education loans
12
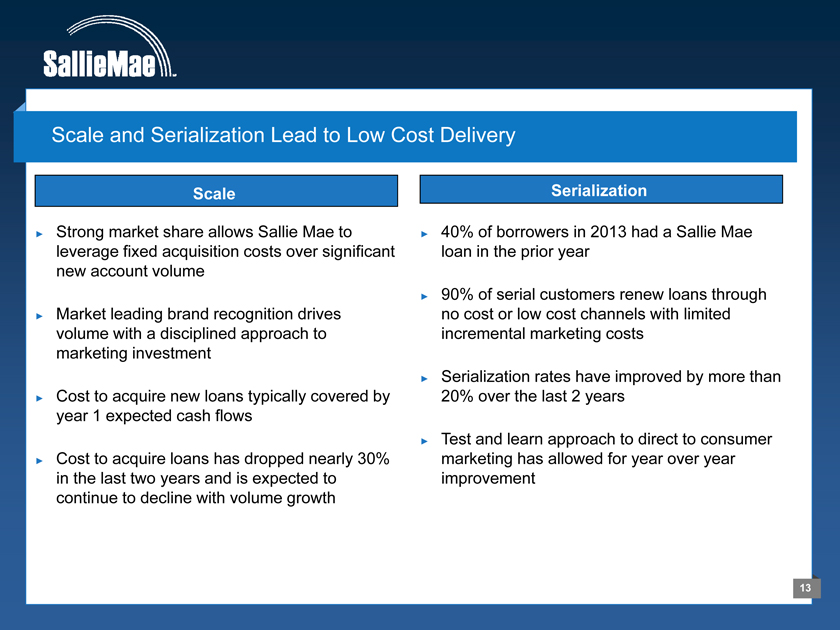
Scale and Serialization Lead to Low Cost Delivery
Scale
Strong market share allows Sallie Mae to leverage fixed acquisition costs over significant new account volume
Market leading brand recognition drives volume with a disciplined approach to marketing investment
Cost to acquire new loans typically covered by year 1 expected cash flows
Cost to acquire loans has dropped nearly 30% in the last two years and is expected to continue to decline with volume growth
Serialization
40% of borrowers in 2013 had a Sallie Mae loan in the prior year
90% of serial customers renew loans through no cost or low cost channels with limited incremental marketing costs
Serialization rates have improved by more than 20% over the last 2 years
Test and learn approach to direct to consumer marketing has allowed for year over year improvement
13
Unique Smart Option Product Leads Private Education Lending Market
Smart Option student loan product first introduced in 2009
Offers three repayment options designed to help borrowers balance their goals and budget while in school
– Interest Only: requires interest only payment during in-school period
– Fixed Repayment: requires $25 monthly payments during in-school period
– Deferred Repayment: allows the customer to defer payments while in-school
Variable and Fixed Interest Rate Options
Repayment term is driven by cumulative amount borrowed and grade level
Regular communication with customers and cosigners during in-school period
Full collection activities are employed at both the customer and cosigner level
All loans are certified by the school’s financial aid office to ensure that proceeds are used for education expenses
14
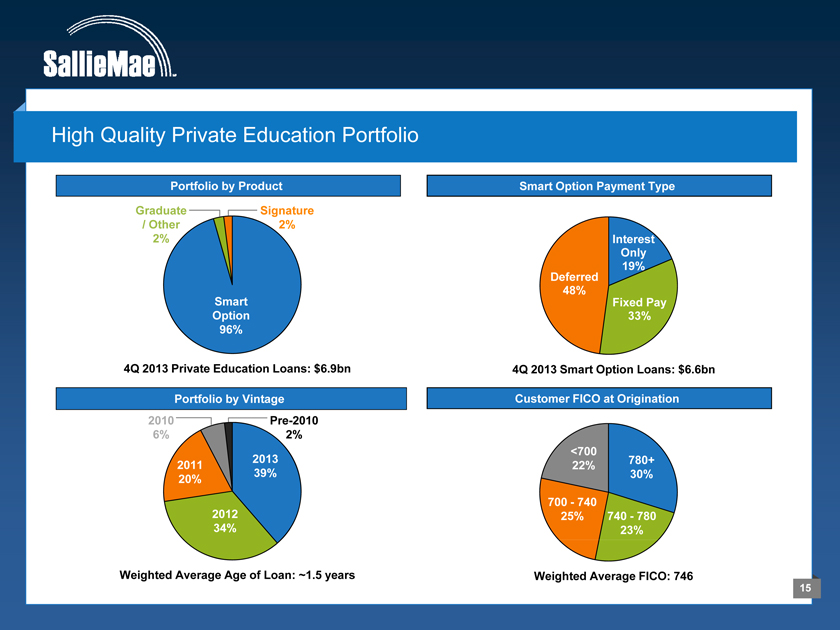
High Quality Private Education Portfolio
Portfolio by Product
Graduate Signature / Other 2% 2%
Smart Option 96%
4Q 2013 Private Education Loans: $6.9bn
Smart Option Payment Type
Interest Only Deferred 19% 48% Fixed Pay 33%
4Q 2013 Smart Option Loans: $6.6bn
Portfolio by Vintage
2010 Pre-2010
6% 2%
2013 2011 39% 20%
2012 34%
Weighted Average Age of Loan: ~1.5 years
Customer FICO at Origination
<700
22% 780+ 30%
700—740
25% 740—780 23%
Weighted Average FICO: 746
15
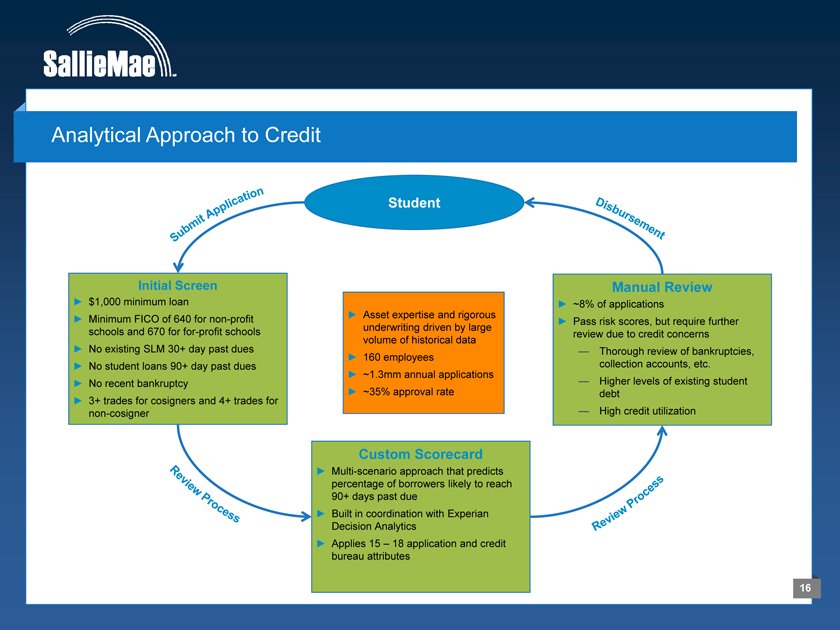
Analytical Approach to Credit
Student
Initial Screen
$1,000 minimum loan
Minimum FICO of 640 for non-profit schools and 670 for for-profit schools
No existing SLM 30+ day past dues
No student loans 90+ day past dues
No recent bankruptcy
3+ trades for cosigners and 4+ trades for non-cosigner
Custom Scorecard
Multi-scenario approach that predicts percentage of borrowers likely to reach 90+ days past due
Built in coordination with Experian Decision Analytics
Applies 15 – 18 application and credit bureau attributes
Asset expertise and rigorous underwriting driven by large volume of historical data
160 employees
~1.3mm annual applications
~35% approval rate
Manual Review
~8% of applications
Pass risk scores, but require further review due to credit concerns
— Thorough review of bankruptcies, collection accounts, etc.
— Higher levels of existing student debt
— High credit utilization
16
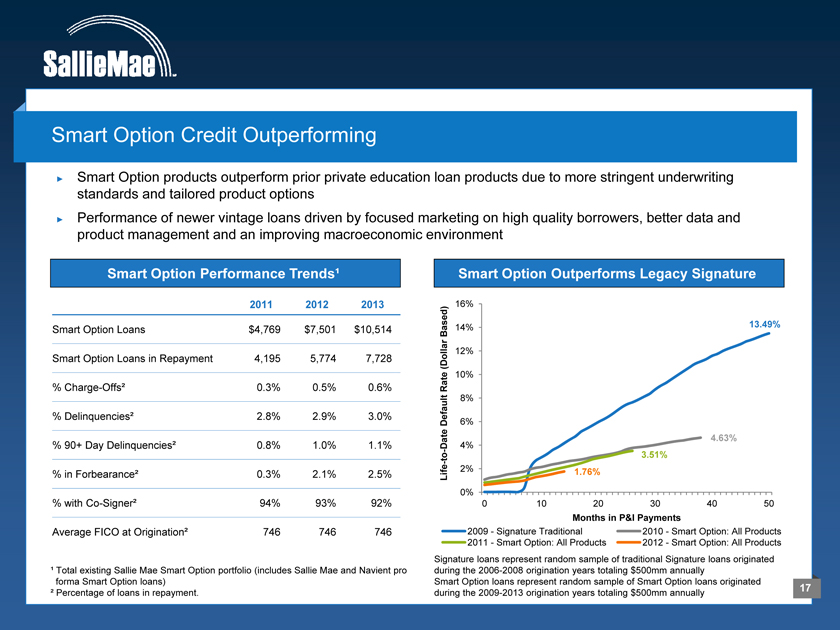
Smart Option Credit Outperforming
Smart Option products outperform prior private education loan products due to more stringent underwriting standards and tailored product options
Performance of newer vintage loans driven by focused marketing on high quality borrowers, better data and product management and an improving macroeconomic environment
Smart Option Performance Trends¹
2011 2012 2013
Smart Option Loans $4,769 $7,501 $10,514
Smart Option Loans in Repayment 4,195 5,774 7,728
% Charge-Offs² 0.3% 0.5% 0.6%
% Delinquencies² 2.8% 2.9% 3.0%
% 90+ Day Delinquencies² 0.8% 1.0% 1.1% % in Forbearance² 0.3% 2.1% 2.5% % with Co-Signer² 94% 93% 92% Average FICO at Origination² 746 746 746
¹ Total existing Sallie Mae Smart Option portfolio (includes Sallie Mae and Navient pro forma Smart Option loans)
² Percentage of loans in repayment.
Smart Option Outperforms Legacy Signature
16%
Based) 14% 13.49% Dollar 12%
( 10% Rate
8%
Default 6%
4.63% Date 4% to - 3.51% -Life 2% 1.76%
0%
0 1020 3040 50
Months in P&I Payments
2009—Signature Traditional 2010—Smart Option: All Products 2011—Smart Option: All Products 2012—Smart Option: All Products
Signature loans represent random sample of traditional Signature loans originated during the 2006-2008 origination years totaling $500mm annually Smart Option loans represent random sample of Smart Option loans originated during the 2009-2013 origination years totaling $500mm annually
17
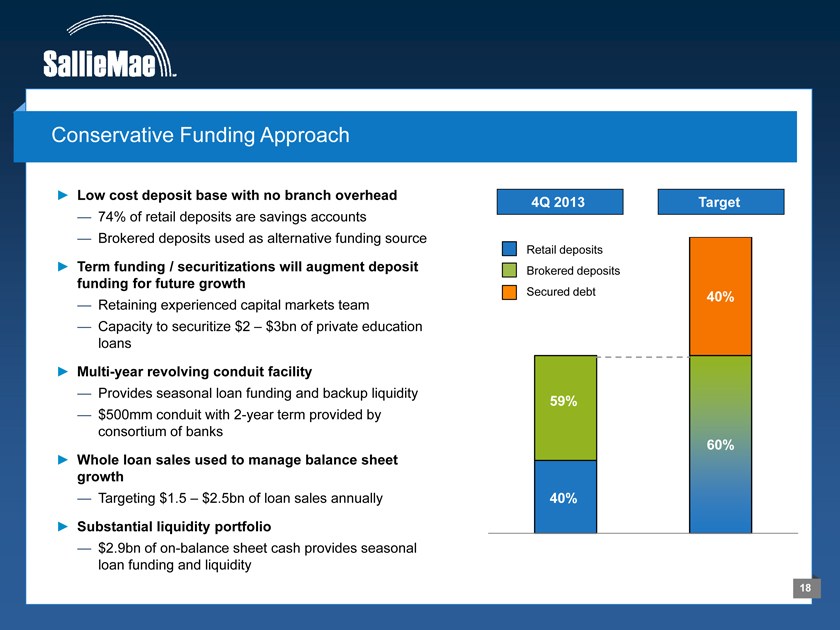
Conservative Funding Approach
Low cost deposit base with no branch overhead
— 74% of retail deposits are savings accounts
— Brokered deposits used as alternative funding source
Term funding / securitizations will augment deposit funding for future growth
— Retaining experienced capital markets team
— Capacity to securitize $2 – $3bn of private education loans
Multi-year revolving conduit facility
— Provides seasonal loan funding and backup liquidity
— $500mm conduit with 2-year term provided by consortium of banks
Whole loan sales used to manage balance sheet growth
— Targeting $1.5 – $2.5bn of loan sales annually
Substantial liquidity portfolio
— $2.9bn of on-balance sheet cash provides seasonal loan funding and liquidity
4Q 2013
Target
Retail deposits Brokered deposits Secured debt
59%
40%
40%
60%
18
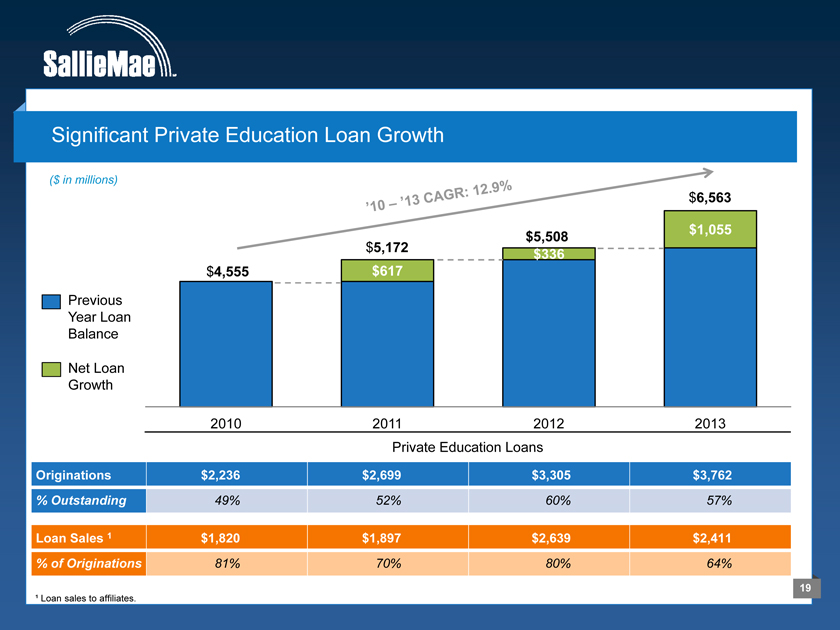
Significant Private Education Loan Growth
($ in millions)
Previous Year Loan Balance
Net Loan Growth
$4,555
2010
$5,172 $617
2011
$5,508 $336
2012
$6,563
$1,055
2013
Private Education Loans
Originations $2,236 $2,699 $3,305 $3,762
% Outstanding 49% 52% 60% 57%
Loan Sales 1 $1,820 $1,897 $2,639 $2,411
% of Originations 81% 70% 80% 64%
19
¹ Loan sales to affiliates.
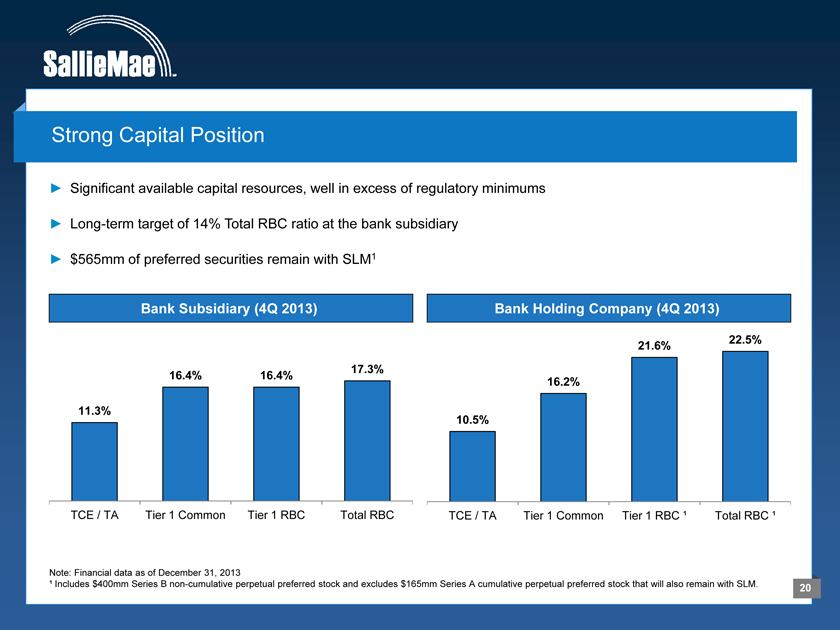
Strong Capital Position
Significant available capital resources, well in excess of regulatory minimums
Long-term target of 14% Total RBC ratio at the bank subsidiary
$565mm of preferred securities remain with SLM1
Bank Subsidiary (4Q 2013)
Bank Holding Company (4Q 2013)
22.5%
21.6%
17.3%
16.4% 16.4%
16.2%
11.3%
10.5%
TCE / TA Tier 1 Common Tier 1 RBC Total RBC TCE / TA Tier 1 Common Tier 1 RBC ¹ Total RBC ¹
Note: Financial data as of December 31, 2013
1 Includes $400mm Series B non-cumulative perpetual preferred stock and excludes $165mm Series A cumulative perpetual preferred stock that will also remain with SLM.
20
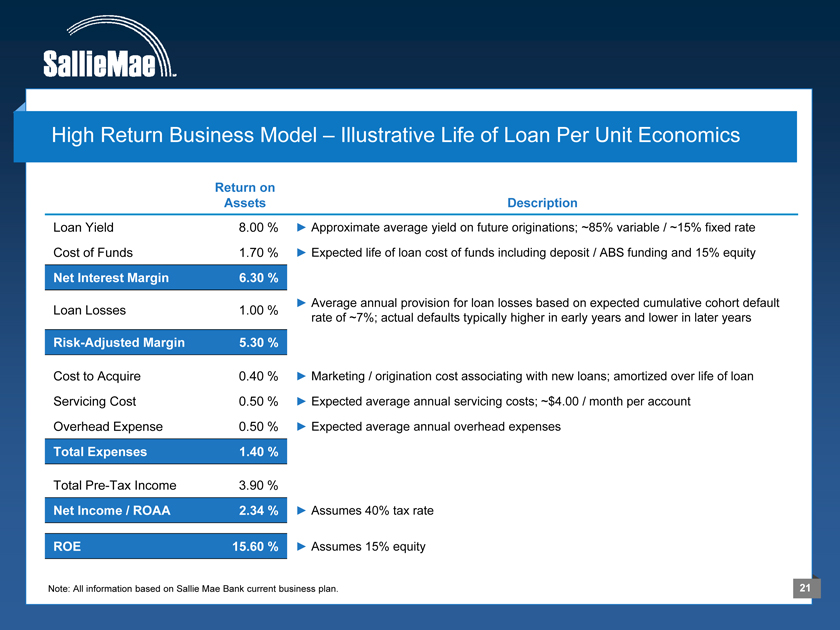
High Return Business Model – Illustrative Life of Loan Per Unit Economics
Return on Assets
Loan Yield 8.00 % Cost of Funds 1.70 %
Net Interest Margin 6.30 %
Loan Losses 1.00 %
Risk-Adjusted Margin 5.30 %
Cost to Acquire 0.40 % Servicing Cost 0.50 % Overhead Expense 0.50 %
Total Expenses 1.40 %
Total Pre-Tax Income 3.90 %
Net Income / ROAA 2.34 %
ROE 15.60 %
Description
Approximate average yield on future originations; ~85% variable / ~15% fixed rate
Expected life of loan cost of funds including deposit / ABS funding and 15% equity
Average annual provision for loan losses based on expected cumulative cohort default rate of ~7%; actual defaults typically higher in early years and lower in later years
Marketing / origination cost associating with new loans; amortized over life of loan
Expected average annual servicing costs; ~$4.00 / month per account
Expected average annual overhead expenses
Assumes 40% tax rate
Assumes 15% equity
21
Note: All information based on Sallie Mae Bank current business plan.
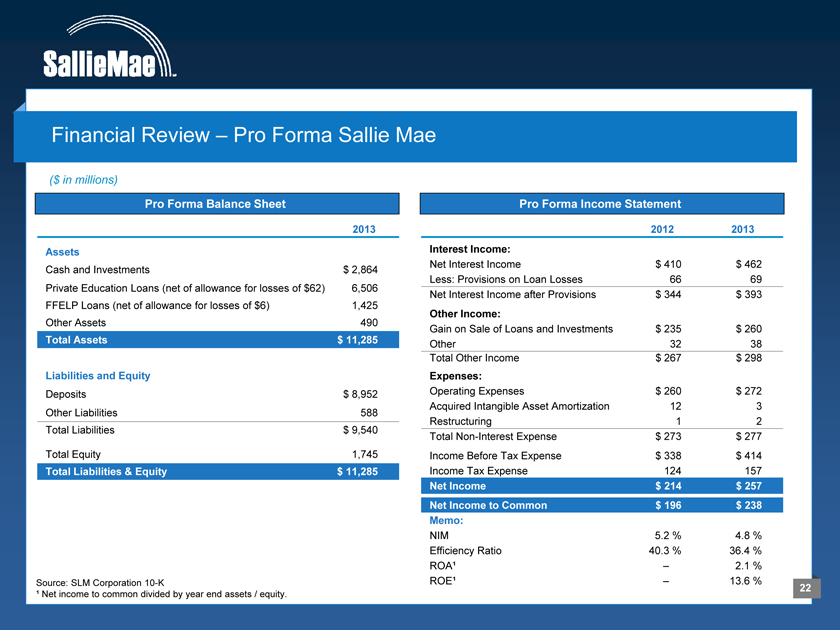
Financial Review – Pro Forma Sallie Mae
($ in millions)
Pro Forma Balance Sheet
2013
Assets
Cash and Investments $ 2,864 Private Education Loans (net of allowance for losses of $62) 6,506 FFELP Loans (net of allowance for losses of $6) 1,425 Other Assets 490
Total Assets $ 11,285
Liabilities and Equity
Deposits $ 8,952 Other Liabilities 588 Total Liabilities $ 9,540
Total Equity 1,745
Total Liabilities & Equity $ 11,285
Source: SLM Corporation 10-K
¹ Net income to common divided by year end assets / equity.
Pro Forma Income Statement
2012 2013 Interest Income:
Net Interest Income $ 410 $ 462 Less: Provisions on Loan Losses 66 69 Net Interest Income after Provisions $ 344 $ 393
Other Income:
Gain on Sale of Loans and Investments $ 235 $ 260 Other 32 38 Total Other Income $ 267 $ 298
Expenses:
Operating Expenses $ 260 $ 272 Acquired Intangible Asset Amortization 12 3 Restructuring 1 2 Total Non-Interest Expense $ 273 $ 277 Income Before Tax Expense $ 338 $ 414 Income Tax Expense 124 157
Net Income $ 214 $ 257 Net Income to Common $ 196 $ 238 Memo:
NIM 5.2 % 4.8 % Efficiency Ratio 40.3 % 36.4 % ROA1 – 2.1 % ROE1 – 13.6 %
22
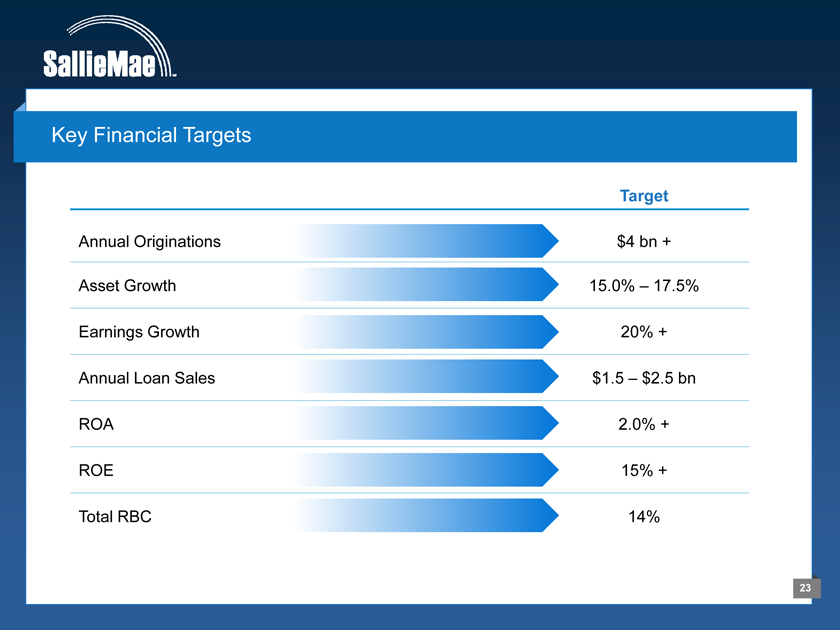
Key Financial Targets
Target
Annual Originations $4 bn +
Asset Growth 15.0% – 17.5%
Earnings Growth 20% + Annual Loan Sales $1.5 – $2.5 bn ROA 2.0% + ROE 15% + Total RBC 14%
23
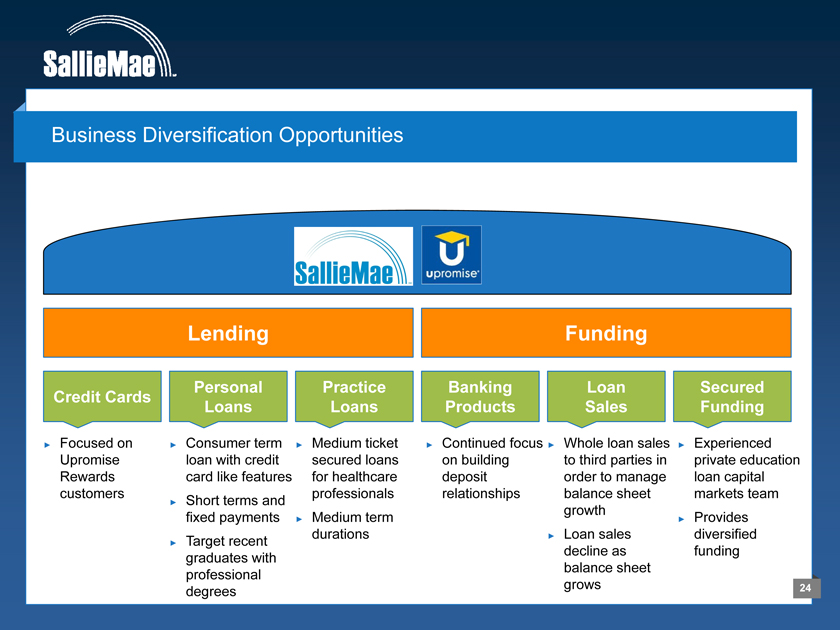
Business Diversification Opportunities
Lending
Funding
Credit Cards
Focused on Upromise Rewards customers
Personal Loans
Consumer term loan with credit card like features
Short terms and fixed payments
graduates with professional degrees
Practice Loans
Medium ticket secured loans for healthcare professionals Medium term durations
Banking Products
Continued focus on building deposit relationships
Loan Sales
Whole loan sales to third parties in order to manage balance sheet growth Loan sales decline as balance sheet grows
Secured Funding
Experienced private education loan capital markets team
Provides diversified funding
24
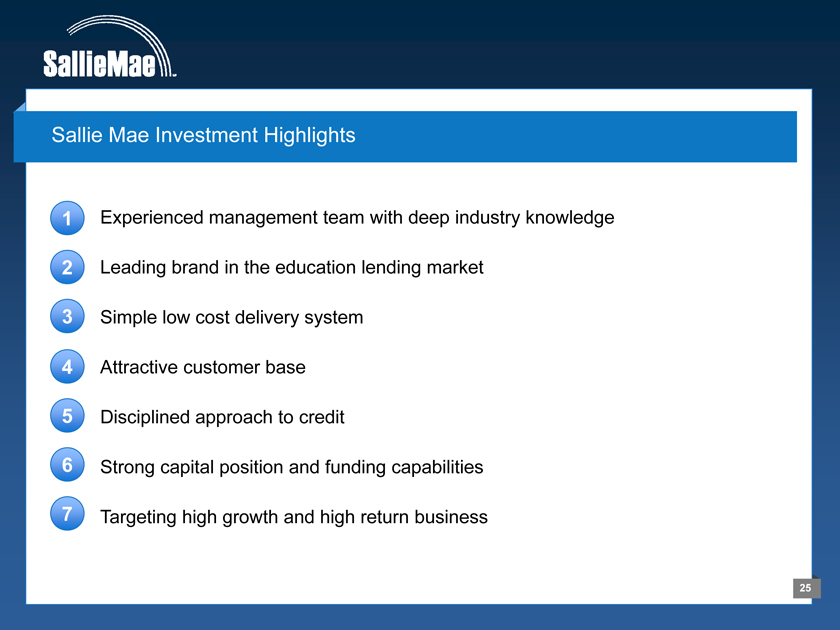
Sallie Mae Investment Highlights
1 Experienced management team with deep industry knowledge
Leading brand in the education lending market
3 Simple low cost delivery system
4 Attractive customer base
5 Disciplined approach to credit
6 Strong capital position and funding capabilities
7 Targeting high growth and high return business
25