Exhibit 99.1
Exhibit 99.1
Bank of America Merrill Lynch 2015 Leveraged Finance Conference
December 3, 2015
Forward-Looking Statements; Non-GAAP Financial
Measures
The following information is current as of December 3, 2015 (unless otherwise noted) and should be read in connection with Navient Corporation’s (Navient) Annual Report on Form 10-K for the year ended December 31, 2014 (the “2014 Form 10-K”), filed by Navient with the Securities and Exchange Commission (the “SEC”) on February 27, 2015 and subsequent reports filed by Navient with the SEC. Definitions for capitalized terms in this presentation not defined herein can be found in our 2014 Form 10-K. This presentation contains forward-looking statements and information based on management’s current expectations as of the date of this presentation. Statements that are not historical facts, including statements about the company’s beliefs, opinions or expectations and statements that assume or are dependent upon future events, are forward-looking statements. Forward-looking statements are subject to risks, uncertainties, assumptions and other factors that may cause actual results to be materially different from those reflected in such forward-looking statements. These factors include, among others, the risks and uncertainties set forth in Item 1A “Risk Factors” and elsewhere in Navient’s 2014 Form 10-K and subsequent filings with the SEC; increases in financing costs; limits on liquidity; increases in costs associated with compliance with laws and regulations; changes in accounting standards and the impact of related changes in significant accounting estimates; any adverse outcomes in any significant litigation to which the company is a party; credit risk associated with the company’s exposure to third parties, including counterparties to the company’s derivative transactions; risks inherent in the government contracting environment, including the possible loss of government contracts and potential civil and criminal penalties as a result of governmental investigations or audits; and changes in the terms of student loans and the educational credit marketplace (including changes resulting from new laws and the implementation of existing laws). The company could also be affected by, among other things: changes in its funding costs and availability; reductions to its credit ratings or the credit ratings of the United States of America; failures of its operating systems or infrastructure, or those of third-party vendors; risks related to cybersecurity including the potential disruption of its systems or potential disclosure of confidential customer information; damage to its reputation; failures to successfully implement cost-cutting initiatives and adverse effects of such initiatives on its business; failures or delays in the planned conversion to our servicing platform of the Wells Fargo portfolio of Federal Family Education Loan Program (“FFELP”) loans or any other FFELP or Private Education Loan portfolio acquisitions; risks associated with restructuring initiatives; risks associated with the April 30, 2014 separation of Navient and SLM Corporation into two distinct, publicly traded companies, including failure to achieve the expected benefits of the separation; changes in the demand for educational financing or in financing preferences of lenders, educational institutions, students and their families; changes in law and regulations with respect to the student lending business and financial institutions generally; increased competition including from banks, other consumer lenders and other loan servicers; the creditworthiness of its customers; changes in the general interest rate environment, including the rate relationships among relevant money-market instruments and those of its earning assets vs. its funding arrangements; changes in general economic conditions; the company’s ability to successfully effectuate any acquisitions and other strategic initiatives; and changes in the demand for debt management services.
The preparation of the company’s consolidated financial statements also requires management to make certain estimates and assumptions including estimates and assumptions about future events. These estimates or assumptions may prove to be incorrect. All forward-looking statements contained in this presentation are qualified by these cautionary statements and are made only as of the date of this presentation. The company does not undertake any obligation to update or revise these forward-looking statements to conform the statement to actual results or changes in its expectations.
Navient reports financial results on a GAAP basis and also provides certain core earnings performance measures. When compared to GAAP results, core earnings exclude the impact of: (1) the financial results of the consumer banking business for historical periods prior to the April 30, 2014 spin-off as well as related restructuring and reorganization expenses incurred in connection with the spin-off, including the restructuring initiated in the second quarter of 2015; (2) unrealized, mark-to-market gains/losses on derivatives; and (3) goodwill and acquired intangible asset amortization and impairment. Navient provides core earnings measures because this is what management uses when making management decisions regarding Navient’s performance and the allocation of corporate resources. Navient core earnings are not defined terms within GAAP and may not be comparable to similarly titled measures reported by other companies. For additional information, see “Core Earnings — Definition and Limitations” in Navient’s third quarter earnings release for a further discussion and a complete reconciliation between GAAP net income and core earnings.
Confidential and proprietary information © 2015 Navient Solutions, Inc. All rights reserved. 2
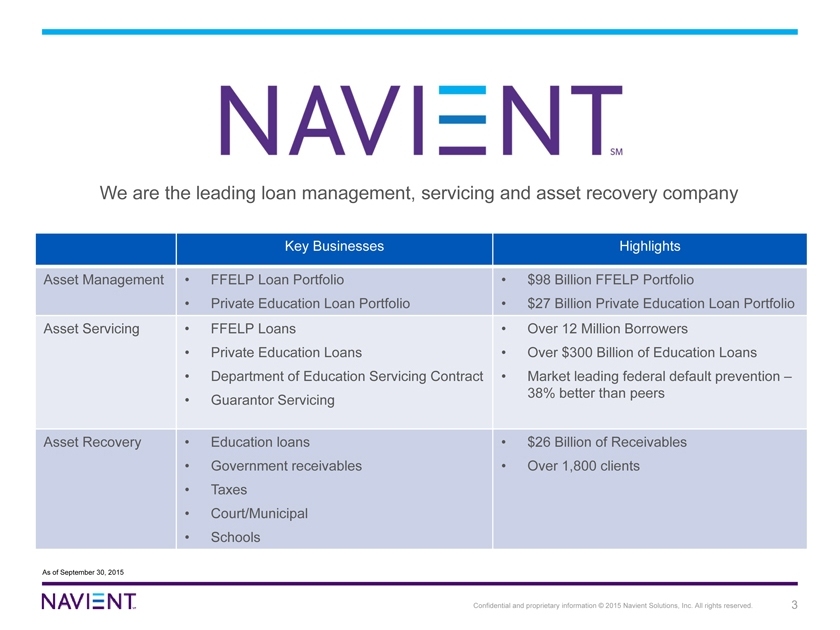
We are the leading loan management, servicing and asset recovery company
Asset Management
Asset Servicing
Asset Recovery
Key Businesses
Highlights
FFELP Loan Portfolio
Private Education Loan Portfolio FFELP Loans Private Education Loans
Department of Education Servicing Contract Guarantor Servicing
Education loans
Government receivables Taxes Court/Municipal Schools
$98 Billion FFELP Portfolio
$27 Billion Private Education Loan Portfolio Over 12 Million Borrowers Over $300 Billion of Education Loans Market leading federal default prevention – 38% better than peers
$26 Billion of Receivables Over 1,800 clients
Confidential and proprietary information © 2015 Navient Solutions, Inc. All rights reserved. 3
As of September 30, 2015
Employ a Conservative Long Term Funding Model
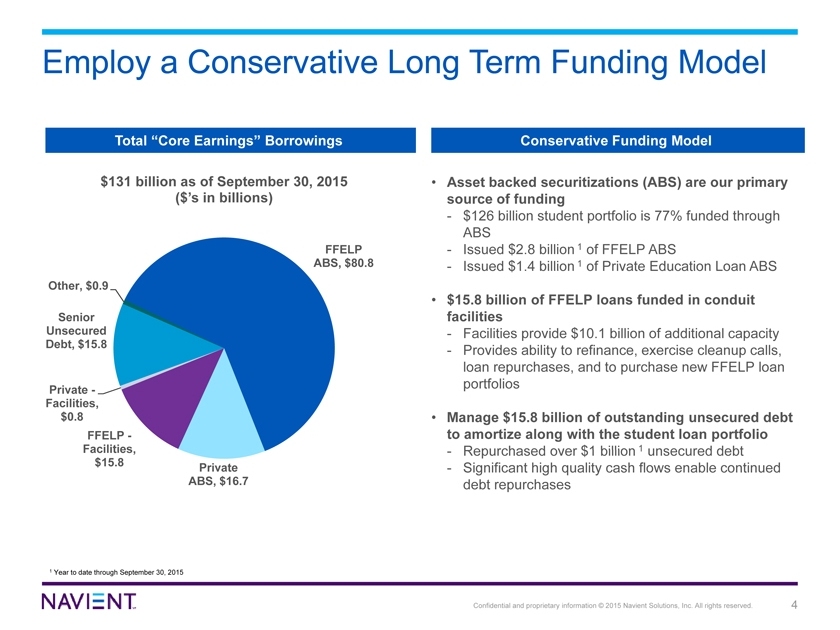
Total “Core Earnings” Borrowings Conservative Funding Model
$131 billion as of September 30, 2015
($’s in billions)
Other, $0.9
Senior Unsecured
Debt, $15.8
Private—
Facilities, $0.8
FFELP—Facilities, $15.8
Private ABS, $16.7
FFELP ABS, $80.8
Asset backed securitizations (ABS) are our primary source of funding
- $126 billion student portfolio is 77% funded through ABS
- Issued $2.8 billion 1 of FFELP ABS
- Issued $1.4 billion 1 of Private Education Loan ABS
$15.8 billion of FFELP loans funded in conduit facilities
- Facilities provide $10.1 billion of additional capacity
- Provides ability to refinance, exercise cleanup calls, loan repurchases, and to purchase new FFELP loan portfolios
Manage $15.8 billion of outstanding unsecured debt to amortize along with the student loan portfolio
- Repurchased over $1 billion 1 unsecured debt
- Significant high quality cash flows enable continued debt repurchases
1 Year to date through September 30, 2015
Confidential and proprietary information © 2015 Navient Solutions, Inc. All rights reserved. 4
Unsecured Debt Maturities
As of September 30, 2015 (par value, $ in billions)
$4.2
$2.8
$2.5
$2.1
$1.8
$1.2
$0.8
$0.6
$0.0
2015 2016 2017 2018 2019 2020 2021 2022 2023+
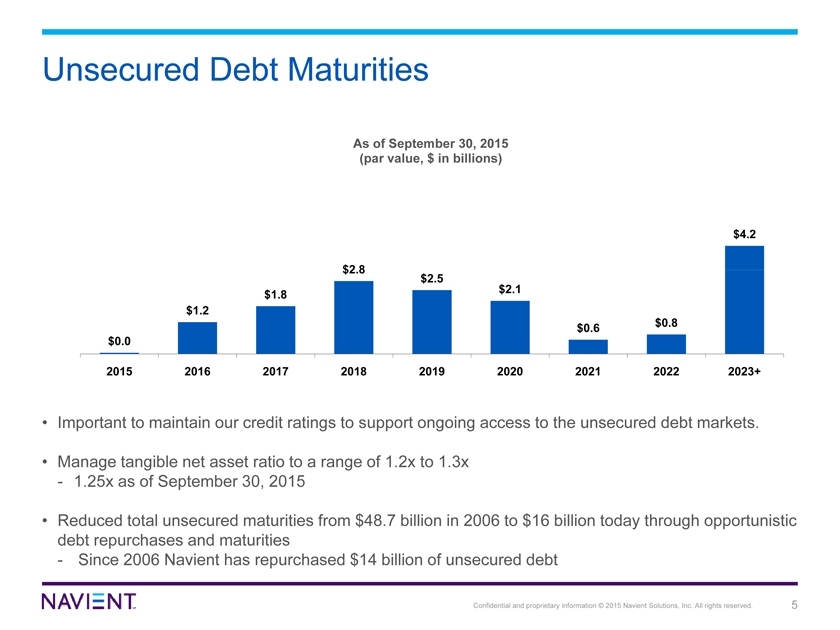
Important to maintain our credit ratings to support ongoing access to the unsecured debt markets.
Manage tangible net asset ratio to a range of 1.2x to 1.3x
- 1.25x as of September 30, 2015
Reduced total unsecured maturities from $48.7 billion in 2006 to $16 billion today through opportunistic debt repurchases and maturities
- Since 2006 Navient has repurchased $14 billion of unsecured debt
Confidential and proprietary information © 2015 Navient Solutions, Inc. All rights reserved. 5
Value Rooted in Portfolio Cash Flows
Projected Life of Loan Cash Flows over ~20 Years
$’s in Billions
FFELP Cash Flows 9/30/15
Secured
Residual (including O/C) $6.7
Floor Income 2.2
Servicing 3.7
Total Secured $12.6
Unencumbered 1.3
Total FFELP Cash Flows $13.9
Private Credit Cash Flows
Secured
Residual (including O/C) $12.9
Servicing 1.2
Total Secured $14.1
Unencumbered 4.9
Total Private Cash Flows $19.0
Combined Cash Flows
before Unsecured Debt $32.9
These projections are based on internal estimates and assumptions and are subject to ongoing review and modification. These projections may prove to be incorrect.
Enhancing Cash Flows
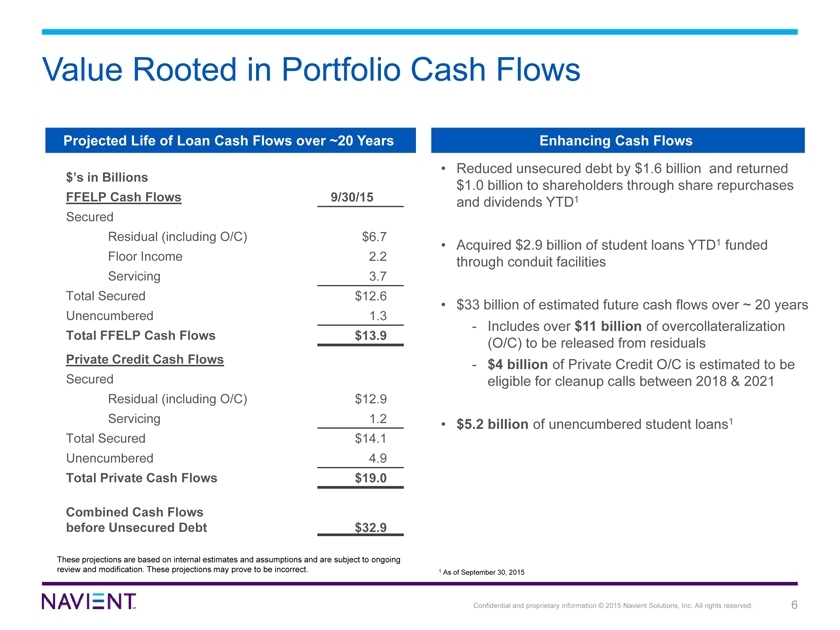
Reduced unsecured debt by $1.6 billion and returned $1.0 billion to shareholders through share repurchases and dividends YTD1
Acquired $2.9 billion of student loans YTD1 funded through conduit facilities
$33 billion of estimated future cash flows over ~ 20 years
- Includes over $11 billion of overcollateralization (O/C) to be released from residuals
- $4 billion of Private Credit O/C is estimated to be eligible for cleanup calls between 2018 & 2021
$5.2 billion of unencumbered student loans1
1 As of September 30, 2015
Confidential and proprietary information © 2015 Navient Solutions, Inc. All rights reserved. 6
Opportunity to Finance Private Education Loan
Overcollateralization (“O/C”)
Private Education Loan Turbo Trusts OC%
70%
60%
53% 55%
51%
49%
50% 45%
45% 44%
41%
40% 36%
31%
31%
30% 26% 27% 27%
26% 25% 26%
23%
21% 21%
19%
18%
20% 15%
13%
10%
0%
10-A 11-A 11-B 11-C 12-A 12-B 12-C 12-D 12-E 13-A 13-B 13-C
Current* At Issuance
* As of November 15, 2015, O/C is calculated as 100% minus the current aggregate principal balance of the notes divided by the asset balance
Overview
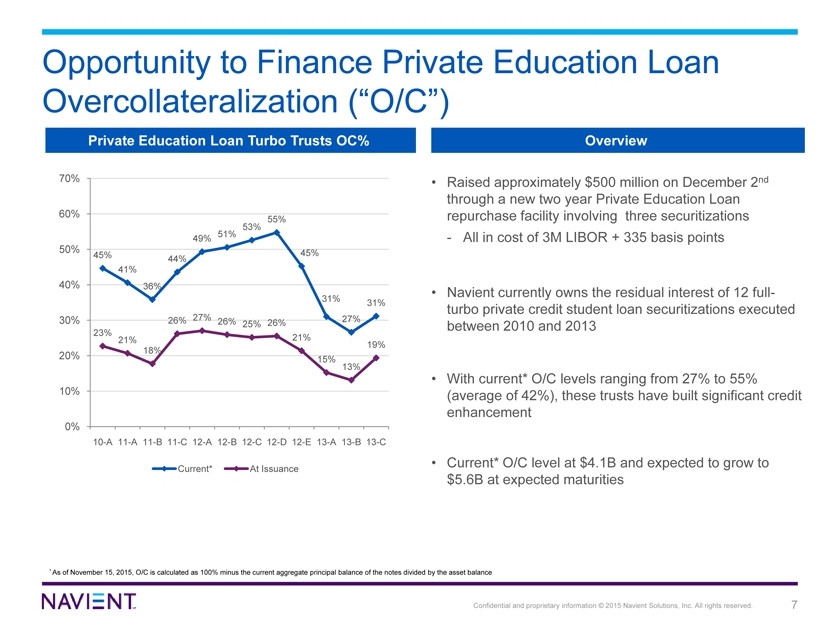
Raised approximately $500 million on December 2nd through a new two year Private Education Loan repurchase facility involving three securitizations
- All in cost of 3M LIBOR + 335 basis points
Navient currently owns the residual interest of 12 full-turbo private credit student loan securitizations executed between 2010 and 2013
With current* O/C levels ranging from 27% to 55%
(average of 42%), these trusts have built significant credit enhancement
Current* O/C level at $4.1B and expected to grow to $5.6B at expected maturities
Confidential and proprietary information © 2015 Navient Solutions, Inc. All rights reserved. 7
Update on FFELP ABS Environment
Navient is working with the rating agencies and developing actions to support our investors and the continued investment-grade ratings status of our FFELP ABS
- Navient submitted formal response to Moody’s on October 19th
- Fitch announced a comment deadline of December 31, 2015
Launched process to extend the Legal Final Maturity Date on bonds in select trusts
Exercised cleanup call option on 18 trusts totaling $1.5 billion since 20141 and funded the associated loans through conduit facilities
Amended 33 trusts to include 10% optional servicer purchase rights and have exercised loan repurchased rights of $449 million since 20141
1 As of October 31, 2015
Confidential and proprietary information © 2015 Navient Solutions, Inc. All rights reserved. 8
Strong Private Education Portfolio Credit
Performance
Private Education Loan % of Portfolio Outstanding by Segment
Private Education Loan Charge-Off1 Rate by Segment
100%
11% 11% 10% 9% 8% 8% 90% 14% 13% 80% 25% 24% 24% 27% 29% 29% 28% 29%
70% 60% 50%
40%
66% 68% 68% 30% 61% 64% 57% 59% 60%
20%
10%
0%
Dec 08 Dec 09 Dec 10 Dec 11 Dec 12 Dec 13 Dec 14 Sept 15
Low Risk Moderate Risk Elevated Risk
25%
21.3%
20%
17.3%
Rate 15% off 12.6%
- 11.1% 10.4%
9.4%
10% 7.7%
Charge 6.8% 7.2%
6.7% 5.6%
5.4% 4.6%
5% 6.3% 3.6% 3.7%
2.9% 5.6%
4.3% 3.9%
2.8%
2.6% 2.7% 3.1% 2.6%
2.3% 1.8% 1.7% 2.6%
1.0% 2.1% 1.7% 0% 2008 2009 2010 2011 2012 2013 2014 YTD 2015 Low Risk Moderate Risk Elevated Risk Overall Portfolio
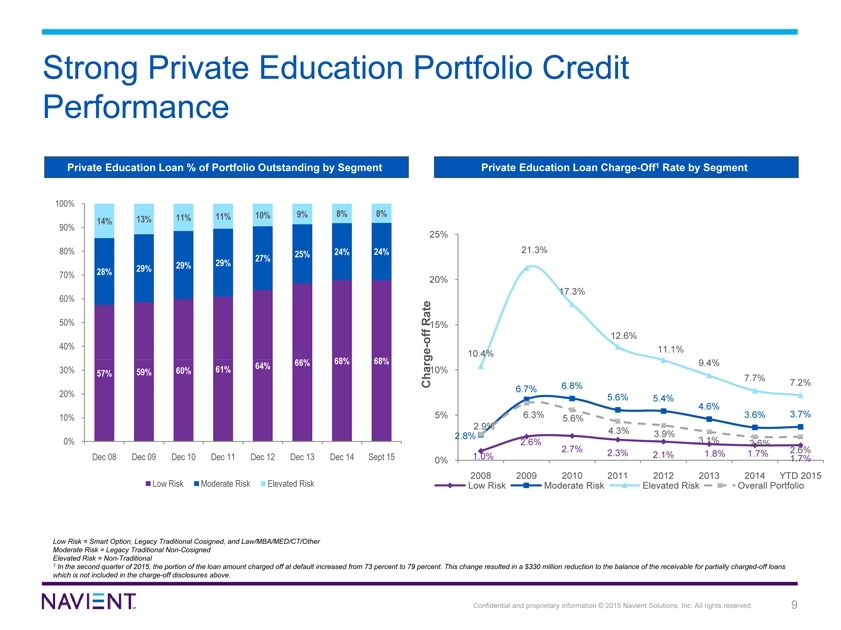
Low Risk = Smart Option, Legacy Traditional Cosigned, and Law/MBA/MED/CT/Other Moderate Risk = Legacy Traditional Non-Cosigned Elevated Risk = Non-Traditional
1 In the second quarter of 2015, the portion of the loan amount charged off at default increased from 73 percent to 79 percent. This change resulted in a $330 million reduction to the balance of the receivable for partially charged-off loans which is not included in the charge-off disclosures above.
Confidential and proprietary information © 2015 Navient Solutions, Inc. All rights reserved. 9
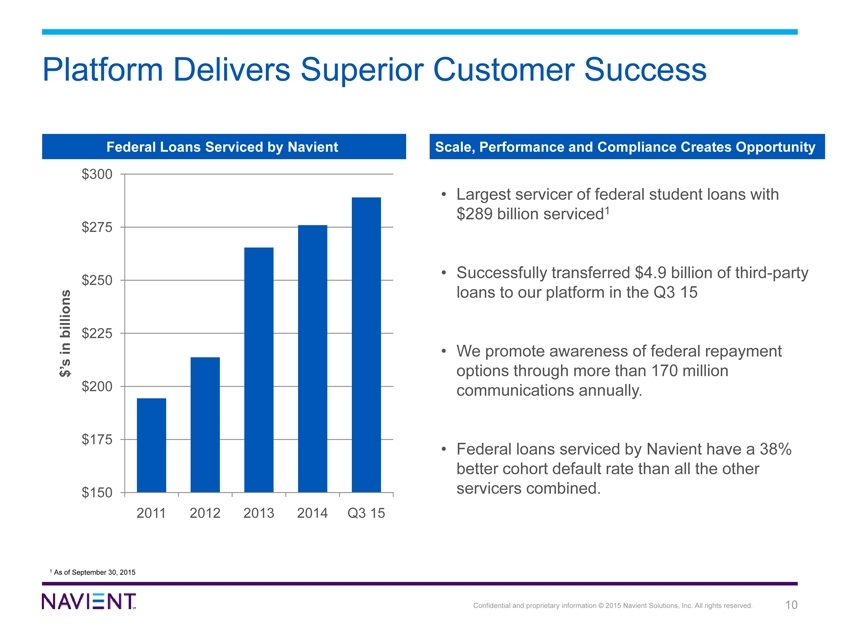
Platform Delivers Superior Customer Success
Federal Loans Serviced by Navient
$300
$275
$250 billions $225 in $ ’s $200
$175
$150
2011 2012 2013 2014 Q3 15
1 As of September 30, 2015
Scale, Performance and Compliance Creates Opportunity
Largest servicer of federal student loans with $289 billion serviced1
Successfully transferred $4.9 billion of third-party loans to our platform in the Q3 15
We promote awareness of federal repayment options through more than 170 million communications annually.
Federal loans serviced by Navient have a 38% better cohort default rate than all the other servicers combined.
Confidential and proprietary information © 2015 Navient Solutions, Inc. All rights reserved. 10
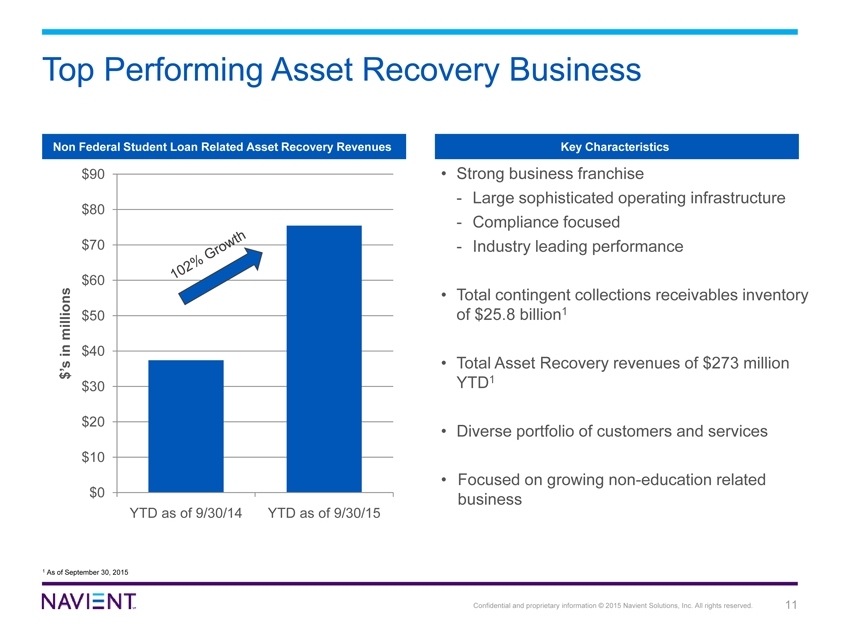
Top Performing Asset Recovery Business
Non Federal Student Loan Related Asset Recovery Revenues
$90
$80
$70
$60
millions $50
in $40
’s
$
$30
$20
$10
$0
YTD as of 9/30/14 YTD as of 9/30/15
1 As of September 30, 2015
Key Characteristics
Strong business franchise
- Large sophisticated operating infrastructure
- Compliance focused
- Industry leading performance
Total contingent collections receivables inventory of $25.8 billion1
Total Asset Recovery revenues of $273 million YTD1
Diverse portfolio of customers and services
Focused on growing non-education related business
Confidential and proprietary information © 2015 Navient Solutions, Inc. All rights reserved. 11
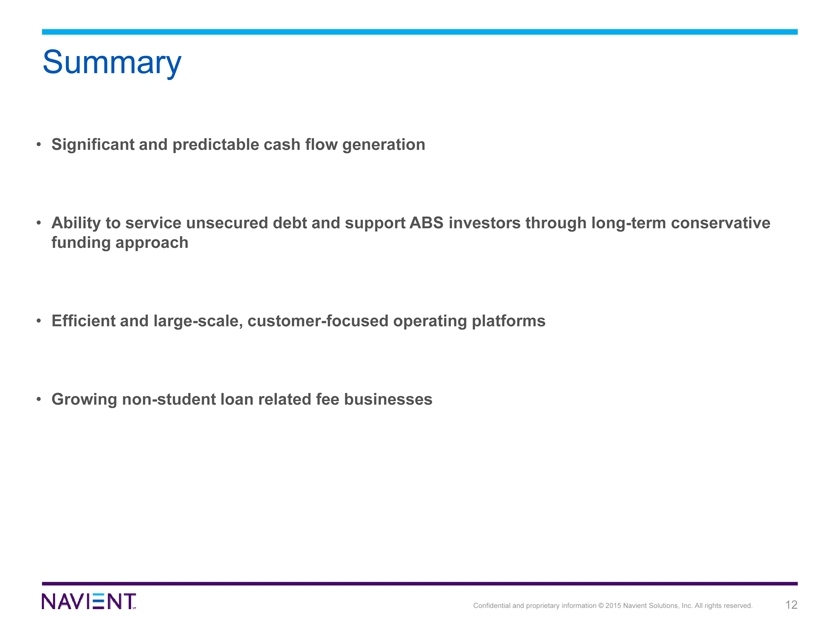
Summary
Significant and predictable cash flow generation
Ability to service unsecured debt and support ABS investors through long-term conservative funding approach
Efficient and large-scale, customer-focused operating platforms
Growing non-student loan related fee businesses
Confidential and proprietary information © 2015 Navient Solutions, Inc. All rights reserved. 12
Appendix
Confidential and proprietary information © 2015 Navient Solutions, Inc. All rights reserved. 13
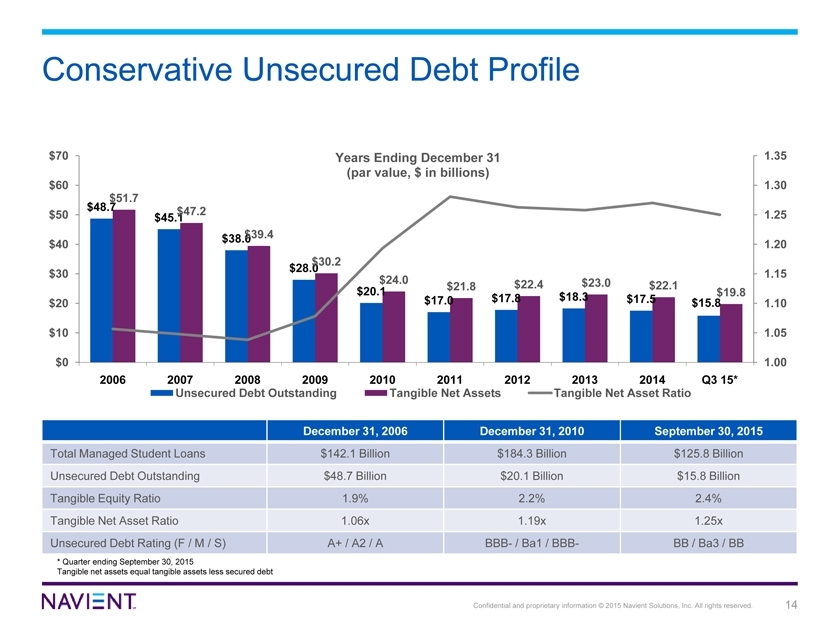
Conservative Unsecured Debt Profile
Years Ending December 31 (par value, $ in billions)
$70
$60
$51.7
$48.7 $47.2
$50 $45.1
$40 $38.0 $39.4 $30
$20
$10
$0
2006 2007 2008
$30.2
$28.0
$24.0 $22.4 $23.0
$21.8 $22.1
$20.1 $19.8
$17.0 $17.8 $18.3 $17.5
$15.8
2009 2010 2011 2012 2013 2014 Q3 15*
1.35
1.30
1.25
1.20
1.15
1.10
1.05
1.00
Unsecured Debt Outstanding Tangible Net Assets Tangible Net Asset Ratio
December 31, 2006 December 31, 2010 September 30, 2015
Total Managed Student Loans $142.1 Billion $184.3 Billion $125.8 Billion
Unsecured Debt Outstanding $48.7 Billion $20.1 Billion $15.8 Billion
Tangible Equity Ratio 1.9% 2.2% 2.4%
Tangible Net Asset Ratio 1.06x 1.19x 1.25x
Unsecured Debt Rating (F / M / S) A+ / A2 / A BBB- / Ba1 / BBB- BB / Ba3 / BB
* Quarter ending September 30, 2015
Tangible net assets equal tangible assets less secured debt
Confidential and proprietary information © 2015 Navient Solutions, Inc. All rights reserved. 14
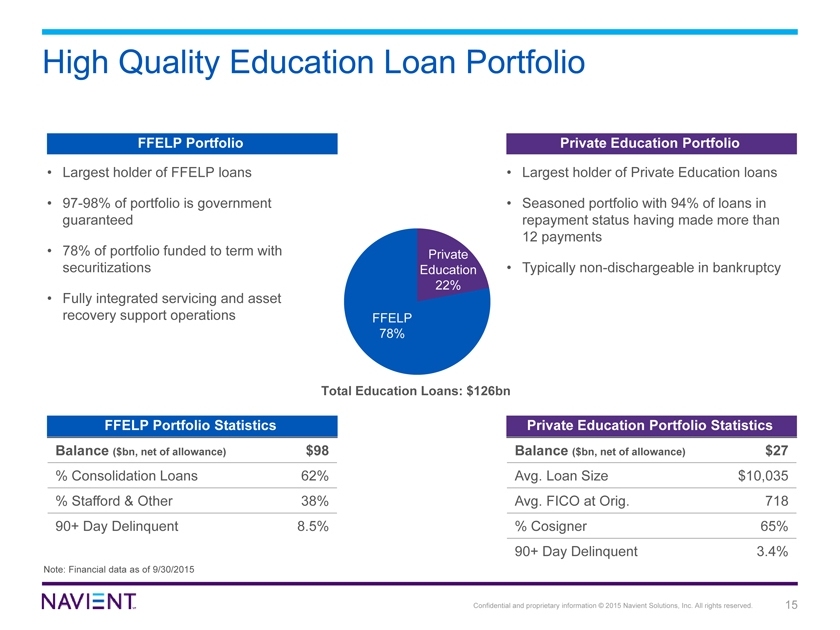
High Quality Education Loan Portfolio
FFELP Portfolio
Largest holder of FFELP loans
97-98% of portfolio is government guaranteed
78% of portfolio funded to term with securitizations
Fully integrated servicing and asset recovery support operations
Private Education Portfolio
Largest holder of Private Education loans
Seasoned portfolio with 94% of loans in repayment status having made more than 12 payments
Typically non-dischargeable in bankruptcy
Private Education 22%
FFELP 78%
Total Education Loans: $126bn
FFELP Portfolio Statistics
Balance ($bn, net of allowance) $98
% Consolidation Loans 62%
% Stafford & Other 38%
90+ Day Delinquent 8.5%
Note: Financial data as of 9/30/2015
Private Education Portfolio Statistics
Balance ($bn, net of allowance) $27
Avg. Loan Size $10,035
Avg. FICO at Orig. 718
% Cosigner 65%
90+ Day Delinquent 3.4%
Confidential and proprietary information © 2015 Navient Solutions, Inc. All rights reserved. 15
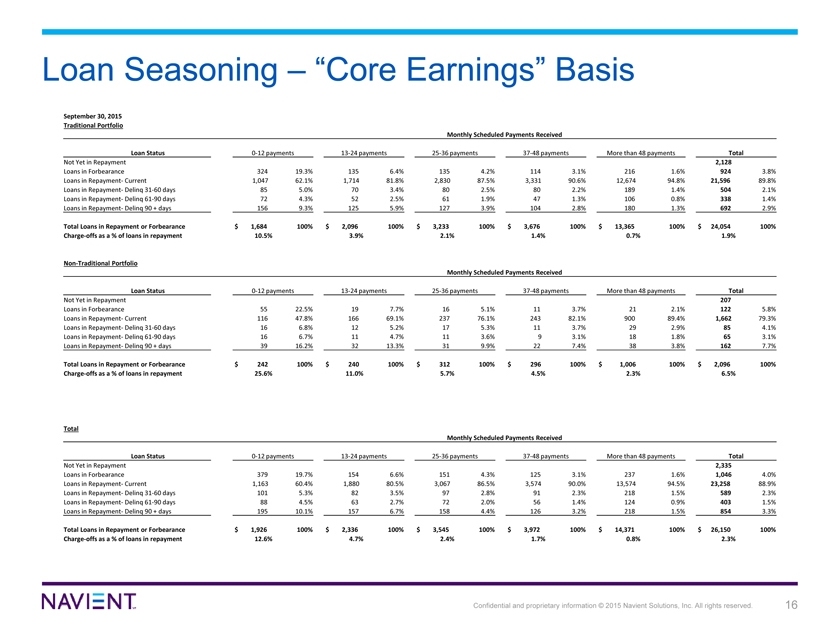
Loan Seasoning – “Core Earnings” Basis
September 30, 2015 Traditional Portfolio
Monthly Scheduled Payments Received
Loan Status 0-12 payments 13-24 payments 25-36 payments 37-48 payments More than 48 payments Total
Not Yet in Repayment 2,128
Loans in Forbearance 324 19.3% 135 6.4% 135 4.2% 114 3.1% 216 1.6% 924 3.8%
Loans in Repayment- Current 1,047 62.1% 1,714 81.8% 2,830 87.5% 3,331 90.6% 12,674 94.8% 21,596 89.8%
Loans in Repayment- Delinq 31-60 days 85 5.0% 70 3.4% 80 2.5% 80 2.2% 189 1.4% 504 2.1%
Loans in Repayment- Delinq 61-90 days 72 4.3% 52 2.5% 61 1.9% 47 1.3% 106 0.8% 338 1.4%
Loans in Repayment- Delinq 90 + days 156 9.3% 125 5.9% 127 3.9% 104 2.8% 180 1.3% 692 2.9%
Total Loans in Repayment or Forbearance $ 1,684 100% $ 2,096 100% $ 3,233 100% $ 3,676 100% $ 13,365 100% $ 24,054 100%
Charge-offs as a % of loans in repayment 10.5% 3.9% 2.1% 1.4% 0.7% 1.9%
Non-Traditional Portfolio
Monthly Scheduled Payments Received
Loan Status 0-12 payments 13-24 payments 25-36 payments 37-48 payments More than 48 payments Total
Not Yet in Repayment 207
Loans in Forbearance 55 22.5% 19 7.7% 16 5.1% 11 3.7% 21 2.1% 122 5.8%
Loans in Repayment- Current 116 47.8% 166 69.1% 237 76.1% 243 82.1% 900 89.4% 1,662 79.3%
Loans in Repayment- Delinq 31-60 days 16 6.8% 12 5.2% 17 5.3% 11 3.7% 29 2.9% 85 4.1%
Loans in Repayment- Delinq 61-90 days 16 6.7% 11 4.7% 11 3.6% 9 3.1% 18 1.8% 65 3.1%
Loans in Repayment- Delinq 90 + days 39 16.2% 32 13.3% 31 9.9% 22 7.4% 38 3.8% 162 7.7%
Total Loans in Repayment or Forbearance $ 242 100% $ 240 100% $ 312 100% $ 296 100% $ 1,006 100% $ 2,096 100%
Charge-offs as a % of loans in repayment 25.6% 11.0% 5.7% 4.5% 2.3% 6.5%
Total
Monthly Scheduled Payments Received
Loan Status 0-12 payments 13-24 payments 25-36 payments 37-48 payments More than 48 payments Total
Not Yet in Repayment 2,335
Loans in Forbearance 379 19.7% 154 6.6% 151 4.3% 125 3.1% 237 1.6% 1,046 4.0%
Loans in Repayment- Current 1,163 60.4% 1,880 80.5% 3,067 86.5% 3,574 90.0% 13,574 94.5% 23,258 88.9%
Loans in Repayment- Delinq 31-60 days 101 5.3% 82 3.5% 97 2.8% 91 2.3% 218 1.5% 589 2.3%
Loans in Repayment- Delinq 61-90 days 88 4.5% 63 2.7% 72 2.0% 56 1.4% 124 0.9% 403 1.5%
Loans in Repayment- Delinq 90 + days 195 10.1% 157 6.7% 158 4.4% 126 3.2% 218 1.5% 854 3.3%
Total Loans in Repayment or Forbearance $ 1,926 100% $ 2,336 100% $ 3,545 100% $ 3,972 100% $ 14,371 100% $ 26,150 100%
Charge-offs as a % of loans in repayment 12.6% 4.7% 2.4% 1.7% 0.8% 2.3%
Confidential and proprietary information © 2015 Navient Solutions, Inc. All rights reserved. 16
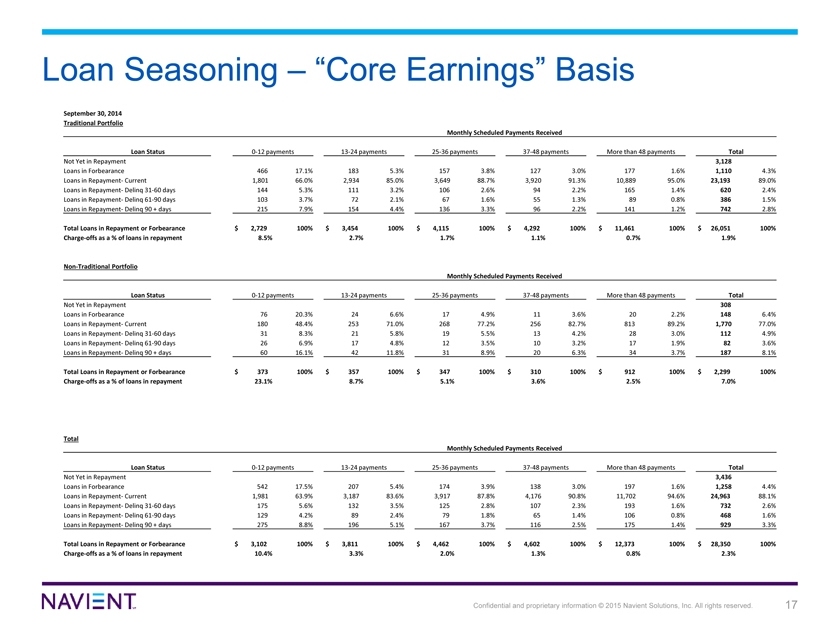
Loan Seasoning – “Core Earnings” Basis
September 30, 2014 Traditional Portfolio
Monthly Scheduled Payments Received
Loan Status 0-12 payments 13-24 payments 25-36 payments 37-48 payments More than 48 payments Total
Not Yet in Repayment 3,128
Loans in Forbearance 466 17.1% 183 5.3% 157 3.8% 127 3.0% 177 1.6% 1,110 4.3%
Loans in Repayment- Current 1,801 66.0% 2,934 85.0% 3,649 88.7% 3,920 91.3% 10,889 95.0% 23,193 89.0%
Loans in Repayment- Delinq 31-60 days 144 5.3% 111 3.2% 106 2.6% 94 2.2% 165 1.4% 620 2.4%
Loans in Repayment- Delinq 61-90 days 103 3.7% 72 2.1% 67 1.6% 55 1.3% 89 0.8% 386 1.5%
Loans in Repayment- Delinq 90 + days 215 7.9% 154 4.4% 136 3.3% 96 2.2% 141 1.2% 742 2.8%
Total Loans in Repayment or Forbearance $ 2,729 100% $ 3,454 100% $ 4,115 100% $ 4,292 100% $ 11,461 100% $ 26,051 100%
Charge-offs as a % of loans in repayment 8.5% 2.7% 1.7% 1.1% 0.7% 1.9%
Non-Traditional Portfolio
Monthly Scheduled Payments Received
Loan Status 0-12 payments 13-24 payments 25-36 payments 37-48 payments More than 48 payments Total
Not Yet in Repayment 308
Loans in Forbearance 76 20.3% 24 6.6% 17 4.9% 11 3.6% 20 2.2% 148 6.4%
Loans in Repayment- Current 180 48.4% 253 71.0% 268 77.2% 256 82.7% 813 89.2% 1,770 77.0%
Loans in Repayment- Delinq 31-60 days 31 8.3% 21 5.8% 19 5.5% 13 4.2% 28 3.0% 112 4.9%
Loans in Repayment- Delinq 61-90 days 26 6.9% 17 4.8% 12 3.5% 10 3.2% 17 1.9% 82 3.6%
Loans in Repayment- Delinq 90 + days 60 16.1% 42 11.8% 31 8.9% 20 6.3% 34 3.7% 187 8.1%
Total Loans in Repayment or Forbearance $ 373 100% $ 357 100% $ 347 100% $ 310 100% $ 912 100% $ 2,299 100%
Charge-offs as a % of loans in repayment 23.1% 8.7% 5.1% 3.6% 2.5% 7.0%
Total
Monthly Scheduled Payments Received
Loan Status 0-12 payments 13-24 payments 25-36 payments 37-48 payments More than 48 payments Total
Not Yet in Repayment 3,436
Loans in Forbearance 542 17.5% 207 5.4% 174 3.9% 138 3.0% 197 1.6% 1,258 4.4%
Loans in Repayment- Current 1,981 63.9% 3,187 83.6% 3,917 87.8% 4,176 90.8% 11,702 94.6% 24,963 88.1%
Loans in Repayment- Delinq 31-60 days 175 5.6% 132 3.5% 125 2.8% 107 2.3% 193 1.6% 732 2.6%
Loans in Repayment- Delinq 61-90 days 129 4.2% 89 2.4% 79 1.8% 65 1.4% 106 0.8% 468 1.6%
Loans in Repayment- Delinq 90 + days 275 8.8% 196 5.1% 167 3.7% 116 2.5% 175 1.4% 929 3.3%
Total Loans in Repayment or Forbearance $ 3,102 100% $ 3,811 100% $ 4,462 100% $ 4,602 100% $ 12,373 100% $ 28,350 100%
Charge-offs as a % of loans in repayment 10.4% 3.3% 2.0% 1.3% 0.8% 2.3%
Confidential and proprietary information © 2015 Navient Solutions, Inc. All rights reserved. 17
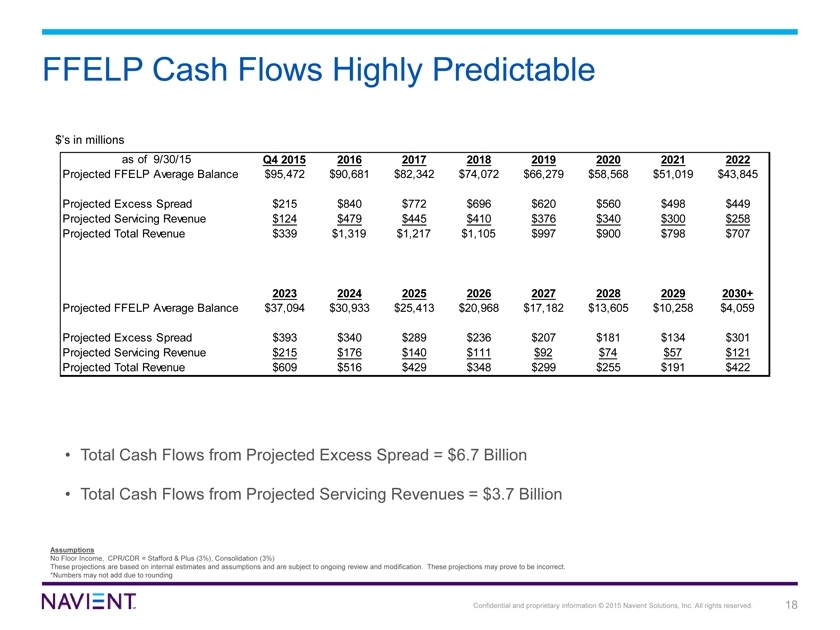
FFELP Cash Flows Highly Predictable
$’s in millions
as of 9/30/15 Q4 2015 2016 2017 2018 2019 2020 2021 2022
Projected FFELP Average Balance $95,472 $90,681 $82,342 $74,072 $66,279 $58,568 $51,019 $43,845
Projected Excess Spread $215 $840 $772 $696 $620 $560 $498 $449
Projected Servicing Revenue $124 $479 $445 $410 $376 $340 $300 $258
Projected Total Revenue $339 $1,319 $1,217 $1,105 $997 $900 $798 $707
2023 2024 2025 2026 2027 2028 2029 2030+
Projected FFELP Average Balance $37,094 $30,933 $25,413 $20,968 $17,182 $13,605 $10,258 $4,059
Projected Excess Spread $393 $340 $289 $236 $207 $181 $134 $301
Projected Servicing Revenue $215 $176 $140 $111 $92 $74 $57 $121
Projected Total Revenue $609 $516 $429 $348 $299 $255 $191 $422
Total Cash Flows from Projected Excess Spread = $6.7 Billion
Total Cash Flows from Projected Servicing Revenues = $3.7 Billion
Assumptions
No Floor Income, CPR/CDR = Stafford & Plus (3%), Consolidation (3%)
These projections are based on internal estimates and assumptions and are subject to ongoing review and modification. These projections may prove to be incorrect. *Numbers may not add due to rounding
Confidential and proprietary information © 2015 Navient Solutions, Inc. All rights reserved. 18
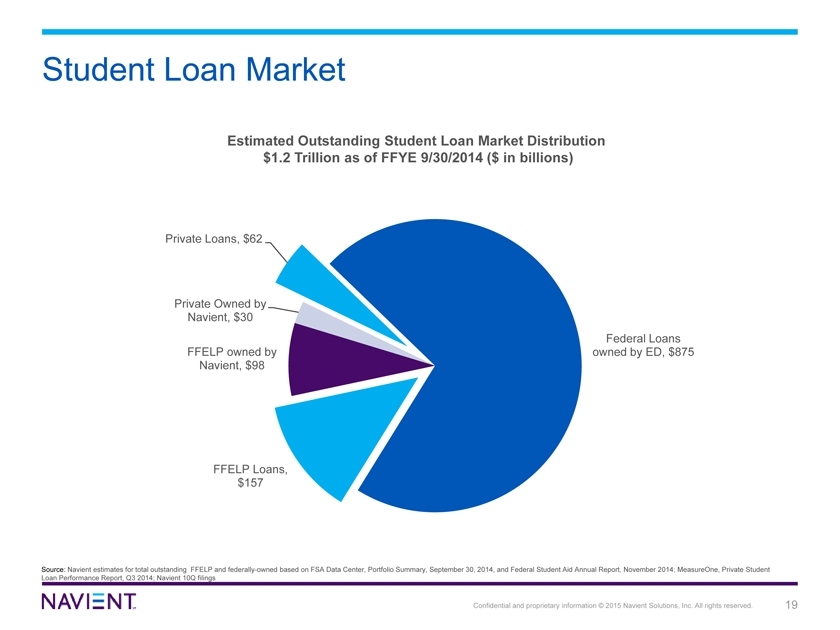
Student Loan Market
Estimated Outstanding Student Loan Market Distribution $1.2 Trillion as of FFYE 9/30/2014 ($ in billions)
Private Loans, $62
Private Owned by Navient, $30
Federal Loans FFELP owned by owned by ED, $875 Navient, $98
FFELP Loans, $157
Source: Navient estimates for total outstanding FFELP and federally-owned based on FSA Data Center, Portfolio Summary, September 30, 2014, and Federal Student Aid Annual Report, November 2014; MeasureOne, Private Student Loan Performance Report, Q3 2014; Navient 10Q filings
Confidential and proprietary information © 2015 Navient Solutions, Inc. All rights reserved. 19
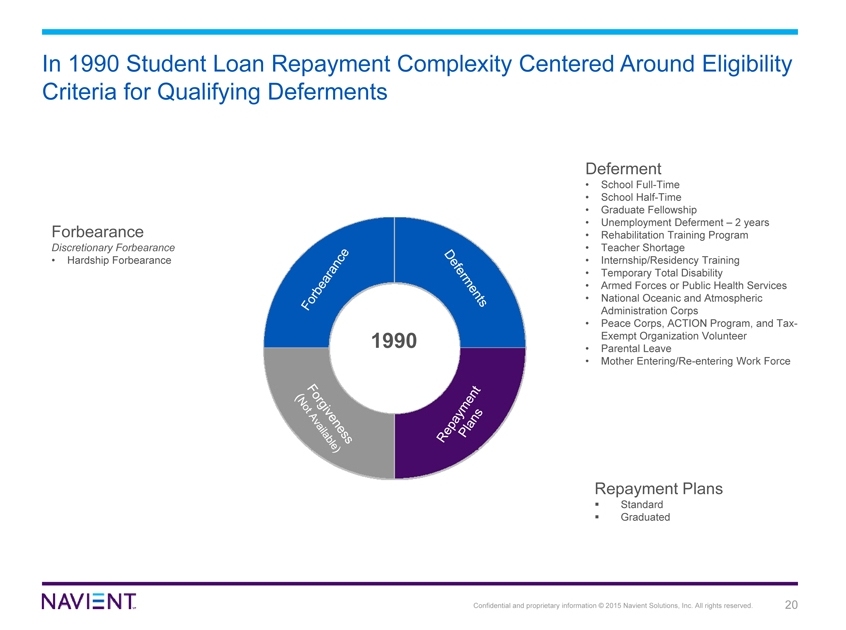
In 1990 Student Loan Repayment Complexity Centered Around Eligibility Criteria for Qualifying Deferments
Forbearance
Discretionary Forbearance
Hardship Forbearance
1990
Deferment
School Full-Time
School Half-Time
Graduate Fellowship
Unemployment Deferment – 2 years
Rehabilitation Training Program
Teacher Shortage
Internship/Residency Training
Temporary Total Disability
Armed Forces or Public Health Services
National Oceanic and Atmospheric Administration Corps
Peace Corps, ACTION Program, and Tax-Exempt Organization Volunteer
Parental Leave
Mother Entering/Re-entering Work Force
Repayment Plans
Standard Graduated
Confidential and proprietary information © 2015 Navient Solutions, Inc. All rights reserved. 20
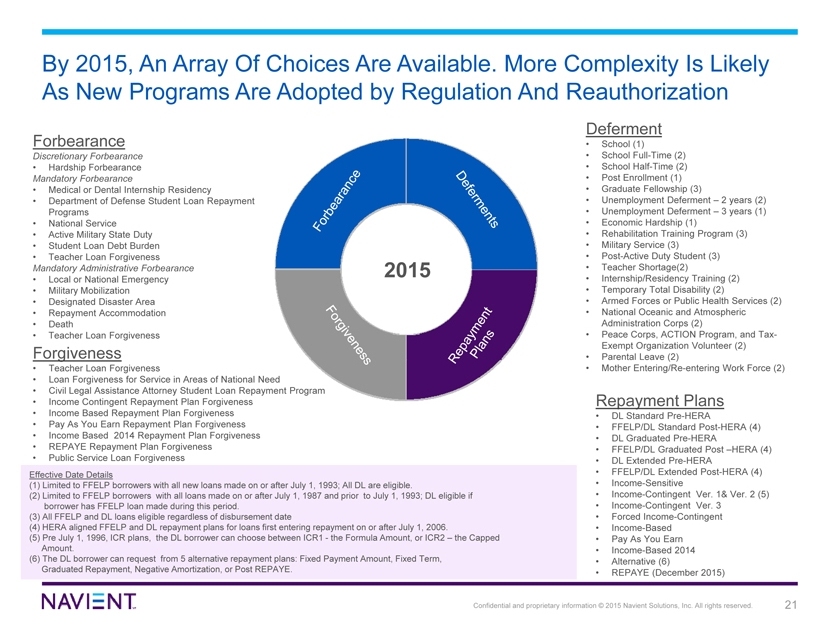
By 2015, An Array Of Choices Are Available. More Complexity Is Likely As New Programs Are Adopted by Regulation And Reauthorization
Forbearance
Discretionary Forbearance
Hardship Forbearance
Mandatory Forbearance
Medical or Dental Internship Residency
Department of Defense Student Loan Repayment Programs
National Service
Active Military State Duty
Student Loan Debt Burden
Teacher Loan Forgiveness
Mandatory Administrative Forbearance
Local or National Emergency
Military Mobilization
Designated Disaster Area
Repayment Accommodation
Death
Teacher Loan Forgiveness
Forgiveness
Teacher Loan Forgiveness
Loan Forgiveness for Service in Areas of National Need
Civil Legal Assistance Attorney Student Loan Repayment Program
Income Contingent Repayment Plan Forgiveness
Income Based Repayment Plan Forgiveness
Pay As You Earn Repayment Plan Forgiveness
Income Based 2014 Repayment Plan Forgiveness
REPAYE Repayment Plan Forgiveness
Public Service Loan Forgiveness
Effective Date Details
(1) Limited to FFELP borrowers with all new loans made on or after July 1, 1993; All DL are eligible.
(2) Limited to FFELP borrowers with all loans made on or after July 1, 1987 and prior to July 1, 1993; DL eligible if borrower has FFELP loan made during this period.
(3) All FFELP and DL loans eligible regardless of disbursement date
(4) HERA aligned FFELP and DL repayment plans for loans first entering repayment on or after July 1, 2006.
(5) Pre July 1, 1996, ICR plans, the DL borrower can choose between ICR1—the Formula Amount, or ICR2 – the Capped Amount.
(6) The DL borrower can request from 5 alternative repayment plans: Fixed Payment Amount, Fixed Term, Graduated Repayment, Negative Amortization, or Post REPAYE.
Deferment
School (1)
School Full-Time (2)
School Half-Time (2)
Post Enrollment (1)
Graduate Fellowship (3)
Unemployment Deferment – 2 years (2)
Unemployment Deferment – 3 years (1)
Economic Hardship (1)
Rehabilitation Training Program (3)
Military Service (3)
Post-Active Duty Student (3)
Teacher Shortage(2)
Internship/Residency Training (2)
Temporary Total Disability (2)
Armed Forces or Public Health Services (2)
National Oceanic and Atmospheric Administration Corps (2)
Peace Corps, ACTION Program, and Tax-Exempt Organization Volunteer (2)
Parental Leave (2)
Mother Entering/Re-entering Work Force (2)
Repayment Plans
• DL Standard Pre-HERA
FFELP/DL Standard Post-HERA (4)
DL Graduated Pre-HERA
FFELP/DL Graduated Post –HERA (4)
DL Extended Pre-HERA
FFELP/DL Extended Post-HERA (4)
Income-Sensitive
Income-Contingent Ver. 1& Ver. 2 (5)
Income-Contingent Ver. 3
Forced Income-Contingent
Income-Based
Pay As You Earn
Income-Based 2014
Alternative (6)
REPAYE (December 2015)
Confidential and proprietary information © 2015 Navient Solutions, Inc. All rights reserved. 21
