 Investor Presentation April 21, 2014 Second-Step Conversion Offering Issuer Free Writing Prospectus Filed Pursuant to Rule 433 Registration No. 333-192966 April 21, 2014 |
 2 Free Writing Prospectus New Investors Bancorp, Inc. (“New Investors Bancorp”) has filed a registration statement (including a prospectus) with the SEC for the offering to which this communication relates. Before you invest, you should read the prospectus in that registration statement and other documents New Investors Bancorp has filed with the SEC for more complete information about New Investors Bancorp and this offering. You may get these documents for free by visiting EDGAR on the SEC web site at www.sec.gov. Alternatively, New Investors Bancorp or the underwriters participating in the offering will arrange to send you the prospectus and the prospectus supplement if you request it by calling toll-free 1- 877-822-4089. Forward Looking Statements and Risk Factors This presentation contains forward-looking information for New Investors Bancorp, Inc. Such information constitutes forward-looking statements (within the meaning of the Private Securities Litigation Reform Act of 1995) which involve significant risks and uncertainties. Please refer to the discussion of the risk factors set forth in the prospectus for those factors that may cause actual results to differ materially from the results discussed in these forward-looking statements. |
 3 I. Offering Summary |
 4 Offering Summary Issuer: New Investors Bancorp, Inc., a newly formed Delaware corporation (1) Exchange / Symbol: NASDAQ / ISBC Price Per Share: $10.00 Shares Offered: 170,000,000 (Minimum) to 264,500,000 (Adjusted Maximum) Gross Proceeds: $1.7 billion (Minimum) to $2.6 billion (Adjusted Maximum) Exchange Ratio: 2.6698x (Maximum) Maximum Purchase Limitations: $8.0 million individual / $50.0 million group Bookrunners: RBC Capital Markets | Keefe, Bruyette & Woods | Sandler O’Neill + Partners, L.P. Lead Managers: Barclays | Deutsche Bank Securities | J.P. Morgan Co-Managers: Sterne Agee | Boenning & Scattergood, Inc. Expected Subscription Offering Results: April 25, 2014 Expected Pricing: May 1, 2014 Source: Firm Commitment Underwriting Offering Prospectus. (1) Created in connection with the conversion of Investors Bancorp, MHC from a mutual holding company to a stock holding company form of organization. |
 5 Pro Forma Financial Information Appraisal Maximum Number of Shares Offered: 230.0 million Pro Forma Shares Outstanding: 373.9 million Pro Forma Market Capitalization: $3.7 billion Pro Forma Tangible Equity / Tangible Assets: (1) 18.7% Price / Pro Forma Tangible Book Value: (1) 1.12x Price / Pro Forma EPS: (1) 32.3x Peers Peer Median (2) Price / Tangible Book Value: 1.64x Price / EPS: (3) 16.4x Source: Firm Commitment Underwriting Offering Prospectus except for peer data per SNL Financial. (1) For the year ended December 31, 2013, pro forma for second-step conversion offering. (2) Market data as of April 17, 2014. Peer group consists of AF, DCOM, FFIC, LBAI, NYCB, NWBI, PBCT, PFS, SBNY, STL, VLY, WBS, SUSQ, NPBC, FULT, and ORIT. Note that the peer set differs from the independent appraisal peer set in the prospectus. Financial data as of December 31, 2013. (3) EPS for the twelve months ended December 31, 2013. |
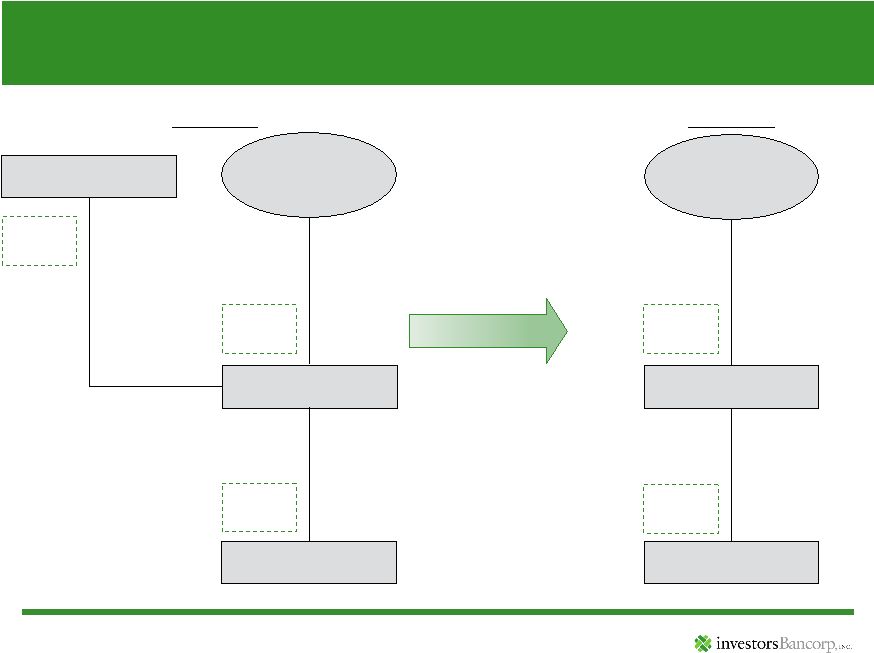 6 Conversion Structure Public Stockholders (Including the Charitable Foundation) New Investors Bancorp Investors Bank 100% of common stock Public Stockholders (Including the Charitable Foundation) Old Investors Bancorp Investors Bank Investors Bancorp, MHC 12/31/2013 Pro-Forma 100% of common stock 38% of common stock 62% of common stock 100% of common stock Source: Firm Commitment Underwriting Offering Prospectus. |
 7 II. Investment & Company Highlights |
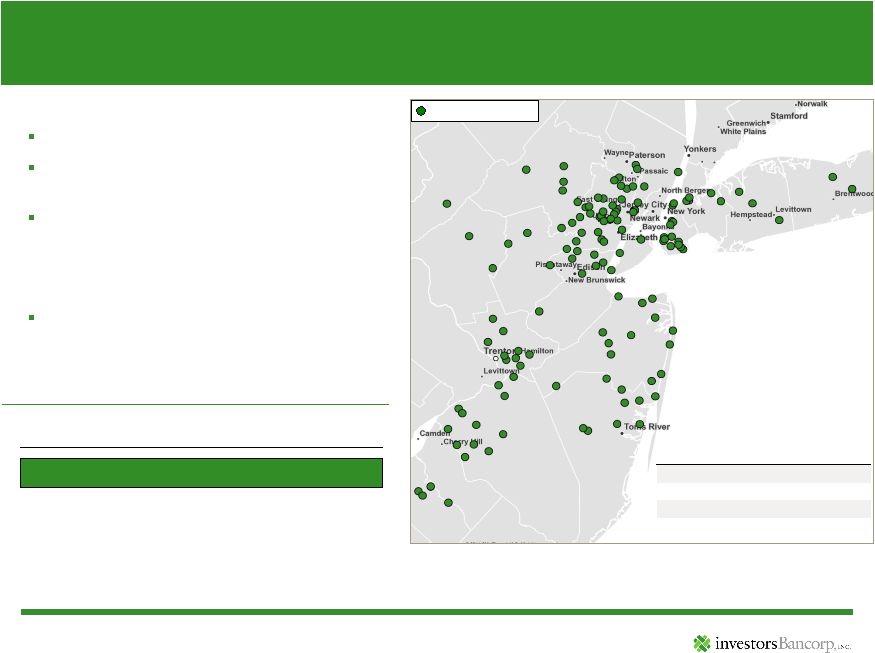 8 Largest Bank Headquartered in New Jersey and Fifth Largest in Metro NY (1) (2) Branches (129) History Founded in 1926 Completed $516 million first-step conversion in October 2005 Transformed from a wholesale thrift into a high performing commercial bank Competitive Strategy Community involvement and engaged employee base differentiate Investors from other banks, particularly large banks Source: SNL Financial and company reports. Deposit figures shown as of June 30, 2013. (1) Ranked by assets and excludes Bank of New York Mellon. (2) Pro forma as of December 31, 2013 for Gateway Community Financial Corp and second-step offering net proceeds assuming the maximum of the appraisal range. (3) Pro forma for pending acquisitions. Largest NJ Headquartered Institutions (3) Deposit Ranking Institution Total Assets ($bn) NJ Deposits ($bn) NJ Branches 1 Investors Bancorp 18.0 9.1 104 2 Valley National Bancorp 16.2 8.6 168 3 Provident Financial Services 8.4 5.7 86 4 Columbia Bank 4.5 3.2 44 5 Sun Bancorp 3.1 2.7 55 (2) Key Statistics Total Assets (2) $18.0 billion 2013 ROAA / ROAE 0.83% / 10.0% Market Cap (2) $3.7 billion |
 9 Investment Rationale $18 billion in total assets (1) , commercial focused bank operating in some of the best markets in the U.S. Experienced management team with track record of successful capital deployment - Transformed Investors from a wholesale thrift into a high performing commercial bank - Fully leveraged first-step conversion proceeds through organic growth, acquisitions and repurchase of approximately 30% of shares issued in first-step as of December 31, 2013 - Total return of over 166% since 2005 first-step conversion offering (2) Meaningful growth opportunities - New York and Philadelphia metro markets dominated by large banks against which Investors competes effectively - Continued commercial build out focused on C&I lending - Numerous acquisition opportunities within footprint Strong profitability and asset quality Attractively valued vs. peers (1) Total assets as of December 31, 2013, pro forma for Gateway Community Financial Corp and second-step offering net proceeds assuming the maximum of the appraisal range. (2) For the period beginning on October 12, 2005 and ending April 17, 2014. |
 10 Experienced Management Team Executive Role Years at Investors Years of Financial Services Experience Kevin Cummings Director, President & Chief Executive Officer 11 36 Domenick Cama Director, Senior EVP, Chief Operating Officer 11 40 Thomas Splaine SVP, Chief Financial Officer 9 25 Richard Spengler EVP, Chief Lending Officer 10 31 Paul Kalamaras EVP, Chief Retail Banking Officer 6 33 Daniel Harris SVP, Technology & Operations 6 35 Thomas Stackhouse SVP, Chief Credit Officer 5 27 Joseph Orefice SVP, Commercial Real Estate Lending 5 25 Mark Noto SVP, Business Lending 2 30 Dennis Budnick SVP, Chief Culture Officer 2 24 |
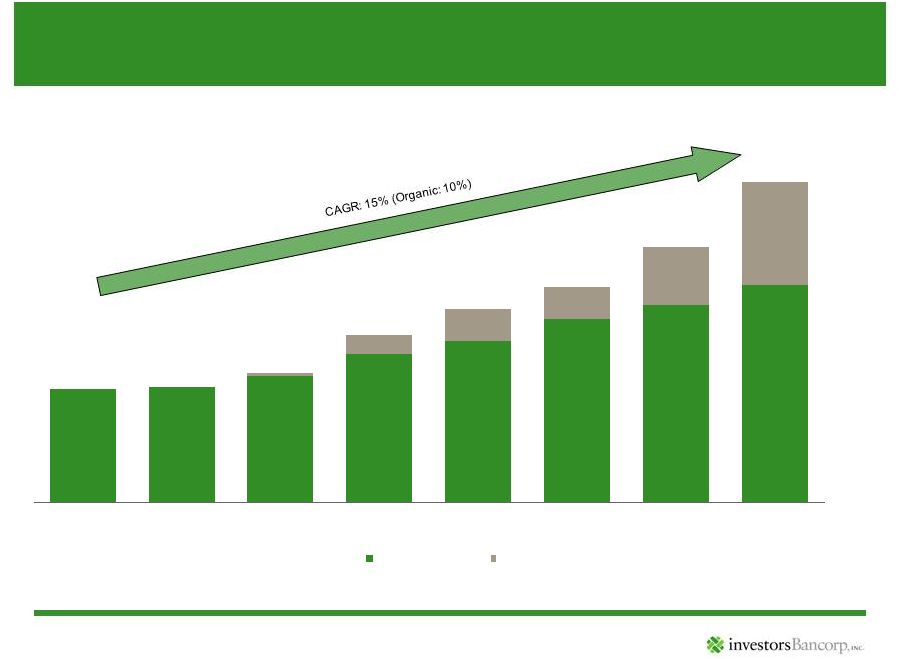 11 2006 2007 2008 2009 2010 2011 2012 2013 Organic Acquisitions $15.9 $12.7 $10.7 $9.6 $8.4 $6.4 $5.7 $5.6 Investors has grown assets at a 15% compounded annual growth rate (“CAGR”) through a balance of organic growth and acquisitions Growth Since First-Step Conversion ($ in billions) Source: SNL Financial and company reports. 2013 assets are pro forma for Gateway Community Financial Corp. acquisition, Note: Figures shown as of fiscal year end. Years 2006 to 2009 reflect June 30 fiscal year end. Years 2010 to 2013 reflect December 31 fiscal year end, as Investors changed its fiscal year end to December 31 in 2009. |
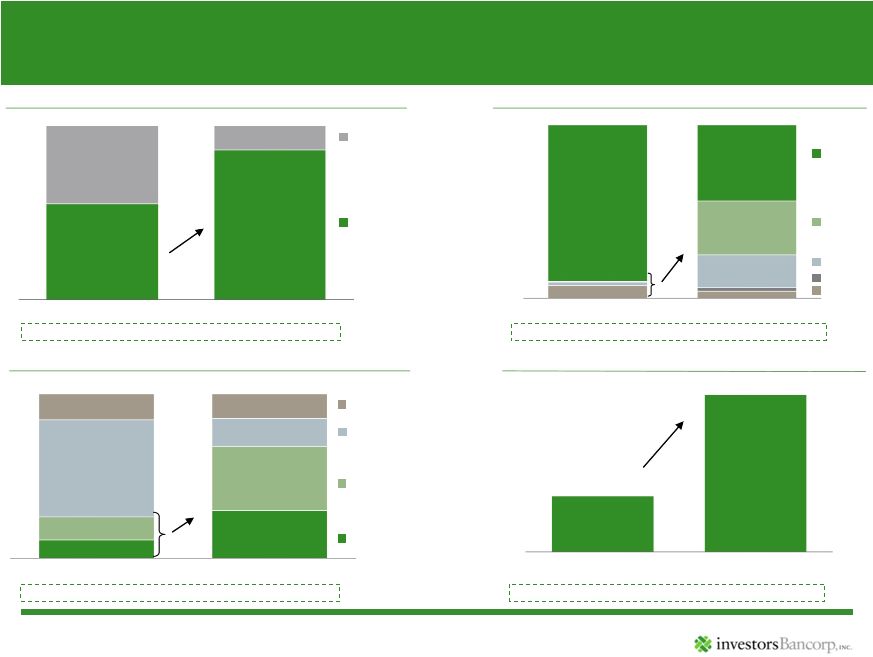 12 Source: SNL Financial and company reports. 2006 data as of fiscal year end June 30, 2006. 2013 data as of fiscal year end December 31, 2013. Loan CAGR: 22% Core Deposit CAGR: 33% Branch CAGR: 15% Interest Earning Assets CAGR: 15% 1-4 Family Multi-family C&I CRE Other Cash and Securities Loans ($ in millions) Jumbo CDs Retail CDs MMDA & Savings DDA Franchise Transformation Interest Earning Assets Total Loans Deposits Number of Branches 11% 29% 14% 39% 59% 17% 16% 15% 2006 2013 $3,419 $10,719 55% 86% 45% 14% 2006 2013 $5,443 $15,110 4% 2% 19% 31% 90% 44% 2006 2013 $2,983 $13,065 46 129 2006 2013 |
 13 Opportunistic and Disciplined Acquiror Investors has completed 8 whole bank and branch acquisitions since 2008, growing its asset and deposit base significantly while generating only $78 million in goodwill January 2014 Gateway Community Financial (MHC) 4 branches in NJ $287 million in assets $255 million in deposits Merger of mutual enterprises December 2013 Roma Financial Corporation (MHC) 26 branches in NJ $1,632 million in assets $1,341 million in deposits $113 million transaction value (1) 0.53x Minority TBV October 2012 Marathon Banking Corporation 13 branches in NY and NJ $787 million in assets $777 million in deposits $135 million transaction value 1.51x TBV / 5.8% deposit premium January 2012 Brooklyn Federal Bancorp, Inc. (MHC) 5 branches $386 million in deposits $2.9 million transaction value (1) 0.25x Minority TBV Subsequent commercial loan sale / hedge October 2010 Deposit Franchise of Millennium bcpbank 17 branches in NJ, NY & MA $600 million in deposits 0.11% deposit premium $200 million in performing loans October 2009 6 NJ Branches from Banco Popular North America 6 branches $227 million in deposits 1.0% deposit premium No loans acquired in the transaction May 2009 American Bancorp of New Jersey 5 branches $670 million in assets $520 million in deposits $98 million transaction value 1.01x TBV / 1.2% deposit premium June 2008 Summit Federal Bankshares (MHC) 5 branches $110 million in assets $95 million in deposits Pooling of interests Source: SNL Financial and company reports. Transaction value, multiples and deposit premiums are as of the announcement date. (1) Based on consideration to minority stockholders. |
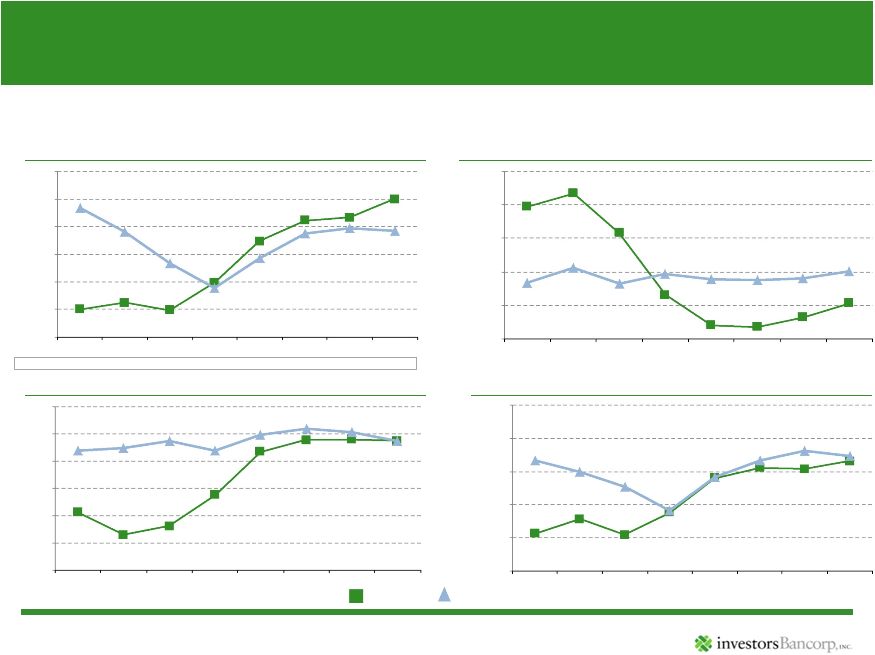 14 Strong and Improving Profitability Investors has been consistently profitable, with improvement resulting from balance sheet repositioning and expense controls Source: SNL Financial and company reports. Figures shown as of fiscal year end. Years 2006 to 2009 reflect June 30 fiscal year end. Years 2010 to 2013 reflect December 31 fiscal year end, as Investors changed its fiscal year end to December 31 in 2009. Note: Peer group consists of AF, DCOM, FFIC, LBAI, NYCB, NWBI, PBCT, PFS, SBNY, STL, VLY, WBS, SUSQ, NPBC, FULT, and ORIT. (1) 2009 ROAE and ROAA are adjusted for one-time special assessment fee and realized losses on securities. See appendix for reconciliation to GAAP financials. (2) Efficiency ratio defined as non interest expense / (non interest income + net interest income). (3) For 2008, 2009, 2012 and 2013, see appendix for reconciliation to GAAP financials. Net Interest Margin Efficiency Ratio (2) (3) Return on Average Assets (1) Return on Average Equity (1) Investors Peer Median TE / TA: 16.3% 15.0% 12.9% 9.8% 9.0% 8.7% 7.7% 7.9% 2.0% 10.0% 9.3% 7.7% 0.0% 2.0% 4.0% 6.0% 8.0% 10.0% 12.0% 2006 2007 2008 2009 2010 2011 2012 2013 79% 51% 57% 60% 40% 50% 60% 70% 80% 90% 2006 2007 2008 2009 2010 2011 2012 2013 2.06% 3.37% 3.20% 3.37% 1.0% 1.5% 2.0% 2.5% 3.0% 3.5% 4.0% 2006 2007 2008 2009 2010 2011 2012 2013 0.28% 0.83% 0.84% 0.87% 0.00% 0.25% 0.50% 0.75% 1.00% 1.25% 2006 2007 2008 2009 2010 2011 2012 2013 |
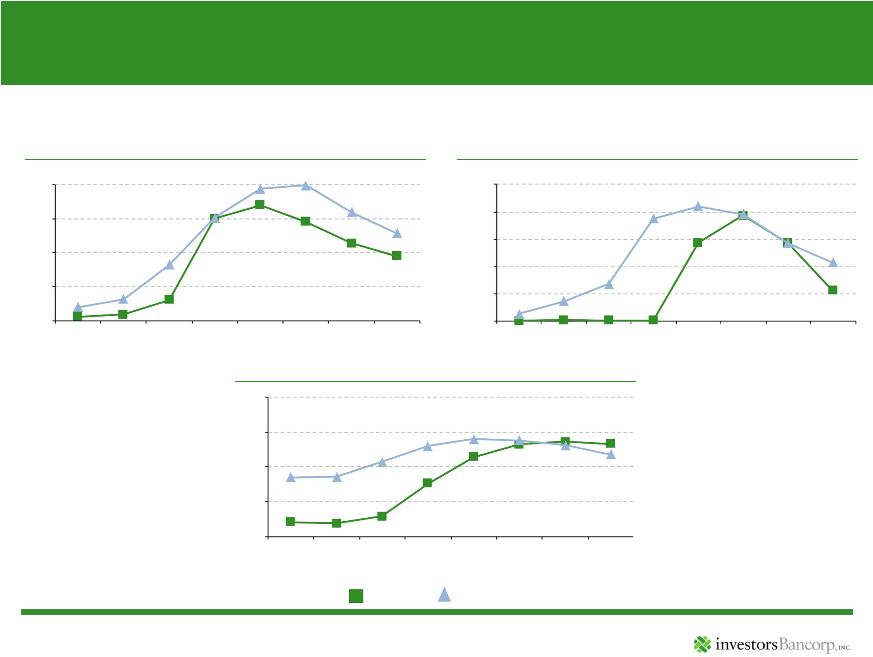 15 Excellent Credit Quality Despite strong growth, Investors has maintained superior credit quality and substantially bolstered reserves Non-Performing Assets / Total Assets Net Charge-Offs / Average Loans Loan Loss Reserves / Gross Loans Investors Peer Median Source: SNL Financial and company reports. Figures shown as of fiscal year end. Years 2006 to 2009 reflect June 30 fiscal year end. Years 2010 to 2013 reflect December 31 fiscal year end, as Investors changed its fiscal year end to December 31 in 2009. Note: Peer group consists of AF, DCOM, FFIC, LBAI, NYCB, NWBI, PBCT, PFS, SBNY, STL, VLY, WBS, SUSQ, NPBC, FULT, and ORIT. 0.1% 1.0% 0.2% 1.3% 0.0% 0.5% 1.0% 1.5% 2.0% 2006 2007 2008 2009 2010 2011 2012 2013 0.00% 0.17% 0.04% 0.32% 0.00% 0.15% 0.30% 0.45% 0.60% 0.75% 2006 2007 2008 2009 2010 2011 2012 2013 0.21% 1.33% 0.85% 1.18% 0.0% 0.5% 1.0% 1.5% 2.0% 2006 2007 2008 2009 2010 2011 2012 2013 |
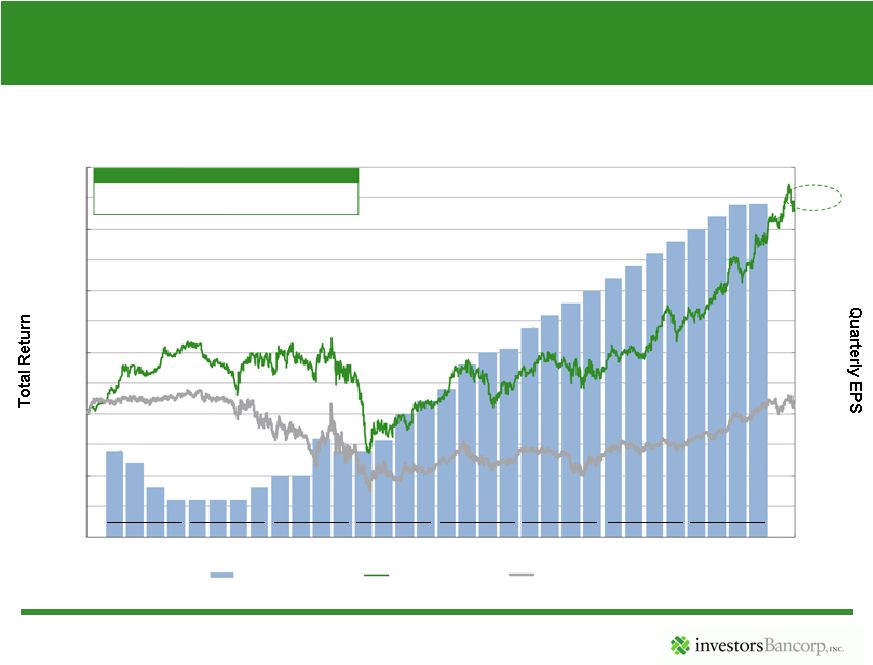 Total Return Since First-Step Conversion Source: SNL Financial, Bloomberg and company reports. EPS is as-reported, adjusted for non-recurring items. See appendix for reconciliation to GAAP financials. 166% total return since first-step conversion in October 2005, significantly outperforming the broader banking sector 2006 Mar Jun Sep Dec 2007 Mar Jun Sep Dec 2008 Mar Jun Sep Dec 2009 Mar Jun Sep Dec 2010 Mar Jun Sep Dec 2011 Mar Jun Sep Dec 2012 Mar Jun Sep Dec 2013 Mar Jun Sep Dec $0.00 $0.05 $0.10 $0.15 $0.20 $0.25 $0.30 (100%) (50%) 0% 50% 100% 10/12/05 4/17/14 Investors Quarterly EPS Investors Total Return KBW Regional Banking Index (KRX) 7% CAGR since ISBC First-Step 150% 200% Investors Total Return 12.2% KBW Regional Banking Index (KRX) 0.8% 166% 16 |
 17 Business Priorities Continue transition into a commercial bank - Increase commercial loans and core deposits - Build credit and risk management infrastructure - Convert core processing system Grow organically and through acquisitions in existing markets Focus on core competencies - Safety and soundness: strong asset quality and risk management - Expense control - Prudent yet efficient capital utilization Maintain focus on delivering superior customer service Involvement in communities - Continue to promote a higher quality of life in the communities Investors serves through employee volunteer efforts and the Charitable Foundation |
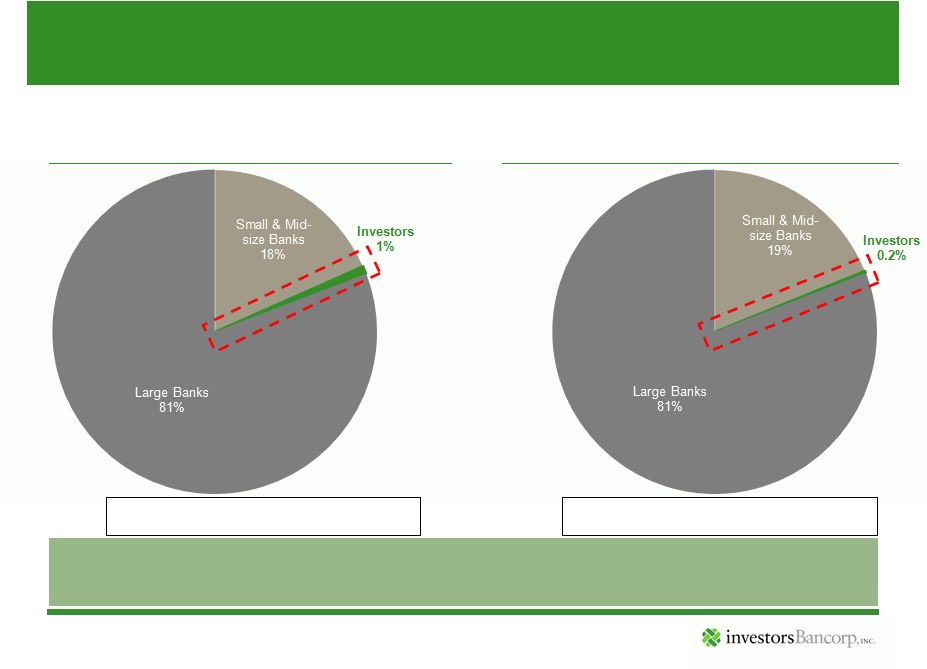 18 Market Share Opportunities Source: SNL Financial. Note: Large Banks defined as having over $50 billion in assets. (1) Excludes institutional deposits (defined as deposits / # of branches) of greater than $4 billion. Investors has the opportunity to gain share from the large money center & super-regional banks within its footprint New York City MSA Market Share (1) Philadelphia MSA Market Share (1) Total Deposits: $1.0 Trillion Total Deposits: $0.3 Trillion Small market share gains are capable of contributing billions in new loan and deposit growth |
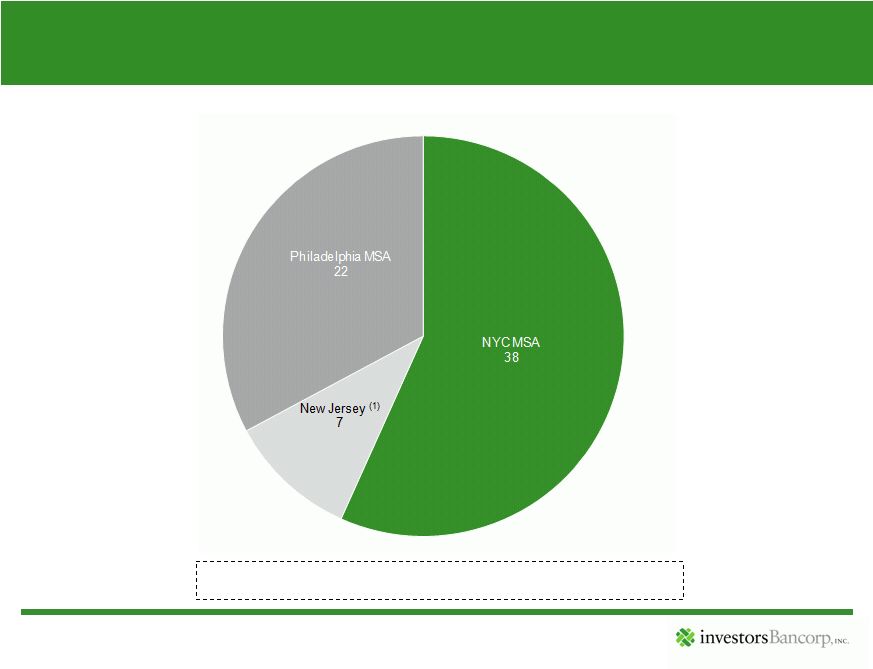 19 Numerous Acquisition Opportunities Note: Public and private banks and thrifts between $500mm - $10bn headquartered in each respective geography (excludes mutuals and MHC’s). Source: SNL Financial, assets as of December 31, 2013. (1) Banks in the State of New Jersey not headquartered in the NYC and Philadelphia MSAs. Total: 67 67 banks in existing markets between $500 million and $10 billion in assets |
 20 Use of Proceeds & Capital Management Use of proceeds and capital management priorities: - Repayment of maturing short-term borrowings and investment in short-dated securities - Organic growth - Cash dividends - Share repurchases - Acquisitions Repurchased 30% of shares issued in first-step conversion Long-term target tangible common ratio of approximately 8% |
 21 Positioning for Rising Rates Historically Investors has been liability sensitive Consistent with Investors’ transition to a commercial bank business model, Investors has and continues to: – Diversify its asset mix with shorter duration commercial loans – Increase core deposit funding – Invest primarily in shorter-duration securities – Use borrowings to hedge interest rate risk Investment of conversion proceeds into shorter-dated securities will further enhance positioning for rising rates |
 22 Summary of First Quarter Results ($000s) At March 31, 2014 At December 31, 2013 Total assets $16,426,309 $15,623,070 Loans receivable, net 13,392,754 12,882,544 Deposits 11,391,228 10,718,811 Borrowed funds 3,372,780 3,367,274 Goodwill and intangibles (1) 109,889 109,129 Stockholders’ equity 1,395,757 1,334,327 Asset Quality Ratios: Non-performing assets as a percent of total assets 0.88% 0.95% Allowance for loan losses as a percent of total loans 1.33% 1.33% ($000s, except per share amounts) For the Three Months Ended March 31, 2014 2013 Net income $34,418 $27,167 Earnings per share — basic $0.26 $0.25 Earnings per share — diluted $0.25 $0.25 Return on average assets 0.86% 0.85% Return on average equity 9.98% 10.10% Net interest margin 3.36% 3.36% Efficiency ratio 54.7% 50.0% Selected Financial Condition Data Selected Operating & Profitability Data Source: Company reports. (1) Includes $78 million of goodwill. |
 23 Investment Rationale $18 billion in total assets (1) , commercial focused bank operating in some of the best markets in the U.S. Experienced management team with track record of successful capital deployment - Transformed Investors from a wholesale thrift into a high performing commercial bank - Fully leveraged first-step conversion proceeds through organic growth, acquisitions and repurchase of approximately 30% of shares issued in first-step as of December 31, 2013 - Meaningful growth opportunities - New York and Philadelphia metro markets dominated by large banks against which Investors competes effectively - Continued commercial build out focused on C&I lending - Numerous acquisition opportunities within footprint (1) Total assets as of December 31, 2013, pro forma for Gateway Community Financial Corp and second-step offering net proceeds assuming the maximum of the appraisal range. (2) For the period beginning on October 12, 2005 and ending April 17, 2014. Strong profitability and asset quality Attractively valued vs. peers Total return of over 166% since 2005 first-step conversion offering (2) |
 24 APPENDIX |
 25 Overview of Indicative Valuation Range Source: Firm Commitment Underwritten Offering Prospectus. ($mm, except per share data) Minimum Midpoint Maximum Adjusted Maximum Shares in Offering 170.0 200.0 230.0 264.5 Shares Issued for Shares of Old Investors Bancorp 105.6 124.2 142.9 164.3 Shares Issued to the Charitable Foundation 1.0 1.0 1.0 1.0 Pro Forma Shares Outstanding 276.6 325.2 373.9 429.8 Implied Exchange Ratio 1.9733x 2.3215x 2.6698x 3.0702x Proceeds Gross Proceeds $1,700 $2,000 $2,300 $2,645 Net Income Pro Forma Earnings Per Share $0.42 $0.35 $0.31 $0.27 Price / Pro Forma Earnings Per Share 23.81x 28.57x 32.26x 37.04x Stockholders' Equity Pro Forma Stockholders' equity $2,799.2 $3,070.6 $3,342.0 $3,654.1 Tangible Book Value Per Share $10.12 $9.45 $8.94 $8.51 Price / Tangible Book Value 0.99x 1.06x 1.12x 1.18x Tangible Equity / Tangible Assets 16.1% 17.4% 18.7% 20.1% |
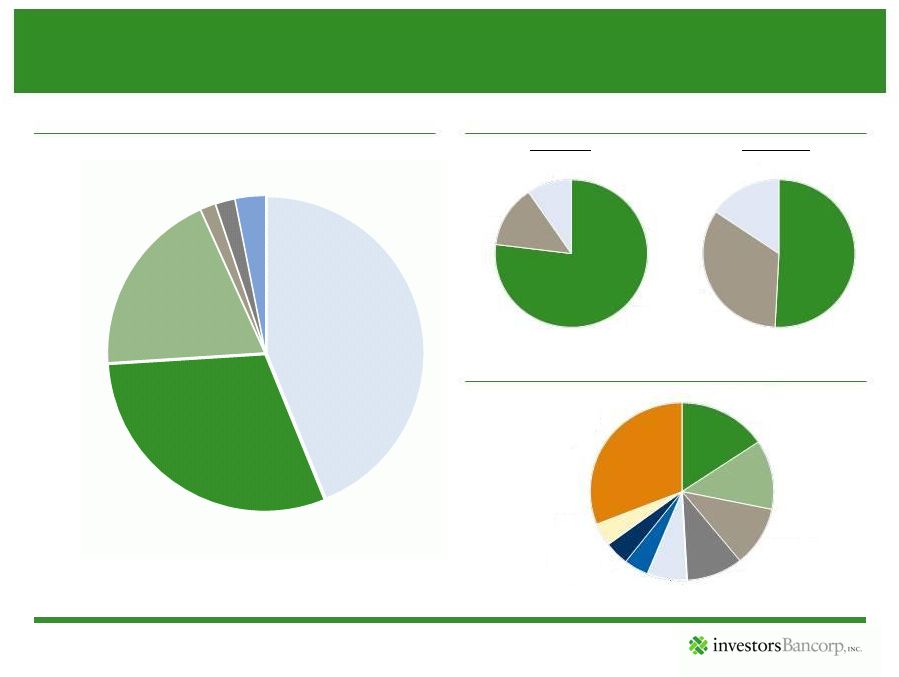 26 Loan Portfolio Total Loans by Type Loans by Geography Business Lending Portfolio Source: SNL Financial and company reports. Based on regulatory data. Figures shown as of December 31, 2013. Total: $13.1 billion Residential Commercial Total $6.1bn Total $7.0bn Total $685mm NJ 77% NY 14% Others 9% 1- 4 Family, 44% Multi-family, 30% CRE, 19% C&D, 2% C&I, 2% Consumer & Other, 3% NY 51% NJ 34% Other Mid- Atlantic 15% Investment Real Estate 16% Healthcare 13% Hotel / Motel 11% Non Profit 10% Service 7% Restaurant 4% Wholesale 4% Retail 4% Less than 4% Composition 31% |
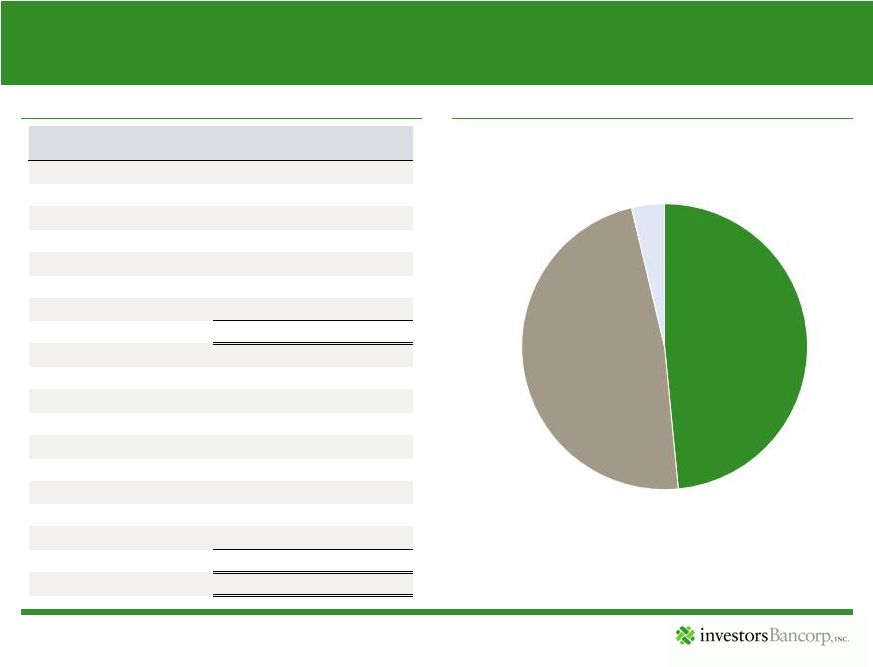 27 Securities Portfolio Securities Securities Portfolio Composition Source: Company reports. Figures shown as of December 31, 2013. ($mm) Carrying Value Est Fair Value AFS Equity $7.1 $8.4 GSE Debt 3.0 3.0 Corporate and other 0.7 0.7 MBS Agency 771.9 772.9 Non-Agency 0.0 0.0 Total AFS $782.8 $785.0 Held-to-maturity: Debt securities: GSE $4.5 $4.5 Municipal bonds 15.0 15.5 Corporate and other 29.7 48.6 Mortgage-backed securities: Agency 782.6 770.5 Non Agency 0.0 0.0 Total HTM Securities $831.8 $839.1 Total Securities $1,614.6 $1,624.1 Agency HTM 48% Agency AFS 48% Other 4% |
   28 Highly Attractive Banking Markets Source: SNL Financial, US Census Bureau, Bureau of Economic Analysis. Note: New York City MSA excludes institutional deposits (defined as deposits / # of branches) of greater than $4 billion. New York City MSA is defined as New York – Newark – Jersey City. (1) Weighted average by MSA. Investors is well positioned in some of the largest, most dense and affluent markets in the U.S. State of New Jersey New York City MSA Philadelphia MSA Investors Weighted Average (1) National Population: 8,840,746 19,764,907 6,019,190 314,467,933 Projected Population Growth (2013 - 2018): 1.6% 2.4% 1.8% 2.3% 3.6% Median Household Income (HHI): $68,482 $62,660 $59,198 $63,049 $51,314 Projected HHI Annual Growth (2013 - 2018): 3.3% 4.1% 4.5% 4.1% 3.0% Unemployment Rate (Dec. 2013): 6.7% 6.6% 6.4% 6.5% 6.7% # of Businesses / Square Mile: 54 98 51 92 4 Total Deposits in Market (as of 6/30/2013, mm): $274,878 $1,082,292 $319,920 |
 29 Historical Profitability and Asset Quality Ratios Source: SNL Financial and company reports. Figures shown as of fiscal year end. Years 2006 to 2009 reflect June 30 fiscal year end. Years 2010 to 2013 reflect December 31fiscal year end, as Investors changed its fiscal year end to December 31 in 2009. Note: Peer group consists of AF, DCOM, FFIC, LBAI, NYCB, NWBI, PBCT, PFS, SBNY, STL, VLY, WBS, SUSQ, NPBC, FULT, and ORIT. (1) 2009 ROAE and ROAA are adjusted for one-time special assessment fee and realized losses on securities. See next page for reconciliation to GAAP financials. (2) Efficiency ratio defined as non interest expense/ (non interest income + net interest income). (3) For 2008, 2009, 2012 and 2013, see next page for reconciliation to GAAP financials. 2006 2007 2008 2009 2010 2011 2012 2013 Profitability Ratios Return on Average Equity (1) ISBC 2.0% 2.5% 1.9% 3.9% 7.0% 8.4% 8.7% 10.0% Peers 9.3% 7.6% 5.3% 3.5% 5.7% 7.5% 7.9% 7.7% Efficiency Ratio (2)(3) ISBC 79% 83% 72% 53% 44% 44% 46% 51% Peers 57% 61% 56% 59% 58% 57% 58% 60% Net Interest Margin ISBC 2.06% 1.65% 1.81% 2.38% 3.17% 3.39% 3.40% 3.37% Peers 3.20% 3.25% 3.37% 3.19% 3.48% 3.60% 3.53% 3.37% Return on Average Assets (1) ISBC 0.28% 0.39% 0.27% 0.44% 0.70% 0.78% 0.77% 0.83% Peers 0.84% 0.75% 0.64% 0.46% 0.71% 0.84% 0.91% 0.87% Asset Quality Ratios Non-Performing Assets / Total Assets ISBC 0.1% 0.1% 0.3% 1.5% 1.7% 1.5% 1.1% 1.0% Peers 0.2% 0.3% 0.8% 1.5% 1.9% 2.0% 1.6% 1.3% Net Charge Offs / Average Loans ISBC 0.00% 0.00% 0.00% 0.00% 0.43% 0.58% 0.43% 0.17% Peers 0.04% 0.11% 0.20% 0.56% 0.63% 0.59% 0.43% 0.32% Loan Loss Reserves / Gross Loans ISBC 0.21% 0.19% 0.29% 0.76% 1.14% 1.32% 1.36% 1.33% Peers 0.85% 0.86% 1.07% 1.30% 1.40% 1.38% 1.31% 1.18% |
 30 Non-GAAP Financial Measures Source: Company reports. EPS Reconciliation ($mm, except per share data) One-Time Adjustments, Net of Tax EPS Quarter Ending Reported Net Income Tax Benefit Related to DTA Loss on Securities OTTI FDIC Assessment Bargain Purchase Gain Acquisition Expenses Adjusted Net Income Reported Adjusted December 31, 2006 $12.0 ($10.7) $2.2 – – – $3.5 $0.11 $0.03 September 30, 2008 $5.5 – – $2.3 – – – $7.8 $0.05 $0.08 December 31, 2008 ($83.0) – – $90.6 – – – $7.6 ($0.80) $0.07 June 30, 2009 $5.5 – – $0.7 $2.1 – – $8.3 $0.05 $0.08 December 31, 2010 $16.9 – – – – ($1.8) $1.5 $16.6 $0.16 $0.15 March 31, 2012 $18.9 – – – – – $3.7 $22.6 $0.18 $0.21 December 31, 2012 $21.4 – – – – – $4.4 $25.8 $0.20 $0.24 December 31, 2013 $27.5 – – $0.6 – – $3.5 $31.6 $0.24 $0.27 ROAA and ROAE Reconciliation ($mm) One-Time Adjustments, Net of Tax ROAA ROAE Year Ending Reported Net Income OTTI FDIC Assessment Loss on Conversion of Like Kind Securities Adjusted Net Income Reported Adjusted Reported Adjusted June 30, 2009 ($64.9) $93.8 $2.1 $0.5 $31.4 (0.90%) 0.44% (8.1%) 3.9% Efficiency Ratio Reconciliation ($mm) Reported One-Time Adjustments Adjusted Efficiency Ratio Year Ending Net Interest Income Non Interest Income Non Interest Expenses FDIC Assessment OTTI Loss on Conversion of Like Kind Securities Acquisition Expense Non Interest Income Non Interest Expenses Reported Adjusted June 30, 2008 $105.1 $7.4 $80.8 $0.4 – – – $7.8 – 71.8% 71.6% June 30, 2009 $166.1 ($148.4) $97.8 ($3.6) $158.5 $0.8 – $10.8 $94.2 552.3% 53.2% December 31, 2012 $372.7 $44.1 $207.0 – – – ($13.3) – $193.7 49.7% 46.5% December 31, 2013 $435.4 $36.6 $245.7 ($5.6) ($1.0) – – – $239.1 52.1% 50.7% |
 Investor Presentation |