Investors Presentation June 9, 2015 1 Annual Shareholder Meeting Exhibit 99.1
Investors Bancorp, Inc. Investor Presentation Forward Looking Statements Certain statements contained herein are “forward looking statements” within the meaning of Section 27A of the Securities Act of 1933 and Section 21E of the Securities Exchange Act of 1934. Such forward looking statements may be identified by reference to a future period or periods, or by the use of forward looking terminology, such as “may,” “will,” ”believe,” ”expect,” ”estimate,” “anticipate,” “continue,” or similar terms or variations on those terms, or the negative of those terms. Forward looking statements are subject to numerous risks, as described in our SEC filings, and uncertainties, including, but not limited to, those related to the economic environment, particularly in the market areas in which the Company operated, competitive products and pricing, fiscal and monetary policies of the U.S. Government, changes in government regulations affecting financial institutions, including regulatory fees and capital requirements, changes in prevailing interest rates, acquisitions and the integration of acquired businesses, credit risk management, asset-liability management, the financial and securities markets and the availability of and costs associated with sources of liquidity. The Company wishes to caution readers not to place undue reliance on any such forward looking statements, which speak only as of the date made. The Company wishes to advise readers that the factors listed above could affect the Company’s financial performance and could cause the Company’s actual results for future periods to differ materially from any opinions or statements expressed with respect to future periods in any current statements. The Company does not undertake and specifically declines any obligation to publicly release the results of any revisions, which may be made to any forward looking statements to reflect events or circumstances after the date of such statements or to reflect the occurrence of anticipated or unanticipated events. 2

Investors Bancorp, Inc. June 9, 2015 Core Values 3 Cooperation The act of working together towards a common purpose or benefit. Character The combination of features and traits that form the individual nature of a person or team. Community A self-organized network of people who collaborate by sharing ideas and information for the sake of the common good. Commitment A pledge, promise or obligation.
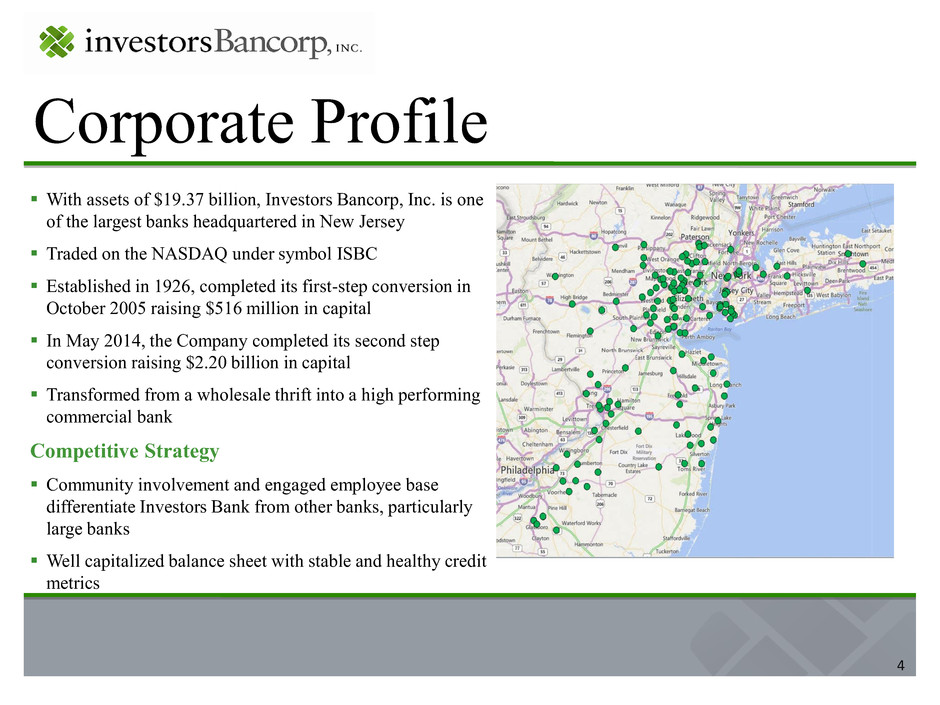
Corporate Profile 4 With assets of $19.37 billion, Investors Bancorp, Inc. is one of the largest banks headquartered in New Jersey Traded on the NASDAQ under symbol ISBC Established in 1926, completed its first-step conversion in October 2005 raising $516 million in capital In May 2014, the Company completed its second step conversion raising $2.20 billion in capital Transformed from a wholesale thrift into a high performing commercial bank Competitive Strategy Community involvement and engaged employee base differentiate Investors Bank from other banks, particularly large banks Well capitalized balance sheet with stable and healthy credit metrics
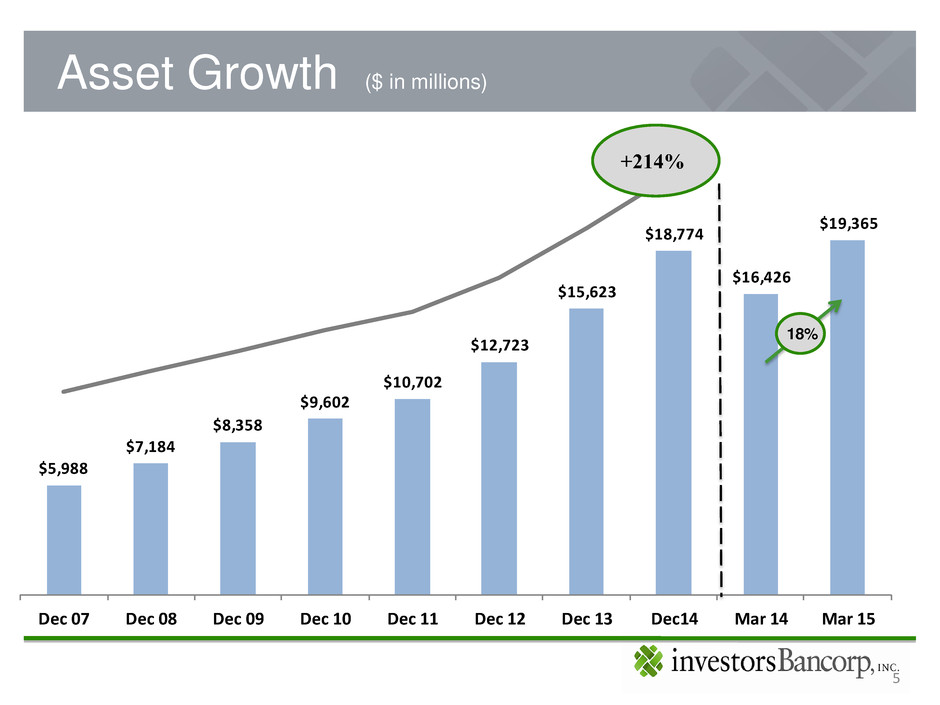
$5,988 $7,184 $8,358 $9,602 $10,702 $12,723 $15,623 $18,774 $16,426 $19,365 Dec 07 Dec 08 Dec 09 Dec 10 Dec 11 Dec 12 Dec 13 Dec14 Mar 14 Mar 15 Asset Growth ($ in millions) 5 +214% 18%
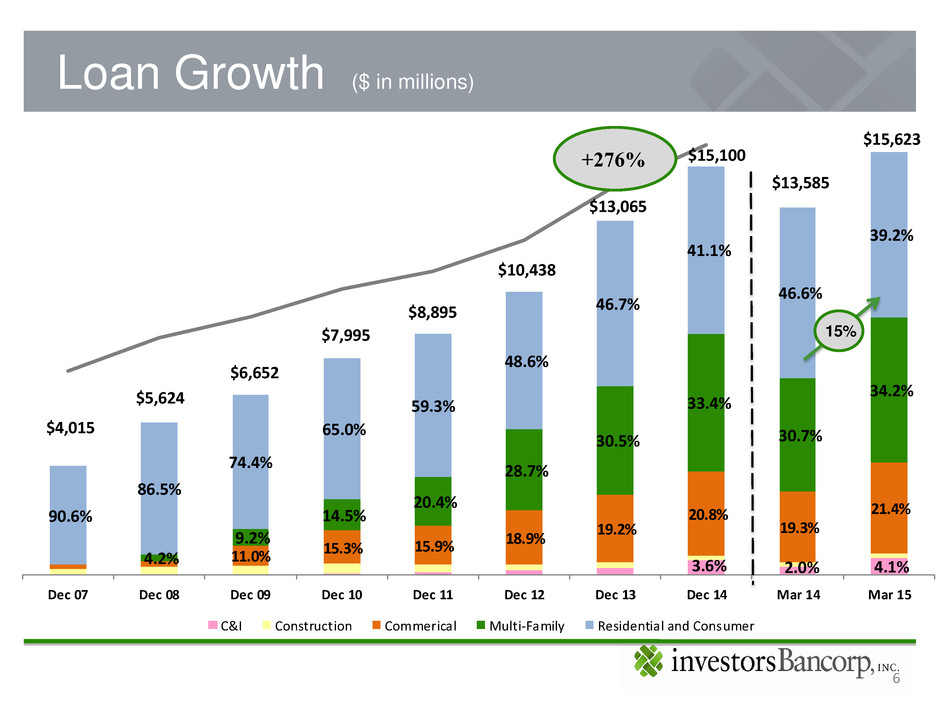
$4,015 $5,624 $6,652 $7,995 $8,895 $10,438 $13,065 $15,100 $13,585 $15,623 90.6% 86.5% 74.4% 65.0% 59.3% 48.6% 46.7% 41.1% 46.6% 39.2% 4.2% 9.2% 14.5% 20.4% 28.7% 30.5% 33.4% 30.7% 34.2% 11.0% 15.3% 15.9% 18.9% 19.2% 20.8% 19.3% 21.4% 3.6% 2.0% 4.1% Dec 07 Dec 08 Dec 09 Dec 10 Dec 11 Dec 12 Dec 13 Dec 14 Mar 14 Mar 15 C&I Construction Commerical Multi-Family Residential and Consumer Loan Growth ($ in millions) 6 +276% 15%
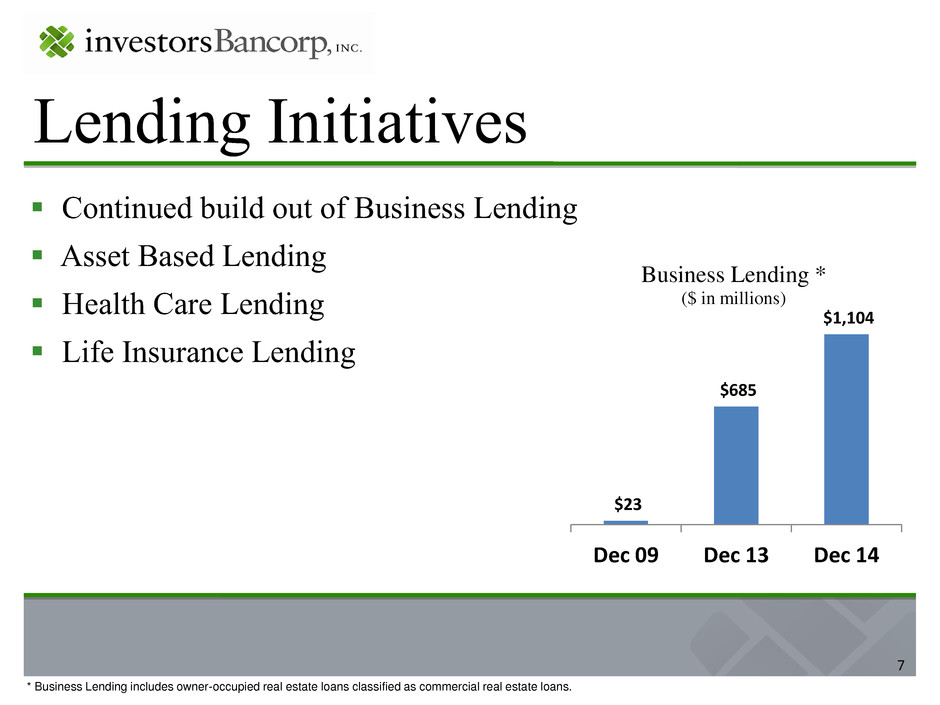
Lending Initiatives 7 Continued build out of Business Lending Asset Based Lending Health Care Lending Life Insurance Lending $23 $685 $1,104 Dec 09 Dec 13 Dec 14 Business Lending * ($ in millions) * Business Lending includes owner-occupied real estate loans classified as commercial real estate loans.
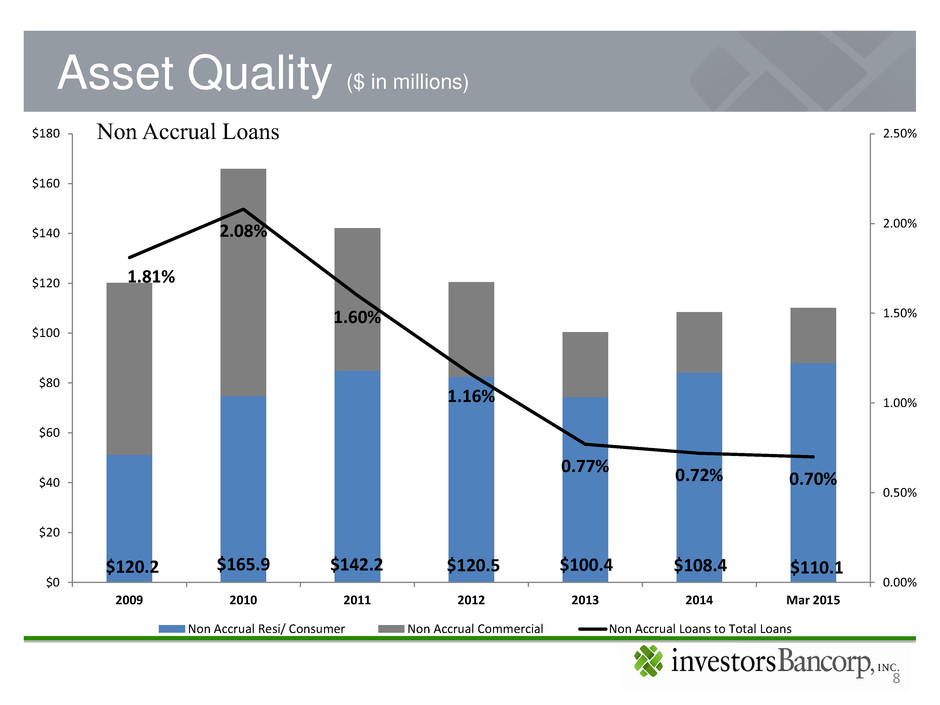
Asset Quality ($ in millions) 8 $120.2 $165.9 $142.2 $120.5 $100.4 $108.4 $110.1 1.81% 2.08% 1.60% 1.16% 0.77% 0.72% 0.70% 0.00% 0.50% 1.00% 1.50% 2.00% 2.50% $0 $20 $40 $60 $80 $100 $120 $140 $160 $180 2009 2010 2011 2012 2013 2014 Mar 2015 Non Accrual Resi/ Consumer Non Accrual Commercial Non Accrual Loans to Total Loans Non Accrual Loans
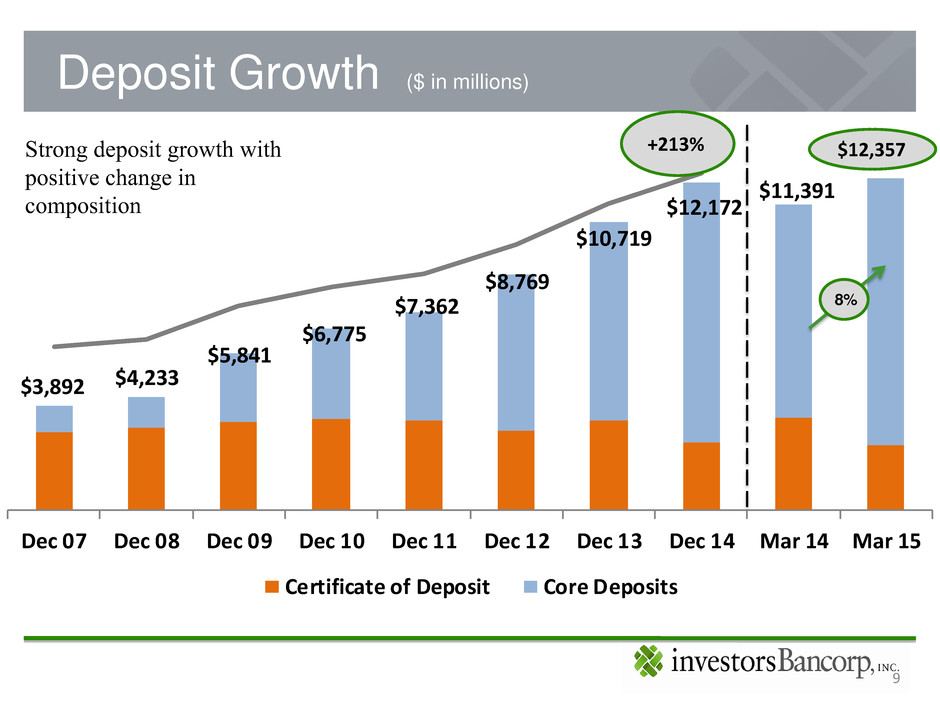
$3,892 $4,233 $5,841 $6,775 $7,362 $8,769 $10,719 $12,172 $11,391 Dec 07 Dec 08 Dec 09 Dec 10 Dec 11 Dec 12 Dec 13 Dec 14 Mar 14 Mar 15 Certificate of Deposit Core Deposits Deposit Growth ($ in millions) 9 Strong deposit growth with positive change in composition +213% $12,357 8%
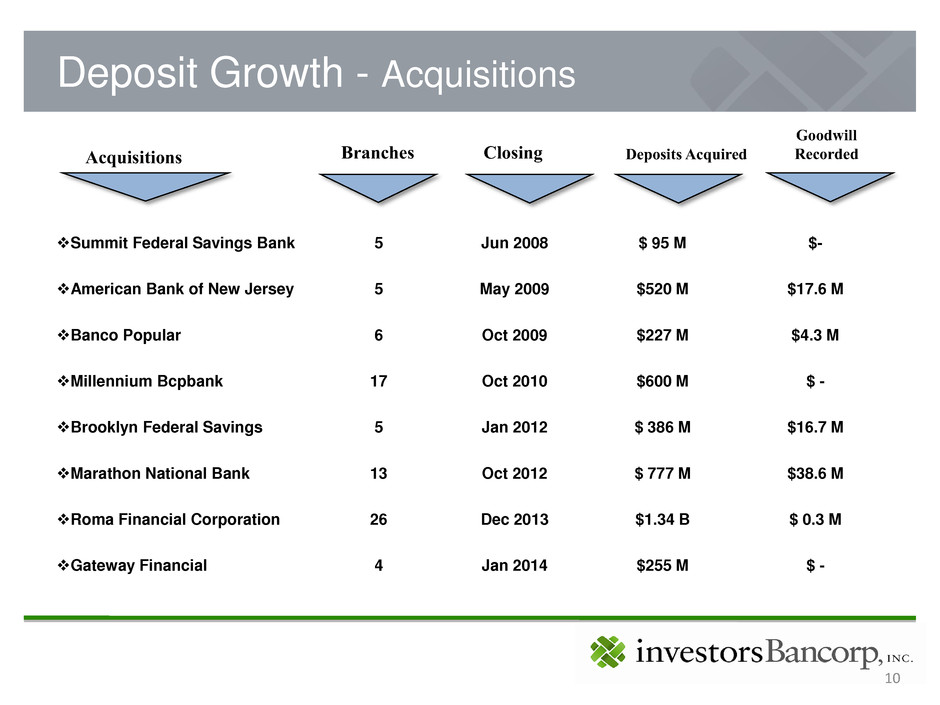
Summit Federal Savings Bank 5 Jun 2008 $ 95 M $- American Bank of New Jersey 5 May 2009 $520 M $17.6 M Banco Popular 6 Oct 2009 $227 M $4.3 M Millennium Bcpbank 17 Oct 2010 $600 M $ - Brooklyn Federal Savings 5 Jan 2012 $ 386 M $16.7 M Marathon National Bank 13 Oct 2012 $ 777 M $38.6 M Roma Financial Corporation 26 Dec 2013 $1.34 B $ 0.3 M Gateway Financial 4 Jan 2014 $255 M $ - 10 Acquisitions Branches Closing Deposits Acquired Goodwill Recorded Deposit Growth - Acquisitions 10

Brooklyn – Boro Park Oct 2011 $150 M Brooklyn – Ave M Apr 2012 $ 64 M Brooklyn – 86th St Nov 2012 $ 22 M Brooklyn – Ocean Ave Jul 2013 $ 22 M Brooklyn – Quentin Rd Oct 2013 $ 33 M Brooklyn- Carroll Garden Nov 2013 $ 31 M Brooklyn - Brighton Beach May 2014 $20 M Deposit Growth – De Novo Branches 11 New York Perth Amboy Oct 2007 $ 66 M Red Bank May 2008 $ 72 M Morristown Mar 2009 $ 140 M Three Bridges Jul 2009 $ 80 M Edison- Clara Barton Sep 2009 $ 113 M Lakewood- Madison Oct 2009 $ 70 M Carteret Jun 2010 $ 61 M South Plainfield Sep 2010 $ 43 M South Orange Mar 2011 $ 38 M Freehold- Main Apr 2011 $ 288 M Point Pleasant Apr 2012 $ 80 M Woodbridge Oct 2012 $ 73 M Tottenville Sep 2014 $ 28 M Garfield Dec 2014 $ 8 M New Jersey De Novo branches opened through December 2014, deposits as of May, 2015
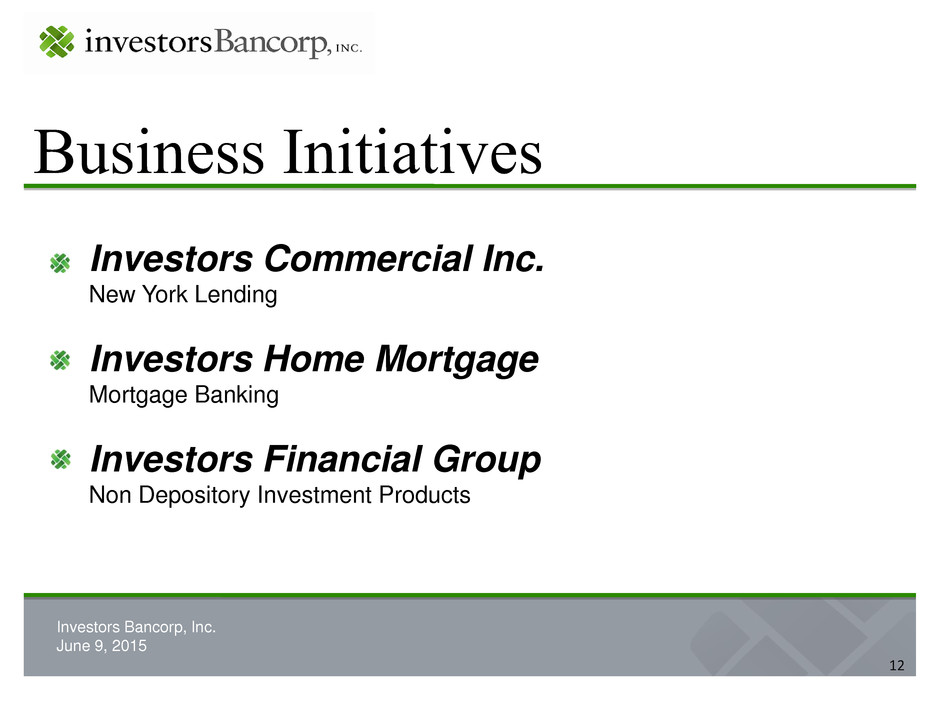
Investors Bancorp, Inc. June 9, 2015 Business Initiatives 12 Investors Commercial Inc. New York Lending Investors Home Mortgage Mortgage Banking Investors Financial Group Non Depository Investment Products
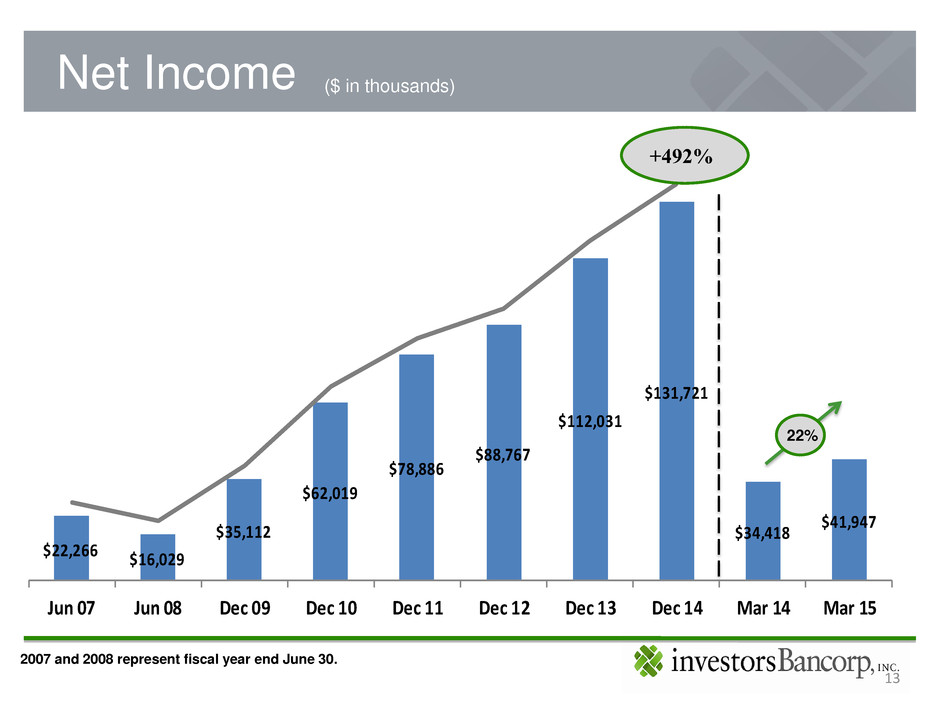
$22,266 $16,029 $35,112 $62,019 $78,886 $88,767 $112,031 $131,721 $34,418 $41,947 Jun 07 Jun 08 Dec 09 Dec 10 Dec 11 Dec 12 Dec 13 Dec 14 Mar 14 Mar 15 Net Income 13 +492% 2007 and 2008 represent fiscal year end June 30. ($ in thousands) 22%
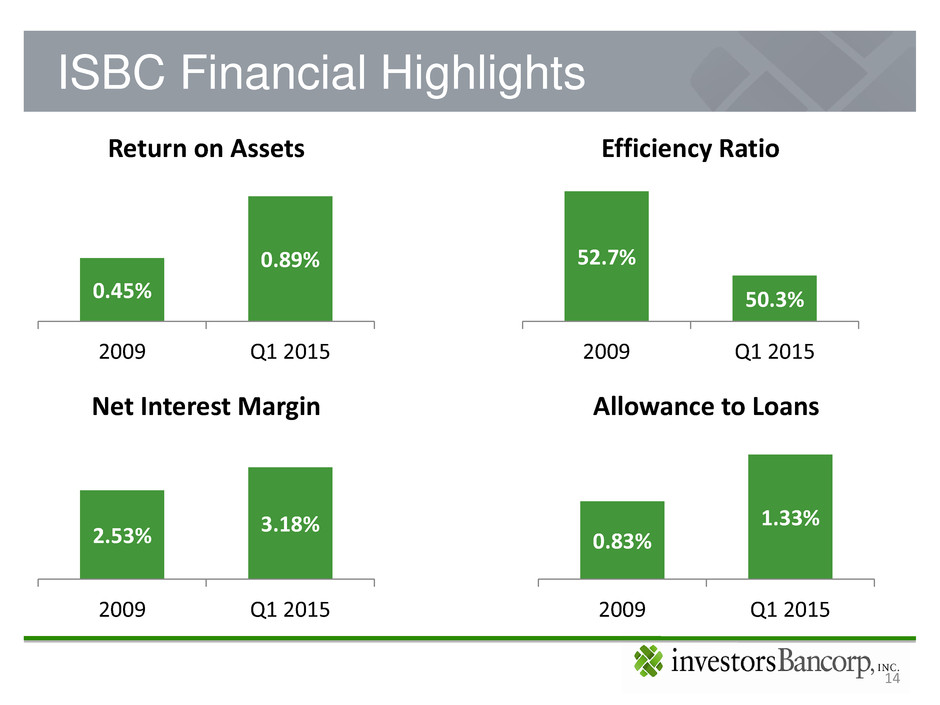
ISBC Financial Highlights 14 0.45% 0.89% 2009 Q1 2015 Return on Assets 52.7% 50.3% 2009 Q1 2015 Efficiency Ratio 2.53% 3.18% 2009 Q1 2015 Net Interest Margin 0.83% 1.33% 2009 Q1 2015 Allowance to Loans
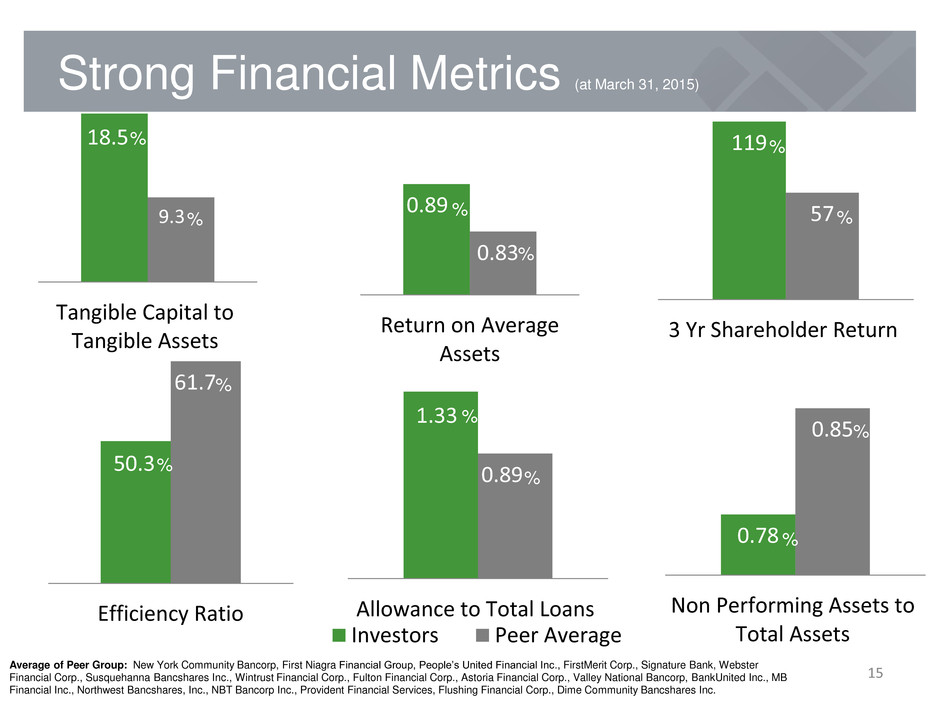
18.5 9.3 Tangible Capital to Tangible Assets 15 119 57 3 Yr Shareholder Return 50.3 61.7 Efficiency Ratio Investors Peer Average Average of Peer Group: New York Community Bancorp, First Niagra Financial Group, People’s United Financial Inc., FirstMerit Corp., Signature Bank, Webster Financial Corp., Susquehanna Bancshares Inc., Wintrust Financial Corp., Fulton Financial Corp., Astoria Financial Corp., Valley National Bancorp, BankUnited Inc., MB Financial Inc., Northwest Bancshares, Inc., NBT Bancorp Inc., Provident Financial Services, Flushing Financial Corp., Dime Community Bancshares Inc. Strong Financial Metrics (at March 31, 2015) 0.78 0.85 Non Performing Assets to Total Assets 1.33 0.89 Allowance to Total Loans 0.89 0.83 Return on Average Assets % % % % % % % % % % % %
16 Strategic Plan Initiatives Complete Core Conversion Increase Middle Market Penetration Enhance Enterprise Risk Management Prudent Capital Management
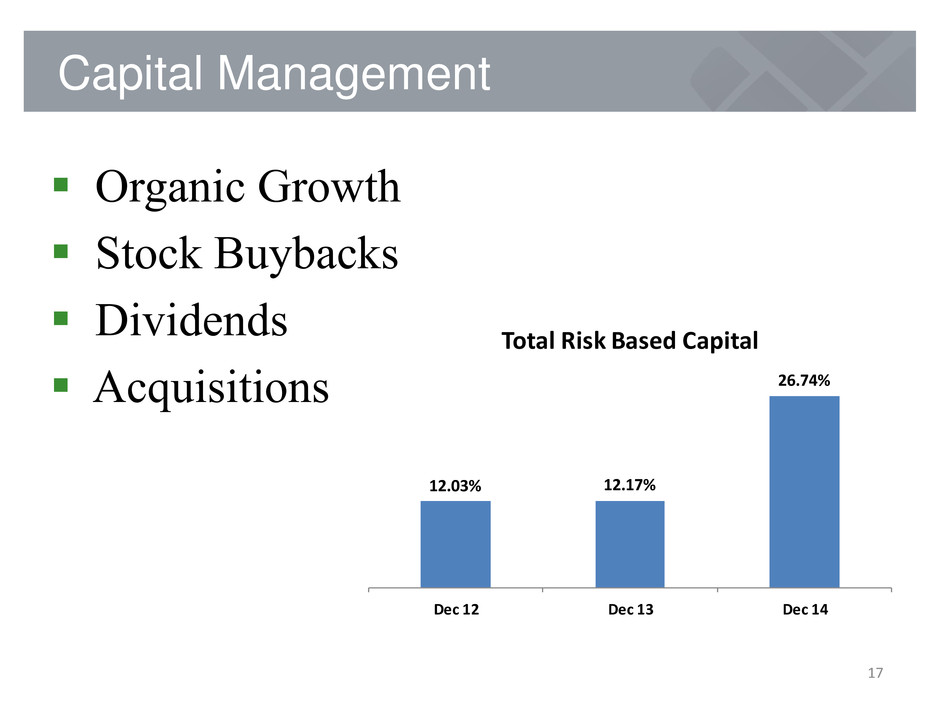
17 Capital Management Organic Growth Stock Buybacks Dividends Acquisitions 12.03% 12.17% 26.74% Dec 12 Dec 13 Dec 14 Total Risk Based Capital
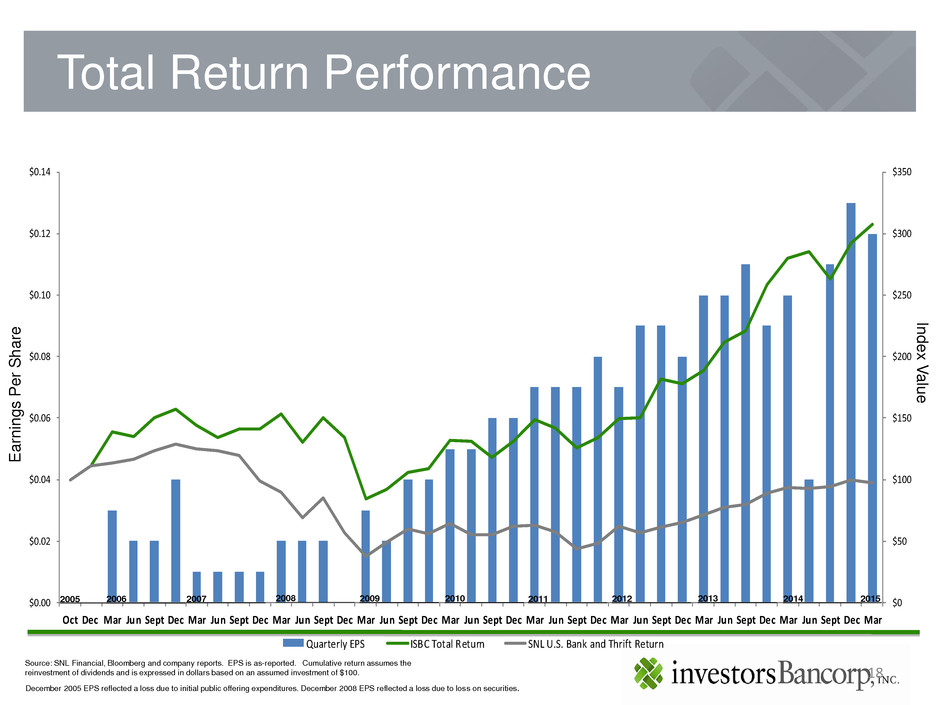
$0 $50 $100 $150 $200 $250 $300 $350 $0.00 $0.02 $0.04 $0.06 $0.08 $0.10 $0.12 $0.14 Oct Dec Mar Jun Sept Dec Mar Jun Sept Dec Mar Jun Sept Dec Mar Jun Sept Dec Mar Jun Sept Dec Mar Jun Sept Dec Mar Jun Sept Dec Mar Jun Sept Dec Mar Jun Sept Dec Mar Quarterly EPS ISBC Total Return SNL U.S. Bank and Thrift Return 18 Source: SNL Financial, Bloomberg and company reports. EPS is as-reported. Cumulative return assumes the reinvestment of dividends and is expressed in dollars based on an assumed investment of $100. 2006 Total Return Performance 2007 2008 2009 2010 2012 2011 2013 2014 December 2005 EPS reflected a loss due to initial public offering expenditures. December 2008 EPS reflected a loss due to loss on securities. 2015 2005 E a rnin g s P e r S h a re In d e x V a lu e

Thank You For More Information: • Log onto our web site: www.myinvestorsbank.com • Log onto our website above or www.sec.gov to obtain free copies of documents filed by Investors with the SEC 19


