Exhibit 99.3
FELDMAN FINANCIAL ADVISORS, INC.
1001 CONNECTICUT AVENUE, NW — SUITE 840
WASHINGTON, DC 20036
202-467-6862 — (FAX) 202-467-6963
HV Bancorp, Inc.
Proposed Holding Company for
Huntingdon Valley Bank
Huntingdon Valley, Pennsylvania
Pro Forma Conversion Valuation
Appraisal Report
Valued as of April 15, 2014
Prepared By
Feldman Financial Advisors, Inc.
Washington, DC
FELDMAN FINANCIAL ADVISORS, INC.
1001 CONNECTICUT AVENUE, NW — SUITE 840
WASHINGTON, DC 20036
202-467-6862 — (FAX) 202-467-6963
April 15, 2014
Board of Trustees
Huntingdon Valley Bank
3501 Masons Mill Road, Suite 401
Huntingdon Valley, Pennsylvania 19006
At your request, we have completed and hereby provide an independent appraisal (“Appraisal”) of the estimated pro forma market value of HV Bancorp, Inc. (“HV Bancorp”) in connection with the simultaneous conversion of Huntingdon Valley Bank (“HV Bank”) from the mutual to stock form of ownership, the change in HV Bank’s charter from a Pennsylvania-chartered savings bank to a Pennsylvania-chartered commercial bank, the issuance of HV Bank’s capital stock to HV Bancorp, the offering of shares of common stock of HV Bancorp for sale to certain members of HV Bank, an employee benefit plan of HV Bank, and other members of the general public (collectively referred to herein as the “conversion”).
Immediately after the completion of the conversion, HV Bancorp expects to acquire by merger The Victory Bancorp, Inc. (“Victory Bancorp”), the holding company for The Victory Bank (“Victory Bank”). Upon consummation of the merger, HV Bank will change its corporate title to “Victory Bank.” This Appraisal is furnished pursuant to the regulatory filing by HV Bank and HV Bancorp of the Application for Conversion (“Application”) with the Pennsylvania Department of Banking and Securities, the Federal Deposit Insurance Corporation (“FDIC”), and the Board of Governors of the Federal Reserve System (“FRB”).
Feldman Financial Advisors, Inc. (“Feldman Financial”) is a financial consulting and economic research firm that specializes in financial valuations and analyses of business enterprises and securities in the thrift, banking, and mortgage industries. The background of Feldman Financial is presented in Exhibit I. In preparing the Appraisal, we conducted an analysis of HV Bank that included discussions with HV Bank’s management, HV Bank’s legal counsel, Jones Walker LLP, and HV Bank’s independent auditor, BDO USA, LLP. We also reviewed, among other factors, the economy in HV Bank’s primary market area and compared HV Bank’s financial condition and operating performance with that of selected publicly traded thrift institutions. We reviewed conditions in the securities markets in general and in the market for thrift institution common stocks in particular.
We have also analyzed the pro forma financial impact of HV Bancorp’s pending acquisition of Victory Bancorp based on financial data set forth in the Application, the review of audited and unaudited financial information of Victory Bancorp, and discussions with Victory Bancorp’s management. In addition, where appropriate, we considered information based on other available published sources that we believe are reliable; however, we cannot guarantee the accuracy and completeness of such information.
FELDMAN FINANCIAL ADVISORS, INC.
Board of Trustees
Huntingdon Valley Bank
April 15, 2014
Page Two
The Appraisal is based on HV Bank’s representation that the information contained in the Application and additional information furnished to us by HV Bank, Victory Bancorp, and their respective independent auditors are truthful, accurate, and complete. We did not independently verify the financial statements and other information provided by HV Bank, Victory Bancorp, and their independent auditors, nor did we independently value the assets or liabilities of HV Bank or Victory Bancorp. The Appraisal considers HV Bancorp only as a going concern and should not be considered as an indication of the liquidation value of HV Bancorp.
Plan of Conversion
On December 12, 2013, the Board of Trustees of HV Bank unanimously adopted a Plan of Conversion from mutual to stock form of organization. Pursuant to the Plan of Conversion, HV Bank will convert from the mutual to the stock form of organization and will become the wholly owned subsidiary of HV Bancorp, a new Pennsylvania corporation. HV Bancorp will own all of the capital stock of HV Bank upon completion of the conversion. All of the common stock of HV Bancorp will be owned by public shareholders, including former shareholders of Victory Bancorp who receive shares of HV Bancorp in the merger. The Plan of Conversion provides that shares of common stock of HV Bank will be offered for sale in a subscription offering to eligible members of HV Bank and to its employee stock ownership plan (“ESOP”), and, if necessary, to members of the general public through a community offering and, possibly, through a syndicate of registered broker-dealers. In any community offering, preference will be given to persons residing in the Pennsylvania counties of Montgomery, Bucks, and Philadelphia.
Merger Agreement
HV Bank, HV Bancorp, and Victory Bancorp entered into an Agreement and Plan of Reorganization on December 12, 2013 pursuant to which HV Bancorp will acquire Victory Bancorp. As part of the acquisition, Victory Bank will merge with and into HV Bank, with HV Bank as the resulting entity. Upon consummation of the merger, HV Bank will change its corporate title to “Victory Bank.” In connection with the merger, Victory Bancorp’s shareholders will receive the right to exchange each share of Victory Bancorp common stock for 0.6794 of a share of HV Bancorp common stock, and under certain limited circumstances, a combination of HV Bancorp common stock and cash. In addition, Victory Bancorp Series E convertible preferred stock shareholders will be given the opportunity to convert shares of Series E preferred stock as follows: (i) exchange their shares of Series E preferred stock into Victory Bancorp subordinated debt; (ii) if permitted by the terms of Series E preferred stock and any necessary regulatory approvals, be redeemed by Victory Bancorp for cash as par on or prior to the closing date of the merger; or (iii) convert into the right to receive one share of HV Bancorp preferred stock having similar terms, subject to certain limitations. Victory Bancorp Series F preferred stock that was issued to the U.S. Treasury under the Small Business Lending Fund (“SBLF”) program will be exchanged for HV Bancorp Series B preferred stock having similar terms.
FELDMAN FINANCIAL ADVISORS, INC.
Board of Trustees
Huntingdon Valley Bank
April 15, 2014
Page Three
In the event that the aggregate amount of HV Bancorp common stock issued to Victory Bancorp shareholders in the merger, when added to the aggregate number of shares of HV Bancorp common stock to be purchased by Victory Bancorp shareholders in the conversion offering, would result in Victory Bancorp shareholders owning an amount of HV Bancorp common stock in excess of 48.5% on a pro forma basis, then HV Bancorp will pay to Victory Bancorp shareholders an amount of HV Bancorp common stock and cash, on a pro rata basis, sufficient to reduce the aggregate ownership of Victory Bancorp shareholders below the ownership limitation. In accordance with the merger agreement, Victory Bancorp shareholders will not own more than 48.5% of HV Bancorp after consummation of the merger. The 48.5% ownership limitation of former Victory Bancorp shareholders is a regulatory condition to approval of the conversion offering and the merger.
The merger agreement was the result of arm’s-length negotiations between the managements and boards of the parties, with the assistance and advice of their respective financial advisors and legal counsel. Consummation of the merger is subject to satisfaction of a number of conditions, including receipt of all required regulatory approvals, completion of HV Bank’s conversion to stock form as a state-chartered commercial bank and simultaneous holding company formation, and approval of the merger by Victory Bancorp’s stockholders.
Based on the shares outstanding at December 31, 2013, and the terms of the merger with Victory Bancorp, between 800,485 and 1,046,804 shares of HV Bancorp common stock would be issued to Victory Bancorp common shareholders in the merger in exchange for their Victory Bancorp common stock at a ratio of 0.6794 of a share of HV Bancorp for each outstanding share of Victory Bancorp common stock. In addition, under certain conditions, up to $1.8 million of cash may be paid as consideration in the merger with Victory Bancorp.
Valuation Conclusion
It is our opinion that, as of April 15, 2014, the estimated aggregate pro forma market value of the shares to be issued by HV Bancorp, inclusive of common stock to be issued to Victory Bancorp’s shareholders in connection with the pending merger, was $19,417,480 at the midpoint of the range (the “Valuation Range”), equal to 1,941,748 shares of common stock at a per share value of $10.00. At the midpoint, it is assumed that 1,000,000 shares of common stock will be sold in the offering by HV Bancorp and 941,748 shares of HV Bancorp common stock will be part of the merger consideration issued to shareholders of Victory Bancorp.
FELDMAN FINANCIAL ADVISORS, INC.
Board of Trustees
Huntingdon Valley Bank
April 15, 2014
Page Four
The range of shares sold in the offering reflects a 15% decrease from the midpoint to determine the minimum and a 15% increase from the midpoint to determine the maximum. Assuming an additional 15% increase above the maximum results in the adjusted maximum. Based on the foregoing valuation, the corresponding Valuation Range of pro forma outstanding shares and pro forma market values assuming an offering price of $10.00 per share is shown on the following page:
| Sold in Conversion Offering | Issued in Merger(1) | Pro Forma Combined Total | ||||||||||
HV Bancorp, Inc. | ||||||||||||
Shares of Common Stock | ||||||||||||
Minimum | 850,000 | 800,485 | 1,650,485 | |||||||||
Midpoint | 1,000,000 | 941,748 | 1,941,748 | |||||||||
Maximum | 1,150,000 | 1,046,804 | 2,196,804 | |||||||||
Adjusted Maximum | 1,322,500 | 1,046,804 | 2,369,304 | |||||||||
Pro Forma Market Value | ||||||||||||
Minimum | $ | 8,500,000 | $ | 8,004,850 | $ | 16,504,850 | ||||||
Midpoint | $ | 10,000,000 | $ | 9,417,480 | $ | 19,417,480 | ||||||
Maximum | $ | 11,500,000 | $ | 10,468,040 | $ | 21,968,040 | ||||||
Adjusted Maximum | $ | 13,225,000 | $ | 10,468,040 | $ | 23,693,040 | ||||||
Outstanding % of Shares | ||||||||||||
Minimum | 51.50 | % | 48.50 | % | 100.00 | % | ||||||
Midpoint | 51.50 | % | 48.50 | % | 100.00 | % | ||||||
Maximum | 52.35 | % | 47.65 | % | 100.00 | % | ||||||
Adjusted Maximum | 55.82 | % | 44.18 | % | 100.00 | % | ||||||
| (1) | As discussed in the preliminary prospectus of HV Bancorp, assumes that at levels equal to or below the midpoint of the offering range, 81% of Victory Bancorp Series E stockholders convert their preferred shares into Victory Bancorp common stock prior to the merger and 19% convert their preferred shares into subordinated debt. At levels above the midpoint of the offering range, it is assumed that 100% of the Series E preferred shares are exchanged for Victory Bancorp common stock. In the event that the aggregate HV Bancorp common stock shares to be issued in the merger, when added to the aggregate HV Bancorp common stock shares purchased by holders of Victory Bancorp common stock in the conversion offering, would result in Victory Bancorp shareholders owning in excess of 48.5% of the outstanding HV Bancorp common stock, then HV Bancorp will substitute cash in an amount sufficient to reduce the ownership level to comply with this limitation. In order to ensure that Victory Bancorp shareholders, in the aggregate, do not own HV Bancorp common stock in excess of the 48.5% limit, Series E preferred shareholders who are Victory Bancorp directors and senior management have entered into commitments pursuant to which they have agreed to exchange a certain percentage of shares of Victory Bancorp Series E preferred stock held by each of them for subordinated debt. |
Our Appraisal is not intended, and must not be construed, to be a recommendation of any kind as to the advisability of purchasing shares of common stock in the conversion offering. Moreover, because the Appraisal is necessarily based upon estimates and projections of a number of matters, all of which are subject to change from time to time, no assurance can be given that persons who purchase shares of stock in the conversion offering will thereafter be able to sell such shares at prices related to the foregoing estimate of the aggregate pro forma market value.
FELDMAN FINANCIAL ADVISORS, INC.
Board of Trustees
Huntingdon Valley Bank
April 15, 2014
Page Five
Feldman Financial is not a seller of securities within the meaning of any federal or state securities laws and any report prepared by Feldman Financial shall not be used as an offer or solicitation with respect to the purchase or sale of any securities. Except for the fee that we shall receive from HV Bank for preparing this Appraisal, we are independent of HV Bank, HV Bancorp, Victory Bancorp, and their respective boards and officers. We are also independent of other professional firms engaged by HV Bank, HV Bancorp, and Victory Bancorp to assist with the stock offering and pending merger.
The Valuation Range reported herein will be updated as appropriate. These updates will consider, among other factors, any developments or changes in the operating performance and financial condition of HV Bank and Victory Bancorp, management policies, terms of the merger, and current conditions in the securities markets for financial institution common stocks. Should any such new developments or changes be material, in our opinion, to the pro forma valuation of the common stock of HV Bancorp, appropriate adjustments to the estimated pro forma market value will be made. The reasons for any such adjustments will be explained in detail at that time.
| Respectfully submitted, |
| Feldman Financial Advisors, Inc. |
 |
|
| Trent R. Feldman |
| President |
 |
|
| Peter W. L. Williams |
| Principal |
FELDMAN FINANCIAL ADVISORS, INC.
TABLE OF CONTENTS
TAB | PAGE | |||||||
INTRODUCTION | 1 | |||||||
I. | Chapter One – OVERVIEW OF FINANCIAL PERFORMANCE | |||||||
General Profile of Huntingdon Valley Bank | 4 | |||||||
Financial Condition | 11 | |||||||
Income and Expense Trends | 20 | |||||||
Interest Rate Risk Management | 29 | |||||||
Asset Quality | 32 | |||||||
Office Properties | 35 | |||||||
Market Area | 37 | |||||||
General Profile of Victory Bancorp | 45 | |||||||
Pro Forma Impact of the Merger and Conversion | 49 | |||||||
II. | Chapter Two – COMPARISONS WITH PUBLICLY TRADED THRIFTS | |||||||
General Overview | 56 | |||||||
Selection Criteria | 57 | |||||||
Recent Financial Comparisons | 61 | |||||||
III. | Chapter Three – MARKET VALUE ADJUSTMENTS | |||||||
General Overview | 76 | |||||||
Earnings Prospects | 77 | |||||||
Financial Condition | 79 | |||||||
Market Area | 80 | |||||||
Management | 81 | |||||||
Dividend Policy | 82 | |||||||
Liquidity of the Issue | 83 | |||||||
Subscription Interest | 83 | |||||||
Recent Acquisition Activity | 85 | |||||||
Effect of Government Regulations and Regulatory Reform | 87 | |||||||
Stock Market Conditions | 88 | |||||||
Adjustments Conclusion | 93 | |||||||
Valuation Approach | 93 | |||||||
Valuation Conclusion | 97 | |||||||
IV. | Appendix – EXHIBITS | |||||||
I | Background of Feldman Financial Advisors, Inc | I-1 | ||||||
II-1 | Consolidated Balance Sheets | II-1 | ||||||
II-2 | Consolidated Income Statements | II-2 | ||||||
II-3 | Loan Portfolio Composition | II-3 | ||||||
II-4 | Net Lending Activity | II-4 | ||||||
II-5 | Investment Portfolio Composition | II-5 | ||||||
II-6 | Deposit Account Distribution | II-6 | ||||||
II-7 | Borrowed Funds Distribution | II-7 | ||||||
II-8 | Consolidated Balance Sheets (Victory Bancorp) | II-8 | ||||||
II-9 | Consolidated Income Statements (Victory Bancorp) | II-9 | ||||||
III | Financial and Market Data for All Public Thrifts | III-1 | ||||||
IV-1 | Pro Forma Assumptions for Conversion Stock Offering | IV-1 | ||||||
IV-2 | Pro Forma Conversion Valuation Range | IV-2 | ||||||
IV-3 | Pro Forma Conversion Analysis at the Midpoint Valuation | IV-4 | ||||||
IV-4 | Comparative Valuation Ratio Differential | IV-5 | ||||||
i
FELDMAN FINANCIAL ADVISORS, INC.
LIST OF TABLES
TAB | PAGE | |||||||
I. | Chapter One – OVERVIEW OF FINANCIAL PERFORMANCE | |||||||
Table 1 | Selected Financial Condition Data | 11 | ||||||
Table 2 | Relative Balance Sheet Concentrations | 12 | ||||||
Table 3 | Income Statement Summary | 21 | ||||||
Table 4 | Selected Financial Ratios and Other Data | 22 | ||||||
Table 5 | Income Statement Ratios | 24 | ||||||
Table 6 | Yield and Cost Summary | 25 | ||||||
Table 7 | Net Portfolio Value Analysis | 31 | ||||||
Table 8 | Non-performing Assets Summary | 33 | ||||||
Table 9 | Allowance for Loan Loss Summary | 34 | ||||||
Table 10 | Branch Office Deposit Data | 36 | ||||||
Table 11 | Selected Demographic Data | 39 | ||||||
Table 12 | Deposit Market Share in the Philadelphia MSA | 42 | ||||||
Table 13 | Deposit Market Share in Montgomery County, Pennsylvania | 43 | ||||||
Table 14 | Residential Mortgage Lending Share in the Philadelphia MSA | 44 | ||||||
Table 15 | Selected Financial Condition and Operating Data (Victory Bancorp) | 46 | ||||||
Table 16 | Selected Financial Ratios and Other Data (Victory Bancorp) | 47 | ||||||
Table 17 | Pro Forma Consolidated Balance Sheet | 52 | ||||||
Table 18 | Pro Forma Consolidated Income Statement | 54 | ||||||
II. | Chapter Two – COMPARISONS WITH PUBLICLY TRADED THRIFTS | |||||||
Table 19 | Comparative Group Operating Summary | 60 | ||||||
Table 20 | Key Financial Comparisons | 63 | ||||||
Table 21 | General Operating Characteristics | 70 | ||||||
Table 22 | Summary Financial Performance Ratios | 71 | ||||||
Table 23 | Income and Expense Analysis | 72 | ||||||
Table 24 | Yield-Cost Structure and Growth Rates | 73 | ||||||
Table 25 | Balance Sheet Composition | 74 | ||||||
Table 26 | Regulatory Capital, Credit Risk, and Loan Composition | 75 | ||||||
III. | Chapter Three – MARKET VALUE ADJUSTMENTS | |||||||
Table 27 | Summary of Pennsylvania Bank and Thrift Acquisition Activity | 86 | ||||||
Table 28 | Comparative Stock Index Performance | 88 | ||||||
Table 29 | Summary of Recent Standard Conversion Stock Offerings | 91 | ||||||
Table 30 | Comparative Pro Forma Market Valuation Analysis | 99 | ||||||
ii
FELDMAN FINANCIAL ADVISORS, INC.
INTRODUCTION
As requested, we have completed and hereby provide an independent appraisal (“Appraisal”) of the estimated pro forma market value of HV Bancorp, Inc. (“HV Bancorp”) in connection with the simultaneous conversion of Huntingdon Valley (“HV Bank”) from the mutual to stock form of ownership, the change in HV Bank’s charter from a Pennsylvania-chartered savings bank to a Pennsylvania-chartered commercial bank, the issuance of HV Bank’s capital stock to HV Bancorp, the offering of shares of common stock of HV Bancorp for sale to certain members of HV Bank, the employee stock ownership plan (“ESOP”) of HV Bank, and other members of the general public (collectively referred to herein as the “conversion”).
Immediately after the completion of the conversion, HV Bancorp expects to acquire by merger The Victory Bancorp, Inc. (“Victory Bancorp”), the holding company for The Victory Bank (“Victory Bank”). Upon consummation of the merger, HV Bank will change its corporate title to “Victory Bank.” This Appraisal is furnished pursuant to the regulatory filing by HV Bank and HV Bancorp of the Application for Conversion (“Application”) with the Pennsylvania Department of Banking and Securities, the Federal Deposit Insurance Corporation (“FDIC”), and the Board of Governors of the Federal Reserve System (“FRB”).
The estimated pro forma market value is defined as the price at which HV Bancorp’s common stock, immediately upon completion of the stock offering and merger with Victory Bancorp, would change hands between a willing buyer and a willing seller, when the former is not under any compulsion to buy and the latter is not under any compulsion to sell, both parties having reasonable knowledge of relevant facts.
1
FELDMAN FINANCIAL ADVISORS, INC.
Feldman Financial Advisors, Inc. (“Feldman Financial”) is a financial consulting and economic research firm that specializes in financial valuations and analyses of business enterprises and securities in the thrift, banking, and mortgage industries. The background of Feldman Financial is presented in Exhibit I. In preparing the Appraisal, we conducted an analysis of HV Bank that included discussions with HV Bank’s management, HV Bank’s legal counsel, Jones Walker LLP, and HV Bank’s independent auditor, BDO USA, LLP. We also reviewed, among other factors, the economy in HV Bank’s primary market area and compared HV Bank’s financial condition and operating performance with that of selected publicly traded thrift institutions. We reviewed conditions in the securities markets in general and in the market for thrift institution common stocks in particular.
We have also analyzed the pro forma financial impact of HV Bancorp’s pending acquisition of Victory Bancorp based on financial data set forth in the Application, the review of audited and unaudited financial information of Victory Bancorp, and discussions with Victory Bancorp’s management. In addition, where appropriate, we considered information based on other available published sources that we believe are reliable; however, we cannot guarantee the accuracy and completeness of such information.
The Appraisal is based on HV Bank’s representation that the information contained in the Application and additional information furnished to us by HV Bank, Victory Bancorp, and their respective independent auditors are truthful, accurate, and complete. We did not independently verify the financial statements and other information provided by HV Bank, Victory Bancorp, and their independent auditors, nor did we independently value the assets or liabilities of HV Bank of Victory Bancorp. The Appraisal considers HV Bancorp only as a going concern and should not be considered as an indication of the liquidation value of HV Bancorp.
2
FELDMAN FINANCIAL ADVISORS, INC.
Our Appraisal is not intended, and must not be construed, to be a recommendation of any kind as to the advisability of purchasing shares of common stock in the conversion offering. Moreover, because the Appraisal is necessarily based on estimates and projections of a number of matters, all of which are subject to change from time to time, no assurance can be given that persons who purchase shares of common stock in the conversion offering will hereafter be able to sell such shares at prices related to the foregoing estimate of the aggregate pro forma market value.
Feldman Financial is not a seller of securities within the meaning of any federal and state securities laws and any report prepared by Feldman Financial shall not be used as an offer or solicitation with respect to the purchase or sale of any securities. Except for the fee that we shall receive from HV Bank for preparing this Appraisal, we are independent of HV Bank, HV Bancorp, Victory Bancorp, and their respective boards and officers. We are also independent of other professional firms engaged by HV Bank and HV Bancorp to assist with the conversion offering.
The Valuation Range reported herein will be updated as appropriate. These updates will consider, among other factors, any developments or changes in the operating performance and financial condition of HV Bank and Victory Bancorp, management policies, terms of the merger, and current conditions in the securities markets for financial institution common stocks. Should any such new developments or changes be material, in our opinion, to the pro forma valuation of the common stock of HV Bancorp, appropriate adjustments to the estimated pro forma market value will be made. The reasons for any such adjustments will be explained in detail at that time.
3
FELDMAN FINANCIAL ADVISORS, INC.
I. OVERVIEW OF FINANCIAL PERFORMANCE
General Profile of Huntingdon Valley Bank
Huntingdon Valley Bank, or HV Bank, was organized under the laws of the Commonwealth of Pennsylvania in 1871. HV Bank is a community-oriented mutual savings institution offering a variety of financial products and services to meet the needs of the communities it serves. HV Bank operates five branch offices located in Montgomery, Bucks and Philadelphia counties, Pennsylvania. It aims to deliver personalized service and respond promptly to customer needs and inquiries. HV Bank believes that its community orientation is attractive to its customers and distinguishes it from larger banks that operate in its market area. HV Bank’s principal business consists of attracting retail deposits from the general public in the areas surrounding its banking offices and investing those deposits, together with funds generated from operations, primarily in one- to four-family residential mortgage loans. HV Bank also invests in various investment securities and its revenue is derived primarily from interest income on loans and investments. HV Bank’s primary sources of funds are deposits and principal and interest payments on loans and securities.
HV Bank was founded in 1871 as a loan and building association with the name “Huntingdon Valley Perpetual Savings and Building Association.” Five years later, the name of the association was changed to “Huntingdon Valley Building & Loan Association.” In 1951, the association converted to a federal thrift charter and changed its name to “Huntingdon Valley Federal Savings & Loan Association.” In 1997, the savings and loan association changed its name to “Huntingdon Valley Federal Savings Bank.” In January 2000, the savings bank changed its corporate name to “Huntingdon Valley Bank.” The change in corporate title
4
FELDMAN FINANCIAL ADVISORS, INC.
signified HV Bank’s desire to broaden and expand its services and strengthen its community presence. On July 1, 2003, Huntingdon Valley Bank converted from a federally chartered mutual savings bank to a Pennsylvania-chartered mutual savings bank.
At December 31, 2013, HV Bank had total assets of $163.4 million, net total loans of $79.5 million, total deposits of $140.6 million, and total equity capital of $10.3 million or 6.28% of total assets. HV Bank is regulated by the Pennsylvania Department of Banking and Securities and the Federal Deposit Insurance Corporation (“FDIC”) and its deposits are insured up to applicable legal limits by the FDIC. HV Bank is a member of the Federal Home Loan Bank (“FHLB”) System.
Business Strategy after the Conversion and the Merger
HV Bank’s business strategy after the conversion stock offering and merger is to operate and grow a profitable commercial bank. As a result of the merger, HV Bancorp will be a larger, more diversified bank with a management team and operating strategy that will draw from both business strategies currently being used at HV Bank and Victory Bank. HV Bank believes that the proposed merger offers unique operating and strategic benefits. The following highlights some of the key points of HV Bank’s operating strategy for the combined enterprise.
Pursuing loan portfolio expansion and diversification with an emphasis on credit risk management to opportunities to increase the portfolio of commercial and other loans that provide higher returns. HV Bank’s loan portfolio includes commercial real estate and commercial business loans. At December 31, 2013, HV Bank had $13.2 million of commercial real estate and commercial business loans, representing 17.3% of total loans. Commercial loans help diversify HV Bank’s loan portfolio and help improve the interest rate sensitivity of its assets. The merger with Victory Bank will significantly increase HV Bank’s commercial loan
5
FELDMAN FINANCIAL ADVISORS, INC.
portfolio and origination capability. With the additional capital raised in the conversion offering, HV Bank intends to continue to pursue commercial lending opportunities. HV Bank’s maximum loan to-one borrower limit will increase from $1.7 million at December 31, 2013 to $3.7 million following completion of the stock offering (assuming the midpoint of the offering range) and merger, although HV Bank does not expect to have any lending relationships that would reach this limit.
Maintaining asset quality through conservative underwriting standards and diligent collection efforts. HV Bank believes that maintaining high asset quality is a key to long-term financial success. HV Bank has sought to grow and diversify its loan portfolio. HV Bank uses underwriting standards that it believes are conservative, and it diligently monitors collection efforts. At December 31, 2013, HV Bank’s non-accrual loans were 2.6% of its total loan portfolio. Although it intends to continue efforts to originate commercial real estate and commercial business loans after the conversion offering, HV Bank intends to maintain its philosophy of managing loan exposures through a prudent approach to lending.
Serving small- and middle-market commercial and retail customers with a significant focus on electronic delivery of services. HV Bank expects to utilize technology to increase profitability through greater productivity and cost control, and to provide new and better products and services. HV Bank expects to leverage Victory Bank’s middle-market commercial relationships and implement strategic hires of established commercial managers. HV Bank will seek to leverage the technological delivery platform employed by Victory Bank, including the use of remote deposit capture to enhance customers’ banking experience. After completion of the merger and the stock offering, HV Bank intends to operate and grow the combined enterprise into a high-technology commercial bank serving small businesses and professional practices,
6
FELDMAN FINANCIAL ADVISORS, INC.
with a significant focus on electronic delivery of services, while continuing to emphasize residential real estate lending. HV Bank will seek to utilize technology to increase productivity and provide new and better products and services. HV Bank also plans to analyze the profitability of these new technologies, products and services, and allocate its resources to those areas that it believes offer the greatest future potential, including cost control.
Continuing to originate residential mortgage loans that are primarily sold in the secondary mortgage market. HV Bank will continue to provide products and services that meet the needs of its residential lending customers in its primary market area. HV Bank offers both fixed-rate and adjustable-rate residential mortgage loans, with a variety of terms to meet its customers’ needs, which it primarily sells into the secondary mortgage market.
Building profitable business and consumer relationships by providing superior customer service with an emphasis on increasing transaction deposit account and deposit balances. HV Bank is a full-service financial services institution offering its customers a broad range of loan and deposit products. HV Bank continues to seek to increase the commercial real estate and commercial business loans that it originates and anticipates serving a greater percentage of the small businesses in its market area. HV Bank offers a broad array of services, including internet banking, mobile banking, account-related text messaging, remote check capture, automated clearinghouse (“ACH”) processing, and merchant credit card processing, among other conveniences.
HV Bank provides and plans to continue to emphasize superior customer service as a means to attract and maintain customers. HV Bank aims to deliver personalized service and to respond with flexibility to customer needs. It believes that a solid banking relationship is best facilitated by the primary transaction account. HV Bank intends to focus resources on growing
7
FELDMAN FINANCIAL ADVISORS, INC.
profitable business and consumer relationship by emphasizing the primary transaction account. The primary transaction account becomes connected to automated payment links in the form of direct debits and direct deposits and, coupled with superior customer service, tends to create a relationship between the banking organization and the customer. HV Bank believes that many opportunities remain to deliver what its customers want in the form of service and convenience, and intends to continue to promote its transaction accounts, particularly when it originates loans to its customers.
Reasons for the Conversion and the Offering
HV Bank has determined that the primary reasons for the conversion and the stock offering are to:
| • | facilitate the merger with Victory Bancorp; |
| • | raise capital to support the future growth of HV Bank by hiring experienced bankers with extensive market relationships and by successful implementation of electronic delivery channels; |
| • | enhance profitability and earnings by investing and leveraging the offering proceeds, primarily through the acquisition of Victory Bancorp and also through traditional funding and commercial banking activities; and |
| • | attract and retain highly qualified officers, other employees, and directors through, in part, the use of equity compensation plans, and to enhance current compensation programs. |
In addition, in the stock holding company structure, HV Bancorp will have greater flexibility in structuring mergers and acquisitions. Potential sellers often want a stock component for at least part of the acquisition consideration. The new stock holding company structure will enable HV Bancorp to offer stock or cash consideration, or a combination thereof, and will therefore enhance its ability to compete with other bidders when acquisition opportunities arise. Other than the merger with Victory Bancorp, HV Bancorp has no current arrangements or agreements to acquire other commercial banks, savings institutions, financial service companies, or branch offices.
8
FELDMAN FINANCIAL ADVISORS, INC.
The offering will afford directors, officers, and employees of HV Bank the opportunity to become shareholders, which HV Bank believes to be an effective performance incentive and an effective means of attracting and retaining qualified personnel. The offering also will provide customers of HV Bank and its local community members with an opportunity to acquire shares of the common stock of HV Bancorp.
HV Bancorp also intends to establish an ESOP that will purchase an amount of shares in the subscription offering equal to 6.0% of the total shares of common stock issued in the stock offering, including shares issued to Victory Bancorp’s shareholders in the merger. Subsequently, HV Bancorp intends to adopt and request shareholder approval of one or more stock-based incentive plans, including a restricted stock plan (“RSP”) and a stock option plan, no earlier than six months after the completion of the conversion.
Reasons for the Merger
The Board of Trustees of HV Bank believes that the merger will enhance the competitive position of HV Bank by enabling it to expand its franchise in Montgomery, Chester, Berks, Bucks, and Philadelphia counties. The merger with Victory Bancorp will facilitate a key step in the execution of HV Bank’s business strategy to increase market share in HV Bank’s primary market area through the acquisition or purchase of deposits, as well as expanding HV Bank’s commercial lending activity. The combination of HV Bank and Victory Bank will provide customers of both institutions with convenient access to their accounts by increasing the number of branches available in their market areas.
9
FELDMAN FINANCIAL ADVISORS, INC.
The merger, combined with the stock offering, will create a larger and more competitive retail distribution platform, and will enhance HV Bank’s ability to grow its loan portfolio, thus reducing its dependency on lower-yielding investment products. The terms of the merger agreement were the result of arm’s-length negotiations between HV Bank and Victory Bancorp. In their deliberations and in making their determinations, HV Bank’s Board of Trustees and Victory Bancorp’s Board of Directors considered many factors including the factors described above, as well as the following:
| • | information concerning the financial condition, results of operations, capital levels, asset quality, and prospects of HV Bank and Victory Bancorp, including consideration of each institution’s historical and projected results of operation and financial condition and a review of Victory Bancorp’s financial performance by comparison to peer group; |
| • | the anticipated impact the stock offering and merger will have on HV Bancorp’s ability to increase market share through organic growth; |
| • | the general structure of the transaction and the perceived compatibility of the respective management teams and business philosophies of HV Bank and Victory Bank, which both boards believe will facilitate integration of the operations of the two companies; |
| • | the belief that the merger will enhance each banking organization’s franchise value by the expansion of its branch network and by enhancing its ability to compete in its primary market area; and |
| • | the long-term growth strategies of both financial institutions. |
The remainder of Chapter I examines in more detail the performance trends of HV Bank and recent management initiatives. The discussion is supplemented by the exhibits in the Appendix. Exhibit II-1 summarizes HV Bank’s balance sheets as of the fiscal years ended June 30, 2012 and 2013 and as of December 31, 2013. Exhibit II-2 presents HV Bank’s income statements for the fiscal years ended June 30, 2012 and 2013 and the six months ended December 31, 2012 and 2013.
10
FELDMAN FINANCIAL ADVISORS, INC.
Financial Condition
Table 1 presents selected data concerning HV Bank’s financial position as of June 30, 2012 and 2013 and December 31, 2013. Table 2 displays relative balance sheet concentrations for HV Bank as of the corresponding periods.
Table 1
Selected Financial Condition Data
As of June 30, 2012 and 2013 and December 31, 2013
(Dollars in Thousands)
| December 31, 2013 | June 30, | |||||||||||
| 2013 | 2012 | |||||||||||
Total assets | $ | 163,423 | $ | 153,373 | $ | 155,914 | ||||||
Cash and cash equivalents | 22,898 | 7,073 | 11,011 | |||||||||
Investment securities | 51,259 | 51,807 | 49,110 | |||||||||
Total loans, net(1) | 79,534 | 83,865 | 86,007 | |||||||||
Total deposits | 140,631 | 133,540 | 133,717 | |||||||||
Total borrowings | 10,759 | 7,031 | 8,204 | |||||||||
Total equity capital | 10,261 | 10,566 | 11,627 | |||||||||
| (1) | Includes loans held for sale. |
Source: HV Bancorp, preliminary prospectus.
Asset Composition
HV Bank’s total assets amounted to $163.4 million at December 31, 2013, reflecting an increase of 6.5% from $153.4 million at June 30, 2013. HV Bank’s asset base had expanded to $174.9 million at June 30, 2005, but declined in the succeeding years to $143.3 million at June 30, 2008 as HV Bank sought to strengthen its capital ratios against the backdrop of declining profitability. In recent periods, HV Bank’s asset total has remained relatively stable with only modest growth. Cash and investments continue to comprise a relatively large percentage of the balance sheet, measuring 45.5% of total assets at December 31, 2013. HV Bank relies primarily on deposits as its chief funding source, supplemented to a limited degree by borrowings.
11
FELDMAN FINANCIAL ADVISORS, INC.
Table 2
Relative Balance Sheet Concentrations
As of June 30, 2012 and 2013 and December 31, 2013
(Percent of Total Assets)
| December 31, 2013 (%) | June 30, | |||||||||||
| 2013 | 2012 | |||||||||||
| (%) | (%) | |||||||||||
Cash and cash equivalents | 14.01 | 4.61 | 7.06 | |||||||||
Investment securities | 31.53 | 33.78 | 31.50 | |||||||||
Total loans, net(1) | 48.67 | 54.68 | 55.16 | |||||||||
Other assets | 5.79 | 6.93 | 6.28 | |||||||||
|
|
|
|
|
| |||||||
Total assets | 100.00 | 100.00 | 100.00 | |||||||||
|
|
|
|
|
| |||||||
Total deposits | 86.05 | 87.07 | 85.76 | |||||||||
Total borrowings | 6.58 | 4.58 | 5.26 | |||||||||
Other liabilities | 1.09 | 1.46 | 1.52 | |||||||||
|
|
|
|
|
| |||||||
Total liabilities | 93.72 | 93.11 | 92.54 | |||||||||
Total equity capital | 6.28 | 6.89 | 7.46 | |||||||||
|
|
|
|
|
| |||||||
Total liabilities and equity | 100.00 | 100.00 | 100.00 | |||||||||
|
|
|
|
|
| |||||||
| (1) | Includes loans held for sale. |
Source: HV Bancorp, preliminary prospectus; Feldman Financial calculations.
Total assets increased by $10.0 million, or 6.5%, to $163.4 million at December 31, 2013, from $153.4 million at June 30, 2013. The increase was primarily a result of an increase in cash and cash equivalents of $15.8 million funded by an increase in deposit liabilities of $5.1 million and additional FHLB advances of $4.0 million. The increase in cash and cash equivalents was offset by a $5.5 million decrease in loans held for sale.
Total assets decreased by $2.5 million, or 1.6%, to $153.4 million at June 30, 2013, from $155.9 million at June 30, 2012. The decrease was the result of a decrease in cash and cash equivalents of $3.9 million and a decrease in loans held for sale of $7.1 million. This was offset partially by an increase in loans receivable of $5.0 million and an increase in investment securities of $2.7 million.
12
FELDMAN FINANCIAL ADVISORS, INC.
As presented in Exhibit II-3, HV Bank’s current loan portfolio includes real estate mortgage loans as core products. The largest components of HV Bank’s loan portfolio are residential mortgage loans, commercial mortgage loans, home equity loans, and home equity lines of credit (“HELOCs”). Residential mortgage loans remain the largest category type within HV Bank’s loan portfolio, although commercial real estate loans occupy an increasing concentration of the overall portfolio compared to historical levels. For the year ended June 30, 2013, HV Bank originated $106.2 million of total loans, of which $103.5 million represented residential mortgage loans and $1.5 million consisted of commercial real estate loans. For the six months ended December 31, 2013, HV Bank originated $42.0 million of total loans, of which $40.5 million were residential mortgage loans and $1.1 million were commercial real estate loans.
At December 31, 2013, residential one- to four-family loans totaled $54.9 million or 72.0% of total loans. While HV Bank has traditionally originated and serviced the bulk of its residential lending for its own portfolio, in the past several years, due to concerns of interest rate risk in a historically low interest rate environment, HV Bank has sold a significant portion of its originated mortgage loans and loan servicing to third-party investors in the secondary market. For the year ended June 30, 2012 and 2013, total originations of loans held for sale were $142.5 million and $90.0 million, respectively. Gains on sale of loans totaled $1.8 million and $1.7 million for the year ended June 30, 2012 and 2013, respectively. For the six months ended December 31, 2013, total originations of loans held for sale amounted to $35.9 million with gains on sale of loans totaling $1.0 million for the same period. This compares to $46.8 million in total originations of loans held for sale with gains on sale of loans totaling $930,000 for the six months ended December 31, 2012.
13
FELDMAN FINANCIAL ADVISORS, INC.
HV Bank generates loans through its existing customers, referrals, real estate brokers, and other marketing efforts. HV Bank generally has limited its real estate loan originations to the financing of properties located within its market area. HV Bank’s residential mortgage loans generally have terms of 15, 20, or 30 years and consist of fixed-rate and adjustable-rate mortgage (“ARM”) loans. HV Bank does not offer “interest only” loans, where the borrower pays interest for an initial period after which the loan converts to a fully amortizing loan, nor does it offer “option ARM” or negative amortization loans, where the borrower can pay less than the interest owed on the loan, resulting in an increased principal balance during the life of the loan. HV Bank also does not make loans that are known as “sub-prime” or “Alt-A” loans.
HV Bank’s home equity loans and HELOCs are secured by second mortgages on owner-occupied one- to four-family residences. The maximum loan-to-value of these loans generally is 80%. At December 31, 2013, home equity loans and HELOCs secured by second mortgages totaled $8.1 million or 10.7% of total loans. Home equity loans consist of fixed-rate loans with terms up to a maximum of 20 years. At December 31, 2013, home equity loans totaled $2.5 million. HELOCs are adjustable monthly and tied to the prime rate. At December 31, 2013, HELOCs totaled $5.6 million.
HV Bank is also engaged in the origination of loans secured by commercial real estate, including multi-family dwellings. The current portfolio of these loans amounted to $12.4 million or 16.3% of total loans at December 31, 2013. The current loan-to-value ratio of these loans generally does not exceed 80% and these loans typically include personal guarantees. Loans secured by commercial real estate generally have larger loan balances and bear more credit risk than one- to four-family mortgage loans. The increased credit risk is a result of several factors, including the concentration of principal in a limited number of loans and borrowers, the impact
14
FELDMAN FINANCIAL ADVISORS, INC.
of local and general economic conditions on the borrower’s ability to repay the loan, and the increased difficulty of evaluating and monitoring these types of loans. However, commercial real estate loans generally have higher interest rates than one- to four-family residential loans.
HV Bank provides commercial business loans that demonstrate the ability to repay the debt through corporate cash flows. A majority of HV Bank’s commercial business loans are secured by assignment of corporate assets and include personal guarantees of the business owners. At December 31, 2013, commercial business loans amounted to $787,000 or 1.0% of total loans. Underwriting standards for commercial business loans include a review of the applicant’s tax returns, financial statements, credit history, and an assessment of the applicant’s ability to meet existing obligations and payments on the proposed loan based on cash flows generated by the applicant’s business. HV Bank typically requires a principal of the company obtaining a commercial business loan to personally sign the note as a co-borrower or guarantor.
Commercial business loans generally have higher interest rates and shorter terms than one- to four-family residential loans, but they also may involve higher average balances, increased difficulty of loan monitoring, and a higher risk of default since their repayment generally depends on the successful operation of the borrower’s business. HV Bank anticipates that its proposed merger with Victory Bank will allow HV Bank to increase its portfolio of commercial and other loans that provide higher returns than residential mortgage loans.
On a limited basis, HV Bank originates residential construction loans to individuals for the construction and permanent financing of their personal residences. Construction loans to individuals are made on the same general terms as one- to four-family mortgage loans, but provide for the payment of interest only during the construction phase, which is usually six months. At the end of the construction phase, the loan converts to a permanent mortgage loan.
15
FELDMAN FINANCIAL ADVISORS, INC.
Prior to making a commitment to fund a construction loan, HV Bank requires an appraisal of the property by an independent appraiser. HV Bank also reviews and inspects each project prior to disbursement of funds during the term of the construction loan. Loan proceeds are disbursed after inspection of the project based on percentage of completion. At December 31, 2013, HV Bank had no construction loans outstanding. When market conditions improve, HV Bank anticipates an expansion of its construction and land development loan activity.
Exhibit II-5 presents a summary of HV Bank’s investment portfolio as of June 30, 2012 and 2013 and December 31, 2013. HV Bank’s investment portfolio has consisted primarily of U.S. Government securities, corporate notes, collateralized mortgage obligations (“CMOs”), mortgage-backed securities (“MBS”), and municipal securities. HV Bank’s investment objectives are to (i) maintain high asset quality, (ii) provide and maintain liquidity, (iii) establish an acceptable level of interest rate and credit risk, (iv) provide an alternate source of low-risk investments when demand for loans is weak, and (v) generate a favorable return. At December 31, 2013, the held-to-maturity portfolio, which is carried at amortized cost, totaled $5.0 million or 3.1% of total assets and the available-for-sale portfolio, which is carried at fair value, totaled $46.2 million, or 38.3% of total assets. As of December 31, 2013, HV Bank also held $21.7 million in cash and due from banks, $1.2 million in interest-bearing deposits with other banks, and $910,000 in stock of the FHLB of Pittsburgh.
HV Bank also invests in bank-owned life insurance (“BOLI”) policies as a mechanism for funding various employee benefit costs. HV Bank is the beneficiary of these policies that insure the lives of certain of its current and former officers. The cash surrender value (“CSV”) of the insurance policies is recognized as an asset on the balance sheet and changes in the CSV are recorded as non-interest income on the income statement. The CSV of the BOLI amounted to $3.6 million or 2.2% of total assets as of December 31, 2013.
16
FELDMAN FINANCIAL ADVISORS, INC.
Liability Composition
Deposits are HV Bank’s major external source of funds for lending and investment purposes. In addition to deposits, funds are also derived primarily from principal and interest payments on loans and sources of borrowed debt. Loan repayments are a relatively stable source of funds, while deposit inflows and outflows are significantly influenced by general interest rates, money market conditions, and competition. Borrowings may also be used on a short-term basis to compensate for reductions in the availability of funds from other sources and may be used on a longer-term basis for general business purposes.
Exhibit II-6 presents a summary of HV Bank’s deposit composition as of June 30, 2012 and 2013 and December 31, 2013. Total deposits increased by 5.3% to $140.6 million at December 31, 2013, compared to $133.5 million at June 30, 2013. Deposits are generated primarily from within HV Bank’s market area. HV Bank relies on competitive pricing and customer service to attract and retain deposits. In addition, it offers a variety of deposit accounts with a range of interest rates and terms. Deposit accounts consist of savings accounts, demand checking accounts, interest-bearing and non-interest bearing NOW accounts, money market deposit accounts, and certificates of deposit.
HV Bank’s deposit base at December 31, 2013 comprised $93.1 million of transaction accounts (66.2% of total deposits) and $47.6 million of certificate accounts (33.8% of total deposits). Included in the transaction accounts were NOW accounts ($32.6 million or 23.2% of total deposits), savings accounts ($30.1 million or 21.4%), money market deposit accounts ($25.4 million or 18.0%), and checking accounts ($5.1 million or 3.6%). HV Bank has placed an
17
FELDMAN FINANCIAL ADVISORS, INC.
emphasis on attracting and retaining transaction deposit accounts. Additionally, in recent years, there has been a trend of customers shifting certificate deposits to more liquid deposit accounts due to low interest rates. The relative proportion of transaction accounts to deposits has expanded from 63.0% at June 30, 2012 to 66.2% at December 31, 2013. Certificates of deposit in denomination of $100,000 or more amounted to $22.6 million or 16.1% of total deposits at December 31, 2013. HV Bank did not have any brokered deposits outstanding as of December 31, 2013.
HV Bank utilizes borrowings as a supplemental source of funds when they can be invested profitably or to meet asset/liability management objectives. As shown in Exhibit II-7, HV Bank’s current borrowings consist of advances from the FHLB of Pittsburgh and securities sold under agreement to repurchase. In addition, HV Bank has the ability to borrow funds from the discount window of the Federal Reserve Bank of Philadelphia and a credit facility with Atlantic Community Banker’s Bank (“ACBB”), a correspondent bank. As of December 31, 2013, HV Bank had short-term and long-term credit facilities with the FHLB with a maximum borrowing capacity of approximately $69.7 million. HV Bank had fixed-rate FHLB advances outstanding in the amount of $7.0 million with a weighted average cost of 0.72% at December 31, 2013. HV Bank also accesses borrowings through overnight repurchase agreements, which are collateralized by MBS and CMOs. As of December 31, 2013, the repurchase agreements outstanding totaled $3.8 million with a weighted average cost of 0.14%.
HV Bank has historically maintained adequate capital levels. Due to restrained profitability and an increase in the unrealized losses related to the available-for-sale securities portfolio, HV Bank’s total equity declined from $11.6 million or 7.46% of total assets at June 30, 2012 to $10.3 million or 6.28% of total assets at December 31, 2013. HV Bank’s capital levels
18
FELDMAN FINANCIAL ADVISORS, INC.
remain above the minimum regulatory requirements. HV Bank’s regulatory capital ratios of Tier 1 Leverage Capital, Tier 1 Risk-based Capital, and Total Risk-based Capital were 6.85%, 12.30%, and 12.84%, respectively, as of December 31, 2013. In comparison, the minimum regulatory requirements for HV Bank under FDIC guidelines were 4.0%, 4.0%, and 8.0%, and the threshold requirements for regulatory “well capitalized” levels were 5.0%, 6.0%, and 10.0%, respectively. Based on these regulatory capital ratios and requirements, HV Bank was considered well capitalized as of December 31, 2013.
19
FELDMAN FINANCIAL ADVISORS, INC.
Income and Expense Trends
Table 3 displays the main components of HV Bank’s earnings performance for the fiscal years ended June 30, 2012 and 2013 and the six months ended December 31, 2012 and 2013. Table 4 presents a summary of selected operating ratios. Table 5 displays HV Bank’s income and expense ratios as a percent of average assets. Table 6 presents HV Bank’s weighted average yields on interest-earning assets and weighted average costs of interest-bearing liabilities.
General Overview
HV Bank has exhibited a record of moderate profitability in recent years, reflecting a trend of net interest income not covering operating expense and relying on gains on sales of loans and securities to deliver positive earnings. HV Bank’s return on average assets (“ROA”) measured 0.60% and 0.08% for the fiscal years ended June 30, 2012 and 2013. HV Bank’s earnings decreased from $912,000 in fiscal 2012 to $123,000 in fiscal 2013. HV Bank’s net interest margin has been restrained by its relative large concentration of investment security holdings. For the six months ended December 31, 2013, HV Bank’s earnings amounted to $55,000, representing an annualized ROA of 0.07%.
Six Months Ended December 31, 2012 and 2013
Net income was $55,000 for the six months ended December 31, 2013 as compared to $169,000 for the six months ended December 31, 2012. The annualized ROA declined to 0.07% for the recent six-month period versus 0.22% for the corresponding period a year ago. The $114,000 decrease in earnings reflected a $291,000 decrease in non-interest income, chiefly related to a decline in gains on sale of securities. Net interest income and non-interest expense did not change materially in the recent six-month period as compared to a year ago.
20
FELDMAN FINANCIAL ADVISORS, INC.
Table 3
Income Statement Summary
For the Years Ended June 30, 2012 and 2013
And the Six Months Ended December 31, 2012 and 2013
(Dollars in Thousands)
| Six Months Ended December 31, | Year Ended June 30, | |||||||||||||||
| 2013 | 2012 | 2013 | 2012 | |||||||||||||
Total interest income | $ | 2,545 | $ | 2,569 | $ | 4,994 | $ | 5,545 | ||||||||
Total Interest expense | 435 | 521 | 982 | 1,121 | ||||||||||||
|
|
|
|
|
|
|
| |||||||||
Net interest income | 2,110 | 2,048 | 4,012 | 4,334 | ||||||||||||
Provision (credit) for loan losses | (31 | ) | 80 | 120 | 178 | |||||||||||
|
|
|
|
|
|
|
| |||||||||
Net interest income after provision | 2,141 | 1,968 | 3,892 | 4,156 | ||||||||||||
Non-interest income | 1,202 | 1,493 | 2,700 | 2,749 | ||||||||||||
Non-interest expense | 3,253 | 3,220 | 6,511 | 6,103 | ||||||||||||
|
|
|
|
|
|
|
| |||||||||
Income before income taxes | 91 | 241 | 81 | 802 | ||||||||||||
Income tax expense (benefit) | 36 | 72 | (42 | ) | (110 | ) | ||||||||||
|
|
|
|
|
|
|
| |||||||||
Net income | $ | 55 | $ | 169 | $ | 123 | $ | 912 | ||||||||
|
|
|
|
|
|
|
| |||||||||
Source: HV Bancorp, preliminary prospectus.
Net interest income for the six months ended December 31, 2013 totaled $2.1 million compared to $2.0 million for the six months ended December 31, 2012, an increase of $62,000, or 3.0%. The increase in net interest income was primarily due to a decrease in interest expense, which declined by $86,000, or 16.5%, during this period primarily due to a decline of 15 basis points in the cost of interest-bearing liabilities from 0.81% to 0.66%. Concurrently, the yield on interest-earning assets only fell by 9 basis points from 3.50% to 3.41%. As a result, HV Bank’s net interest spread improved by 6 basis points from 2.69% to 2.75%. Due to an improvement in asset quality as reflected by a lower level of non-accrual loans of $2.0 million at December 31, 2013 versus $2.5 million at December 31, 2012, HV Bank recorded a $31,000 credit for loan losses in the recent six-month period versus a $80,000 provision in the prior year’s period.
21
FELDMAN FINANCIAL ADVISORS, INC.
Table 4
Selected Financial Ratios and Other Data
As of or For the Years Ended June 30, 2012 and 2013
And As of or For the Six Months Ended December 31, 2013
| As of or For the Six Months Ended December 31, 2013 |
As of or For the Year | |||||||||||
| 2013 | 2012 | |||||||||||
Performance Ratios: | ||||||||||||
Return on average assets (ROA) | 0.07 | % | 0.08 | % | 0.60 | % | ||||||
Return on average equity (ROE) | 1.05 | % | 1.07 | % | 8.42 | % | ||||||
Interest rate spread(1) | 2.75 | % | 2.68 | % | 2.98 | % | ||||||
Net interest margin(2) | 2.83 | % | 2.74 | % | 3.06 | % | ||||||
Non-interest expense to average assets | 4.11 | % | 4.18 | % | 4.03 | % | ||||||
Efficiency ratio | 98.2 | % | 97.0 | % | 86.2 | % | ||||||
Average interest-earning assets to average interest-bearing liabilities | 112.7 | % | 109.0 | % | 109.2 | % | ||||||
Loans to deposits | 53.9 | % | 62.8 | % | 64.3 | % | ||||||
Asset Quality Ratios: | ||||||||||||
Non-performing assets to total assets(3) | 1.6 | % | 2.4 | % | 2.6 | % | ||||||
Non-performing loans to total loans | 2.7 | % | 1.7 | % | 2.5 | % | ||||||
Allowance for loan losses to non-performing loans | 24.1 | % | 40.2 | % | 21.7 | % | ||||||
Allowance for loan losses to total loans | 0.6 | % | 0.7 | % | 0.6 | % | ||||||
Net charge-offs as a percentage of average loans outstanding | 0.1 | % | 0.0 | % | 0.4 | % | ||||||
Capital Ratios: | ||||||||||||
Average equity to average assets | 6.6 | % | 7.4 | % | 7.1 | % | ||||||
Equity to total assets at end of period | 6.3 | % | 6.9 | % | 7.5 | % | ||||||
Total capital to risk-weighted assets | 12.8 | % | 12.9 | % | 13.9 | % | ||||||
Tier 1 capital to risk-weighted assets | 12.3 | % | 12.3 | % | 13.3 | % | ||||||
Tier 1 capital to average assets | 6.9 | % | 7.2 | % | 7.5 | % | ||||||
Other Data: | ||||||||||||
Number of full-service offices | 4 | 5 | 5 | |||||||||
Number of employees | 63 | 62 | 71 | |||||||||
| (1) | Represents the difference between the weighted-average yield on interest-earning assets and the weighted-average cost of interest-bearing liabilities for the period. |
| (2) | The net interest margin represents net interest income as a percent of average interest-earning assets for the period. |
| (3) | Non-performing assets consist of non-performing loans and real estate owned. |
Source: HV Bancorp, preliminary prospectus.
22
FELDMAN FINANCIAL ADVISORS, INC.
Non-interest income amounted to $1.2 million for the six months ended December 31, 2013, which was a decrease of $291,000 or 19.5% from $1.5 million for the six months ended December 31, 2012. Customer service charges and fees decreased by $11,000 or 5.9% from $119,000 for the six months ended December 31, 2012 to $108,000 for six months ended December 31, 2013. Gains on sale of loans increased by $72,000 or 7.7% from $930,000 for the six months ended December 31, 2012 to $1.0 million for the six months ended December 31, 2013. Gains on sale of investment securities decreased from $334,000 for the six months ended December 31, 2012 to a loss of $2,000 for the six months ended December 31, 2013, as sales of investment securities were $347,000 for the six months ended December 31, 2013 compared to sales of $15.3 million for the six months ended December 31, 2012. The annualized ratio of non-interest income to average assets decreased to 1.52% for the six months ended December 31, 2013 from 1.91% for the six months ended December 31, 2012.
Non-interest expense increased by $33,000 or 1.0% to $3.3 million for the six months ended December 31, 2013 from $3.2 million for the six months ended December 31, 2012. Salaries and employment expenses decreased by $48,000, or 3.1%, to $1.5 million for the six months ended December 31, 2013, from $1.6 million for the six months ended December 31, 2012, primarily the result of decreased bonuses and loan officer commission expense related to reduced sales volume in the mortgage operation. Occupancy expense decreased by $47,000, or 9.0% from $522,000 for the six months ended December 31, 2012 to $475,000 for the six months ended December 31, 2013. Real estate owned expense increased by $21,000 from $167,000 in the six months ended December 31, 2012 to $186,000 for the six months ended December 31, 2013, as a result of the preparation of a property for settlement. Professional fees increased $113,000 or 65.3% from $173,000 for the six months ended December 31, 2012, to
23
FELDMAN FINANCIAL ADVISORS, INC.
$286,000 for the six months ended December 31, 2013, largely due to $120,000 in expenses associated with the merger transaction. The annualized ratio of non-interest expense to average assets was relatively unchanged at 4.11% for the six months ended December 31, 2013 as compared to 4.12% for the six months ended December 31, 2012.
Table 5
Income Statement Ratios
For the Years Ended June 30, 2012 and 2013
And the Six Months Ended December 31, 2012 and 2013
(Percent of Average Assets)
| Six Months Ended December 31, | Year Ended June 30, | |||||||||||||||
| 2013(1) | 2012(1) | 2013 | 2012 | |||||||||||||
Total interest income | 3.21 | 3.29 | 3.21 | 3.66 | ||||||||||||
Total Interest expense | 0.55 | 0.67 | 0.63 | 0.80 | ||||||||||||
|
|
|
|
|
|
|
| |||||||||
Net interest income | 2.66 | 2.62 | 2.58 | 2.86 | ||||||||||||
Provision (credit) for loan losses | (0.04 | ) | 0.10 | 0.08 | 0.12 | |||||||||||
|
|
|
|
|
|
|
| |||||||||
Net interest income after provision | 2.70 | 2.52 | 2.50 | 2.74 | ||||||||||||
Non-interest income | 1.52 | 1.91 | 1.73 | 1.82 | ||||||||||||
Non-interest expense | 4.11 | 4.12 | 4.18 | 4.03 | ||||||||||||
|
|
|
|
|
|
|
| |||||||||
Income before income taxes | 0.11 | 0.31 | 0.05 | 0.53 | ||||||||||||
Income tax expense (benefit) | 0.04 | 0.09 | (0.03 | ) | (0.07 | ) | ||||||||||
|
|
|
|
|
|
|
| |||||||||
Net income | 0.07 | 0.22 | 0.08 | 0.60 | ||||||||||||
|
|
|
|
|
|
|
| |||||||||
| (1) | Ratios for the six months ended December 31, 2012 and 2013 are annualized. |
Source: HV Bancorp, preliminary prospectus; Feldman Financial calculations.
Fiscal Years Ended June 30, 2012 and 2013
Net income decreased by $789,000, or 86.5%, to $123,000 for the fiscal year ended June 30, 2013, from $912,000 for the fiscal year ended June 30, 2012. Net interest income decreased $322,000, or 7.4%, to $4.0 million for the year ended June 30, 2013 from $4.3 million for the year ended June 30, 2012. The provision for loan losses decreased by $58,000, or 32.6%, to $120,000 for the year ended June 30, 2013, from $178,000 for the year ended June 30, 2012.
24
FELDMAN FINANCIAL ADVISORS, INC.
Non-interest income decreased by $49,000 or 1.8%, while non-interest expense increased by $408,000 or 6.7% from fiscal 2012 to 2013. The resulting income tax benefit decreased by $68,000 from $110,000 in fiscal 2012 to $42,000 in fiscal 2013.
Table 6
Yield and Cost Summary
For the Years Ended June 30, 2012 and 2013
And the Six Months Ended December 31, 2012 and 2013
| Six Months Ended December 31, | Year Ended June 30, | |||||||||||||||
| 2013(1) | 2012(1) | 2013 | 2012 | |||||||||||||
Weighted Average Yields | ||||||||||||||||
Loans | 4.83 | % | 5.08 | % | 4.96 | % | 5.29 | % | ||||||||
Cash and cash equivalents | 0.29 | 0.33 | 0.34 | 0.21 | ||||||||||||
Investment securities | 2.14 | 1.95 | 1.88 | 2.78 | ||||||||||||
FHLB stock | 1.18 | 0.29 | 0.30 | 0.08 | ||||||||||||
Total interest-earning assets | 3.41 | 3.50 | 3.42 | 3.92 | ||||||||||||
Weighted Average Costs | ||||||||||||||||
NOW accounts | 0.20 | 0.25 | 0.19 | 0.27 | ||||||||||||
Money market deposit accounts | 0.24 | 0.28 | 0.24 | 0.43 | ||||||||||||
Savings accounts | 0.24 | 0.25 | 0.22 | 0.30 | ||||||||||||
Certificates of deposit | 1.36 | 1.63 | 1.58 | 1.81 | ||||||||||||
Repurchase agreements | 0.10 | 0.09 | 0.10 | 0.12 | ||||||||||||
FHLB advances | 0.90 | 1.53 | 1.33 | 1.90 | ||||||||||||
Total interest-bearing liabilities(2) | 0.66 | 0.81 | 0.73 | 0.93 | ||||||||||||
Net interest spread(3) | 2.75 | 2.69 | 2.68 | 2.98 | ||||||||||||
Net interest margin(4) | 2.83 | 2.79 | 2.74 | 3.06 | ||||||||||||
| (1) | Ratios for the six-month periods have been annualized. |
| (2) | Excludes non-interest bearing deposits. |
| (3) | Represents the difference between the weighted average yield on average interest-earning assets and the weighted average cost of average interest-bearing liabilities. |
| (4) | Represents net interest income as a percentage of average interest-earning assets. |
Source: HV Bancorp, preliminary prospectus.
25
FELDMAN FINANCIAL ADVISORS, INC.
Net interest income decreased by $322,000, or 7.4%, to $4.0 million for fiscal 2013 from $4.3 million for fiscal 2012. The decrease primarily resulted from the decline in the net interest margin, which decreased 32 basis points from 3.06% for fiscal 2012 to 2.74% for fiscal 2013. Loan interest income decreased from $4.4 million for the year ended June 30, 2012 to $3.9 million for the year ended June 30, 2013, a decrease of $451,000. This was primarily the result of the yield on loans decreasing 33 basis points from 5.29% for fiscal 2012 to 4.96% for fiscal 2013. The average loan balances also decreased from $83.0 million for fiscal 2012 to $79.6 million for fiscal 2013. Investment and liquidity interest income decreased from $1.1 million for fiscal 2012 to $1.0 million for fiscal 2013. The decrease in investment and liquidity interest income was mainly the result of a decrease in the yield on investment securities decreasing from 2.78% to 1.88% over the corresponding periods. This decreased yield resulted primarily from the sale of $32.4 million of available-for-sale securities, which generated a $592,000 gain on sale of investments for the year ended June 30, 2013. Interest expense paid on deposits for the year ended June 30, 2013 was $938,000 compared to $1.1 million during the same period in 2012. The decrease in interest expense was primarily driven by the general reduction in rates across the deposit products of HV Bank, reflecting competitive market conditions and the overall interest rate environment.
For the year ended June 30, 2013, the average yield on interest-earning assets was 3.42%, compared to 3.92% for the year ended June 30, 2012. The average cost of interest-bearing liabilities was 0.73% for the year ended June 30, 2013, compared to 0.93% for the year ended June 30, 2012. As a result, the net interest rate spread was 2.68% for fiscal 2013, compared to 2.98% for fiscal 2012. The net interest margin declined from 3.06% in fiscal 2012 to 2.74% for fiscal 2013.
26
FELDMAN FINANCIAL ADVISORS, INC.
The provision for loan losses decreased $58,000, or 32.6%, to $120,000 for fiscal 2013 from $178,000 for fiscal 2012. The primary factor that contributed to the decrease in the provision was a decrease in non-accrual loans, which declined from $2.2 million as of June 30, 2012 to $1.4 million as of June 30, 2013. HV Bank recorded net charge-offs of $332,000 and $13,000 for the years ended June 30, 2012 and June 30, 2013, respectively.
Non-interest income amounted to $2.70 million for fiscal 2013, which was a decrease of $49,000, or 1.8% from $2.75 million for the year ended June 30, 2012. Gains on sale of loans decreased $88,000 from $1.8 million for fiscal 2012 to $1.7 million for fiscal 2013. This decrease was due to the lower volumes of loan originations and sales related to loans designated as held for sale. Gains on sale of investment securities increased $64,000 from $528,000 in fiscal 2012 to $592,000 in fiscal 2013. The ratio of non-interest income to average assets declined moderately from 1.82% for fiscal 2012 to 1.73% in fiscal 2013.
Non-interest expense increased by $408,000, or 6.7% to $6.5 million for the year ended June 30, 2013, from $6.1 million for the year ended June 30, 2012. The ratio of non-interest expense to average assets increased from 4.03% to 4.18%. Salaries and employee benefits increased by $456,000, or 16.6%, to $3.2 million for fiscal 2013 from $2.8 million for fiscal 2012. The increase in salaries and employment expenses was primarily the result of increased commissions for loan officers. Occupancy expenses decreased by $108,000, or 9.5% from $1.1 million for fiscal 2012 to $1.0 million for fiscal 2013. Data processing expenses increased by $60,000, or 10.5%, from $573,000 for fiscal 2012 to $633,000 for fiscal 2013. This increase was due to enhancements to HV Bank’s technology systems. Real estate owned expense decreased $285,000, or 43.3%, from $658,000 for fiscal 2012 to $373,000 in fiscal 2013 as a result of the resolution of a number of properties acquired through foreclosures. Professional fees increased
27
FELDMAN FINANCIAL ADVISORS, INC.
$112,000, or 38.4%, from $292,000 in fiscal 2012 to $404,000 for fiscal 2013 due to increased compliance costs and fees as well as professional fees incurred in the resolution of foreclosures. Other operating expenses increased by $168,000, or 31.8%, from $528,000 for the year ended June 30, 2012, to $696,000 for the year ended June 30, 2013. The escalation in other operating expenses was primarily the result of increased marketing expenses and advertising costs.
The total income tax benefit decreased $68,000, or 61.8%, to $(42,000) for the year ended June 30, 2013, from $(110,000) for the year ended June 30, 2012. This decrease was primarily due to the change in valuation allowance on the deferred tax asset of $335,000. HV Bank’s ROA declined from 0.60% for the year ended June 30, 2012 to 0.08% for the year ended June 30, 2013. HV Bank’s return on average equity (“ROE”) declined from 8.42% for the year ended June 30, 2012 to 1.07% for the year ended June 30, 2013.
28
FELDMAN FINANCIAL ADVISORS, INC.
Interest Rate Risk Management
Because the net present value of the majority of its assets and liabilities are sensitive to changes in interest rates, HV Bank’s most significant form of market risk is interest rate risk. HV Bank is vulnerable to an increase in interest rates to the extent that its interest-bearing liabilities mature or reprice more quickly than its interest-earning assets. As a result, a principal part of HV Bank’s business strategy is to manage interest rate risk and limit the exposure of its net interest income to changes in market interest rates. The Board of Trustees is responsible for evaluating the interest rate risk inherent in HV Bank’s assets and liabilities, for determining the level of risk that is appropriate, given HV Bank’s business strategy, operating environment, capital, liquidity and performance objectives, and for managing this risk consistent with the guidelines approved by the Board of Trustees.
HV Bank has emphasized the origination of fixed-rate mortgage loans in its portfolio in order to maximize its net interest income and control credit risk. Because of its investment in such loans, HV Bank has accepted increased exposure to interest rate fluctuations. In a period of rising interest rates, HV Bank’s net interest rate spread and net interest income may be negatively affected. HV Bank seeks to manage and mitigate its exposure to interest rate risk in the following ways:
| • | maintaining adequate levels of short-term liquid assets (totaling $22.9 million in cash and cash equivalents at December 31, 2013); |
| • | lengthening the weighted average maturity of liabilities through retail deposit pricing strategies and the use of FHLB advances; |
| • | investing in shorter- to medium-term securities and in securities with adjustable-rate features, thereby providing for increased interest rates prior to maturity according to a predetermined schedule; and |
| • | maintaining adequate levels of capital. |
29
FELDMAN FINANCIAL ADVISORS, INC.
In the future, HV Bank intends to take additional steps to reduce interest rate risk, including investing cash flows from investment securities in higher yielding assets such as commercial loans and lines of credit, which will afford the ability to option to reprice the asset in the shorter term.
HV Bank’s goal is to manage asset and liability positions to moderate the effects of interest rate fluctuations on net interest income and the net present value of equity (“NPV”). Table 7 presents, as of December 31, 2013, the estimated changes in HV Bank’s net portfolio value that would result from the designated instantaneous changes in the U.S. Treasury yield curve. Computations of prospective effects of hypothetical interest rate changes are based on numerous assumptions, including relative levels of market interest rates, loan prepayments and deposit decay.
As shown in Table 7, HV Bank’s net present value of equity would be negatively impacted by an immediate increase in interest rates from current levels. Table 7 indicates that HV Bank’s NPV was $15.1 million as of December 31, 2013 (compared to HV Bank’s stated total equity of $10.5 million as of December 31, 2013). Based upon the assumptions utilized, an immediate 100 basis point increase in market interest rates would result in a $3.4 million decrease or 22.3% reduction in NPV. However, an immediate 100 basis point decrease would have a positive impact of $2.2 million on NPV, representing an increase of 14.9%.
30
FELDMAN FINANCIAL ADVISORS, INC.
Table 7
Net Portfolio Value Analysis
As of December 31, 2013
(Dollars in Thousands)
| Net Present Value of Equity(2) | NPV as a % of Present Value of Assets(3) | |||||||||||||||||||
Change in Interest Rates(1) (basis points) | Estimated Net Present Value of Equity | Change from Base (000s) | Change from Base (%) | NPV Ratio (%) | Change in NPV (basis points) | |||||||||||||||
+ 300 | $ | 6,670 | $ | (8,407 | ) | (55.8 | )% | 4.3 | % | -470 | ||||||||||
+ 200 | 8,910 | (6,167 | ) | (40.9 | )% | 5.6 | % | -340 | ||||||||||||
+ 100 | 11,711 | (3,366 | ) | (22.3 | )% | 7.2 | % | -180 | ||||||||||||
0 | 15,077 | — | — | 9.0 | % | — | ||||||||||||||
- 100 | 17,323 | 2,246 | 14.9 | % | 10.2 | % | 120 | |||||||||||||
| (1) | Assumes an instantaneous uniform change in interest rates at all maturities. |
| (2) | NPV is the discounted present value of expected cash flows from assets, liabilities, and off-balance sheet contracts. |
| (3) | Present value of assets represents the discounted present value of incoming cash flows on interest-earning assets. |
Source: HV Bancorp, preliminary prospectus.
31
FELDMAN FINANCIAL ADVISORS, INC.
Asset Quality
Table 8 summarizes HV Bank’s total non-performing assets (“NPAs”) as of June 30, 2012 and 2013 and December 31, 2013. Historically, HV Bank has exhibited a sound record of asset quality until experiencing an upturn in NPAs during calendar 2009 and 2010 due to the national and regional decline in real estate market conditions. Total NPAs increased from zero at June 30, 2008 to $5.9 million at June 30, 2009, reflecting a ratio of 4.14% of total assets. Since that time period, improvements in real estate market conditions and more stringent underwriting and collection efforts at HV Bank have resulted in decreases in the level of non-performing assets. As of December 31, 2013, HV Bank’s non-performing assets totaled $2.6 million and comprised $2.0 million of non-performing loans (“NPLs”) and $566,000 of real estate owned (“REO”). The ratio of non-performing assets to total assets was 1.58% at December 31, 2013, as compared to 2.38% at June 30, 2013 and 2.74% at June 30, 2012.
In order to reflect the risk inherent in the loan portfolio, HV Bank maintains an allowance for loan losses. A summary of HV Bank’s recent provision and net charge-off activity is included in the allowance for loan loss summary presented in Table 9. As of December 31, 2013, HV Bank’s allowance for loans losses amounted to $485,000, measuring 0.64% of loans receivable (excluding loans held for sale) and 24.1% of NPLs. The provision for loan losses decreased from $178,000 in fiscal 2012 to $120,000 for fiscal 2013. For the six months ended December 31, 2013, HV Bank recorded a $31,000 credit for loan losses instead of a provision. The largest concentration of the loan loss allowance at December 31, 2013 represented reserves established against the commercial real estate and residential mortgage loan portfolios.
32
FELDMAN FINANCIAL ADVISORS, INC.
Table 8
Non-performing Assets Summary
As of June 30, 2012 and 2013 and December 31, 2013
(Dollars in Thousands)
| Dec. 31, | June 30, | |||||||||||
| 2013 | 2013 | 2012 | ||||||||||
Non-accrual loans(1) | ||||||||||||
Consumer: | ||||||||||||
Residential mortgage | $ | 957 | $ | 564 | $ | 622 | ||||||
Home equity and HELOCs | 379 | 198 | 222 | |||||||||
Other consumer | — | — | — | |||||||||
Commercial: | ||||||||||||
Commercial real estate | 679 | 683 | 1,343 | |||||||||
Commercial business | — | — | — | |||||||||
Construction - residential | — | — | — | |||||||||
|
|
|
|
|
| |||||||
Total non-performing loans | 2,015 | 1,445 | 2,187 | |||||||||
Real estate owned | 566 | 2,199 | 1,824 | |||||||||
|
|
|
|
|
| |||||||
Total non-performing assets | $ | 2,581 | $ | 3,644 | $ | 4,011 | ||||||
|
|
|
|
|
| |||||||
Ratios: | ||||||||||||
Non-performing loans to total loans | 2.7 | % | 1.9 | % | 3.5 | % | ||||||
Non-performing assets to total assets | 1.6 | % | 2.4 | % | �� | 2.7 | % | |||||
| (1) | There were no troubled debt restructurings in non-accrual loans for the above periods. |
Source: HV Bancorp, preliminary prospectus.
33
FELDMAN FINANCIAL ADVISORS, INC.
Table 9
Allowance for Loan Loss Summary
For the Years Ended June 30, 2012 and 2013
And the Six Months Ended December 31, 2012 and 2013
(Dollars in Thousands)
| Six Months Ended December 31, | Year Ended June 30, | |||||||||||||||
| 2013 | 2012 | 2013 | 2012 | |||||||||||||
Allowance for loan losses at beginning of period | $ | 581 | $ | 474 | $ | 474 | $ | 628 | ||||||||
Provision (credit) for loan losses | (31 | ) | 80 | 120 | 178 | |||||||||||
Charge-offs | ||||||||||||||||
Residential mortgage | 62 | — | — | 12 | ||||||||||||
Home equity and HELOCs | — | — | 1 | — | ||||||||||||
Other consumer | 3 | 1 | — | 3 | ||||||||||||
Commercial real estate | — | 12 | 12 | 362 | ||||||||||||
Commercial business | — | — | — | — | ||||||||||||
Construction - residential | — | — | — | — | ||||||||||||
Unallocated reserve | — | — | — | — | ||||||||||||
|
|
|
|
|
|
|
| |||||||||
Total charge-offs | 65 | 13 | 13 | 377 | ||||||||||||
Total recoveries | — | — | — | 45 | ||||||||||||
|
|
|
|
|
|
|
| |||||||||
Net charge-offs | 65 | 13 | 13 | 332 | ||||||||||||
|
|
|
|
|
|
|
| |||||||||
Allowance for loan losses at end of period | $ | 485 | $ | 541 | $ | 581 | $ | 474 | ||||||||
|
|
|
|
|
|
|
| |||||||||
Allowance for loan losses to non-performing loans(1) | 24.1 | % | 21.8 | % | 40.2 | % | 19.4 | % | ||||||||
Allowance for loan losses to loans receivable(1) | 0.6 | % | 0.7 | % | 0.8 | % | 0.7 | % | ||||||||
Net charge-offs to average loans receivable | 0.1 | % | 0.0 | % | 0.0 | % | 0.4 | % | ||||||||
| (1) | Data measured at end of period. |
Source: HV Bancorp, preliminary prospectus.
34
FELDMAN FINANCIAL ADVISORS, INC.
Office Properties
HV Bank conducts its executive administrative operations from the headquarters office located at 3501 Masons Mill Road, Suite 401, Huntingdon Valley, Pennsylvania. HV Bank operates four full-service branch offices, one limited service office, and an administrative office located in Montgomery, Bucks and Philadelphia counties. HV Bank closed a branch office located at 2190 York Road, Jamison, Pennsylvania on November 29, 2013. HV Bank also has a loan production office in Warminster, Pennsylvania. The net book value of the premises, land and equipment of HV Bank was $1.8 million at December 31, 2013. A map of HV Bank’s office network is presented below along with the location of Victory Bank’s single office.
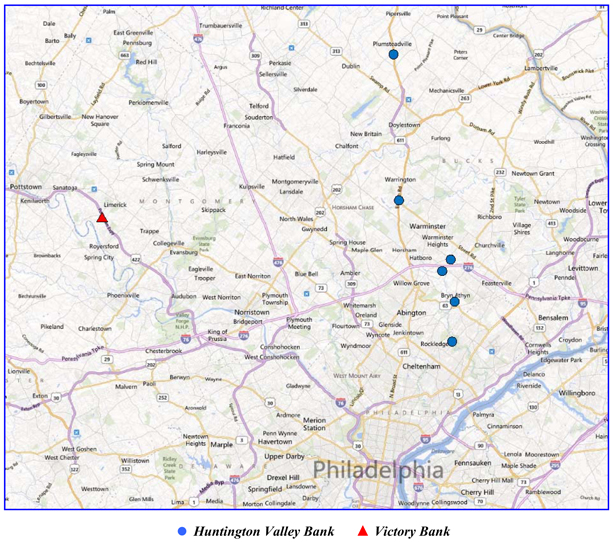
35
FELDMAN FINANCIAL ADVISORS, INC.
Table 10 provides deposit data for HV Bank’s branch offices from June 30, 2008 to June 30, 2013. HV Bank’s total deposits increased by a compound annual growth rate (“CAGR”) of 2.6% over this five-year period with the bulk of the deposit increase occurring at the Bucks County branch offices in Warrington and Plumsteadville. As of June 30, 2013, HV Bank’s branch with the largest deposit amount was the Huntingdon Valley office located at 2617 Huntingdon Pike with total deposits of $56.9 million, followed by the Huntingdon Valley office located at 1990 County Line Road with total deposits of $27.0 million. As noted previously, the Jamison branch office was closed in November 2013.
Table 10
Branch Office Deposit Data
(Dollars in Thousands)
| June 30, | ‘08-13 | ‘12-13 | ||||||||||||||||||||
Address | City | 2008 ($000s) | 2012 ($000s) | 2013 ($000s) | CAGR (%) | CAGR (%) | ||||||||||||||||
Montgomery County | ||||||||||||||||||||||
2617 Huntingdon Pike | Huntingdon Valley | $ | 57,564 | $ | 58,360 | $ | 56,948 | -0.2 | % | 2.5 | % | |||||||||||
1990 County Line Road | Huntingdon Valley | 23,512 | 27,812 | 27,007 | 2.8 | % | 3.0 | % | ||||||||||||||
Bucks County | ||||||||||||||||||||||
Rt. 611 & Street Road | Warrington | 16,479 | 23,613 | 24,202 | 8.0 | % | -2.4 | % | ||||||||||||||
5725 Easton Road | Plumsteadville | 7,037 | 15,456 | 16,715 | 18.9 | % | -7.5 | % | ||||||||||||||
2190 York Road(1) | Jamison | 13,467 | 9,632 | 9,049 | -7.6 | % | 6.4 | % | ||||||||||||||
Philadelphia County | ||||||||||||||||||||||
8580 Verree Road | Philadelphia | 2,253 | 2,712 | 3,138 | 6.9 | % | -13.6 | % | ||||||||||||||
|
|
|
|
|
| |||||||||||||||||
Total Deposits | $ | 120,312 | $ | 137,585 | $ | 137,059 | 2.6 | % | 0.4 | % | ||||||||||||
|
|
|
|
|
| |||||||||||||||||
| (1) | Branch office was closed on November 29, 2013. |
Source: SNL Financial.
36
FELDMAN FINANCIAL ADVISORS, INC.
Market Area
Overview of Market Area
HV Bank is headquartered in Huntingdon Valley, Pennsylvania, which is located in the northwest suburban area of metropolitan Philadelphia. HV Bank primarily serves communities located in Montgomery, Bucks and Philadelphia counties in Pennsylvania from its four full-service retail banking offices, two limited service branch offices, one loan production office, and one administrative office. The total population of the three counties served by HV Bank was approximately 3.0 million in 2012. Victory Bank operates an office in Montgomery County as well as a loan processing office in Wyomissing (Berks County), Pennsylvania. The merger will add a single branch office location in western Montgomery County to HV Bank’s branch network and provide access to additional population centers for HV Bank.
The Philadelphia metropolitan area’s economy is heavily based upon manufacturing, refining, health care, food and financial services. The city is home to many Fortune 500 companies, including cable television and internet provider Comcast; insurance companies CIGNA and Lincoln Financial Group; energy company Sunoco; food services company Aramark; paper and packaging company Crown Holdings Incorporated; diversified producer Rohm and Haas Company; the pharmaceutical company Glaxo SmithKline; the helicopter division of Boeing Co.; and automotive parts retailer Pep Boys. The city is also home to many hospitals, universities and colleges.
Table 11 presents comparative demographic data for the United States, the state of Pennsylvania, the Philadelphia Metropolitan Statistical Area (“MSA”), Montgomery County, and Bucks County. The Philadelphia MSA is composed of the Philadelphia, PA metropolitan division, the Camden, NJ metropolitan division, and the Wilmington, DE-MD-NJ metropolitan
37
FELDMAN FINANCIAL ADVISORS, INC.
division. The Philadelphia metropolitan division includes the Pennsylvania counties of Bucks, Chester, Delaware, Montgomery, and Philadelphia. The Camden metropolitan division includes the New Jersey counties of Burlington, Camden, and Gloucester. The Wilmington metropolitan division includes New Castle County-DE, Cecil County-MD, and Salem County-NJ.
Montgomery County is a suburban county northwest of the city of Philadelphia. Its estimated 2012 population of approximately 807,000 made it the third most populous county in Pennsylvania after Philadelphia and Allegheny counties. Montgomery County’s median household income of $74,136 in 2012 ranked it second after Chester County among all Pennsylvania counties. Over the five years from 2012 to 2017, Montgomery County’s population is expected to expand by 2.3%, ahead of the Pennsylvania and Philadelphia MSA projected growth rates of 1.5% and 1.8%, respectively. Montgomery County’s economic base is very diverse and its top private sector employers include Main Line Health Systems, Abington Health, Lockheed Martin, SmithKline Beecham, Schering Corporation, and Giant Food Stores.
Bucks County had an estimated 2012 population of approximately 629,000 and ranked fourth among all counties in Pennsylvania. Bucks County’s median household income of $73,557 in 2012 ranked it third in the state. Over the past two decades, the economy of Bucks County has continued to shift away from manufacturing and agriculture to health care, professional services, and retail trade. The unemployment rates in Montgomery and Bucks counties generally follow the national and statewide trends, but are consistently lower. The unemployment rates in December 2013 for Montgomery and Bucks counties were 5.1% and 5.6%, respectively, below the national and state rates of 6.7% and 6.2%, respectively.
38
FELDMAN FINANCIAL ADVISORS, INC.
Table 11
Selected Demographic Data
| United States | Pennsylvania | Philadelphia MSA | Montgomery County | Bucks County | ||||||||||||||||
Total Population | ||||||||||||||||||||
2012 - Current | 313,129,017 | 12,807,296 | 6,011,545 | 806,827 | 629,397 | |||||||||||||||
2017 - Projected | 323,986,227 | 12,997,575 | 6,120,409 | 825,595 | 633,763 | |||||||||||||||
% Change 2010-12 | 1.42 | % | 0.83 | % | 0.77 | % | 0.87 | % | 0.66 | % | ||||||||||
% Change 2012-17 | 3.47 | % | 1.49 | % | 1.81 | % | 2.33 | % | 0.69 | % | ||||||||||
Age Distribution, 2012 | ||||||||||||||||||||
0 - 14 Age Group | 19.65 | % | 17.70 | % | 18.87 | % | 18.59 | % | 18.38 | % | ||||||||||
15 - 34 Age Group | 27.42 | % | 25.87 | % | 27.24 | % | 23.94 | % | 22.49 | % | ||||||||||
35 - 54 Age Group | 27.07 | % | 27.16 | % | 27.71 | % | 28.80 | % | 29.98 | % | ||||||||||
55 - 69 Age Group | 16.64 | % | 17.97 | % | 16.58 | % | 17.51 | % | 18.69 | % | ||||||||||
70 + Age Group | 9.22 | % | 11.31 | % | 9.61 | % | 11.16 | % | 10.46 | % | ||||||||||
Median Age (years) | 37.3 | 40.5 | 38.2 | 40.9 | 42.3 | |||||||||||||||
Total Households | ||||||||||||||||||||
2012 - Current | 118,208,713 | 5,046,383 | 2,275,804 | 310,707 | 235,430 | |||||||||||||||
2017 - Projected | 122,665,498 | 5,142,006 | 2,323,211 | 318,366 | 239,153 | |||||||||||||||
% Change 2012-17 | 3.77 | % | 1.89 | % | 2.08 | % | 2.47 | % | 1.58 | % | ||||||||||
Household Income, 2012 | ||||||||||||||||||||
< $25,000 | 24.67 | % | 25.09 | % | 21.85 | % | 14.31 | % | 13.21 | % | ||||||||||
$25,000 - $49,999 | 25.15 | % | 25.51 | % | 21.57 | % | 18.75 | % | 18.60 | % | ||||||||||
$50,000 - $99,000 | 29.93 | % | 30.89 | % | 30.11 | % | 31.67 | % | 33.28 | % | ||||||||||
$100,000 - $199,999 | 16.28 | % | 15.02 | % | 20.92 | % | 26.01 | % | 27.11 | % | ||||||||||
$200,000+ | 3.97 | % | 3.49 | % | 5.55 | % | 9.26 | % | 7.81 | % | ||||||||||
Median Household Income | ||||||||||||||||||||
2012 - Current | $ | 50,157 | $ | 49,167 | $ | 57,132 | $ | 74,136 | $ | 73,557 | ||||||||||
2017 - Projected | $ | 56,895 | $ | 57,204 | $ | 69,239 | $ | 84,663 | $ | 84,159 | ||||||||||
% Change 2012-17 | 13.43 | % | 16.35 | % | 21.19 | % | 14.20 | % | 14.41 | % | ||||||||||
Average Household Income | ||||||||||||||||||||
2012 - Current | $ | 68,162 | $ | 65,815 | $ | 78,256 | $ | 95,929 | $ | 94,029 | ||||||||||
2017 - Projected | $ | 77,137 | $ | 75,896 | $ | 90,465 | $ | 112,071 | $ | 109,013 | ||||||||||
% Change 2012-17 | 13.17 | % | 15.32 | % | 15.60 | % | 16.83 | % | 15.94 | % | ||||||||||
Per Capita Income | ||||||||||||||||||||
2012 - Current | $ | 26,409 | $ | 26,715 | $ | 30,381 | $ | 37,574 | $ | 35,502 | ||||||||||
2017 - Projected | $ | 29,882 | $ | 30,823 | $ | 35,107 | $ | 43,856 | $ | 41,477 | ||||||||||
% Change 2012-17 | 13.15 | % | 15.38 | % | 15.56 | % | 16.72 | % | 16.83 | % | ||||||||||
39
FELDMAN FINANCIAL ADVISORS, INC.
Table 11 (continued)
| United States | Pennsylvania | Philadelphia MSA | Montgomery County | Bucks County | ||||||||||||||||
Total Housing Units | ||||||||||||||||||||
2012 - Current | 133,455,832 | 5,601,278 | 2,450,602 | 328,299 | 246,675 | |||||||||||||||
2017 - Projected | 138,191,185 | 5,691,179 | 2,495,845 | 335,563 | 250,084 | |||||||||||||||
2017 - Projected | 3.55 | % | 1.61 | % | 1.85 | % | 2.21 | % | 1.38 | % | ||||||||||
Housing Units, 2012 | ||||||||||||||||||||
Owner Occupied | 75,420,523 | 3,410,873 | 1,514,704 | 221,434 | 177,613 | |||||||||||||||
Renter Occupied | 42,788,190 | 1,635,510 | 761,100 | 89,273 | 57,817 | |||||||||||||||
Vacant | 15,247,119 | 554,895 | 174,798 | 17,592 | 11,245 | |||||||||||||||
Owner Occupied | 56.51 | % | 60.89 | % | 61.81 | % | 67.45 | % | 72.00 | % | ||||||||||
Renter Occupied | 32.06 | % | 29.20 | % | 31.06 | % | 27.19 | % | 23.44 | % | ||||||||||
Vacant | 11.42 | % | 9.91 | % | 7.13 | % | 5.36 | % | 4.56 | % | ||||||||||
Unemployment Rates | ||||||||||||||||||||
December 2012 | 7.8 | % | 7.9 | % | 8.3 | % | 6.7 | % | 7.2 | % | ||||||||||
December 2013 | 6.7 | % | 6.2 | % | 6.4 | % | 5.1 | % | 5.6 | % | ||||||||||
% Change | -14.1 | % | -21.5 | % | -22.9 | % | -23.9 | % | -22.2 | % | ||||||||||
Source: SNL Financial and ESRI.
Market Share Analysis
Table 12 displays branch deposit data for the top 25 financial institutions in the Philadelphia MSA as of June 30, 2013. HV Bank ranked 75th in the Philadelphia MSA out of 117 financial institutions and had total deposits of $137.1 million with a market share of 0.04%. Previously, as of June 30, 2012, HV Bank ranked 78th in the Philadelphia MSA with total deposits of $137.6 million and a market share of 0.05%. HV Bank’s deposits decreased by 0.4% between June 30, 2012 and 2013, while the total deposits in the Philadelphia MSA increased by 6.2% from $301.7 billion to $327.4 billion over the same period. The top five financial institutions (Capital One Bank, TD Bank, Wells Fargo Bank, HSBC Bank, and PNC Bank) held
40
FELDMAN FINANCIAL ADVISORS, INC.
$236.1 billion or 73.0% of the deposit market in the Philadelphia MSA. The merger of HV Bank and Victory Bancorp would have increased the combined company’s market ranking to 54th in the Philadelphia MSA and a market share of 0.08% as of June 30, 2013.
Table 13 displays branch deposit data as of June 30, 2013 for the financial institutions operating in Montgomery County, Pennsylvania. With deposits of $84.0 million in Montgomery County branch locations as of June 30, 2013 and a market share of 0.35%, HV Bank ranked 27th in the Montgomery County out of 42 financial institutions. The merger of HV Bank and Victory Bancorp would have increased the combined company’s market ranking to 20th in Montgomery County and a market share of 0.85%. The top five financial institutions (Wells Fargo Bank, TD Bank, Citizens Bank, PNC Bank, and First Niagara Bank) held $14.7 billion or 65.0% of the deposit total of $24.3 billion in Montgomery County.
Table 14 provides residential mortgage market share data for the top 25 lenders in the Philadelphia MSA as ranked by the dollar-amount of loans funded in calendar 2012. Wells Fargo Bank ranked as the leading residential lender in the MSA, funding $6.5 billion (15.6% market share) of the total $41.9 billion of residential loans funded in 2012. JPMorgan Chase, Trident Mortgage, Quicken Loans, and Bank of America were included among the top five residential lenders. HV Bank ranked 75th in the Philadelphia MSA with $125.2 million of residential loans funded and a market share of 0.3%. Previously, HV Bank ranked 51st in 2011 with a market share of 0.3% based on residential loans funded of $122.0 million. Victory Bank, which focuses mainly on commercial related lending, ranked 330th in the Philadelphia MSA in 2012 with residential loan originations totaling $5.6 million. The average loan size in the Philadelphia MSA amounted to approximately $208,000 in 2011 and $220,000 in 2012.
41
FELDMAN FINANCIAL ADVISORS, INC.
Table 12
Deposit Market Share in the Philadelphia MSA
Data as of June 30, 2013
Rank | Financial Institution | Type | Branch Count | Deposit Market Share (%) | Total Deposits ($000) | |||||||||||
| 1 | Capital One Financial Corp. (VA) | Bank | 1 | 27.30 | 87,477,784 | |||||||||||
| 2 | Toronto-Dominion Bank (TD Bank) | Bank | 153 | 25.59 | 81,981,505 | |||||||||||
| 3 | Wells Fargo & Co. (CA) | Bank | 207 | 8.64 | 27,678,901 | |||||||||||
| 4 | HSBC Holdings Plc (HSBC Bank) | Bank | 4 | 6.83 | 21,869,888 | |||||||||||
| 5 | PNC Financial Services Group (PA) | Bank | 182 | 5.34 | 17,111,142 | |||||||||||
| 6 | RBS Group Plc (Citizens Bank) | Bank | 188 | 5.31 | 17,011,995 | |||||||||||
| 7 | Bank of America Corp. (NC) | Bank | 98 | 2.44 | 7,813,792 | |||||||||||
| 8 | M&T Bank Corp. (NY) | Bank | 57 | 1.68 | 5,371,143 | |||||||||||
| 9 | Banco Santander (Santander Bank) | Bank | 72 | 1.28 | 4,101,637 | |||||||||||
| 10 | Citigroup Inc. (NY) | Bank | 12 | 1.25 | 3,994,462 | |||||||||||
| 11 | Beneficial Mutual Bancorp (PA) | Thrift | 60 | 1.18 | 3,777,354 | |||||||||||
| 12 | Susquehanna Bancshares, Inc. (PA) | Bank | 62 | 0.95 | 3,028,995 | |||||||||||
| 13 | WSFS Financial Corp. (DE) | Thrift | 31 | 0.86 | 2,746,737 | |||||||||||
| 14 | Fulton Financial Corp. (PA) | Bank | 57 | 0.72 | 2,321,349 | |||||||||||
| 15 | First Niagara Financial Group (NY) | Bank | 46 | 0.65 | 2,075,387 | |||||||||||
| 16 | National Penn Bancshares, Inc. (PA) | Bank | 45 | 0.60 | 1,924,198 | |||||||||||
| 17 | Univest Corp. of Pennsylvania (PA) | Bank | 39 | 0.59 | 1,896,033 | |||||||||||
| 18 | Firstrust Savings Bank (PA) | Thrift | 20 | 0.54 | 1,725,130 | |||||||||||
| 19 | Comenity Bank (DE) | Bank | 1 | 0.52 | 1,659,188 | |||||||||||
| 20 | Bryn Mawr Bank Corp. (PA) | Bank | 27 | 0.49 | 1,555,354 | |||||||||||
| 21 | Customers Bancorp, Inc (PA) | Bank | 8 | 0.33 | 1,051,882 | |||||||||||
| 22 | Hudson City Bancorp, Inc. (NJ) | Thrift | 5 | 0.28 | 882,695 | |||||||||||
| 23 | Republic First Bancorp, Inc. (PA) | Bank | 14 | 0.26 | 821,790 | |||||||||||
| 24 | FNB Bancorp, Inc. (PA) | Bank | 17 | 0.22 | 720,627 | |||||||||||
| 25 | FSB Bankshares Corporation (PA) | Thrift | 12 | 0.22 | 690,625 | |||||||||||
| 54 | HV Bank / Victory - Combined | Bank | 7 | 0.08 | 258,563 | |||||||||||
| 75 | Huntingdon Valley Bank (PA) | Thrift | 6 | 0.04 | 137,059 | |||||||||||
| 81 | Victory Bancorp, Inc. (PA) | Bank | 1 | 0.04 | 121,504 | |||||||||||
Total (117 financial institutions) | 1,831 | 100.00 | 320,375,327 | |||||||||||||
Source: SNL Financial.
42
FELDMAN FINANCIAL ADVISORS, INC.
Table 13
Deposit Market Share in Montgomery County, Pennsylvania
Data as of June 30, 2013
Rank | Financial Institution | Type | Branch Count | Deposit Market Share (%) | Total Deposits ($000) | |||||||||||
| 1 | Wells Fargo & Co. (CA) | Bank | 43 | 18.89 | 4,585,914 | |||||||||||
| 2 | Toronto-Dominion Bank (TD Bank) | Bank | 24 | 14.39 | 3,495,041 | |||||||||||
| 3 | RBS Group Plc (Citizens Bank) | Bank | 40 | 13.15 | 3,193,064 | |||||||||||
| 4 | PNC Financial Services Group (PA) | Bank | 25 | 8.38 | 2,035,370 | |||||||||||
| 5 | First Niagara Financial Group (NY) | Bank | 26 | 5.69 | 1,382,772 | |||||||||||
| 6 | Univest Corp. of Pennsylvania (PA) | Bank | 21 | 5.61 | 1,362,079 | |||||||||||
| 7 | Susquehanna Bancshares Inc. (PA) | Bank | 20 | 3.67 | 890,161 | |||||||||||
| 8 | Firstrust Savings Bank (PA) | Thrift | 7 | 3.34 | 811,223 | |||||||||||
| 9 | Bryn Mawr Bank Corp. (PA) | Bank | 6 | 3.08 | 746,998 | |||||||||||
| 10 | Banco Santander (Santander Bank) | Bank | 17 | 3.00 | 729,432 | |||||||||||
| 11 | Bank of America Corp. (NC) | Bank | 18 | 2.30 | 557,345 | |||||||||||
| 12 | Harleysville Savings Financial (PA) | Thrift | 8 | 2.21 | 537,503 | |||||||||||
| 13 | National Penn Bancshares, Inc. (PA) | Bank | 11 | 2.11 | 512,383 | |||||||||||
| 14 | Beneficial Mutual Bancorp (PA) | Thrift | 8 | 1.80 | 436,338 | |||||||||||
| 15 | Continental Bank Holdings, Inc (PA) | Bank | 11 | 1.69 | 409,745 | |||||||||||
| 16 | Fox Chase Bancorp, Inc. (PA) | Thrift | 2 | 1.14 | 276,452 | |||||||||||
| 17 | Ambler Savings Bank (PA) | Thrift | 7 | 1.13 | 275,131 | |||||||||||
| 18 | Royal Bancshares of PA (PA) | Bank | 5 | 1.05 | 255,563 | |||||||||||
| 19 | Hatboro Federal Savings FA (PA) | Thrift | 1 | 0.90 | 217,439 | |||||||||||
| 20 | HV Bank / Victory - Combined | Thrift | 3 | 0.85 | 205,469 | |||||||||||
| 20 | Republic First Bancorp Inc. (PA) | Bank | 4 | 0.84 | 203,066 | |||||||||||
| 21 | Penn Liberty Financial Corp. (PA) | Bank | 3 | 0.79 | 191,400 | |||||||||||
| 22 | Tompkins Financial Corporation (NY) | Bank | 5 | 0.71 | 171,934 | |||||||||||
| 23 | Victory Bancorp, Inc. (PA) | Bank | 1 | 0.50 | 121,514 | |||||||||||
| 24 | Phoenixville Federal Bank & Trust (PA) | Thrift | 3 | 0.49 | 119,801 | |||||||||||
| 25 | QNB Corp. (PA) | Bank | 2 | 0.40 | 97,886 | |||||||||||
| 27 | Huntingdon Valley Bank (PA) | Thrift | 2 | 0.35 | 83,955 | |||||||||||
| Total (42 financial institutions) | 344 | 100.00 | 24,281,112 | |||||||||||||
Source: SNL Financial.
43
FELDMAN FINANCIAL ADVISORS, INC.
Table 14
Residential Mortgage Market Share in the Philadelphia MSA
Data for the Year Ended December 31, 2012
Rank | Company | Type | No. of Funded Loans | Total Market Share (%) | Total Funded Loans ($000) | |||||||||||
| 1 | Wells Fargo & Co. (CA) | Bank | 29,112 | 15.63 | 6,547,602 | |||||||||||
| 2 | JPMorgan Chase & Co. (NY) | Bank | 10,421 | 4.62 | 1,933,696 | |||||||||||
| 3 | Trident Mortgage Co. LP (PA) | Mtg. Bank | 6,556 | 3.86 | 1,616,181 | |||||||||||
| 4 | Quicken Loans Inc. (MI) | Mtg. Bank | 6,312 | 3.30 | 1,384,545 | |||||||||||
| 5 | Bank of America Corp. (NC) | Bank | 5,189 | 2.81 | 1,179,371 | |||||||||||
| 6 | RBS Citizens NA (RI) | Bank | 5,559 | 2.41 | 1,009,457 | |||||||||||
| 7 | TD Bank NA (DE) | Bank | 5,043 | 2.12 | 888,944 | |||||||||||
| 8 | PNC Financial Services Group (PA) | Bank | 4,893 | 2.03 | 849,192 | |||||||||||
| 9 | Citigroup Inc. (NY) | Bank | 4,510 | 1.91 | 798,947 | |||||||||||
| 10 | Santander Bank N.A. (MA) | Bank | 2,686 | 1.77 | 740,540 | |||||||||||
| 11 | Ally Bank (UT) | Bank | 3,331 | 1.65 | 689,892 | |||||||||||
| 12 | Gateway Funding (PA) | Mtg. Bank | 3,061 | 1.63 | 684,886 | |||||||||||
| 13 | Provident Funding Group Inc (CA) | Mtg. Bank | 2,360 | 1.41 | 590,545 | |||||||||||
| 14 | Police & Fire FCU (PA) | Credit Union | 4,493 | 1.20 | 503,943 | |||||||||||
| 15 | New York Community Bancorp (NY) | Thrift | 855 | 1.17 | 489,973 | |||||||||||
| 16 | M&T Bank Corp. (NY) | Bank | 1,182 | 1.07 | 448,826 | |||||||||||
| 17 | PHH Corp. (NJ) | Mtg. Bank | 1,935 | 0.97 | 407,291 | |||||||||||
| 18 | New Penn Financial LLC (PA) | Mtg. Bank | 1,785 | 0.97 | 405,028 | |||||||||||
| 19 | Meridian Bank (PA) | Bank | 1,622 | 0.93 | 388,000 | |||||||||||
| 20 | Guaranteed Rate Inc. (IL) | Mtg. Bank | 1,663 | 0.92 | 385,069 | |||||||||||
| 21 | Allied Mortgage Group Inc. (PA) | Mtg. Bank | 1,843 | 0.92 | 384,203 | |||||||||||
| 22 | Walker & Dunlop Inc. (MD) | Mtg. Bank | 26 | 0.89 | 374,086 | |||||||||||
| 23 | Hudson City Bancorp Inc. (NJ) | Thrift | 577 | 0.80 | 335,669 | |||||||||||
| 24 | Univest Corp. of Pennsylvania (PA) | Bank | 1,726 | 0.77 | 322,375 | |||||||||||
| 25 | Cardinal Financial Co L.P. (PA) | Mtg. Bank | 1,300 | 0.71 | 295,916 | |||||||||||
| 74 | HV Bank / Victory - Combined | Thrift | 731 | 0.31 | 130,762 | |||||||||||
| 75 | Huntingdon Valley Bank (PA) | Thrift | 711 | 0.30 | 125,180 | |||||||||||
| 330 | Victory Bank (PA) | Bank | 20 | 0.01 | 5,582 | |||||||||||
| Total | 190,436 | 100.00 | 41,898,357 | |||||||||||||
Source: SNL Financial.
44
FELDMAN FINANCIAL ADVISORS, INC.
General Profile of Victory Bancorp
Victory Bancorp is a bank holding company that owns 100% of the outstanding capital stock of Victory Bank, a Pennsylvania-chartered commercial bank that was established in January 2008. Victory Bank operates a full-service commercial and consumer banking business in Montgomery County, Pennsylvania. Victory Bank originates secured and unsecured commercial loans, commercial mortgage loans, consumer loans, construction loans, small business loans, and automobile loans. Victory Bank offers an enhanced delivery system option of telephone banking and Internet banking. Other services include safe deposit facilities, remote deposit capture, wire transfers, two drive-through facilities, 24-hour depositories, and an ATM.
Since its inception, Victory Bank has focused on a strategic niche of operating as a local community bank with special expertise in serving the borrowing, cash management and depository, needs of small- to medium-sized business and professional practices, and providing responsive and personalized service to its customers. Due to the consolidation of financial institutions in Pennsylvania and in Montgomery County, Victory Bank saw a significant opportunity for a locally focused bank to provide a full range of financial services to small- and middle-market commercial and retail customers. By offering highly professional, personalized banking products and service delivery methods and employing advanced banking technologies, Victory Bank seeks to distinguish itself from larger, regional banks operating in the local market. At December 31, 2013, Victory Bancorp had total assets of $141.3 million, net total loans of $129.3 million, total deposits of $120.1 million, and total equity capital of $13.0 million or 9.17% of total assets. Exhibit II-8 summarizes Victory Bancorp’s consolidated balance sheets as of the years ended December 31, 2011 to 2013.
45
FELDMAN FINANCIAL ADVISORS, INC.
Exhibit II-9 displays Victory Bancorp’s consolidated income statements for the years ended December 31, 2011 to 2013. Table 15 below presents selected financial condition and operating data for Victory Bancorp as of or for the years ended December 31, 2012 and 2013 and Table 16 displays selected financial ratios for Victory Bancorp.
Table 15
Selected Financial Condition and Operating Data
Victory Bancorp
As of or For the Years Ended December 31, 2012 and 2013
(Dollars in Thousands)
| December 31, | ||||||||
| 2013 | 2012 | |||||||
Total assets | $ | 141,319 | $ | 127,296 | ||||
Cash and cash equivalents | 2,389 | 5,577 | ||||||
Investment securities | 1,901 | 4,885 | ||||||
Total loans, net | 129,337 | 109,158 | ||||||
Total deposits | 120,126 | 112,338 | ||||||
Total borrowings | 7,665 | 2,000 | ||||||
Total equity capital | 12,958 | 12,552 | ||||||
| Year Ended December 31, | ||||||||
| 2013 | 2012 | |||||||
Total interest income | $ | 6,839 | $ | 5,707 | ||||
Total Interest expense | 1,030 | 1,074 | ||||||
|
|
|
| |||||
Net interest income | 5,809 | 4,633 | ||||||
Provision for loan losses | 348 | 472 | ||||||
|
|
|
| |||||
Net interest income after provision | 5,461 | 4,161 | ||||||
Non-interest income | 969 | 369 | ||||||
Non-interest expense | 5,247 | 4,057 | ||||||
|
|
|
| |||||
Income before income taxes | 1,183 | 473 | ||||||
Income tax expense (benefit) | 473 | (1,060 | ) | |||||
|
|
|
| |||||
Net income | 710 | 1,533 | ||||||
Preferred stock dividends | 218 | 217 | ||||||
|
|
|
| |||||
Net income available to common shareholders | $ | 492 | $ | 1,316 | ||||
|
|
|
| |||||
Source: Victory Bancorp, financial statements.
46
FELDMAN FINANCIAL ADVISORS, INC.
Table 16
Selected Financial Ratios and Other Data
Victory Bancorp
As of or For the Years Ended December 31, 2012 and 2013
| As of or For the Year Ended December 31, | ||||||||
| 2013 | 2012 | |||||||
Performance Ratios: | ||||||||
Return on average assets (ROA) | 0.52 | % | 1.32 | % | ||||
Return on average equity (ROE) | 5.55 | % | 13.43 | % | ||||
Interest rate spread(1) | 4.36 | % | 4.04 | % | ||||
Net interest margin(2) | 4.53 | % | 4.24 | % | ||||
Non-interest expense to average assets | 3.86 | % | 3.49 | % | ||||
Efficiency ratio | 77.4 | % | 81.1 | % | ||||
Average interest-earning assets to average interest-bearing liabilities | 121.1 | % | 120.3 | % | ||||
Loans to deposits | 109.0 | % | 98.3 | % | ||||
Asset Quality Ratios: | ||||||||
Non-performing assets to total assets(3) | 0.35 | % | 1.32 | % | ||||
Non-performing loans to total loans | 0.38 | % | 1.52 | % | ||||
Allowance for loan losses to non-performing loans | 334.00 | % | 79.69 | % | ||||
Allowance for loan losses to total loans | 1.27 | % | 1.21 | % | ||||
Net charge-offs as a percentage of average loans outstanding | (0.02 | %) | (0.22 | %) | ||||
Capital Ratios: | ||||||||
Average equity to average assets | 9.40 | % | 9.83 | % | ||||
Equity to total assets at end of period | 9.17 | % | 9.86 | % | ||||
Total capital to risk-weighted assets | 10.20 | % | 10.32 | % | ||||
Tier 1 capital to risk-weighted assets | 8.95 | % | 9.14 | % | ||||
Tier 1 capital to average assets | 8.20 | % | 8.50 | % | ||||
Other Data: | ||||||||
Number of full-service offices | 1 | 1 | ||||||
Number of employees | 30 | 27 | ||||||
| (1) | Represents the difference between the weighted-average yield on interest-earning assets and the weighted-average cost of interest-bearing liabilities for the period. |
| (2) | The net interest margin represents net interest income as a percent of average interest-earning assets for the period. |
| (3) | Non-performing assets consist of non-performing loans and real estate owned. |
Source: HV Bancorp, preliminary prospectus.
47
FELDMAN FINANCIAL ADVISORS, INC.
Victory Bancorp’s balance sheet at December 31, 2013 was heavily concentrated in loans, which amounted to $129.3 million or 91.5% of total assets. Commercial loans totaled 75.8% of Victory Bancorp’s loan portfolio and comprised commercial term, commercial mortgage, and commercial line loans. Its assets are funded chiefly by deposits, which included $97.3 million (81.0% of total deposits) of transaction accounts and $22.8 million (19.0% of total deposits) of certificate accounts. The asset quality of Victory Bancorp has remained sound, as the NPAs measured 0.35% of total assets at December 31, 2013. As of December 31, 2013, Victory Bancorp’s equity capital amounted to $13.0 million, or 9.17% of total assets, and included preferred stock of $6.0 million and common equity of $6.9 million. The preferred stock included $2.6 million of Series E convertible shares bearing a dividend rate of 7.0% and $3.4 million of Series F non-convertible shares issued to the U.S. Treasury under the SBLF and bearing a current dividend rate of 1.0%.
Victory Bancorp’s net income declined from $1.5 million for the year ended December 31, 2012 to $710,000 for the year ended December 31, 2013. Pre-tax earnings actually increased from $473,000 to $1.2 million over the corresponding periods. Victory Bancorp recorded an income tax benefit of $1.1 million in the 2012 period related to a decrease in the deferred tax asset valuation allowance, and recorded an income tax expense of $473,000 in the 2013 period. Victory Bancorp’s ROA declined from 1.32% for the year ended December 31, 2012 to 0.52% for the year ended December 31, 2013. The earnings of Victory Bancorp are driven by its strong net interest margin, which is supported by the large concentration of commercial loans on the balance sheet funded primarily by transaction deposit accounts. The net interest margin increased from 4.24% to 4.53% over the year ended December 31, 2012 to 2013.
48
FELDMAN FINANCIAL ADVISORS, INC.
Pro Forma Impact of the Merger and Conversion
HV Bank has formed HV Bancorp to be the holding company of HV Bank upon completion of its conversion from the mutual to stock form of organization. As part of the conversion, HV Bancorp will raise additional capital through the offering for sale the shares of common stock of HV Bancorp. Upon completion of the offering, HV Bancorp will own 100% of the outstanding shares of common stock of HV Bank. In connection with the mutual to stock conversion, HV Bank will also change its charter from a Pennsylvania-chartered mutual savings bank to a Pennsylvania-chartered commercial bank.
In conjunction with the conversion, HV Bancorp will complete the acquisition of Victory Bancorp that will entail the merger of Victory Bank into HV Bank. Upon consummation of the merger, HV Bank will change its corporate title to “Victory Bank.” Pursuant to the terms of the merger, Victory Bancorp’s shareholders will receive the right to exchange each share of Victory Bancorp common stock for 0.6794 of a share of HV Bancorp common stock or, under certain limited circumstances, a combination of HV Bancorp common stock and cash. In addition, Series E preferred stockholders of Victory Bancorp will be given the opportunity to convert their shares as follows: (i) exchange their shares for Victory Bancorp subordinated debt that HV Bancorp will assume upon completion of the merger; (ii) be redeemed by Victory Bancorp for cash at par on or prior the closing date of the merger; or (iii) if not exchanged for subordinated debt, redeemed for cash, or converted into Victory Bancorp stock prior to merger closing, their Series E preferred shares will be converted into HV Bancorp Series A preferred stock having similar terms. Victory Bancorp Series F preferred stock issued under the SBLF program will be exchanged for HV Bancorp Series B preferred stock having similar terms.
49
FELDMAN FINANCIAL ADVISORS, INC.
Subject to the above terms and the agreed upon limitations, the existing shareholders of Victory Bancorp immediately prior to the merger will not own in excess of 48.5% of the common stock of HV Bancorp on a pro forma basis. Table 17 presents the consolidated pro forma balance sheet of HV Bancorp at December 31, 2013, giving effect to the conversion stock offering at the midpoint ($10.0 million) of the valuation range and the merger with Victory Bancorp. This pro forma presentation provides for compliance that Victory Bancorp shareholders own a maximum of 48.5% of the pro forma outstanding shares and therefore assumes, at the minimum midpoint of the offering range, that 81% of the Series E convertible preferred stock is exchanged for common stock and the remaining 19% of the Series E convertible preferred stock is converted into newly issued subordinated debt. Assuming 81% of the shares of Series E preferred stock are converted to common stock, the aggregate deal cost of the merger will be approximately $9.8 million.
As shown on Table 17, total assets would increase from $163.4 million for HV Bank at December 31, 2013 to $312.3 million on a pro forma combined basis. The combined company’s ratio of total loans to assets increases to 67.3% as compared to 48.7% for HV Bank, reflecting the substantial concentration of loans on the balance sheet of Victory Bancorp. Intangible assets, consisting of goodwill and the core deposit intangible, resulting from the merger are estimated at $834,000 in this presentation. The combined company’s ratio of tangible equity to tangible assets advances to 9.36% (compared to 6.28% for HV Bank before the conversion and merger) and its ratio of tangible common equity to tangible assets increases to 8.26% (compared to 6.28% for HV Bank). Table 17 also includes a summary of the estimated fair adjustments utilized in recording the accounting for the merger under the purchase method.
50
FELDMAN FINANCIAL ADVISORS, INC.
Table 18 presents the pro forma consolidated income statement of HV Bancorp for the last twelve months (“LTM”) ended December 31, 2013, giving effect to the conversion stock offering at the midpoint of the valuation range and the merger with Victory Bancorp. Net income of HV Bank for the LTM ended December 31, 2013 amounted to $9,000, which would increase to $156,000 for HV Bancorp on a pro forma combined basis. Over the same time period, Victory Bancorp’s net income amounted to $710,000 before payment of preferred stock dividends and $492,000 after preferred dividends. The incremental contribution of Victory Bancorp’s earnings is offset by additional expenses related to HV Bancorp’s stock-benefit plans and the effect of certain fair valuation adjustments that reduce earnings. Core earnings, which exclude the effect of non-recurring income (such as securities gains), non-recurring expense (such as merger expenses), and intangibles amortization expense, increase from a deficit of $81,000 at HV Bank for the LTM ended December 31, 2013 to $252,000 for HV Bancorp on a pro forma basis. The operating performance ratios also improve as reflected by the increase in LTM ROA to 0.05% from 0.01%, the net interest margin advancing to 3.39% from 2.74%, and the efficiency ratio improving to 93.7% from 103.2%. The pro forma presentation in Table 18 does not consider any operating cost savings or revenue synergies that might result from the merger.
51
FELDMAN FINANCIAL ADVISORS, INC.
Table 17
Pro Forma Consolidated Balance Sheet
HV Bancorp, Inc. – After Conversion Midpoint Offering and Merger
As of December 31, 2013
(Dollars in Thousands)
| HV Bank Historical 12/31/13 | Midpoint Offering Adjust. | Victory Bancorp Historical 12/31/13 | Merger Adjust. | Pro Forma HV Bancorp | ||||||||||||||||
Cash and securities | $ | 74,157 | $ | 7,042 | (1) | $ | 4,290 | $ | (747 | )(4) | $ | 84,742 | ||||||||
Total loans, net | 79,534 | — | 129,337 | 1,286 | (5) | 210,157 | ||||||||||||||
Restricted invest. in bank stocks | 910 | — | 627 | — | 1,537 | |||||||||||||||
Bank-owned life insurance | 3,617 | — | 1,306 | — | 4,923 | |||||||||||||||
Premises and equipment | 1,793 | — | 3,960 | (477 | )(6) | 5,276 | ||||||||||||||
Goodwill | — | — | — | 140 | (7) | 140 | ||||||||||||||
Core deposit intangible | — | — | — | 694 | (8) | 694 | ||||||||||||||
Other assets | 3,412 | — | 1,799 | (429 | )(9) | 4,782 | ||||||||||||||
|
|
|
|
|
|
|
|
|
| |||||||||||
Total assets | $ | 163,423 | $ | 7,042 | $ | 141,319 | $ | 467 | $ | 312,251 | ||||||||||
|
|
|
|
|
|
|
|
|
| |||||||||||
Total deposits | $ | 140,631 | $ | — | $ | 120,126 | $ | 263 | (10) | $ | 261,020 | |||||||||
Borrowed funds | 10,759 | — | 7,665 | (22 | )(11) | 18,402 | ||||||||||||||
Subordinated debt | — | — | — | 497 | (12) | 497 | ||||||||||||||
Other liabilities | 1,772 | — | 570 | — | 2,342 | |||||||||||||||
|
|
|
|
|
|
|
|
|
| |||||||||||
Total liabilities | 153,162 | — | 128,361 | 738 | 282,261 | |||||||||||||||
Preferred stock | — | — | 6,047 | (2,616 | )(12) | 3,431 | ||||||||||||||
Common stock and paid-in capital | — | 8,984 | (2) | 10,246 | (829 | )(13) | 18,401 | |||||||||||||
Retained earnings | 11,502 | — | (3,356 | ) | 3,195 | (14) | 11,341 | |||||||||||||
Accum. other comp. income (loss) | (1,241 | ) | — | 21 | (21 | )(15) | (1,241 | ) | ||||||||||||
Unearned ESOP stock | — | (1,165 | )(3) | — | — | (1,165 | ) | |||||||||||||
Unearned RSP stock | — | (777 | )(3) | — | — | (777 | ) | |||||||||||||
|
|
|
|
|
|
|
|
|
| |||||||||||
Total equity | 10,261 | 7,042 | 12,958 | (271 | ) | 29,990 | ||||||||||||||
|
|
|
|
|
|
|
|
|
| |||||||||||
Total liabilities and equity | $ | 163,423 | $ | 7,042 | $ | 141,319 | $ | 467 | $ | 312,251 | ||||||||||
|
|
|
|
|
|
|
|
|
| |||||||||||
Total equity / assets | 6.28 | % | 9.17 | % | 9.60 | % | ||||||||||||||
Tangible equity / assets | 6.28 | % | 9.17 | % | 9.36 | % | ||||||||||||||
Tangible common equity / assets | 6.28 | % | 4.89 | % | 8.26 | % | ||||||||||||||
Cash and securities / assets | 45.38 | % | 3.04 | % | 27.14 | % | ||||||||||||||
Total loans / assets | 48.67 | % | 91.52 | % | 67.30 | % | ||||||||||||||
Total loans / deposits | 56.56 | % | 107.67 | % | 80.51 | % | ||||||||||||||
52
FELDMAN FINANCIAL ADVISORS, INC.
Table 17
Pro Forma Consolidated Balance Sheet (continued)
| (1) | Net investable proceeds from offering midpoint, after offering expenses and funded stock purchases by ESOP and RSP. |
| (2) | Issuance of common stock in offering, net of offering expenses. |
| (3) | Contra-equity account established to reflect the stock benefit plans (ESOP and RSP). The ESOP plans to purchase an amount of common stock in the offering equal to 6% of the total shares to be outstanding after the merger. Subject to shareholder approval, the RSP plans to purchase an amount of common stock equal to 4% of the total outstanding shares. |
| (4) | Includes the cash portion of the merger consideration, transaction expense, and settlement of warrants. |
| (5) | Fair value adjustment to loan portfolio of Victory Bancorp. |
| (6) | Market value adjustment to the land and building of Victory Bancorp. |
| (7) | Excess of purchase price over fair value of net assets acquired. |
| (8) | Core deposit intangible representing the economic value of the acquired core deposit base. |
| (9) | Deferred tax asset created as a result of purchase accounting. |
| (10) | Fair value adjustment to certificates of deposit acquired in the merger. |
| (11) | Fair value adjustment to borrowings acquired in the merger. |
| (12) | Reflects conversion of 81% of Series E preferred shares of Victory Bancorp into right to receive HV Bancorp common stock and 19% of Series E preferred shares into subordinated debt. |
| (13) | Reflects elimination of historical common stock and paid-in capital account of Victory Bancorp and issuance of HV Bancorp common stock to Victory Bancorp shareholders as merger consideration. |
| (14) | Reflects elimination of historical retained deficit account of Victory Bancorp and deduction of HV Bancorp merger expenses. |
| (15) | Reflects elimination of historical accumulated other comprehensive income account of Victory Bancorp. |
Source: HV Bancorp, preliminary prospectus; Feldman Financial.
53
FELDMAN FINANCIAL ADVISORS, INC.
Table 18
Pro Forma Consolidated Income Statement
HV Bancorp, Inc. – After Conversion Midpoint Offering and Merger
As of December 31, 2013
(Dollars in Thousands)
| HV Bank Historical 12/31/13 | Midpoint Offering Adjust. | Victory Bancorp Historical 12/31/13 | Merger Adjust. | Pro Forma HV Bancorp | ||||||||||||||||
Total interest income | $ | 4,970 | $ | 124 | (1) | $ | 6,839 | $ | (459 | )(4) | $ | 11,474 | ||||||||
Total interest expense | 896 | — | 1,030 | (88 | )(5) | 1,838 | ||||||||||||||
|
|
|
|
|
|
|
|
|
| |||||||||||
Net interest income | 4,074 | 124 | 5,809 | (371 | ) | 9,636 | ||||||||||||||
Provision for loan losses | 9 | — | 348 | — | 357 | |||||||||||||||
|
|
|
|
|
|
|
|
|
| |||||||||||
Net interest income after prov. | 4,065 | 124 | 5,461 | (371 | ) | 9,279 | ||||||||||||||
Non-interest operating income | 2,153 | — | 924 | — | 3,077 | |||||||||||||||
Securities gains, net | 256 | — | 45 | — | 301 | |||||||||||||||
|
|
|
|
|
|
|
|
|
| |||||||||||
Non-interest income | 2,409 | — | 969 | — | 3,378 | |||||||||||||||
|
|
|
|
|
|
|
|
|
| |||||||||||
Non-interest operating expense | 6,424 | 331 | (2) | 5,049 | 108 | (6) | 11,912 | |||||||||||||
Intangibles amortization expense | — | — | — | 129 | (7) | 129 | ||||||||||||||
Non-recurring expense | 120 | — | 198 | — | 318 | |||||||||||||||
|
|
|
|
|
|
|
|
|
| |||||||||||
Non-interest expense | 6,544 | 331 | 5,247 | 237 | 12,359 | |||||||||||||||
|
|
|
|
|
|
|
|
|
| |||||||||||
Income before income taxes | (69 | ) | (207 | ) | 1,183 | (608 | ) | 299 | ||||||||||||
Income tax expense (benefit) | (78 | ) | (37 | )(3) | 473 | (215 | )(3) | 143 | ||||||||||||
|
|
|
|
|
|
|
|
|
| |||||||||||
Net income | 9 | (170 | ) | 710 | (393 | ) | 156 | |||||||||||||
Preferred stock dividends | — | — | 218 | (184 | )(8) | 34 | ||||||||||||||
|
|
|
|
|
|
|
|
|
| |||||||||||
Net income available to common | $ | 9 | $ | (170 | ) | $ | 492 | $ | (209 | ) | $ | 122 | ||||||||
|
|
|
|
|
|
|
|
|
| |||||||||||
Return on average assets - ROA | 0.01 | % | 0.52 | % | 0.05 | % | ||||||||||||||
Return on average equity - ROE | 0.08 | % | 5.55 | % | 0.51 | % | ||||||||||||||
Core ROA | -0.05 | % | 0.60 | % | 0.08 | % | ||||||||||||||
Core ROE | -0.74 | % | 6.34 | % | 0.83 | % | ||||||||||||||
Net interest margin | 2.74 | % | 4.53 | % | 3.39 | % | ||||||||||||||
Efficiency ratio | 103.16 | % | 74.99 | % | 93.70 | % | ||||||||||||||
Non-interest income / avg. assets | 1.54 | % | 0.71 | % | 1.13 | % | ||||||||||||||
Non-interest expense / avg. assets | 4.18 | % | 3.86 | % | 4.12 | % | ||||||||||||||
54
FELDMAN FINANCIAL ADVISORS, INC.
Table 18
Pro Forma Consolidated Income Statement (continued)
| (1) | Interest income from reinvestment of net cash proceeds from offering midpoint, reflecting estimated pretax yield of 1.75% that approximates the yield on a five-year U.S. Treasury security as of December 31, 2013. |
| (2) | Reflects the expense impact of the stock benefit plans, including the ESOP, RSP, and stock option plan. |
| (3) | Assumes a marginal income tax rate of 34.0% on taxable income and tax-deductible expense. |
| (4) | Adjustment to interest income to reflect amortization of yield component of fair adjustment to acquired loan portfolio and opportunity cost of funding the cash portion of the merger consideration and the merger transaction expenses. |
| (5) | Adjustment to interest expense to reflect accretion premium on certificates of deposit, amortization of discount on acquired borrowings, and incremental cost of newly issued subordinated debt. |
| (6) | Adjustment to non-interest operating expense to reflect increased Pennsylvania shares tax and reduced depreciation expense related to fair value write-down of fixed assets. |
| (7) | Amortization of core deposit intangible asset assuming expected life of approximately 11 years utilizing the double declining balance method. |
| (8) | Reflects the elimination of all cash dividends on Series E preferred stock. Remaining preferred dividends reflect cash dividends paid on the $3.4 million of SBLF Series F preferred stock at an annual rate of 1.0%. |
Source: HV Bancorp, preliminary prospectus; Feldman Financial.
55
FELDMAN FINANCIAL ADVISORS, INC.
II. COMPARISONS WITH PUBLICLY TRADED THRIFTS
General Overview
The comparative market approach provides a sound basis for determining estimates of going-concern valuations where a regular and active market exists for the stocks of peer institutions. The comparative market approach was utilized in determining the estimated pro forma market value of HV Bancorp because: (i) reliable market and financial data are readily available for comparable institutions; (ii) the comparative market method is accepted by the applicable regulatory guidelines; and (iii) other alternative valuation methods (such as income capitalization, discounted cash flow, or liquidation analysis) are unlikely to produce a valuation relevant to the future trading patterns of the related equity interest. The generally employed valuation method in initial public offerings, where possible, is the comparative market approach, which also can be relied upon to determine pro forma market value in a thrift stock conversion.
The comparative market approach derives valuation benchmarks from the trading patterns of selected peer institutions that, due to certain factors such as financial performance and operating strategies, enable the appraiser to estimate the potential value of the subject institution in a stock conversion offering. The pricing and trading history of recent initial public offerings of thrifts are also examined to provide evidence of the “new issue discount” that must be considered. In Chapter II, our valuation analysis focuses on the selection and comparison of HV Bank with a comparable group of publicly traded thrift institutions (the “Comparative Group”). Chapter III will detail any additional discounts or premiums that we believe are appropriate to HV Bancorp’s pro forma market value.
56
FELDMAN FINANCIAL ADVISORS, INC.
Selection Criteria
Selected market price and financial performance data for all public thrifts listed on major stock exchanges are shown in Exhibit III. The list excludes companies that are subject to being acquired under a pending merger transaction and companies that have a majority ownership interest controlled by a mutual holding company (“MHC”). Several criteria, discussed below, were used to select the individual members of the Comparative Group from the overall universe of publicly traded thrifts.
| • | Operating characteristics – An institution’s operating characteristics are the most important factors because they affect investors’ expected rates of return on a company’s stock under various business/economic scenarios, and they influence the market’s general perception of the quality and attractiveness of a given company. Operating characteristics, which may vary in importance during the business cycle, include financial variables such as profitability, balance sheet growth, capitalization, asset quality, and other factors such as lines of business and management strategies. |
| • | Degree of marketability and liquidity – Marketability of a stock reflects the relative ease and promptness with which a security may be sold when desired, at a representative current price, without material concession in price merely because of the necessity of sale. Marketability also connotes the existence of buying interest as well as selling interest and is usually indicated by trading volumes and the spread between the bid and asked price for a security. Liquidity of the stock issue refers to the organized market exchange process whereby the security can be converted into cash. We attempted to limit our selection to companies that have access to a regular trading market or price quotations, and therefore only considered companies listed on major stock exchanges. We eliminated for consideration companies with market prices that were materially influenced by announced acquisitions or other unusual circumstances. However, the expectation of continued industry consolidation is currently embedded in thrift equity valuations. |
| • | Geographic Location – The region of the country where a company operates is also of importance in selecting the comparative group. The operating environment for thrift institutions varies from region to region with respect to business and economic environments, real estate market conditions, speculative takeover activity, and investment climates. Economic and investor climates can also vary greatly within a region, particularly due to takeover activity. |
57
FELDMAN FINANCIAL ADVISORS, INC.
The operations of HV Bank fit the general profile of a diversifying thrift institution, concentrating primarily on real estate lending in its local market and relying significantly on core deposits and certificate of deposit accounts as funding sources. Residential mortgage loans remain a core product in HV Bank’s loan portfolio. However, HV Bank has increasingly expanded its loan mix through the origination of commercial real estate loans and, to a lesser extent, commercial business loans and construction loans.
In determining the Comparative Group composition, we focused chiefly on HV Bank’s asset size, capital level, credit risk profile, and geographic location. Attempting to concentrate on HV Bank’s performance characteristics and to develop a meaningful number of comparables for valuation purposes, we expanded the geographic criterion for comparable thrifts beyond the Mid-Atlantic region of the United States; however, primary consideration was accorded to comparable thrifts located in Pennsylvania and other Mid-Atlantic states. As with any composition of a group of comparable companies, the selection criteria were broadened sufficiently to assemble a meaningful number of members:
| • | Publicly traded thrift – stockholder-owned thrift whose shares are traded on the NYSE, NYSE MKT, or NASDAQ stock markets. |
| • | Non-acquisition target – company is not subject to a pending acquisition. |
| • | Excludes mutual holding companies – company’s majority ownership interest is not held by an MHC. |
| • | Seasoned trading issue – company has been traded publicly for a minimum of one full year. |
| • | Asset size – total assets less than $500 million. |
| • | Credit risk exposure – ratio of total non-performing assets to total assets less than or equal to 3.0%. |
| • | Geographic location – preference for companies based in the Mid-Atlantic region, with consideration also granted to companies in adjacent regions. |
58
FELDMAN FINANCIAL ADVISORS, INC.
As a result of applying the stated criteria, the screening process produced a reliable representation of publicly traded thrifts. A general operating summary of the ten companies included in the Comparative Group is presented in Table 19. All of the selected companies are traded on the NASDAQ market. The Comparative Group ranged in asset size from $263.0 million at Georgetown Bancorp to $425.5 million at Alliance Bancorp. The median asset size of the Comparative Group was $303.0 million, compared to HV Bank’s total assets of $163.4 million at December 31, 2013. The asset size criterion was extended to encapsulate a meaningful number of comparables since only a few number of small publicly held thrifts trade on the major stock exchanges. However, four of the selected comparables have total assets less than $300 million: Georgetown Bancorp at $263.0 million, Poage Bankshares at $289.2 million, Athens Bancshares at $294.8 million, and Wolverine Bancorp at $297.8 million.
Four of the members of the Comparative Group are located in Mid-Atlantic states: Alliance Bancorp, Polonia Bancorp, and WVS Financial in Pennsylvania, and Hamilton Bancorp in Maryland. Polonia Bancorp, which completed its conversion from a mutual holding company to a full stock company in November 2012, is headquartered in Huntingdon Valley, Pennsylvania, similar to HV Bank. Three of the members of the Comparative Group are located in the Midwest, two in the Southeast, and one in New England.
In comparison to recent performance trends of the aggregate public thrift industry, the Comparative Group generally exhibited comparable profitability and asset quality ratios and higher capital levels. While some differences inevitably may exist between HV Bank and the individual companies, we believe that the selected Comparative Group on the whole provides a meaningful basis of financial comparison for valuation purposes.
59
FELDMAN FINANCIAL ADVISORS, INC.
Table 19
Comparative Group Operating Summary
As of December 31, 2013
Company | Headquarters Location | Number of Offices | Conversion Offering Date | Total Assets ($Mil.) | Tang. Equity/ Assets (%) | |||||||||
Huntingdon Valley Bank | Huntingdon Valley, PA | 5 | NA | $ | 163.4 | 6.28 | ||||||||
Victory Bancorp, Inc. | Limerick, PA | 1 | NA | 141.3 | 9.17 | |||||||||
Comparative Group | ||||||||||||||
Alliance Bancorp, Inc. | Broomall, PA | 8 | 01/18/11 | 425.5 | 16.49 | |||||||||
Athens Bancshares Corp. | Athens, TN | 7 | 01/07/10 | 294.8 | 13.89 | |||||||||
Georgetown Bancorp, Inc. | Georgetown, MA | 3 | 07/12/12 | 263.0 | 11.00 | |||||||||
Hamilton Bancorp, Inc. | Towson, MD | 5 | 10/10/12 | 300.5 | 19.70 | |||||||||
Jacksonville Bancorp, Inc. | Jacksonville, IL | 6 | 07/15/10 | 318.4 | 12.17 | |||||||||
LSB Financial Corp. | Lafayette, IN | 5 | 02/03/95 | 367.6 | 11.08 | |||||||||
Poage Bankshares, Inc. | Ashland, KY | 6 | 09/13/11 | 289.2 | 19.93 | |||||||||
Polonia Bancorp, Inc. | Huntingdon Valley, PA | 6 | 11/13/12 | 305.6 | 13.19 | |||||||||
Wolverine Bancorp, Inc. | Midland, MI | 4 | 01/20/11 | 297.8 | 20.26 | |||||||||
WVS Financial Corp. | Pittsburgh, PA | 6 | 11/29/93 | 314.0 | 10.28 | |||||||||
Source: Huntingdon Valley Bank; Victory Bancorp; SNL Financial.
60
FELDMAN FINANCIAL ADVISORS, INC.
Recent Financial Comparisons
Table 20 summarizes certain key financial comparisons between HV Bank and the Comparative Group. Tables 21 through 26 contain the detailed financial comparisons of HV Bank with the individual Comparative Group companies based on measures of profitability, income and expense components, yield-cost structure, capital levels, balance sheet composition, asset quality, and growth rates. Historical financial performance ratios for Victory Bancorp are also displayed. In addition, pro forma financial ratios are presented for HV Bancorp giving effect to the conversion and the merger based on the pro forma financial statements as of December 31, 2013 in Table 17 and Table 18. Financial data for HV Bank, Victory Bancorp, the Comparative Group, and All Public Thrift aggregate were utilized for the latest available period as of or for the LTM ended December 31, 2013.
HV Bank’s LTM ROA was 0.01%, reflecting breakeven profitability results that trailed the Comparative Group median of 0.42% and the All Public Thrift median of 0.58%. HV Bank’s lower ROA was attributable mainly to a lower net interest margin and a higher level of operating expense. HV Bank’s LTM ROE was 0.08% and positioned below the Comparative Group median of 3.00%. Only two Comparative Group members reported an LTM ROA below that of HV Bank. Hamilton Bancorp and Polonia Bancorp sustained net losses with ROA performances of -0.38% and -0.09%, respectively. On a pro forma basis assuming the midpoint of the offering range, HV Bancorp reflects an LTM ROA of 0.05% and ROE of 0.51%
Based on core earnings as adjusted to exclude securities gains and merger-related expenses, HV Bank’s core ROA measured -0.05% versus the Comparative Group median of 0.52% and the All Public Thrift median of 0.58%. HV Bank’s core earnings for the LTM period excluded $256,000 of pre-tax gains on sales of investment securities and $120,000 of merger-related
61
FELDMAN FINANCIAL ADVISORS, INC.
expenses. HV Bank’s LTM core ROE of -0.74% also lagged the Comparative Group median of 2.57% and the All Public Thrift median of 4.46%. The LTM core ROA for HV Bancorp on a pro forma basis was 0.08% and the LTM core ROE was 0.83%.
As shown in Table 20, HV Bank’s net interest margin of 2.74% was surpassed by the Comparative Group median of 3.35% and the All Public Thrift median of 3.27%. HV Bank’s net interest margin has been restrained by its large concentration of investment securities, which generally are lower yielding compared to loans. Two of the Comparative Group members, Hamilton Bancorp and WVS Financial, exhibited net interest margins comparable to or lower than that of HV Bank and both also had large levels of investment securities on their respective balance sheets.
HV Bank’s weighted average yield on earning assets measured 3.34% for the LTM period, measuring below the Comparative Group median of 4.09%. HV Bank’s weighted average cost of funding liabilities at 0.61% was below the Comparative Group median of 0.78%. Accordingly, HV Bank’s net interest spread of 2.73% was lower than the Comparative Group median of 3.25%. On a pro forma basis, HV Bancorp displays a net interest spread of 3.35% as the larger concentration of loans to assets at Victory Bancorp would have the effect of increasing HV Bancorp’s yield on earning assets to 4.03% as compared to 3.34% for HV Bank.
HV Bank’s non-interest operating income (excluding securities gains and other non-recurring income) totaled 1.37% of average assets for the LTM period, noticeably outperforming the Comparative Group and All Public Thrift medians of 0.71% and 0.68%, respectively. Gains on sale of loans have been a significant contributor to HV Bank’s non-interest revenue.
62
FELDMAN FINANCIAL ADVISORS, INC.
Table 20
Key Financial Comparisons
Huntingdon Valley Bank and the Comparative Group
As of For the Last Twelve Months Ended December 31, 2013
(Ratios in Percent)
| HV Bank | Victory Bancorp | Pro Forma HV Bancorp(1) | Comp. Group Median | All Public Thrift Median | ||||||||||||||||
Profitability | ||||||||||||||||||||
LTM ROA | 0.01 | 0.52 | 0.05 | 0.42 | 0.58 | |||||||||||||||
LTM ROE | 0.08 | 5.55 | 0.51 | 2.52 | 4.68 | |||||||||||||||
Core ROA | (0.05 | ) | 0.60 | 0.08 | 0.52 | 0.58 | ||||||||||||||
Core ROE | (0.74 | ) | 6.34 | 0.83 | 2.57 | 4.46 | ||||||||||||||
Income and Expense(% of avg. assets) | ||||||||||||||||||||
Total Interest Income | 3.17 | 5.03 | 3.82 | 3.84 | 3.03 | |||||||||||||||
Total Interest Expense | 0.57 | 0.76 | 0.61 | 0.65 | 0.65 | |||||||||||||||
Net Interest Income | 2.60 | 4.27 | 3.21 | 3.17 | 3.03 | |||||||||||||||
Provision for Loan Losses | 0.01 | 0.26 | 0.12 | 0.19 | 0.11 | |||||||||||||||
Other Operating Income | 1.37 | 0.68 | 0.93 | 0.71 | 0.68 | |||||||||||||||
Securities Gains and Non-rec. Income | 0.16 | 0.03 | 0.10 | 0.00 | 0.01 | |||||||||||||||
General and Administrative Expense | 4.10 | 3.71 | 3.97 | 3.09 | 2.90 | |||||||||||||||
Intangibles Amortization Expense | 0.00 | 0.00 | 0.04 | 0.00 | 0.00 | |||||||||||||||
Non-recurring Expense | 0.08 | 0.15 | 0.11 | 0.00 | 0.00 | |||||||||||||||
Pre-tax Core Earnings(1) | (0.13 | ) | 0.98 | 0.05 | 0.51 | 0.88 | ||||||||||||||
Net Interest Margin | 2.74 | 4.40 | 3.39 | 3.35 | 3.27 | |||||||||||||||
Efficiency Ratio | 103.16 | 74.99 | 93.70 | 78.54 | 74.79 | |||||||||||||||
Yield-Cost Data | ||||||||||||||||||||
Yield on Earning Assets | 3.34 | 5.34 | 4.03 | 4.09 | 3.98 | |||||||||||||||
Cost of Funding Liabilities | 0.61 | 0.85 | 0.69 | 0.78 | 0.77 | |||||||||||||||
Net Interest Spread | 2.73 | 4.49 | 3.35 | 3.25 | 3.23 | |||||||||||||||
Asset Utilization(% of avg. total assets) | ||||||||||||||||||||
Average Earning Assets | 95.00 | 94.24 | 94.80 | 94.61 | 93.79 | |||||||||||||||
Average Funding Liabilities | 93.48 | 89.02 | 89.37 | 84.22 | 86.17 | |||||||||||||||
Average Net Earnings Assets | 1.51 | 5.22 | 5.43 | 10.36 | 7.42 | |||||||||||||||
Average Equity | 6.99 | 9.40 | 10.16 | 14.93 | 12.73 | |||||||||||||||
63
FELDMAN FINANCIAL ADVISORS, INC.
Table 20 (continued)
Key Financial Comparisons
Huntingdon Valley Bank and the Comparative Group
As of For the Last Twelve Months Ended December 31, 2013
(Ratios in Percent)
| HV Bank | Victory Bancorp | Pro Forma HV Bancorp(1) | Comp. Group Median | All Public Thrift Median | ||||||||||||||||
Balance Sheet Composition(% of total assets) | ||||||||||||||||||||
Cash and Securities | 45.93 | 3.48 | 27.63 | 28.52 | 23.11 | |||||||||||||||
Loans Receivable, net | 48.67 | 91.52 | 67.30 | 68.23 | 69.84 | |||||||||||||||
Real Estate Owned | 0.35 | 0.00 | 0.18 | 0.13 | 0.21 | |||||||||||||||
Intangible Assets | 0.00 | 0.00 | 0.27 | 0.00 | 0.01 | |||||||||||||||
Other Assets | 5.05 | 5.00 | 4.62 | 5.35 | 4.80 | |||||||||||||||
Total Deposits | 86.05 | 85.00 | 83.59 | 75.67 | 75.13 | |||||||||||||||
Borrowed Funds | 6.58 | 5.42 | 6.05 | 6.53 | 11.62 | |||||||||||||||
Other Liabilities | 1.08 | 0.40 | 0.75 | 1.02 | 0.98 | |||||||||||||||
Total Equity | 6.28 | 9.17 | 9.60 | 13.57 | 12.25 | |||||||||||||||
Loan Portfolio(% of total loans) | ||||||||||||||||||||
Residential Mortgage Loans | 86.21 | 27.91 | 49.99 | 39.59 | 38.33 | |||||||||||||||
Other Real Estate Mortgage Loans | 13.03 | 45.76 | 33.37 | 42.47 | 40.35 | |||||||||||||||
Non-mortgage Loans | 0.76 | 26.33 | 16.64 | 13.80 | 16.13 | |||||||||||||||
Growth Rates | ||||||||||||||||||||
Total Assets | 3.48 | 11.02 | 9.48 | 0.95 | 2.36 | |||||||||||||||
Total Loans, Net | (0.77 | ) | 18.49 | 11.01 | 3.90 | 5.34 | ||||||||||||||
Total Deposits | 2.04 | 6.93 | 4.34 | 1.40 | 1.09 | |||||||||||||||
Regulatory Capital Ratios | ||||||||||||||||||||
Tier 1 Leverage Ratio | 6.85 | 8.20 | 8.45 | 11.32 | 11.98 | |||||||||||||||
Tier 1 Risk-based Capital Ratio | 12.30 | 8.95 | 11.70 | 21.23 | 18.05 | |||||||||||||||
Total Risk-based Capital Ratio | 12.84 | 10.20 | 11.97 | 22.29 | 19.43 | |||||||||||||||
Credit Risk Ratios | ||||||||||||||||||||
Non-performing Loans / Total Loans | 2.52 | 0.38 | 1.19 | 2.18 | 2.27 | |||||||||||||||
Non-performing Assets / Total Assets | 1.58 | 0.35 | 0.99 | 1.57 | 1.81 | |||||||||||||||
Reserves / Total Loans | 0.61 | 1.27 | 0.23 | 1.54 | 1.20 | |||||||||||||||
Reserves / Non-performing Loans | 24.07 | 334.00 | 19.31 | 71.53 | 57.66 | |||||||||||||||
| (1) | Assumes completion of the merger and the conversion offering at the midpoint. |
| (2) | Core earnings exclude securities gains, intangibles amortization expense, and non-recurring items. |
Source: Huntingdon Valley Bank; Victory Bancorp; SNL Financial; Feldman Financial.
64
FELDMAN FINANCIAL ADVISORS, INC.
For the LTM ended December 31, 2013, HV Bank’s gains on sale of loans amounted to $1.8 million or 1.12% of average assets. As previously noted, HV Bank also generated gains on sale of securities that amounted to $256,000 or 0.16% of average assets, which exceeded the corresponding production of securities gains and non-recurring income as reflected by the Comparative Group median of 0.00% and All Public Thrift median of 0.01%.
HV Bank’s operating expense ratio at 4.10% of average assets for the LTM period substantially exceeded the Comparative Group median of 3.09% and All Public Thrift median of 2.90%. HV Bank operates a relatively large branch network for a depository institution of its size. HV Bank’s average branch size was $28.1 million in deposits at December 31, 2013, compared to the Comparative Group median branch size of $42.6 million, which presents greater economies of scale opportunities. HV Bank’s efficiency ratio (non-interest expense less intangibles amortization expense as a percent of the sum of net interest income and non-interest operating income) was 103.2% for the recent LTM period, comparing unfavorably to the Comparative Group and All Public Thrift medians of 78.5% and 74.8%, respectively. (The efficiency ratio can be evaluated as the amount of operating expense required to generate a dollar of operating revenue.) Polonia Bancorp at 98.5% and Hamilton Bancorp at 94.4% exhibited the highest efficiency ratios among the Comparative Group companies. On a pro forma basis, HV Bancorp exhibited an efficiency ratio of 93.7%.
HV Bank’s lower net interest margin and higher operating expense ratio place it at a competitive disadvantage in generating profitability levels approaching industry norms. As a result, non-interest income generated primarily from gains on sale of loans and securities have been important sources of revenue to deliver positive earnings. For the LTM period ended December 31, 2013, HV Bank’s net interest income of $4.1 million did not cover its total non- interest expense of $6.5 million. HV Bank’s total non-interest income of $2.4 million for the LTM period narrowed this gap but only delivered marginally breakeven profits for HV Bank.
65
FELDMAN FINANCIAL ADVISORS, INC.
HV Bank’s efficiency ratio was higher (more unfavorable) than each of the corresponding ratios reported by all of the Comparative Group companies. As a noteworthy contrast, it is common for smaller financial institutions to exhibit higher efficiency ratios since economies of scale are more challenging to achieve.
HV Bank historically has recorded moderate levels of provision for loan losses, reflecting a record of satisfactory asset quality and recent trends reflecting modest expansion of its loan portfolio. HV Bank’s provision for loan losses amounted to 0.01% of average assets for the LTM ended December 31, 2013, lower than the Comparative Group median of 0.19% and All Public Thrift median of 0.11%.
Table 25 profiles the overall balance sheet composition of HV Bank versus that of the Comparative Group. HV Bank’s ratio of cash and securities to total assets was 45.9%, measuring above the medians of 28.5% for the Comparative Group and 23.1% for All Public Thrifts. HV Bank’s net total loans amounted to 48.7% of total assets as of December 31, 2013, below the medians of 68.2% for the Comparative Group and 69.8% for All Public Thrifts. HV Bank had no goodwill or other intangible assets on its balance sheet as of December 31, 2013. HV Bank’s 0.35% ratio of real estate owned to total assets slightly exceeded the Comparative Group and All Public Thrift medians of 0.13% and 0.21%, respectively. HV Bank’s level of other assets was comparable to the medians reported by the Comparative Group and All Public Thrifts.
On a pro forma basis as of December 31, 2013, HV Bancorp’s ratio of cash and securities measured 27.6% and paralleled the Comparative Group median of 28.5%. Also, HV Bancorp’s
66
FELDMAN FINANCIAL ADVISORS, INC.
pro forma ratio of loans to assets approximated 67.3% and was similar to the Comparative Group median of 68.2%. As a result of the merger, HV Bancorp will record intangible assets measuring 0.3% of total assets on a pro forma basis as of December 31, 2013.
HV Bank had not made considerable strides toward diversifying its loan portfolio away from the traditional thrift institution model’s reliance on residential mortgages as evidenced by the loan composition data displayed in Table 26. HV Bank’s level of residential mortgage loans (including home equity loans secured by residential properties) measured 86.2% of total loans as of December 31, 2013, compared to the Comparative Group median of 39.6% based on regulatory financial data. HV Bank’s concentration of other real estate mortgage loans, which include commercial real estate mortgages and construction loans, measured 13.0% of total loans and was lower than the Comparative Group median of 42.5% and All Public Thrift median of 40.4%. HV Bank’s ratio of non-mortgage loans, which include commercial business loans and other consumer loans, amounted to 0.8% of total loans and was positioned below the 13.8% and 16.1% medians for the Comparative Group and All Public Thrifts, respectively. Among the Comparative Group companies, Polonia Bancorp and Poage Bankshares also continued to display high concentrations of residential loans at 88.5% and 75.6% of total loans, respectively.
On a pro forma basis, HV Bancorp exhibits a more diverse portfolio than the current HV Bank because of the varied loan mix present at Victory Bank, which reflected loan portfolio concentrations of 27.9% in residential mortgages, 45.8% in other real estate mortgages, and 26.3% of non-mortgage loans as of December 31, 2013. Comparing HV Bank to HV Bancorp on a pro forma basis, the residential mortgage concentration would decrease to 50.0% of total loans at HV Bancorp, while other real estate loans and non-mortgage loans would increase to 33.4% and 16.6%, respectively.
67
FELDMAN FINANCIAL ADVISORS, INC.
HV Bank’s borrowings level at 6.6% of total assets primarily reflected its usage of FHLB advances and repurchase agreements as supplemental funding sources, and was similar to the Comparative Group median of 6.5% but lower than the All Public Thrift median of 11.6%. Largely due to its lower capital level, HV Bank’s ratio of deposits to assets was 86.1% and surpassed the Comparative Group and All Public Thrift medians of 75.7% and 75.1%, respectively.
HV Bank’s restrained loan growth in recent periods is reflected in the comparative growth rates. HV Bank’s loan growth rate measured -0.8% over the LTM period, measuring below the Comparative Group median of 3.9% and All Public Thrift median of 5.3%. HV Bank positive growth rates of assets and deposits that exceeded the corresponding medians for the Comparative Group and All Public Thrifts. The sluggish economic recovery and recent turnaround from mounting credit-related losses forced many financial institutions to emphasize capital preservation and credit remediation over growth objectives. On a pro forma basis, HV Bancorp’s more robust growth rates reflect the steady expansion experienced by Victory Bank since it opened in 2008.
HV Bank’s 1.58% ratio of NPAs to total assets was almost the same as the Comparative Group median of 1.57% and slightly lower than the All Public Thrift median of 1.81%. Four of the Comparative Group companies exhibited higher ratios of NPAs to assets: Wolverine Bancorp at 2.84%, Athens Bancshares at 2.71%, Hamilton Bancorp at 2.49%, and Alliance Bancorp with 2.38%. Polonia Bancorp displayed a ratio of NPAs to assets equal to 1.50%, which closely approximated HV Bank’s NPAs ratio of 1.58% of assets. HV Bank’s ratio of reserve coverage compared unfavorably to the aggregate medians. HV Bank’s 0.61% ratio of reserves to total loans trailed the Comparative Group and All Public Thrift medians of 1.54% and 1.20%, respectively. Additionally, HV Bank’s 24.1% ratio of reserves to NPLs was lower than the Comparative Group and All Public Thrift medians of 71.5% and 57.7%, respectively.
68
FELDMAN FINANCIAL ADVISORS, INC.
In summary, HV Bank’s recent earnings results underperformed the results exhibited by the Comparative Group and All Public Thrift segments. HV Bank’s lower profitability was characterized by a lower net interest margin and relatively high operating expenses, despite reflecting higher levels of non-interest income. Relative to the Comparative Group, HV Bank’s net interest margin is restrained by its high concentration of investment securities and lower level of equity capital. HV Bank’s earnings growth outlook will depend largely on its ability to improve the net interest margin, enhance operating efficiency, and maintain satisfactory asset quality as it attempts to manage and grow the loan portfolio.
For the LTM ended December 31, 2013, Victory Bancorp generated an ROA of 0.52% and an ROE of 5.55%. Victory Bancorp’s strong net interest margin of 4.40% reflected its large concentration of loans to assets and its diversified mix of loans. Victory Bancorp exhibited sound asset quality as represented by its 0.35% ratio of NPAs to total assets. On a pro forma basis giving effect to the merger and the conversion offering at the midpoint, HV Bancorp’s LTM ROA of 0.05% was inferior to the Comparative Group median of 0.42% and its LTM core ROA of 0.08% was below the Comparative Group median of 0.52%. While HV Bancorp’s pro forma asset quality ratios appear more favorable than the Comparative Group’s ratios, its capital levels would continue to fall below the Comparative Group’s medians.
69
FELDMAN FINANCIAL ADVISORS, INC.
Table 21
General Operating Characteristics
As of December 31, 2013
City / State | Ticker | Exchange | No. of Offices | Conversion Offering Date | Total Assets ($000s) | Net Loans ($000s) | Total Deposits ($000s) | Total Equity ($000s) | ||||||||||||||||||
Huntingdon Valley Bank | Huntingdon Valley, PA | NA | NA | 5 | NA | 163,423 | 79,534 | 140,631 | 10,261 | |||||||||||||||||
Victory Bancorp, Inc. | Limerick, PA | NA | NA | 1 | NA | 141,319 | 129,337 | 120,126 | 12,958 | |||||||||||||||||
Pro Forma - HV Bancorp(1) | Huntingdon Valley, PA | NA | NA | 6 | NA | 312,251 | 210,157 | 261,020 | 29,990 | |||||||||||||||||
Comparative Group Average | 317,642 | 200,988 | 229,802 | 47,413 | ||||||||||||||||||||||
Comparative Group Median | 303,027 | 214,815 | 223,282 | 41,124 | ||||||||||||||||||||||
All Public Thrift Average | 2,508,082 | 1,768,604 | 1,680,024 | 315,521 | ||||||||||||||||||||||
All Public Thrift Median | 820,319 | 546,142 | 630,864 | 102,153 | ||||||||||||||||||||||
Comparative Group | ||||||||||||||||||||||||||
Alliance Bancorp, Inc. | Broomall, PA | ALLB | NASDAQ | 8 | 01/18/11 | 425,502 | 298,877 | 345,378 | 70,169 | |||||||||||||||||
Athens Bancshares Corporation | Athens, TN | AFCB | NASDAQ | 7 | 01/07/10 | 294,812 | 226,206 | 248,172 | 41,108 | |||||||||||||||||
Georgetown Bancorp, Inc. | Georgetown, MA | GTWN | NASDAQ | 3 | 07/12/12 | 263,033 | 224,913 | 175,961 | 28,942 | |||||||||||||||||
Hamilton Bancorp, Inc. | Towson, MD | HBK | NASDAQ | 5 | 10/10/12 | 300,470 | 149,330 | 237,123 | 61,474 | |||||||||||||||||
Jacksonville Bancorp, Inc. | Jacksonville, IL | JXSB | NASDAQ | 6 | 07/15/10 | 318,419 | 180,902 | 251,738 | 41,139 | |||||||||||||||||
LSB Financial Corp. | Lafayette, IN | LSBI | NASDAQ | 5 | 02/03/95 | 367,581 | 255,360 | 314,620 | 40,727 | |||||||||||||||||
Poage Bankshares, Inc. | Ashland, KY | PBSK | NASDAQ | 6 | 09/13/11 | 289,230 | 177,395 | 209,440 | 57,658 | |||||||||||||||||
Polonia Bancorp, Inc. | Huntingdon Valley, PA | PBCP | NASDAQ | 6 | 11/13/12 | 305,583 | 204,716 | 201,322 | 40,300 | |||||||||||||||||
Wolverine Bancorp, Inc. | Midland, MI | WBKC | NASDAQ | 4 | 01/20/11 | 297,761 | 260,706 | 172,983 | 60,325 | |||||||||||||||||
WVS Financial Corp. | Pittsburgh, PA | WVFC | NASDAQ | 6 | 11/29/93 | 314,033 | 31,470 | 141,286 | 32,290 | |||||||||||||||||
| (1) | Assumes completion of the merger and the conversion offering at the midpoint. |
Source: Huntingdon Valley Bank; Victory Bancorp; SNL Financial; Feldman Financial.
70
FELDMAN FINANCIAL ADVISORS, INC.
Table 22
Summary Financial Performance Ratios
As of or For the Last Twelve Months Ended December 31, 2013
| Total Assets ($000s) | Total Equity/ Assets (%) | Tang. Equity/ Assets (%) | Total NPAs/ Assets (%) | Net Interest Margin (%) | Effcy. Ratio (%) | LTM ROA (%) | LTM ROE (%) | Core ROA (%) | Core ROE (%) | |||||||||||||||||||||||||||||||
Huntingdon Valley Bank | 163,423 | 6.28 | 6.28 | 1.58 | 2.74 | 103.16 | 0.01 | 0.08 | (0.05 | ) | (0.74 | ) | ||||||||||||||||||||||||||||
Victory Bancorp, Inc. | 141,319 | 9.17 | 9.17 | 0.35 | 4.40 | 74.99 | 0.52 | 5.55 | 0.60 | 6.34 | ||||||||||||||||||||||||||||||
Pro Forma - HV Bancorp(1) | 312,251 | 9.60 | 9.36 | 0.99 | 3.39 | 93.70 | 0.05 | 0.51 | 0.08 | 0.83 | ||||||||||||||||||||||||||||||
Comparative Group Average | 317,642 | 14.96 | 14.80 | 1.68 | 3.26 | 80.47 | 0.40 | 2.86 | 0.44 | 3.04 | ||||||||||||||||||||||||||||||
Comparative Group Median | 303,027 | 13.57 | 13.54 | 1.57 | 3.35 | 78.54 | 0.42 | 2.52 | 0.52 | 2.57 | ||||||||||||||||||||||||||||||
All Public Thrift Average | 2,508,082 | 13.11 | 12.45 | 2.43 | 3.24 | 75.09 | 0.55 | 4.27 | 0.55 | 4.27 | ||||||||||||||||||||||||||||||
All Public Thrift Median | 820,319 | 12.25 | 11.20 | 1.81 | 3.27 | 74.79 | 0.58 | 4.68 | 0.58 | 4.46 | ||||||||||||||||||||||||||||||
Comparative Group | ||||||||||||||||||||||||||||||||||||||||
Alliance Bancorp, Inc. | 425,502 | 16.49 | 16.49 | 2.38 | 3.36 | 79.44 | 0.32 | 1.80 | 0.32 | 1.80 | ||||||||||||||||||||||||||||||
Athens Bancshares Corporation | 294,812 | 13.94 | 13.89 | 2.71 | 4.19 | 77.63 | 0.78 | 5.23 | 0.80 | 5.34 | ||||||||||||||||||||||||||||||
Georgetown Bancorp, Inc. | 263,033 | 11.00 | 11.00 | 1.20 | 3.86 | 81.45 | 0.32 | 2.46 | 0.32 | 2.46 | ||||||||||||||||||||||||||||||
Hamilton Bancorp, Inc. | 300,470 | 20.46 | 19.70 | 2.49 | 2.79 | 94.44 | (0.38 | ) | (1.86 | ) | (0.44 | ) | (2.14 | ) | ||||||||||||||||||||||||||
Jacksonville Bancorp, Inc. | 318,419 | 12.92 | 12.17 | 1.40 | 3.51 | 72.91 | 1.02 | 7.51 | 0.85 | 6.26 | ||||||||||||||||||||||||||||||
LSB Financial Corp. | 367,581 | 11.08 | 11.08 | 1.64 | 3.30 | 69.40 | 0.70 | 6.37 | 0.70 | 6.37 | ||||||||||||||||||||||||||||||
Poage Bankshares, Inc. | 289,230 | 19.93 | 19.93 | 0.45 | 3.35 | 82.97 | 0.52 | 2.67 | 0.51 | 2.65 | ||||||||||||||||||||||||||||||
Polonia Bancorp, Inc. | 305,583 | 13.19 | 13.19 | 1.50 | 3.13 | 98.48 | (0.09 | ) | (0.60 | ) | 0.56 | 2.65 | ||||||||||||||||||||||||||||
Wolverine Bancorp, Inc. | 297,761 | 20.26 | 20.26 | 2.84 | 3.60 | 73.15 | 0.54 | 2.48 | 0.54 | 2.48 | ||||||||||||||||||||||||||||||
WVS Financial Corp. | 314,033 | 10.28 | 10.28 | 0.20 | 1.52 | 74.79 | 0.29 | 2.55 | 0.28 | 2.50 | ||||||||||||||||||||||||||||||
| (1) | Assumes completion of the merger and the conversion offering at the midpoint. |
Source: Huntingdon Valley Bank; Victory Bancorp; SNL Financial; Feldman Financial.
71
FELDMAN FINANCIAL ADVISORS, INC.
Table 23
Income and Expense Analysis
For the Last Twelve Months Ended December 31, 2013
| As a Percent of Average Assets | ||||||||||||||||||||||||||||||||||||||||
| Total Interest Income | Total Interest Expense | Net Interest Income | Other Oper. Income | Sec. Gains & Non-rec. Income | Loan Loss Prov. | Gen. & Admin. Expense | Amort. & Imp. Intang, | Non-rec. Expense | Pretax Core Earnings | |||||||||||||||||||||||||||||||
Huntingdon Valley Bank | 3.17 | 0.57 | 2.60 | 1.37 | 0.16 | 0.01 | 4.10 | 0.00 | 0.08 | (0.13 | ) | |||||||||||||||||||||||||||||
Victory Bancorp, Inc. | 5.03 | 0.76 | 4.27 | 0.68 | 0.03 | 0.26 | 3.71 | 0.00 | 0.15 | 0.98 | ||||||||||||||||||||||||||||||
Pro Forma - HV Bancorp(1) | 3.82 | 0.61 | 3.21 | 0.93 | 0.10 | 0.12 | 3.97 | 0.04 | 0.11 | 0.05 | ||||||||||||||||||||||||||||||
Comparative Group Average | 3.78 | 0.69 | 3.09 | 0.84 | 0.04 | 0.22 | 3.19 | 0.00 | 0.00 | 0.52 | ||||||||||||||||||||||||||||||
Comparative Group Median | 3.84 | 0.65 | 3.17 | 0.71 | 0.00 | 0.19 | 3.09 | 0.00 | 0.00 | 0.51 | ||||||||||||||||||||||||||||||
All Public Thrift Average | 3.70 | 0.71 | 3.00 | 1.03 | 0.05 | 0.15 | 3.12 | 0.01 | 0.04 | 0.76 | ||||||||||||||||||||||||||||||
All Public Thrift Median | 3.68 | 0.65 | 3.03 | 0.68 | 0.01 | 0.11 | 2.90 | 0.00 | 0.00 | 0.88 | ||||||||||||||||||||||||||||||
Comparative Group | ||||||||||||||||||||||||||||||||||||||||
Alliance Bancorp, Inc. | 3.73 | 0.55 | 3.18 | 0.17 | 0.00 | 0.20 | 2.66 | 0.00 | 0.00 | 0.49 | ||||||||||||||||||||||||||||||
Athens Bancshares Corporation | 4.63 | 0.72 | 3.90 | 1.75 | 0.00 | 0.11 | 4.39 | 0.03 | 0.00 | 1.16 | ||||||||||||||||||||||||||||||
Georgetown Bancorp, Inc. | 4.22 | 0.51 | 3.70 | 0.74 | 0.00 | 0.31 | 3.63 | 0.00 | 0.00 | 0.50 | ||||||||||||||||||||||||||||||
Hamilton Bancorp, Inc. | 3.24 | 0.65 | 2.59 | 0.22 | 0.08 | 0.88 | 2.72 | 0.01 | 0.00 | (0.79 | ) | |||||||||||||||||||||||||||||
Jacksonville Bancorp, Inc. | 3.83 | 0.57 | 3.27 | 1.13 | 0.29 | 0.05 | 3.20 | 0.00 | 0.02 | 1.14 | ||||||||||||||||||||||||||||||
LSB Financial Corp. | 3.82 | 0.65 | 3.16 | 1.09 | 0.00 | 0.18 | 2.97 | 0.00 | 0.00 | 1.11 | ||||||||||||||||||||||||||||||
Poage Bankshares, Inc. | 3.85 | 0.69 | 3.16 | 0.47 | 0.01 | 0.04 | 3.08 | 0.00 | 0.00 | 0.51 | ||||||||||||||||||||||||||||||
Polonia Bancorp, Inc. | 3.90 | 0.94 | 2.96 | 2.02 | 0.01 | 0.21 | 4.90 | 0.00 | 0.00 | (0.13 | ) | |||||||||||||||||||||||||||||
Wolverine Bancorp, Inc. | 4.61 | 1.10 | 3.52 | 0.68 | 0.00 | 0.29 | 3.09 | 0.00 | 0.00 | 0.81 | ||||||||||||||||||||||||||||||
WVS Financial Corp. | 1.98 | 0.48 | 1.49 | 0.17 | 0.01 | (0.04 | ) | 1.25 | 0.00 | 0.00 | 0.45 | |||||||||||||||||||||||||||||
| (1) | Assumes completion of the merger and the conversion offering at the midpoint. |
Source: Huntingdon Valley Bank; Victory Bancorp; SNL Financial; Feldman Financial.
72
FELDMAN FINANCIAL ADVISORS, INC.
Table 24
Yield-Cost Structure and Growth Rates
For the Last Twelve Months Ended December 31, 2013
| Avg. Earning Assets/ Assets | Avg. Funding Liabs./ Assets | Avg. Net Earning Assets/ Assets | Avg. Equity/ Assets | Yield on Earning Assets | Cost of Funding Liabs. | Net Interest Spread | Asset Growth Rate | Loan Growth Rate | Deposit Growth Rate | |||||||||||||||||||||||||||||||
Huntingdon Valley Bank | 95.00 | 93.48 | 1.51 | 6.99 | 3.34 | 0.61 | 2.73 | 3.48 | (0.77 | ) | 2.04 | |||||||||||||||||||||||||||||
Victory Bancorp, Inc. | 94.24 | 89.02 | 5.22 | 9.40 | 5.34 | 0.85 | 4.49 | 11.02 | 18.49 | 6.93 | ||||||||||||||||||||||||||||||
Pro Forma - HV Bancorp(1) | 94.80 | 89.37 | 5.43 | 10.16 | 4.03 | 0.69 | 3.35 | 9.48 | 11.01 | 4.34 | ||||||||||||||||||||||||||||||
Comparative Group Average | 95.07 | 83.26 | 11.81 | 15.79 | 3.98 | 0.83 | 3.15 | 1.70 | 8.16 | (2.99 | ) | |||||||||||||||||||||||||||||
Comparative Group Median | 94.61 | 84.22 | 10.36 | 14.93 | 4.09 | 0.78 | 3.25 | 0.95 | 3.90 | 1.40 | ||||||||||||||||||||||||||||||
All Public Thrift Average | 93.26 | 85.62 | 7.64 | 13.30 | 4.00 | 0.83 | 3.17 | 3.17 | 5.48 | 1.89 | ||||||||||||||||||||||||||||||
All Public Thrift Median | 93.79 | 86.17 | 7.42 | 12.73 | 3.98 | 0.77 | 3.23 | 2.36 | 5.34 | 1.09 | ||||||||||||||||||||||||||||||
Comparative Group | ||||||||||||||||||||||||||||||||||||||||
Alliance Bancorp, Inc. | 94.74 | 80.95 | 13.79 | 17.58 | 3.94 | 0.68 | 3.26 | (7.68 | ) | 7.17 | (6.92 | ) | ||||||||||||||||||||||||||||
Athens Bancshares Corporation | 93.14 | 83.57 | 9.57 | 14.92 | 4.97 | 0.86 | 4.10 | 1.09 | 4.11 | 5.94 | ||||||||||||||||||||||||||||||
Georgetown Bancorp, Inc. | 96.09 | 85.20 | 10.89 | 13.05 | 4.39 | 0.60 | 3.79 | 24.31 | 22.77 | 13.94 | ||||||||||||||||||||||||||||||
Hamilton Bancorp, Inc. | 92.97 | 78.67 | 14.31 | 20.55 | 3.49 | 0.83 | 2.66 | (10.25 | ) | 22.77 | (10.42 | ) | ||||||||||||||||||||||||||||
Jacksonville Bancorp, Inc. | 93.13 | 85.47 | 7.66 | 13.58 | 4.12 | 0.66 | 3.46 | (0.94 | ) | 3.69 | (2.62 | ) | ||||||||||||||||||||||||||||
LSB Financial Corp. | 95.81 | 88.37 | 7.44 | 11.05 | 3.98 | 0.74 | 3.24 | 0.81 | (9.32 | ) | 1.94 | |||||||||||||||||||||||||||||
Poage Bankshares, Inc. | 94.47 | 79.63 | 14.84 | 19.43 | 4.07 | 0.87 | 3.20 | (32.17 | ) | (2.37 | ) | (44.09 | ) | |||||||||||||||||||||||||||
Polonia Bancorp, Inc. | 94.35 | 84.87 | 9.47 | 14.94 | 4.13 | 1.11 | 3.02 | 14.25 | 37.07 | 2.34 | ||||||||||||||||||||||||||||||
Wolverine Bancorp, Inc. | 97.68 | 77.35 | 20.33 | 21.60 | 4.72 | 1.42 | 3.30 | 4.37 | 1.65 | 9.09 | ||||||||||||||||||||||||||||||
WVS Financial Corp. | 98.32 | 88.50 | 9.83 | 11.23 | 2.01 | 0.54 | 1.47 | 23.24 | (5.96 | ) | 0.87 | |||||||||||||||||||||||||||||
| (1) | Assumes completion of the merger and the conversion offering at the midpoint. |
Source: Huntingdon Valley Bank; Victory Bancorp; SNL Financial; Feldman Financial.
73
FELDMAN FINANCIAL ADVISORS, INC.
Table 25
Balance Sheet Composition
As of December 31, 2013
| As a Percent of Total Assets | ||||||||||||||||||||||||||||||||||||||||
| Cash & Securities | Net Loans | Real Est. Owned | Intang. Assets | Other Assets | Total Deposits | Borrowed Funds | Other Liabs. | Total Liabs. | Total Equity | |||||||||||||||||||||||||||||||
Huntingdon Valley Bank | 45.93 | 48.67 | 0.35 | 0.00 | 5.05 | 86.05 | 6.58 | 1.08 | 93.72 | 6.28 | ||||||||||||||||||||||||||||||
Victory Bancorp, Inc. | 3.48 | 91.52 | 0.00 | 0.00 | 5.00 | 85.00 | 5.42 | 0.40 | 90.83 | 9.17 | ||||||||||||||||||||||||||||||
Pro Forma - HV Bancorp(1) | 27.63 | 67.30 | 0.18 | 0.27 | 4.62 | 83.59 | 6.05 | 0.75 | 90.40 | 9.60 | ||||||||||||||||||||||||||||||
Comparative Group Average | 33.33 | 63.44 | 0.24 | 0.19 | 2.81 | 71.72 | 12.25 | 1.08 | 85.04 | 14.96 | ||||||||||||||||||||||||||||||
Comparative Group Median | 28.52 | 68.23 | 0.13 | 0.00 | 5.35 | 75.67 | 6.53 | 1.02 | 86.43 | 13.57 | ||||||||||||||||||||||||||||||
All Public Thrift Average | 26.40 | 67.41 | 0.40 | 0.68 | 5.11 | 73.39 | 12.27 | 1.23 | 86.89 | 13.11 | ||||||||||||||||||||||||||||||
All Public Thrift Median | 23.11 | 69.84 | 0.21 | 0.01 | 4.80 | 75.13 | 11.62 | 0.98 | 87.75 | 12.25 | ||||||||||||||||||||||||||||||
Comparative Group | ||||||||||||||||||||||||||||||||||||||||
Alliance Bancorp, Inc. | 23.56 | 70.24 | 0.75 | 0.00 | 5.45 | 81.17 | 0.81 | 1.53 | 83.51 | 16.49 | ||||||||||||||||||||||||||||||
Athens Bancshares Corporation | 17.08 | 76.73 | 0.14 | 0.07 | 5.98 | 84.18 | 0.44 | 1.43 | 86.06 | 13.94 | ||||||||||||||||||||||||||||||
Georgetown Bancorp, Inc. | 10.85 | 85.51 | 0.00 | 0.00 | 3.64 | 66.90 | 20.88 | 1.22 | 89.00 | 11.00 | ||||||||||||||||||||||||||||||
Hamilton Bancorp, Inc. | 42.61 | 49.70 | 0.56 | 0.95 | 6.18 | 78.92 | 0.00 | 0.62 | 79.54 | 20.46 | ||||||||||||||||||||||||||||||
Jacksonville Bancorp, Inc. | 36.52 | 56.81 | 0.56 | 0.86 | 5.25 | 79.06 | 6.16 | 1.86 | 87.08 | 12.92 | ||||||||||||||||||||||||||||||
LSB Financial Corp. | 24.98 | 69.47 | 0.00 | 0.00 | 5.54 | 85.59 | 2.72 | 0.61 | 88.92 | 11.08 | ||||||||||||||||||||||||||||||
Poage Bankshares, Inc. | 32.74 | 61.33 | 0.13 | 0.00 | 5.80 | 72.41 | 6.90 | 0.75 | 80.07 | 19.93 | ||||||||||||||||||||||||||||||
Polonia Bancorp, Inc. | 28.15 | 66.99 | 0.12 | 0.00 | 4.73 | 65.88 | 19.31 | 1.62 | 86.81 | 13.19 | ||||||||||||||||||||||||||||||
Wolverine Bancorp, Inc. | 28.89 | 87.56 | 0.09 | 0.00 | (16.54 | ) | 58.09 | 20.82 | 0.83 | 79.74 | 20.26 | |||||||||||||||||||||||||||||
WVS Financial Corp. | 87.95 | 10.02 | 0.00 | 0.00 | 2.03 | 44.99 | 44.44 | 0.29 | 89.72 | 10.28 | ||||||||||||||||||||||||||||||
| (1) | Assumes completion of the merger and the conversion offering at the midpoint. |
Source: Huntingdon Valley Bank; Victory Bancorp; SNL Financial; Feldman Financial.
74
FELDMAN FINANCIAL ADVISORS, INC.
Table 26
Regulatory Capital, Credit Risk, and Loan Composition
As of or For the Last Twelve Months Ended December 31, 2013
| Tier 1 Leverage Capital Ratio | Tier 1 Risk- based Capital | Total Risk- based Capital | NPLs/ Loans | Total NPAs/ Assets | Resrvs./ NPLs | Resrvs./ Loans | Resid. 1-4 Mtgs./ Loans | Other Real Est. Mtgs./ Loans | Non-mtg. Loans/ Loans | |||||||||||||||||||||||||||||||
Huntingdon Valley Bank | 6.85 | 12.30 | 12.84 | 2.52 | 1.58 | 24.07 | 0.61 | 86.21 | 13.03 | 0.76 | ||||||||||||||||||||||||||||||
Victory Bancorp, Inc. | 8.20 | 8.95 | 10.20 | 0.38 | 0.35 | 334.00 | 1.27 | 27.91 | 45.76 | 26.33 | ||||||||||||||||||||||||||||||
Pro Forma - HV Bancorp(1) | 8.45 | 11.70 | 11.97 | 1.19 | 0.99 | 19.31 | 0.23 | 49.99 | 33.37 | 16.64 | ||||||||||||||||||||||||||||||
Comparative Group Average | 12.92 | 21.13 | 22.24 | 2.18 | 1.68 | 83.14 | 1.56 | 45.69 | 40.25 | 14.06 | ||||||||||||||||||||||||||||||
Comparative Group Median | 11.32 | 21.23 | 22.29 | 2.18 | 1.57 | 71.53 | 1.54 | 39.59 | 42.47 | 13.80 | ||||||||||||||||||||||||||||||
All Public Thrift Average | 12.44 | 19.35 | 20.52 | 2.98 | 2.43 | 75.38 | 1.38 | 40.09 | 41.73 | 18.70 | ||||||||||||||||||||||||||||||
All Public Thrift Median | 11.98 | 18.05 | 19.43 | 2.27 | 1.81 | 57.66 | 1.20 | 38.33 | 40.35 | 16.13 | ||||||||||||||||||||||||||||||
Comparative Group | ||||||||||||||||||||||||||||||||||||||||
Alliance Bancorp, Inc. | 13.25 | 20.87 | 22.12 | 2.08 | 2.38 | 67.15 | 1.40 | 36.86 | 54.36 | 8.78 | ||||||||||||||||||||||||||||||
Athens Bancshares Corporation | 10.84 | 15.74 | 17.01 | 3.26 | 2.71 | 59.01 | 1.92 | 38.33 | 45.62 | 16.04 | ||||||||||||||||||||||||||||||
Georgetown Bancorp, Inc. | 9.70 | 13.10 | 14.30 | 1.39 | 1.20 | 75.92 | 1.05 | 40.85 | 44.60 | 14.55 | ||||||||||||||||||||||||||||||
Hamilton Bancorp, Inc. | 15.30 | 26.80 | 28.05 | 3.58 | 2.49 | 46.81 | 1.68 | 48.35 | 31.26 | 20.40 | ||||||||||||||||||||||||||||||
Jacksonville Bancorp, Inc. | 11.51 | 16.89 | 18.15 | 2.27 | 1.40 | 81.52 | 1.85 | 23.88 | 40.35 | 35.77 | ||||||||||||||||||||||||||||||
LSB Financial Corp. | 11.00 | 16.10 | 17.40 | 2.30 | 1.64 | 105.47 | 2.43 | 37.56 | 52.56 | 9.87 | ||||||||||||||||||||||||||||||
Poage Bankshares, Inc. | 16.16 | 30.87 | 32.12 | 0.52 | 0.45 | 206.05 | 1.06 | 75.56 | 11.39 | 13.05 | ||||||||||||||||||||||||||||||
Polonia Bancorp, Inc. | 11.12 | 21.59 | 22.46 | 2.09 | 1.50 | 31.93 | 0.67 | 88.54 | 8.56 | 2.89 | ||||||||||||||||||||||||||||||
Wolverine Bancorp, Inc. | 19.60 | 24.60 | 25.90 | 2.31 | 2.84 | 122.39 | 2.83 | 18.63 | 77.66 | 3.71 | ||||||||||||||||||||||||||||||
WVS Financial Corp. | 10.70 | 24.70 | 24.90 | 1.98 | 0.20 | 35.14 | 0.69 | 48.35 | 36.14 | 15.52 | ||||||||||||||||||||||||||||||
| (1) | Assumes completion of the merger and the conversion offering at the midpoint. |
Source: Huntingdon Valley Bank; Victory Bancorp; SNL Financial; Feldman Financial.
75
FELDMAN FINANCIAL ADVISORS, INC.
III. MARKET VALUE ADJUSTMENTS
General Overview
This concluding chapter of the Appraisal identifies certain additional adjustments to the HV Bancorp’s estimated pro forma market value relative to the Comparative Group selected in Chapter II. The adjustments discussed in this chapter are made from the viewpoints of potential investors, which would include depositors holding subscription rights and unrelated parties who may purchase stock in a community offering. It is assumed that these potential investors are aware of all relevant and necessary facts as they would pertain to the value of HV Bank relative to other publicly traded thrift institutions and relative to alternative investments.
Our appraised value is predicated on a continuation of the current operating environment for HV Bank and thrift institutions in general. Changes in HV Bank’s operating performance along with changes in the local and national economy, the stock market, interest rates, the regulatory environment, and other external factors may occur from time to time, often with great unpredictability, which could impact materially the pro forma market value of HV Bancorp or thrift stocks in general. Therefore, the Valuation Range provided herein is subject to a more current re-evaluation prior to the actual completion of the conversion.
In addition to the comparative operating fundamentals discussed in Chapter II, it is important to address additional market value adjustments based on certain financial and other criteria, which include, among other factors:
| (1) | Earnings Prospects |
| (2) | Financial Condition |
| (3) | Market Area |
| (4) | Management |
| (5) | Dividend Policy |
| (6) | Liquidity of the Issue |
76
FELDMAN FINANCIAL ADVISORS, INC.
| (7) | Subscription Interest |
| (8) | Recent Acquisition Activity |
| (9) | Effect of Government Regulations and Regulatory Reform |
| (10) | Stock Market Conditions |
Earnings Prospects
Earnings prospects are dependent upon the sensitivity of asset yields and liability costs to changes in market rates, the credit quality of assets, the stability of non-interest components of income and expense, and the ability to leverage the balance sheet. Each of the foregoing is an important factor for investors in assessing earnings prospects. HV Bank has reported low profitability for much of the past ten years due to a combination of earnings fundamentals reflecting a relatively narrow net interest margin and above-average operating expense. Non-interest income, mainly comprising gains on sales of loans and investments, has become an important factor in more recent years toward delivering positive earnings results.
HV Bank recorded net income of $123,000 or ROA of 0.08% for the fiscal year ended June 30, 2013 and net income of $55,000 or annualized ROA of 0.07% for the six months ended December 31, 2013. For the LTM ended December 31, 2013, HV Bank’s net income amounted to $9,000 or an ROA of 0.01%, which trailed the Comparative Group median of 0.42% and All Public Thrift median of 0.58%. On a core earnings basis, HV Bank’s core ROA of -0.05% was positioned farther below the Comparative Group median of 0.52% and All Public Thrift median of 0.58%. HV Bank’s earnings components underperformed the Comparative Group in the areas of net interest income and non-interest expense, and surpassed the Comparative Group in the production of non-interest revenue. HV Bank’s net interest margin of 2.74% fell below the Comparative Group median of 3.35%, while its operating expense ratio of 4.10% relative to average assets exceeded the Comparative Group median of 3.09%.
77
FELDMAN FINANCIAL ADVISORS, INC.
The merger is expected to improve HV Bank’s earnings outlook. The lending functions of each institution are very complementary, combining HV Bank’s residential lending and mortgage banking operations with Victory Bancorp’s small business commercial banking operations. HV Bank is expected to incorporate Victory Bancorp’s existing banking platform, which includes enhanced electronic delivery systems and technology that provides additional opportunities for operating efficiency, greater productivity, and expanded revenue. HV Bank will be able to introduce new business banking deposit products that can be marketed across its customer base and over the expanded market area coverage of the combined branch network.
On a pro forma basis giving effect to the merger and conversion at the midpoint of the offering range, HV Bancorp’s LTM ROA is estimated at 0.05% versus the historical LTM ROA of 0.01% for HV Bank. Similarly, HV Bancorp’s pro forma LTM core ROA is estimated at 0.08% versus the historical LTM core ROA of -0.05% for HV Bank. The improvement in earnings results is restrained by the impact of increased operating expense associated with the stock benefit compensation plans and the effect of fair value accounting adjustments. In addition, the pro forma earnings results are calculated based on historical data and do not take into account any potential operating cost savings or increased revenue opportunities. While the overall benefits of the merger should enhance HV Bancorp’s earnings prospects over time, these benefits are partially offset in the near term by the aforementioned factors as well as the added expense and integration risk to consolidate the operations of HV Bank and Victory Bancorp. Furthermore, the transformation of the earnings fundamentals presently in place at HV Bank will require a phase-in period to attain the improvements that translate into increased profitability for HV Bancorp. Therefore, we believe that the earnings outlook for HV Bancorp would continue to warrant a downward adjustment relative to the Comparative Group.
78
FELDMAN FINANCIAL ADVISORS, INC.
Financial Condition
As discussed and summarized in Chapter I, HV Bank’s overall balance sheet reflects a sizeable concentration of investment securities and a loan portfolio overwhelmingly composed of residential single-family mortgages. HV Bank’s high level of liquidity is evidenced by a 45.9% ratio of cash and securities to total assets, compared to the corresponding Comparative Group median of 28.5%. On a pro forma basis following the merger with Victory Bancorp, whose balance sheet is concentrated largely in loans, HV Bancorp’s liquidity would decline to a level approaching that of the Comparative Group median and its loan concentration would expand commensurately. In addition, HV Bancorp’s pro forma loan portfolio would encompass a more diverse mix of loans, including increased holdings of commercial real estate and commercial business loans.
Concurrently, HV Bank’s asset quality would remain at satisfactory levels based on historical data as of December 31, 2013. HV Bank’s 1.58% ratio of NPAs to total assets was similar to the Comparative Group median of 1.57%, and is calculated at 0.99% on a pro forma basis including Victory Bancorp. In addition, the interest rate risk exposure stemming from HV Bank’s fixed-rate residential loan and investment portfolio can be mitigated through the addition of new capital from the conversion and from Victory Bancorp’s commercial loan portfolio that features shorter-term repricing characteristics. Before the infusion of net capital proceeds, HV Bank’s ratio of tangible equity to assets was 6.28% and below the Comparative Group median of 13.54%. On a pro forma basis, the ratio of tangible equity to assets is expected to improve for HV Bancorp but still trail the Comparative Group median due to the immediate capital leverage related to the addition of Victory Bancorp’s asset base. In addition, the post-merger capital level of HV Bancorp may restrain implementation of any future growth plans in the near term.
79
FELDMAN FINANCIAL ADVISORS, INC.
The selection criteria for the Comparative Group resulted in a collection of companies with solid capital positions and generally satisfactory asset quality. We believe that the balance sheet, asset quality, and capitalization fundamentals of HV Bancorp on a pro forma basis are largely similar to that of the Comparative Group. Therefore, on the whole, we believe that no additional adjustment is warranted for financial condition relative to the Comparative Group.
Market Area
The members of the Comparative Group were drawn primarily from the Mid-Atlantic and Midwest regions of the country. The selection criteria parameters produced three public companies operating in HV Bank’s home state of Pennsylvania (Alliance Bancorp, Polonia Bancorp, and WVS Financial Corp.). Polonia Bancorp is based in Huntingdon Valley, Pennsylvania, similar to HV Bank and the headquarters locations of both financial institutions are located approximately two miles apart. In addition, two companies were selected from the Southeast and one from New England.
The Comparative Group companies are characterized by a cross-section of market areas that encompass suburban and urban locations in smaller to larger metropolitan areas with relatively stable economies and moderate population growth prospects, very similar to that experienced by HV Bank’s market area. Demographic data for HV Bank’s primary market area in Montgomery and Bucks counties reflect a trend of above-average household income and below-average unemployment rates. We do not believe that HV Bank’s market area conditions overall are notably different from those facing most of the companies in the Comparative Group, whose metropolitan areas include Baltimore, Boston, Philadelphia, and Pittsburgh. Based on these factors, we believe that no additional adjustment is warranted for market area.
80
FELDMAN FINANCIAL ADVISORS, INC.
Management
Management’s principal challenges are to generate profitable results, monitor credit risks, and control operating costs while HV Bank competes in an increasingly challenging financial services environment. The normal challenges facing HV Bank in attempting to deliver earnings growth and enhance its competitiveness remain paramount as it attempts to leverage the stock offering proceeds and accomplish the integration of Victory Bancorp’s operations following the closing of the merger.
HV Bancorp plans to assemble a senior management team comprising individuals from HV Bank and Victory Bancorp. Travis J. Thompson, current President and Chief Executive Officer (“CEO”) of HV Bank, will become Chairman of HV Bancorp and Executive Chairman of HV Bank. Joseph W. Major, current President and CEO of Victory Bancorp, will become President and CEO of HV Bancorp and President and CEO of HV Bank upon consummation of the merger. Joseph C. O’Neill, Jr., current Chief Financial Officer (“CFO”) of HV Bank, will become the CFO of HV Bancorp and HV Bank following the merger. Also after the merger, the executive positions at HV Bank of Chief Operating Officer, Chief Lending Officer, and Chief Credit Officer will be assumed by individuals who are current partly of the management team at Victory Bank.
As reflected by the historical performance of both HV Bank and Victory Bancorp, we believe that investors will take into account that HV Bancorp can be professionally and capably managed by this experienced management team. Investors will likely rely upon actual earnings results as the means of evaluating the future performance of HV Bancorp’s management as the combined organization pursues its earnings and growth objectives following the completion of the conversion and merger. Therefore, based on these considerations, we believe no adjustment is warranted relative to the Comparative Group for this factor.
81
FELDMAN FINANCIAL ADVISORS, INC.
Dividend Policy
Following the conversion, the Board of Directors of HV Bancorp will consider adopting a policy of paying regular cash dividends on the outstanding common stock. However, there is no guarantee that HV Bancorp will pay cash dividends or that, if paid, dividends will not be reduced or eliminated in the future. The Board may declare and pay periodic special cash dividends in addition to, or in lieu of, regular cash dividends. In determining whether to declare or pay any dividends, whether regular or special, the Board will take into account HV Bancorp’s and HV Bank’s financial condition and operating results, tax considerations, capital requirements, industry standards, applicable regulatory guidelines, and economic conditions.
Any HV Bancorp preferred stock, including the SBLF preferred stock assumed from Victory Bancorp, will have priority over common stock with respect to dividends and distribution of assets, but will rank junior to all outstanding indebtedness for borrowed money. Interest payments on HV Bancorp subordinated debt securities will rank senior to dividend payments on all capital stock.
Payment of cash dividends has become commonplace among publicly traded thrifts with relatively high capital levels. Of the ten members of the Comparative Group, seven currently pay regular cash dividends. The average dividend yield of the Comparative Group was 0.89% and the median was 1.17% as of April 15, 2014. The average dividend yield of the All Public Thrift aggregate was 1.46% and the median was 1.35% as of April 15, 2014. Although HV Bancorp has yet to establish a policy of paying regular cash dividends, we believe that investors will take note of HV Bancorp’s capital structure and determine that the dividend preference
82
FELDMAN FINANCIAL ADVISORS, INC.
assigned to the preferred stock issue, along with the resulting capital leverage position and growth objectives of HV Bancorp, may forestall the payment of regular cash dividends on the common stock. While thrift stocks are not generally bought and sold based on the underlying dividend yield, we do believe that this restraining factor on potential dividend capacity warrants a slight downward adjustment.
Liquidity of the Issue
With the increased number of market makers and institutional investors following thrift stocks, the majority of thrift stock conversions are able to develop a public market for their new stock issues. Most publicly traded thrift stocks continue to be traded on the NASDAQ market. All of the ten members of the Comparative Group are listed on the NASDAQ market. In conjunction with the conversion, HV Bancorp will apply to have its common stock listed on the NASDAQ market.
The number of active buyers and sellers of shares of common stock at any particular time may be limited, which may have an adverse effect on the price at which shares of common stock can be sold. The development of a public market having the desirable characteristics of depth, liquidity, and orderliness is facilitated by trading on an active exchange such as the NASDAQ market. Therefore, we have concluded the no adjustment to HV Bancorp’s pro forma market value is warranted for anticipated liquidity of its common stock issue.
Subscription Interest
HV Bank has retained the services of Griffin Financial Group to assist in the marketing and sale of the stock offering. HV Bank’s ESOP intends to purchase in the subscription offering an amount of common shares equal to 6.0% of the total shares to be outstanding, including shares issued Victory Bancorp’s shareholders in the merger. HV Bank expects its trustees,
83
FELDMAN FINANCIAL ADVISORS, INC.
executive officers, and their associates, to purchase 120,000 shares of common stock in the offering for an aggregate amount of $1.2 million based on a $10.00 offering price per share. Except for the ESOP, no person may purchase in the aggregate more than 5% of the shares sold in the conversion offering. Similarly, no person or entity, together with associates or persons acting in concert with such person or entity, may purchase more than 5% of the total shares sold in the conversion offering. The minimum purchase in the conversion offering will be 25 shares or an aggregate amount of $250.
If any shares remain available for purchase after satisfaction of all orders from eligible subscribers in the subscription offering, HV Bancorp may offer shares to the general public in a community offering. In the community offering, preference will be granted first to natural persons residing in Montgomery, Bucks, and Philadelphia counties in Pennsylvania, and then to the general public. If necessary, any shares of common stock not purchased in the subscription offering and community offering may be offered for sale to the general public in a syndicated offering to be managed by Griffin Financial Group in conjunction with other registered broker-dealers.
Recent subscription interest in thrift stock conversion offerings has been solid and broad-based. Three standard full conversion offerings were completed in calendar 2013 and two have been completed thus far in 2014. In addition, a growing number of companies have filed regulatory applications in 2014 to undertake mutual to stock conversion offerings. Subscription interest in thrift conversion stocks is cyclical and influenced by general stock market conditions and the overall economic outlook. Of the five standard conversion offerings completed in the past twelve months, three were closed at the adjusted maximum of the range and reflected oversubscriptions in the subscription and/or community offerings. We are not currently aware of
84
FELDMAN FINANCIAL ADVISORS, INC.
any meaningful market evidence or specific characteristics that might help predict the likely level of interest in the subscription offering of HV Bancorp. Accordingly, absent actual results of the subscription offering, we believe that subscription interest is currently a neutral factor and at present requires no further adjustment.
Recent Acquisition Activity
Table 27 summarizes recent acquisition activity involving banks and thrifts based in Pennsylvania. S&T Bancorp, Susquehanna Bancshares, and ESSA Bancorp have been among the most active acquirers of banks and thrifts in Pennsylvania. The largest recent acquisition of a Pennsylvania bank or thrift involved the completed purchase in February 2012 of Tower Bancorp (total assets of $2.6 billion) by Susquehanna Bancshares. A number of mid-sized banks and thrifts, ranging in asset size from $300 million to $1 billion, have also been acquired recently.
Many bank and thrift acquisition transactions nationwide during the 2009 to 2012 period were characterized by sellers experiencing financial difficulties and subsequently being acquired or recapitalized in change of control transactions at prices near or below book value. However, acquisition valuations can vary widely according to the financial profile of the seller and trends in underlying trading market valuations. Certain provisions in the articles of incorporation and bylaws of HV Bancorp and specific banking regulations or approval conditions may prevent or make more difficult an involuntary acquisition of HV Bancorp. Accordingly, at the present time, we do not believe that potential acquisition premiums are a significant factor to consider in determining the estimated pro forma market value of HV Bancorp.
85
FELDMAN FINANCIAL ADVISORS, INC.
Table 27
Summary of Recent Pennsylvania Bank and Thrift Acquisition Activity
Transactions Announced Since January 1, 2011 to April 15, 2014
| Seller’s Prior Financial Data | Offer Value to | |||||||||||||||||||||||||||||||||||||||||||||||||
Buyer | State | Seller | B/T (1) | Total Assets ($Mil.) | TanEq./ Assets (%) | NPAs/ Assets (%) | LTM ROA (%) | LTM ROE (%) | Date Anncd. | Status (2) | Offer Value ($Mil.) | Book Value (%) | Tang. Book (%) | LTM EPS (x) | Total Assets (%) | |||||||||||||||||||||||||||||||||||
Average | 635.2 | 10.05 | 2.07 | 0.05 | (1.91 | ) | NA | NA | 84.2 | 118.2 | 128.0 | 31.7 | 12.68 | |||||||||||||||||||||||||||||||||||||
Median | 312.9 | 8.86 | 1.57 | 0.24 | 1.89 | NA | NA | 46.1 | 117.0 | 124.1 | 29.6 | 10.95 | ||||||||||||||||||||||||||||||||||||||
CB Financial Services | PA | FedFirst Financial Corp. | T | 319.0 | 15.96 | 1.54 | 0.73 | 4.28 | 04/14/14 | P | 55.0 | 104.5 | 106.8 | 25.2 | 17.24 | |||||||||||||||||||||||||||||||||||
Provident Fin’l Services | NJ | Team Capital Bank | T | 949.2 | 9.24 | 0.86 | 0.71 | 7.09 | 12/20/13 | P | 124.4 | 190.6 | 190.6 | 19.2 | 13.11 | |||||||||||||||||||||||||||||||||||
HV Bancorp, Inc. | PA | Victory Bank | B | 141.2 | 8.41 | 0.38 | 1.29 | 14.89 | 12/12/13 | P | NA | NA | NA | NA | NA | |||||||||||||||||||||||||||||||||||
ESSA Bancorp, Inc. | PA | Franklin Security Bancorp | B | 225.6 | 10.60 | 1.08 | 0.22 | 1.92 | 11/18/13 | C | 15.7 | 83.5 | 86.5 | 30.5 | 6.96 | |||||||||||||||||||||||||||||||||||
GNB Fin’l Services, Inc. | PA | Liberty Centre Bancorp | B | 27.9 | 9.01 | 3.98 | (2.37 | ) | (24.46 | ) | 08/28/13 | C | NA | NA | NA | NA | NA | |||||||||||||||||||||||||||||||||
Peoples Fin’l Services Corp. | PA | Penseco Fin’l Services(3) | B | 929.8 | 11.75 | 0.43 | 1.13 | 7.86 | 06/28/13 | C | 155.9 | 117.0 | 147.0 | 15.1 | 16.77 | |||||||||||||||||||||||||||||||||||
Riverview Financial Corp. | PA | Union Bancorp, Inc. | B | 123.8 | 8.66 | 4.93 | (0.02 | ) | (0.23 | ) | 03/07/13 | C | 10.1 | 94.3 | 94.3 | NM | 8.16 | |||||||||||||||||||||||||||||||||
Penns Woods Bancorp | PA | Luzerne Nat’l Bank Corp. | B | 306.3 | 9.11 | 1.28 | 0.76 | 8.40 | 10/18/12 | C | 46.1 | 165.0 | 165.0 | 20.3 | 15.04 | |||||||||||||||||||||||||||||||||||
WesBanco, Inc. | WV | Fidelity Bancorp, Inc. | T | 665.8 | 7.46 | 2.96 | 0.25 | 3.31 | 07/19/12 | C | 72.9 | 156.8 | 166.7 | 56.4 | 10.95 | |||||||||||||||||||||||||||||||||||
First Priority Fin’l Corp. | PA | Affinity Bancorp, Inc.(3) | B | 176.3 | 6.86 | 1.54 | (0.02 | ) | (0.34 | ) | 05/23/12 | C | 12.7 | 103.9 | 104.7 | NM | 7.21 | |||||||||||||||||||||||||||||||||
S&T Bancorp, Inc. | PA | Gateway Bank | B | 120.3 | 12.62 | 0.00 | 0.51 | 4.23 | 03/30/12 | C | 21.3 | 140.1 | 140.1 | 34.2 | 17.68 | |||||||||||||||||||||||||||||||||||
Tompkins Fin’l Corp. | NY | VIST Financial Corp. | B | 1,485.7 | 6.63 | 2.79 | 0.32 | 3.39 | 01/26/12 | C | 84.1 | 71.2 | 116.3 | 28.8 | 5.66 | |||||||||||||||||||||||||||||||||||
ESSA Bancorp, Inc. | PA | First Star Bancorp, Inc. | T | 423.3 | 6.48 | 1.63 | (0.41 | ) | (6.89 | ) | 12/22/11 | C | 24.7 | 50.0 | 50.0 | NM | 7.77 | |||||||||||||||||||||||||||||||||
Beneficial Mutual Bancorp | PA | SE Financial Corp. | T | 306.9 | 8.26 | 3.67 | 0.09 | 1.11 | 12/05/11 | C | 31.8 | 110.5 | 110.5 | NM | 10.60 | |||||||||||||||||||||||||||||||||||
S&T Bancorp, Inc. | PA | Mainline Bancorp, Inc. | B | 241.8 | 8.85 | 0.78 | (0.09 | ) | (1.11 | ) | 09/14/11 | C | 21.4 | 125.1 | 125.9 | NM | 8.84 | |||||||||||||||||||||||||||||||||
Susquehanna Bancshares | PA | Tower Bancorp, Inc. | B | 2,616.0 | 8.87 | 1.60 | (0.01 | ) | (0.13 | ) | 06/20/11 | C | 342.1 | 134.5 | 149.3 | NM | 13.08 | |||||||||||||||||||||||||||||||||
F.N.B. Corporation | PA | Parkvale Financial Corp. | T | 1,801.3 | 5.42 | 2.04 | (0.83 | ) | (12.20 | ) | 06/15/11 | C | 131.2 | 137.8 | 197.6 | NM | 7.29 | |||||||||||||||||||||||||||||||||
GNB Fin’l Services, Inc. | PA | Herndon National Bank | B | 30.5 | 27.00 | 0.95 | 0.50 | 1.86 | 02/04/11 | C | 8.3 | 100.7 | 100.7 | 54.2 | 27.20 | |||||||||||||||||||||||||||||||||||
Snyder Group | PA | NexTier Inc. | B | 566.4 | 2.92 | 5.76 | (2.36 | ) | (54.72 | ) | 02/02/11 | C | NA | NA | NA | NA | NA | |||||||||||||||||||||||||||||||||
Susquehanna Bancshares | PA | Abington Bancorp, Inc. | T | 1,247.1 | 16.99 | 3.18 | 0.61 | 3.60 | 01/26/11 | C | 273.8 | 124.1 | 124.1 | 33.4 | 21.96 | |||||||||||||||||||||||||||||||||||
| (1) | B=bank; T=thrift. |
| (2) | P=pending; C=completed. |
| (3) | Merger of equals transaction |
Source: SNL Financial.
86
FELDMAN FINANCIAL ADVISORS, INC.
Effect of Government Regulations and Regulatory Reform
The Dodd-Frank Wall Street Reform and Consumer Protection Act (the “Dodd-Frank Act”) has changed the banking regulatory framework. It has created an independent Consumer Financial Protection Bureau that has assumed the consumer protection responsibilities of the various federal banking agencies and established more stringent capital standards for financial institutions and their holding companies. The legislation has also resulted in new regulations affecting the lending, funding, trading, and investment activities of financial institutions.
The full impact of the Dodd-Frank Act on banking operations will not be known until all of the regulations implementing the statute are adopted and implemented. However, compliance with these new laws and regulations may require financial institutions to make changes to business operations and will likely result in additional costs and divert management’s time from other business activities.
Following the conversion, HV Bank will become a Pennsylvania-chartered commercial bank and the wholly owned subsidiary of HV Bancorp, a registered bank holding company subject to regulation by the FRB. As a fully converted stock bank insured by the FDIC and supervised by its primary regulators, HV Bank will continue to operate in the same regulatory environment that is substantially similar to that faced by the Comparative Group companies. HV Bank was considered well capitalized as of December 31, 2013 and not subject to a formal regulatory enforcement agreement, similar to all the members of the Comparative Group. Therefore, given these factors, we believe that no specific adjustment is necessary for the effect of government regulations and regulatory reform.
87
FELDMAN FINANCIAL ADVISORS, INC.
Stock Market Conditions
Table 28 displays the performance of the SNL All Public Thrift, SNL All Mid-Atlantic Thrift, and SNL < $500 Million-Asset Thrift indexes, as compared to the Dow Jones Industrials Average (“DJIA”) and Standard & Poor’s 500-Stock Index (“S&P 500”) over various periods. Table 28 also includes comparison to the SNL NASDAQ Thrift Index. The various public thrift indexes generally tracked directionally the cyclical trends of the broader stock index from 2012 through the period measured in 2014. The All Public Thrift Index increased by 17.5% in 2012, slightly above the 13.4% improvement in the S&P 500 and the 7.3% increase in the DJIA, while the SNL Mid-Atlantic Thrift Index advanced 15.2% during this period. The All Public Thrift Index advanced further by 24.9% in 2013, while the DJIA and S&P 500 advanced 29.6% and 26.5%, respectively, in 2013.
Table 28
Comparative Stock Index Performance
Stock Performance Index | 12/31/11- 12/31/12 | 12/31/12- 12/31/13 | 12/31/13- 04/15/14 | 12/31/11- 04/15/14 | ||||||||||||
SNL All Public Thrifts | 17.5 | % | 24.9 | % | 0.2 | % | 47.0 | % | ||||||||
SNL Mid-Atlantic Thrifts | 15.2 | % | 25.8 | % | -0.4 | % | 44.3 | % | ||||||||
SNL Thrifts < $500 Mil. Assets | 21.1 | % | 21.0 | % | 3.1 | % | 51.0 | % | ||||||||
SNL NASDAQ Thrifts | 15.9 | % | 24.0 | % | 1.7 | % | 46.2 | % | ||||||||
Dow Jones Industrials Average | 7.3 | % | 26.5 | % | -1.9 | % | 33.1 | % | ||||||||
S&P 500 Stock Index | 13.4 | % | 29.6 | % | -0.3 | % | 46.5 | % | ||||||||
Source: SNL Financial.
88
FELDMAN FINANCIAL ADVISORS, INC.
The market values for bank and thrift stocks increased have exhibited much volatility thus far in 2014, as have the DJIA and S&P 500 Index. The SNL All Public Thrift index increased nominally by 0.2% since December 31, 2013 and the DJIA and S&P 500 index were down marginally by 1.9% and 0.3%, respectively during this same period. Concerns over the sustainability of earnings in the banking system related to interest rate pressures, increased expenses related to Dodd-Frank, and capital concerns related to Basel III continue to place pressure on financial stock issues; however there appears to be increased market speculation on merger activity and industry consolidation heats up again. More recently, the sluggish stock market performance reflected the fact that slower than expected economic growth was reported for the first quarter of calendar 2014.
A “new issue” discount that reflects investor concerns and investment risks inherent in all initial public offerings (“IPOs”) is a factor to be considered for purposes of valuing converting thrifts. The magnitude of the new issue discount has begun to expand in the current market environment as most seasoned thrift stocks have rebounded to trade at levels approaching or exceeding book value, while thrift conversion IPOs represent a more unproven investment opportunity. The thrift conversion market continues to respond to the after-market performance of recent offerings.
Table 29 presents a summary of standard full conversion offerings completed since January 1, 2012. There were 12 standard conversion offerings completed in 2011, only seven in calendar 2012 and a scarce three transactions in 2013. Two standard thrift conversions have been completed thus far in 2014. The after-market price performance of standard thrift conversion IPOs has generally characterized by stock price increases. Of the 12 standard conversion offerings completed since January 1, 2012, the average and median one-week price
89
FELDMAN FINANCIAL ADVISORS, INC.
changes were 16.4% and 14.8%, respectively. The after-market performance for the five recent thrift conversions listed on the Over-the-Counter Bulletin Board (“OTCBB”) exhibited average and median one-week price changes of 9.8% and 4.5%, respectively. As shown in Table 29, the cumulative price changes for OTCBB listed conversions were an average of 19.7% and median of 4.0% as compared to the NASDAQ listed conversions posting cumulative average and median price gains of 54.5% and 59.3%, respectively.
Historically, newly converted thrifts had been trading upward to a range approaching existing thrift stock valuation levels, but found resistance approaching book value until a discernible trend in earnings improvement was evident. Pricing a new offering at a high ratio in relation to pro forma book value, because of the mathematics of the calculation, would require very large increases in valuations resulting in non-sustainable price-to-earnings ratios and very marginal returns on equity. Accordingly, thrift conversions continue to be priced at discounts to publicly traded companies. This is due to the relatively high pro forma equity ratios, expected low returns on equity, and the uncertainty regarding the prospects of an institution to leverage the balance sheet prudently and effectively in the current low interest rate environment and against the backdrop of recovering real estate market conditions.
The FDIC recently reported that for the year ended December 31, 2013, the thrift industry recorded profits of $11.2 billion or 1.08% of average assets as compared to $11.0 billion or 1.06% for 2012. Asset quality continued to improve, as troubled assets (non-current loans and repossessed assets) declined to 1.74% of assets at the end of 2013, down from 2.38% one year earlier.
90
FELDMAN FINANCIAL ADVISORS, INC.
Table 29
Summary of Recent Standard Conversion Stock Offerings
Transactions Completed Since January 1, 2012
| Pro Forma Ratios | After-Market Trading | |||||||||||||||||||||||||||||||||||||||||||||||||
| Gross | Price/ | Price/ | Price/ | 4/15/14 | Price Change | |||||||||||||||||||||||||||||||||||||||||||||
Company | State | Stock Exchange | IPO Conv. Date | Total Assets ($Mil.) | Offering Proceeds ($Mil.) | Book Value (%) | Tang. Book (%) | LTM EPS (x) | IPO Price ($) | Closing Price ($) | One Day (%) | One Week (%) | One Month (%) | As of 4/15/14 (%) | ||||||||||||||||||||||||||||||||||||
Average - All Standard Offerings | NA | NA | NA | 345.2 | 39.5 | 58.7 | 59.4 | 18.2 | NA | NA | 15.6 | 16.4 | 15.4 | 40.0 | ||||||||||||||||||||||||||||||||||||
Median - All Standard Offerings | NA | NA | NA | 253.9 | 27.2 | 58.7 | 59.0 | 17.4 | NA | NA | 12.6 | 14.8 | 16.3 | 41.5 | ||||||||||||||||||||||||||||||||||||
Average - NASDAQ | NA | NA | NA | 513.3 | 62.1 | 60.2 | 60.7 | 15.0 | NA | NA | 21.3 | 21.2 | 20.3 | 54.5 | ||||||||||||||||||||||||||||||||||||
Median - NASDAQ | NA | NA | NA | 315.8 | 37.0 | 59.7 | 59.7 | 12.6 | NA | NA | 19.0 | 20.0 | 22.9 | 59.3 | ||||||||||||||||||||||||||||||||||||
Average - OTCBB | NA | NA | NA | 109.9 | 7.8 | 56.7 | 57.6 | 21.4 | NA | NA | 7.5 | 9.8 | 8.6 | 19.7 | ||||||||||||||||||||||||||||||||||||
Median - OTCBB | NA | NA | NA | 90.6 | 6.7 | 54.2 | 56.4 | 20.9 | NA | NA | 7.5 | 4.5 | 2.5 | 4.0 | ||||||||||||||||||||||||||||||||||||
Edgewater Bancorp, Inc. | MI | OTCBB | 01/17/14 | 119.5 | 6.7 | 52.7 | 55.0 | NM | 10.00 | 10.40 | 0.0 | 2.5 | 2.5 | 4.0 | ||||||||||||||||||||||||||||||||||||
Coastway Bancorp, Inc. | RI | NASDAQ | 01/15/14 | 380.5 | 48.3 | 72.2 | 72.2 | NM | 10.00 | 10.20 | 9.2 | 8.5 | 1.9 | 2.0 | ||||||||||||||||||||||||||||||||||||
Quarry City Savings & Loan Assn. | MO | OTCBB | 07/26/13 | 40.3 | 4.1 | 54.2 | 56.4 | 13.9 | 10.00 | 10.35 | 7.5 | 2.0 | 0.5 | 3.5 | ||||||||||||||||||||||||||||||||||||
Sunnyside Bancorp, Inc. | NY | OTCBB | 07/16/13 | 90.6 | 7.9 | 63.0 | 63.0 | NM | 10.00 | 9.60 | 5.0 | 4.5 | 0.1 | (4.0 | ) | |||||||||||||||||||||||||||||||||||
Westbury Bancorp, Inc. | WI | NASDAQ | 04/10/13 | 523.8 | 50.9 | 57.7 | 57.7 | NM | 10.00 | 14.30 | 35.2 | 35.1 | 33.3 | 43.0 | ||||||||||||||||||||||||||||||||||||
Meetinghouse Bancorp, Inc. | MA | OTCBB | 11/20/12 | 74.1 | 6.6 | 64.7 | 64.7 | 29.4 | 10.00 | 12.00 | 12.5 | 27.5 | 20.0 | 20.0 | ||||||||||||||||||||||||||||||||||||
Hamilton Bancorp, Inc. | MD | NASDAQ | 10/10/12 | 315.8 | 37.0 | 55.7 | 58.3 | NM | 10.00 | 14.00 | 19.0 | 17.0 | 12.5 | 40.0 | ||||||||||||||||||||||||||||||||||||
Madison County Financial, Inc. | NE | NASDAQ | 10/04/12 | 233.4 | 31.9 | 55.2 | 56.6 | 6.9 | 10.00 | 18.10 | 48.9 | 46.1 | 45.1 | 81.0 | ||||||||||||||||||||||||||||||||||||
HomeTrust Bancshares, Inc. | NC | NASDAQ | 07/11/12 | 1,564.4 | 211.6 | 59.7 | 59.7 | NM | 10.00 | 15.93 | 17.0 | 20.0 | 24.5 | 59.3 | ||||||||||||||||||||||||||||||||||||
FS Bancorp, Inc. | WA | NASDAQ | 07/10/12 | 300.8 | 32.4 | 61.1 | 61.1 | 25.6 | 10.00 | 16.37 | 0.1 | 0.7 | 2.1 | 63.7 | ||||||||||||||||||||||||||||||||||||
Wellesley Bancorp, Inc. | MA | NASDAQ | 01/26/12 | 274.4 | 22.5 | 59.7 | 59.7 | 12.6 | 10.00 | 19.25 | 20.0 | 20.9 | 22.9 | 92.5 | ||||||||||||||||||||||||||||||||||||
West End Indiana Bancshares, Inc. | IN | OTCBB | 01/11/12 | 225.2 | 13.6 | 49.1 | 49.1 | 20.9 | 10.00 | 17.50 | 12.6 | 12.5 | 20.0 | 75.0 | ||||||||||||||||||||||||||||||||||||
Source: SNL Financial.
91
FELDMAN FINANCIAL ADVISORS, INC.
FDIC regulated thrifts continued to be strongly capitalized with an average leverage ratio of 10.88% and an average total risk-based capital ratio of 18.75%, and there was only one failed thrift for the year ending December 31, 2013 as compared to ten for 2012. Thrift industry total assets have continued their decline, but at a much slower pace, decreasing approximately 0.7% during 2013, as compared to a 14.8% decrease in 2012. The industry reported a net interest margin of 3.39% for the year ended December 31, 2013 and 3.46% for the quarter ended December 31, 2013, as compared to 3.45% for the year ended December 31, 2012 and 3.24% for the quarter ended December 31, 2012. Structural changes during the year ended December 31, 2013, other than the one aforementioned thrift failure, comprised 28 thrifts that were acquired in mergers and one newly reporting thrift institution.
As the banking industry continues its recovery, the FRB has maintained a program of keeping rates at or near historic lows. Through calendar 2013 and early 2014, the effective federal funds rate was approximately 5-20 basis points and the prime rate has remained constant at 3.25%. In Mid-March of 2014, the FRB sent signals that while it intends to keep short-term rates near zero into 2015, rate increases may come sooner and more aggressively than expected depending on certain factors impacting the speed of economic recovery. While remaining low by historical standards, mortgage interest rates have risen recently as the FRB has continued with its decision to extend its purchases of mortgage-backed securities and long-term U.S. Treasury securities (although tapering purchases from $85 billion per month to $55 billion per month over the first three months of 2014) to attempt to keep longer-term borrowings at low interest levels to spur growth.
Thrift industry earnings results have recently been sustained by stabilizing net interest margins and have been bolstered by significant reductions in loan loss provisions. Industry
92
FELDMAN FINANCIAL ADVISORS, INC.
operating expenses generally continue to rise in the face of a stabilizing net interest margin and little growth in non-interest income. Generally, over the past year, financial institutions have relied on reductions in loan loss provisions to a more normalized level as asset quality has improved to increase net income. While thrift industry capital levels remain strong and asset quality has improved, there continue to be volatile swings in the market for bank and thrift stocks. However, we note that some of the economic uncertainty has dissipated and believe no adjustment is necessary for stock market conditions.
Adjustments Conclusion
It is our opinion that HV Bancorp’s pro forma market value should be discounted relative to the Comparative Group because of factors associated with earnings prospects and dividend policy. Currently, converting thrifts are often valued at meaningful discounts to peer institutions relative to price-to-book and price-to-earnings ratios. It is the judgment of the appraiser to balance the relative dynamics of price-to-book and price-to-earnings discounts or premiums.
Valuation Approach
In determining the estimated pro forma market value of HV Bancorp, we have employed the comparative company approach and considered the following pricing ratios: price-to-earnings per share (“P/E”), price-to-book value per share (“P/B”), price-to-tangible book value per share (“P/TB”), and price-to-assets (“P/A”). Table 30 presents the trading market valuation ratios of the Comparative Group and All Public Thrift averages and medians as of April 15, 2014. As shown in Table 30, the average and median P/B ratios for the Comparative Group were 89.2% and 87.8%, respectively. The average and median P/TB ratios for the Comparative Group were 90.3% and 90.2%, respectively. The average and median P/E ratios for the
93
FELDMAN FINANCIAL ADVISORS, INC.
Comparative Group were 27.6x and 25.8x respectively. On a core earnings basis, average and median core P/E ratios of the Comparative Group were 28.5x and 29.2x, respectively. Several of the Comparative Group companies reported P/E ratios that were negative or distortedly high due to very low levels of profitability. Such ratios are represented as not meaningful (“NM”) and were not utilized for comparative valuation analysis.
Investors continue to make decisions to purchase thrift conversion stocks and more seasoned thrift issues based upon consideration of core earnings profitability and P/B comparisons. The P/E ratio remains an important valuation ratio in the current thrift stock market environment. HV Bank’s earnings for the LTM ended December 31, 2013 amounted to $9,000 for an ROA of 0.01%. On a core earnings basis, which excludes non-recurring income and expense items, its LTM core earnings reflected a deficit of -$81,000 for a core ROA of -0.05%. On a pro forma basis assuming completion of the merger but before the impact of the conversion offering, HV Bancorp’s LTM earnings available for common shareholders would amount to $292,000 and LTM core earnings available for common shareholders would approximate $389,000. The increase reflects the addition of earnings production from Victory Bancorp, offset partially by the net purchase accounting effects of the merger.
Based on our comparative financial and valuation analyses, we concluded that HV Bancorp should be discounted relative to the trading valuation ratios of the overall Comparative Group. In consideration of the foregoing factors along with the additional adjustments discussed in this chapter, we have determined a pro forma midpoint P/B ratio of 73.1% and P/TB ratio of 75.5% for HV Bancorp. These valuation ratios results in an aggregate midpoint value of approximately $19.4 million that consists of $10.0 million in common stock to be sold in the conversion offering and $9.4 million to be issued to shareholders of Victory Bancorp in the
94
FELDMAN FINANCIAL ADVISORS, INC.
merger. Employing an offering range of 15% above and below the midpoint offering amount of $10.0 million, the resulting minimum offering amount is $8.5 million and the resulting maximum offering amount is $11.5 million. The adjusted maximum offering amount, computed as an additional 15.0% above the maximum offering amount, is positioned at approximately $13.2 million. Including the common shares estimated to be issued to shareholders of Victory Bancorp at various points in the offering range produces aggregate pro forma market values for HV Bancorp of approximately $16.5 million at the minimum, $19.4 million at the midpoint, $22.0 million at the maximum, and $23.7 million at the adjusted maximum.
HV Bancorp’s pro forma midpoint P/B ratio of 73.1% reflects a discount of 18.0% to the Comparative Group average P/B ratio of 89.2% and a discount of 16.7% to the Comparative Group median P/B ratio of 87.8%. At the adjusted maximum, HV Bancorp’s pro forma P/B ratio of 78.2% evidences a 12.3% discount to the Comparative Group average and 10.9% discount to the Comparative Group median. In addition, at the adjusted maximum, the HV Bancorp’s pro forma P/TB ratio of 80.8% is positioned at a 10.5% discount to the corresponding Comparative Group average of 90.3% and 10.4% discount to the Comparative Group median of 90.2%.
As compared to recent conversion offerings in Table 29, HV Bancorp’s range pro forma P/B and P/TB valuation ratios would surpass the corresponding ratios for all the transactions listed. Only one recent standard full conversion offering, Coastway Bancorp, has been completed with P/B and P/TB ratios above 70%. Based in Cranston, Rhode Island, Coastway Bancorp concluded its offering in January 2014 with a sale of $48.3 million of common stock, representing the adjusted maximum of its offering range at P/B and P/TB ratios of 72.2%. Three months after its IPO at $10.00 per share, Coastway Bancorp closed at $10.20 on April 15, 2015 and reflected price appreciation of 2.0% since the IPO.
95
FELDMAN FINANCIAL ADVISORS, INC.
The pro forma P/B and P/TB ratios for HV Bancorp are affected by the concurrent issuance of common stock to Victory Bancorp shareholders pursuant to the merger. The additional stock issue results in an increase to the aggregate market value of HV Bancorp along with the incremental capital. The additional capital issuance and leverage at the initial offering price has the effect of diluting ownership interest and raising the pro forma P/B and P/TB ratios of HV Bancorp, in comparison to other standard conversion offerings that did not involve a simultaneous merger and issuance of additional shares.
Based on the aggregate pro forma valuation range as indicated above, HV Bancorp’s pro forma P/E ratios based on LTM earnings reflected values ranging from 125.0x at the minimum to 166.7x at the adjusted maximum. As shown in Exhibit IV-2, the additional expense associated with the stock benefit plans, including the ESOP, RSP, and stock options, and the merger-related purchase accounting adjustments restrain the benefits of incremental earnings from Victory Bancorp and re-investing the offering proceeds. The low level of earnings results in very high P/E ratios that are not useful for comparative valuation analysis. Similarly, HV Bancorp’s core P/E ratios are distortedly high, ranging from 66.7x at the minimum to 100.0x at the adjusted maximum. Therefore, the very high P/E ratios for HV Bancorp are reported as NM (not meaningful) on Table 30 and the P/B and P/TB valuation analysis takes on more importance.
Based on the price-to-assets valuation metric, the aggregate pro forma midpoint of $19.4 million reflects a corresponding P/A ratio of 6.22%, ranging from 5.33% at the pro forma valuation minimum to 7.00% and 7.51% at the maximum and adjusted maximum, respectively. HV Bancorp’s relatively lower capital level on a pro forma basis generally resulted in P/A ratio discounts in contrast to the Comparative Group average P/A ratio of 13.27% and median P/A ratio of 12.63%.
96
FELDMAN FINANCIAL ADVISORS, INC.
On a pro forma basis, HV Bancorp’s ratio of total equity to assets ranges from 8.85% at the valuation minimum and 9.60% at the midpoint to 10.27% and 10.69% at the maximum and adjusted maximum, respectively. Excluding the intangible assets resulting from the merger, HV Bancorp’s ratio of tangible equity to assets ranges from 8.61% at the valuation minimum and 9.36% at the midpoint to 9.98% and 10.41% at the maximum and adjusted maximum, respectively. Further excluding intangible assets and preferred stock, HV Bancorp’s ratio of tangible common equity to assets ranges from 7.50% at the valuation minimum and 8.26% at the midpoint to 8.88% and 9.32% at the maximum and adjusted maximum, respectively.
Valuation Conclusion
It is our opinion that, as of April 15, 2014, the estimated aggregate pro forma market value of the shares to be issued by HV Bancorp, inclusive of common stock to be issued to Victory Bancorp’s shareholders in connection with the pending merger, was $19,417,480 at the midpoint of the Valuation Range, equal to 1,941,748 shares of common stock at a per share value of $10.00. At the midpoint, it is assumed that 1,000,000 shares of common stock will be sold in the offering by HV Bancorp and 941,748 shares of HV Bancorp common stock will be part of the merger consideration issued to shareholders of Victory Bancorp.
97
FELDMAN FINANCIAL ADVISORS, INC.
The range of shares sold in the conversion offering reflects a 15% decrease from the midpoint to determine the minimum and a 15% increase from the midpoint to determine the maximum. Assuming an additional 15% increase above the maximum results in the adjusted maximum. Based on the foregoing valuation, the corresponding Valuation Range of pro forma outstanding shares and pro forma market values assuming an offering price of $10.00 per share is shown on the following page:
| Sold in Conversion Offering | Issued in Merger(1) | Pro Forma Combined Total | ||||||||||
HV Bancorp, Inc. | ||||||||||||
Shares of Common Stock | ||||||||||||
Minimum | 850,000 | 800,485 | 1,650,485 | |||||||||
Midpoint | 1,000,000 | 941,748 | 1,941,748 | |||||||||
Maximum | 1,150,000 | 1,046,804 | 2,196,804 | |||||||||
Adjusted Maximum | 1,322,500 | 1,046,804 | 2,369,304 | |||||||||
Pro Forma Market Value | ||||||||||||
Minimum | $ | 8,500,000 | $ | 8,004,850 | $ | 16,504,850 | ||||||
Midpoint | $ | 10,000,000 | $ | 9,417,480 | $ | 19,417,480 | ||||||
Maximum | $ | 11,500,000 | $ | 10,468,040 | $ | 21,968,040 | ||||||
Adjusted Maximum | $ | 13,225,000 | $ | 10,468,040 | $ | 23,693,040 | ||||||
Outstanding % of Shares | ||||||||||||
Minimum | 51.50 | % | 48.50 | % | 100.00 | % | ||||||
Midpoint | 51.50 | % | 48.50 | % | 100.00 | % | ||||||
Maximum | 52.35 | % | 47.65 | % | 100.00 | % | ||||||
Adjusted Maximum | 55.82 | % | 44.18 | % | 100.00 | % | ||||||
| (1) | As discussed in the preliminary prospectus of HV Bancorp, assumes that at levels equal to or below the midpoint of the offering range, 81% of Victory Bancorp Series E stockholders convert their preferred shares into Victory Bancorp common stock prior to the merger and 19% convert their preferred shares into subordinated debt. At levels above the midpoint of the offering range, it is assumed that 100% of the Series E preferred shares are exchanged for Victory Bancorp common stock. In the event that the aggregate HV Bancorp common stock shares to be issued in the merger, when added to the aggregate HV Bancorp common stock shares purchased by holders of Victory Bancorp common stock in the conversion offering, would result in Victory Bancorp shareholders owning in excess of 48.5% of the outstanding HV Bancorp common stock, then HV Bancorp will substitute cash in an amount sufficient to reduce the ownership level to comply with this limitation. In order to ensure that Victory Bancorp shareholders, in the aggregate, do not own HV Bancorp common stock in excess of the 48.5% limit, Series E preferred shareholders who are Victory Bancorp directors and senior management have entered into commitments pursuant to which they have agreed to exchange a certain percentage of shares of Victory Bancorp Series E preferred stock held by each of them for subordinated debt. |
Exhibit IV-1 displays the assumptions utilized in calculating the pro forma financial consequences of the stock offering. Exhibit IV-2 displays the pro forma financial data at each level of the Valuation Range. Exhibit IV-3 provides more detailed data at the midpoint of the Valuation Range. Exhibit IV-4 compares the pro forma valuation ratios with the averages and medians reported by the Comparative Group and All Public Thrifts.
98
FELDMAN FINANCIAL ADVISORS, INC.
Table 30
Comparative Pro Forma Market Valuation Analysis
HV Bancorp, Inc. and the Comparative Group
Computed from Market Price Data as of April 15, 2014
Company | Closing Price 4/15/14 ($) | Total Market Value ($Mil.) | Price/ LTM EPS (x) | Price/ Core EPS (x) | Price/ Book Value (%) | Price/ Tang. Book (%) | Price/ Total Assets (%) | Total Equity/ Assets (%) | Tang. Equity/ Assets (%) | Current Dividend Yield (%) | ||||||||||||||||||||||||||||||
HV Bancorp, Inc.(1) | ||||||||||||||||||||||||||||||||||||||||
Pro Forma Minimum | 10.00 | 16.5 | NM | NM | 68.8 | 71.3 | 5.33 | 8.85 | 8.61 | 0.00 | ||||||||||||||||||||||||||||||
Pro Forma Midpoint | 10.00 | 19.4 | NM | NM | 73.1 | 75.5 | 6.22 | 9.60 | 9.36 | 0.00 | ||||||||||||||||||||||||||||||
Pro Forma Maximum | 10.00 | 22.0 | NM | NM | 76.3 | 79.0 | 7.00 | 10.27 | 9.98 | 0.00 | ||||||||||||||||||||||||||||||
Pro Forma Adjusted Maximum | 10.00 | 23.7 | NM | NM | 78.2 | 80.8 | 7.51 | 10.69 | 10.41 | 0.00 | ||||||||||||||||||||||||||||||
Comparative Group Average | NA | 42.8 | 27.6 | 28.5 | 89.2 | 90.3 | 13.27 | 14.96 | 14.80 | 0.89 | ||||||||||||||||||||||||||||||
Comparative Group Median | NA | 41.2 | 25.8 | 29.2 | 87.8 | 90.2 | 12.63 | 13.57 | 13.54 | 1.17 | ||||||||||||||||||||||||||||||
All Public Thrift Average(2) | NA | 355.4 | 23.2 | 27.6 | 105.9 | 114.2 | 13.50 | 13.11 | 12.45 | 1.46 | ||||||||||||||||||||||||||||||
All Public Thrift Median(2) | NA | 101.8 | 18.8 | 20.5 | 97.4 | 101.9 | 12.33 | 12.25 | 11.20 | 1.35 | ||||||||||||||||||||||||||||||
Comparative Group | ||||||||||||||||||||||||||||||||||||||||
Alliance Bancorp, Inc. | 15.46 | 67.1 | 53.3 | 53.3 | 98.4 | 98.4 | 16.23 | 16.49 | 16.49 | 1.29 | ||||||||||||||||||||||||||||||
Athens Bancshares Corporation | 20.25 | 37.5 | 17.9 | 17.5 | 93.2 | 93.6 | 12.99 | 13.94 | 13.89 | 0.99 | ||||||||||||||||||||||||||||||
Georgetown Bancorp, Inc. | 14.75 | 27.1 | 36.0 | 36.0 | 93.3 | 93.3 | 10.27 | 11.00 | 11.00 | 1.08 | ||||||||||||||||||||||||||||||
Hamilton Bancorp, Inc. | 14.00 | 49.2 | NM | NM | 80.1 | 84.0 | 16.39 | 20.46 | 19.70 | 0.00 | ||||||||||||||||||||||||||||||
Jacksonville Bancorp, Inc. | 20.65 | 37.5 | 12.4 | 13.4 | 88.6 | 94.6 | 11.92 | 12.92 | 12.17 | 1.55 | ||||||||||||||||||||||||||||||
LSB Financial Corp. | 28.83 | 44.9 | 17.8 | 17.8 | 110.8 | 110.8 | 12.27 | 11.08 | 11.08 | 1.25 | ||||||||||||||||||||||||||||||
Poage Bankshares, Inc. | 14.50 | 56.6 | 21.0 | 27.4 | 84.2 | 84.2 | 16.78 | 19.93 | 19.93 | 1.38 | ||||||||||||||||||||||||||||||
Polonia Bancorp, Inc. | 9.99 | 34.6 | NM | NM | 87.0 | 87.0 | 11.48 | 13.19 | 13.19 | 0.00 | ||||||||||||||||||||||||||||||
Wolverine Bancorp, Inc. | 21.75 | 49.9 | 31.5 | 31.5 | 82.8 | 82.8 | 16.78 | 20.26 | 20.26 | 0.00 | ||||||||||||||||||||||||||||||
WVS Financial Corp. | 11.59 | 23.9 | 30.5 | 31.1 | 73.9 | 73.9 | 7.60 | 10.28 | 10.28 | 1.38 | ||||||||||||||||||||||||||||||
| (1) | Pro forma ratios assume sale of common stock in the conversion offering and issuance of common stock to Victory Bancorp shareholders in the merger. |
| (2) | Excludes companies subject to pending acquisition or mutual holding company ownership. |
Source: HV Bancorp, preliminary prospectus; SNL Financial; Feldman Financial.
99
FELDMAN FINANCIAL ADVISORS, INC.
Exhibit I
Background of Feldman Financial Advisors, Inc.
Overview of Firm
Feldman Financial Advisors provides consulting and advisory services to financial institutions and mortgage companies in the areas of corporate valuations, mergers and acquisitions, strategic planning, branch sales and purchases, developing and implementing regulatory business and capital plans, and expert witness testimony and analysis. Our senior staff members have been involved in the stock conversion process since 1982 and have valued more than 350 converting institutions.
Feldman Financial Advisors was incorporated in February 1996 by a group of consultants who were previously associated with Credit Suisse First Boston and Kaplan Associates. Each of the principals at Feldman Financial Advisors has more than 10 years experience in consulting and all were officers of their prior firm. Our senior staff collectively has worked with more than 1,000 banks, thrifts and mortgage companies nationwide. The firm’s office is located in Washington, D.C.
Background of Senior Professional Staff
Trent Feldman – President. Trent is a nationally recognized expert in providing strategic advice to and valuing service companies, and advising on mergers and acquisitions. Trent was with Kaplan Associates for 14 years and was one of three founding principals at that firm. Trent also has worked at the Federal Home Loan Bank Board and with the California State Legislature. Trent holds Bachelors and Masters Degrees from the University of California at Los Angeles.
Peter Williams – Principal. Peter specializes in merger and acquisition analysis, stock and other corporate valuations, strategic business plans and retail delivery analysis. Peter was with Kaplan Associates for 13 years. Peter also served as a Corporate Planning Analyst with the Wilmington Trust Company in Delaware. Peter holds a BA in Economics from Yale University and an MBA in Finance and Investments from George Washington University.
Michael Green – Principal. Mike is an expert in mergers and acquisition analysis, financial institution and corporate valuations, and strategic and business plans. During Mike’s 10 years at Kaplan Associates, his experience also included business restructurings, litigation support, mark-to-market analysis, and goodwill valuations. Mike holds a BA in Finance and Economics from Rutgers College.
I-1
FELDMAN FINANCIAL ADVISORS, INC.
Exhibit II-1
Consolidated Balance Sheets
Huntingdon Valley Bank
As of June 30, 2012 and 2013 and December 31, 2013
(Dollars in Thousands)
| Dec. 31, | June 30, | |||||||||||
| 2013 | 2013 | 2012 | ||||||||||
Assets | ||||||||||||
Cash and due from banks | $ | 21,679 | $ | 3,668 | $ | 7,069 | ||||||
Interest-bearing deposits with banks | 1,219 | 3,405 | 3,942 | |||||||||
Securities available-for-sale, at fair value | 46,239 | 47,375 | 48,504 | |||||||||
Securities held-to-maturity | 5,020 | 4,432 | 606 | |||||||||
Loans held for sale | 3,745 | 9,293 | 16,392 | |||||||||
Loans receivable, net | 75,789 | 74,572 | 69,614 | |||||||||
Bank-owned life insurance | 3,617 | 3,559 | 3,443 | |||||||||
Restricted investment in bank stock | 910 | 779 | 761 | |||||||||
Premises and equipment, net | 1,793 | 1,886 | 2,094 | |||||||||
Accrued interest receivable | 587 | 557 | 563 | |||||||||
Prepaid federal income taxes | 83 | 83 | 40 | |||||||||
Deferred income taxes | 1,421 | 1,206 | 352 | |||||||||
Prepaid expenses | 253 | 239 | 617 | |||||||||
Real estate owned | 566 | 2,199 | 1,824 | |||||||||
Other assets | 502 | 120 | 92 | |||||||||
|
|
|
|
|
| |||||||
Total Assets | $ | 163,423 | $ | 153,373 | $ | 155,914 | ||||||
|
|
|
|
|
| |||||||
Liabilities and Equity | ||||||||||||
Total deposits | $ | 140,631 | $ | 133,540 | $ | 133,717 | ||||||
FHLB advances | 7,000 | 3,000 | 3,000 | |||||||||
Securities sold under agreements to repurchase | 3,759 | 4,031 | 5,204 | |||||||||
Advances from borrowers for taxes and insurance | 709 | 1,078 | 1,130 | |||||||||
Deferred gain on sale - leaseback of building | 367 | 375 | 391 | |||||||||
Other liabilities | 696 | 783 | 845 | |||||||||
|
|
|
|
|
| |||||||
Total Liabilities | 153,162 | 142,807 | 144,287 | |||||||||
|
|
|
|
|
| |||||||
Retained earnings | 11,502 | 11,447 | 11,324 | |||||||||
Accumulated other comprehensive income (loss) | (1,241 | ) | (881 | ) | 303 | |||||||
|
|
|
|
|
| |||||||
Total Equity | 10,261 | 10,566 | 11,627 | |||||||||
|
|
|
|
|
| |||||||
Total Liabilities and Equity | $ | 163,423 | $ | 153,373 | $ | 155,914 | ||||||
|
|
|
|
|
| |||||||
Source: HV Bank, financial statements.
II-1
FELDMAN FINANCIAL ADVISORS, INC.
Exhibit II-2
Consolidated Income Statements
Huntingdon Valley Bank
For the Years Ended June 30, 2012 and 2013
And the Six Months Ended December 31, 2012 and 2013
(Dollars in Thousands)
| Six Months Ended December 31, | Year Ended June 30, | |||||||||||||||
| 2013 | 2012 | 2013 | 2012 | |||||||||||||
Total interest income | $ | 2,545 | $ | 2,569 | $ | 4,994 | $ | 5,545 | ||||||||
Total interest expense | 435 | 521 | 982 | 1,211 | ||||||||||||
|
|
|
|
|
|
|
| |||||||||
Net interest income | 2,110 | 2,048 | 4,012 | 4,334 | ||||||||||||
Provision (credit) for loan losses | (31 | ) | 80 | 120 | 178 | |||||||||||
|
|
|
|
|
|
|
| |||||||||
Net interest income after provision | 2,141 | 1,968 | 3,892 | 4,156 | ||||||||||||
Customer service fees | 108 | 119 | 235 | 216 | ||||||||||||
Increase in cash surrender value of BOLI | 58 | 60 | 116 | 118 | ||||||||||||
Gains on sale of loans, net | 1,002 | 930 | 1,686 | 1,774 | ||||||||||||
Gains on sale of available-for-sale securities | (2 | ) | 334 | 592 | 528 | |||||||||||
Other non-interest income | 36 | 50 | 71 | 113 | ||||||||||||
|
|
|
|
|
|
|
| |||||||||
Total non-interest income | 1,202 | 1,493 | 2,700 | 2,749 | ||||||||||||
|
|
|
|
|
|
|
| |||||||||
Salaries and employee benefits | 1,514 | 1,562 | 3,210 | 2,754 | ||||||||||||
Occupancy expense | 475 | 522 | 1,023 | 1,131 | ||||||||||||
FDIC premiums | 70 | 68 | 159 | 137 | ||||||||||||
Data processing related operations | 236 | 248 | 633 | 573 | ||||||||||||
Real estate owned expense | 186 | 167 | 373 | 658 | ||||||||||||
Professional fees | 286 | 173 | 404 | 292 | ||||||||||||
Other expenses | 486 | 480 | 696 | 528 | ||||||||||||
|
|
|
|
|
|
|
| |||||||||
Total non-interest expense | 3,253 | 3,220 | 6,498 | 6,073 | ||||||||||||
|
|
|
|
|
|
|
| |||||||||
Income before income taxes | 91 | 241 | 81 | 802 | ||||||||||||
Income tax expense (benefit) | 36 | 72 | (42 | ) | (110 | ) | ||||||||||
|
|
|
|
|
|
|
| |||||||||
Net income | $ | 55 | $ | 169 | $ | 123 | $ | 912 | ||||||||
|
|
|
|
|
|
|
| |||||||||
Source: HV Bank, financial statements.
II-2
FELDMAN FINANCIAL ADVISORS, INC.
Exhibit II-3
Loan Portfolio Composition
Huntingdon Valley Bank
As of June 30, 2012 and 2013 and December 31, 2013
(Dollars in Thousands)
| December 31, 2013 | June 30, | |||||||||||||||||||||||
| 2013 | 2012 | |||||||||||||||||||||||
| Amount | Percent | Amount | Percent | Amount | Percent | |||||||||||||||||||
Residential mortgage loans | $ | 54,906 | 71.95 | % | $ | 53,375 | 70.95 | % | $ | 45,412 | 64.34 | % | ||||||||||||
Home equity and HELOCs(1) | 8,143 | 10.67 | 9,053 | 12.03 | 10,535 | 14.92 | ||||||||||||||||||
Other consumer loans | 42 | 0.06 | 72 | 0.10 | 126 | 0.18 | ||||||||||||||||||
Commercial real estate loans | 12,433 | 16.29 | 11,954 | 15.89 | 12,824 | 18.17 | ||||||||||||||||||
Commercial business loans | 787 | 1.03 | 775 | 1.03 | 188 | 0.27 | ||||||||||||||||||
Construction residential loans | — | 0.00 | — | 0.00 | 1,500 | 2.13 | ||||||||||||||||||
|
|
|
|
|
|
|
|
|
|
|
| |||||||||||||
Total loans(2) | 76,311 | 100.00 | % | 75,229 | 100.00 | % | 70,585 | 100.00 | % | |||||||||||||||
|
|
|
|
|
| |||||||||||||||||||
Less: | ||||||||||||||||||||||||
Unearned discounts and fees | (37 | ) | (76 | ) | (161 | ) | ||||||||||||||||||
Undisbursed portion of loans | — | — | (336 | ) | ||||||||||||||||||||
Allowance for loan losses | (485 | ) | (581 | ) | (474 | ) | ||||||||||||||||||
|
|
|
|
|
| |||||||||||||||||||
Net total loans | $ | 75,789 | $ | 74,572 | $ | 69,614 | ||||||||||||||||||
|
|
|
|
|
| |||||||||||||||||||
| (1) | Includes home equity loans secured by second mortgages and home equity lines of credit secured by second mortgages. |
| (2) | Does not include loans classified as held for sale. |
Source: HV Bancorp, preliminary prospectus.
II-3
FELDMAN FINANCIAL ADVISORS, INC.
Exhibit II-4
Net Lending Activity
Huntingdon Valley Bank
For the Years Ended June 30, 2012 and 2013
And the Six Months Ended December 31, 2012 and 2013
(Dollars in Thousands)
| Six Months Ended December 31, | Year Ended June 30, | |||||||||||||||
| 2013 | 2012 | 2013 | 2012 | |||||||||||||
Total loans at beginning of period(1) | $ | 84,446 | $ | 86,481 | $ | 86,481 | $ | 84,036 | ||||||||
Loans originated or purchased | ||||||||||||||||
Consumer: | ||||||||||||||||
Residential mortgage loans(2) | 40,458 | 54,551 | 103,523 | 149,118 | ||||||||||||
Home equity loans and HELOCs | 281 | 384 | 656 | 630 | ||||||||||||
Other consumer loans | 70 | 38 | 66 | 51 | ||||||||||||
Commercial: | ||||||||||||||||
Commercial real estate loans | 1,059 | 516 | 1,494 | 109 | ||||||||||||
Commercial business loans | — | — | 172 | — | ||||||||||||
Construction residential loans | 131 | — | 265 | 828 | ||||||||||||
|
|
|
|
|
|
|
| |||||||||
Total loans originated | 41,999 | 55,489 | 106,176 | 150,736 | ||||||||||||
Loans and participations purchased | — | — | 676 | — | ||||||||||||
|
|
|
|
|
|
|
| |||||||||
Total loans originated/purchased | $ | 41,499 | $ | 55,489 | $ | 106,852 | $ | 150,736 | ||||||||
|
|
|
|
|
|
|
| |||||||||
Loans sold/principal repayments | ||||||||||||||||
Loans sold | $ | 41,450 | $ | 55,673 | $ | 97,134 | $ | 131,763 | ||||||||
Principal repayments | 4,845 | 5,602 | 9,443 | 14,549 | ||||||||||||
Transferred to real estate owned or charged off | 131 | 13 | 958 | 1,979 | ||||||||||||
|
|
|
|
|
|
|
| |||||||||
Total deductions | $ | 46,426 | $ | 61,288 | $ | 108,211 | $ | 148,291 | ||||||||
|
|
|
|
|
|
|
| |||||||||
Net loan activity | (4,427 | ) | (5,799 | ) | (2,035 | ) | 2,445 | |||||||||
|
|
|
|
|
|
|
| |||||||||
Total loans at end of period(1) | $ | 80,019 | $ | 80,682 | $ | 84,446 | $ | 86,481 | ||||||||
|
|
|
|
|
|
|
| |||||||||
| (1) | Includes loans classified as held for sale; excludes unearned discounts and fees, and excludes undisbursed portion of construction loans. |
Source: HV Bancorp, preliminary prospectus.
II-4
FELDMAN FINANCIAL ADVISORS, INC.
Exhibit II-5
Investment Portfolio Composition
Huntingdon Valley Bank
As of June 30, 2012 and 2013 and December 31, 2013
(Dollars in Thousands)
| December 31, 2013 | June 30, | |||||||||||||||||||||||
| 2013 | 2012 | |||||||||||||||||||||||
| Amortized Cost | Fair Value | Amortized Cost | Fair Value | Amortized Cost | Fair Value | |||||||||||||||||||
Securities available-for-sale | ||||||||||||||||||||||||
U.S. Government securities | $ | 7,102 | $ | 6,962 | $ | 6,221 | $ | 6,122 | $ | 7,334 | $ | 7,469 | ||||||||||||
Corporate notes | 9,591 | 9,058 | 9,597 | 9,118 | 6,281 | 6,235 | ||||||||||||||||||
CMOs - agency residential | 17,575 | 16,829 | 19,627 | 18,842 | 22,561 | 22,741 | ||||||||||||||||||
MBS - agency residential | 9,251 | 8,744 | 8,966 | 8,651 | 10,184 | 10,409 | ||||||||||||||||||
Municipal securities | 4,075 | 3,896 | 4,069 | 3,887 | 1,379 | 1,400 | ||||||||||||||||||
Bank certificates of deposit | 749 | 750 | 749 | 755 | 250 | 250 | ||||||||||||||||||
|
|
|
|
|
|
|
|
|
|
|
| |||||||||||||
Total securities available-for-sale | $ | 48,343 | $ | 46,239 | $ | 48,869 | $ | 47,375 | $ | 47,989 | $ | 48,504 | ||||||||||||
|
|
|
|
|
|
|
|
|
|
|
| |||||||||||||
Securities held-to-maturity | ||||||||||||||||||||||||
Municipal securities | $ | 5,020 | $ | 4,905 | $ | 4,432 | $ | 4,310 | $ | 606 | $ | 606 | ||||||||||||
|
|
|
|
|
|
|
|
|
|
|
| |||||||||||||
Total securities held-to-maturity | $ | 5,020 | $ | 4,905 | $ | 4,432 | $ | 4,310 | $ | 606 | $ | 606 | ||||||||||||
|
|
|
|
|
|
|
|
|
|
|
| |||||||||||||
Source: HV Bancorp, preliminary prospectus.
II-5
FELDMAN FINANCIAL ADVISORS, INC.
Exhibit II-6
Deposit Account Distribution
Huntingdon Valley Bank
As of June 30, 2012 and 2013 and December 31, 2013
(Dollars in Thousands)
| December 31, 2013 | June 30, | |||||||||||||||||||||||
| 2013 | 2012 | |||||||||||||||||||||||
| Amount | Percent | Amount | Percent | Amount | Percent | |||||||||||||||||||
Transaction accounts | ||||||||||||||||||||||||
NOW accounts - interest bearing | $ | 28,975 | 20.60 | % | $ | 26,390 | 19.76 | % | $ | 24,512 | 18.33 | % | ||||||||||||
NOW accounts - non-int. bearing | 3,587 | 2.55 | 3,482 | 2.61 | 3,336 | 2.49 | ||||||||||||||||||
Money market deposit accounts | 25,366 | 18.04 | 32,747 | 24.52 | 34,363 | 25.70 | ||||||||||||||||||
Passbook and statement savings | 30,077 | 21.39 | 18,959 | 14.20 | 16,640 | 12.44 | ||||||||||||||||||
Checking accounts | 5,072 | 3.61 | 5,536 | 4.15 | 5,451 | 4.08 | ||||||||||||||||||
|
|
|
|
|
|
|
|
|
|
|
| |||||||||||||
Total transaction accounts | 93,077 | 66.19 | 87,114 | 65.23 | 84,302 | 63.05 | ||||||||||||||||||
|
|
|
|
|
|
|
|
|
|
|
| |||||||||||||
Certificate accounts | ||||||||||||||||||||||||
0.15% - 0.99% | 16,626 | 11.82 | 13,457 | 10.08 | 9,699 | 7.25 | ||||||||||||||||||
1.00% - 1.99% | 22,217 | 15.80 | 23,429 | 17.54 | 26,296 | 19.67 | ||||||||||||||||||
2.00% - 2.99% | 8,233 | 5.85 | 8,288 | 6.21 | 10,078 | 7.54 | ||||||||||||||||||
3.00% - 3.99% | 478 | 0.34 | 1,252 | 0.94 | 3,322 | 2.48 | ||||||||||||||||||
4.00% - 4.34% | — | — | — | — | 20 | 0.01 | ||||||||||||||||||
|
|
|
|
|
|
|
|
|
|
|
| |||||||||||||
Total certificate accounts | 47,554 | 33.81 | 46,426 | 34.77 | 49,415 | 36.95 | ||||||||||||||||||
|
|
|
|
|
|
|
|
|
|
|
| |||||||||||||
Total deposits | $ | 140,631 | 100.00 | % | $ | 133,540 | 100.00 | % | $ | 133,717 | 100.00 | % | ||||||||||||
|
|
|
|
|
|
|
|
|
|
|
| |||||||||||||
Source: HV Bancorp, preliminary prospectus.
II-6
FELDMAN FINANCIAL ADVISORS, INC.
Exhibit II-7
Borrowed Funds Distribution
Huntingdon Valley Bank
As of June 30, 2012 and 2013 and December 31, 2013
(Dollars in Thousands)
| December 31, 2013 | June 30, | |||||||||||
| 2013 | 2012 | |||||||||||
Federal Home Loan Bank advances | ||||||||||||
Balance outstanding at end of the period | $ | 7,000 | $ | 3,000 | $ | 3,000 | ||||||
Weighted average rate at end of the period | 0.72 | % | 1.33 | % | 1.90 | % | ||||||
Securities sold under agreement to repurchase | $ | 3,759 | $ | 4,031 | $ | 5,204 | ||||||
Balance outstanding at end of the period | 0.14 | % | 0.10 | % | 0.11 | % | ||||||
Weighted average rate at end of the period | ||||||||||||
Source: HV Bancorp, preliminary prospectus.
II-7
FELDMAN FINANCIAL ADVISORS, INC.
Exhibit II-8
Consolidated Balance Sheets
The Victory Bancorp, Inc.
As of December 31, 2011 to 2013
(Dollars in Thousands)
| December 31, | ||||||||||||
| 2013 | 2012 | 2011 | ||||||||||
Assets | ||||||||||||
Cash and due from banks | $ | 809 | $ | 3,171 | $ | 4,626 | ||||||
Federal funds sold | 1,580 | ,406 | 7,745 | |||||||||
Securities available-for-sale, at fair value | 1,901 | 4,885 | 3,764 | |||||||||
Loans receivable, net | 129,337 | 109,158 | 84,459 | |||||||||
Bank-owned life insurance | 1,306 | 1,259 | 1,207 | |||||||||
Restricted investment in bank stocks | 627 | 508 | 387 | |||||||||
Premises and equipment, net | 3,960 | 3,868 | 3,854 | |||||||||
Accrued interest receivable | 425 | 394 | 287 | |||||||||
Other assets | 1,374 | 1,647 | 682 | |||||||||
|
|
|
|
|
| |||||||
Total Assets | $ | 141,319 | $ | 127,296 | $ | 107,011 | ||||||
|
|
|
|
|
| |||||||
Liabilities and Equity | ||||||||||||
Total deposits | $ | 120,126 | $ | 112,338 | $ | 95,653 | ||||||
Borrowings | 7,665 | 2,000 | — | |||||||||
Other liabilities | 570 | 406 | 283 | |||||||||
|
|
|
|
|
| |||||||
Total Liabilities | 128,361 | 114,744 | 95,936 | |||||||||
|
|
|
|
|
| |||||||
Preferred stock, Series E non-cum., convertible | 2,616 | 2,616 | 2,616 | |||||||||
Preferred stock, Series F cumulative, non-conv. | 3,431 | 3,431 | 3,431 | |||||||||
Common stock | 1,025 | 1,025 | 1,025 | |||||||||
Surplus | 9,221 | 9,221 | 9,221 | |||||||||
Accumulated deficit | (3,356 | ) | (3,848 | ) | (5,164 | ) | ||||||
Accumulated other comprehensive income (loss) | 21 | 107 | (54 | ) | ||||||||
|
|
|
|
|
| |||||||
Total Equity | 12,958 | 12,552 | 11,075 | |||||||||
|
|
|
|
|
| |||||||
Total Liabilities and Equity | $ | 141,319 | $ | 127,296 | $ | 107,011 | ||||||
|
|
|
|
|
| |||||||
Source: Victory Bancorp, financial statements.
II-8
FELDMAN FINANCIAL ADVISORS, INC.
Exhibit II-9
Consolidated Income Statements
The Victory Bancorp, Inc.
For the Years Ended December 31, 2011 to 2013
(Dollars in Thousands)
| Year Ended December 31, | ||||||||||||
| 2013 | 2012 | 2011 | ||||||||||
Total interest income | $ | 6,839 | $ | 5,707 | $ | 4,722 | ||||||
Total interest expense | 1,030 | 1,074 | 1,091 | |||||||||
|
|
|
|
|
| |||||||
Net interest income | 5,809 | 4,633 | 3,631 | |||||||||
Provision for loan losses | 348 | 472 | 279 | |||||||||
|
|
|
|
|
| |||||||
Net interest income after provision | 5,461 | 4,161 | 3,352 | |||||||||
Service charges and activity fees | 145 | 140 | 97 | |||||||||
Gains on sales of loans, net | 680 | 123 | 579 | |||||||||
Gains on sales of securities, net | 45 | — | — | |||||||||
Other non-interest income | 99 | 106 | 53 | |||||||||
|
|
|
|
|
| |||||||
Total non-interest income | 969 | 369 | 729 | |||||||||
|
|
|
|
|
| |||||||
Salaries and employee benefits | 2,842 | 2,307 | 1,896 | |||||||||
Occupancy and equipment | 409 | 368 | 438 | |||||||||
Legal and professional fees | 545 | 260 | 239 | |||||||||
Advertising and promotion | 122 | 98 | 70 | |||||||||
Loan expenses | 80 | 33 | 36 | |||||||||
Data processing costs | 579 | 461 | 434 | |||||||||
FDIC premiums | 83 | 102 | 99 | |||||||||
Shares tax | 91 | 82 | 74 | |||||||||
Other expenses | 496 | 346 | 265 | |||||||||
|
|
|
|
|
| |||||||
Total non-interest expense | 5,247 | 4,057 | 3,551 | |||||||||
|
|
|
|
|
| |||||||
Income before income taxes | 1,183 | 473 | 530 | |||||||||
Income tax expense (benefit) | 473 | (1,060 | ) | (200 | ) | |||||||
|
|
|
|
|
| |||||||
Net income | $ | 710 | $ | 1,533 | $ | 730 | ||||||
|
|
|
|
|
| |||||||
Preferred stock dividends | 218 | 217 | 233 | |||||||||
|
|
|
|
|
| |||||||
Net income available to common shareholders | $ | 492 | $ | 1,316 | $ | 507 | ||||||
|
|
|
|
|
| |||||||
Source: Victory Bancorp, financial statements.
II-9
FELDMAN FINANCIAL ADVISORS, INC.
Exhibit III
Financial and Market Data for All Public Thrifts
Company | State | Ticker | Total Assets ($Mil.) | Total Equity/ Assets (%) | Tang. Equity/ Assets (%) | LTM ROA (%) | LTM ROE (%) | Closing Price 4/15/14 ($) | Total Market Value ($Mil.) | Price/ LTM EPS (x) | Price/ Core EPS (x) | Price/ Book Value (%) | Price/ Tang. Book (%) | Price/ Total Assets (%) | Div. Yield (%) | |||||||||||||||||||||||||||||||||||||||||
All Public Thrifts(1) | ||||||||||||||||||||||||||||||||||||||||||||||||||||||||
Alliance Bancorp, Inc. | PA | ALLB | 426 | 16.49 | 16.49 | 0.32 | 1.80 | 15.46 | 67.1 | 53.3 | 53.3 | 98.4 | 98.4 | 16.23 | 1.29 | |||||||||||||||||||||||||||||||||||||||||
Anchor Bancorp | WA | ANCB | 391 | 13.33 | 13.33 | (0.23 | ) | (1.93 | ) | 18.80 | 47.9 | NM | NM | 91.9 | 91.9 | 12.25 | 0.00 | |||||||||||||||||||||||||||||||||||||||
ASB Bancorp, Inc. | NC | ASBB | 733 | 13.79 | 13.79 | 0.19 | 1.37 | 17.76 | 89.3 | 57.3 | 68.7 | 88.5 | 88.5 | 12.21 | 0.00 | |||||||||||||||||||||||||||||||||||||||||
Astoria Financial Corp. | NY | AF | 15,794 | 9.62 | 8.55 | 0.41 | 4.69 | 12.98 | 1,288.5 | 21.6 | 22.1 | 92.3 | 106.5 | 8.19 | 1.23 | |||||||||||||||||||||||||||||||||||||||||
Athens Bancshares Corp. | TN | AFCB | 295 | 13.94 | 13.89 | 0.78 | 5.23 | 20.25 | 37.5 | 17.9 | 17.5 | 93.2 | 93.6 | 12.99 | 0.99 | |||||||||||||||||||||||||||||||||||||||||
Atlantic Coast Financial Corp. | FL | ACFC | 734 | 8.93 | 8.93 | (1.55 | ) | (30.40 | ) | 4.12 | 63.9 | NM | NM | 97.5 | 97.5 | 8.71 | 0.00 | |||||||||||||||||||||||||||||||||||||||
Bank Mutual Corp. | WI | BKMU | 2,347 | 12.10 | 12.09 | 0.46 | 3.91 | 6.06 | 282.1 | 26.3 | 26.0 | 100.1 | 100.2 | 12.00 | 1.98 | |||||||||||||||||||||||||||||||||||||||||
BankFinancial Corp. | IL | BFIN | 1,454 | 12.08 | 11.93 | 0.23 | 1.89 | 9.93 | 209.5 | 62.1 | 55.5 | 119.3 | 121.0 | 14.42 | 0.40 | |||||||||||||||||||||||||||||||||||||||||
Berkshire Hills Bancorp, Inc. | MA | BHLB | 5,673 | 11.95 | 7.54 | 0.78 | 6.09 | 24.74 | 621.1 | 15.0 | 12.2 | 91.3 | 152.0 | 10.92 | 2.91 | |||||||||||||||||||||||||||||||||||||||||
BofI Holding, Inc. | CA | BOFI | 3,568 | 8.73 | 8.73 | 1.54 | 17.05 | 80.16 | 1,131.6 | 24.4 | 23.5 | 367.4 | 367.4 | 31.61 | 0.00 | |||||||||||||||||||||||||||||||||||||||||
Broadway Financial Corp. | CA | BYFC | 332 | 7.70 | 7.70 | (0.09 | ) | (1.47 | ) | 1.22 | 24.7 | NM | NM | 96.4 | 96.4 | 7.42 | 0.00 | |||||||||||||||||||||||||||||||||||||||
BSB Bancorp, Inc. | MA | BLMT | 1,055 | 12.37 | 12.37 | 0.21 | 1.51 | 17.15 | 155.3 | NM | 78.9 | 119.1 | 119.1 | 14.73 | 0.00 | |||||||||||||||||||||||||||||||||||||||||
Cape Bancorp, Inc. | NJ | CBNJ | 1,093 | 12.85 | 10.99 | 0.53 | 3.80 | 10.72 | 127.4 | 23.3 | 21.1 | 92.1 | 109.9 | 11.83 | 2.24 | |||||||||||||||||||||||||||||||||||||||||
Capitol Federal Financial, Inc. | KS | CFFN | 9,111 | 17.23 | 17.23 | 0.76 | 4.25 | 12.39 | 1,798.6 | 25.8 | 25.8 | 116.3 | 116.3 | 20.03 | 2.42 | |||||||||||||||||||||||||||||||||||||||||
Carver Bancorp, Inc. | NY | CARV | 639 | 7.90 | 7.90 | 0.26 | 2.82 | 12.45 | 46.0 | 34.6 | 64.2 | NM | NM | 7.75 | 0.00 | |||||||||||||||||||||||||||||||||||||||||
Central Federal Corp. | OH | CFBK | 256 | 8.94 | 8.94 | (0.39 | ) | (4.04 | ) | 1.55 | 24.5 | NM | NM | 107.3 | 107.3 | 9.59 | 0.00 | |||||||||||||||||||||||||||||||||||||||
Charter Financial Corp. | GA | CHFN | 1,080 | 25.30 | 24.95 | 0.51 | 2.29 | 10.64 | 242.8 | 42.6 | 45.9 | 89.6 | 91.3 | 22.66 | 1.88 | |||||||||||||||||||||||||||||||||||||||||
Cheviot Financial Corp. | OH | CHEV | 587 | 15.49 | 13.90 | 0.24 | 1.43 | 10.53 | 71.8 | 50.1 | 42.0 | 79.2 | 89.9 | 12.26 | 3.42 | |||||||||||||||||||||||||||||||||||||||||
Chicopee Bancorp, Inc. | MA | CBNK | 588 | 15.69 | 15.69 | 0.44 | 2.79 | 17.40 | 94.6 | 34.8 | 33.8 | 102.6 | 102.6 | 16.09 | 1.61 | |||||||||||||||||||||||||||||||||||||||||
Citizens Community Bancorp, Inc. | WI | CZWI | 552 | 9.80 | 9.77 | 0.20 | 2.00 | 7.88 | 40.7 | 37.5 | 26.9 | 75.0 | 75.3 | 7.35 | 0.51 | |||||||||||||||||||||||||||||||||||||||||
Clifton Bancorp Inc. | NJ | CSBK | 1,099 | 17.42 | 17.42 | 0.61 | 3.42 | 11.72 | 311.7 | 45.9 | 48.8 | 158.6 | 158.6 | 27.64 | 2.09 | |||||||||||||||||||||||||||||||||||||||||
CMS Bancorp, Inc. | NY | CMSB | NA | 8.66 | 8.66 | 0.37 | 4.29 | 9.28 | 17.3 | 17.8 | 22.7 | 81.3 | 81.3 | 6.62 | 0.00 | |||||||||||||||||||||||||||||||||||||||||
Coastway Bancorp, Inc. | RI | CWAY | 433 | 6.43 | 6.43 | 0.06 | 0.81 | 10.20 | 50.5 | NA | NA | NA | NA | NA | 0.00 | |||||||||||||||||||||||||||||||||||||||||
Colonial Financial Services, Inc. | NJ | COBK | 583 | 10.15 | 10.15 | (0.30 | ) | (2.87 | ) | 11.16 | 43.1 | NM | NM | 72.7 | 72.7 | 7.37 | 0.00 | |||||||||||||||||||||||||||||||||||||||
Dime Community Bancshares, Inc. | NY | DCOM | 4,028 | 10.81 | 9.56 | 1.09 | 10.58 | 16.53 | 607.0 | 13.4 | 13.5 | 139.3 | 159.8 | 15.07 | 3.39 | |||||||||||||||||||||||||||||||||||||||||
Eagle Bancorp Montana, Inc. | MT | EBMT | 516 | 9.25 | 7.84 | 0.53 | 5.38 | 10.95 | 42.9 | 15.9 | 19.1 | 89.8 | 107.6 | 8.31 | 2.65 | |||||||||||||||||||||||||||||||||||||||||
ESB Financial Corp. | PA | ESBF | 1,907 | 9.75 | 7.73 | 0.83 | 8.36 | 12.55 | 222.6 | 13.9 | NA | NA | NA | NA | 3.19 | |||||||||||||||||||||||||||||||||||||||||
ESSA Bancorp, Inc. | PA | ESSA | 1,355 | 12.29 | 11.57 | 0.58 | 4.68 | 10.75 | 127.8 | 15.4 | 14.7 | 77.0 | 82.5 | 9.46 | 2.60 | |||||||||||||||||||||||||||||||||||||||||
EverBank Financial Corp | FL | EVER | 17,641 | 9.19 | 8.92 | 0.75 | 8.88 | 19.06 | 2,338.5 | 18.7 | 16.3 | 158.9 | 164.8 | 13.36 | 0.63 | |||||||||||||||||||||||||||||||||||||||||
First Capital, Inc. | IN | FCAP | 444 | 12.00 | 10.92 | 1.12 | 9.59 | 20.75 | 57.8 | 11.4 | 11.5 | 108.5 | 120.8 | 13.00 | 4.05 | |||||||||||||||||||||||||||||||||||||||||
First Clover Leaf Financial Corp. | IL | FCLF | 622 | 11.75 | 10.07 | 0.55 | 4.40 | 9.30 | 65.2 | 20.2 | 20.6 | 89.2 | 106.1 | 10.48 | 2.58 | |||||||||||||||||||||||||||||||||||||||||
First Connecticut Bancorp, Inc. | CT | FBNK | 2,110 | 11.01 | 11.01 | 0.19 | 1.57 | 15.76 | 263.4 | 65.7 | 70.3 | 111.7 | 111.7 | 12.29 | 0.76 | |||||||||||||||||||||||||||||||||||||||||
First Defiance Financial Corp. | OH | FDEF | 2,137 | 12.73 | 10.00 | 1.08 | 8.39 | 26.97 | 260.3 | 12.3 | 11.8 | 96.3 | 126.6 | 12.27 | 2.22 | |||||||||||||||||||||||||||||||||||||||||
First Federal Bancshares of Arkansas | AR | FFBH | 549 | 12.97 | 12.97 | 0.14 | 1.02 | 9.09 | 182.2 | NM | NM | 255.9 | 255.9 | 33.19 | 0.00 | |||||||||||||||||||||||||||||||||||||||||
First Federal of Nthn. Mich. Bancorp | MI | FFNM | 210 | 11.22 | 11.20 | 0.03 | 0.23 | 4.87 | 14.0 | NM | 101.5 | 59.7 | 59.8 | 6.70 | 1.64 | |||||||||||||||||||||||||||||||||||||||||
First Financial Northwest, Inc. | WA | FFNW | 921 | 20.02 | 20.02 | 2.73 | 13.12 | 10.02 | 164.4 | 6.9 | 6.8 | 89.1 | 89.1 | 17.83 | 2.00 | |||||||||||||||||||||||||||||||||||||||||
III-1
FELDMAN FINANCIAL ADVISORS, INC.
Exhibit III (continued)
Financial and Market Data for All Public Thrifts
Company | State | Ticker | Total Assets ($Mil.) | Total Equity/ Assets (%) | Tang. Equity/ Assets (%) | LTM ROA (%) | LTM ROE (%) | Closing Price 4/15/14 ($) | Total Market Value ($Mil.) | Price/ LTM EPS (x) | Price/ Core EPS (x) | Price/ Book Value (%) | Price/ Tang. Book (%) | Price/ Total Assets (%) | Div. Yield (%) | |||||||||||||||||||||||||||||||||||||||||
First Savings Financial Group, Inc. | IN | FSFG | 687 | 12.00 | 10.71 | 0.71 | 5.64 | 22.60 | 51.1 | 11.3 | 10.8 | 78.3 | 92.3 | 7.63 | 1.95 | |||||||||||||||||||||||||||||||||||||||||
Flagstar Bancorp, Inc. | MI | FBC | 9,407 | 15.16 | 15.16 | 2.13 | 21.56 | 20.07 | 1,128.4 | 4.6 | 3.7 | 97.2 | 97.2 | 12.33 | 0.00 | |||||||||||||||||||||||||||||||||||||||||
Fox Chase Bancorp, Inc. | PA | FXCB | 1,117 | 15.53 | 15.53 | 0.51 | 3.13 | 16.88 | 205.1 | 35.2 | 37.5 | 118.2 | 118.2 | 18.36 | 2.37 | |||||||||||||||||||||||||||||||||||||||||
Franklin Financial Corp. | VA | FRNK | 1,075 | 22.51 | 22.51 | 0.91 | 3.98 | 19.61 | 236.8 | 23.6 | 28.4 | 98.2 | 98.2 | 22.10 | 0.00 | |||||||||||||||||||||||||||||||||||||||||
FS Bancorp, Inc. | WA | FSBW | 419 | 14.87 | 14.87 | 1.01 | 6.43 | 16.37 | 53.0 | 12.7 | 13.7 | 85.1 | 85.1 | 12.65 | 1.22 | |||||||||||||||||||||||||||||||||||||||||
Georgetown Bancorp, Inc. | MA | GTWN | 263 | 11.00 | 11.00 | 0.32 | 2.46 | 14.75 | 27.1 | 36.0 | 36.0 | 93.3 | 93.3 | 10.27 | 1.08 | |||||||||||||||||||||||||||||||||||||||||
Hamilton Bancorp, Inc. | MD | HBK | 300 | 20.46 | 19.70 | (0.38 | ) | (1.86 | ) | 14.00 | 49.2 | NM | NM | 80.1 | 84.0 | 16.39 | 0.00 | |||||||||||||||||||||||||||||||||||||||
Hampden Bancorp, Inc. | MA | HBNK | 694 | 12.19 | 12.19 | 0.55 | 4.31 | 16.00 | 90.4 | 23.9 | 24.4 | 106.8 | 106.8 | 13.02 | 1.50 | |||||||||||||||||||||||||||||||||||||||||
Heritage Financial Group, Inc. | GA | HBOS | 1,381 | 9.06 | 8.78 | 0.87 | 9.37 | 19.22 | 151.5 | 12.8 | 14.3 | 120.4 | 124.6 | 10.90 | 1.46 | |||||||||||||||||||||||||||||||||||||||||
HF Financial Corp. | SD | HFFC | 1,254 | 7.79 | 7.43 | 0.48 | 6.06 | 13.89 | 98.0 | 16.5 | 17.8 | 100.3 | 105.6 | 7.81 | 3.24 | |||||||||||||||||||||||||||||||||||||||||
Hingham Institution for Savings | MA | HIFS | 1,356 | 7.61 | 7.61 | 1.07 | 13.52 | 74.70 | 159.0 | 8.1 | 10.3 | 141.8 | 141.8 | 11.05 | 1.45 | |||||||||||||||||||||||||||||||||||||||||
HMN Financial, Inc. | MN | HMNF | 649 | 13.21 | 13.21 | 4.55 | 42.22 | 9.65 | 42.9 | 1.7 | 1.7 | 71.5 | 71.5 | 6.86 | 0.00 | |||||||||||||||||||||||||||||||||||||||||
Home Bancorp, Inc. | LA | HBCP | 984 | 14.42 | 14.25 | 0.76 | 5.14 | 20.10 | 142.7 | 19.0 | 18.6 | 100.6 | 101.9 | 14.50 | 0.00 | |||||||||||||||||||||||||||||||||||||||||
Home Federal Bancorp, Inc. | LA | HFBL | 286 | 14.46 | 14.46 | 0.94 | 6.18 | 18.10 | 40.7 | 14.8 | 15.0 | 98.6 | 98.6 | 14.25 | 1.33 | |||||||||||||||||||||||||||||||||||||||||
HomeStreet, Inc. | WA | HMST | 3,066 | 8.67 | NA | 0.88 | 9.56 | 18.51 | 274.7 | 11.5 | 10.7 | 103.0 | NA | 8.93 | 0.00 | |||||||||||||||||||||||||||||||||||||||||
HomeTrust Bancshares, Inc. | NC | HTBI | 1,629 | 21.98 | NA | 0.73 | 3.21 | 15.93 | 315.2 | 26.6 | 25.0 | 88.0 | NA | 19.34 | 0.00 | |||||||||||||||||||||||||||||||||||||||||
IF Bancorp, Inc. | IL | IROQ | 568 | 13.89 | 13.89 | 0.64 | 4.22 | 16.10 | 71.3 | 19.2 | 19.3 | 90.9 | 90.9 | 12.63 | 0.62 | |||||||||||||||||||||||||||||||||||||||||
Jacksonville Bancorp, Inc. | IL | JXSB | 318 | 12.92 | 12.17 | 1.02 | 7.51 | 20.65 | 37.5 | 12.4 | 13.4 | 88.6 | 94.6 | 11.92 | 1.55 | |||||||||||||||||||||||||||||||||||||||||
LaPorte Bancorp, Inc. | IN | LPSB | 527 | 15.23 | 13.81 | 0.83 | 4.81 | 10.97 | 64.2 | 15.9 | 17.7 | 81.0 | 90.8 | 12.33 | 1.46 | |||||||||||||||||||||||||||||||||||||||||
Louisiana Bancorp, Inc. | LA | LABC | 317 | 18.29 | 18.29 | 0.86 | 4.81 | 19.76 | 56.6 | 19.2 | 20.7 | 98.4 | 98.4 | 18.01 | 1.01 | |||||||||||||||||||||||||||||||||||||||||
LSB Financial Corp. | IN | LSBI | 368 | 11.08 | 11.08 | 0.70 | 6.37 | 28.83 | 44.9 | 17.8 | 17.8 | 110.8 | 110.8 | 12.27 | 1.25 | |||||||||||||||||||||||||||||||||||||||||
Madison County Financial, Inc. | NE | MCBK | 290 | 21.16 | 20.85 | 1.08 | 4.82 | 18.10 | 55.9 | 17.6 | 17.0 | 89.5 | 91.2 | 18.94 | 1.55 | |||||||||||||||||||||||||||||||||||||||||
Malvern Bancorp, Inc. | PA | MLVF | 594 | 12.56 | 12.56 | (2.99 | ) | (21.51 | ) | 10.45 | 68.5 | NM | NM | 91.9 | 91.9 | 11.54 | 0.00 | |||||||||||||||||||||||||||||||||||||||
Meta Financial Group, Inc. | SD | CASH | 1,807 | 7.89 | 7.77 | 0.81 | 9.96 | 40.55 | 247.7 | 16.5 | 16.7 | 173.1 | 176.1 | 13.67 | 1.28 | |||||||||||||||||||||||||||||||||||||||||
NASB Financial, Inc. | MO | NASB | 1,181 | 16.25 | 16.09 | 1.83 | 11.13 | 24.29 | 191.1 | 9.0 | 8.9 | 99.5 | 100.7 | 16.18 | 0.00 | |||||||||||||||||||||||||||||||||||||||||
Naugatuck Valley Financial Corp. | CT | NVSL | 487 | 11.97 | 11.97 | (1.74 | ) | (13.89 | ) | 7.61 | 53.3 | NM | NM | 91.5 | 91.5 | 10.95 | 0.00 | |||||||||||||||||||||||||||||||||||||||
New Hampshire Thrift Bancshares | NH | NHTB | 1,424 | 10.48 | 6.84 | 0.66 | 5.86 | 14.70 | 120.8 | 13.5 | 13.3 | 94.6 | 166.7 | 8.55 | 3.54 | |||||||||||||||||||||||||||||||||||||||||
New York Community Bancorp | NY | NYCB | 46,688 | 12.29 | 7.42 | 1.07 | 8.46 | 15.95 | 7,052.5 | 14.8 | 14.9 | 122.6 | 214.1 | 15.06 | 6.27 | |||||||||||||||||||||||||||||||||||||||||
Northfield Bancorp, Inc. | NJ | NFBK | 2,703 | 26.50 | 26.03 | 0.70 | 2.70 | 12.58 | 699.9 | 37.0 | 39.4 | 101.8 | 104.2 | 26.96 | 1.91 | |||||||||||||||||||||||||||||||||||||||||
Northwest Bancshares, Inc. | PA | NWBI | 7,881 | 14.68 | 12.72 | 0.84 | 5.88 | 14.82 | 1,398.9 | 20.3 | 21.2 | 120.7 | 142.5 | 17.72 | 3.51 | |||||||||||||||||||||||||||||||||||||||||
Ocean Shore Holding Co. | NJ | OSHC | 1,020 | 10.41 | 9.95 | 0.51 | 5.02 | 14.90 | 101.1 | 18.4 | 18.0 | 96.8 | 101.9 | 10.08 | 1.61 | |||||||||||||||||||||||||||||||||||||||||
OceanFirst Financial Corp. | NJ | OCFC | 2,250 | 9.53 | 9.53 | 0.71 | 7.51 | 17.24 | 300.1 | 18.1 | 15.1 | 139.8 | 139.8 | 13.32 | 2.78 | |||||||||||||||||||||||||||||||||||||||||
OmniAmerican Bancorp, Inc. | TX | OABC | 1,391 | 14.89 | 14.89 | 0.48 | 3.12 | 22.63 | 259.4 | 37.1 | 46.8 | 125.1 | 125.1 | 18.63 | 0.88 | |||||||||||||||||||||||||||||||||||||||||
Oneida Financial Corp. | NY | ONFC | 742 | 12.22 | 8.96 | 0.86 | 6.59 | 12.44 | 87.4 | 14.3 | 13.5 | 96.4 | 136.4 | 11.77 | 3.86 | |||||||||||||||||||||||||||||||||||||||||
Oritani Financial Corp. | NJ | ORIT | 2,942 | 17.67 | 17.67 | 1.49 | 8.07 | 15.28 | 698.4 | 15.8 | 16.1 | 134.4 | 134.4 | 23.74 | 4.58 | |||||||||||||||||||||||||||||||||||||||||
Peoples Federal Bancshares, Inc. | MA | PEOP | 588 | 17.88 | 17.88 | 0.37 | 2.01 | 17.98 | 115.2 | 51.4 | 51.4 | 109.9 | 109.9 | 19.65 | 0.89 | |||||||||||||||||||||||||||||||||||||||||
People’s United Financial, Inc. | CT | PBCT | 33,214 | 13.75 | 7.85 | 0.75 | 4.89 | 14.83 | 4,600.7 | 20.0 | 18.6 | 99.6 | 186.5 | 13.70 | 4.38 | |||||||||||||||||||||||||||||||||||||||||
III-2
FELDMAN FINANCIAL ADVISORS, INC.
Exhibit III (continued)
Financial and Market Data for All Public Thrifts
Company | State | Ticker | Total Assets ($Mil.) | Total Equity/ Assets (%) | Tang. Equity/ Assets (%) | LTM ROA (%) | LTM ROE (%) | Closing Price 4/15/14 ($) | Total Market Value ($Mil.) | Price/ LTM EPS (x) | Price/ Core EPS (x) | Price/ Book Value (%) | Price/ Tang. Book (%) | Price/ Total Assets (%) | Div. Yield (%) | |||||||||||||||||||||||||||||||||||||||||
Poage Bankshares, Inc. | KY | PBSK | 289 | 19.93 | 19.93 | NA | NA | 14.50 | 56.6 | NA | NA | 84.2 | 84.2 | 16.78 | 1.38 | |||||||||||||||||||||||||||||||||||||||||
Polonia Bancorp, Inc. | PA | PBCP | 306 | 13.19 | 13.19 | (0.09 | ) | (0.60 | ) | 9.99 | 34.6 | NM | NM | 87.0 | 87.0 | 11.48 | 0.00 | |||||||||||||||||||||||||||||||||||||||
Provident Financial Holdings, Inc. | CA | PROV | 1,134 | 13.44 | 13.44 | 1.11 | 8.44 | 14.42 | 142.1 | 11.6 | 11.6 | 93.2 | 93.2 | 12.53 | 2.77 | |||||||||||||||||||||||||||||||||||||||||
Provident Financial Services, Inc. | NJ | PFS | 7,487 | 13.50 | 9.19 | 0.97 | 7.08 | 17.40 | 1,047.3 | 14.1 | 14.2 | 103.1 | 159.1 | 13.92 | 3.45 | |||||||||||||||||||||||||||||||||||||||||
Prudential Bancorp, Inc. | PA | PBIP | 525 | 24.84 | 24.84 | 0.36 | 2.40 | 10.74 | 102.5 | 54.0 | 76.5 | 78.6 | 78.6 | 19.52 | 0.00 | |||||||||||||||||||||||||||||||||||||||||
Pulaski Financial Corp. | MO | PULB | 1,294 | 9.04 | 8.76 | 0.72 | 7.58 | 10.45 | 118.8 | 14.9 | 14.9 | 115.6 | 120.4 | 9.01 | 3.64 | |||||||||||||||||||||||||||||||||||||||||
Riverview Bancorp, Inc. | WA | RVSB | 805 | 10.15 | 7.20 | 0.56 | 5.42 | 3.43 | 77.1 | 17.2 | 17.3 | 94.8 | 138.5 | 9.58 | 0.00 | |||||||||||||||||||||||||||||||||||||||||
Rockville Financial, Inc. | CT | RCKB | 2,302 | 13.01 | 12.97 | 0.67 | 4.67 | 13.44 | 349.2 | 24.9 | 22.0 | 116.6 | 117.0 | 15.16 | 2.98 | |||||||||||||||||||||||||||||||||||||||||
Severn Bancorp, Inc. | MD | SVBI | 800 | 10.35 | 10.31 | (3.00 | ) | (24.45 | ) | 4.52 | 45.5 | NM | NM | 81.1 | 81.6 | 5.89 | 0.00 | |||||||||||||||||||||||||||||||||||||||
SI Financial Group, Inc. | CT | SIFI | 1,346 | 11.35 | 10.04 | (0.08 | ) | (0.63 | ) | 11.67 | 149.4 | NM | 57.5 | 97.7 | 112.1 | 11.09 | 1.03 | |||||||||||||||||||||||||||||||||||||||
Simplicity Bancorp, Inc. | CA | SMPL | 855 | 16.50 | 16.12 | 0.72 | 4.28 | 17.02 | 128.6 | 21.3 | 21.3 | 95.1 | 97.8 | 15.69 | 1.88 | |||||||||||||||||||||||||||||||||||||||||
SP Bancorp, Inc. | TX | SPBC | 304 | 10.79 | 10.79 | 0.41 | 3.73 | 20.50 | 32.9 | 25.3 | 24.5 | 100.8 | 100.8 | 10.88 | 0.00 | |||||||||||||||||||||||||||||||||||||||||
State Investors Bancorp, Inc. | LA | SIBC | 259 | 16.07 | 16.07 | 0.20 | 1.19 | 15.40 | 36.1 | NM | 77.0 | 88.6 | 88.6 | 14.23 | 0.00 | |||||||||||||||||||||||||||||||||||||||||
Territorial Bancorp Inc. | HI | TBNK | 1,617 | 13.12 | NA | 0.93 | 6.73 | 20.55 | 206.6 | 13.8 | 16.3 | 97.4 | NA | 12.77 | 2.73 | |||||||||||||||||||||||||||||||||||||||||
TF Financial Corp. | PA | THRD | 836 | 11.35 | 10.84 | 0.85 | 7.40 | 30.89 | 97.3 | 13.6 | 14.0 | 102.5 | 108.0 | 11.64 | 1.55 | |||||||||||||||||||||||||||||||||||||||||
Timberland Bancorp, Inc. | WA | TSBK | 728 | 10.86 | 10.16 | 0.63 | 5.19 | 11.00 | 77.5 | 19.3 | 21.6 | 98.0 | 105.7 | 10.65 | 1.45 | |||||||||||||||||||||||||||||||||||||||||
TrustCo Bank Corp NY | NY | TRST | 4,521 | 8.00 | 7.99 | 0.90 | 11.15 | 6.76 | 639.3 | 16.0 | 16.5 | 176.5 | 176.8 | 14.12 | 3.88 | |||||||||||||||||||||||||||||||||||||||||
United Community Bancorp | IN | UCBA | 512 | 14.49 | 13.96 | 0.52 | 3.77 | 11.06 | 57.0 | 19.8 | 21.4 | 76.7 | 80.1 | 11.12 | 2.17 | |||||||||||||||||||||||||||||||||||||||||
United Community Financial Corp. | OH | UCFC | 1,738 | 10.07 | 10.07 | 0.56 | 5.32 | 3.62 | 182.5 | 51.7 | 103.4 | 104.1 | 104.2 | 10.49 | 0.00 | |||||||||||||||||||||||||||||||||||||||||
Waterstone Financial, Inc. | WI | WSBF | 1,947 | 11.02 | 10.99 | 0.90 | 7.01 | 10.18 | 350.1 | 23.7 | 23.7 | 163.3 | 163.7 | 17.99 | 1.96 | |||||||||||||||||||||||||||||||||||||||||
Wayne Savings Bancshares, Inc. | OH | WAYN | 410 | 9.40 | 9.01 | 0.51 | 5.24 | 11.30 | 32.1 | 15.7 | 15.3 | 83.3 | 87.3 | 7.83 | 2.83 | |||||||||||||||||||||||||||||||||||||||||
Wellesley Bancorp, Inc. | MA | WEBK | 459 | 10.20 | 10.20 | 0.55 | 5.09 | 19.25 | 47.2 | 19.8 | 20.5 | 101.0 | 101.0 | 10.30 | 0.00 | |||||||||||||||||||||||||||||||||||||||||
Westbury Bancorp, Inc. | WI | WBB | 536 | 16.94 | 16.94 | 0.03 | 0.21 | 14.30 | 73.5 | NA | NA | 81.1 | 81.1 | 13.73 | 0.00 | |||||||||||||||||||||||||||||||||||||||||
Westfield Financial, Inc. | MA | WFD | 1,277 | 12.07 | 12.07 | 0.53 | 4.04 | 7.20 | 143.0 | 21.2 | 32.8 | 94.1 | 94.1 | 11.36 | 3.33 | |||||||||||||||||||||||||||||||||||||||||
Wolverine Bancorp, Inc. | MI | WBKC | 298 | 20.26 | 20.26 | 0.54 | 2.48 | 21.75 | 49.9 | 31.5 | 31.5 | 82.8 | 82.8 | 16.78 | 0.00 | |||||||||||||||||||||||||||||||||||||||||
WSFS Financial Corp. | DE | WSFS | 4,516 | 8.48 | 7.69 | 1.07 | 11.60 | 69.00 | 614.9 | 13.6 | 14.9 | 160.2 | 178.4 | 13.59 | 0.70 | |||||||||||||||||||||||||||||||||||||||||
WVS Financial Corp. | PA | WVFC | 314 | 10.28 | 10.28 | 0.29 | 2.55 | 11.59 | 23.9 | 30.5 | 31.1 | 73.9 | 73.9 | 7.60 | 1.38 | |||||||||||||||||||||||||||||||||||||||||
Average | NA | NA | 2,531 | 13.11 | 12.45 | 0.55 | 4.27 | NA | 355.4 | 23.2 | 27.6 | 105.9 | 114.2 | 13.50 | 1.46 | |||||||||||||||||||||||||||||||||||||||||
Median | NA | NA | 836 | 12.25 | 11.20 | 0.58 | 4.68 | NA | 101.8 | 18.8 | 20.5 | 97.4 | 101.9 | 12.33 | 1.35 | |||||||||||||||||||||||||||||||||||||||||
| (1) | Public thrifts traded on NYSE, NYSE MKT, or NASDAQ; excludes companies subject to pending acquisitions or mutual holding company ownership. |
Source: SNL Financial; Feldman Financial.
III-3
FELDMAN FINANCIAL ADVISORS, INC.
Exhibit IV-1
Pro Forma Assumptions for Conversion Stock Offering
| 1. | The total amount of the net offering proceeds was fully invested at the beginning of the applicable period. |
| 2. | The net offering proceeds are invested to yield a return of 1.75%, which represented the yield on five-year U.S. Treasury securities at December 31, 2013. The effective corporate income tax rate was assumed to be 34.0%, resulting in a net after-tax yield of 1.16%. |
| 3. | It is assumed that 6% of the total shares of common stock to be outstanding after completion of the conversion, including shares issued to Victory Bancorp shareholders in the merger, will be acquired by the employee stock ownership plan (“ESOP”). Pro forma adjustments have been made to earnings and equity to reflect the impact of the ESOP. The annual expense is estimated based on a 25-year loan to the ESOP from HV Bancorp. No re-investment is assumed on proceeds used to fund the ESOP. |
| 4. | It is assumed that that the restricted stock plan (“RSP”) will purchase in the open market a number of shares equal to 4% of the total shares to be outstanding after completion of the conversion, including shares issued to Victory Bancorp shareholders in the merger. Also, it is assumed that these shares are acquired at the initial public offering price of $10.00 per share. Pro forma adjustments have been made to earnings and equity to reflect the impact of the RSP. The annual expense is estimated based on a five-year vesting period. No re-investment is assumed on proceeds used to fund the RSP. |
| 5. | It is assumed that an additional 10% of the total shares to be outstanding after completion of the conversion, including shares issued to Victory Bancorp shareholders in the merger, will be reserved for issuance by HV Bancorp’s stock option plan. Pro forma net income has been adjusted to reflect the expense associated with the granting of options at an assumed options value of $3.33 per share. It is further assumed that options for all shares reserved under the plan were granted to plan participants at the beginning of the period, 25% of the options granted were non-qualified options for income tax purposes, the options would vest at a rate of 20% per year, and compensation expense will be recognized on a straight-line basis over the five-year vesting period |
| 6. | The fair value of stock options has been estimated at $3.33 per option using the Black-Scholes option pricing model with the following assumptions: a grant-date share price and option exercise price of $10.00; dividend yield of 0.00%; an expected option life of 10 years; a risk-free interest rate of 3.04%; and a volatility rate of 15.82% based on an index of publicly traded thrift institutions. |
| 7. | Total offering expenses, including marketing agent fees and expenses, are estimated at $1.0 million at the midpoint, and range from $973,000 at the minimum to $1.1 million at the adjusted maximum. |
| 8. | No effect has been given in the pro forma equity calculation for the assumed earnings on the net proceeds. |
| 9. | No effect has been given to withdrawals from deposit accounts for the purpose of purchasing common stock in the offering. |
IV-1
FELDMAN FINANCIAL ADVISORS, INC.
Exhibit IV-2
HV Bancorp, Inc.
Pro Forma Conversion Valuation Range
Historical Financial Data as of December 31, 2013
(Dollars in Thousands, Except Per Share Data)
| Minimum | Midpoint | Maximum | Adj. Max. | |||||||||||||
Shares outstanding | 1,650,485 | 1,941,748 | 2,196,804 | 2,369,304 | ||||||||||||
Shares sold in conversion offering | 850,000 | 1,000,000 | 1,150,000 | 1,322,500 | ||||||||||||
Shares issued in Victory Bancorp merger | 800,485 | 941,748 | 1,046,804 | 1,046,804 | ||||||||||||
Shares sold in offering (%) | 51.50 | % | 51.50 | % | 52.35 | % | 55.82 | % | ||||||||
Shares issued in merger (%) | 48.50 | % | 48.50 | % | 47.65 | % | 44.18 | % | ||||||||
Offering price | $ | 10.00 | $ | 10.00 | $ | 10.00 | $ | 10.00 | ||||||||
Pro forma market value | $ | 16,505 | $ | 19,417 | $ | 21,968 | $ | 23,693 | ||||||||
Gross offering proceeds | $ | 8,500 | $ | 10,000 | $ | 11,500 | $ | 13,225 | ||||||||
Less: estimated offering expenses | (973 | ) | (1,016 | ) | (1,060 | ) | (1,115 | ) | ||||||||
|
|
|
|
|
|
|
| |||||||||
Net offering proceeds | 7,527 | 8,984 | 10,440 | 12,110 | ||||||||||||
Less: ESOP purchase | (990 | ) | (1,165 | ) | (1,318 | ) | (1,422 | ) | ||||||||
Less: RSP purchase | (660 | ) | (777 | ) | (879 | ) | (948 | ) | ||||||||
|
|
|
|
|
|
|
| |||||||||
Net investable proceeds from offering | $ | 5,877 | $ | 7,042 | $ | 8,243 | $ | 9,740 | ||||||||
Net Income (available to common): | ||||||||||||||||
LTM ended 12/31/13 - HV Bank | 9 | 9 | 9 | 9 | ||||||||||||
LTM ended 12/31/13 - Victory Bancorp | 492 | 492 | 492 | 492 | ||||||||||||
Pro forma income on net proceeds | 68 | 82 | 96 | 113 | ||||||||||||
Pro forma impact of funding the merger | (25 | ) | (9 | ) | (4 | ) | (4 | ) | ||||||||
Pro forma subordinated debt cost | (28 | ) | (28 | ) | 0 | 0 | ||||||||||
Pro forma merger adjustments | (172 | ) | (172 | ) | (172 | ) | (172 | ) | ||||||||
Pro forma ESOP adjustment | (26 | ) | (31 | ) | (35 | ) | (38 | ) | ||||||||
Pro forma RSP adjustment | (87 | ) | (103 | ) | (116 | ) | (125 | ) | ||||||||
Pro forma option adjustment | (101 | ) | (118 | ) | (134 | ) | (144 | ) | ||||||||
|
|
|
|
|
|
|
| |||||||||
Pro forma net income for common | 130 | 122 | 135 | 131 | ||||||||||||
|
|
|
|
|
|
|
| |||||||||
Pro forma earnings per share | $ | 0.08 | $ | 0.07 | $ | 0.07 | $ | 0.06 | ||||||||
Core Earnings (available to common): | ||||||||||||||||
LTM ended 12/31/13 - HV Bank | (81 | ) | (81 | ) | (81 | ) | (81 | ) | ||||||||
LTM ended 12/31/13 - Victory Bancorp | 593 | 593 | 593 | 593 | ||||||||||||
Pro forma income on net proceeds | 68 | 82 | 96 | 113 | ||||||||||||
Pro forma impact of funding the merger | (25 | ) | (9 | ) | (4 | ) | (4 | ) | ||||||||
Pro forma subordinated debt cost | (28 | ) | (28 | ) | 0 | 0 | ||||||||||
Pro forma merger adjustments | (87 | ) | (87 | ) | (87 | ) | (87 | ) | ||||||||
Pro forma ESOP adjustment | (26 | ) | (31 | ) | (35 | ) | (38 | ) | ||||||||
Pro forma RSP adjustment | (87 | ) | (103 | ) | (116 | ) | (125 | ) | ||||||||
Pro forma option adjustment | (101 | ) | (118 | ) | (134 | ) | (144 | ) | ||||||||
|
|
|
|
|
|
|
| |||||||||
Pro forma core earnings | 227 | 218 | 232 | 227 | ||||||||||||
|
|
|
|
|
|
|
| |||||||||
Pro forma core earnings per share | $ | 0.15 | $ | 0.12 | $ | 0.11 | $ | 0.10 | ||||||||
Total Equity | ||||||||||||||||
Historical 12/31/13 - HV Bank | $ | 10,261 | $ | 10,261 | $ | 10,261 | $ | 10,261 | ||||||||
Net offering proceeds | 7,527 | 8,984 | 10,440 | 12,110 | ||||||||||||
Common equity issued in merger | 8,005 | 9,417 | 10,468 | 10,468 | ||||||||||||
Preferred equity assumed in merger | 3,431 | 3,431 | 3,431 | 3,431 | ||||||||||||
Less: merger expenses | (161 | ) | (161 | ) | (161 | ) | (161 | ) | ||||||||
Less: ESOP purchase | (990 | ) | (1,165 | ) | (1,318 | ) | (1,422 | ) | ||||||||
Less: RSP purchase | (660 | ) | (777 | ) | (879 | ) | (948 | ) | ||||||||
|
|
|
|
|
|
|
| |||||||||
Pro forma total equity | $ | 27,413 | $ | 29,990 | $ | 32,242 | $ | 33,739 | ||||||||
|
|
|
|
|
|
|
| |||||||||
Pro forma common equity | $ | 23,982 | $ | 26,559 | $ | 28,811 | $ | 30,308 | ||||||||
|
|
|
|
|
|
|
| |||||||||
Pro forma common book value | $ | 14.53 | $ | 13.68 | $ | 13.11 | $ | 12.79 | ||||||||
IV-2
FELDMAN FINANCIAL ADVISORS, INC.
Exhibit IV-2 (continued)
HV Bancorp, Inc.
Pro Forma Conversion Valuation Range
Historical Financial Data as of December 31, 2013
(Dollars in Thousands, Except Per Share Data)
| Minimum | Midpoint | Maximum | Adj. Max. | |||||||||||||
Shares outstanding | 1,650,485 | 1,941,748 | 2,196,804 | 2,369,304 | ||||||||||||
Shares sold in conversion offering | 850,000 | 1,000,000 | 1,150,000 | 1,322,500 | ||||||||||||
Shares issued in Victory Bancorp merger | 800,485 | 941,748 | 1,046,804 | 1,046,804 | ||||||||||||
Shares sold in offering (%) | 51.50 | % | 51.50 | % | 52.35 | % | 55.82 | % | ||||||||
Shares issued in merger (%) | 48.50 | % | 48.50 | % | 47.65 | % | 44.18 | % | ||||||||
Offering price | $ | 10.00 | $ | 10.00 | $ | 10.00 | $ | 10.00 | ||||||||
Pro forma market value | $ | 16,505 | $ | 19,417 | $ | 21,968 | $ | 23,693 | ||||||||
Gross offering proceeds | $ | 8,500 | $ | 10,000 | $ | 11,500 | $ | 13,225 | ||||||||
Less: estimated offering expenses | (973 | ) | (1,016 | ) | (1,060 | ) | (1,115 | ) | ||||||||
|
|
|
|
|
|
|
| |||||||||
Net offering proceeds | 7,527 | 8,984 | 10,440 | 12,110 | ||||||||||||
Less: ESOP purchase | (990 | ) | (1,165 | ) | (1,318 | ) | (1,422 | ) | ||||||||
Less: RSP purchase | (660 | ) | (777 | ) | (879 | ) | (948 | ) | ||||||||
|
|
|
|
|
|
|
| |||||||||
Net investable proceeds from offering | $ | 5,877 | $ | 7,042 | $ | 8,243 | $ | 9,740 | ||||||||
Tangible Equity | ||||||||||||||||
Historical 12/31/13 - HV Bank | $ | 10,261 | $ | 10,261 | $ | 10,261 | $ | 10,261 | ||||||||
Net offering proceeds | 7,527 | 8,984 | 10,440 | 12,110 | ||||||||||||
Common stock issued in merger | 8,005 | 9,417 | 10,468 | 10,468 | ||||||||||||
Preferred stock assumed in merger | 3,431 | 3,431 | 3,431 | 3,431 | ||||||||||||
Less: merger expenses | (161 | ) | (161 | ) | (161 | ) | (161 | ) | ||||||||
Less: intangible assets | (834 | ) | (834 | ) | (1,002 | ) | (1,002 | ) | ||||||||
Less: ESOP purchase | (990 | ) | (1,165 | ) | (1,318 | ) | (1,422 | ) | ||||||||
Less: RSP purchase | (660 | ) | (777 | ) | (879 | ) | (948 | ) | ||||||||
|
|
|
|
|
|
|
| |||||||||
Pro forma tangible equity | $ | 26,579 | $ | 29,156 | $ | 31,240 | $ | 32,737 | ||||||||
|
|
|
|
|
|
|
| |||||||||
Pro forma tangible common equity | $ | 23,148 | $ | 25,725 | $ | 27,809 | $ | 29,306 | ||||||||
|
|
|
|
|
|
|
| |||||||||
Pro forma tangible common book value | $ | 14.02 | $ | 13.25 | $ | 12.66 | $ | 12.37 | ||||||||
Total Assets | ||||||||||||||||
Historical 12/31/13 - HV Bank | $ | 163,423 | $ | 163,423 | $ | 163,423 | $ | 163,423 | ||||||||
Historical 12/31/13 - Victory Bancorp | 141,319 | 141,319 | 141,319 | 141,319 | ||||||||||||
Net offering proceeds | 7,527 | 8,984 | 10,440 | 12,110 | ||||||||||||
Plus: merger adjustments | (945 | ) | 467 | 1,021 | 1,021 | |||||||||||
Less: ESOP purchase | (990 | ) | (1,165 | ) | (1,318 | ) | (1,422 | ) | ||||||||
Less: RSP purchase | (660 | ) | (777 | ) | (879 | ) | (948 | ) | ||||||||
|
|
|
|
|
|
|
| |||||||||
Pro forma total assets | $ | 309,674 | $ | 312,251 | $ | 314,006 | $ | 315,503 | ||||||||
Pro Forma Ratios: | ||||||||||||||||
Price / LTM EPS | 125.0 | 142.9 | 142.9 | 166.7 | ||||||||||||
Price / Core EPS | 66.7 | 83.3 | 90.9 | 100.0 | ||||||||||||
Price / Book Value | 68.8 | % | 73.1 | % | 76.3 | % | 78.2 | % | ||||||||
Price / Tangible Book Value | 71.3 | % | 75.5 | % | 79.0 | % | 80.8 | % | ||||||||
Price / Total Assets | 5.33 | % | 6.22 | % | 7.00 | % | 7.51 | % | ||||||||
Total Equity / Assets | 8.85 | % | 9.60 | % | 10.27 | % | 10.69 | % | ||||||||
Tangible Equity / Assets | 8.61 | % | 9.36 | % | 9.98 | % | 10.41 | % | ||||||||
Tangible Common Equity / Assets | 7.50 | % | 8.26 | % | 8.88 | % | 9.32 | % | ||||||||
Memo Items: | ||||||||||||||||
Total value of acquiring Victory Bancorp | $ | 9,803 | $ | 9,802 | $ | 10,468 | $ | 10,468 | ||||||||
Common portion of merger consideration | 8,005 | 9,417 | 10,468 | 10,468 | ||||||||||||
Cash portion of merger consideration | 1,798 | 385 | 0 | 0 | ||||||||||||
Merger-related expenses | 361 | 361 | 361 | 361 | ||||||||||||
Preferred stock assumed - SBLF | 3,431 | 3,431 | 3,431 | 3,431 | ||||||||||||
Subordinated debt issued | 497 | 497 | 0 | 0 | ||||||||||||
IV-3
FELDMAN FINANCIAL ADVISORS, INC.
Exhibit IV-3
Pro Forma Conversion Analysis at the Midpoint Valuation
HV Bancorp, Inc.
Pro Forma Financial Data as of December 31, 2013
| Symbol | Data | |||||
Pre-Conversion Variables | ||||||
Net income - LTM com. avail. | Y | $ | 292,000 | |||
Core earnings - LTM com. avail. | Y | 389,000 | ||||
Common equity | B | 10,100,000 | ||||
Tangible common equity | TB | 9,266,000 | ||||
Total assets | A | 305,209,000 | ||||
Expenses in conversion | X | 1,016,000 | ||||
Other proceeds not reinvested | O | 1,942,000 | ||||
ESOP purchase | E | 1,165,000 | ||||
ESOP expense (pre-tax) | F | 47,000 | ||||
RSP purchase | M | 777,000 | ||||
RSP expense (pre-tax) | N | 156,000 | ||||
Stock option expense (pre-tax) | Q | 129,000 | ||||
Option expense tax-deductible | D | 25.00 | % | |||
Re-investment rate (after-tax) | R | 1.16 | % | |||
Tax rate | T | 34.00 | % | |||
Shares for EPS | S | 94.24 | % | |||
Pro Forma Valuation Ratios at Maximum Value | ||||||
Price / LTM EPS | P/E | 142.86 | ||||
Price / Core EPS | P/E | 83.33 | ||||
Price / Book Value | P/B | 73.10 | % | |||
Price / Tangible Book | P/TB | 75.47 | % | |||
Price / Assets | P/A | 6.22 | % | |||
Pro Forma Calculation at Maximum Value | Based on | |||||||||||||||
V | = | (P/E/ S)*((Y-R*(O+X)-(F+N)*(1-T)-(Q-Q*D*T))) | = | $ | 19,417,480 | [LTM earnings] | ||||||||||
1 - (P/E* R) | ||||||||||||||||
V | = | (P/E/ S)*((Y-R*(O+X)-(F+N)*(1-T)-(Q-Q*D*T)) | = | $ | 19,417,480 | [Core earnings] | ||||||||||
1 - (P/E* R) | ||||||||||||||||
V | = | P/B* (B - X - E - M) | = | $ | 19,417,480 | [Book value] | ||||||||||
1 -P/B | ||||||||||||||||
V | = | P/TB* (TB - X - E - M) | = | $ | 19,417,480 | [Tangible book] | ||||||||||
1 -P/TB | ||||||||||||||||
V | = | P/A* (A - X - E - M) | = | $ | 19,417,480 | [Total assets] | ||||||||||
1 - P/A | ||||||||||||||||
Pro Forma Offering Range | Merger Shares | Aggregate Pro Forma Value | ||||||||||||||||||||||||
| Minimum = | $ | 10,000,000 | x | 0.85 | = | $8,500,000 | $ | 8,004,850 | $ | 16,504,850 | ||||||||||||||||
| Midpoint = | $ | 10,000,000 | x | 1.00 | = | $10,000,000 | $ | 9,417,480 | $ | 19,417,480 | ||||||||||||||||
| Maximum = | $ | 10,000,000 | x | 1.15 | = | $11,500,000 | $ | 10,468,040 | $ | 21,968,040 | ||||||||||||||||
| Adj. Max. = | $ | 11,500,000 | x | 1.15 | = | $13,225,000 | $ | 10,468,040 | $ | 23,693,040 | ||||||||||||||||
IV-4
FELDMAN FINANCIAL ADVISORS, INC.
Exhibit IV-4
Comparative Valuation Ratio Differential
Pro Forma Conversion Valuation Range
Computed from Market Price Data as of April 15, 2014
| Pro Forma HV Bancorp |
Comparative | |||||||||||||
Valuation Ratio | Symbol | Average | Median | |||||||||||
Price / Book Value | P/B | 89.2 | 87.8 | |||||||||||
Minimum | (%) | 68.8 | -22.9 | % | -21.6 | % | ||||||||
Midpoint | 73.1 | -18.0 | % | -16.7 | % | |||||||||
Maximum | 76.3 | -14.5 | % | -13.1 | % | |||||||||
Adj. Maximum | 78.2 | -12.3 | % | -10.9 | % | |||||||||
Price / Tangible Book | P/TB | 90.3 | 90.2 | |||||||||||
Minimum | (%) | 71.3 | -21.0 | % | -21.0 | % | ||||||||
Midpoint | 75.5 | -16.4 | % | -16.3 | % | |||||||||
Maximum | 79.0 | -12.5 | % | -12.4 | % | |||||||||
Adj. Maximum | 80.8 | -10.5 | % | -10.4 | % | |||||||||
Price / LTM EPS | P/E | 27.6 | 25.8 | |||||||||||
Minimum | (x) | NM | NA | NA | ||||||||||
Midpoint | NM | NA | NA | |||||||||||
Maximum | NM | NA | NA | |||||||||||
Adj. Maximum | NM | NA | NA | |||||||||||
Price / Core EPS | P/E | 28.5 | 29.2 | |||||||||||
Minimum | (x) | NM | NA | NA | ||||||||||
Midpoint | NM | NA | NA | |||||||||||
Maximum | NM | NA | NA | |||||||||||
Adj. Maximum | NM | NA | NA | |||||||||||
Price / Total Assets | P/A | 13.27 | 12.63 | |||||||||||
Minimum | (%) | 5.33 | -59.8 | % | -57.8 | % | ||||||||
Midpoint | 6.22 | -53.1 | % | -50.8 | % | |||||||||
Maximum | 7.00 | -47.3 | % | -44.6 | % | |||||||||
Adj. Maximum | 7.51 | -43.4 | % | -40.5 | % | |||||||||
IV-5