Exhibit 99.2
SAFE HARBOR: Some of the information contained in this presentation includes forward looking statements. Such statements are subject to a number of risks and uncertainties which could cause actual results in the future to differ materially and adversely from those described in the forward-looking statements. Investors should consult the Company’s filings with the Securities and Exchange Commission for a description of the various risks and uncertainties which could cause such a difference before deciding whether to invest.

Table of Contents
| Page |
Income Statement Data | |
Consolidated income statements | 1 |
Consolidated balance sheets | 2 |
Components of minimum rents and other revenue | 3 |
Calculation of funds from operations (FFO) | 4 |
EBITDA, market capitalization and credit facility covenants | 5 |
Net operating income growth for comparable properties | 6 |
| |
Balance Sheet Data | |
Total debt maturities | 7 |
| |
Operational Data | |
Occupancy and rent metrics | 8 |
Leasing results | 9 |
Top 10 tenants | 10 |
Lease expirations | 11 |
| |
Development Activity | |
Capital expenditures | 12 |
Major redevelopment projects | 13 |
| |
Other | |
WP Glimcher property information | 14-21 |
Glossary of terms | 22 |

CONSOLIDATED INCOME STATEMENTS
Washington Prime only
(dollars in thousands, except per share data)
| | | Three Months Ended December 31, | | | | Twelve Months Ended December 31, | |
| | | | | | | | | | | | | | | | |
| | | 2014 | | | | 2013 | | | | 2014 | | | | 2013 | |
Revenue: | | | | | | | | | | | | | | | | |
Minimum rent (see components on page 3) | | | $ | 120,202 | | | | $ | 112,649 | | | | $ | 449,100 | | | | $ | 426,039 | |
Overage rent | | | 4,366 | | | | 3,715 | | | | 9,357 | | | | 8,715 | |
Tenant reimbursements | | | 49,665 | | | | 46,044 | | | | 194,826 | | | | 184,742 | |
Other (see components on page 3) | | | 3,065 | | | | 2,697 | | | | 7,843 | | | | 6,793 | |
Total revenue | | | 177,298 | | | | 165,105 | | | | 661,126 | | | | 626,289 | |
| | | | | | | | | | | | | | | | |
Expenses: | | | | | | | | | | | | | | | | |
Property operating expenses | | | (28,088 | ) | | | (26,556 | ) | | | (109,715 | ) | | | (104,089 | ) |
Real estate taxes | | | (18,458 | ) | | | (17,715 | ) | | | (77,587 | ) | | | (76,216 | ) |
Total recoverable expenses | | | (46,546 | ) | | | (44,271 | ) | | | (187,302 | ) | | | (180,305 | ) |
Depreciation and amortization | | | (55,327 | ) | | | (45,657 | ) | | | (197,890 | ) | | | (182,828 | ) |
Repairs and maintenance | | | (6,178 | ) | | | (6,694 | ) | | | (23,431 | ) | | | (22,584 | ) |
Advertising and promotion | | | (2,551 | ) | | | (2,101 | ) | | | (8,389 | ) | | | (8,316 | ) |
Provision for doubtful accounts | | | (480 | ) | | | (312 | ) | | | (2,332 | ) | | | (572 | ) |
General and administrative | | | (5,959 | ) | | | - | | | | (12,219 | ) | | | - | |
Spin-off costs | | | 1,024 | | | | - | | | | (38,907 | ) | | | - | |
Merger and transaction costs | | | (6,339 | ) | | | - | | | | (8,839 | ) | | | - | |
Ground rent and other costs | | | (1,148 | ) | | | (1,293 | ) | | | (4,656 | ) | | | (4,664 | ) |
Total operating expenses | | | (123,504 | ) | | | (100,328 | ) | | | (483,965 | ) | | | (399,269 | ) |
| | | | | | | | | | | | | | | | |
Operating Income | | | 53,794 | | | | 64,777 | | | | 177,161 | | | | 227,020 | |
| | | | | | | | | | | | | | | | |
Interest expense, net | | | (22,639 | ) | | | (13,811 | ) | | | (82,452 | ) | | | (55,058 | ) |
Income and other taxes | | | (940 | ) | | | (26 | ) | | | (1,215 | ) | | | (196 | ) |
Equity in income of unconsolidated real estate entities, net | | | 127 | | | | 564 | | | | 973 | | | | 1,416 | |
Gain upon acquisition of controlling interests and on sale of interests in properties | | | 10,509 | | | | - | | | | 110,988 | | | | 14,152 | |
| | | | | | | | | | | | | | | | |
Net income | | | 40,851 | | | | 51,504 | | | | 205,455 | | | | 187,334 | |
| | | | | | | | | | | | | | | | |
Net income attributable to noncontrolling interests | | | 7,216 | | | | 8,737 | | | | 35,426 | | | | 31,853 | |
Net income attributable to common shareholders | | | $ | 33,635 | | | | $ | 42,767 | | | | $ | 170,029 | | | | $ | 155,481 | |
| | | | | | | | | | | | | | | | |
Earnings Per Share: | | | | | | | | | | | | | | | | |
Weighted average common shares outstanding - basic | | | 155,163 | | | | 155,163 | | | | 155,163 | | | | 155,163 | |
Weighted average common shares outstanding - diluted | | | 188,195 | | | | 186,738 | | | | 187,491 | | | | 186,738 | |
| | | | | | | | | | | | | | | | |
Earnings per share - basic | | | $ | 0.22 | | | | $ | 0.28 | | | | $ | 1.10 | | | | $ | 1.00 | |
| | | | | | | | | | | | | | | | |
Earnings per share - diluted | | | $ | 0.22 | | | | $ | 0.28 | | | | $ | 1.10 | | | | $ | 1.00 | |

| SUPPLEMENTAL INFORMATION | 1 |
CONSOLIDATED BALANCE SHEETS
Washington Prime only
(dollars in thousands)
| | | December 31 | | | | December 31 | |
| | | 2014 | | | | 2013 | |
Assets: | | | | | | | | |
Investment properties at cost | | | $ | 5,292,665 | | | | $ | 4,789,705 | |
Less accumulated depreciation | | | 2,113,929 | | | | 1,974,949 | |
| | | 3,178,736 | | | | 2,814,756 | |
| | | | | | | | |
Cash and cash equivalents | | | 108,768 | | | | 25,857 | |
Tenant accounts receivable and accrued revenue, net | | | 69,616 | | | | 61,121 | |
Investment in unconsolidated subsidiaries, at equity | | | - | | | | 3,554 | |
Deferred costs and other assets, net | | | 170,883 | | | | 97,370 | |
Total assets | | | $ | 3,528,003 | | | | $ | 3,002,658 | |
| | | | | | | | |
Liabilities: | | | | | | | | |
Mortgage notes payable | | | $ | 1,435,114 | | | | $ | 918,614 | |
Unsecured term loan | | | 500,000 | | | | - | |
Revolving credit facility | | | 413,750 | | | | - | |
Accounts payable, accrued expenses, intangibles and deferred revenues | | | 194,014 | | | | 151,011 | |
Cash distributions and losses in partnerships and joint ventures, at equity | | | 15,298 | | | | 41,313 | |
Other liabilities | | | 11,786 | | | | 7,195 | |
Total liabilities | | | 2,569,962 | | | | 1,118,133 | |
| | | | | | | | |
Equity: | | | | | | | | |
Stockholders’ equity | | | | | | | | |
Common stock | | | 16 | | | | - | |
Capital in excess of par value | | | 720,921 | | | | - | |
SPG equity | | | - | | | | 1,565,169 | |
Retained earnings | | | 68,114 | | | | - | |
Total stockholders’ equity | | | 789,051 | | | | 1,565,169 | |
Noncontrolling interests | | | 168,990 | | | | 319,356 | |
Total equity | | | 958,041 | | | | 1,884,525 | |
Total liabilities and equity | | | $ | 3,528,003 | | | | $ | 3,002,658 | |

| SUPPLEMENTAL INFORMATION | 2 |
COMPONENTS OF MINIMUM RENTS AND OTHER REVENUE
Washington Prime only
(dollars in thousands)
| | | Three Months Ended December 31, | | | | Twelve Months Ended December 31, | |
| | | 2014 | | | | 2013 | | | | 2014 | | | | 2013 | |
| | | | | | | | | | | | | | | | |
Components of Minimum Rents: | | | | | | | | | | | | | | | | |
| | | | | | | | | | | | | | | | |
Base rent | | | $ | 120,365 | | | | $ | 112,386 | | | | $ | 448,799 | | | | $ | 425,845 | |
Straight-line rents | | | (163 | ) | | | 263 | | | | 301 | | | | 194 | |
Total Minimum Rents | | | $ | 120,202 | | | | $ | 112,649 | | | | $ | 449,100 | | | | $ | 426,039 | |
| | | | | | | | | | | | | | | | |
Components of Other Revenue: | | | | | | | | | | | | | | | | |
Sponsorship and other ancillary property income | | | $ | 1,457 | | | | $ | 1,748 | | | | $ | 4,035 | | | | $ | 5,169 | |
Lease termination income | | | 973 | | | | 327 | | | | 1,551 | | | | 473 | |
Gain on land sales | | | 17 | | | | 348 | | | | 830 | | | | 380 | |
Other | | | 618 | | | | 274 | | | | 1,427 | | | | 771 | |
Total Other Revenue | | | $ | 3,065 | | | | $ | 2,697 | | | | $ | 7,843 | | | | $ | 6,793 | |

| SUPPLEMENTAL INFORMATION | 3 |
CALCULATION OF FUNDS FROM OPERATIONS (INCLUDING PRO-RATA SHARE OF JOINT VENTURES)
Washington Prime only
(dollars in thousands, except per share data)
| | Three months Ended
December 31 | | Twelve months Ended
December 31 |
| | 2014 | | 2013 | | 2014 | | 2013 |
Funds from Operations ("FFO"): | | | | | | | | |
Net income | | $ | 40,851 | | $ | 51,504 | | $ | 205,455 | | $ | 187,334 |
Real estate depreciation and amortization, including joint venture impact | | 55,556 | | 45,535 | | 200,584 | | 186,303 |
Noncontrolling interest portion of depreciation | | - | | (47) | | - | | (165) |
Gain on sale of interests in properties and upon acquisition of controlling interests | | (10,509) | | - | | (110,988) | | (14,152) |
Net income attributable to noncontrolling interest holders in properties | | - | | (35) | | - | | (213) |
FFO | | $ | 85,898 | | $ | 96,957 | | $ | 295,051 | | $ | 359,107 |
| | | | | | | | |
Adjusted Funds from Operations: | | | | | | | | |
FFO | | $ | 85,898 | | $ | 96,957 | | $ | 295,051 | | $ | 359,107 |
Add back: Simon spin-off costs | | (1,024) | | - | | 38,907 | | - |
Add back: Glimcher merger and transaction costs | | 6,339 | | - | | 8,839 | | - |
Adjusted FFO | | $ | 91,213 | | $ | 96,957 | | $ | 342,797 | | $ | 359,107 |
| | | | | | | | |
Weighted average common shares outstanding - diluted | | 188,195 | | 186,738 | | 187,491 | | 186,738 |
| | | | | | | | |
FFO per diluted share | | $ | 0.46 | | $ | 0.52 | | $ | 1.57 | | $ | 1.92 |
Total adjustments | | $ | 0.02 | | - | | 0.25 | | - |
Adjusted FFO per diluted share | | $ | 0.48 | | $ | 0.52 | | $ | 1.83 | | $ | 1.92 |
| | | | | | | | | | | | |
| | | | | | | | | | | | |
| | | | | | | | | | | | |
| | | | | | | | | | | | |
| | | | | | | | | | | | |
| | | | | | | | | | | | |
| | | | | | | | | | | | |
| | | | | | | | | | | | |
| | Three months Ended
December 31 | | Twelve months Ended
December 31 |
| | 2014 | | 2013 | | 2014 | | 2013 |
Supplemental Disclosure of Amounts included in FFO: | | | | | | | | |
Deferred leasing costs | | $ | 4,478 | | $ | 3,070 | | $ | 12,504 | | $ | 10,778 |
Non-cash compensation expense | | $ | 523 | | $ | - | | $ | 1,789 | | $ | - |
Straight-line adjustment as a (decrease) increase to minimum rents | | $ | (163) | | $ | 263 | | $ | 301 | | $ | 194 |
Straight-line and fair market value adj. to ground lease expense recorded as an increase to other operating exp. | | $ | 207 | | $ | 207 | | $ | 824 | | $ | 827 |
Fair value of debt amortized as a decrease to interest expense | | $ | 463 | | $ | 157 | | $ | 1,971 | | $ | 509 |
Intangible and inducement amortization as a net increase to base rents | | $ | 214 | | $ | 189 | | $ | 557 | | $ | 1,152 |
| | | | | | | | | | | | | | | | |

| SUPPLEMENTAL INFORMATION | 4 |
EBITDA, MARKET CAPITALIZATION RATIOS AND CREDIT FACILITY COVENANTS
Washington Prime only
(dollars in thousands)
| | Three months ended
December 31, | | Twelve months ended
December 31, |
| | 2014 | | 2013 | | 2014 | | 2013 |
Calculation of EBITDA: | | | | | | | | |
Net income | | $ | 40,851 | | $ | 51,504 | | $ | 205,455 | | $ | 187,334 |
Interest expense, net | | | 22,639 | | | 13,811 | | | 82,452 | | | 55,058 |
Income and other taxes | | | 940 | | | 26 | | | 1,215 | | | 196 |
Depreciation and amortization | | | 55,327 | | | 45,657 | | | 197,890 | | | 182,828 |
EBITDA | | | 119,757 | | | 110,998 | | | 487,012 | | | 425,416 |
Spin-off costs | | | (1,024) | | | - | | | 38,907 | | | - |
Merger and transaction costs | | | 6,339 | | | - | | | 8,839 | | | - |
Gain upon acquisition of controlling interests and on sale of interests in properties | | (10,509) | | | - | | (110,988) | | | (14,152) |
Adjusted EBITDA | | $ | 114,563 | | $ | 110,998 | | $ | 423,770 | | $ | 411,264 |

| SUPPLEMENTAL INFORMATION | 5 |
NET OPERATING INCOME GROWTH FOR COMPARABLE PROPERTIES
Washington Prime only
Including Pro-Rata Share of Unconsolidated Properties
(dollars in thousands)
| | | | | | | | |
| | | Quarter Ended December 31, | | | | Year Ended December 31, | |
| | | 2014 | | | | 2013 | | | | Variance | | | | 2014 | | | | 2013 | | | | Variance | |
| | | | | | | | | | | | | | | | | | | | | | | | |
Net Income | | | $ | 40,851 | | | | $ | 51,504 | | | | $ | (10,653 | ) | | | $ | 205,455 | | | | $ | 187,334 | | | | $ | 18,121 | |
Income and other taxes | | | 940 | | | | 26 | | | | 914 | | | | 1,215 | | | | 196 | | | | 1,019 | |
Interest expense | | | 22,639 | | | | 13,811 | | | | 8,828 | | | | 82,452 | | | | 55,058 | | | | 27,394 | |
Gain on sale of interests in properties | | | (10,509 | ) | | | - | | | | (10,509 | ) | | | (110,988 | ) | | | (14,152 | ) | | | (96,836 | ) |
Income from unconsolidated entities | | | (127 | ) | | | (564 | ) | | | 437 | | | | (973 | ) | | | (1,416 | ) | | | 443 | |
Operating Income | | | 53,794 | | | | 64,777 | | | | (10,983 | ) | | | 177,161 | | | | 227,020 | | | | (49,859 | ) |
General and administrative | | | 5,959 | | | | - | | | | 5,959 | | | | 12,219 | | | | - | | | | 12,219 | |
Spin-off costs | | | (1,024 | ) | | | - | | | | (1,024 | ) | | | 38,907 | | | | - | | | | 38,907 | |
Merger and transaction costs | | | 6,339 | | | | - | | | | 6,339 | | | | 8,839 | | | | - | | | | 8,839 | |
Depreciation and amortization | | | 55,327 | | | | 45,657 | | | | 9,670 | | | | 197,890 | | | | 182,828 | | | | 15,062 | |
NOI of consolidated properties | | | $ | 120,395 | | | | $ | 110,434 | | | | $ | 9,961 | | | | $ | 435,016 | | | | $ | 409,848 | | | | $ | 25,168 | |
| | | | | | | | | | | | | | | | | | | | | | | | |
NOI of unconsolidated properties | | | 2,914 | | | | 11,408 | | | | (8,494 | ) | | | 25,958 | | | | 44,352 | | | | (18,394 | ) |
| | | | | | | | | | | | | | | | | | | | | | | | |
Total NOI of our portfolio | | | $ | 123,309 | | | | $ | 121,842 | | | | $ | 1,467 | | | | $ | 460,974 | | | | $ | 454,200 | | | | $ | 6,774 | |
| | | | | | | | | | | | | | | | | | | | | | | | |
Less NOI from non-comparable properties (1) | | | 4,088 | | | | 4,714 | | | | (626 | ) | | | 14,921 | | | | 15,326 | | | | (405 | ) |
Comparable NOI | | | $ | 119,221 | | | | $ | 117,128 | | | | $ | 2,093 | �� | | | $ | 446,053 | | | | $ | 438,874 | | | | $ | 7,179 | |
Comparable NOI percentage change | | | | | | | | | | | 1.8% | | | | | | | | | | | 1.6% |
(1) Also includes adjustments to exclude non-comparable items such as lease termination fees and sales of outparcels.

| SUPPLEMENTAL INFORMATION | 6 |
TOTAL DEBT MATURITIES (INCLUDES DEBT ASSUMED AT CLOSE OF MERGER)
WP Glimcher - pro-forma adjustments to include GRT
(dollars in thousands)
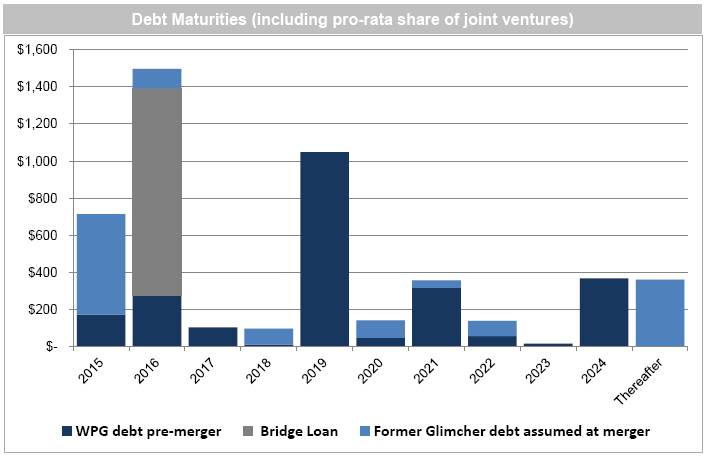
Note: The large maturity in 2016 relates to the bridge loan that will be repaid with the JV and bond offering.

| SUPPLEMENTAL INFORMATION | 7 |
OCCUPANCY AND RENT METRICS
WP Glimcher - pro-forma adjustments to include GRT
As of December 31, 2014
| | | | | |
| | December 31, | | December 31, | |
| | | | | |
| | 2014 | | 2013 | |
| | | | | |
Malls: | | | | | |
| | | | | |
Occupancy | | 91.7% | | 91.7% | |
| | | | | |
Occupancy cost | | 13.1% | | 13.1% | |
| | | | | |
Base minimum rent PSF | | $25.88 | | $26.25 | |
| | | | | |
| | | | | |
Community lifestyle centers: | | | | | |
| | | | | |
Occupancy | | 95.6% | | 95.7% | |
| | | | | |
Base minimum rent PSF | | $13.79 | | $13.46 | |
| | | | | |
| | | | | |
Total portfolio: | | | | | |
| | | | | |
Occupancy | | 93.2% | | 93.3% | |
| | | | | |
Base minimum rent PSF | | $21.00 | | $20.94 | |
Metrics include the WPG properties owned at December 31, 2014 as well as the properties acquired with the Glimcher merger in January 2015, excluding Jersey Gardens and University Park Village. |

| SUPPLEMENTAL INFORMATION | 8 |
LEASING RESULTS
WP Glimcher - pro-forma adjustments to include GRT
For the year ended December 31, 2014
| | Square Footage Analysis | | Annualized 1st-Year
Minimum Base Rent | | Number of Deals | | Average Term |
| | | | | | | | | | | | | | | | | | | | | | | | |
| | | | | | | | | | | | | | | | | | | | | | | | |
| | New
Deals | | Renewals | | Total | | New
Deals | | Renewals | | Total | | New
Deals | | Renewals | | Total | | New
Deals | | Renewals | | Total |
| | | | | | | | | | | | | | | | | | | | | | | | |
Community lifestyle centers: | | | | | | | | | | | | | | | | | | | | | | | | |
| | | | | | | | | | | | | | | | | | | | | | | | |
Stores | | 249,899 | | 305,856 | | 555,755 | | $21.20 | | $22.26 | | $21.79 | | 88 | | 111 | | 199 | | 6.5 | | 4.0 | | 5.1 |
| | | | | | | | | | | | | | | | | | | | | | | | |
| | | | | | | | | | | | | | | | | | | | | | | | |
| | | | | | | | | | | | | | | | | | | | | | | | |
Malls: | | | | | | | | | | | | | | | | | | | | | | | | |
| | | | | | | | | | | | | | | | | | | | | | | | |
Stores | | 796,239 | | 2,001,337 | | 2,797,576 | | $24.38 | | $27.98 | | $26.89 | | 227 | | 722 | | 949 | | 7.1 | | 3.6 | | 4.5 |
| | | | | | | | | | | | | | | | | | | | | | | | |
Subtotal | | 1,046,138 | | 2,307,193 | | 3,353,331 | | $ 23.62 | | $ 27.15 | | $ 26.00 | | 315 | | 833 | | 1,148 | | 6.9 | | 3.7 | | 4.6 |
Leasing results include both the WPG properties owned at December 31, 2014 as well as the properties acquired
with the merger with Glimcher in January 2015, excluding Jersey Gardens and University Park Village.

| SUPPLEMENTAL INFORMATION | 9 |
TOP 10 TENANTS
WP Glimcher - pro-forma adjustments to include GRT
As of December 31, 2014
Non-Anchor Stores (Ranked by Percent of Total Minimum Rents) | | | | | | | | |
| | | | | | | | |
Tenant Name | | Number
of Stores | | GLA of
Stores | | Percent of
Total GLA in
Portfolio | | Percent of Total
Base Minimum
Rent |
| | | | | | | | |
Signet Jewelers, Ltd. | | 181 | | 239,694 | | 0.4% | | 3.2% |
L Brands, Inc. | | 141 | | 661,295 | | 1.0% | | 2.6% |
Foot Locker, Inc. | | 130 | | 524,061 | | 0.8% | | 2.2% |
Ascena Retail Group Inc. | | 119 | | 597,140 | | 0.9% | | 1.5% |
Luxottica Group | | 108 | | 283,453 | | 0.4% | | 1.3% |
Genesco Inc. | | 137 | | 220,939 | | 0.3% | | 1.3% |
American Eagle Outfitters, Inc. | | 55 | | 310,801 | | 0.5% | | 1.3% |
Gap, Inc. | | 43 | | 508,440 | | 0.7% | | 1.2% |
Finish Line, Inc. | | 52 | | 294,975 | | 0.4% | | 1.1% |
Aeropostale, Inc. | | 68 | | 236,279 | | 0.3% | | 0.9% |
Anchor Stores (Ranked by Total GLA) | | | | | | | | |
| | | | | | | | |
Tenant Name | | Number
of Stores | | GLA of
Stores | | Percent of
Total GLA in
Portfolio | | Percent of Total
Base Minimum
Rent |
| | | | | | | | |
Sears Holding Corp. | | 58 | | 8,175,846 | | 12.0% | | 1.1% |
JCPenney Company, Inc. | | 49 | | 6,207,163 | | 9.1% | | 1.3% |
Macy’s, Inc. | | 36 | | 6,027,126 | | 8.8% | | 0.5% |
Dillard’s, Inc. | | 28 | | 3,902,495 | | 5.7% | | 0.1% |
The Bon-Ton Stores, Inc. | | 19 | | 1,856,405 | | 2.7% | | 0.9% |
Target Corporation | | 12 | | 1,625,339 | | 2.4% | | 0.0% |
Kohl’s Corporation | | 14 | | 1,277,064 | | 1.9% | | 0.9% |
Belk, Inc. | | 13 | | 1,070,585 | | 1.6% | | 0.1% |
Dick’s Sporting Goods, Inc. | | 15 | | 840,330 | | 1.2% | | 1.3% |
Burlington Stores, Inc. | | 10 | | 814,577 | | 1.2% | | 0.8% |
Tenants include both the WPG properties owned at December 31, 2014 as well as the properties acquired with the merger with Glimcher in January 2015, excluding Jersey Gardens and University Park Village.

| SUPPLEMENTAL INFORMATION | 10 |
LEASE EXPIRATIONS
WP Glimcher - pro-forma adjustments to include GRT
As of December 31, 2014
Combined Inline Stores and Freestanding | | | | | | | | |
| | | | | | | | |
| | Number of
Leases
Expiring | | Square
Feet | | Average Base
Minimum Rent
PSF | | Percentage of
Gross Annual
Rental Revenues |
Year | | | | | | | | |
Month To Month Leases | | 199 | | 345,773 | | $25.25 | | 1.4% |
2015 | | 1,016 | | 2,812,439 | | $22.83 | | 10.1% |
2016 | | 1,011 | | 3,209,205 | | $24.04 | | 12.2% |
2017 | | 854 | | 2,799,918 | | $24.20 | | 10.7% |
2018 | | 647 | | 2,011,991 | | $26.62 | | 8.5% |
2019 | | 558 | | 1,938,499 | | $25.98 | | 8.0% |
2020 | | 320 | | 1,389,850 | | $24.89 | | 5.5% |
2021 | | 220 | | 1,015,350 | | $24.05 | | 3.9% |
2022 | | 250 | | 1,092,615 | | $23.89 | | 4.1% |
2023 | | 305 | | 1,428,571 | | $23.39 | | 5.3% |
2024 | | 242 | | 933,878 | | $26.81 | | 4.0% |
Thereafter | | 117 | | 677,331 | | $22.57 | | 2.4% |
Specialty Leasing Agreements w/ terms in excess of 12 months | | 661 | | 1,441,937 | | $12.43 | | 2.8% |
Combined Anchors | | | | | | | | |
| | | | | | | | |
| | Number of
Leases
Expiring | | Square
Feet | | Average Base
Minimum Rent
PSF | | Percentage of
Gross Annual
Rental Revenues |
Year | | | | | | | | |
Month To Month Leases | | 2 | | 69,884 | | $6.38 | | 0.1% |
2015 | | 20 | | 1,099,817 | | $5.47 | | 1.0% |
2016 | | 49 | | 2,878,381 | | $6.36 | | 2.9% |
2017 | | 34 | | 2,273,127 | | $5.07 | | 1.8% |
2018 | | 45 | | 2,514,052 | | $7.39 | | 2.8% |
2019 | | 34 | | 2,167,505 | | $6.14 | | 2.1% |
2020 | | 46 | | 2,580,277 | | $6.83 | | 2.8% |
2021 | | 18 | | 1,253,364 | | $7.71 | | 1.5% |
2022 | | 16 | | 915,171 | | $6.91 | | 1.0% |
2023 | | 26 | | 1,232,950 | | $8.33 | | 1.6% |
2024 | | 17 | | 865,354 | | $7.38 | | 1.0% |
Thereafter | | 50 | | 4,897,643 | | $3.19 | | 2.5% |
Specialty Leasing Agreements w/ terms in excess of 12 months | | - | | - | | $0.00 | | 0.0% |
Metrics include both the WPG properties owned at December 31, 2014 as well as the properties acquired with the merger with Glimcher in January 2015, excluding Jersey Gardens and University Park Village.

| SUPPLEMENTAL INFORMATION | 11 |
CAPITAL EXPENDITURES
WP Glimcher - pro-forma adjustments to include GRT
(dollars in thousands)
| | Twelve Months
Ended
December 31, 2014 | | Twelve Months
Ended
December 31, 2013 |
| | | | |
New Developments | | $ | 1,087 | | $ | 2,686 |
Redevelopments, Renovations, and Expansions | | $ | 83,914 | | $ | 91,237 |
| | | | |
Property Capital Expenditures: | | | | |
Non-Anchor stores tenant improvements and allowances | | $ | 40,848 | | $ | 42,734 |
Operational capital expenditures | | 34,266 | | 29,206 |
Total Property Capital Expenditures | | $ | 75,114 | | $ | 71,940 |
Includes both the WPG properties owned at December 31, 2014, as well as the properties acquired with the merger with Glimcher in January 2015, excluding Jersey Gardens and University Park Village.

| SUPPLEMENTAL INFORMATION | 12 |
MAJOR REDEVELOPMENT PROJECTS
Includes projects from merger with GRT
(dollars in thousands)
| | City | | St | | Estimated
Total Costs (1) | | Estimated
Project
Yield (2) | | Estimated
Completion (2) | | Description |
| | | | | | | | | | | | |
Current Projects: | | | | | | | | | | | | |
| | | | | | | | | | | | |
Scottsdale Quarter - Phase III | | Scottsdale | | AZ | | $110,000 - $130,000 | | 7% - 8% | | 2015/2016 | | Multi-use addition to existing center |
| | | | | | | | | | | | |
Fairfield Town Center | | Houston | | TX | | $75,000 - $85,000 | | 8% - 9% | | 2016/2017 | | Multi-phase retail development |
| | | | | | | | | | | | |
Jefferson Valley Mall | | Yorktown Hts | | NY | | $32,000 - $36,000 | | 7% - 8% | | 2017 2Q | | Redevelop center; add Dick's Sporting Goods |
| | | | | | | | | | | | |
Town Center Plaza | | Leawood | | KS | | $30,000 - $40,000 | | 7% - 8% | | 2015/2016 | | New Arhaus, Restoration Hardware, pedestrian walkway |
| | | | | | | | | | | | |
Mall at Fairfield Commons | | Dayton | | OH | | $18,000 - $20,000 | | 7% - 8% | | 2015 4Q | | Demolish former dprtmt store & replace w/ restaurants |
| | | | | | | | | | | | |
Rockaway Commons | | Rockaway | | NJ | | $8,000 - $10,000 | | 13% - 14% | | 2015 4Q | | Re-anchor w/ Nordstrom Rack & add'l junior anchor |
Total major projects | | | | | | $273,000 - $321,000 | | 7% - 9% | | | | |
(1) Project costs exclude the allocation of internal costs such as labor, interest, and taxes.
(2) Anticipated opening date, estimated project costs and project yield are subject to adjustment as a result of changes (some of which are not under the direct control of the company) that are inherent in the development process.
Note that the project yield excludes any NOI benefit to the property that is indirectly related to the redevelopment, although each project does benefit other aspects of the mall.

| SUPPLEMENTAL INFORMATION | 13 |
WP GLIMCHER PROPERTY INFORMATION - includes properties from merger with GRT
As of December 31, 2014
| | | | | | | | | | | | | | Debt Information |
| | | | | | | | | | | | | | | | | | | | Indebtedness |
Property Name (1) | | St | | City | | Legal
Ownership (2) | | Total
Center
Square Feet | | Total
WPG Owned
Square Feet | | Total
Tenant Owned
Square Feet | | Maturity
Date | | Interest
Rate | | Type | | Total | | WP
Glimcher
Share |
Malls | | | | | | | | | | | | | | | | | | | | | | |
Anderson Mall | | SC | | Anderson | | 100% | | 671,311 | | 316,122 | | 355,189 | | 12/01/22 | | 4.61% | | Fixed | | $ | 19,933 | | $ | 19,933 |
Ashland Town Center | | KY | | Ashland | | 100% | | 434,460 | | 331,070 | | 103,390 | | 07/06/21 | | 4.90% | | Fixed | | $ | 39,898 | | $ | 39,898 |
Bowie Town Center | | MD | | Bowie
(Wash, D.C.) | | 100% | | 578,400 | | 277,102 | | 301,298 | | | | | | | | | | |
Boynton Beach Mall | | FL | | Boynton Beach
(Miami) | | 100% | | 1,101,261 | | 589,709 | | 511,552 | | | | | | | | | | |
Brunswick Square | | NJ | | East Brunswick
(New York) | | 100% | | 760,790 | | 289,495 | | 471,295 | | 03/01/24 | | 4.80% | | Fixed | | $ | 76,084 | | $ | 76,084 |
Charlottesville Fashion Square | | VA | | Charlottesville | | 100% | | 576,787 | | 353,084 | | 223,703 | | 04/01/24 | | 4.54% | | Fixed | | $ | 49,434 | | $ | 49,434 |
Chautauqua Mall | | NY | | Lakewood | | 100% | | 427,590 | | 422,614 | | 4,976 | | | | | | | | | | |
Chesapeake Square | | VA | | Chesapeake
(VA Beach) | | 75% | | 759,929 | | 560,420 | | 199,509 | | 02/01/17 | | 5.84% | | Fixed | | $ | 64,014 | | $ | 48,011 |
Colonial Park Mall | | PA | | Harrisburg | | 100% | | 739,187 | | 371,741 | | 367,446 | | | | | | | | | | |
Cottonwood Mall | | NM | | Albuquerque | | 100% | | 1,036,042 | | 401,965 | | 634,077 | | 04/06/24 | | 4.82% | | Fixed | | $ | 103,999 | | $ | 103,999 |
Dayton Mall | | OH | | Dayton | | 100% | | 1,443,520 | | 785,239 | | 658,281 | | 09/01/22 | | 4.57% | | Fixed | | $ | 82,000 | | $ | 82,000 |
Edison Mall | | FL | | Fort Myers | | 100% | | 1,054,445 | | 572,153 | | 482,292 | | | | | | | | | | |
Forest Mall | | WI | | Fond Du Lac | | 100% | | 500,623 | | 249,293 | | 251,330 | | | | | | | | | | |
Grand Central Mall | | WV | | Parkersburg | | 100% | | 848,292 | | 742,469 | | 105,823 | | 07/06/20 | | 6.05% | | Fixed | | $ | 42,515 | | $ | 42,515 |
Great Lakes Mall | | OH | | Mentor
(Cleveland) | | 100% | | 1,287,311 | | 580,178 | | 707,133 | | | | | | | | | | |
Gulf View Square | | FL | | Port Richey
(Tampa) | | 100% | | 754,818 | | 400,172 | | 354,646 | | | | | | | | | | |
Indian Mound Mall | | OH | | Newark | | 100% | | 556,817 | | 464,156 | | 92,661 | | | | | | | | | | |

| SUPPLEMENTAL INFORMATION | 14 |
WP GLIMCHER PROPERTY INFORMATION - includes properties from merger with GRT
As of December 31, 2014
| | | | | | | | | | | | | | Debt Information |
| | | | | | | | | | | | | | | | | | | | Indebtedness |
Property Name (1) | | St | | City | | Legal
Ownership (2) | | Total
Center
Square Feet | | Total
WPG Owned
Square Feet | | Total
Tenant Owned
Square Feet | | Maturity
Date | | Interest
Rate | | Type | | Total | | WP
Glimcher
Share |
Malls | | | | | | | | | | | | | | | | | | | | | | |
Irving Mall | | TX | | Irving
(Dallas) | | 100% | | 1,052,862 | | 489,318 | | 563,544 | | | | | | | | | | |
Jefferson Valley Mall | | NY | | Yorktown Heights
(New York) | | 100% | | 555,221 | | 389,529 | | 165,692 | | | | | | | | | | |
Knoxville Center | | TN | | Knoxville | | 100% | | 960,882 | | 506,270 | | 454,612 | | | | | | | | | | |
Lima Mall | | OH | | Lima | | 100% | | 743,555 | | 543,733 | | 199,822 | | | | | | | | | | |
Lincolnwood Town Center | | IL | | Lincolnwood
(Chicago) | | 100% | | 421,992 | | 421,992 | | 0 | | 04/01/21 | | 4.26% | | Fixed | | $ | 52,366 | | $ | 52,366 |
Lindale Mall | | IA | | Cedar Rapids | | 100% | | 712,760 | | 462,007 | | 250,753 | | | | | | | | | | |
Longview Mall | | TX | | Longview | | 100% | | 638,565 | | 194,480 | | 444,085 | | | | | | | | | | |
Mall at Fairfield Commons, The | | OH | | Beavercreek | | 100% | | 1,008,714 | | 859,302 | | 149,412 | | | | | | | | | | |
Mall at Johnson City, The | | TN | | Johnson City | | 100% | | 570,995 | | 495,587 | | 75,408 | | 05/06/20 | | 6.76% | | Fixed | | $ | 52,262 | | $ | 52,262 |
Maplewood Mall | | MN | | St. Paul
(Minneapolis) | | 100% | | 908,085 | | 325,606 | | 582,479 | | | | | | | | | | |
Markland Mall | | IN | | Kokomo | | 100% | | 418,294 | | 414,814 | | 3,480 | | | | | | | | | | |
Melbourne Square | | FL | | Melbourne | | 100% | | 705,642 | | 420,824 | | 284,818 | | | | | | | | | | |
Merritt Square Mall | | FL | | Merritt Island | | 100% | | 810,814 | | 475,141 | | 335,673 | | 09/01/15 | | 5.35% | | Fixed | | $ | 53,465 | | $ | 53,465 |
Mesa Mall | | CO | | Grand Junction | | 100% | | 873,741 | | 431,037 | | 442,704 | | 06/01/16 | | 5.79% | | Fixed | | $ | 87,250 | | $ | 87,250 |
Morgantown Mall | | WV | | Morgantown | | 100% | | 555,372 | | 555,372 | | 0 | | | | | | | | | | |
Muncie Mall | | IN | | Muncie | | 100% | | 635,870 | | 386,070 | | 249,800 | | 04/01/21 | | 4.19% | | Fixed | | $ | 36,551 | | $ | 36,551 |
New Towne Mall | | OH | | New Philadelphia | | 100% | | 509,705 | | 509,705 | | 0 | | | | | | | | | | |

| SUPPLEMENTAL INFORMATION | 15 |
WP GLIMCHER PROPERTY INFORMATION - includes properties from merger with GRT
As of December 31, 2014
| | | | | | | | | | | | | | Debt Information |
| | | | | | | | | | | | | | | | | | | | Indebtedness |
Property Name (1) | | St | | City | | Legal
Ownership (2) | | Total
Center
Square Feet | | Total
WPG Owned
Square Feet | | Total
Tenant Owned
Square Feet | | Maturity
Date | | Interest
Rate | | Type | | Total | | WP
Glimcher
Share |
Malls | | | | | | | | | | | | | | | | | | | | | | |
Northlake Mall | | GA | | Atlanta | | 100% | | 962,980 | | 576,580 | | 386,400 | | | | | | | | | | |
Northtown Mall | | MN | | Blaine | | 100% | | 547,854 | | 547,854 | | 0 | | | | | | | | | | |
Northwoods Mall | | IL | | Peoria | | 100% | | 693,481 | | 220,512 | | 472,969 | | | | | | | | | | |
Oak Court Mall | | TN | | Memphis | | 100% | | 849,265 | | 363,448 | | 485,817 | | 04/01/21 | | 4.76% | | Fixed | | $ | 39,614 | | $ | 39,614 |
Orange Park Mall | | FL | | Orange Park
(Jacksonville) | | 100% | | 959,181 | | 556,001 | | 403,180 | | | | | | | | | | |
Paddock Mall | | FL | | Ocala | | 100% | | 552,308 | | 321,751 | | 230,557 | | | | | | | | | | |
Pearlridge Center | | HI | | Aiea | | 100% | | 1,139,887 | | 1,139,887 | | 0 | | 11/01/15 | | 4.60% | | Fixed | | $ | 172,103 | | $ | 172,103 |
Polaris Fashion Place | | OH | | Columbus | | 100% | | 1,437,685 | | 685,466 | | 752,219 | | 03/01/25 | | 3.90% | | Fixed | | $ | 225,000 | | $ | 225,000 |
Port Charlotte Town Center | | FL | | Port Charlotte | | 80% | | 764,849 | | 480,640 | | 284,209 | | 11/01/20 | | 5.30% | | Fixed | | $ | 45,593 | | $ | 36,474 |
Richmond Town Square | | OH | | Richmond Heights
(Cleveland) | | 100% | | 1,011,808 | | 541,857 | | 469,951 | | | | | | | | | | |
River Oaks Center | | IL | | Calumet City
(Chicago) | | 100% | | 1,192,641 | | 688,382 | | 504,259 | | | | | | | | | | |
River Valley Mall | | OH | | Lancaster | | 100% | | 521,587 | | 521,587 | | 0 | | 01/11/16 | | 5.65% | | Fixed | | $ | 45,793 | | $ | 45,793 |
Rolling Oaks Mall | | TX | | San Antonio | | 100% | | 882,348 | | 286,040 | | 596,308 | | | | | | | | | | |
Rushmore Mall | | SD | | Rapid City | | 100% | | 829,234 | | 752,758 | | 76,476 | | 02/01/19 | | 5.79% | | Fixed | | $ | 94,000 | | $ | 94,000 |
Seminole Towne Center | | FL | | Sanford
(Orlando) | | 45% | | 1,104,690 | | 591,400 | | 513,290 | | 05/06/21 | | 5.97% | | Fixed | | $ | 57,346 | | $ | 25,806 |
Southern Hills Mall | | IA | | Sioux City | | 100% | | 794,367 | | 550,420 | | 243,947 | | 06/01/16 | | 5.79% | | Fixed | | $ | 101,500 | | $ | 101,500 |
Southern Park Mall | | OH | | Youngstown | | 100% | | 1,204,641 | | 1,009,077 | | 195,564 | | | | | | | | | | |

| SUPPLEMENTAL INFORMATION | 16 |
WP GLIMCHER PROPERTY INFORMATION - includes properties from merger with GRT
As of December 31, 2014
| | | | | | | | | | | | | | Debt Information |
| | | | | | | | | | | | | | | | | | | | Indebtedness |
Property Name (1) | | St | | City | | Legal
Ownership (2) | | Total
Center
Square Feet | | Total
WPG Owned
Square Feet | | Total
Tenant Owned
Square Feet | | Maturity
Date | | Interest
Rate | | Type | | Total | | WP
Glimcher
Share |
Malls | | | | | | | | | | | | | | | | | | | | | | |
Sunland Park Mall | | TX | | El Paso | | 100% | | 922,210 | | 327,273 | | 594,937 | | | | | | | | | | |
Outlet Collection | Seattle, The | | WA | | Seattle | | 100% | | 921,472 | | 921,472 | | 0 | | 02/11/15 | | 7.54% | | Fixed | | $ | 49,969 | | $ | 49,969 |
Town Center at Aurora | | CO | | Aurora
(Denver) | | 100% | | 1,082,991 | | 343,050 | | 739,941 | | 04/01/19 | | 4.19% | | Fixed | | $ | 55,000 | | $ | 55,000 |
Towne West Square | | KS | | Wichita | | 100% | | 936,908 | | 440,375 | | 496,533 | | 06/01/21 | | 5.61% | | Fixed | | $ | 48,573 | | $ | 48,573 |
Valle Vista Mall | | TX | | Harlingen | | 100% | | 650,570 | | 492,170 | | 158,400 | | 05/10/17 | | 5.35% | | Fixed | | $ | 40,000 | | $ | 40,000 |
Virginia Center Commons | | VA | | Glen Allen | | 100% | | 785,049 | | 444,141 | | 340,908 | | | | | | | | | | |
Weberstown Mall | | CA | | Stockton | | 100% | | 856,817 | | 283,493 | | 573,324 | | 06/08/16 | | 5.90% | | Fixed | | $ | 60,000 | | $ | 60,000 |
West Ridge Mall | | KS | | Topeka | | 100% | | 995,627 | | 391,516 | | 604,111 | | 03/06/24 | | 4.84% | | Fixed | | $ | 42,740 | | $ | 42,740 |
Westminster Mall | | CA | | Westminster
(Los Angeles) | | 100% | | 1,203,700 | | 431,009 | | 772,691 | | 04/01/24 | | 4.65% | | Fixed | | $ | 84,060 | | $ | 84,060 |
WestShore Plaza | | FL | | Tampa | | 100% | | 1,076,374 | | 847,912 | | 228,462 | | 10/01/17 | | 3.65% | | Variable | | $ | 119,600 | | $ | 119,600 |
| | | | | | | | | | | | | | | | | | | | | | |
Community Lifestyle Centers | | | | | | | | | | | | | | | | | | | | | | |
Arbor Hills (3) | | MI | | Ann Arbor | | 93% | | 87,395 | | 87,395 | | 0 | | 01/01/26 | | 4.27% | | Fixed | | $ | 25,500 | | $ | 23,621 |
Arboretum, The | | TX | | Austin | | 100% | | 194,972 | | 194,972 | | 0 | | | | | | | | | | |
Bloomingdale Court | | IL | | Bloomingdale
(Chicago) | | 100% | | 686,639 | | 375,094 | | 311,545 | | 11/01/15 | | 8.15% | | Fixed | | $ | 24,732 | | $ | 24,732 |
Bowie Town Center Strip | | MD | | Bowie
(Wash, D.C.) | | 100% | | 106,589 | | 40,927 | | 65,662 | | | | | | | | | | |
Charles Towne Square | | SC | | Charleston | | 100% | | 71,794 | | 71,794 | | 0 | | | | | | | | | | |
| | | | | | | | | | | | | | | | | | | | | | | | | | | | | | |

| SUPPLEMENTAL INFORMATION | 17 |
WP GLIMCHER PROPERTY INFORMATION - includes properties from merger with GRT
As of December 31, 2014
| | | | | | | | | | | | | | Debt Information |
| | | | | | | | | | | | | | | | | | | | Indebtedness |
Property Name (1) | | St | | City | | Legal
Ownership (2) | | Total
Center
Square Feet | | Total
WPG Owned
Square Feet | | Total
Tenant Owned
Square Feet | | Maturity
Date | | Interest
Rate | | Type | | Total | | WP
Glimcher
Share |
Community Lifestyle Centers | | | | | | | | | | | | | | | | | | | | | | |
Chesapeake Center | | VA | | Chesapeake (Virginia Beach) | | 100% | | 305,853 | | 128,972 | | 176,881 | | | | | | | | | | |
Clay Terrace | | IN | | Carmel (Indianapolis) | | 100% | | 576,784 | | 482,798 | | 93,986 | | 10/01/15 | | 5.08% | | Fixed | | $ | 115,000 | | $ | 115,000 |
Concord Mills Marketplace | | NC | | Concord (Charlotte) | | 100% | | 230,683 | | 216,870 | | 13,813 | | 11/01/23 | | 4.82% | | Fixed | | $ | 16,000 | | $ | 16,000 |
Countryside Plaza | | IL | | Countryside (Chicago) | | 100% | | 403,756 | | 204,295 | | 199,461 | | | | | | | | | | |
Dare Centre | | NC | | Kill Devil Hills | | 100% | | 168,673 | | 109,154 | | 59,519 | | | | | | | | | | |
DeKalb Plaza | | PA | | King of Prussia (Philadelphia) | | 100% | | 101,911 | | 44,091 | | 57,820 | | | | | | | | | | |
Empire East | | SD | | Sioux Falls | | 100% | | 301,438 | | 167,616 | | 133,822 | | | | | | | | | | |
Fairfax Court | | VA | | Fairfax
(Wash, D.C.) | | 100% | | 249,488 | | 239,483 | | 10,005 | | | | | | | | | | |
Fairfield Town Center | | TX | | Houston | | 100% | | 108,000 | | 0 | | 108,000 | | | | | | | | | | |
Forest Plaza | | IL | | Rockford | | 100% | | 434,838 | | 414,542 | | 20,296 | | 10/10/19 | | 7.50% | | Fixed | | $ | 17,366 | | $ | 17,366 |
Gaitway Plaza | | FL | | Ocala | | 88% | | 208,051 | | 207,251 | | 800 | | 07/01/15 | | 4.60% | | Fixed | | $ | 13,900 | | $ | 12,261 |
Gateway Centers | | TX | | Austin | | 100% | | 512,664 | | 403,661 | | 109,003 | | | | | | | | | | |
Greenwood Plus | | IN | | Greenwood (Indianapolis) | | 100% | | 155,319 | | 146,091 | | 9,228 | | | | | | | | | | |
Henderson Square | | PA | | King of Prussia (Philadelphia) | | 100% | | 107,371 | | 53,615 | | 53,756 | | 04/01/16 | | 4.43% | | Fixed | | $ | 12,954 | | $ | 12,954 |
Keystone Shoppes | | IN | | Indianapolis | | 100% | | 29,080 | | 29,080 | | 0 | | | | | | | | | | |
Lake Plaza | | IL | | Waukegan (Chicago) | | 100% | | 215,568 | | 124,939 | | 90,629 | | | | | | | | | | |
Lake View Plaza | | IL | | Orland Park (Chicago) | | 100% | | 367,370 | | 311,961 | | 55,409 | | | | | | | | | | |
| | | | | | | | | | | | | | | | | | | | | | | | | |

| SUPPLEMENTAL INFORMATION | 18 |
WP GLIMCHER PROPERTY INFORMATION - includes properties from merger with GRT
As of December 31, 2014
| | | | | | | | | | | | | | Debt Information |
| | | | | | | | | | | | | | | | | | | | Indebtedness |
Property Name (1) | | St | | City | | Legal
Ownership (2) | | Total
Center
Square Feet | | Total
WPG Owned
Square Feet | | Total
Tenant Owned
Square Feet | | Maturity
Date | | Interest
Rate | | Type | | Total | | WP
Glimcher
Share |
Community Lifestyle Centers | | | | | | | | | | | | | | | | | | | | | | |
Lakeline Plaza | | TX | | Cedar Park (Austin) | | 100% | | 387,304 | | 356,867 | | 30,437 | | 10/10/19 | | 7.50% | | Fixed | | $ | 16,269 | | $ | 16,269 |
Lima Center | | OH | | Lima | | 100% | | 233,878 | | 173,878 | | 60,000 | | | | | | | | | | |
Lincoln Crossing | | IL | | O'Fallon
(St. Louis) | | 100% | | 243,326 | | 37,861 | | 205,465 | | | | | | | | | | |
MacGregor Village | | NC | | Cary | | 100% | | 144,301 | | 144,301 | | 0 | | | | | | | | | | |
Malibu Lumber Yard (3) | | CA | | Malibu | | 100% | | 31,438 | | 31,438 | | 0 | | | | | | | | | | |
Mall of Georgia Crossing | | GA | | Buford
(Atlanta) | | 100% | | 440,670 | | 317,535 | | 123,135 | | 10/06/22 | | 4.28% | | Fixed | | $ | 24,102 | | $ | 24,102 |
Markland Plaza | | IN | | Kokomo | | 100% | | 90,527 | | 80,977 | | 9,550 | | | | | | | | | | |
Martinsville Plaza | | VA | | Martinsville | | 100% | | 102,105 | | 94,760 | | 7,345 | | | | | | | | | | |
Matteson Plaza | | IL | | Matteson (Chicago) | | 100% | | 272,636 | | 181,236 | | 91,400 | | | | | | | | | | |
Morgantown Commons | | WV | | Morgantown | | 100% | | 230,843 | | 230,843 | | 0 | | | | | | | | | | |
Muncie Towne Plaza | | IN | | Muncie | | 100% | | 172,617 | | 172,617 | | 0 | | 10/10/19 | | 7.50% | | Fixed | | $ | 6,764 | | $ | 6,764 |
North Ridge Shopping Center | | NC | | Raleigh | | 100% | | 169,774 | | 164,374 | | 5,400 | | 12/01/22 | | 3.41% | | Fixed | | $ | 12,500 | | $ | 12,500 |
Northwood Plaza | | IN | | Fort Wayne | | 100% | | 208,076 | | 79,877 | | 128,199 | | | | | | | | | | |
Oklahoma City Properties (3) | | OK | | Oklahoma City | | 99% | | 288,135 | | 288,135 | | 0 | | | | | | | | | | |
Palms Crossing | | TX | | McAllen | | 100% | | 392,305 | | 358,468 | | 33,837 | | 08/01/21 | | 5.49% | | Fixed | | $ | 36,620 | | $ | 36,620 |
Plaza at Buckland Hills, The | | CT | | Manchester | | 100% | | 329,885 | | 218,986 | | 110,899 | | | | | | | | | | |
Richardson Square | | TX | | Richardson (Dallas) | | 100% | | 517,265 | | 41,354 | | 475,911 | | | | | | | | | | |
| | | | | | | | | | | | | | | | | | | | | | | | | |

| SUPPLEMENTAL INFORMATION | 19 |
WP GLIMCHER PROPERTY INFORMATION - includes properties from merger with GRT
As of December 31, 2014
| | | | | | | | | | | | | | Debt Information |
| | | | | | | | | | | | | | | | | | | | Indebtedness |
Property Name (1) | | St | | City | | Legal
Ownership (2) | | Total
Center
Square Feet | | Total
WPG Owned
Square Feet | | Total
Tenant Owned
Square Feet | | Maturity
Date | | Interest
Rate | | Type | | Total | | WP
Glimcher
Share |
Community Lifestyle Centers | | | | | | | | | | | | | | | | | | | | | | |
Rockaway Commons | | NJ | | Rockaway
(New York) | | 100% | | 238,253 | | 229,145 | | 9,108 | | | | | | | | | | |
Rockaway Town Plaza | | NJ | | Rockaway
(New York) | | 100% | | 371,908 | | 70,632 | | 301,276 | | | | | | | | | | |
Royal Eagle Plaza | | FL | | Coral Springs (Miami) | | 100% | | 202,921 | | 191,968 | | 10,953 | | | | | | | | | | |
Scottsdale Quarter (3) | | AZ | | Scottsdale | | 100% | | 541,386 | | 541,386 | | 0 | | 05/22/15 | | 3.27% | | Variable | | $ | 130,000 | | $ | 130,000 |
| | | | | | | | | | | | | | 10/01/15 | | 4.91% | | Fixed | | $ | 65,492 | | $ | 65,492 |
Shops at Arbor Walk, The | | TX | | Austin | | 100% | | 458,468 | | 280,314 | | 178,154 | | 08/01/21 | | 5.49% | | Fixed | | $ | 41,388 | | $ | 41,388 |
Shops at North East Mall, The | | TX | | Hurst
(Dallas) | | 100% | | 365,039 | | 365,039 | | 0 | | | | | | | | | | |
St. Charles Towne Plaza | | MD | | Waldorf (Wash, D.C.) | | 100% | | 391,889 | | 330,047 | | 61,842 | | | | | | | | | | |
Tippecanoe Plaza | | IN | | Lafayette | | 100% | | 90,522 | | 85,811 | | 4,711 | | | | | | | | | | |
Town Center Crossing & Plaza (3) | | KS | | Leawood | | 100% | | 605,104 | | 483,871 | | 121,233 | | 02/01/27 | | 4.25% | | Fixed | | $ | 36,634 | | $ | 36,634 |
| | | | | | | | | | | | | | 02/01/27 | | 5.00% | |
Fixed
| | $ | 73,628 | | $ | 73,628 |
University Center | | IN | | Mishawaka | | 100% | | 150,441 | | 100,441 | | 50,000 | | | | | | | | | | |
University Town Plaza | | FL | | Pensacola | | 100% | | 565,538 | | 216,194 | | 349,344 | | | | | | | | | | |
Village Park Plaza | | IN | | Carmel (Indianapolis) | | 100% | | 575,576 | | 290,037 | | 285,539 | | | | | | | | | | |
Washington Plaza | | IN | | Indianapolis | | 100% | | 50,107 | | 50,107 | | 0 | | | | | | | | | | |
Waterford Lakes Town Center | | FL | | Orlando | | 100% | | 960,226 | | 685,726 | | 274,500 | | | | | | | | | | |
West Ridge Plaza | | KS | | Topeka | | 100% | | 254,480 | | 99,987 | | 154,493 | | 03/06/24 | | 4.84% | | Fixed | | $ | 10,685 | | $ | 10,685 |
| | | | | | | | | | | | | | | | | | | | | | | | | |

| SUPPLEMENTAL INFORMATION | 20 |
WP GLIMCHER PROPERTY INFORMATION - includes properties from merger with GRT
As of December 31, 2014
| | | | | | | | | | | | | | Debt Information |
| | | | | | | | | | | | | | | | | | | | Indebtedness |
Property Name (1) | | St | | City | | Legal
Ownership (2) | | Total
Center
Square Feet | | Total
WPG Owned
Square Feet | | Total
Tenant Owned
Square Feet | | Maturity
Date | | Interest
Rate | | Type | | Total | | WP
Glimcher
Share |
Community Lifestyle Centers | | | | | | | | | | | | | | | | | | | | | | |
West Town Corners | | FL | | Altamonte Springs (Orlando) | | 88% | | 385,366 | | 236,748 | | 148,618 | | 07/01/15 | | 4.60% | | Fixed | | $ | 18,800 | | $ | 16,583 |
Westland Park Plaza | | FL | | Orange Park (Jacksonville) | | 88% | | 163,259 | | 163,259 | | 0 | | | | | | | | | | |
White Oaks Plaza | | IL | | Springfield | | 100% | | 387,911 | | 235,128 | | 152,783 | | 10/10/19 | | 7.50% | | Fixed | | $ | 13,527 | | $ | 13,527 |
Whitehall Mall | | PA | | Whitehall | | 100% | | 613,417 | | 598,543 | | 14,874 | | 11/01/18 | | 7.00% | | Fixed | | $ | 10,198 | | $ | 10,198 |
Wolf Ranch | | TX | | Georgetown (Austin) | | 100% | | 627,284 | | 415,098 | | 212,186 | | | | | | | | | | |
| | | | | | | | | | | | | | | | | | | | | | |
Total | | | | | | | | 68,373,592 | | 43,041,429 | | 25,332,163 | | | | | | | | 2,762,721 | | 2,700,324 |
Footnotes:
(1) Property list includes both the WPG properties owned at December 31, 2014 as well as the properties acquired with the merger with Glimcher in January 2015, excluding Jersey Gardens and University Park Village.
(2) Direct and indirect interests in some joint venture properties are subject to preferences on distributions and/or capital allocation in favor of other partners.
(3) Reporting in the mall operating metrics as of December 31, 2014.

| SUPPLEMENTAL INFORMATION | 21 |
GLOSSARY OF TERMS
- Average rent PSF | | Average base minimum rent charge in effect for the reporting period for all tenants that qualify to be included in the occupancy as defined below. |
- EBITDA | | Net income/(loss) attributable to the company before interest, depreciation and amortization, gains/losses on sale of operating properties, impairment charges, income taxes and unrealized remeasurement adjustment of derivative instrument. |
- Funds from operation (FFO) | | Funds From Operation ("FFO") is a supplemental non-GAAP measure utilized to evaluate the operating performance of real estate companies. The National Association of Real Estate Investment Trusts ("NAREIT") defines FFO as net income/(loss) attributable to common shareholders computed in accordance with generally accepted accounting principles ("GAAP"), excluding (i) gains or losses from sales of operating real estate assets and (ii) extraordinary items, plus (iii) depreciation and amortization of operating properties and (iv) impairment of depreciable real estate and in substance real estate equity investments and (v) after adjustments for unconsolidated partnerships and joint ventures calculated to reflect funds from operations on the same basis. |
- Gross leasable area (GLA) | | Measure of the total amount of leasable space in a property. |
- Net operating income (NOI) | | Revenues from all rental property less operating and maintenance expenses, real estate taxes and rent expense including the company's pro-rata share of real estate joint ventures. Excludes non-recurring items such as termination income and sales from outparcels. |
- Occupancy | | Occupancy is the percentage of total owned square footage (GLA) which is leased as of the last day of the reporting period. For malls, all company owned space except for mall anchors, mall majors, mall freestanding, office and mall outlots in the calculation. For community lifestyle centers, all owned GLA other than office are included in the calculation. |
- Occupancy cost | | Percent of tenant's total occupancy cost (rent and reimbursement of CAM, tax and insurance) to tenant sales for mall stores of 10,000 sf or less. |

| SUPPLEMENTAL INFORMATION | 22 |