SECURITIES AND EXCHANGE COMMISSION
Washington, DC 20549
MANAGEMENT INVESTMENT COMPANIES
(Exact name of registrant as specified in charter)
Statements in this Annual Report that reflect projections or expectations of future financial or economic performance of the Aspiration Redwood Fund (“Fund”) and of the market in general and statements of the Fund’s plans and objectives for future operations are forward-looking statements. No assurance can be given that actual results or events will not differ materially from those projected, estimated, assumed or anticipated in any such forward-looking statements. Important factors that could result in such differences, in addition to the other factors noted with such forward-looking statements, include, without limitation, general economic conditions such as inflation, recession and interest rates. Past performance is not a guarantee of future results. An investor should consider the investment objectives, risks, charges, and expenses of the Fund carefully before investing. The prospectus contains this and other information about the Fund. A copy of the prospectus is available at funds.aspiration.com/redwood/ or by calling the Advisor at 800-683-8529. The prospectus should be read carefully before investing. |
Dear Aspiration Redwood Fund Shareholder,
Thank you for investing in the Aspiration Redwood Fund.
Our aim with the Redwood Fund was to challenge the pervasive assumption on Wall Street that investing in ways that align with your values means sacrificing returns.
We set out to prove that sustainable, 100% fossil fuel free investing could be a sound financial strategy—that you could do well and do good at the same time.
Many people told us it couldn’t work, but they’re not saying that anymore.
We’re proud to be showing that a better way is possible—that you can build value in your portfolio while staying true to your values.
But we won’t stop here. We’ll keep working hard to bring you and all Americans innovative, sustainable, high-quality investment services. You can trust us to always keep the Redwood Fund fossil fuel free and firearms free, and to keep investing your money only in companies that respect the environment, treat people well, and govern themselves ethically.
Over one year ending September 30, 2019, US Equity markets posted positive returns. In 2019 stocks rallied, swiftly recovering from the underperformance in the last months of 2018. This was despite continued uncertainty in the economic outlook globally. Trade talks between China and the US combined with Fed's softer policy on interest rate outlook were one of the most important factors steering the markets' sentiment.
The Fund returned 2.95% for the 12-month reporting period ended September 30, 2019, underperforming the S&P 500 Total Return Index (the “Index”), which the Fund uses for performance comparisons. The index returned 4.25% for the reporting period.
Over 1 year, the Fund delivered positive returns, but underperformed its benchmark S&P 500. Both stock selection and allocation detracted from relative returns.
Securities selection in Health Care was the largest detractor. Within the sector, Ironwood Pharmaceuticals, UnitedHealth, and Incyte hurt performance the most. Ironwood Pharmaceuticals shares have underperformed following the spin out of R&D-Co on concerns around the growth prospects for the company's flagship product, Linzess. These concerns further intensified when ABBV announced plans to acquire IRWD's partner, AGN, raising concerns that the Linzess franchise could be impacted by merger related reorganizations/reprioritizations. Stock selection in Real Estate and Consumer Discretionary also negatively impacted performance.
Fom the sector allocation perspective, underweight in Utilities and overweight in Healthcare were the largest detractors.
On the positive side, securities selection in Industrials was the most beneficial to the returns. Within the sector, AGCO and Gardner Denver were the largest contributors. AGCO's shares price continued to grow due to increasing margins, smart pricing and growth initiatives and better cost control. From the sector allocation perspective, underweight in Energy was the largest contributor.
On a single stock level, AGCO, Walgreens and Lam Research were the largest contributors. Ironwood Pharmaceuticals, NetApp and UnitedHealth detracted the most.
Consumer Discretionary sector is our largest overweight. Retail remains under heavy pressure although some perceived winning models of the future are bucking the trend, for example OneSpaWorld continues to hum along nicely and we're optimistic about operating trends and the prospect of new ship wins. Information Technology sector is also one of our top overweights. We believe that traditional IT hardware and software manufacturers should continue to see top-line revenue and margin pressure as cloud, software-as-a-service and open source computing shrink their addressable markets.
The Fund does not invest in Energy sector. We are currently also underweight Communication Services and – most recently (due to selling out of Eli Lilly, Incyte, and Ironwood Pharmaceuticals) Health Care.
Thanks again for your investment in the Aspiration Redwood Fund. Together, we’re accomplishing something truly remarkable. And we’re just getting started.
Best,
Andrei Cherny
CEO, Aspiration Partners, Inc.
PS. Do you know anyone else you think we be a good fit to join Aspiration’s growing community of socially-conscious investors? Please put in a good word for us!
(RCASP1119002)
| Aspiration Redwood Fund | |||||||||||||||||||
| Performance Update (Unaudited) | |||||||||||||||||||
| For the period from November 16, 2015 (Date of Initial Public Investment) through September 30, 2019 | |||||||||||||||||||
| Comparison of the Change in Value of a $10,000 Investment | |||||||||||||||||||
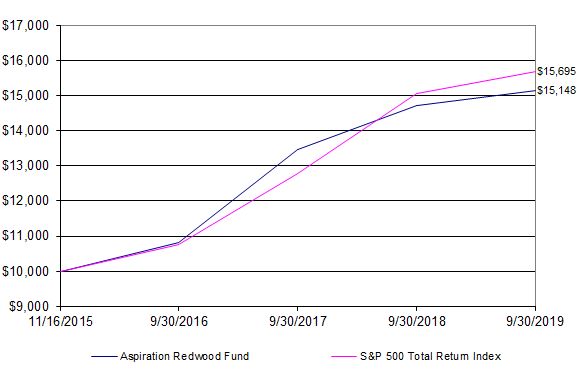
| This graph assumes an initial investment of $10,000 at November 16, 2015 (Date of Initial Public Investment). All dividends and distributions are reinvested. This graph depicts the performance of the Aspiration Redwood Fund versus the S&P 500 Total Return Index. It is important to note that the Fund is a professionally managed mutual fund while the index is not available for investment and is unmanaged. The comparison is shown for illustrative purposes only. | |||||||||||||||||||
| Average Annual Total Returns | |||||||||||||||||||
| Gross | Net | ||||||||||||||||||
| As of | One | Since | Inception | Expense | Expense | ||||||||||||||
| September 30, 2019 | Year | Inception | Date | Ratio* | Ratio* | ||||||||||||||
| Aspiration Redwood Fund - With maximum | |||||||||||||||||||
| assumed contribution reduction** | 0.95% | 9.32% | 11/16/15 | 1.50% | 0.50% | ||||||||||||||
| Aspiration Redwood Fund - Without maximum | |||||||||||||||||||
| assumed contribution reduction | 2.95% | 11.32% | 11/16/15 | 1.50% | 0.50% | ||||||||||||||
| S&P 500 Total Return Index | 4.25% | 12.34% | N/A | N/A | N/A | ||||||||||||||
| * | The gross and net expense ratios shown are from the Fund's Financial Highlights as of September 30, 2019. | ||||||||||||||||||
| ** | Investors in the Fund are clients of Aspiration Fund Adviser, LLC (the "Advisor") and may pay the Advisor a fee in the amount they believe is fair ranging from 0% to 2% of the value of their investment in the Fund. The Average Annual Total Returns with a maximum assumed contributed reduction is calculated assuming a maximum advisory fee of 2% is paid by an investor to the Advisor. | ||||||||||||||||||
| Performance quoted above represents past performance, which is no guarantee of future results. Investment return and principal value will fluctuate so that shares, when redeemed, may be worth more or less than their original cost. Current performance may be lower or higher than the performance data quoted. An investor may obtain performance data, current to the most recent month-end, by visiting aspiration.com. | |||||||||||||||||||
| The graph and table do not reflect the deduction of taxes that a shareholder would pay on Fund distributions or the redemption of Fund shares. Average annual total returns are historical in nature and measure net investment income and capital gain or loss from portfolio investments assuming reinvestments of distributions. | |||||||||||||||||||
| Aspiration Redwood Fund | ||||||||||
| Schedule of Investments | ||||||||||
| As of September 30, 2019 | ||||||||||
Shares | Value (Note 1) | |||||||||
| COMMON STOCKS - 93.58% | ||||||||||
| Communication Services - 4.03% | ||||||||||
| * | Electronic Arts, Inc. | 34,838 | $ | 3,407,853 | ||||||
| 3,407,853 | ||||||||||
| Consumer Discretionary - 15.32% | ||||||||||
| Aptiv PLC | 33,518 | 2,930,144 | ||||||||
| Best Buy Co., Inc. | 28,014 | 1,932,686 | ||||||||
| * | LKQ Corp. | 74,803 | 2,352,554 | |||||||
| * | Mohawk Industries, Inc. | 24,646 | 3,057,829 | |||||||
| * | OneSpaWorld Holdings Ltd. | 173,034 | 2,687,218 | |||||||
| 12,960,431 | ||||||||||
| Consumer Staples - 4.20% | ||||||||||
| Conagra Brands, Inc. | 115,851 | 3,554,309 | ||||||||
| 3,554,309 | ||||||||||
| Financials - 21.98% | ||||||||||
| Ameriprise Financial, Inc. | 26,282 | 3,866,082 | ||||||||
| Comerica, Inc. | 53,279 | 3,515,881 | ||||||||
| Prudential Financial, Inc. | 46,307 | 4,165,315 | ||||||||
| US Bancorp | 67,362 | 3,727,813 | ||||||||
| Visa, Inc. | 19,314 | 3,322,201 | ||||||||
| 18,597,292 | ||||||||||
| Health Care - 11.60% | ||||||||||
| * | Bio-Rad Laboratories, Inc. | 6,787 | 2,258,306 | |||||||
| * | Cyclerion Therapeutics, Inc. | 36,480 | 442,138 | |||||||
| Eli Lilly & Co. | 12,916 | 1,444,396 | ||||||||
| * | Ironwood Pharmaceuticals, Inc. | 202,925 | 1,742,111 | |||||||
| * | Mirati Therapeutics, Inc. | 3,199 | 249,234 | |||||||
| UnitedHealth Group, Inc. | 16,917 | 3,676,403 | ||||||||
| 9,812,588 | ||||||||||
| Industrials - 14.23% | ||||||||||
| AGCO Corp. | 48,233 | 3,651,238 | ||||||||
| * | Gardner Denver Holdings, Inc. | 44,936 | 1,271,239 | |||||||
| Masco Corp. | 61,120 | 2,547,482 | ||||||||
| MSA Safety, Inc. | 6,654 | 726,018 | ||||||||
| * | Stericycle, Inc. | 75,415 | 3,840,886 | |||||||
| 12,036,863 | ||||||||||
| Information Technology - 22.22% | ||||||||||
| * | Adobe, Inc. | 10,378 | 2,866,923 | |||||||
| * | IPG Photonics Corp. | 7,775 | 1,054,290 | |||||||
| * | LiveRamp Holdings, Inc. | 75,114 | 3,226,897 | |||||||
| LogMeIn, Inc. | 56,281 | 3,993,700 | ||||||||
| NetApp, Inc. | 57,334 | 3,010,608 | ||||||||
| * | ON Semiconductor Corp. | 115,192 | 2,212,838 | |||||||
| Western Digital Corp. | 40,850 | 2,436,294 | ||||||||
| 18,801,550 | ||||||||||
| Total Common Stocks (Cost $79,177,632) | 79,170,886 | |||||||||
| (Continued) | ||||||||||
| Aspiration Redwood Fund | ||||||||||
| Schedule of Investments - Continued | ||||||||||
| As of September 30, 2019 | ||||||||||
Shares | Value (Note 1) | |||||||||
| REAL ESTATE INVESTMENT TRUST - 4.71% | ||||||||||
| Simon Property Group, Inc. | 25,599 | $ | 3,984,484 | |||||||
| 3,984,484 | ||||||||||
| Total Real Estate Investment Trust (Cost $4,263,285) | 3,984,484 | |||||||||
| SHORT-TERM INVESTMENT - 3.86% | ||||||||||
| § | Fidelity Institutional Money Market Funds - Treasury Portfolio, 1.82% | 3,263,232 | 3,263,232 | |||||||
| Total Short-Term Investment (Cost $3,263,232) | 3,263,232 | |||||||||
| Total Value of Investments (Cost $86,704,149) - 102.15% | $ | 86,418,602 | ||||||||
| Liabilities in Excess of Other Assets - (2.15)% | (1,821,770) | |||||||||
| NET ASSETS - 100.00% | $ | 84,596,832 | ||||||||
| * | Non-income producing investment | |||||||||
| § | Represents 7 day effective yield as of September 30, 2019 | |||||||||
| Summary of Investments | ||||||||||
| % of Net | ||||||||||
| By Sector | Assets | Value | ||||||||
| Communication Services | 4.03% | $ 3,407,853 | ||||||||
| Consumer Discretionary | 15.32% | 12,960,431 | ||||||||
| Consumer Staples | 4.20% | 3,554,309 | ||||||||
| Financials | 21.98% | 18,597,292 | ||||||||
| Health Care | 11.60% | 9,812,588 | ||||||||
| Industrials | 14.23% | 12,036,863 | ||||||||
| Information Technology | 22.22% | 18,801,550 | ||||||||
| Real Estate Investment Trust | 4.71% | 3,984,484 | ||||||||
| Short-Term Investment | 3.86% | 3,263,232 | ||||||||
| Other Assets Less Liabilities | -2.15% | (1,821,770) | ||||||||
| Total Net Assets | 100.00% | $84,596,832 | ||||||||
| See Notes to Financial Statements | ||||||||||
| Aspiration Redwood Fund | ||||
| Statement of Assets and Liabilities | ||||
| As of September 30, 2019 | ||||
| Assets: | ||||
| Investments, at value (cost $86,704,149) | $ | 86,418,602 | ||
| Receivables: | ||||
| From Advisor | 746,277 | |||
| Investments sold | 12,406,877 | |||
| Fund shares sold | 310,146 | |||
| Dividends | 70,504 | |||
| Prepaid expenses: | ||||
| Registration and filing expenses | 18,501 | |||
| Fund accounting fees | 2,038 | |||
| Transfer agent fees | 667 | |||
| Trustee fees and meeting expenses | 4 | |||
| Total assets | 99,973,616 | |||
| Liabilities: | ||||
| Payables: | ||||
| Investments purchased | 15,164,771 | |||
| Fund shares repurchased | 152,168 | |||
| Accrued expenses: | ||||
| Professional fees | 32,674 | |||
| Distribution and service fees - Investor Class Shares | 16,412 | |||
| Insurance fees | 5,832 | |||
| Custody fees | 4,141 | |||
| Shareholder fulfillment fees | 543 | |||
| Administration fees | 208 | |||
| Security pricing fees | 35 | |||
| Total liabilities | 15,376,784 | |||
| Net Assets | $ | 84,596,832 | ||
| Net Assets Consist of: | ||||
| Paid in capital | $ | 79,758,045 | ||
| Distributable earnings | 4,838,787 | |||
| Total Net Assets | $ | 84,596,832 | ||
| Shares Outstanding, no par value (unlimited authorized shares) | 6,604,969 | |||
| Net Asset Value, Maximum Offering Price and Redemption Price Per Share | $ | 12.81 | ||
| See Notes to Financial Statements | ||||
| Aspiration Redwood Fund | ||||
| Statement of Operations | ||||
| For the fiscal year ended September 30, 2019 | ||||
| Investment Income: | ||||
| Dividends | $ | 1,375,532 | ||
| Total Investment Income | 1,375,532 | |||
| Expenses: | ||||
Transfer Agent fees (Note 2) | 511,720 | |||
Other operating expenses (Note 2) | 322,341 | |||
Distribution and service fees - Investor Class Shares (Note 3) | 198,572 | |||
| Professional fees | 159,104 | |||
| Total Expenses | 1,191,737 | |||
Expenses reimbursed by Advisor (Note 2) | (794,797) | |||
| Net Expenses | 396,940 | |||
| Net Investment Income | 978,592 | |||
| Realized and Unrealized Gain (Loss) on Investments: | ||||
| Net realized gain from investment transactions | 4,450,881 | |||
| Net change in unrealized depreciation on investments | (2,741,641) | |||
| Net Realized and Unrealized Gain on Investments | 1,709,240 | |||
| Net Increase in Net Assets Resulting from Operations | $ | 2,687,832 | ||
| Aspiration Redwood Fund | ||||||||||
| Statements of Changes in Net Assets | ||||||||||
| For the fiscal years ended September 30, | 2019 | 2018 | ||||||||
| Operations: | ||||||||||
| Net investment income | $ | 978,592 | $ | 658,446 | ||||||
| Net realized gain from investment transactions | 4,450,881 | 5,624,398 | ||||||||
| Net change in unrealized appreciation (depreciation) on | ||||||||||
| investments | (2,741,641) | 244,520 | ||||||||
| Increase in Net Assets from Operations | 2,687,832 | 6,527,364 | ||||||||
| Distributions to Shareholders | (6,111,447) | (2,151,750) | ||||||||
| Decrease in Net Assets Resulting from Distributions | (6,111,447) | (2,151,750) | ||||||||
| Beneficial Interest Transactions: | ||||||||||
| Shares Sold | 25,409,119 | 51,184,782 | ||||||||
| Reinvested Dividends and Distributions | 6,083,362 | 2,145,987 | ||||||||
| Shares Repurchased | (22,602,384) | (15,824,831) | ||||||||
| Net Increase in Beneficial Interest Transactions | 8,890,097 | 37,505,938 | ||||||||
| Net Increase in Net Assets | 5,466,482 | 41,881,552 | ||||||||
| Net Assets: | ||||||||||
| Beginning of year | 79,130,350 | 37,248,798.00 | ||||||||
| End of year | $ | 84,596,832 | $ | 79,130,350 | ||||||
| Share Information: | ||||||||||
| Shares Sold | 2,061,802 | 3,936,356 | ||||||||
| Reinvested Dividends and Distributions | 564,133 | 170,837 | ||||||||
| Shares Repurchased | (1,828,327) | (1,206,269) | ||||||||
| Net Increase in Shares of Beneficial Interest | 797,608 | 2,900,924 | ||||||||
| Aspiration Redwood Fund | |||||||||||||
| Financial Highlights | |||||||||||||
| For a share outstanding during the fiscal | |||||||||||||
| years or period ended September 30, | 2019 | 2018 | 2017 | 2016 | (d) | ||||||||
| Net Asset Value per Share, Beginning of Period | $ | 13.63 | $ | 12.82 | $ | 10.81 | $ | 10.00 | |||||
| Income from Investment Operations | |||||||||||||
| Net investment income | 0.14 | 0.14 | 0.13 | 0.10 | |||||||||
| Net realized and unrealized gain on investments | 0.06 | 1.25 | 2.43 | 0.71 | |||||||||
| Total from Investment Operations | 0.20 | 1.39 | 2.56 | 0.81 | |||||||||
| Less Distributions to Shareholders: | |||||||||||||
| Net investment income | (0.12) | (0.06) | (0.21) | - | |||||||||
| Net realized gains | (0.90) | (0.52) | (0.34) | - | |||||||||
| Total Distributions | (1.02) | (0.58) | (0.55) | - | |||||||||
| Net Asset Value per Share, End of Period | $ | 12.81 | $ | 13.63 | $ | 12.82 | $ | 10.81 | |||||
| Total Return (c) | 2.95% | 11.28% | 24.70% | 8.10% | (b) | ||||||||
| Net Assets, End of Period (in thousands) | $ | 84,597 | $ | 79,130 | $ | 37,249 | $ | 5,163 | |||||
| Ratios of: | |||||||||||||
| Gross Expenses to Average Net Assets | 1.50% | 1.41% | 2.65% | 9.49% | (a) | ||||||||
| Net Expenses to Average Net Assets | 0.50% | 0.50% | 0.50% | 0.50% | (a) | ||||||||
| Net Investment Income to Average Net Assets | 1.23% | 1.06% | 0.83% | 1.90% | (a) | ||||||||
| Portfolio turnover rate | 135.10% | 110.18% | 131.83% | 120.74% | (b) | ||||||||
| (a) | Annualized | ||||||||||||
| (b) | Not annualized. | ||||||||||||
| (c) | Investors in the Fund are clients of Aspiration Fund Adviser, LLC (the "Advisor") and may pay the Advisor a fee in the amount they believe is fair ranging from 0% to 2% of the value of their investment in the Fund. Assuming a maximum advisory fee of 2% is paid by an investor to the Advisor, the Total Return of an investment in the Fund would have been 0.95%, 9.28%, 22.70%, and 6.10% for the periods ended September 2019, 2018, 2017, and 2016, respectively. | ||||||||||||
| (d) | For the fiscal period from November 16, 2015 (Date of Initial Public Investment) through September 30, 2016. | ||||||||||||
| Aspiration Redwood Fund | ||||||||
| Investments in Securities (a) | Total | Level 1 | Level 2 | Level 3 | ||||
| Investments | ||||||||
Common Stocks* | $ | 79,170,886 | $ | 79,170,886 | $ | - | $ | - |
Real Estate Investment Trust | 3,984,484 | 3,984,484 | - | - | ||||
Short-Term Investment | 3,263,232 | 3,263,232 | - | - | ||||
| Total Investments | $ | 86,418,602 | $ | 86,418,602 | $ | - | $ | - |
| Fiscal Year/Period End | Reimbursement Amount | Recoupment Date Expiration |
| September 30, 2019 | $794,797 | September 30, 2022 |
| September 30, 2018 | $566,641 | September 30, 2021 |
| September 30, 2017 | $373,852 | September 30, 2020 |
| Purchases of Securities | Proceeds from Sales of Securities |
| $109,430,159 | $105,548,700 |
September 30, 2019 | September 30, 2018 | |
| Ordinary Income | $4,852,616 | $1,979,757 |
| Long-Term Capital Gains | 1,258,831 | 171,993 |
Cost of Investments | $87,051,414 | |||||
Gross Unrealized Appreciation | 3,070,260 | |||||
Gross Unrealized Depreciation | (3,703,071) | |||||
Net Unrealized Depreciation | (632,811) | |||||
Undistributed Net Investment Income | 4,920,807 | |||||
Undistributed Capital Gains | 550,793 | |||||
Accumulated Earnings | $ 4,838,787 | |||||
of Aspiration Redwood Fund

| Investor Class Shares | Beginning Account Value April 1, 2019 | Ending Account Value September 30, 2019 | Expenses Paid During Period* |
Actual Hypothetical (5% annual return before expenses) | |||
| $1,000.00 | $1,046.60 | $2.57 | |
| $1,000.00 | $1,022.56 | $2.54 |
Name, Age and Address | Position held with Funds or Trust | Length of Time Served | Principal Occupation During Past 5 Years | Number of Portfolios in Fund Complex Overseen by Trustee | Other Directorships Held by Trustee During Past 5 Years |
| Independent Trustees | |||||
| Chuck Daggs (1947) 116 South Franklin Street Rocky Mount, NC 27804 | Independent Trustee | Since 05/2018 | Currently Retired; previously Executive Vice President of Wealth Management Group at Wells Fargo from 1998 – 2015. | 2 | None. |
| Coby A. King (1960) 116 South Franklin Street Rocky Mount, NC 27804 | Independent Trustee | Since 01/2016 | President and Chief Executive Officer of High Point Strategies, LLC (Public Affairs Consulting) since 2013; Lobbyist for Ek & Ek, LLC (Public Affairs Consulting) from 2012 – 2013; Senior Vice President at MWW Group, Inc. (Public Affairs Consulting) from 2008 – 2012. | 2 | None. |
| David L. Kingsdale (1963) 116 South Franklin Street Rocky Mount, NC 27804 | Independent Trustee | Since 10/2014 | Chief Executive Officer of Millennium Dance Media, LLC since 2010; Owner of DLK, Inc. (media consulting agency) since 2005. | 2 | The Giving Back Fund; Prime Access Capital. |
Name, Age and Address | Position held with Funds or Trust | Length of Time Served | Principal Occupation During Past 5 Years | Number of Portfolios in Fund Complex Overseen by Trustee | Other Directorships Held by Trustee During Past 5 Years |
| Interested Trustees | |||||
| Andrei Cherny (1975) 116 South Franklin Street Rocky Mount, NC 27804 | Interested Trustee, Principal Executive Officer and President | Trustee Since 08/2017; President Since 2/2014 | Chief Executive Officer of Aspiration Partners, LLC since 2013; Investor since 2009; previously, Managing Director and Senior Analyst for Burston-Marsteller (Public Relations and Communications) from 2011 – 2013. | 2 | Board Member and President for Democracy: a Journal of Ideas. |
| Alexandra Horigan (1983) 116 South Franklin Street Rocky Mount, NC 27804 | Interested Trustee | Since 08/2017 | Vice President of Operations of Aspiration Partners, Inc. since 2012. | 2 | None. |
| Other Officers | |||||
| Ashley E. Harris (1984) 116 South Franklin Street Rocky Mount, NC 27804 | Treasurer, Principal Financial Officer and Assistant Secretary of the Trust | Since 12/2014 | Fund Accounting Manager and Financial Reporting, The Nottingham Company since 2008. | n/a | n/a |
Andrew P. Chica (1975) 116 S. Franklin Street Rocky Mount, NC 27804 | Chief Compliance Officer | Since 07/2019 | Compliance Director, Cipperman Compliance Services, LLC (01/2019-Present). Chief Compliance Officer of Hatteras Funds, LP and Hatteras Capital Distributors, LLC (2007-Present) | n/a | n/a |
For Shareholder Service Inquiries: | For Investment Advisor Inquiries: |
| Nottingham Shareholder Services, LLC | Aspiration Fund Adviser, LLC |
| 116 South Franklin Street | 4551 Glencoe Avenue |
| Post Office Box 69 | Marina Del Rey, CA 90292 |
| Rocky Mount, North Carolina 27802-0069 | |
| Telephone: | Telephone: |
| 800-773-3863 | 800-683-8529 |
| World Wide Web @: | World Wide Web @: |
| ncfunds.com | aspiration.com |
Item 2. | CODE OF ETHICS. |
| (a) | The registrant, as of the end of the period covered by this report, has adopted a code of ethics that applies to the registrant’s principal executive officer, principal financial officer, principal accounting officer or controller, or persons performing similar functions, regardless of whether these individuals are employed by the registrant or a third party (the “Code of Ethics”). |
| (c) | During the period covered by this report, there have been no substantive amendments to the provisions of the Code of Ethics. |
| (d) | During the period covered by this report, the registrant did not grant any waivers to the provisions of the Code of Ethics. |
| (f)(1) | A copy of the Code of Ethics is filed with this Form N-CSR as Exhibit 13(a)(1). |
| Item 3. | AUDIT COMMITTEE FINANCIAL EXPERT. |
| The registrant’s Board of Trustees has determined that it does not have an audit committee financial expert. At this time, the registrant’s Board of Trustees believe that the collective knowledge and experience provided by the members of the audit committee collectively offer the registrant adequate oversight for the registrant’s level of financial complexity. | |
| Item 4. | PRINCIPAL ACCOUNTANT FEES AND SERVICES. |
(a) | Audit Fees – Audit fees billed for the Aspiration Redwood Fund (the Fund”), a series of the Aspiration Funds, for the last two fiscal years are reflected in the tables below. |
| For the fiscal year ended September 30, 2019, these amounts represent aggregate fees billed for professional services rendered by the registrant’s independent accountants Deloitte & Touche LLP (“Accountant”), for the audit of the Fund’s annual financial statements or services that are normally provided by the Accountant in connection with the registrant’s statutory and regulatory filings or engagements for that fiscal year. | |
| Fund | September 30, 2019 |
| Aspiration Redwood Fund | $23,000 |
| For the fiscal year ended September 30, 2018, these amounts represent aggregate fees billed for professional services rendered by the registrant’s former independent accountants, Ernst & Young, LLP (“Former Accountant”), for the audit of the Fund’s annual financial statements or services that are normally provided by the Former Accountant in connection with the registrant’s statutory and regulatory filings or engagements for that fiscal year. |
| Fund | September 30, 2018 |
| Aspiration RedwoodFund | $20,000 |
(b) | Audit-Related Fees – There were no additional fees billed in the fiscal year ended September 30, 2019 for assurance and related services by the Accountant that were reasonably related to the performance of the audit of the Fund’s financial statements and that were not reported under paragraph (a) of this Item. |
| There were no additional fees billed in the fiscal year ended September 30, 2018 for assurance and related services by the Former Accountant that were reasonably related to the performance of the audit of the Fund’s financial statements and that were not reported under paragraph (a) of this Item. | |
(c) | Tax Fees – The tax fees billed in the fiscal year ended September 30, 2019 for professional services rendered for tax compliance, tax advice, and tax planning are reflected in the table below. These services were for the completion of the Fund’s federal and state income tax returns, excise tax returns, and assistance with distribution calculations. |
| Fund | September 30, 2019 |
| Aspiration Redwood Fund | $5,500 |
The tax fees billed in the fiscal year ended September 30, 2018 for professional services rendered by the Former Accountant for tax compliance, tax advice, and tax planning are reflected in the table below. These services were for the completion of the Fund’s federal and state income tax returns, excise tax returns, and assistance with distribution calculations. |
| Fund | September 30, 2018 |
| Aspiration Redwood Fund | $5,500 |
(d) | All Other Fees – There were no other fees billed in the fiscal year ended September 30, 2019 for products and services provided by the Accountant, other than the services reported in paragraphs (a) through (c) of this Item. |
There were no other fees billed in the fiscal year ended September 30, 2018 for products and services provided by the Former Accountant, other than the services reported in paragraphs (a) through (c) of this Item. | |
| (e)(1) | The registrant’s Board of Trustees pre-approved the engagement of the Former Accountant for the fiscal year ended September 30, 2018 at an audit committee meeting of the Board of Trustees called for such purpose. The registrant’s Board of Trustees pre-approved the engagement of the Accountant for the fiscal year ended September 30, 2019 at an audit committee meeting of the Board of Trustees called for such purpose and will pre-approve the Accountant for each fiscal year thereafter at an audit committee meeting called for such purpose. The charter of the audit committee states that the audit committee should pre-approve any audit services and, when appropriate, evaluate and pre-approve any non-audit services provided by the Accountant to the registrant and to pre-approve, when appropriate, any non-audit services provided by the Accountant to the registrant’s investment adviser, or any entity controlling, controlled by, or under common control with the investment adviser that provides ongoing services to the registrant if the engagement relates directly to the operations and financial reporting of the registrant. |
(2) | There were no services as described in each of paragraph (b) through (d) of this Item that were approved by the audit committee pursuant to paragraph (c)(7)(i)(C) of Rule 2-01 of Regulation S-X. |
| (f) | Not Applicable. |
| (g) | The aggregate non-audit fees billed by the Accountant to the Fund for services rendered for the fiscal year ended September 30, 2019 was $0.00. There were no fees billed by the Accountant for non-audit services rendered to the Fund’s investment adviser, or any other entity controlling, controlled by, or under common control with the Fund’s investment adviser. |
| The aggregate non-audit fees billed by the Former Accountant to the Fund for services rendered for the fiscal year ended September 30, 2018 was $0.00. There were no fees billed by the Former Accountant for non-audit services rendered to the Fund’s investment adviser, or any other entity controlling, controlled by, or under common control with the Fund’s investment adviser. | |
| (h) | Not applicable. |
| Item 5. | AUDIT COMMITTEE OF LISTED REGISTRANTS. |
| Not applicable. | |
| Item 6. | SCHEDULE OF INVESTMENTS. |
| A copy of the schedule of investments in securities of unaffiliated issuers as of the close of the reporting period is included as part of the report to shareholders filed under Item 1 of this Form. | |
| Item 7. | DISCLOSURE OF PROXY VOTING POLICIES AND PROCEDURES FOR CLOSED-END MANAGEMENT INVESTMENT COMPANIES. |
| Not applicable. | |
| Item 8. | PORTFOLIO MANAGERS OF CLOSED-END MANAGEMENT INVESTMENT COMPANIES. |
| Not applicable. | |
| Item 9. | PURCHASES OF EQUITY SECURITIES BY CLOSED-END MANAGEMENT INVESTMENT COMPANY AND AFFILIATED PURCHASERS. |
| Not applicable. | |
| Item 10. | SUBMISSION OF MATTERS TO A VOTE OF SECURITY HOLDERS. |
| None. | |
| Item 11. | CONTROLS AND PROCEDURES. |
| (a) | The President and Principal Executive Officer and the Treasurer and Principal Financial Officer have concluded that the registrant’s disclosure controls and procedures (as defined in Rule 30a-3(c) under the Investment Company Act of 1940) are effective based on their evaluation of these disclosure controls and procedures required by Rule 30a-3(b) under the Investment Company Act of 1940 and Rules 13a-15(b) or 15d-15(b) under the Exchange Act of 1934, as of a date within 90 days of the filing of this report. |
| (b) | There were no changes in the registrant's internal control over financial reporting (as defined in Rule 30a-3(d) under the Investment Company Act of 1940) that occurred during the period covered by this report that have materially affected, or are reasonably likely to materially affect, the registrant’s internal control over financial reporting. |
| Item 12. | DISCLOSURE OF SECURITIES LENDING ACTIVITIES FOR CLOSED-END MANAGEMENT INVESTMENT COMPANIES. |
| Not applicable. | |
| Item 13. | EXHIBITS. |
| (a)(1) | Code of Ethics required by Item 2 of Form N-CSR is filed herewith. |
| (a)(2) | Certifications pursuant to Rule 30a-2(a) under the Investment Company Act of 1940 are filed herewith. |
| (a)(3) | Not applicable. |
| (a)(4) | The information regarding the change in the registrant’s independent public accountant pursuant to Item 4 of Form 8-K and Item 304(a)(1) of Regulation S-K is filed herewith. |
| (b) | Certifications pursuant to Rule 30a-2(b) under the Act and Section 906 of the Sarbanes-Oxley Act of 2002 are filed herewith. |
Aspiration Funds | ||
By: | /s/ Andrei Cherny | |
Andrei Cherny Trustee, President and Principal Executive Officer | ||
Date: | December 5, 2019 | |
By: | /s/ Andrei Cherny | |
Andrei Cherny Trustee, President and Principal Executive Officer | ||
Date: | December 5, 2019 | |
By: | /s/ Ashley E. Harris | |
Ashley E. Harris Treasurer and Principal Financial Officer | ||
Date: | December 5, 2019 |