Exhibit (c)(2)
DISCUSSION MATERIALS Presentation to Board of Directors January 21, 2018 STRICTLY PRIVATE AND CONFIDENTIAL

CONFIDENTIAL CELGENE CORPORATION This presentation was prepared exclusively for the benefit and internal use of the J.P. Morgan client to whom it is directly add ressed and delivered (including such client’s subsidiaries, the “Company”) in order to assist the Company in evaluating, on a preliminary basis, the feasibil ity of a possible transaction or transactions and does not carry any right of publication or disclosure, in whole or in part, to any other party. This presen tat ion is for discussion purposes only and is incomplete without reference to, and should be viewed solely in conjunction with, the oral briefing provided by J.P. Morg an. Neither this presentation nor any of its contents may be disclosed or used for any other purpose without the prior written consent of J.P. Morgan. The information in this presentation is based upon any management forecasts supplied to us and reflects prevailing conditions an d our views as of this date, all of which are accordingly subject to change. J.P. Morgan’s opinions and estimates constitute J.P. Morgan’s judgment and shou ld be regarded as indicative, preliminary and for illustrative purposes only. In preparing this presentation, we have relied upon and assumed, wi thout independent verification, the accuracy and completeness of all information available from public sources or which was provided to us by or on behalf of th e Company or which was otherwise reviewed by us. In addition, our analyses are not and do not purport to be appraisals of the assets, stock, or bus ine ss of the Company or any other entity. J.P. Morgan makes no representations as to the actual value which may be received in connection with a transaction nor the legal, tax or accounting effects of consummating a transaction. Unless expressly contemplated hereby, the information in this presentation does not t ake into account the effects of a possible transaction or transactions involving an actual or potential change of control, which may have significant valuation an d other effects. Notwithstanding anything herein to the contrary, the Company and each of its employees, representatives or other agents may d isc lose to any and all persons, without limitation of any kind, the U.S. federal and state income tax treatment and the U.S. federal and state incom e t ax structure of the transactions contemplated hereby and all materials of any kind (including opinions or other tax analyses) that are provided to the Company re lating to such tax treatment and tax structure insofar as such treatment and/or structure relates to a U.S. federal or state income tax strategy provided to the Company by J.P. Morgan. J.P. Morgan's policies on data privacy can be found at http://www.jpmorgan.com/pages/privacy . J.P. Morgan’s policies prohibit employees from offering, directly or indirectly, a favorable research rating or specific price t arget, or offering to change a rating or price target, to a subject company as consideration or inducement for the receipt of business or for compensation. J.P. Morg an also prohibits its research analysts from being compensated for involvement in investment banking transactions except to the extent that such participati on is intended to benefit investors. IRS Circular 230 Disclosure : JPMorgan Chase & Co. and its affiliates do not provide tax advice. Accordingly, any discussion of U.S. tax matters included herein (including any attachments) is not intended or written to be used, and cannot be used, in connection with the pr omotion, marketing or recommendation by anyone not affiliated with JPMorgan Chase & Co. of any of the matters addressed herein or for the purpose of avoiding U.S. tax - related penalties. J.P. Morgan is the marketing name for the Corporate and Investment Banking activities of JPMorgan Chase Bank, N.A., JPMS (mem ber , NYSE), J.P. Morgan PLC authorized by the Prudential Regulation Authority and regulated by the Financial Conduct Authority and the Prud ential Regulation Authority and their investment banking affiliates. This presentation does not constitute a commitment by any J.P. Morgan entity to underwrite, subscribe for or place any securitie s or to extend or arrange credit or to provide any other services. Copyright 201 7 JPMorgan Chase & Co. All rights reserved. DISCUSSION MATERIALS
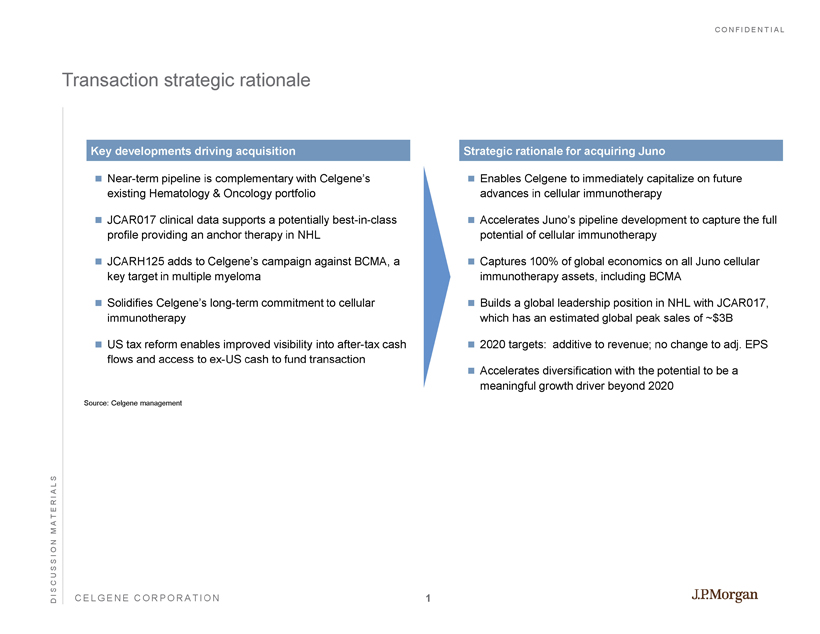
CONFIDENTIAL CELGENE CORPORATION Transaction strategic rationale Near - term pipeline is complementary with Celgene’s existing Hematology & Oncology portfolio JCAR017 clinical data supports a potentially best - in - class profile providing an anchor therapy in NHL JCARH125 adds to Celgene’s campaign against BCMA, a key target in multiple myeloma Solidifies Celgene’s long - term commitment to cellular immunotherapy US tax reform enables improved visibility into after - tax cash flows and access to ex - US cash to fund transaction Key developments driving acquisition Enables Celgene to immediately capitalize on future advances in cellular immunotherapy Accelerates Juno’s pipeline development to capture the full potential of cellular immunotherapy Captures 100% of global economics on all Juno cellular immunotherapy assets, including BCMA Builds a global leadership position in NHL with JCAR017, which has an estimated global peak sales of ~$3B 2020 targets: additive to revenue; no change to adj. EPS Accelerates diversification with the potential to be a meaningful growth driver beyond 2020 Strategic rationale for acquiring Juno DISCUSSION MATERIALS Source: Celgene management 1
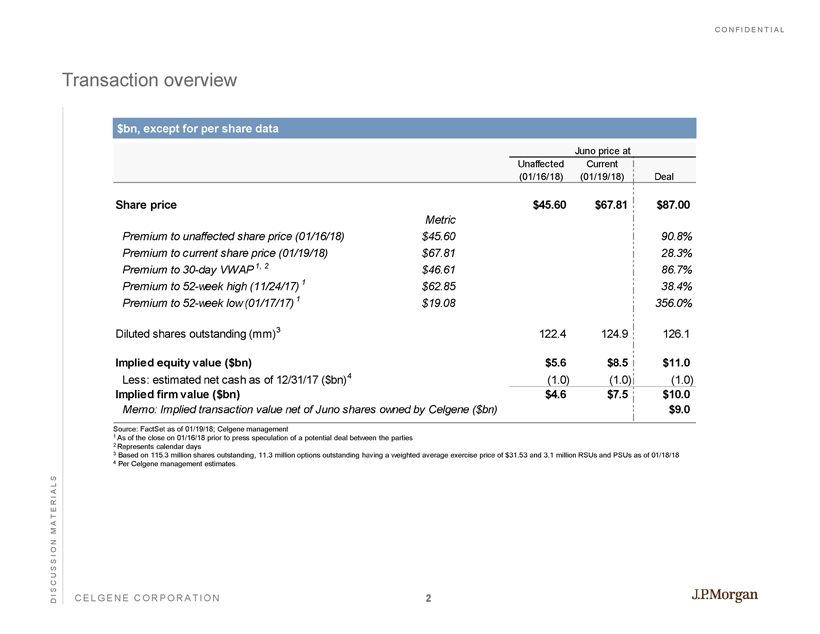
CONFIDENTIAL CELGENE CORPORATION Transaction overview $ bn , except for per share data Source: FactSet as of 01/19/18; Celgene management 1 As of the close on 01/16/18 prior to press speculation of a potential deal between the parties 2 Represents calendar days 3 Based on 115.3 million shares outstanding, 11.3 million options outstanding having a weighted average exercise price of $31.5 3 and 3.1 million RSUs and PSUs as of 01/18/18 4 Per Celgene management estimates DISCUSSION MATERIALS Juno price at Unaffected (01/16/18) Current (01/19/18) Deal Share price $45.60 $67.81 $87.00 Metric Premium to unaffected share price (01/16/18) $45.60 90.8% Premium to current share price (01/19/18) $67.81 28.3% Premium to 30-day VWAP 1, 2 $46.61 86.7% Premium to 52-week high (11/24/17) 1 $62.85 38.4% Premium to 52-week low (01/17/17) 1 $19.08 356.0% Diluted shares outstanding (mm) 3 122.4 124.9 126.1 Implied equity value ($bn) $5.6 $8.5 $11.0 Less: estimated net cash as of 12/31/17 ($bn) 4 (1.0) (1.0) (1.0) Implied firm value ($bn) $4.6 $7.5 $10.0 Memo: Implied transaction value net of Juno shares owned by Celgene ($bn) $9.0 2
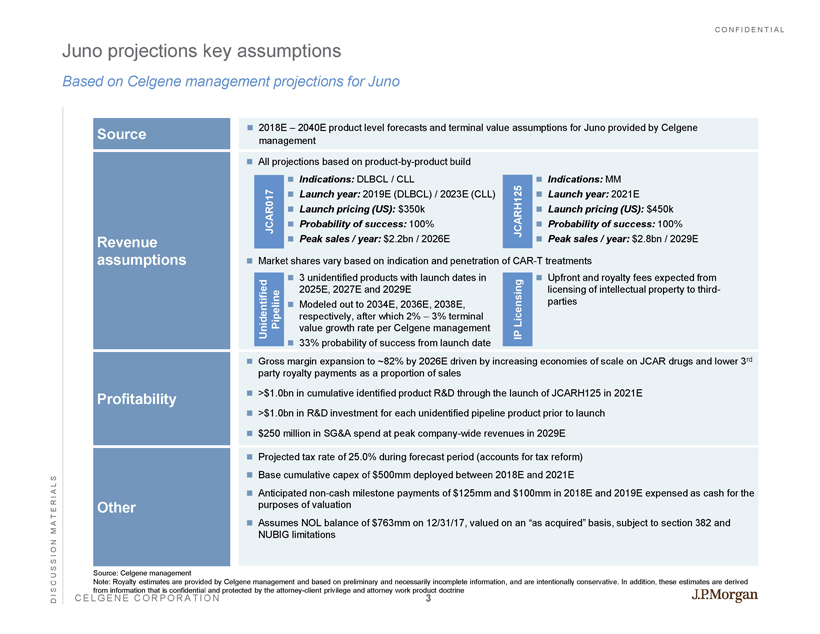
CONFIDENTIAL CELGENE CORPORATION Juno projections key assumptions Based on Celgene management projections for Juno DISCUSSION MATERIALS Source Revenue assumptions Profitability Other 2018E – 2040E product level forecasts and terminal value assumptions for Juno provided by Celgene management Projected tax rate of 25.0% during forecast period (accounts for tax reform) Base cumulative capex of $500mm deployed between 2018E and 2021E Anticipated non - cash milestone payments of $125mm and $100mm in 2018E and 2019E expensed as cash for the purposes of valuation Assumes NOL balance of $763mm on 12/31/17, valued on an “as acquired” basis, subject to section 382 and NUBIG limitations Gross margin expansion to ~82% by 2026E driven by increasing economies of scale on JCAR drugs and lower 3 rd party royalty payments as a proportion of sales >$1.0bn in cumulative identified product R&D through the launch of JCARH125 in 2021E >$1.0bn in R&D investment for each unidentified pipeline product prior to launch $250 million in SG&A spend at peak company - wide revenues in 2029E Source: Celgene management Note: Royalty estimates are provided by Celgene management and based on preliminary and necessarily incomplete information, a nd are intentionally conservative. In addition, these estimates are derived from information that is confidential and protected by the attorney - client privilege and attorney work product doctrine Indications: DLBCL / CLL Launch year: 2019E (DLBCL) / 2023E (CLL) Launch pricing (US): $350k Probability of success: 100% Peak sales / year: $2.2bn / 2026E Indications: MM Launch year: 2021E Launch pricing (US): $450k Probability of success: 100% Peak sales / year: $2.8bn / 2029E JCARH125 JCAR017 All projections based on product - by - product build Market shares vary based on indication and penetration of CAR - T treatments 3 unidentified products with launch dates in 2025E, 2027E and 2029E Modeled out to 2034E, 2036E, 2038E, respectively, after which 2% – 3% terminal value growth rate per Celgene management 33% probability of success from launch date Unidentified Pipeline Upfront and royalty fees expected from licensing of intellectual property to third - parties IP Licensing 3
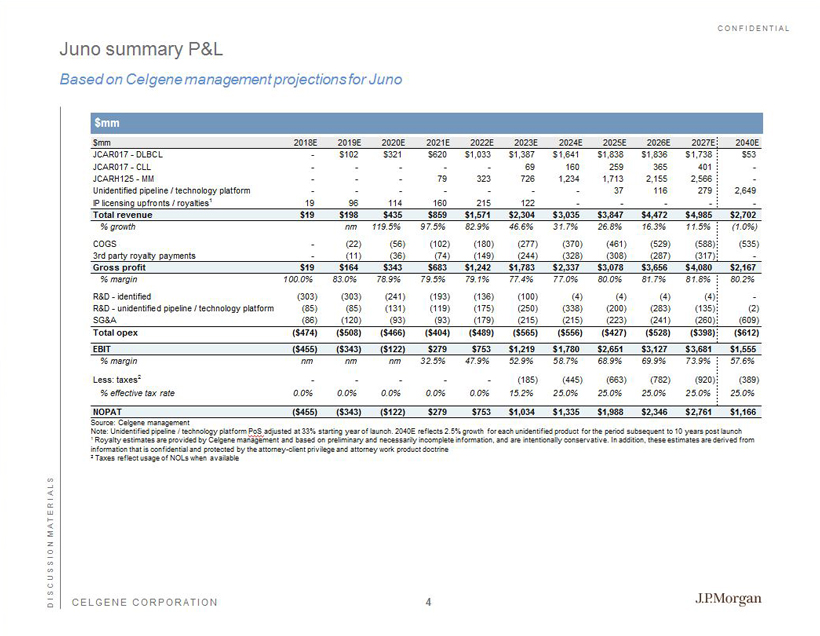
CONFIDENTIAL CELGENE CORPORATION Juno summary P&L Based on Celgene management projections for Juno DISCUSSION MATERIALS $mm 2018E 2019E 2020E 2021E 2022E 2023E 2024E 2025E 2026E 2027E 2040E JCAR017 - DLBCL - $102 $321 $620 $1,033 $1,387 $1,641 $1,838 $1,836 $1,738 $53 JCAR017 - CLL - - - - - 69 160 259 365 401 - JCARH125 - MM - - - 79 323 726 1,234 1,713 2,155 2,566 - Unidentified pipeline / technology platform - - - - - - - 37 116 279 2,649 IP licensing upfronts / royalties1 19 96 114 160 215 122 - - - - - Total revenue $19 $198 $435 $859 $1,571 $2,304 $3,035 $3,847 $4,472 $4,985 $2,702 % growth nm 119.5% 97.5% 82.9% 46.6% 31.7% 26.8% 16.3% 11.5% (1.0%) COGS - (22) (56) (102) (180) (277) (370) (461) (529) (588) (535) 3rd party royalty payments - (11) (36) (74) (149) (244) (328) (308) (287) (317) - Gross profit $19 $164 $343 $683 $1,242 $1,783 $2,337 $3,078 $3,656 $4,080 $2,167 % margin 100.0% 83.0% 78.9% 79.5% 79.1% 77.4% 77.0% 80.0% 81.7% 81.8% 80.2% R&D - identified (303) (303) (241) (193) (136) (100) (4) (4) (4) (4) - R&D - unidentified pipeline / technology platform (85) (85) (131) (119) (175) (250) (338) (200) (283) (135) (2) SG&A (86) (120) (93) (93) (179) (215) (215) (223) (241) (260) (609) Total opex ($474) ($508) ($466) ($404) ($489) ($565) ($556) ($427) ($528) ($398) ($612) EBIT ($455) ($343) ($122) $279 $753 $1,219 $1,780 $2,651 $3,127 $3,681 $1,555 % margin nm nm nm 32.5% 47.9% 52.9% 58.7% 68.9% 69.9% 73.9% 57.6% Less: taxes2 - - - - - (185) (445) (663) (782) (920) (389) % effective tax rate 0.0% 0.0% 0.0% 0.0% 0.0% 15.2% 25.0% 25.0% 25.0% 25.0% 25.0% NOPAT ($455) ($343) ($122) $279 $753 $1,034 $1,335 $1,988 $2,346 $2,761 $1,166 $mm Source: Celgene management Note: Unidentified pipeline / technology platform PoS adjusted at 33% starting year of launch. 2040E reflects 2.5% growth for each unidentified product for the period subsequent t o 10 years post launch 1 Royalty estimates are provided by Celgene management and based on preliminary and necessarily incomplete information, and are in tentionally conservative. In addition, these estimates are derived from information that is confidential and protected by the attorney - client privilege and attorney work product doctrine 2 Taxes reflect usage of NOLs when available 4
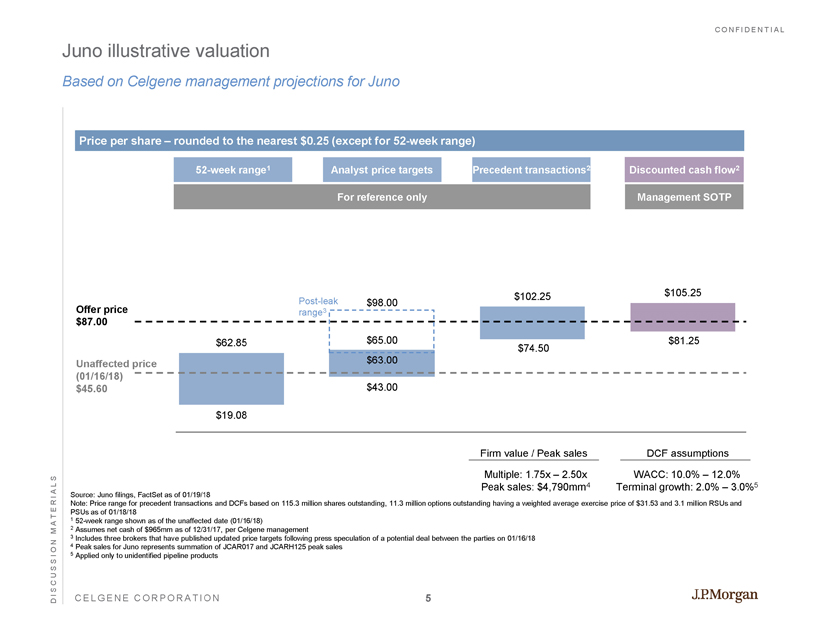
CONFIDENTIAL CELGENE CORPORATION DISCUSSION MATERIALS 52 - week range 1 Analyst price targets Discounted cash flow 2 Price per share – rounded to the nearest $0.25 (except for 52 - week range) Unaffected price (01/16/18) $45.60 Source: Juno filings, FactSet as of 01/19/18 Note: Price range for precedent transactions and DCFs based on 115.3 million shares outstanding, 11.3 million options outstan din g having a weighted average exercise price of $31.53 and 3.1 million RSUs and PSUs as of 01/18/18 1 52 - week range shown as of the unaffected date (01/16/18) 2 Assumes net cash of $965mm as of 12/31/17, per Celgene management 3 Includes three brokers that have published updated price targets following press speculation of a potential deal between the pa rties on 01/16/18 4 Peak sales for Juno represents summation of JCAR017 and JCARH125 peak sales 5 Applied only to unidentified pipeline products For reference only Implied equity value $mm) $2,268 – $7,826 $5,241 – $8,106 $9,348 – $12,941 $10,214 – $13,355 DCF assumptions WACC: 10.0% – 12.0% Terminal growth : 2.0% – 3.0% 5 Management SOTP Implied firm value ($mm) $1,222 – $6,780 3 $4,196 – $7,010 3 $8,383 – $11,975 4 $9,249 – $12,390 4 Firm value / Peak sales Multiple: 1.75x – 2.50x Peak sales : $4,790mm 4 Precedent transactions 2 $19.08 $43.00 $74.50 $81.25 $62.85 $65.00 $102.25 $105.25 Offer price $87.00 Juno illustrative valuation Based on Celgene management projections for Juno $63.00 $98.00 Post - leak range 3 5
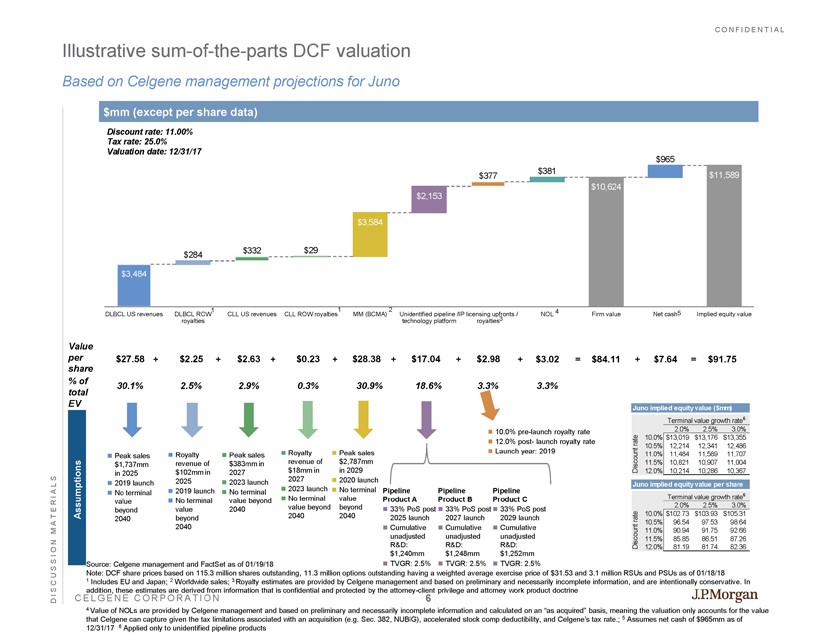
CONFIDENTIAL CELGENE CORPORATION $10,624 $11,589 $3,484 $284 $332 $29 $3,584 $2,153 $377 $381 $965 DLBCL US revenues DLBCL ROW royalties CLL US revenues CLL ROW royalties MM (BCMA) Unidentified pipeline / technology platform IP licensing upfronts / royalties NOL Firm value Net cash Implied equity value Illustrative sum - of - the - parts DCF valuation Based on Celgene management projections for Juno DISCUSSION MATERIALS Assumptions Value per share % of total EV + $27.58 30.1% Peak sales $1,737mm in 2025 2019 launch No terminal value beyond 2040 $91.75 $2.25 2.5% $28.38 30.9% Peak sales $383mm in 2027 2023 launch No terminal value beyond 2040 $2.98 3.3% $84.11 $7.64 $17.04 18.6% Peak sales $2,787mm in 2029 2020 launch No terminal value beyond 2040 Royalty revenue of $102mm in 2025 2019 launch No terminal value beyond 2040 Royalty revenue of $18mm in 2027 2023 launch No terminal value beyond 2040 Pipeline Product A 33% PoS post 2025 launch Cumulative unadjusted R&D: $1,240mm TVGR: 2.5% Pipeline Product C 33% PoS post 2029 launch Cumulative unadjusted R&D: $1,252mm TVGR: 2.5% Discount rate: 11.00% Tax rate: 25.0% Valuation date: 12/31/17 $mm (except per share data) $2.63 2.9% Juno implied equity value per share Terminal value growth rate 6 2.0% 2.5% 3.0% 10.0% $102.73 $103.93 $105.31 10.5% 96.54 97.53 98.64 11.0% 90.94 91.75 92.66 11.5% 85.85 86.51 87.26 12.0% 81.19 81.74 82.36 Discount rate $0.23 0.3% + Juno implied equity value ($mm) Terminal value growth rate 6 2.0% 2.5% 3.0% 10.0% $13,019 $13,176 $13,355 10.5% 12,214 12,341 12,486 11.0% 11,484 11,589 11,707 11.5% 10,821 10,907 11,004 12.0% 10,214 10,286 10,367 Discount rate + + + + + + = Source: Celgene management and FactSet as of 01/19/18 Note: DCF share prices based on 115.3 million shares outstanding, 11.3 million options outstanding having a weighted average exe rcise price of $31.53 and 3.1 million RSUs and PSUs as of 01/18/18 1 Includes EU and Japan; 2 Worldwide sales; 3 Royalty estimates are provided by Celgene management and based on preliminary and necessarily incomplete information, and are in tentionally conservative. In addition, these estimates are derived from information that is confidential and protected by the attorney - client privilege and a ttorney work product doctrine 4 Value of NOLs are provided by Celgene management and based on preliminary and necessarily incomplete information and calculat ed on an “as acquired” basis, meaning the valuation only accounts for the value that Celgene can capture given the tax limitations associated with an acquisition (e.g. Sec. 382, NUBIG), accelerated stock c omp deductibility, and Celgene’s tax rate.; 5 Assumes net cash of $965mm as of 12/31/17 6 Applied only to unidentified pipeline products 1 1 2 3 Pipeline Product B 33% PoS post 2027 launch Cumulative unadjusted R&D: $1,248mm TVGR: 2.5% $3.02 3.3% = 10.0% pre - launch royalty rate 12.0% post - launch royalty rate Launch year: 2019 4 5 6

CONFIDENTIAL CELGENE CORPORATION $4.57 $5.73 $3.87 $3.34 $12.19 ($5.79) ($5.51) ($0.55) ($4.78) ($5.85) ($3.89) ($3.37) ($10.00) ($7.23) ($8.82) ($9.56) Illustrative valuation sensitivities – for reference only Based on Celgene management projections for Juno DISCUSSION MATERIALS 80% PoS JCAR017 in DLBCL Management case: 100% Base case implied equity value per share: $91.75 Illustrative sensitivity scenarios Impact on implied equity value per share Sensitivities Product A does not receive FDA approval 1 80% PoS JCARH125 in BCMA Management case: 100% + / – 100 bps change in WACC Base case: 11.0% + / - 5% JCAR017 in DLBCL US peak market share Source: Celgene management 1 Assumes R&D expense is incurred prior to product failing to receive FDA approval 80% PoS JCAR017 in CLL Management case: 100% + / - 5% JCARH125 in BCMA US peak market share + / - $25,000 JCAR017 in DLBCL US pricing Base: $350,000 + / - $25,000 JCARH125 in BCMA US pricing Base: $450,000 Product B does not receive FDA approval 1 Product C does not receive FDA approval 1 7
CONFIDENTIAL CELGENE CORPORATION Page Agenda DISCUSSION MATERIALS Appendix 8
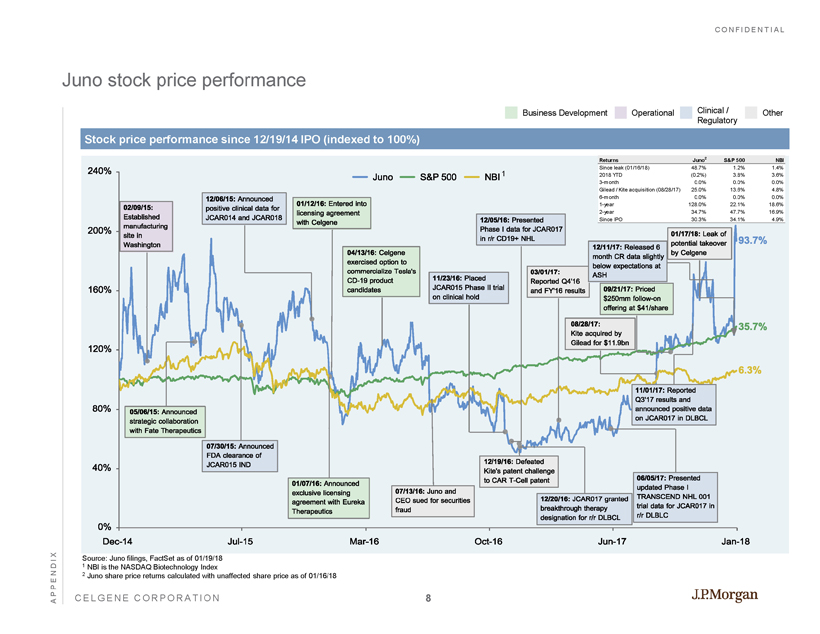
CONFIDENTIAL CELGENE CORPORATION Juno stock price performance APPENDIX Stock price performance since 12/19/14 IPO (indexed to 100%) Business Development Operational Clinical / Regulatory Other Dec-14 Jul-15 Mar-16 Oct-16 Jun-17 Jan-18 0% 40% 80% 120% 160% 200% 240% 11/23/16:Placed JCAR015PhaseIItrial onclinicalhold 12/05/16:Presented PhaseIdataforJCAR017 inr/rCD19+NHL 12/20/16:JCAR017granted breakthroughtherapy designationforr/rDLBCL 03/01/17: ReportedQ4'16 andFY'16results 06/05/17:Presented updatedPhaseI TRANSCENDNHL001 trialdataforJCAR017in r/rDLBLC 09/21/17:Priced $250mmfollow-on offeringat$41/share 08/28/17: Kiteacquiredby Gileadfor$11.9bn 05/06/15:Announced strategiccollaboration withFateTherapeutics 07/30/15:Announced FDAclearanceof JCAR015IND 12/06/15:Announced positiveclinicaldatafor JCAR014andJCAR018 01/07/16:Announced exclusivelicensing agreementwithEureka Therapeutics 02/09/15: Established manufacturing sitein Washington 12/19/16:Defeated Kite'spatentchallenge toCART-Cellpatent 01/12/16:Enteredinto licensingagreement withCelgene 04/13/16:Celgene exercisedoptionto commercializeTesla's CD-19product candidates 07/13/16:Junoand CEOsuedforsecurities fraud 11/01/17:Reported Q3'17resultsand announcedpositivedata onJCAR017inDLBCL 12/11/17:Released6 monthCRdataslightly belowexpectationsat ASH 01/17/18:Leakof potentialtakeover byCelgene 6.3% 35.7% 93.7% Juno S&P500 NBI Source: Juno filings, FactSet as of 01/19/18 1 NBI is the NASDAQ Biotechnology Index 2 Juno share price returns calculated with unaffected share price as of 01/16/18 1 Returns Juno 2 S&P 500 NBI Since leak (01/16/18) 48.7% 1.2% 1.4% 2018 YTD (0.2%) 3.8% 3.6% 3-month 0.0% 0.0% 0.0% Gilead / Kite acquisition (08/28/17) 25.0% 13.6% 4.8% 6-month 0.0% 0.0% 0.0% 1-year 128.0% 22.1% 18.6% 2-year 34.7% 47.7% 16.9% Since IPO 30.3% 34.1% 4.9% 8
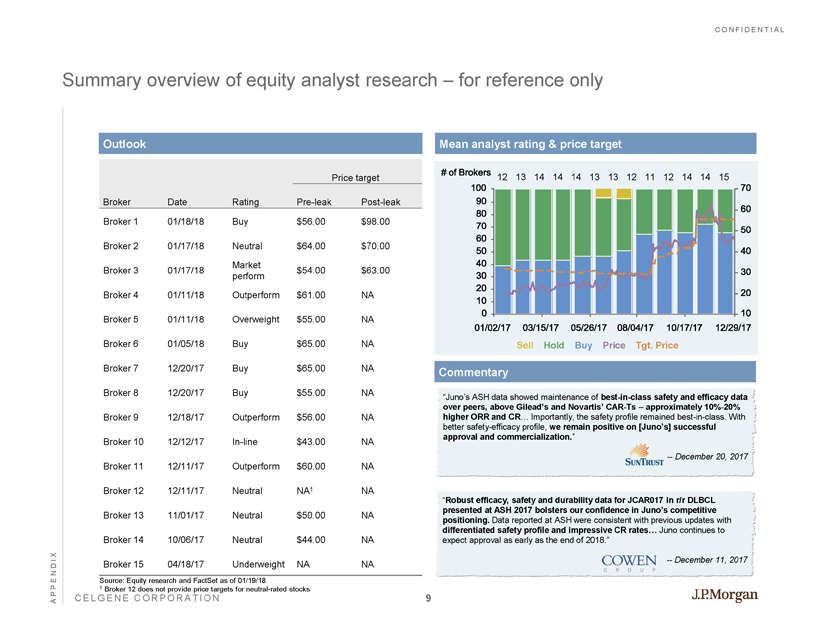
CONFIDENTIAL CELGENE CORPORATION Summary overview of equity analyst research – for reference only APPENDIX 2493438 - 001 Source: Equity research and FactSet as of 01/19/18 1 Broker 12 does not provide price targets for neutral - rated stocks Mean analyst rating & price target Commentary “Juno’s ASH data showed maintenance of best - in - class safety and efficacy data over peers, above Gilead’s and Novartis’ CAR - Ts – approximately 10% - 20% higher ORR and CR … Importantly, the safety profile remained best - in - class. With better safety - efficacy profile, we remain positive on [Juno’s] successful approval and commercialization. ” -- December 20, 2017 “ Robust efficacy, safety and durability data for JCAR017 in r/r DLBCL presented at ASH 2017 bolsters our confidence in Juno’s competitive positioning. Data reported at ASH were consistent with previous updates with differentiated safety profile and impressive CR rates… Juno continues to expect approval as early as the end of 2018.” -- December 11, 2017 01/02/17 03/15/17 05/26/17 08/04/17 10/17/17 12/29/17 0 10 20 30 40 50 60 70 80 90 100 10 20 30 40 50 60 70 #ofBrokers Sell Hold Buy Price Tgt. Price 12 15 14 14 12 11 12 13 13 14 14 14 13 Outlook Price target Broker Date Rating Pre - leak Post - leak Broker 1 01/18/18 Buy $56.00 $98.00 Broker 2 01/17/18 Neutral $64.00 $70.00 Broker 3 01/17/18 Market perform $54.00 $63.00 Broker 4 01/11/18 Outperform $61.00 NA Broker 5 01/11/18 Overweight $55.00 NA Broker 6 01/05/18 Buy $65.00 NA Broker 7 12/20/17 Buy $65.00 NA Broker 8 12/20/17 Buy $55.00 NA Broker 9 12/18/17 Outperform $56.00 NA Broker 10 12/12/17 In - line $43.00 NA Broker 11 12/11/17 Outperform $60.00 NA Broker 12 12/11/17 Neutral NA 1 NA Broker 13 11/01/17 Neutral $50.00 NA Broker 14 10/06/17 Neutral $44.00 NA Broker 15 04/18/17 Underweight NA NA 9
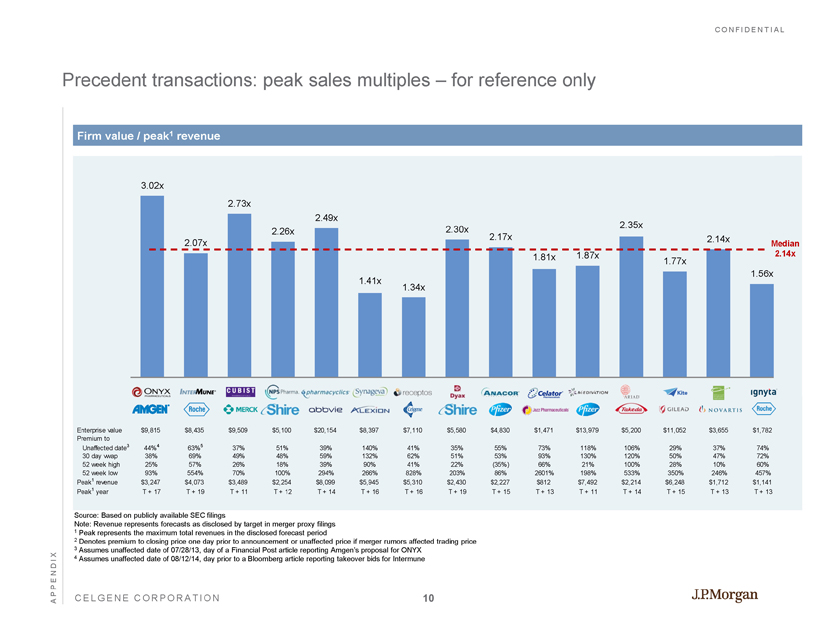
CONFIDENTIAL CELGENE CORPORATION Precedent transactions: peak sales multiples – for reference only APPENDIX Firm value / peak 1 revenue 3.02x 2.07x 2.73x 2.26x 2.49x 1.41x 1.34x 2.30x 2.17x 1.81x 1.87x 2.35x 1.77x 2.14x 1.56x Median 2.14x Source: Based on publicly available SEC filings Note: Revenue represents forecasts as disclosed by target in merger proxy filings 1 Peak represents the maximum total revenues in the disclosed forecast period 2 Denotes premium to closing price one day prior to announcement or unaffected price if merger rumors affected trading price 3 Assumes unaffected date of 07/28/13, day of a Financial Post article reporting Amgen’s proposal for ONYX 4 Assumes unaffected date of 08/12/14, day prior to a Bloomberg article reporting takeover bids for Intermune Enterprise value $9,815 $8,435 $9,509 $5,100 $20,154 $8,397 $7,110 $5,580 $4,830 $1,471 $13,979 $5,200 $11,052 $3,655 $1,782 Premium to Unaffected date 3 44% 4 63% 5 37% 51% 39% 140% 41% 35% 55% 73% 118% 106% 29% 37% 74% 30 day vwap 38% 69% 49% 48% 59% 132% 62% 51% 53% 93% 130% 120% 50% 47% 72% 52 week high 25% 57% 26% 18% 39% 90% 41% 22% (35%) 66% 21% 100% 28% 10% 60% 52 week low 93% 554% 70% 100% 294% 266% 828% 203% 86% 2601% 198% 533% 350% 246% 457% Peak 1 revenue $3,247 $4,073 $3,489 $2,254 $8,099 $5,945 $5,310 $2,430 $2,227 $812 $7,492 $2,214 $6,248 $1,712 $1,141 Peak 1 year T + 17 T + 19 T + 11 T + 12 T + 14 T + 16 T + 16 T + 19 T + 15 T + 13 T + 11 T + 14 T + 15 T + 13 T + 13 10
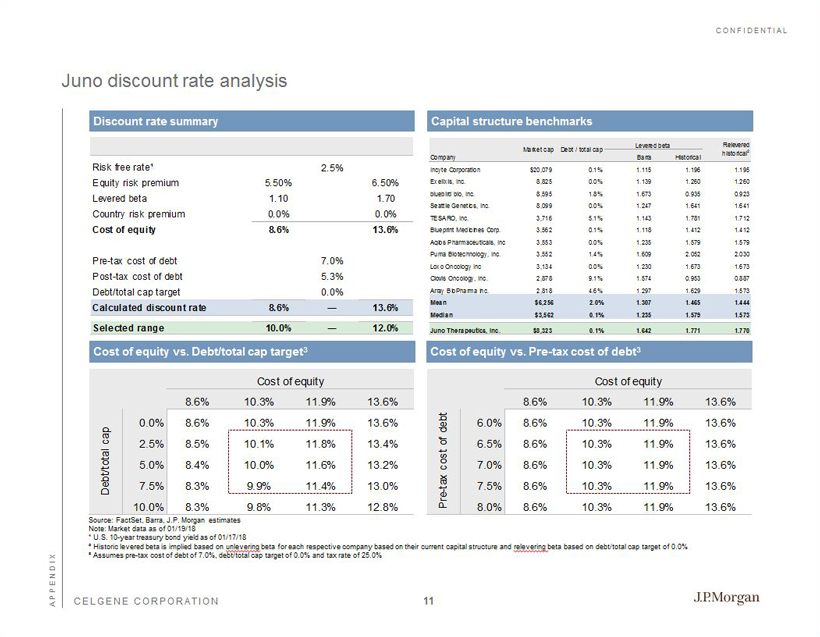
CONFIDENTIAL CELGENE CORPORATION Risk free rate¹ 2.5% Equity risk premium 5.50% 6.50% Levered beta 1.10 1.70 Country risk premium 0.0% 0.0% Cost of equity 8.6% 13.6% Pre-tax cost of debt 7.0% Post-tax cost of debt 5.3% Debt/total cap target 0.0% Calculated discount rate 8.6% ― 13.6% Selected range 10.0% ― 12.0% Juno discount rate analysis Discount rate summary Capital structure benchmarks Cost of equity vs. Debt/total cap target 3 Cost of equity vs. Pre - tax cost of debt 3 Source: FactSet, Barra, J.P. Morgan estimates Note: Market data as of 01/19/18 ¹ U.S. 10 - year treasury bond yield as of 01/17/18 ² Historic levered beta is implied based on unlevering beta for each respective company based on their current capital structure and relevering beta based on debt/total cap target of 0.0% ³ Assumes pre - tax cost of debt of 7.0%, debt/total cap target of 0.0% and tax rate of 25.0% Cost of equity Cost of equity 8.6% 10.3% 11.9% 13.6% 0.0% 8.6% 10.3% 11.9% 13.6% 2.5% 8.5% 10.1% 11.8% 13.4% 5.0% 8.4% 10.0% 11.6% 13.2% 7.5% 8.3% 9.9% 11.4% 13.0% 10.0% 8.3% 9.8% 11.3% 12.8% Debt/total cap Cost of equity 8.6% 10.3% 11.9% 13.6% 6.0% 8.6% 10.3% 11.9% 13.6% 6.5% 8.6% 10.3% 11.9% 13.6% 7.0% 8.6% 10.3% 11.9% 13.6% 7.5% 8.6% 10.3% 11.9% 13.6% 8.0% 8.6% 10.3% 11.9% 13.6% Pre-tax cost of debt APPENDIX Levered beta Company Barra Historical Incyte Corporation $20,079 0.1% 1.115 1.196 1.195 Exelixis, Inc. 8,825 0.0% 1.139 1.260 1.260 bluebird bio, Inc. 8,595 1.8% 1.673 0.935 0.923 Seattle Genetics, Inc. 8,099 0.0% 1.247 1.641 1.641 TESARO, Inc. 3,716 5.1% 1.143 1.781 1.712 Blueprint Medicines Corp. 3,562 0.1% 1.118 1.412 1.412 Agios Pharmaceuticals, Inc. 3,553 0.0% 1.235 1.579 1.579 Puma Biotechnology, Inc. 3,552 1.4% 1.609 2.052 2.030 Loxo Oncology Inc 3,134 0.0% 1.230 1.673 1.673 Clovis Oncology, Inc. 2,878 9.1% 1.574 0.953 0.887 Array BioPharma Inc. 2,818 4.6% 1.297 1.629 1.573 Mean $6,256 2.0% 1.307 1.465 1.444 Median $3,562 0.1% 1.235 1.579 1.573 Juno Therapeutics, Inc. $8,323 0.1% 1.642 1.771 1.770 Relevered historical 2 Market cap Debt / total cap Juno Therapeutics, Inc. 11