UNITED STATES
SECURITIES AND EXCHANGE COMMISSION
Washington, D.C. 20549
FORM N-CSR
CERTIFIED SHAREHOLDER REPORT OF REGISTERED
MANAGEMENT INVESTMENT COMPANIES
Investment Company Act file number 811-22926
Elkhorn ETF Trust
(Exact name of registrant as specified in charter)
207 Reber Street, Suite 201
Wheaton, IL 60187
(Address of principal executive offices) (Zip code)
Benjamin T. Fulton
Elkhorn ETF Trust
207 Reber Street, Suite 201
Wheaton, IL 60187
(Name and address of agent for service)
Copy to:
Morrison C. Warren, Esq.
Chapman and Cutler LLP
111 West Monroe Street
Chicago, IL 60603
Registrant's telephone number, including area code: (630) 355-4676
Date of fiscal year end: March 31
Date of reporting period: March 31, 2017
Form N-CSR is to be used by management investment companies to file reports with the Commission not later than 10 days after the transmission to stockholders of any report that is required to be transmitted to stockholders under Rule 30e-1 under the Investment Company Act of 1940 (17 CFR 270.30e-1). The Commission may use the information provided on Form N-CSR in its regulatory, disclosure review, inspection, and policymaking roles.
A registrant is required to disclose the information specified by Form N-CSR, and the Commission will make this information public. A registrant is not required to respond to the collection of information contained in Form N-CSR unless the Form displays a currently valid Office of Management and Budget ("OMB") control number. Please direct comments concerning the accuracy of the information collection burden estimate and any suggestions for reducing the burden to Secretary, Securities and Exchange Commission, 450 Fifth Street, NW, Washington, DC 20549-0609. The OMB has reviewed this collection of information under the clearance requirements of 44 U.S.C. § 3507.
Item 1. Reports to Stockholders.
The Report to Shareholders is attached herewith.
TABLE OF CONTENTS
| Letter to Shareholder. | 1 |
| Management’s Discussion of Fund Performance | 2 |
| Shareholder Expense Example. | 8 |
| Sector Allocations | 9 |
| Schedules of Investments | 10 |
| Elkhorn Commodity Rotation Strategy ETF | 10 |
| Elkhorn Fundamental Commodity Strategy ETF | 12 |
| Elkhorn S&P High Quality Preferred ETF | 14 |
| Statements of Assets and Liabilities | 16 |
| Statements of Operations | 17 |
| Statements of Changes in Net Assets | 18 |
| Financial Highlights | 19 |
| Notes to Financial Statements | 22 |
| Report of Independent Registered Public Accounting Firm | 29 |
| Trustees and Officers | 30 |
| Board Considerations Regarding Approval of Investment Management Agreement | 31 |
| Supplemental Information | 32 |
Letter to Shareholders (unaudited) |
Dear Shareholders,
Thank you very much for your continued support and investment in Elkhorn Exchange-Traded-Funds. Elkhorn is pleased to provide you with the annual report which contains detailed information about your investment, including a market overview and a performance analysis for the period.
At Elkhorn, we aim to be a leading independent investment solutions firm pioneering innovative research-based financial products in a wide array of investment structures. Elkhorn was honored to be named Most Innovative Issuer of 2016 by ETF.com. Elkhorn will continue to be a leader in the innovation of ETFs and other investment products and looks forward to bringing out more products in 2017 and beyond.
On behalf of Elkhorn and our partners, I thank you for our interest in Elkhorn and our innovative products. We appreciate your belief and trust in Elkhorn and our funds and look forward to serving you moving forward.
Sincerely,
Benjamin T. Fulton
Chief Executive Officer
1
Management’s Discussion of Fund Performance (unaudited) |
| Elkhorn Commodity Rotation Strategy ETF |
The Elkhorn Commodity Rotation Strategy ETF (the “Fund”) is a momentum-based, actively managed ETF that uses Dorsey Wright & Associates’ proprietary Relative Strength methodology to select the five commodities with the highest relative strength from a universe of 21 commodities, and adds a mix of short duration, highly liquid, high quality bonds. The portfolio is designed to be a tactical, momentum-based commodity strategy with a modified dynamic roll methodology.
Research shows that momentum investing captures an important and pervasive dimension of return. Momentum’s effect has also been shown to exist across a range of markets, time periods, and asset classes, including the commodity space.
During the reporting period, the ‘fund’ began life with its inception date of September 20, 2016. The Fund’s initial allocation called for an overweight allocation to the ‘softs’ sector, which had been a strong performer in prior periods, and two selections from the Metals sector. Fund performance suffered as the commodity market transitioned away from strength in the ‘softs’ sector, experiencing cumulative double-digit negative returns in Coffee and Sugar contracts. Mixed results were seen in the Metals sector. Overall, however, the Fund was able to close the performance gap with other broad commodity benchmarks as it benefited from avoiding allocations to an increasingly volatile Energy market, which experienced a reversal from the prior month’s positive results.
As 2016 entered its final month, uncertainty over OPEC production levels saw the Energy sector enjoying consistent increases. The Fund picked up on this renewed strength and increased allocations to the sector. By year end, the Fund had completed its move out of ‘softs’ and into a mix of two-thirds Base Metals, one-third Energy related.
This composition served the Fund well to start off 2017, with returns in January of 2.09% in Natural Gas, 1.19% in Copper, and 2.67% in Zinc contributing the bulk of the returns.
February brought a broad sell-off across the commodity space, Base Metals included, as resolution to on-going mining strikes looked more likely.
March saw a reversal back again with positive returns broadly seen; Base Metals once again led the way with returns of 4.22% in newly re-added Aluminum, 1.40% in Copper, and 2.34% in Zinc.
The Fund kept its mix of Fixed Income in highly liquid, high quality bonds, with maturities of no longer than six months. The adviser believes the risk/reward of going out further on the maturity curve is not warranted at this time.
The adviser believes the Fund has performed reasonably well in a period that witnessed a fair amount of back and forth price action from one month to another. The adviser believes the Fund could exhibit strong relative outperformance if leadership within the commodity space is demonstrated in the periods ahead.
Performance as of 3/31/2017
| | Average Annual Total Return |
| | Fund NAV | Fund
Market Value | Elkhorn Dorsey
Wright Commodity Rotation Index | S&P GSCI
Index |
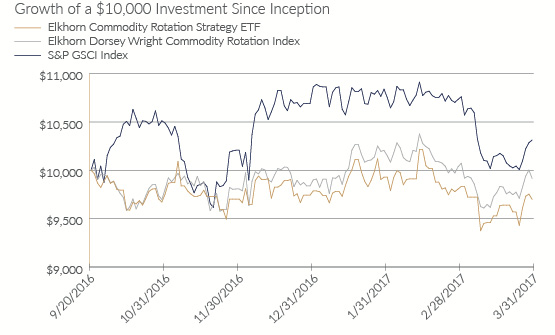
| Since Inception* | (1.91)% | (2.77)% | (0.31)% | 4.52% |
| * | Commenced operations on 9/20/2016 |
The Elkhorn Dorsey Wright Commodity Rotation Index tracks a proprietary model of commodity futures that is developed, maintained and sponsored by Dorsey Wright & Associates. The S&P GSCI Index comprises the principal physical commodities of active, liquid futures markets and is recognized as a leading measure of general price movements and inflation in the world economy. S&P® is a registered trademark of Standard & Poor’s Financial Services LLC (S&P).
An index is a statistical measure of a specified financial market or sector. An index does not actually hold a portfolio of securities therefore does not incur expenses incurred by the Fund. The index returns do not reflect deductions for fees or expenses. In comparison, the Fund’s performance is negatively impacted by these fees and expenses. One cannot invest directly in an index.
Total returns for less than a period of one year are not annualized.
Performance data quoted represents past performance, which is not a guarantee of future results. Investment returns and principal value will fluctuate, and shares, when redeemed, may be worth more or less than their original cost.
Current performance may be higher or lower than performance data quoted. For the most current month-end performance data please visit www.elkhorn.com or call (630) 355-4676.
2
Management’s Discussion of Fund Performance (unaudited) |
| Elkhorn Commodity Rotation Strategy ETF, continued |
The net asset value or ‘‘NAV’’ is calculated by dividing the net assets by the number of shares outstanding. The price used to calculate the market price returns is determined by using the midpoint bid/ask of the closing price listed on the primary stock exchange on which shares of the Fund are listed for trading and does not represent returns an investor would receive if shares were traded at other times.
The returns for the Fund reflect the reinvestment of dividends and capital gains, if any, and are reported after the deduction of all expenses. These returns do not, however, reflect the deduction of taxes that a shareholder would pay on Fund distributions or upon redemption of Fund shares. Market returns do not reflect brokerage commissions that may be payable on secondary market transactions.
Hypothetical growth of a $10,000 Investment
For the period 9/20/2016 (commencement of operations) to 3/31/2017
3
Management’s Discussion of Fund Performance (unaudited) |
| Elkhorn Fundamental Commodity Strategy ETF |
The Elkhorn Fundamental Commodity Strategy ETF (the “Fund”) is a fundamental factor-weighted, broad-market commodity fund with a diversified approach to investing in liquid commodities. It has exposure to 24 GSCI commodity components. By broadening the opportunity set and dynamically selecting from liquid, longer-maturity contracts, the strategy seeks to avoid unnecessary turnover and lowers overall portfolio volatility.
The strategy focuses on systematic sources of return by allocating to commodities with positive roll yield and momentum—primary drivers of excess returns in commodity investing.
During the reporting period, the ‘fund’ began life with its inception date of September 20, 2016. The environment during the first half of the period was marked by strong Energy markets as uncertainty around OPEC production levels dictated higher prices. With relatively 20% less allocated to this space, the Fund underperformed “production-weighted” commodity indices. However, the application of the strategy’s ‘Momentum’ and ‘Roll Yield’ methodology helped the Fund lesson this performance gap, and also outpace its benchmark Base Portfolio, which allocates equally to Energy, Agriculture, and Metals. The back half of the reporting period witnessed a partial reversal across the broad energy sector. Here the Fund benefited on a relative basis through both a smaller allocation, and its ‘Dynamic Roll’ contract selection process as it invested in contracts further out the maturity curve. As an example; the first quarter of 2017 saw returns of (3.76%) in the May, 2017 WTI Crude Oil contract, compared (1.94%) in the June 2018 WTI Crude Oil contract. (source; Bloomberg).
Within the agricultural space, mixed results were seen in the grain markets for the period, and generally strong results in the Livestock sub-sector. Weak results were found within ‘Softs’, particularly within Cocoa and Sugar contracts. Here again the Fund benefited through its contract selection process, going further out on the maturity curve. For the reporting period, May, 2017 Sugar performance was (24.27%) compared with July, 2018 Sugar (8.10%). (Source; Bloomberg)
Base Metals performed well as enthusiasm for increased ‘infrastructure’ spending, along with ongoing mining ‘labor strikes’, drove prices higher. The Fund benefited through its relatively large factor-driven allocation to the sector, approximately twice that of the “production-weighted” indices, with Copper being one of the Fund’s largest single holdings.
The Fund kept its mix of Fixed Income in highly liquid, high quality bonds, with maturities of no longer than six months (>95% US Treasury Bills). The adviser believes the risk/reward of going out further on the maturity curve is not warranted at this time.
Overall, on a relative basis the Fund experienced underperformance from the Energy sector, matched other broad-market commodity funds within the Agricultural sector, and enjoyed outperformance from the Metals sector, Base Metals in particular.
The adviser believes the Fund delivered good performance at favorable volatility levels during the period, and benefited from both Factor Returns (Roll Yield & Momentum) and Contract Selection.
Performance as of 3/31/2017
| | Average Annual Total Return |
| | Fund NAV | Fund
Market Value | Dow Jones RAFI Commodity
Total Return Index | Bloomberg Commodity
Index TR |
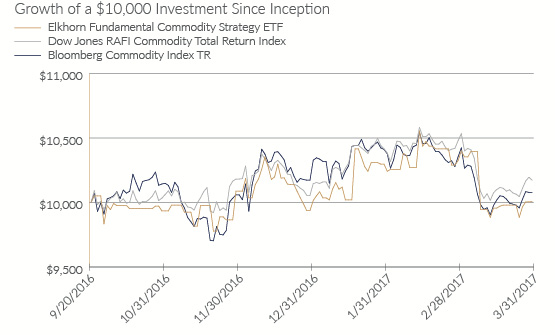
| Since Inception* | 0.94% | 0.44% | 1.90% | 1.53% |
| * | Commenced operations on 9/20/2016 |
The Dow Jones RAFI Commodity Index is jointly compiled by S&P Dow Jones Indices and Research Affiliates (“RAFI”), is a version of the Dow Jones Commodity Index, a broad-market commodity index with equally weighted sectors and liquidity weighted commodities. The Bloomberg Commodity Index is a broadly diversified index that allows investors to track commodity futures through a single, simple measure.
An index is a statistical measure of a specified financial market or sector. An index does not actually hold a portfolio of securities therefore does not incur expenses incurred by the Fund. The index returns do not reflect deductions for fees or expenses. In comparison, the Fund’s performance is negatively impacted by these fees and expenses. One cannot invest directly in an index.
Total returns for less than a period of one year are not annualized.
Performance data quoted represents past performance, which is not a guarantee of future results. Investment returns and principal value will fluctuate, and shares, when redeemed, may be worth more or less than their original cost.
4
Management’s Discussion of Fund Performance (unaudited) |
| Elkhorn Fundamental Commodity Strategy ETF, continued |
Current performance may be higher or lower than performance data quoted. For the most current month-end performance data please visit www.elkhorn.com or call (630) 355-4676.
The net asset value or ‘‘NAV’’ is calculated by dividing the net assets by the number of shares outstanding. The price used to calculate the market price returns is determined by using the midpoint bid/ask of the closing price listed on the primary stock exchange on which shares of the Fund are listed for trading and does not represent returns an investor would receive if shares were traded at other times.
The returns for the Fund reflect the reinvestment of dividends and capital gains, if any, and are reported after the deduction of all expenses. These returns do not, however, reflect the deduction of taxes that a shareholder would pay on Fund distributions or upon redemption of Fund shares. Market returns do not reflect brokerage commissions that may be payable on secondary market transactions.
Hypothetical growth of a $10,000 Investment
For the period 9/20/2016 (commencement of operations) to 3/31/2017
5
Management’s Discussion of Fund Performance (unaudited) |
| Elkhorn S&P High Quality Preferred ETF |
The Elkhorn S&P High Quality Preferred ETF (EPRF) is based on the S&P U.S. High Quality Preferred Stock Index, which selects fixed-rate investment grade preferred issues (BBB- or higher) from U.S. listed preferred stocks and maintains an allocation of 75% to cumulative preferreds.
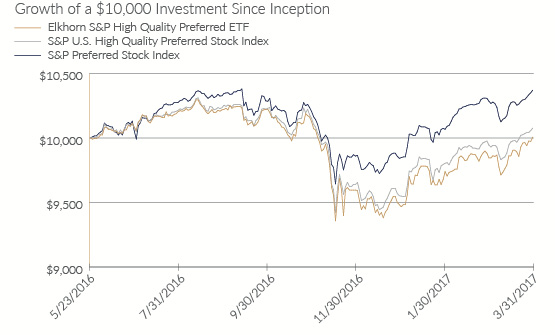
Since inception, EPRF has underperformed the broader preferred market, as junk has outperformed investment grade in both the preferred stock and broader fixed income space.
Since the day EPRF was listed on the BATs Exchange (05/24/2016) through the quarter ended 03/31/2017, the fund’s NAV returned 0.19%. The S&P U.S. Preferred Stock Index, which includes significant exposure to below investment grade preferreds, returned 3.94%.
Following the turn of the calendar, investment grade kept pace with the broader preferred market as EPRF’s NAV returned 5.29% relative to the S&P U.S. Preferred Stock Index’s 5.27% return (01/01/2017 – 03/31/2017).
Performance as of 3/31/2017
| | Average Annual Total Return |
| | Fund NAV | Fund
Market Value | S&P U.S. High Quality Preferred Stock Index | S&P U.S. Preferred Stock Index |
| Since Inception* | 0.18% | (0.10)% | 0.85% | 3.94% |
| * | Commenced operations on 5/23/2016 |
The S&P U.S. High Quality Preferred Index is designed to provide exposure to U.S.-listed preferred stocks that meet a minimum size, liquidity, type of issuance, and quality criteria. The S&P U.S. Preferred Stock Index represents the U.S. preferred stock market.
An index is a statistical measure of a specified financial market or sector. An index does not actually hold a portfolio of securities therefore does not incur expenses incurred by the Fund. The index returns do not reflect deductions for fees or expenses. In comparison, the Fund’s performance is negatively impacted by these fees and expenses. One cannot invest directly in an index.
Total returns for less than a period of one year are not annualized.
Performance data quoted represents past performance, which is not a guarantee of future results. Investment returns and principal value will fluctuate, and shares, when redeemed, may be worth more or less than their original cost.
Current performance may be higher or lower than performance data quoted. For the most current month-end performance data please visit www.elkhorn.com or call (630) 355-4676.
The net asset value or ‘‘NAV’’ is calculated by dividing the net assets by the number of shares outstanding. The price used to calculate the market price returns is determined by using the midpoint bid/ask of the closing price listed on the primary stock exchange on which shares of the Fund are listed for trading and does not represent returns an investor would receive if shares were traded at other times.
6
Management’s Discussion of Fund Performance (unaudited) |
| Elkhorn S&P High Quality Preferred ETF, continued |
The returns for the Fund reflect the reinvestment of dividends and capital gains, if any, and are reported after the deduction of all expenses. These returns do not, however, reflect the deduction of taxes that a shareholder would pay on Fund distributions or upon redemption of Fund shares. Market returns do not reflect brokerage commissions that may be payable on secondary market transactions.
Hypothetical growth of a $10,000 Investment
For the period 5/23/2016 (commencement of operations) to 3/31/2017
7
| Shareholder Expense Example |
| March 31, 2017 (unaudited) |
As a shareholder of the Fund you incur two types of costs: (1) transaction costs for purchasing and selling shares; and (2) ongoing costs, including management fees and other fund expenses. The following examples are intended to help you understand your ongoing costs (in dollars and cents) of investing in the Fund and to compare these costs with the ongoing costs of investing in other funds.
The expense examples are based on an investment of $1,000 invested at the beginning of the period and held for the entire period (October 1, 2016 through March 31, 2017).
ACTUAL EXPENSES
The first line under the Fund in the table below provides information about actual account values and actual expenses. You may use the information in this line, together with the amount you invested, to estimate the expenses that you paid over the period. Simply divide your account value by $1,000 (for example, an $8,600 account value divided by $1,000 = 8.6), then multiply the result by the number in the first line for the Fund under the heading entitled “Expenses Paid During Period” to estimate the expenses you paid on your account during this period.
HYPOTHETICAL EXAMPLE FOR COMPARISON PURPOSES
The second line under the Fund in the table provides information about hypothetical account values and hypothetical expenses based on the Fund’s actual expense ratio and an assumed rate of return of 5% per year before expenses, which is not the Fund’s actual return. The hypothetical account values and expenses may not be used to estimate the actual ending account balance or expenses you paid for the period. You may use this information to compare the ongoing costs of investing in the Fund and other funds. To do so, compare this 5% hypothetical example with the 5% hypothetical examples that appear in the shareholder reports of the other funds. Please note that the expenses shown in the table are meant to highlight your ongoing costs only and do not reflect any transactional costs, such as brokerage commissions paid on purchases and sales of Fund shares. Therefore, the second line under the Fund in the table is useful in comparing ongoing Fund costs only and will not help you determine the relative total costs of owning different funds. In addition, if these transactional costs were included, your costs would have been higher.
| | Beginning
Account Value
10/1/2016 | Ending
Account Value
3/31/2017 | Annualized
Expense Ratio
for the Period | Expenses Paid
During Period
10/1/2016 – 3/31/20171 |
| Elkhorn Commodity Rotation Strategy ETF | | | | |
| Actual | $ 1,000.00 | $ 988.20 | 0.99% | $ 4.91 |
| Hypothetical (5% return before expenses) | $ 1,000.00 | $ 1,020.00 | 0.99% | $ 4.99 |
| Elkhorn Fundamental Commodity Strategy ETF | | | | |
| Actual | $ 1,000.00 | $ 1,003.50 | 0.75% | $ 3.75 |
| Hypothetical (5% return before expenses) | $ 1,000.00 | $ 1,021.19 | 0.75% | $ 3.78 |
| Elkhorn S&P High Quality Preferred ETF | | | | |
| Actual | $ 1,000.00 | $ 988.10 | 0.47% | $ 2.33 |
| Hypothetical (5% return before expenses) | $ 1,000.00 | $ 1,022.59 | 0.47% | $ 2.37 |
1 | Expenses are equal to the Fund’s annualized expense ratio, multiplied by the average account value over the period, multiplied by182/365 (to reflect the one-half year period). |
8
| Sector Allocations |
| March 31, 2017 (unaudited) |
| Elkhorn Commodity Rotation Strategy ETF |
| Sector | % of Total
Investments |
| Communications | 11.8% |
| Consumer Non-cyclical | 11.8 |
| Government | 52.8 |
| Industrial | 11.8 |
| Utilities | 11.8 |
| Total Investments | 100.0% |
| Elkhorn Commodity Rotation Strategy ETF |
| Commodity Sector | % of Value at
March 31, 2017 |
| Base Metals | 61.4% |
| Energy | 38.6 |
| Total Investments | 100.0% |
| Elkhorn Fundamental Commodity Strategy ETF |
| Sector | % of Total
Investments |
| Consumer Staples | 3.8% |
| Government | 93.7 |
| Industrial | 2.5 |
| Total Investments | 100.0% |
| Elkhorn Fundamental Commodity Strategy ETF |
| Commodity Sector | % of Value at
March 31, 2017 |
| Agriculture | 26.8% |
| Base Metals | 22.5 |
| Energy | 41.6 |
| Precious Metals | 9.1 |
| Total Investments | 100.0% |
| Elkhorn S&P High Quality Preferred ETF |
| Sector | % of Total
Investments* |
| Consumer Discretionary | 1.9% |
| Financials | 64.4 |
| Industrials | 5.8 |
| Real Estate | 18.0 |
| Telecommunication Services | 1.9 |
| Utilities | 8.0 |
| Total Investments | 100.0% |
| * | Excluding Money Market Fund |
9
| Elkhorn Commodity Rotation Strategy ETF |
| Consolidated Schedule of Investments |
| March 31, 2017 |
| Investments | | Principal | | | Value | |
| TREASURY BILL—36.7%(a) | | | | | | |
| U.S. Treasury Bill, 0.42%, 06/22/2017 | | $ | 900,000 | | | $ | 898,505 | |
Total Treasury Bill (Cost $899,159) | | | | | | | 898,505 | |
| | | | | | | | | |
CORPORATE BONDS—32.7% | | | | | | | | |
Aerospace/Defense—8.2% | | | | | | | | |
| United Technologies Corp., 1.8%, 6/1/2017 | | | 200,000 | | | | 200,200 | |
| | | | | | | | | |
Electric—8.2% | | | | | | | | |
| Georgia Power Co., Series B, 5.7%, 6/1/2017 | | | 200,000 | | | | 201,306 | |
| | | | | | | | | |
Media—8.2% | | | | | | | | |
| Comcast Cable Communications LLC, 8.88%, 5/1/2017 | | | 200,000 | | | | 201,092 | |
| | | | | | | | | |
Pharmaceutical—8.1% | | | | | | | | |
| Pfizer, Inc., 1.1%, 5/15/2017 | | | 200,000 | | | | 199,957 | |
| | | | | | | | | |
Total Corporate Bonds (Cost $803,350) | | | | | | | 802,555 | |
| | | | | | | | | |
Total Investments—69.4% (Cost $1,702,509) | | | | | | | 1,701,060 | |
| | | | | | | | | |
| Other Assets in Excess of Liabilities—30.6% | | | | 751,204 | |
| Net Assets—100.0% | | | | | | $ | 2,452,264 | |
| (a) | Represents a zero coupon bond. Rate shown reflects the effective yield. |
| Futures contracts outstanding as of March 31, 2017: | |
| Description | Expiration
Date | Contract
Type | | Number of Contracts | | | Value at
Trade Date | | | Value at
March 31,
2017 | | | Unrealized
Appreciation | | | Unrealized (Depreciation) | |
| COPPER Future | 12/27/2018 | Long | | | 1 | | | $ | 70,125 | | | $ | 68,250 | | | $ | — | | | $ | (1,875 | ) |
| Gasoline RBOB Future | 8/31/2017 | Long | | | 7 | | | | 499,225 | | | | 483,895 | | | | — | | | | (15,330 | ) |
| LME Copper Future | 12/17/2018 | Long | | | 15 | | | | 2,179,100 | | | | 2,201,906 | | | | 22,806 | | | | — | |
| LME Copper Future | 12/17/2018 | Short | | | (12 | ) | | | (1,769,232 | ) | | | (1,761,525 | ) | | | 7,707 | | | | — | |
| LME PRI Alum Future | 4/13/2017 | Long | | | 35 | | | | 1,497,625 | | | | 1,710,406 | | | | 212,781 | | | | — | |
| LME PRI Alum Future | 4/13/2017 | Short | | | (35 | ) | | | (1,510,469 | ) | | | (1,710,406 | ) | | | — | | | | (199,937 | ) |
| LME PRI Alum Future | 9/18/2017 | Long | | | 21 | | | | 990,807 | | | | 1,033,856 | | | | 43,049 | | | | — | |
| LME PRI Alum Future | 9/18/2017 | Short | | | (21 | ) | | | (990,031 | ) | | | (1,033,856 | ) | | | — | | | | (43,825 | ) |
| LME PRI Alum Future | 12/18/2017 | Long | | | 26 | | | | 1,229,937 | | | | 1,282,775 | | | | 52,838 | | | | — | |
| LME PRI Alum Future | 12/18/2017 | Short | | | (15 | ) | | | (729,875 | ) | | | (740,063 | ) | | | — | | | | (10,188 | ) |
| LME Zinc Future | 4/13/2017 | Long | | | 38 | | | | 2,426,624 | | | | 2,618,438 | | | | 191,814 | | | | — | |
| LME Zinc Future | 4/13/2017 | Short | | | (38 | ) | | | (2,677,969 | ) | | | (2,618,438 | ) | | | 59,531 | | | | — | |
| LME Zinc Future | 7/17/2017 | Long | | | 22 | | | | 1,576,981 | | | | 1,525,975 | | | | — | | | | (51,006 | ) |
| LME Zinc Future | 7/17/2017 | Short | | | (15 | ) | | | (1,053,837 | ) | | | (1,040,438 | ) | | | 13,399 | | | | — | |
| NY Harb ULSD Future | 11/30/2017 | Long | | | 7 | | | | 501,935 | | | | 480,808 | | | | — | | | | (21,127 | ) |
| | | | | | | | �� | | | | | $ | 2,501,583 | | | $ | 603,925 | | | $ | (343,288 | ) |
| Total unrealized appreciation (depreciation) | | | $ | 260,637 | | | | | |
Cash posted as collateral to broker for futures contracts was $278,279 at March 31, 2017.
The accompanying notes are an integral part of these financial statements.
10
| Elkhorn Commodity Rotation Strategy ETF |
| Consolidated Schedule of Investments, continued |
| March 31, 2017 |
The following table summarizes valuation of the Fund’s investments under the fair value hierarchy levels as of March 31, 2017:
| | | Level 1 | | | Level 2 | | | Level 3 | | | Total | |
| Asset Valuation Inputs | | | | | | | | | | | | |
| Investments in Securities | | | | | | | | | | | | |
| Treasury Bill | | $ | 898,505 | | | $ | — | | | $ | — | | | $ | 898,505 | |
| Corporate Bonds | | | — | | | | 802,555 | | | | — | | | | 802,555 | |
| Other Investments | | | | | | | | | | | | | | | | |
| Futures | | | 603,925 | | | | — | | | | — | | | | 603,925 | |
| Total Investment in Securities | | $ | 1,502,430 | | | $ | 802,555 | | | $ | — | | | $ | 2,304,985 | |
| Liability Valuation Inputs | | | | | | | | | | | | | | | | |
| Other Investments | | | | | | | | | | | | | | | | |
| Futures | | $ | 343,288 | | | $ | — | | | $ | — | | | $ | 343,288 | |
| Total Other Investments | | $ | 343,288 | | | $ | — | | | $ | — | | | $ | 343,288 | |
For the period ended March 31, 2017, there were no transfers between any levels. As of March 31, 2017 there were no Level 3 investments held in the Fund.
The accompanying notes are an integral part of these financial statements.
11
| Elkhorn Fundamental Commodity Strategy ETF |
Consolidated Schedule of Investments |
| March 31, 2017 |
| Investments | | Principal | | | Value | |
| TREASURY BILLS—84.7%(a) | | | | | | |
| U.S. Treasury Bill, 0.42%, 06/22/2017 | | $ | 1,000,000 | | | $ | 998,339 | |
| U.S. Treasury Bill, 0.50%, 07/20/2017 | | | 2,000,000 | | | | 1,995,394 | |
| U.S. Treasury Bill, 0.52%, 08/10/2017 | | | 1,000,000 | | | | 997,187 | |
| U.S. Treasury Bill, 0.54%, 08/17/2017 | | | 2,700,000 | | | | 2,692,024 | |
| U.S. Treasury Bill, 0.76%, 08/31/2017 | | | 800,000 | | | | 797,205 | |
Total Treasury Bills (Cost $7,485,864) | | | | | | | 7,480,149 | |
| | | | | | | | | |
CORPORATE BONDS—5.7% | | | | | | | | |
Miscellaneous Manufacturing—2.3% | | | | | | | | |
| 3M Co., 1.0%, 6/26/2017 | | | 200,000 | | | | 200,007 | |
| | | | | | | | | |
Retail—3.4% | | | | | | | | |
| Wal-Mart Stores, Inc., 5.38%, 4/5/2017 | | | 305,000 | | | | 305,000 | |
| | | | | | | | | |
Total Corporate Bonds (Cost $505,284) | | | | | | | 505,007 | |
| | | | | | | | | |
Total Investments—90.4% (Cost $7,991,148) | | | | | | | 7,985,156 | |
| | | | | | | | | |
| Other Assets in Excess of Liabilities—9.6% | | | | 847,512 | |
| Net Assets—100.0% | | | | | | $ | 8,832,668 | |
| (a) | Represents a zero coupon bond. Rate shown reflects the effective yield. |
| Futures contracts outstanding as of March 31, 2017: | |
| Description | Expiration
Date | Contract
Type | | Number of Contracts | | | Value at
Trade Date | | | Value at
March 31,
2017 | | | Unrealized
Appreciation | | | Unrealized (Depreciation) | |
| Brent Crude Future | 10/31/2018 | Long | | | 24 | | | $ | 1,312,229 | | | $ | 1,284,480 | | | $ | — | | | $ | (27,749 | ) |
| Cattle Feeder Future | 11/16/2017 | Long | | | 1 | | | | 60,775 | | | | 64,988 | | | | 4,213 | | | | — | |
| Cocoa Future | 5/15/2017 | Long | | | 1 | | | | 20,960 | | | | 20,950 | | | | — | | | | (10 | ) |
| Coffee 'C' Future | 3/19/2018 | Long | | | 2 | | | | 119,475 | | | | 112,875 | | | | — | | | | (6,600 | ) |
| Corn Future | 12/14/2017 | Long | | | 15 | | | | 286,826 | | | | 291,187 | | | | 4,361 | | | | — | |
| Cotton No.2 Future | 12/6/2017 | Long | | | 3 | | | | 103,071 | | | | 111,135 | | | | 8,064 | | | | — | |
| Gasoline RBOB Future | 9/29/2017 | Long | | | 4 | | | | 242,628 | | | | 254,755 | | | | 12,127 | | | | — | |
| Gold 100 Oz Future | 12/27/2017 | Long | | | 5 | | | | 623,210 | | | | 630,500 | | | | 7,290 | | | | — | |
| KC HRW Wheat Future | 3/14/2018 | Long | | | 1 | | | | 25,775 | | | | 24,463 | | | | — | | | | (1,312 | ) |
| Lean Hogs Future | 10/13/2017 | Long | | | 3 | | | | 78,355 | | | | 77,730 | | | | — | | | | (625 | ) |
| Live Cattle Future | 6/30/2017 | Long | | | 6 | | | | 240,042 | | | | 266,100 | | | | 26,058 | | | | — | |
| LME Copper Future | 12/18/2017 | Long | | | 10 | | | | 1,208,812 | | | | 1,465,563 | | | | 256,751 | | | | — | |
| LME Copper Future | 12/18/2017 | Short | | | 10 | | | | (1,245,232 | ) | | | (1,465,563 | ) | | | — | | | | (220,331 | ) |
| LME Copper Future | 12/17/2018 | Long | | | 16 | | | | 2,174,006 | | | | 2,348,700 | | | | 174,694 | | | | — | |
| LME Copper Future | 12/17/2018 | Short | | | 9 | | | | (1,316,113 | ) | | | (1,321,144 | ) | | | — | | | | (5,031 | ) |
| LME Lead Future | 5/15/2017 | Long | | | 4 | | | | 230,594 | | | | 233,750 | | | | 3,156 | | | | — | |
| LME Lead Future | 5/15/2017 | Short | | | 4 | | | | (226,225 | ) | | | (233,750 | ) | | | — | | | | (7,525 | ) |
| LME Lead Future | 12/18/2017 | Long | | | 6 | | | | 320,469 | | | | 352,538 | | | | 32,069 | | | | — | |
| LME Lead Future | 12/18/2017 | Short | | | 4 | | | | (225,194 | ) | | | (235,025 | ) | | | — | | | | (9,831 | ) |
| LME Nickel Future | 6/19/2017 | Long | | | 4 | | | | 249,601 | | | | 240,432 | | | | — | | | | (9,169 | ) |
| LME Nickel Future | 6/19/2017 | Short | | | 4 | | | | (251,426 | ) | | | (240,432 | ) | | | 10,994 | | | | — | |
| LME Nickel Future | 12/17/2018 | Long | | | 5 | | | | 329,503 | | | | 310,275 | | | | — | | | | (19,228 | ) |
| LME Nickel Future | 12/17/2018 | Short | | | 2 | | | | (132,288 | ) | | | (124,110 | ) | | | 8,178 | | | | — | |
| LME PRI Alum Future | 4/13/2017 | Long | | | 14 | | | | 601,275 | | | | 684,163 | | | | 82,888 | | | | — | |
| LME PRI Alum Future | 4/13/2017 | Short | | | 14 | | | | (630,484 | ) | | | (684,163 | ) | | | — | | | | (53,679 | ) |
| LME PRI Alum Future | 1/15/2018 | Long | | | 15 | | | | 700,919 | | | | 740,250 | | | | 39,331 | | | | — | |
| LME PRI Alum Future | 1/15/2018 | Short | | | 8 | | | | (381,488 | ) | | | (394,800 | ) | | | — | | | | (13,312 | ) |
| LME Zinc Future | 12/18/2017 | Long | | | 9 | | | | 555,575 | | | | 624,825 | | | | 69,250 | | | | — | |
| LME Zinc Future | 12/18/2017 | Short | | | 9 | | | | (623,169 | ) | | | (624,825 | ) | | | — | | | | (1,656 | ) |
| LME Zinc Future | 12/17/2018 | Long | | | 8 | | | | 531,300 | | | | 540,200 | | | | 8,900 | | | | — | |
| LME Zinc Future | 12/17/2018 | Short | | | 3 | | | | (200,863 | ) | | | (202,575 | ) | | | — | | | | (1,712 | ) |
| Low Su Gasoil G Future | 6/12/2018 | Long | | | 6 | | | | 306,250 | | | | 291,150 | | | | — | | | | (15,100 | ) |
| Natural Gas Future | 3/27/2018 | Long | | | 17 | | | | 484,450 | | | | 489,260 | | | | 4,810 | | | | — | |
The accompanying notes are an integral part of these financial statements.
12
| Elkhorn Fundamental Commodity Strategy ETF |
Consolidated Schedule of Investments, continued |
| March 31, 2017 |
| Description | Expiration
Date | Contract
Type | | Number of Contracts | | | Value at
Trade Date | | | Value at
March 31,
2017 | | | Unrealized
Appreciation | | | Unrealized (Depreciation) | |
| NY Harb USLD Future | 5/31/2018 | Long | | | 4 | | | $ | 285,478 | | | $ | 272,966 | | | $ | — | | | $ | (12,512 | ) |
| Silver Future | 12/27/2017 | Long | | | 2 | | | | 177,650 | | | | 184,990 | | | | 7,340 | | | | — | |
| Soybean Future | 11/14/2017 | Long | | | 23 | | | | 1,106,016 | | | | 1,097,100 | | | | — | | | | (8,916 | ) |
| Sugar #11 (World) Future | 6/29/2018 | Long | | | 15 | | | | 315,349 | | | | 291,816 | | | | — | | | | (23,533 | ) |
| Wheat Future | 12/14/2017 | Long | | | 2 | | | | 49,236 | | | | 47,375 | | | | — | | | | (1,861 | ) |
| WTI Crude Future | 5/22/2018 | Long | | | 22 | | | | 1,211,470 | | | | 1,143,120 | | | | — | | | | (68,350 | ) |
| | | | | | | | | | | | | $ | 8,971,249 | | | $ | 760,474 | | | $ | (508,042 | ) |
| Total unrealized appreciation (depreciation) | | | $ | 252,432 | | | | | |
Cash posted as collateral to broker for futures contracts was $556,251 at March 31, 2017.
The following table summarizes valuation of the Fund’s investments under the fair value hierarchy levels as of March 31, 2017:
| | | Level 1 | | | Level 2 | | | Level 3 | | | Total | |
| Asset Valuation Inputs | | | | | | | | | | | | |
| Investments in Securities | | | | | | | | | | | | |
| Treasury Bills | | $ | 7,480,149 | | | $ | — | | | $ | — | | | $ | 7,480,149 | |
| Corporate Bonds | | | — | | | | 505,007 | | | | — | | | | 505,007 | |
| Other Investments | | | | | | | | | | | | | | | | |
| Futures | | | 760,474 | | | | — | | | | — | | | | 760,474 | |
| Total Investment in Securities | | $ | 8,240,623 | | | $ | 505,007 | | | $ | — | | | $ | 8,745,630 | |
| Liability Valuation Inputs | | | | | | | | | | | | | | | | |
| Other Investments | | | | | | | | | | | | | | | | |
| Futures | | | 508,042 | | | | — | | | | — | | | | 508,042 | |
| Total Other Investments | | $ | 508,042 | | | $ | — | | | $ | — | | | $ | 508,042 | |
For the period ended March 31, 2017, there were no transfers between any levels. As of March 31, 2017 there were no Level 3 investments held in the Fund.
The accompanying notes are an integral part of these financial statements.
13
| Elkhorn S&P High Quality Preferred ETF |
| Schedule of Investments |
| March 31, 2017 |
| Investments | | Shares | | | Value | |
| PREFERRED STOCKS—99.8% | | | | | | |
| Banks—17.3% | | | | | | |
| BB&T Corp., 5.63% | | | 1,833 | | | $ | 46,210 | |
| BB&T Corp., 5.85% | | | 1,812 | | | | 46,061 | |
| BB&T Corp., Series E, 5.63% | | | 1,868 | | | | 47,335 | |
| BB&T Corp., Series F, 5.20% | | | 1,895 | | | | 47,299 | �� |
| BB&T Corp., Series G, 5.20% | | | 1,881 | | | | 46,912 | |
| Commerce Bancshares, Inc., Series B, 6.00% | | | 8,993 | | | | 232,469 | |
| Cullen/Frost Bankers, Inc., 5.38% | | | 9,068 | | | | 228,967 | |
| First Republic Bank, Series F, 5.70% | | | 4,708 | | | | 119,207 | |
| First Republic Bank, Series G, 5.50% | | | 4,793 | | | | 118,627 | |
| HSBC Holdings PLC (United Kingdom), 8.13% | | | 2,907 | | | | 78,140 | |
| HSBC Holdings PLC (United Kingdom), Series 2, 8.00% | | | 2,943 | | | | 77,842 | |
| HSBC Holdings PLC (United Kingdom), Series A, 6.20% | | | 3,005 | | | | 77,830 | |
| JPMorgan Chase & Co., Series AA, 6.10% | | | 1,266 | | | | 33,536 | |
| JPMorgan Chase & Co., Series BB, 6.15% | | | 1,263 | | | | 33,634 | |
| JPMorgan Chase & Co., Series O, 5.50% | | | 1,313 | | | | 33,350 | |
| JPMorgan Chase & Co., Series P, 5.45% | | | 1,305 | | | | 33,199 | |
| JPMorgan Chase & Co., Series T, 6.70% | | | 1,198 | | | | 32,837 | |
| JPMorgan Chase & Co., Series W, 6.30% | | | 1,244 | | | | 33,638 | |
| JPMorgan Chase & Co., Series Y, 6.13% | | | 1,269 | | | | 33,654 | |
| PNC Financial Services Group, Inc. (The), Series Q, 5.38% | | | 9,436 | | | | 235,239 | |
| US Bancorp, Series H, 5.15% | | | 9,305 | | | | 237,836 | |
| Wells Fargo & Co., 5.20% | | | 966 | | | | 23,667 | |
| Wells Fargo & Co., Series J, 8.00% | | | 863 | | | | 22,645 | |
| Wells Fargo & Co., Series L, 7.50% | | | 19 | | | | 23,560 | |
| Wells Fargo & Co., Series O, 5.13% | | | 963 | | | | 23,603 | |
| Wells Fargo & Co., Series P, 5.25% | | | 967 | | | | 23,991 | |
| Wells Fargo & Co., Series T, 6.00% | | | 891 | | | | 23,398 | |
| Wells Fargo & Co., Series V, 6.00% | | | 895 | | | | 23,404 | |
| Wells Fargo & Co., Series W, 5.70% | | | 933 | | | | 23,484 | |
| Wells Fargo & Co., Series X, 5.50% | | | 962 | | | | 23,646 | |
Total Banks | | | | | | | 2,085,220 | |
| | | | | | | | | |
Capital Markets—17.6% | | | | | | | | |
| Affiliated Managers Group, Inc., 6.38% | | | 8,986 | | | | 229,592 | |
| Apollo Investment Corp., 6.63% | | | 9,008 | | | | 228,443 | |
| Ares Management LP, Series A, 7.00% | | | 8,976 | | | | 235,710 | |
| Bank of New York Mellon Corp. (The), 5.20% | | | 9,538 | | | | 238,450 | |
| Charles Schwab Corp. (The), Series C, 6.00% | | | 8,913 | | | | 237,799 | |
| Gabelli Dividend & Income Trust (The), Series G, 5.25% | | | 9,574 | | | | 241,552 | |
| KKR & Co. LP, Series A, 6.75% | | | 4,395 | | | | 115,281 | |
| KKR & Co. LP, Series B, 6.50% | | | 4,463 | | | | 115,145 | |
| Northern Trust Corp., Series C, 5.85% | | | 8,948 | | | | 242,401 | |
| State Street Corp., Series C, 5.25% | | | 4,801 | | | | 119,449 | |
| State Street Corp., Series E, 6.00% | | | 4,408 | | | | 115,666 | |
Total Capital Markets | | | | | | | 2,119,488 | |
| | | | | | | | | |
Commercial Services & Supplies—1.9% | | | | | | | | |
| Pitney Bowes, Inc., 6.70% | | | 8,837 | | | | 231,971 | |
| | | | | | | | | |
Diversified Telecommunication—1.9% | | | | | | | | |
| Qwest Corp., 7.50% | | | 9,072 | | | | 231,699 | |
| | | | | | | | | |
Electric Utilities—8.0% | | | | | | | | |
| Duke Energy Corp., 5.13% | | | 9,316 | | | | 242,123 | |
| FPL Group Capital Trust I, 5.88% | | | 1,817 | | | | 46,824 | |
| Nextera Energy Capital Holdings, Inc., 5.00% | | | 1,994 | | | | 49,192 | |
| Nextera Energy Capital Holdings, Inc., Series G, 5.70% | | | 1,826 | | | | 46,015 | |
| Nextera Energy Capital Holdings, Inc., Series H, 5.63% | | | 1,823 | | | | 45,685 | |
| Nextera Energy Capital Holdings, Inc., Series I, 5.13% | | | 1,997 | | | | 49,046 | |
| PPL Capital Funding, Inc., Series B, 5.90% | | | 9,079 | | | | 237,779 | |
| SCE Trust I, 5.63% | | | 4,693 | | | | 118,451 | |
| SCE Trust II, 5.10% | | | 4,928 | | | | 121,968 | |
Total Electric Utilities | | | | | | | 957,083 | |
| | | | | | | | | |
Equity Real Estate Investment—17.9% | | | | | | | | |
| Boston Properties, Inc., 5.25% | | | 9,222 | | | | 230,550 | |
| Equity Commonwealth, 5.75% | | | 9,355 | | | | 235,372 | |
| Kimco Realty Corp., Series I, 6.00% | | | 3,036 | | | | 76,446 | |
| Kimco Realty Corp., Series J, 5.50% | | | 3,236 | | | | 80,706 | |
| Kimco Realty Corp., Series K, 5.63% | | | 3,201 | | | | 80,985 | |
| National Retail Properties, Inc., Series E, 5.70% | | | 3,154 | | | | 78,850 | |
| National Retail Properties, Inc., Series F, 5.20% | | | 3,412 | | | | 79,124 | |
| PS Business Parks, Inc., Series T, 6.00% | | | 3,014 | | | | 75,832 | |
| PS Business Parks, Inc., Series U, 5.75% | | | 3,144 | | | | 79,952 | |
| PS Business Parks, Inc., Series W, 5.20% | | | 3,436 | | | | 79,028 | |
| Public Storage, Series A, 5.88% | | | 672 | | | | 17,264 | |
| Public Storage, Series B, 5.40% | | | 748 | | | | 18,363 | |
| Public Storage, Series C, 5.13% | | | 782 | | | | 18,744 | |
| Public Storage, Series D, 4.95% | | | 809 | | | | 18,413 | |
| Public Storage, Series E, 4.90% | | | 812 | | | | 18,262 | |
| Public Storage, Series S, 5.90% | | | 704 | | | | 17,734 | |
| Public Storage, Series T, 5.75% | | | 707 | | | | 17,746 | |
| Public Storage, Series U, 5.63% | | | 720 | | | | 18,072 | |
| Public Storage, Series V, 5.38% | | | 743 | | | | 18,285 | |
| Public Storage, Series W, 5.20% | | | 735 | | | | 18,324 | |
| Public Storage, Series X, 5.20% | | | 736 | | | | 18,459 | |
The accompanying notes are an integral part of these financial statements.
14
| Elkhorn S&P High Quality Preferred ETF |
| Schedule of Investments, continued |
| March 31, 2017 |
| Investments | | Shares | | | Value | |
Equity Real Estate Investment (continued) | | | | |
| Public Storage, Series Y, 6.38% | | | 665 | | | $ | 17,702 | |
| Public Storage, Series Z, 6.00% | | | 665 | | | | 17,782 | |
| Realty Income Corp., Series F, 6.63% | | | 9,079 | | | | 227,792 | |
| Senior Housing Properties Trust, 5.63% | | | 9,440 | | | | 238,549 | |
| Ventas Realty LP / Ventas Capital Corp., 5.45% | | | 9,440 | | | | 236,189 | |
| Welltower, Inc., Series I, 6.50% | | | 1,873 | | | | 118,224 | |
Total Equity Real Estate Investment | | | | | | | 2,152,749 | |
| | | | | | | | | |
Industrial Conglomerates—2.0% | | | | | | | | |
| General Electric Co., 4.88% | | | 4,582 | | | | 117,666 | |
| General Electric Co., 4.88% | | | 4,563 | | | | 116,311 | |
Total Industrial Conglomerates | | | | | | | 233,977 | |
| | | | | | | | | |
Insurance—29.1% | | | | | | | | |
| Aegon NV (Netherlands), 6.38% | | | 3,023 | | | | 77,117 | |
| Aegon NV (Netherlands), 6.50% | | | 3,016 | | | | 77,662 | |
| Aegon NV (Netherlands), 8.00% | | | 2,914 | | | | 75,589 | |
| Aflac, Inc., 5.50% | | | 9,237 | | | | 234,620 | |
| American Financial Group, Inc., 6.38% | | | 8,979 | | | | 228,875 | |
| Arch Capital Group Ltd. (Bermuda), Series C, 6.75% | | | 4,520 | | | | 113,768 | |
| Arch Capital Group Ltd. (Bermuda), Series E, 5.25% | | | 5,164 | | | | 116,913 | |
| Argo Group US, Inc., 6.50% | | | 9,130 | | | | 231,628 | |
| Assured Guaranty Municipal Holdings, Inc., 6.25% | | | 8,937 | | | | 229,145 | |
| Axis Capital Holdings Ltd. (Bermuda), Series C, 6.88% | | | 3,016 | | | | 75,309 | |
| Axis Capital Holdings Ltd. (Bermuda), Series D, 5.50% | | | 3,225 | | | | 80,625 | |
| Axis Capital Holdings Ltd. (Bermuda), Series E, 5.50% | | | 3,398 | | | | 80,159 | |
| Endurance Specialty Holdings Ltd. (Bermuda), Series C, 6.35% | | | 8,847 | | | | 231,703 | |
| PartnerRe Ltd. (Bermuda), Series H, 7.25% | | | 4,100 | | | | 117,178 | |
| PartnerRe Ltd. (Bermuda), Series I, 5.88% | | | 4,716 | | | | 120,399 | |
| Protective Life Corp., 6.25% | | | 8,958 | | | | 226,996 | |
| Prudential Financial, Inc., 5.70% | | | 4,497 | | | | 115,708 | |
| Prudential Financial, Inc., 5.75% | | | 4,540 | | | | 116,042 | |
| Prudential PLC (United Kingdom), 6.50% | | | 4,477 | | | | 116,223 | |
| Prudential PLC (United Kingdom), 6.75% | | | 4,467 | | | | 116,276 | |
| RenaissanceRe Holdings Ltd. (Bermuda), Series E. 5.38% | | | 9,821 | | | | 242,677 | |
| Selective Insurance Group, Inc., 5.88% | | | 9,245 | | | | 231,957 | |
| Validus Holdings Ltd. (Bermuda), Series A, 5.88% | | | 9,800 | | | | 243,726 | |
Total Insurance | | | | | | | 3,500,295 | |
| | | | | | | | | |
Machinery—1.9% | | | | | | | | |
| Stanley Black & Decker, Inc., 5.75% | | | 9,134 | | | | 230,634 | |
| | | | | | | | | |
Media—2.0% | | | | | | | | |
| Comcast Corp., 5.00% | | | 9,025 | | | | 232,845 | |
| | | | | | | | | |
Mortgage Real Estate Investment—0.2% | | | | | | | | |
| Wells Fargo Real Estate Investment Corp., Series A, 6.38% | | | 882 | | | | 23,153 | |
| | | | | | | | | |
Total Preferred Stocks (Cost $11,919,217) | | | | | | | 11,999,114 | |
| | | | | | | | | |
| MONEY MARKET FUND—0.1% | | | | | | | | |
Goldman Sachs Financial Square Funds - Government Fund, 0.62% (a) (Cost $16,747) | | | 16,747 | | | | 16,747 | |
| | | | | | | | | |
Total Investments—99.9% (Cost $11,935,964) | | | | | | | 12,015,861 | |
| | | | | | | | | |
| Other Assets in Excess of Liabilities—0.1% | | | | 14,034 | |
| Net Assets—100.0% | | | | | | $ | 12,029,895 | |
| (a) | Rate shown represents annualized 7-day yield as of March 31, 2017. |
The following table summarizes valuation of the Fund’s investments under the fair value hierarchy levels as of March 31, 2017:
| | | Level 1 | | | Level 2 | | | Level 3 | | | Total | |
| Asset Valuation Inputs | | | | | | | | | | | | |
| Investments in Securities | | | | | | | | | | | | |
| Preferred Stocks | | $ | 11,999,114 | | | $ | — | | | $ | — | | | $ | 11,999,114 | |
| Money Market Fund | | | 16,747 | | | | — | | | | — | | | | 16,747 | |
| Total Investment in Securities | | $ | 12,015,861 | | | $ | — | | | $ | — | | | $ | 12,015,861 | |
For the period ended March 31, 2017, there were no transfers between any levels. As of March 31, 2017 there were no Level 3 investments held in the Fund.
The accompanying notes are an integral part of these financial statements.
15
| Elkhorn ETF Trust |
| Statements of Assets and Liabilities |
| March 31, 2017 |
| | | Elkhorn Commodity Rotation
Strategy ETF (Consolidated) | | | Elkhorn Fundamental Commodity Strategy ETF (Consolidated) | | | Elkhorn S&P
High Quality
Preferred ETF | |
| ASSETS: | | | | | | | | | |
| Investments, at cost | | $ | 1,702,509 | | | $ | 7,991,148 | | | $ | 11,935,964 | |
| Investments, at value | | $ | 1,701,060 | | | $ | 7,985,156 | | | $ | 12,015,861 | |
| Cash | | | 203,784 | | | | 1,421,429 | | | | — | |
| Cash collateral held at brokers | | | 278,279 | | | | 556,251 | | | | — | |
| Receivables: | | | | | | | | | | | | |
| Due from adviser | | | 11,496 | | | | 9,146 | | | | — | |
| Variation margin on futures contracts | | | 244,448 | | | | 117,154 | | | | — | |
| Dividends | | | — | | | | — | | | | 18,801 | |
| Interest | | | 13,197 | | | | 8,541 | | | | — | |
Total Assets | | | 2,452,264 | | | | 10,097,677 | | | | 12,034,662 | |
| | | | | | | | | | | | | |
LIABILITIES: | | | | | | | | | | | | |
| Payables: | | | | | | | | | | | | |
| Capital shares payable | | | — | | | | 1,265,009 | | | | — | |
| Advisory fees | | | — | | | | — | | | | 4,767 | |
Total Liabilities | | | — | | | | 1,265,009 | | | | 4,767 | |
NET ASSETS | | $ | 2,452,264 | | | $ | 8,832,668 | | | $ | 12,029,895 | |
| | | | | | | | | | | | | |
NET ASSETS CONSIST OF: | | | | | | | | | | | | |
| Paid-in capital | | $ | 2,206,296 | | | $ | 8,599,120 | | | $ | 12,761,243 | |
| Undistributed net investment income (loss) | | | (11,134 | ) | | | (12,844 | ) | | | 29,539 | |
| Accumulated net realized loss on investments and futures contracts | | | (2,086 | ) | | | (48 | ) | | | (840,784 | ) |
| Net unrealized appreciation on investments and futures contracts | | | 259,188 | | | | 246,440 | | | | 79,897 | |
NET ASSETS | | $ | 2,452,264 | | | $ | 8,832,668 | | | $ | 12,029,895 | |
| Shares outstanding ($0.01 par value common stock, unlimited shares authorized) | | | 100,002 | | | | 350,002 | | | | 500,002 | |
| Net asset value, per share | | $ | 24.52 | | | $ | 25.24 | | | $ | 24.06 | |
The accompanying notes are an integral part of these financial statements.
16
| Elkhorn ETF Trust |
| Statements of Operations |
| |
| | | Elkhorn Commodity Rotation Strategy ETF
(Consolidated) | | | Elkhorn Fundamental Commodity Strategy ETF
(Consolidated) | | | Elkhorn S&P
High Quality
Preferred ETF | |
| | For the Period September 20,
20161 to
March 31,
2017 | | | For the Period September 20,
20161 to
March 31,
2017 | | | For the Period
May 23,
20161 to
March 31,
2017 | |
| INVESTMENT INCOME: | | | | | | | | | |
| Dividend income | | $ | — | | | $ | — | | | $ | 544,569 | |
| Interest income | | | 9,463 | | | | 14,123 | | | | — | |
Total Income | | | 9,463 | | | | 14,123 | | | | 544,569 | |
| | | | | | | | | | | | | |
EXPENSES: | | | | | | | | | | | | |
| Advisory fees | | | 30,720 | | | | 42,000 | | | | 40,373 | |
| Excise tax fees | | | — | | | | — | | | | 1,033 | |
Total Expenses | | | 30,720 | | | | 42,000 | | | | 41,406 | |
Net Investment Income (Loss) | | | (21,257 | ) | | | (27,877 | ) | | | 503,163 | |
| | | | | | | | | | | | | |
REALIZED AND UNREALIZED GAIN (LOSS) ON: | | | | | | | | | | | | |
| Net realized gain (loss) on | | | | | | | | | | | | |
| Investments | | | (2,429 | ) | | | (216 | ) | | | (835,893 | ) |
| In-kind redemptions | | | — | | | | — | | | | 24,508 | |
| Futures contracts | | | (386,781 | ) | | | (181,459 | ) | | | — | |
| Net increase from payment by affiliates | | | 16,328 | | | | 16,328 | | | | — | |
| Total net realized loss | | | (372,882 | ) | | | (165,347 | ) | | | (811,385 | ) |
| Net change in unrealized appreciation (depreciation) on | | | | | | | | | | | | |
| Investments | | | (1,449 | ) | | | (5,992 | ) | | | 79,897 | |
| Futures contracts | | | 260,637 | | | | 252,432 | | | | — | |
| Net change in unrealized appreciation | | | 259,188 | | | | 246,440 | | | | 79,897 | |
| Net realized and change in unrealized appreciation (depreciation) on investments and futures contracts | | | (113,694 | ) | | | 81,093 | | | | (731,488 | ) |
Net Increase (Decrease) in Net Assets Resulting From Operations | | $ | (134,951 | ) | | $ | 53,216 | | | $ | (228,325 | ) |
1 | Commencement of operations. |
The accompanying notes are an integral part of these financial statements.
17
| Elkhorn ETF Trust |
| Statements of Changes in Net Assets |
| |
| | | Elkhorn Commodity Rotation Strategy ETF
(Consolidated) | | | Elkhorn Fundamental Commodity Strategy ETF
(Consolidated) | | | Elkhorn S&P
High Quality Preferred ETF | |
| | For the Period September 20,
20161 to
March 31,
2017 | | | For the Period September 20,
20161 to
March 31,
2017 | | | For the Period
May 23,
20161 to
March 31,
2017 | |
| OPERATIONS: | | | | | | | | | |
| Net investment income (loss) | | $ | (21,257 | ) | | $ | (27,877 | ) | | $ | 503,163 | |
| Net realized loss on investments, in-kind redemptions and futures contracts | | | (372,882 | ) | | | (165,347 | ) | | | (811,385 | ) |
| Net change in unrealized appreciation on investments and futures contracts | | | 259,188 | | | | 246,440 | | | | 79,897 | |
| Net increase (decrease) in net assets resulting from operations | | | (134,951 | ) | | | 53,216 | | | | (228,325 | ) |
| | | | | | | | | | | | | |
Distributions paid to shareholders from: | | | | | | | | | | | | |
| Net investment income | | | — | | | | — | | | | (491,047 | ) |
| Total distributions to shareholders | | | — | | | | — | | | | (491,047 | ) |
| | | | | | | | | | | | | |
SHAREHOLDER TRANSACTIONS: | | | | | | | | | | | | |
| Proceeds from shares sold | | | 11,230,678 | | | | 15,213,462 | | | | 13,945,584 | |
| Cost of shares redeemed | | | (8,643,463 | ) | | | (6,434,010 | ) | | | (1,196,317 | ) |
| Net increase in net assets resulting from shareholder transactions | | | 2,587,215 | | | | 8,779,452 | | | | 12,749,267 | |
| Increase in net assets | | | 2,452,264 | | | | 8,832,668 | | | | 12,029,895 | |
| | | | | | | | | | | | | |
NET ASSETS: | | | | | | | | | | | | |
| Beginning of period | | | — | | | | — | | | | — | |
| End of period | | $ | 2,452,264 | | | $ | 8,832,668 | | | $ | 12,029,895 | |
| Undistributed net investment income (loss) included in net assets at end of period | | $ | (11,134 | ) | | $ | (12,844 | ) | | $ | 29,539 | |
| | | | | | | | | | | | | |
CHANGES IN SHARES OUTSTANDING: | | | | | | | | | | | | |
| Shares outstanding, beginning of period | | | — | | | | — | | | | — | |
| Shares sold | | | 450,002 | | | | 600,002 | | | | 550,002 | |
| Shares redeemed | | | (350,000 | ) | | | (250,000 | ) | | | (50,000 | ) |
| Shares outstanding, end of period | | | 100,002 | | | | 350,002 | | | | 500,002 | |
1 | Commencement of operations. |
The accompanying notes are an integral part of these financial statements.
18
| Elkhorn Commodity Rotation Strategy ETF |
Consolidated Financial Highlights |
For the Period September 20, 20161 to March 31, 2017 |
| Per Share Operating Performance: | | | |
| (for a share of capital stock outstanding throughout the period) | | | |
| Net asset value, beginning of period | | $ | 25.00 | |
| | | | | |
Income from Investment Operations: | | | | |
Net investment loss2 | | | (0.09 | ) |
| Net realized and unrealized loss on investments | | | (0.39 | )3 |
| Total loss from investment operations | | | (0.48 | ) |
| Net asset value, end of period | | $ | 24.52 | |
| Market value, end of period | | $ | 24.48 | |
Total Return at Net Asset Value | | | (1.91 | )%3,4 |
Total Return at Market Value | | | (2.77 | )%4 |
| | | | | |
Ratios/Supplemental Data: | | | | |
| Net assets, end of period (000's) omitted | | $ | 2,452 | |
| Ratio to average net assets of: | | | | |
| Expenses | | | 0.99 | %5 |
| Net investment income (loss) | | | (0.69 | )%5 |
Portfolio turnover rate6 | | | 0 | % |
1 | Commencement of Operations. |
2 | Based on average daily shares outstanding. |
3 | Net realized and unrealized loss on investments includes an increase in per share net asset value of $0.07 related to a voluntary reimbursement by the adviser for commission expenses on futures transactions. This reimbursement increased total return at net asset value by 0.28%. |
5 | Annualized for periods less than one year. |
6 | Portfolio turnover rate is not annualized and excludes the value of portfolio securities received or delivered as a result of in-kind creations or redemptions of the Fund’s capital shares. |
The accompanying notes are an integral part of these financial statements.
19
| Elkhorn Fundamental Commodity Strategy ETF |
Consolidated Financial Highlights |
For the Period September 20, 20161 to March 31, 2017 |
| Per Share Operating Performance: | | | |
| (for a share of capital stock outstanding throughout the period) | | | |
| Net asset value, beginning of period | | $ | 25.00 | |
| | | | | |
Income from Investment Operations: | | | | |
Net investment loss2 | | | (0.07 | ) |
| Net realized and unrealized gain on investments | | | 0.31 | 3 |
| Total gain from investment operations | | | 0.24 | |
| Net asset value, end of period | | $ | 25.24 | |
| Market value, end of period | | $ | 25.22 | |
Total Return at Net Asset Value | | | 0.94 | %3,4 |
Total Return at Market Value | | | 0.44 | %4 |
| | | | | |
Ratios/Supplemental Data: | | | | |
| Net assets, end of period (000's) omitted | | $ | 8,833 | |
| Ratio to average net assets of: | | | | |
| Expenses | | | 0.75 | %5 |
| Net investment income (loss) | | | (0.50 | )%5 |
Portfolio turnover rate6 | | | 0 | % |
1 | Commencement of Operations. |
2 | Based on average daily shares outstanding. |
3 | Net realized and unrealized gain on investments includes an increase in per share net asset value of $0.04 related to a voluntary reimbursement by the adviser for commission expenses on futures transactions. This reimbursement increased total return at net asset value by 0.16%. |
5 | Annualized for periods less than one year. |
6 | Portfolio turnover rate is not annualized and excludes the value of portfolio securities received or delivered as a result of in-kind creations or redemptions of the Fund’s capital shares. |
The accompanying notes are an integral part of these financial statements.
20
| Elkhorn S&P High Quality Preferred ETF |
| Financial Highlights |
For the Period May 23, 20161 to March 31, 2017 |
| Per Share Operating Performance: | | | |
| (for a share of capital stock outstanding throughout the period) | | | |
| Net asset value, beginning of period | | $ | 25.07 | |
| | | | | |
Income from Investment Operations: | | | | |
Net investment income2 | | | 1.21 | |
| Net realized and unrealized loss on investments | | | (1.17 | ) |
| Total gain from investment operations | | | 0.04 | |
| | | | | |
Less distributions from: | | | (1.05 | ) |
| Net investment income | | | (1.05 | ) |
| Net asset value, end of period | | $ | 24.06 | |
| Market value, end of period | | $ | 24.10 | |
Total Return at Net Asset Value | | | 0.18 | %3 |
Total Return at Market Value | | | (0.10 | )%3 |
| | | | | |
Ratios/Supplemental Data: | | | | |
| Net assets, end of period (000's) omitted | | $ | 12,030 | |
| Ratio to average net assets of: | | | | |
| Expenses | | | 0.48 | %4,5 |
| Net investment income | | | 5.86 | %4 |
Portfolio turnover rate6 | | | 171 | % |
1 | Commencement of Operations. |
2 | Based on average daily shares outstanding. |
4 | Annualized for periods less than one year. |
5 | The ratio of expenses to average net assets include tax expenses of 0.01%. |
6 | Portfolio turnover rate is not annualized and excludes the value of portfolio securities received or delivered as a result of in-kind creations or redemptions of the Fund’s capital shares. |
The accompanying notes are an integral part of these financial statements.
21
| Notes to Financial Statements |
| March 31, 2017 |
1. ORGANIZATION
The Elkhorn ETF Trust (the “Trust”) was organized as a Massachusetts business trust on December 17, 2013, and is authorized to issue an unlimited number of shares. The Trust is an open-end management investment company, registered under the Investment Company Act of 1940, as amended (the “1940 Act”). The Elkhorn Commodity Rotation Strategy ETF, Elkhorn Fundamental Commodity Strategy ETF, and Elkhorn S&P High Quality Preferred ETF, (each a “Fund” and collectively, “Funds”) are presented herein. Each Fund is classified as a non-diversified series of the Trust.
| Fund | Commencement of operations | Commencement of trading on secondary market |
| Elkhorn Commodity Rotation Strategy ETF | September 20, 2016 | September 21, 2016 |
| Elkhorn Fundamental Commodity Strategy ETF | September 20, 2016 | September 21, 2016 |
| Elkhorn S&P High Quality Preferred ETF | May 23, 2016 | May 24, 2016 |
| Fund | Investment objectives |
| Elkhorn Commodity Rotation Strategy ETF | The Fund seeks to provide investors with total return. |
| Elkhorn Fundamental Commodity Strategy ETF | The Fund seeks to provide investors with total return. |
| Elkhorn S&P High Quality Preferred ETF | The Fund seeks investment results that generally correspond (before fees and expenses) to the price and yield of the S&P U.S. High Quality Preferred Stock Index. |
2. CONSOLIDATION OF SUBSIDIARIES
Elkhorn Cayman Fund 2 and Elkhorn Cayman Fund 1 (each, a “Subsidiary”: collectively, the “Subsidiaries”) are organized under the laws of the Cayman Islands as wholly-owned subsidiaries which act as investment vehicles for Elkhorn Commodity Rotation Strategy ETF and Elkhorn Fundamental Commodity Strategy ETF, respectively. The principal purpose of the investments of the Funds noted above in the Subsidiaries is to allow the Funds to gain exposure to the commodity markets within the limitations of the federal tax law requirements applicable to regulated investment companies.
The following table reflects the net assets of each Subsidiary as a percentage of each Fund’s net assets at March 31, 2017:
| Fund | Wholly Owned Subsidiary | | Value | | | Percentage
of Fund’s
Net Assets | |
| Elkhorn Commodity Rotation Strategy ETF | Elkhorn Cayman Fund 2 | | $ | 539,054 | | | | 22.0 | % |
| Elkhorn Fundamental Commodity Strategy ETF | Elkhorn Cayman Fund 1 | | | 1,984,876 | | | | 22.5 | |
The Consolidated Schedules of Investments; Consolidated Statements of Assets and Liabilities, of Operations and of Changes in Net Assets; and the Consolidated Financial Highlights of the Funds listed above include the accounts of wholly-owned subsidiaries. All inter-company accounts and transactions have been eliminated in consolidation.
3. SIGNIFICANT ACCOUNTING POLICIES
Use of Estimates: These financial statements are prepared in accordance with accounting principles generally accepted in the United States of America (“U.S. GAAP”), which require management to make estimates and assumptions that affect the reported amount of assets and liabilities, the disclosure of contingent liabilities at the date of the financial statements, and the reported amount of increase and decrease in net assets from operations during the reporting period. Actual amounts could differ from these estimates. The Funds follow the accounting and reporting guidance in the Accounting Standards Codifications 946, “Financial Services—Investment Companies” issued by the U.S. Financial Accounting Standards Board.
The following is a summary of significant accounting policies followed by the Funds in the preparation of their financial statements.
22
| Notes to Financial Statements |
| March 31, 2017, continued |
Investment Transactions and Investment Income: Investment transactions are recorded on the trade date. Realized gains and losses on sales of investment securities are calculated using specific identification basis. Dividend income, if any, is recorded on the ex-dividend date or, in the case of foreign securities, as soon as each Fund is informed of the ex-dividend dates. Interest income, including accretion of discounts and amortization of premiums, is recorded on the accrual basis.
Dividend Distributions: Distributions to shareholders are recorded on the ex-dividend date and are determined in accordance with federal income tax regulations, which may differ from U.S. GAAP. The Funds distribute all or substantially all of their net investment income to shareholders in the form of dividends.
Futures contracts: The Elkhorn Commodity Rotation Strategy ETF and Elkhorn Fundamental Commodity Strategy ETF, through their Subsidiaries, invest in a combination of exchange-listed commodity futures contracts in the normal course of pursuing their investment objectives. A futures contract is a financial instrument in which a party agrees to pay a fixed price for securities or commodities at a specified future date. Futures contracts are traded at market prices on exchanges pursuant to terms common to all market participants. Upon entering into such contracts, the Funds are required to deposit with the broker, either in cash or in securities, an initial margin in an amount equal to a certain percentage of the contract amount. Subsequent fluctuations in the value of the contract are recorded for financial statement purposes as unrealized gains or losses by the Funds and variation margin receivable or payable. Payments received or paid by the Funds adjust the variation margin accounts. When a contract is closed, the Funds record a realized gain or loss.
Futures contracts may be highly volatile. Price movements may be sudden and extreme, and are influenced by a variety of factors including, among other things, changing supply and demand relationships; climate; government agricultural, trade, fiscal, monetary and exchange control programs and policies; national and international political and economic events; crop diseases; the purchasing and marketing programs of different nations; and changes in interest rates.
Open futures contracts at March 31, 2017, if any, are listed in the Consolidated Schedules of Investments. Variation margin, if applicable, is shown in Variation margin receivable or payable within the Consolidated Statements of Assets and Liabilities.
4. SECURITIES VALUATION
Investment Valuation: Each Fund calculates its net asset value (“NAV”) each day the New York Stock Exchange (the “NYSE”) is open for trading as of the close of regular trading on the NYSE, normally 4:00 p.m. Eastern time (the “NAV Calculation Time”).
Common stocks, preferred stocks and other equity securities listed on any national or foreign exchange other than The Nasdaq Stock Market (“Nasdaq”) are valued at the last sale price on the business day as of which such value is being determined. Securities listed on Nasdaq are valued at the official closing price on the business day as of which such value is being determined. If there has been no sale on such day, or no official closing price in the case of securities traded on Nasdaq, the securities are valued at the mean of the most recent bid and ask prices on such day. Portfolio securities traded on more than one securities exchange are valued at the last sale price or official closing price, as applicable, on the business day as of which such value is being determined at the close of the exchange representing the principal market for such securities. Such valuations are typically categorized as Level 1 in the fair value hierarchy described below.
Debt securities are valued using information provided by a third-party pricing service. The third-party pricing service primarily uses broker quotes to value the securities. Such valuations are typically categorized as Level 2 in the fair value hierarchy described below.
If a market quotation is not readily available or is deemed not to reflect market value, Elkhorn Investments, LLC, (the “Adviser”) determines the price of the security held by each Fund based on a determination of the security’s fair value pursuant to policies and procedures approved by the Board of Trustees (the “Board”). In addition, each Fund may use fair valuation to price securities that trade on a foreign exchange when a significant event has occurred after the foreign exchange closes but before the time at which the Fund’s NAV is calculated. Such valuations would typically be categorized as Level 2 or Level 3 in the fair value hierarchy described below.
Exchange-traded futures contracts are valued at the closing price in the market where such contracts are principally traded. If no closing price is available, exchange-traded futures contracts are fair valued at the mean of the last bid and asked prices, if available, and otherwise at the closing bid price. Such valuations are typically categorized as Level 1 in the fair value hierarchy described below.
Certain securities may not be able to be priced by pre-established pricing methods. Such securities may be valued by the Board or its delegate at fair value. These securities generally include but are not limited to, restricted securities (securities which may not be publicly sold without registration under the 1933 Act) for which a pricing service is unable to provide a market price; securities whose trading has been formally suspended; a security whose market price is not available from a pre- established pricing source; a security
23
| Notes to Financial Statements |
| March 31, 2017, continued |
with respect to which an event has occurred that is likely to materially affect the value of the security after the market has closed but before the calculation of each Fund net asset value (as may be the case in foreign markets on which the security is primarily traded) or make it difficult or impossible to obtain a reliable market quotation; and a security whose price, as provided by the pricing service, does not reflect the security’s “fair value.” A variety of factors may be considered in determining the fair value of such securities.
Valuing the Funds’ investments using fair value pricing will result in using prices for those investments that may differ from current market valuations.
Fair Valuation Measurement
The Financial Accounting Standards Board established a framework for measuring fair value in accordance with U.S. GAAP. Under Fair Value Measurements and Disclosures, various inputs are used in determining the value of the exchange traded fund’s investments. The inputs or methodology used for valuing securities are not necessarily an indication of the risk associated with investing in those securities. The three Levels of inputs of the fair value hierarchy are defined as follows:
Level 1 — Unadjusted quoted prices in active markets for identical assets or liabilities.
Level 2 — Observable inputs other than quoted prices included in Level 1 that are observable for the asset or liability, either directly or indirectly. These inputs may include quoted prices for the identical instrument on an inactive market, prices for similar securities, interest rates, prepayment speeds, credit risk, yield curves, default rates and similar data.
Level 3 — Unobservable inputs for the asset or liability, to the extent relevant observable inputs are not available; representing the Funds’ own assumptions about the assumptions a market participant would use in valuing the asset or liability, and would be based on the best information available.
A financial instrument’s level within the fair value hierarchy is based on the lowest level of any input that is significant to the fair value measurement.
The availability of observable inputs can vary from security to security and is affected by a wide variety of factors, including, for example, the type of security, whether the security is new and not yet established in the marketplace, the liquidity of markets, and other characteristics particular to the security. To the extent that valuation is based on models or inputs that are less observable or unobservable in the market, the determination of fair value requires more judgment. Accordingly, the degree of judgment exercised in determining fair value is greatest for instruments categorized in Level 3.
The hierarchy classification of inputs used to value each Fund’s investments at March 31, 2017, is disclosed at the end of each Fund’s Schedule of Investments or Consolidated Schedule of Investments.
5. ADVISORY AND OTHER AGREEMENTS
Advisory and Other Fees: The Funds pay to the Adviser, a related party, a fee calculated daily and payable monthly an annual rate (stated as a percentage of the average daily net assets of each Fund) in return for providing investment management and supervisory services as follows:
| Fund | Management Fees |
| Elkhorn Commodity Rotation Strategy ETF | 0.99% |
| Elkhorn Fundamental Commodity Strategy ETF | 0.75% |
| Elkhorn S&P High Quality Preferred ETF | 0.47% |
Subject to the supervision of the Board, the Adviser pays substantially all expenses associated with the operation of each Fund, except for distribution and service fees payable pursuant to a Rule 12b-1 plan, if any, brokerage commissions and other expenses connected with the execution of portfolio transactions, taxes, interest, and extraordinary expenses.
Administrator, Custodian, Accounting Agent and Transfer Agent Services: The Bank of New York Mellon (in each capacity, the “Administrator”, “Custodian,” “Accounting Agent” or “Transfer Agent”) serves as the Funds’ Administrator, Custodian, Accounting Agent and Transfer Agent pursuant to the Funds Administration and Accounting Agreement. The Bank of New York Mellon is a subsidiary of The Bank of New York Mellon Corporation, a financial holding company.
24
| Notes to Financial Statements |
| March 31, 2017, continued |
Distribution and Service Fees: ALPS Distributors, Inc. (“Distributor”) serves as the Funds’ distributor. The Trust has adopted a distribution and service plan (“Rule 12b-1 Plan”) pursuant to Rule 12b-1 under the 1940 Act. Under the Rule 12b-1 Plan, the Fund is authorized to pay an amount up to a maximum annual rate of 0.25% of its average net assets in connection with the sale and distribution of its shares and pay service fees in connection with the provision of ongoing services to shareholders. No fees are currently paid by the Funds under the plan, and the Funds will not pay 12b-1 fees any time before March 31, 2018.
6. CREATION AND REDEMPTION TRANSACTIONS
There were an unlimited number of shares of beneficial interest at $0.01 par value authorized by the Trust. Individual shares of the Funds may only be purchased and sold at market prices on a national securities exchange through a broker-dealer. Such transactions may be subject to customary commission rates imposed by the broker-dealer, and market prices for the Fund’s shares may be at, above or below its NAV depending on the premium or discount at which the Fund’s shares trade.
Each Fund issues and redeems shares at its NAV only in a large specified number of shares each called a “Creation Unit,” or multiples thereof, and only with “authorized participants” who have entered into contractual arrangements with the Distributor. A Creation Unit for the Funds consists of 50,000 shares. Except when aggregated in Creation Units, shares of the Funds are not redeemable. Transactions in shares for each Fund are disclosed in detail in the Statement of Changes in Net Assets. The consideration for a purchase of Creation Units generally consists of the in-kind deposit of specified securities and an amount of cash or, as permitted or required by the Funds, of cash. A fixed transaction fee is imposed on each creation and redemption transaction. In addition, a variable charge for certain creation and redemption transactions will be imposed.
7. INVESTMENT TRANSACTIONS
The cost of purchases and the proceeds from sales of investment securities (excluding short- term investments) for the period ended March 31, 2017 were the following:
| Fund | | Purchases | | | Sales | |
| Elkhorn S&P High Quality Preferred ETF | | $ | 16,070,870 | | | $ | 16,044,990 | |
For the period ended March 31, 2017, the cost of in-kind subscriptions and the proceeds from in-kind redemptions were the following:
| Fund | | In-Kind
Subscriptions | | | In-Kind Redemptions | |
| Elkhorn S&P High Quality Preferred ETF | | $ | 13,905,230 | | | $ | 1,194,907 | |
8. VALUATION OF DERIVATIVE INSTRUMENTS
The Funds have adopted authoritative standards of accounting for derivative instruments which establish disclosure requirement for derivative instruments. These standards improve financial reporting for derivative instruments by requiring enhanced disclosures that enables investors to understand how and why a fund uses derivatives instruments, how derivatives instruments are accounted for and how derivative instruments affect a fund’s financial position and results of operations. The Funds use derivative instruments as part of their principal investment strategy to achieve their investment objective.
The following is the location and each Fund’s fair values of derivative investments disclosed, if any, in the Consolidated Statements of Assets and Liabilities, categorized by primary market risk exposure as of March 31, 2017.
| Fund | Asset Derivatives: | | Commodity Risk | |
| Elkhorn Commodity Rotation Strategy ETF | Unrealized appreciation on futures contracts (1) | | $ | 603,925 | |
| Elkhorn Fundamental Commodity Strategy ETF | Unrealized appreciation on futures contracts (1) | | | 760,474 | |
25
| Notes to Financial Statements |
| March 31, 2017, continued |
| Fund | Liability Derivatives: | | Commodity Risk | |
| Elkhorn Commodity Rotation Strategy ETF | Unrealized depreciation on futures contracts (1) | | $ | 343,288 | |
| Elkhorn Fundamental Commodity Strategy ETF | Unrealized depreciation on futures contracts (1) | | | 508,042 | |
(1) | Included within cumulative appreciation (depreciation) on futures contracts as reported in the Consolidated Schedules of Investments. |
The following is the location and the effect of derivative investments, if any, on the Consolidated Statements of Operations, categorized by primary market risk exposure during the period ended March 31, 2017.
| Fund | Realized Gain (Loss) | | Commodity Risk | |
| Elkhorn Commodity Rotation Strategy ETF | Futures contracts | | $ | (386,781 | ) |
| Elkhorn Fundamental Commodity Strategy ETF | Futures contracts | | | (181,459 | ) |
The following is the location and the effect of derivative investments, if any, on the Consolidated Statements of Operations, categorized by primary market risk exposure during the period ended March 31, 2017.
| Fund | Change in Unrealized Gain (Loss): | | Commodity Risk | |
| Elkhorn Commodity Rotation Strategy ETF | Futures contracts | | $ | 260,637 | |
| Elkhorn Fundamental Commodity Strategy ETF | Futures contracts | | | 252,432 | |
The following is a summary of the fiscal quarter end average volume on derivative activity for the period ended March 31, 2017.
| | Elkhorn Commodity Rotation
Strategy ETF | | | Elkhorn Fundamental Commodity Strategy ETF | |
| Futures contracts: | | | | | | |
| Average notional value of contracts | | $ | 10,224,551 | | | $ | 14,431,424 | |
For the purpose of this calculation, notional amounts outstanding are at absolute value.
9. FEDERAL INCOME TAX MATTERS
The Funds intend to qualify as a ‘‘regulated investment company’’ under Subchapter M of the Internal Revenue Code of 1986, as amended. If so qualified, the Funds will not be subject to Federal income tax to the extent they distribute substantially all of their net investment income and net capital gains to its shareholders. Accounting for Uncertainty in Income Taxes provides guidance for how uncertain tax positions should be recognized, measured, presented and disclosed in the financial statements, and requires the evaluation of tax positions taken or expected to be taken in the course of preparing each Fund’s tax returns to determine whether the tax positions are ‘‘more-likely-than-not’’ of being sustained by the applicable tax authority. Tax positions not deemed to meet the more- than-likely-than-not threshold would be recorded as a tax benefit or expense in the current year. Interest and penalty related to income taxes would be recorded as income tax expense. Management of the Funds is required to analyze all open tax years (2016), as defined by IRS statute of limitations, for all major jurisdictions, including federal tax authorities and certain state tax authorities. As of March 31, 2017, the Funds did not have a liability for any unrecognized tax benefits. The Funds have no examination in progress and are not aware of any tax positions for which it is reasonably possible that the amounts of unrecognized tax benefits will significantly change in the next twelve months.
26
| Notes to Financial Statements |
| March 31, 2017, continued |
At March 31, 2017, the cost of investments and net unrealized appreciation (depreciation) for federal income tax purposes were as follows:
| Fund | | Federal
Tax Cost of
Investments | | | Gross
Unrealized Appreciation | | | Gross
Unrealized Depreciation | | | Net Unrealized Appreciation (Depreciation) | |
| Elkhorn Commodity Rotation Strategy ETF | | $ | 1,702,509 | | | $ | 7,582 | | | $ | (9,031 | ) | | $ | (1,449 | ) |
| Elkhorn Fundamental Commodity Strategy ETF | | | 7,991,148 | | | | — | | | | (5,992 | ) | | | (5,992 | ) |
| Elkhorn S&P High Quality Preferred ETF | | | 12,042,435 | | | | 66,087 | | | | (92,661 | ) | | | (26,574 | ) |
The differences between book and tax basis cost of investments and net unrealized appreciation (depreciation) are primarily attributable to wash sales and investments in preferred securities.
At March 31, 2017, the components of undistributed or accumulated earnings/loss on a tax-basis were as follows:
| Fund | | Undistributed
Net Investment
Income (Loss) | | | Accumulated
Capital and Other
Gains (Losses) | | | Net Unrealized Appreciation (Depreciation) | | | Total
Accumulated Earnings (Losses) | |
| Elkhorn Commodity Rotation Strategy ETF | | $ | (11,134 | ) | | $ | (2,086 | ) | | $ | 259,188 | | | $ | 245,968 | |
| Elkhorn Fundamental Commodity Strategy ETF | | | (12,844 | ) | | | (48 | ) | | | 246,440 | | | | 233,548 | |
| Elkhorn S&P High Quality Preferred ETF | | | 49,099 | | | | (753,873 | ) | | | (26,574 | ) | | | (731,348 | ) |
The tax character of distributions paid from ordinary income during the period ended March 31, 2017, were as follows:
| | | Period Ended
March 31, 2017 | |
| Fund | | Ordinary Income | |
| Elkhorn S&P High Quality Preferred ETF | | $ | 491,047 | |
Certain capital and qualified late year ordinary losses incurred after October 31 and December 31, respectively, and within the current taxable year, are deemed to arise on the first business day of each Fund’s next taxable year. During the fiscal period ended March 31, 2017, the following Funds incurred and will elect to defer post-October capital losses and late year ordinary losses as follows:
| Fund | | Post-October Losses on Capital | | | Late Year
Ordinary Losses | |
| Elkhorn Commodity Rotation Strategy ETF | | $ | (2,086 | ) | | $ | (11,134 | ) |
| Elkhorn Fundamental Commodity Strategy ETF | | | (48 | ) | | | (12,844 | ) |
| Elkhorn S&P High Quality Preferred ETF | | | (732,404 | ) | | | — | |
At March 31, 2017, for Federal income tax purposes, the following Funds have capital loss carryforwards available to offset future capital gains for an unlimited period. To the extent that these loss carryforwards are utilized, capital gains so offset will not be distributed to shareholders.
| Fund | | Short-Term
No Expiration | | | Long-Term
No Expiration | |
| Elkhorn S&P High Quality Preferred ETF | | $ | 21,469 | | | $ | — | |
27
| Notes to Financial Statements |
| March 31, 2017, continued |
At March 31, 2017, the effect of permanent book/tax reclassifications resulted in increase/(decrease) to the components of net assets were as follows:
| Fund | | Undistributed
Net Investment
Income (Loss) | | | Undistributed
Capital Gains
(Accumulated
Losses) | | | Paid-In
Capital | |
| Elkhorn Commodity Rotation Strategy ETF | | $ | 10,123 | | | $ | 370,796 | | | $ | (380,919 | ) |
| Elkhorn Fundamental Commodity Strategy ETF | | | 15,033 | | | | 165,299 | | | | (180,332 | ) |
| Elkhorn S&P High Quality Preferred ETF | | | 17,423 | | | | (29,399 | ) | | | 11,976 | |
10. INDEMNIFICATION
In the normal course of business, the Funds enter into contracts that contain a variety of representations and warranties which provide general indemnities. The Fund’s maximum exposure under these arrangements is unknown, as this would involve future claims that may be made against the Funds that have not yet occurred. However, based on industry experience, the Funds expect this risk of loss due to these warranties and indemnities to be remote.
11. PRINCIPAL RISKS
In the normal course of business, each Fund makes investments in financial instruments where the risk of potential loss exists due to changes in the market. The following is a description of select risks of investing in the Funds.
Index Risk. The Elkhorn S&P 500 High Quality Preferred ETF is not actively managed. The Funds invest in securities included in or representative of its Index regardless of their investment merit. Therefore, the Funds would not necessarily buy or sell a security unless that security is added or removed, respectively, from the Index, even if that security generally is under performing.
Non-Diversified Risk. Because the Funds are non-diversified and can invest a greater portion of their assets in securities of individual issuers than diversified funds, changes in the market value of a single investment could cause greater fluctuations in share price than would a diversified fund.
The Funds’ prospectus contains additional information regarding risks associated with investments in the Funds.
12. NEW ACCOUNTING PRONOUNCEMENT
On October 13, 2016 the Securities and Exchange Commission amended existing rules intended to modernize reporting and disclosure of information. These amendments relate to Regulation S-X which sets forth the form and content of financial statements. At this time, management is evaluating the implications of adopting these amendments and their impact on the financial statements and accompanying notes.
13. SUBSEQUENT EVENT
Management has evaluated the impact of all subsequent events on the Funds through the date the financial statements were issued, and has determined that there were no subsequent events requiring recognition or disclosure in the financial statements.
28
| Report of Independent Registered Public Accounting Firm |
Board of Trustees and Shareholders
Elkhorn ETF Trust
We have audited the accompanying consolidated statements of assets and liabilities of Elkhorn Commodity Rotation Strategy ETF and subsidiary, Elkhorn Fundamental Commodity Strategy ETF and subsidiary, and Elkhorn S&P High Quality Preferred ETF (collectively, the “Funds”) (three of the funds constituting the Elkhorn ETF Trust), including the consolidated schedules of investments, as of March 31, 2017, and the related consolidated statements of operations, changes in net assets, and financial highlights for the period from September 20, 2016 (commencement of operations) through March 31, 2017, for the Elkhorn Commodity Rotation Strategy ETF and subsidiary and Elkhorn Fundamental Commodity Strategy ETF and subsidiary, and for the period from May 23, 2016 (commencement of operations) through March 31, 2017, for the Elkhorn S&P High Quality Preferred ETF. These consolidated financial statements and financial highlights are the responsibility of the Funds’ management. Our responsibility is to express an opinion on these consolidated financial statements and financial highlights based on our audits.
We conducted our audits in accordance with the standards of the Public Company Accounting Oversight Board (United States). Those standards require that we plan and perform the audits to obtain reasonable assurance about whether the consolidated financial statements and financial highlights are free of material misstatement. We were not engaged to perform an audit of the Fund’s internal control over financial reporting. Our audits included consideration of internal control over financial reporting as a basis for designing audit procedures that are appropriate in the circumstances, but not for the purpose of expressing an opinion on the effectiveness of the Fund’s internal control over financial reporting. Accordingly, we express no such opinion. An audit includes examining, on a test basis, evidence supporting the amounts and disclosures in the consolidated financial statements. Our procedures included confirmation of securities owned as of March 31, 2017, by correspondence with the custodian and broker. An audit also includes assessing the accounting principles used and significant estimates made by management, as well as evaluating the overall consolidated financial statement presentation. We believe that our audits provide a reasonable basis for our opinion.
In our opinion, the consolidated financial statements and financial highlights referred to above present fairly, in all material respects, the financial position of Elkhorn Commodity Rotation Strategy ETF and subsidiary, Elkhorn Fundamental Commodity Strategy ETF and subsidiary, and Elkhorn S&P High Quality Preferred ETF as of March 31, 2017, and the results of their operations, the changes in their net assets, and their financial highlights for the period from September 20, 2016 (commencement of operations) through March 31, 2017, for the Elkhorn Commodity Rotation Strategy ETF and subsidiary and Elkhorn Fundamental Commodity Strategy ETF and subsidiary, and for the period from May 23, 2016 (commencement of operations) through March 31, 2017, for the Elkhorn S&P High Quality Preferred ETF, in conformity with accounting principles generally accepted in the United States of America.
/s/ GRANT THORNTON LLP
Chicago, Illinois
May 30, 2017
29
Trustees and Officers (unaudited) |
Name, Address,
Year of Birth | Position(s) Held
with Trust | Length of
Time Served | Principal Occupation
During Past 5 Years | Number of Funds
in Fund Complex
Overseen by
Trustee | Other
Directorships
Held by Trustee During Past 5 Years |
| Independent Trustees |
Bruce Howard YOB: 1952 | Trustee | Since 2015 | Advisory Board Member, Performance Trust Capital Partners LLC, 2009-present; Director/Tax Consultant, Tyndale House Publishers Inc., 1980-present; Professor of Business & Economics, Wheaton College, 1980-present | 13 | None |
Gregory D. Bunch YOB: 1958 | Trustee | Since 2015 | Adjunct Professor of Entrepreneurship, University of Chicago, 2009-present; President, Masterplan International Corporation, 1998-present; Co-Founder, Oration, 2012-2013 | 13 | None |
Jeffrey P. Helton YOB: 1959 | Trustee | Since 2015 | Pastor, The People’s Church, 2012-2015; Executive/Life Coach, WellSpring Coaching, 2010-present | 13 | None |
| Interested Trustee* |
Benjamin T. Fulton YOB: 1961 | Trustee and President of the Trust | Trustee and President since 2015 | Chief Executive Officer and President, Elkhorn Investments, LLC, 2013-present; Managing Director, Invesco PowerShares Capital Management LLC, 2005-2013 | 13 | None |
| * | Mr. Fulton is an ‘‘interested person,’’ as defined by the Investment Company Act of 1940, as amended, because of his employment within Elkhorn. |
Name, Address,
Year of Birth | Position(s) Held
with Trust | Length of
Time Served | Principal Occupation
During Past 5 Years |
| Officers |
Graham Day YOB: 1986 | Vice President and Assistant Secretary | Since 2015 | SVP- Head of Products & Research, Elkhorn Investments, LLC, 2016-present; Director of Product Development, Elkhorn Investments, LLC, 2014-2016; Senior Strategist (2013-2014), Product Manager (2011-2013), Research Analyst (2009-2011), Invesco PowerShares Capital Management LLC |
Philip L. Ziesemer YOB: 1963 | Principal Financial Officer and Secretary | Since 2015 | Chief Financial Officer, Elkhorn Investments, LLC, 2013-present; Chief Financial Officer, Renegade Holdings, 2009-2013 |
Melanie H. Zimdars YOB: 1976 | Chief Compliance Officer | Since 2015 | Vice President and Deputy Chief Compliance Officer, ALPS Fund Services, 2009-present |
The Funds’ SAI provide additional information about the Funds’ Directors and is available, without charge by calling 630-355-4676 or visiting www.elkhorn.com.
30
Board Considerations Regarding Approval of Investment Management Agreement (unaudited) |
Board Considerations Regarding Approval of Investment Management Agreement for
Elkhorn S&P High Quality Preferred ETF
At a meeting held on March 8, 2017, the Board of Trustees of Elkhorn ETF Trust (the “Trust”), including the Independent Board Members, approved the Investment Management Agreement (the “Agreement”) between Elkhorn Investments, LLC (the “Adviser”) and the Trust for Elkhorn S&P High Quality Preferred ETF (the “Fund”).
The Adviser provided information describing: (i) the nature, extent and quality of services to be provided, (ii) the costs of services to be provided and estimated profits to be realized by the Adviser, (iii) the extent to which economies of scale may be realized by the Adviser as the Fund grows, (iv) whether the fee levels reflect any possible economies of scale for the benefit of each Fund’s shareholders, (v) comparisons of services rendered to and amounts paid by other registered investment companies and (vi) any benefits to be realized by the Adviser from its relationship with the Fund. Based on all of the information considered and the conclusions reached, the Trustees, including the Independent Board Members, determined to approve the Agreement for the Fund. No single factor was determinative in the Board’s analysis.
Nature, Extent and Quality of Services. In evaluating the nature, extent and quality of the Adviser’s services, the Trustees considered information concerning the functions to be performed by the Adviser for the Fund and the personnel and resources of the Adviser, including the investment management team that will be responsible for the day-to-day management of the Fund. The Trustees also considered that the Adviser secured a license with respect to the index that the Fund track and considered the performance history of the indexes as well as benchmark indexes. The Trustees considered the information from the Adviser regarding its financial condition that it was sufficiently stable to support its performance of the services under the Agreement. The Trustees also considered the services provided by the Adviser in its oversight of the Fund’s service providers.
Based on their review, the Trustees concluded that the nature, extent and quality of the services to be provided by the Adviser to the Fund under the Agreement were expected to be appropriate and reasonable.
Fees, Expenses and Profitability. The Trustees discussed the information provided by the Adviser on the Fund’s investment management fee as compared to information provided by the Adviser on other similar products. The Trustees noted that the annual investment management fee charged to the Fund was a unitary fee, and that the Adviser has agreed to pay all other expenses of the Fund except brokerage commissions and other expenses connected with the execution of portfolio transactions, taxes, interest, distribution and service fees payable pursuant to a Rule 12b-1 Plan, if any, and extraordinary expenses. The Trustees also compared the Fund’s proposed unitary advisory fee against the median and average expense ratios of its ETF peer group and noted that the Fund had an expense ratio below the median expense ratios for its ETF classification and ETF peer group. The Board concluded that the unitary investment management fee to be charged to each Fund is reasonable and appropriate in light of the services expected to be provided by the Adviser.
In conjunction with their review of the unitary investment management fees, the Trustees considered information provided by the Adviser on its costs incurred in connection with the Agreement and profitability. The Trustees reviewed the Adviser’s most recent balance sheet, statement of operations and statement of cash flows for various periods ended December 31, 2016 and the Fund’s statement of operations for the period from January 1, 2016 through December 31, 2016. They noted that the Adviser had incurred a net loss with respect to the Fund for the period from January 1, 2016 through December 31, 2016 and considered the Adviser’s statement that it would likely lose money in the first two years of operating the Fund.
Economies of Scale and Whether the Fee Levels Reflect These Economies of Scale. The Trustees considered the information provided by the Adviser as to the extent to which economies of scale would be realized as the Fund grew and whether the fee levels would reflect economies of scale for the benefit of shareholders. The Trustees noted that any reduction in fixed costs associated with the management of the Fund would be enjoyed by the Adviser, but that a unitary fee provides a level of certainty in expenses for each Fund. The Trustees considered whether the advisory fee rate for each Fund was reasonable in relation to the asset size of each Fund. The Trustees concluded that the flat investment management fee for the Fund was reasonable and appropriate.
The Trustees noted that the Adviser had not identified any further benefits that it would derive from its relationship with the Fund, and had noted that it will not, initially, have any soft-dollar arrangements.
Based on all of the information considered and the conclusions reached, the Board, including the Independent Trustees, determined to approve the Agreement for the Fund.
31
Supplemental Information (unaudited) |
Investors should consider the investment objective and policies, risk considerations, charges and ongoing expenses of an investment carefully before investing. The prospectus contains this and other information relevant to an investment in the Fund. Please read the prospectus carefully before investing. A copy of the Prospectus may be obtained without charge by writing to the Distributor, or by calling 630-355-4676 or visiting www.elkhorn.com.
QUARTERLY PORTFOLIO HOLDING INFORMATION
The Trust is required to disclose, after its first and third fiscal quarters, the complete schedule of the Fund’s portfolio holdings with the Securities and Exchange Commission (“SEC”) on Form N-Q. Form N-Q for the Trust is available on the SEC’s website at http://www.sec.gov. The Fund’s Form N-Q may also be reviewed and copied at the SEC’s Public Reference Room in Washington, D.C. and information on the operation of the Public Reference Room may be obtained by calling 1-800-SEC-0330. The Trust’s Forms N-Q are available without charge, upon request, by calling 1-844-355-3837 or by writing to Elkhorn ETF Trust, 207 Reber Street, Suite 201, Wheaton, Illinois 60187.
PROXY VOTING INFORMATION
A description of the Fund’s proxy voting policies and procedures, as well as a record of how the Fund voted proxies during the most recent 12-month period ended June 30, is available without charge upon request by calling 312-219-6285. This information is also available on the SEC’s website at www.sec.gov.
DELIVERY OF SHAREHOLDER DOCUMENTS – HOUSEHOLDING
To reduce expenses, we may only mail one copy of the Fund’s shareholder updates, such as prospectus, annual report, semi-annual report, to those addresses shared by two or more accounts. If you are a direct shareholder and wish to receive individual copies of these documents, please call us at 630-384-8700. If you are not a direct shareholder, please contact your financial institution to opt out of house holding. We will begin sending you individual copies thirty days after receiving your request.
TAX INFORMATION
For the fiscal period ended March 31, 2017, the Funds make the following disclosures for federal income tax purposes. Below is listed the percentages, or the maximum amount allowable, of its ordinary income dividends (“QDI”) to qualify for the lower tax rates applicable to individual shareholders, and the percentage of ordinary income dividends earned by each Fund which qualifies for the dividends received deduction (“DRD”) for corporate shareholders. The actual percentage of QDI and DRD for the calendar year will be designated in year-end tax statements.
| | Qualified
Dividend Income* | Dividends
Received Deduction* |
| Elkhorn Commodity Rotation Strategy ETF | 0% | 0% |
| Elkhorn Fundamental Commodity Strategy ETF | 0% | 0% |
| Elkhorn S&P High Quality Preferred ETF | 70.90% | 38.37% |
| * | The above percentage is based on ordinary income dividends paid to shareholders during each Fund’s fiscal year. |
FREQUENCY DISTRIBUTION OF PREMIUM AND DISCOUNT
The tables below present information about the differences between the daily market trading prices for shares of each Fund and a Fund’s net asset value (“NAV”). Each Fund’s market price is based on the midpoint between the highest bid and the lowest offer on the stock exchange on which the shares of a Fund are listed for trading, as of the close of trading. Shares of each Fund will trade at market prices rather than NAV. The share may trade at prices greater than NAV (at a premium), at NAV, or less than NAV (at a discount).
The NAV of each Fund will generally fluctuate with changes in the market value of each Fund’s holdings. The market prices of shares will generally fluctuate in accordance with changes in NAV as well as the relative supply of and demand for shares. Premiums or discounts are the differences (expressed as a percentage) between the NAV and market price of each Fund.
32
Supplemental Information (unaudited) |
The following information in the tables below shows the frequency distributions of premium and discount for each Fund for the period from commencement of trading on secondary market of each Fund to March 31, 2017.
Each line in the tables shows the number of trading days in which each Fund traded within the premium/discount range indicated. All data presented here represents past performance, which cannot be used to predict future results.
Elkhorn Commodity Rotation Strategy ETF
September 21, 2016* – March 31, 2017 | Basis Point
Differential | Market Price
Above or
Equal to NAV
Number of Days | Market Price
Below NAV
Number of Days |
| | 0-24.99 | 38 | 35 |
| | 25-49.9 | 18 | 17 |
| | 50-99.9 | 11 | 6 |
| | 100-149.9 | 3 | 2 |
| | 150-199.9 | 1 | 0 |
| | >200 | 2 | 0 |
Elkhorn Fundamental Commodity Strategy ETF
September 21, 2016* – March 31, 2017 | Basis Point
Differential | Market Price
Above or
Equal to NAV
Number of Days | Market Price
Below NAV
Number of Days |
| | 0-24.99 | 40 | 49 |
| | 25-49.9 | 25 | 4 |
| | 50-99.9 | 11 | 2 |
| | 100-149.9 | 0 | 0 |
| | 150-199.9 | 1 | 0 |
| | >200 | 1 | 0 |
Elkhorn Fundamental Commodity Strategy ETF
May 24, 2016* – March 31, 2017 | Basis Point
Differential | Market Price
Above or
Equal to NAV
Number of Days | Market Price
Below NAV
Number of Days |
| | 0-24.99 | 137 | 56 |
| | 25-49.9 | 13 | 4 |
| | 50-99.9 | 2 | 3 |
| | 100-149.9 | 0 | 0 |
| | 150-199.9 | 1 | 0 |
| | >200 | 0 | 0 |
| * | Commencement of trading on secondary market. |
33
INVESTMENT ADVISOR
Elkhorn Investments, LLC
207 Reber Street, Suite 201
Wheaton, IL 60187
DISTRIBUTOR
ALPS Distributors, Inc.
1290 Broadway, Suite 1100
Denver, Colorado 80203
ADMINISTRATOR, CUSTODIAN,
FUND ACCOUNTANT & TRANSFER AGENT
The Bank of New York Mellon
101 Barclay Street
New York, NY 10286
INDEPENDENT REGISTERED PUBLIC ACCOUNTING FIRM
Grant Thornton LLP
171 North Clark Street
Chicago, Illinois 60601
LEGAL COUNSEL
Chapman and Cutler LLP
111 West Monroe Street
Chicago, Illinois 60603
Item 2. Code of Ethics.
| (a) | The registrant, as of the end of the period covered by this report, has adopted a code of ethics that applies to the registrant’s principal executive officer, principal financial officer, principal accounting officer or controller, or persons performing similar functions, regardless of whether these individuals are employed by the registrant or a third party. |
| (c) | There have been no amendments, during the period covered by this report, to a provision of the code of ethics that applies to the registrant’s principal executive officer, principal financial officer, principal accounting officer or controller, or persons performing similar functions, regardless of whether these individuals are employed by the registrant or a third party, and that relates to any element of the code of ethics description. |
| (d) | The registrant has not granted any waivers, including an implicit waiver, from a provision of the code of ethics that applies to the registrant’s principal executive officer, principal financial officer, principal accounting officer or controller, or persons performing similar functions, regardless of whether these individuals are employed by the registrant or a third party, that relates to one or more of the items set forth in paragraph (b) of this item’s instructions. |
Item 3. Audit Committee Financial Expert.
As of the end of the period covered by the report, the registrant’s board of trustees has determined that Bruce Howard is qualified to serve as an audit committee financial expert serving on its audit committee and that he is “independent,” as defined by Item 3 of Form N-CSR.
Item 4. Principal Accountant Fees and Services.
Audit Fees
| (a) | The aggregate fees billed for each of the last two fiscal years for professional services rendered by the principal accountant for the audit of the registrant's annual financial statements or services that are normally provided by the accountant in connection with statutory and regulatory filings or engagements for those fiscal years are $0 for 2016 and $69,300 for 2017. |
Audit-Related Fees
| (b) | The aggregate fees billed in each of the last two fiscal years for assurance and related services by the principal accountant that are reasonably related to the performance of the audit of the registrant's financial statements and are not reported under paragraph (a) of this Item are $0 for 2016 and $0 for 2017. |
Tax Fees
| (c) | The aggregate fees billed in each of the last two fiscal years for professional services rendered by the principal accountant for tax compliance, tax advice, and tax planning are $0 for 2016 and $3,928 for 2017. |
All Other Fees
| (d) | The aggregate fees billed in each of the last two fiscal years for products and services provided by the principal accountant, other than the services reported in paragraphs (a) through (c) of this Item are $0 for 2016 and $0 for 2017. |
| (e)(1) | Disclose the audit committee's pre-approval policies and procedures described in paragraph (c)(7) of Rule 2-01 of Regulation S-X. |
The Trust’s Audit Committee shall pre-approve all audit and permitted non-audit services provided by a fund’s independent registered public accounting firm relating to the operations or financial reporting of the fund. Prior to the commencement of any audit or non-audit services to a fund, the Audit Committee reviews the services to determine whether they are appropriate and permissible under applicable law.
The Audit Committee has adopted policies and procedures to, among other purposes, provide a framework for the Committee’s consideration of non-audit services by the audit firms that audit the funds. The policies and procedures require that any non-audit service provided by a fund audit firm to an Elkhorn fund and any non-audit service provided by a fund auditor to a Fund Service Provider that relates directly to the operations and financial reporting of an Elkhorn fund (“Covered Service”) are subject to approval by the Audit Committee before such service is provided.
All Covered Services shall be approved in advance of provision of the service either: (i) by the Audit Committee, or (ii) by the Chair of the Audit Committee.
| (e)(2) | The percentage of services described in each of paragraphs (b) through (d) of this Item that were approved by the audit committee pursuant to paragraph (c)(7)(i)(C) of Rule 2-01 of Regulation S-X are as follows: |
(b) 100%
(c) 100%
(d) 100%
| (f) | The percentage of hours expended on the principal accountant's engagement to audit the registrant's financial statements for the most recent fiscal year that were attributed to work performed by persons other than the principal accountant's full-time, permanent employees was less than fifty percent. |
| (g) | The aggregate non-audit fees billed by the registrant's accountant for services rendered to the registrant, and rendered to the registrant's investment adviser (not including any sub-adviser whose role is primarily portfolio management and is subcontracted with or overseen by another investment adviser), and any entity controlling, controlled by, or under common control with the adviser that provides ongoing services to the registrant for each of the last two fiscal years of the registrant was $0 for 2016 and $0 for 2017. |
Item 5. Audit Committee of Listed registrants.
| (a) | The registrant has a separately designated audit committee consisting of all the independent directors of the registrant. The members of the audit committee are: Bruce Howard, Greg Bunch, and Jeff Helton. |
Item 6. Investments.
| (a) | Schedule of Investments in securities of unaffiliated issuers as of the close of the reporting period is included as part of the report to shareholders filed under Item 1 of this form. |
Item 7. Disclosure of Proxy Voting Policies and Procedures for Closed-End Management Investment Companies.
Not applicable.
Item 8. Portfolio Managers of Closed-End Management Investment Companies.
Not applicable.
Item 9. Purchases of Equity Securities by Closed-End Management Investment Company and Affiliated Purchasers.
Not applicable.
Item 10. Submission of Matters to a Vote of Security Holders.
There have been no material changes to the procedures by which the shareholders may recommend nominees to the registrant’s board of directors, where those changes were implemented after the registrant last provided disclosure in response to the requirements of Item 407(c)(2)(iv) of Regulation S-K (17 CFR 229.407) (as required by Item 22(b)(15) of Schedule 14A (17 CFR 240.14a-101)), or this Item.
Item 11. Controls and Procedures.
| (a) | The registrant’s principal executive and principal financial officers, or persons performing similar functions, have concluded that the registrant’s disclosure controls and procedures (as defined in Rule 30a-3(c) under the Investment Company Act of 1940, as amended (the “1940 Act”) (17 CFR 270.30a-3(c))) are effective, as of a date within 90 days of the filing date of the report that includes the disclosure required by this paragraph, based on their evaluation of these controls and procedures required by Rule 30a-3(b) under the 1940 Act (17 CFR 270.30a-3(b)) and Rules 13a-15(b) or 15d-15(b) under the Securities Exchange Act of 1934, as amended (17 CFR 240.13a-15(b) or 240.15d-15(b)). |
| (b) | There were no changes in the registrant’s internal control over financial reporting (as defined in Rule 30a-3(d) under the 1940 Act (17 CFR 270.30a-3(d))) that occurred during the registrant’s second fiscal quarter of the period covered by this report that has materially affected, or is reasonably likely to materially affect, the registrant’s internal control over financial reporting. |
Item 12. Exhibits.
| (a)(1) | Code of ethics, or any amendment thereto, that is the subject of disclosure required by Item 2 is attached hereto. |
| (a)(2) | Certifications pursuant to Rule 30a-2(a) under the 1940 Act and Section 302 of the Sarbanes-Oxley Act of 2002 are attached hereto. |
| (c) | Certifications pursuant to Rule 30a-2(b) under the 1940 Act and Section 906 of the Sarbanes-Oxley Act of 2002 are attached hereto. |
SIGNATURES
Pursuant to the requirements of the Securities Exchange Act of 1934 and the Investment Company Act of 1940, the registrant has duly caused this report to be signed on its behalf by the undersigned, thereunto duly authorized.
| (Registrant) | Elkhorn ETF Trust | |
| | | |
| By (Signature and Title)* | /s/ Benjamin T. Fulton | |
| | Benjamin T. Fulton, President and Chief Executive Officer |
| | (principal executive officer) |
| | | |
| Date | 6/07/2017 | |
Pursuant to the requirements of the Securities Exchange Act of 1934 and the Investment Company Act of 1940, this report has been signed below by the following persons on behalf of the registrant and in the capacities and on the dates indicated.
| By (Signature and Title)* | /s/ Benjamin T. Fulton | |
| | Benjamin T. Fulton, President and Chief Executive Officer |
| | (principal executive officer) | |
| | | |
| Date | 6/07/2017 | |
| | | |
| By (Signature and Title)* | /s/ Philip L. Ziesemer | |
| | Philip L. Ziesemer, Chief Financial Officer |
| | (principal financial officer) | |
| | | |
| Date | 6/07/2017 | |
* | Print the name and title of each signing officer under his or her signature. |