UNITED STATES
SECURITIES AND EXCHANGE COMMISSION
Washington, D.C. 20549
FORM N-CSR
CERTIFIED SHAREHOLDER REPORT OF REGISTERED MANAGEMENT INVESTMENT COMPANIES
Investment Company Act file number 811-22926
| Innovator ETFs Trust II (formerly, Elkhorn ETF Trust) |
| (Exact name of registrant as specified in charter) |
| 120 N Hale Street, Suite 200 |
| Wheaton, IL 60187 |
| (Address of principal executive offices) (Zip code) |
| |
Bruce Bond Innovator ETFs Trust II (formerly, Elkhorn ETF Trust)
120 N Hale Street, Suite 200
Wheaton, IL 60187 |
| (Name and address of agent for service) |
Copy to:
Morrison C. Warren, Esq.
Chapman and Cutler LLP
111 West Monroe Street
Chicago, IL 60603
Registrant's telephone number, including area code: (630) 355-4676
Date of fiscal year end: September 30
Date of reporting period: September 30, 2018
Form N-CSR is to be used by management investment companies to file reports with the Commission not later than 10 days after the transmission to stockholders of any report that is required to be transmitted to stockholders under Rule 30e-1 under the Investment Company Act of 1940 (17 CFR 270.30e-1). The Commission may use the information provided on Form N-CSR in its regulatory, disclosure review, inspection, and policymaking roles.
A registrant is required to disclose the information specified by Form N-CSR, and the Commission will make this information public. A registrant is not required to respond to the collection of information contained in Form N-CSR unless the Form displays a currently valid Office of Management and Budget ("OMB") control number. Please direct comments concerning the accuracy of the information collection burden estimate and any suggestions for reducing the burden to Secretary, Securities and Exchange Commission, 450 Fifth Street, NW, Washington, DC 20549-0609. The OMB has reviewed this collection of information under the clearance requirements of 44 U.S.C. § 3507.
Item 1. Reports to Stockholders.
The Report to Shareholders is attached herewith.
TABLE OF CONTENTS
Letter to Shareholders. | 1 |
Management’s Discussion of Fund Performance. | 2 |
Shareholder Expense Example. | 4 |
Schedule of Investments | 6 |
Statement of Assets and Liabilities | 11 |
Statement of Operations | 12 |
Statement of Changes in Net Assets | 13 |
Financial Highlights | 14 |
Notes to Financial Statements | 15 |
Report of Independent Registered Public Accounting Firm | 26 |
Trustees and Officers | 28 |
Board Considerations regarding Approval of Investment Management Agreement | 31 |
Supplemental Information | 33 |
Letter to Shareholders (Unaudited)
Dear Shareholders,
Thank you for your continued support of the Innovator Lunt Low Vol/High Beta Tactical ETF. The following shareholder letter covers the one-year period ended September 30, 2018. The ETF struggled during the period, unable to identify a steady trend in either high beta or low volatility stocks. We believe, however, there is reason for optimism looking to the strategy’s more than six year live track record as well as the recent widening in performance between high beta and low volatility stocks as tailwinds. Historically, there has been a wide dispersion between these two factors that may be captured through the tactical rotation found in the ETF. The tax-efficient nature of the ETF structure is exemplified through the implementation of this high-turnover strategy into the ETF wrapper.
Sincerely,
Bruce Bond
Chief Executive Officer
MANAGEMENT’S DISCUSSION OF FUND PERFORMANCE (Unaudited)
Innovator Lunt Low Vol/High Beta Tactical ETF
The Lunt Low Vol/High Beta Tactical ETF (LVHB) is the first of its kind ETF to rotate between low-volatility and high beta stocks utilizing a risk-adjusted relative strength index methodology developed by Lunt Capital.
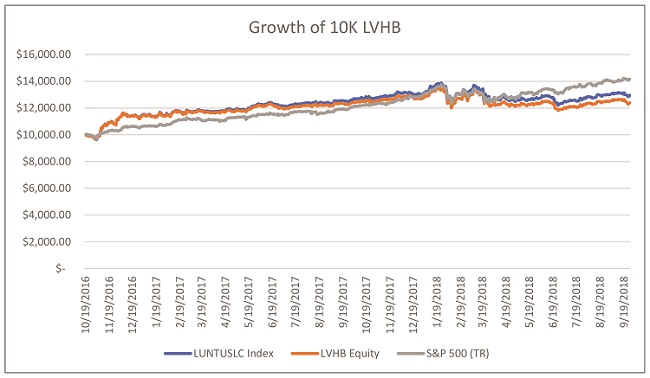
For the one year period ended September 30, 2018 the Innovator Lunt Low Vol/High Beta Tactical ETF had a total return of 2.55% compared to a 17.91% return for the S&P 500 Total Return Index over the same period. Much of the underperformance can be attributed to the second quarter of 2018 when the Fund was in low-volatility then high-beta stocks at inopportune times. Low dispersion between low volatility and high beta stocks created a challenging environment for this relative strength based strategy. At a sector level, the Fund's allocation to utilities was the largest detractor of performance followed by poor stock selection within information technology. The top contributor to relative performance was stock selection within the communication services sector.
Average Annual Total Returns As of September 30, 2018 | |
| | | 1 Year | | | Inception* | |
Innovator Lunt Low Vol/High Beta Tactical ETF (NAV) | | | 2.55 | % | | | 13.54 | % |
Innovator Lunt Low Vol/High Beta Tactical ETF (Market Price) | | | 2.46 | % | | | 13.38 | % |
Lunt Capital US Large Cap Equity Rotation Index | | | 3.38 | % | | | 14.39 | % |
S&P 500 Stock Index | | | 17.91 | % | | | 19.50 | % |
* Commenced operations on 10/19/2016
Performance quoted represents past performance, which is no guarantee of future results. Investment returns and principal value will fluctuate, so you may have a gain or loss when shares are sold. Current performance may be higher or lower than that quoted. Visit innovatoretfs.com/LVHB for current month-end performance.
The Lunt Capital US Large Cap Equity Rotation Index is designed to tactically rotate between low-volatility and high-beta stocks in the S&P 500. The S&P 500 Index measures the value of stocks of the 500 largest corporations by market capitalization.
An index is a statistical measure of a specified financial market or sector. An index does not actually hold a portfolio of securities therefore does not incur expenses incurred by the Fund. The index returns do not reflect deductions for fees or expenses. In comparison, the Fund’s performance is negatively impacted by these fees and expenses. One cannot invest directly in an index.
MANAGEMENT’S DISCUSSION OF FUND PERFORMANCE (Unaudited), (Continued)
The net asset value (“NAV”) is calculated by dividing the net assets by the number of shares outstanding. The price used to calculate the market price returns is determined by using the midpoint bid/ask of the closing price listed on the primary stock exchange on which shares of the Fund are listed for trading and does not represent returns an investor would receive if shares were traded at other times.
The returns for the Fund reflect the reinvestment of dividends and capital gains, if any, and are reported after the deduction of all expenses. These returns do not, however, reflect the deduction of taxes that a shareholder would pay on Fund distributions or upon redemption of Fund shares. Market returns do not reflect brokerage commissions that may be payable on secondary market transactions.
Hypothetical growth of a $10,000 Investment
For the period 10/19/2016 (Commencement of operations) to 9/30/2018
Growth of a $10,000 Investment since Inception
Innovator Lunt Low Vol/High Beta Tactical (1)
Lunt Capital US Large Cap Equity Rotation Index
S&P 500 Stock Index
(1) Based on NAV
Shareholder Expense Example
September 30, 2018 (Unaudited)
As a shareholder of the Fund you incur two types of costs: (1) transaction costs for purchasing and selling shares; and (2) ongoing costs, including management fees and other fund expenses. The following examples are intended to help you understand your ongoing costs (in dollars and cents) of investing in the Fund and to compare these costs with the ongoing costs of investing in other funds.
The expense examples are based on an investment of $1,000 invested at the beginning of the period and held for the entire period (April 1, 2018 through September 30, 2018).
ACTUAL EXPENSES
The first line under the Fund in the table below provides information about actual account values and actual expenses. You may use the information in this line, together with the amount you invested, to estimate the expenses that you paid over the period. Simply divide your account value by $1,000 (for example, an $8,600 account value divided by $1,000 = 8.6), then multiply the result by the number in the first line for the Fund under the heading entitled “Expenses Paid During Period” to estimate the expenses you paid on your account during this period.
HYPOTHETICAL EXAMPLE FOR COMPARISON PURPOSES
The second line under the Fund in the table provides information about hypothetical account values and hypothetical expenses based on the Fund’s actual expense ratio and an assumed rate of return of 5% per year before expenses, which is not the Fund’s actual return. The hypothetical account values and expenses may not be used to estimate the actual ending account balance or expenses you paid for the period. You may use this information to compare the ongoing costs of investing in the Fund and other funds. To do so, compare this 5% hypothetical example with the 5% hypothetical examples that appear in the shareholder reports of the other funds. Please note that the expenses shown in the table are meant to highlight your ongoing costs only and do not reflect any transactional costs, such as brokerage commissions paid on purchases and sales of Fund shares. Therefore, the second line under the Fund in the table is useful in comparing ongoing Fund costs only and will not help you determine the relative total costs of owning different funds. In addition, if these transactional costs were included, your costs would have been higher.
Shareholder Expense Example
September 30, 2018 (Unaudited), (Continued)
| | | Beginning Account Value 4/1/2018 | | | Ending Account Value 9/30/2018 | | | Annualized Expense Ratio for the Period | | | Expenses Paid During Period 4/1/2018– 9/30/20181 | |
Innovator Lunt Low Vol/High Beta Tactical ETF | | | | | | | | | | | | | | | | |
Actual | | $ | 1,000.00 | | | $ | 1,002.30 | | | $ | 0.49 | % | | | 2.46 | |
Hypothetical (5% return before expenses) | | $ | 1,000.00 | | | $ | 1,022.61 | | | $ | 0.49 | % | | | 2.48 | |
1 | Expenses are equal to the Fund’s annualized expense ratio, multiplied by the average account value over the period, multiplied by 183/365 (to reflect the one-half year period). |
INNOVATOR LUNT LOW VOL/HIGH BETA TACTICAL ETF
Schedule of Investments
September 30, 2018
Investments | | Shares | | | Value | |
COMMON STOCKS—99.6% | | | | | | | | |
Banks—1.8% | |
People's United Financial, Inc. | | | 81,691 | | | $ | 1,398,550 | |
US Bancorp | | | 29,488 | | | | 1,557,261 | |
Total Banks | | | | | | | 2,955,811 | |
Beverages—3.4% | | | | | | | | |
Coca-Cola Co. (The) | | | 44,881 | | | | 2,073,054 | |
Constellation Brands, Inc., Class A | | | 7,781 | | | | 1,677,739 | |
PepsiCo, Inc. | | | 15,620 | | | | 1,746,316 | |
Total Beverages | | | | | | | 5,497,109 | |
Capital Markets—2.7% | | | | | | | | |
CME Group, Inc. | | | 8,819 | | | | 1,501,082 | |
Moody's Corp. | | | 8,453 | | | | 1,413,341 | |
Nasdaq, Inc. | | | 17,106 | | | | 1,467,695 | |
Total Capital Markets | | | | | | | 4,382,118 | |
Chemicals—3.1% | | | | | | | | |
Air Products & Chemicals, Inc. | | | 9,905 | | | | 1,654,630 | |
Ecolab, Inc. | | | 12,530 | | | | 1,964,454 | |
PPG Industries, Inc. | | | 13,410 | | | | 1,463,433 | |
Total Chemicals | | | | | | | 5,082,517 | |
Commercial Services & Supplies—2.0% | | | | | | | | |
Republic Services, Inc. | | | 23,519 | | | | 1,708,891 | |
Waste Management, Inc. | | | 17,539 | | | | 1,584,824 | |
Total Commercial Services & Supplies | | | | | | | 3,293,715 | |
Communications Equipment—1.0% | | | | | | | | |
Motorola Solutions, Inc. | | | 12,224 | | | | 1,590,831 | |
Containers & Packaging—1.9% | | | | | | | | |
Ball Corp. | | | 36,024 | | | | 1,584,696 | |
Sealed Air Corp. | | | 37,618 | | | | 1,510,362 | |
Total Containers & Packaging | | | | | | | 3,095,058 | |
Diversified Financial Services—0.9% | | | | | | | | |
Berkshire Hathaway, Inc., Class B* | | | 6,980 | | | | 1,494,488 | |
Electric Utilities—12.4% | | | | | | | | |
Alliant Energy Corp. | | | 39,831 | | | | 1,695,606 | |
American Electric Power Co., Inc. | | | 25,082 | | | | 1,777,812 | |
Duke Energy Corp. | | | 23,196 | | | | 1,856,144 | |
Entergy Corp. | | | 19,105 | | | | 1,549,989 | |
Evergy, Inc. | | | 28,588 | | | | 1,570,053 | |
Eversource Energy | | | 26,342 | | | | 1,618,453 | |
Exelon Corp. | | | 42,130 | | | | 1,839,396 | |
NextEra Energy, Inc. | | | 10,369 | | | | 1,737,844 | |
The accompanying notes are an integral part of these financial statements.
INNOVATOR LUNT LOW VOL/HIGH BETA TACTICAL ETF
Schedule of Investments, Continued
September 30, 2018
Investments | | Shares | | | Value | |
Electric Utilities (continued) | |
Pinnacle West Capital Corp. | | | 20,608 | | | $ | 1,631,741 | |
PPL Corp. | | | 50,324 | | | | 1,472,480 | |
Southern Co. (The) | | | 36,837 | | | | 1,606,093 | |
Xcel Energy, Inc. | | | 37,295 | | | | 1,760,697 | |
Total Electric Utilities | | | | | | | 20,116,308 | |
Electrical Equipment—1.0% | | | | | | | | |
AMETEK, Inc. | | | 19,801 | | | | 1,566,655 | |
Electronic Equipment, Instruments & Components—1.8% | | | | | | | | |
Amphenol Corp., Class A | | | 17,222 | | | | 1,619,212 | |
TE Connectivity Ltd. | | | 15,658 | | | | 1,376,808 | |
Total Electronic Equipment, Instruments & Components | | | | | | | 2,996,020 | |
Equity Real Estate Investments—16.6% | | | | | | | | |
Alexandria Real Estate Equities, Inc. | | | 12,628 | | | | 1,588,476 | |
Apartment Investment & Management Co., Class A | | | 39,921 | | | | 1,761,714 | |
AvalonBay Communities, Inc. | | | 9,929 | | | | 1,798,638 | |
Boston Properties, Inc. | | | 11,598 | | | | 1,427,598 | |
Duke Realty Corp. | | | 54,385 | | | | 1,542,903 | |
Equity Residential | | | 25,966 | | | | 1,720,507 | |
Essex Property Trust, Inc. | | | 6,602 | | | | 1,628,779 | |
Federal Realty Investment Trust | | | 11,743 | | | | 1,485,137 | |
Mid-America Apartment Communities, Inc. | | | 15,762 | | | | 1,579,037 | |
Prologis, Inc. | | | 22,913 | | | | 1,553,272 | |
Public Storage | | | 7,327 | | | | 1,477,343 | |
Realty Income Corp. REIT | | | 28,465 | | | | 1,619,374 | |
Regency Centers Corp. | | | 23,115 | | | | 1,494,847 | |
SL Green Realty Corp. | | | 14,777 | | | | 1,441,201 | |
UDR, Inc. | | | 44,108 | | | | 1,783,287 | |
Vornado Realty Trust | | | 21,335 | | | | 1,557,455 | |
Weyerhaeuser Co. | | | 48,952 | | | | 1,579,681 | |
Total Equity Real Estate Investments | | | | | | | 27,039,249 | |
Food & Staples Retailing—1.0% | | | | | | | | |
Sysco Corp. | | | 21,371 | | | | 1,565,426 | |
Food Products—2.7% | | | | | | | | |
Archer-Daniels-Midland Co. | | | 30,528 | | | | 1,534,643 | |
Kraft Heinz Co. (The) | | | 24,453 | | | | 1,347,605 | |
Mondelez International, Inc., Class A | | | 34,121 | | | | 1,465,838 | |
Total Food Products | | | | | | | 4,348,086 | |
Health Care Equipment & Supplies—2.0% | | | | | | | | |
Baxter International, Inc. | | | 20,190 | | | | 1,556,447 | |
Danaher Corp. | | | 14,983 | | | | 1,628,053 | |
The accompanying notes are an integral part of these financial statements.
INNOVATOR LUNT LOW VOL/HIGH BETA TACTICAL ETF
Schedule of Investments, Continued
September 30, 2018
Investments | | Shares | | | Value | |
Health Care Equipment & Supplies (continued) | | | | | | | | |
Total Health Care Equipment & Supplies | | | | | | $ | 3,184,500 | |
Health Care Providers & Services—0.9% | | | | | | | | |
Laboratory Corp. of America Holdings* | | | 8,303 | | | | 1,442,065 | |
Hotels, Restaurants & Leisure—1.9% | | | | | | | | |
McDonald's Corp. | | | 9,298 | | | | 1,555,462 | |
Yum! Brands, Inc. | | | 17,556 | | | | 1,596,016 | |
Total Hotels, Restaurants & Leisure | | | | | | | 3,151,478 | |
Household Durables—1.0% | | | | | | | | |
Garmin Ltd. | | | 23,114 | | | | 1,619,136 | |
Household Products—2.2% | | | | | | | | |
Colgate-Palmolive Co. | | | 25,030 | | | | 1,675,758 | |
Procter & Gamble Co. (The) | | | 22,065 | | | | 1,836,470 | |
Total Household Products | | | | | | | 3,512,228 | |
Industrial Conglomerates—1.1% | | | | | | | | |
Honeywell International, Inc. | | | 11,029 | | | | 1,835,226 | |
| | | | | | | | |
Insurance—11.2% | | | | | | | | |
Aflac, Inc. | | | 36,430 | | | | 1,714,760 | |
Allstate Corp. (The) | | | 15,244 | | | | 1,504,583 | |
American International Group, Inc. | | | 28,538 | | | | 1,519,363 | |
Aon PLC | | | 11,917 | | | | 1,832,596 | |
Arthur J Gallagher & Co. | | | 22,972 | | | | 1,710,036 | |
Chubb Ltd. | | | 11,174 | | | | 1,493,293 | |
Loews Corp. | | | 33,819 | | | | 1,698,728 | |
Marsh & McLennan Cos., Inc. | | | 21,247 | | | | 1,757,552 | |
Progressive Corp. (The) | | | 23,105 | | | | 1,641,379 | |
Torchmark Corp. | | | 18,982 | | | | 1,645,550 | |
Willis Towers Watson PLC | | | 11,605 | | | | 1,635,609 | |
Total Insurance | | | | | | | 18,153,449 | |
IT Services—6.0% | | | | | | | | |
Broadridge Financial Solutions, Inc. | | | 12,023 | | | | 1,586,435 | |
Cognizant Technology Solutions Corp., Class A | | | 20,196 | | | | 1,558,122 | |
Fidelity National Information Services, Inc. | | | 16,002 | | | | 1,745,338 | |
Fiserv, Inc.* | | | 20,880 | | | | 1,720,094 | |
Paychex, Inc. | | | 21,187 | | | | 1,560,423 | |
Visa, Inc., Class A | | | 10,124 | | | | 1,519,511 | |
Total IT Services | | | | | | | 9,689,923 | |
Multi-Utilities—9.5% | | | | | | | | |
Ameren Corp. | | | 25,970 | | | | 1,641,823 | |
CenterPoint Energy, Inc. | | | 56,308 | | | | 1,556,916 | |
CMS Energy Corp. | | | 37,635 | | | | 1,844,115 | |
The accompanying notes are an integral part of these financial statements.
INNOVATOR LUNT LOW VOL/HIGH BETA TACTICAL ETF
Schedule of Investments, Continued
September 30, 2018
Investments | | Shares | | | Value | |
Multi-Utilities (continued) | | | | | | | | |
Consolidated Edison, Inc. | | | 23,234 | | | $ | 1,770,199 | |
Dominion Energy, Inc. | | | 24,277 | | | | 1,706,188 | |
DTE Energy Co. | | | 16,428 | | | | 1,792,788 | |
NiSource, Inc. | | | 62,147 | | | | 1,548,703 | |
Public Service Enterprise Group, Inc. | | | 34,446 | | | | 1,818,404 | |
WEC Energy Group, Inc. | | | 26,928 | | | | 1,797,713 | |
Total Multi-Utilities | | | | | | | 15,476,849 | |
Oil, Gas & Consumable Fuels—1.8% | | | | | | | | |
Exxon Mobil Corp. | | | 19,265 | | | | 1,637,911 | |
Phillips 66 | | | 11,742 | | | | 1,323,558 | |
Total Oil, Gas & Consumable Fuels | | | | | | | 2,961,469 | |
Pharmaceuticals—3.0% | | | | | | | | |
Eli Lilly & Co. | | | 14,073 | | | | 1,510,174 | |
Johnson & Johnson | | | 11,668 | | | | 1,612,167 | |
Pfizer, Inc. | | | 40,755 | | | | 1,796,073 | |
Total Pharmaceuticals | | | | | | | 4,918,414 | |
Professional Services—1.9% | | | | | | | | |
IHS Markit Ltd.* | | | 27,612 | | | | 1,489,943 | |
Verisk Analytics, Inc.* | | | 13,701 | | | | 1,651,656 | |
Total Professional Services | | | | | | | 3,141,599 | |
Real Estate Management & Development—0.8% | | | | | | | | |
CBRE Group, Inc., Class A* | | | 31,234 | | | | 1,377,419 | |
| | | | | | | | |
Software—1.9% | | | | | | | | |
Citrix Systems, Inc.* | | | 14,067 | | | | 1,563,687 | |
Synopsys, Inc.* | | | 15,634 | | | | 1,541,669 | |
Total Software | | | | | | | 3,105,356 | |
Specialty Retail—1.0% | | | | | | | | |
Home Depot, Inc. (The) | | | 7,440 | | | | 1,541,196 | |
| | | | | | | | |
Water Utilities—1.1% | | | | | | | | |
American Water Works Co., Inc. | | | 19,412 | | | | 1,707,674 | |
| | | | | | | | |
Total Investments—99.6% (Cost $158,071,730) | | | | | | $ | 161,841,372 | |
Other Assets in Excess of Liabilities—0.4% | | | | | | | 642,451 | |
Net Assets—100.0% | | | | | | $ | 162,483,823 | |
* Non-income producing security.
REIT – Real Estate Investment Trust
The accompanying notes are an integral part of these financial statements.
INNOVATOR LUNT LOW VOL/HIGH BETA TACTICAL ETF
Schedule of Investments, Continued
September 30, 2018
The following table summarizes valuation of the Fund's investments under the fair value hierarchy levels as of September 30, 2018:
| | Level 1 | | | Level 2 | | | Level 3 | | | Total | |
Asset Valuation Inputs | | | | | | | | | | | | | | | | |
Common Stocks | | $ | 161,841,372 | | | $ | – | | | $ | – | | | $ | 161,841,372 | |
Total | | $ | 161,841,372 | | | $ | – | | | $ | – | | | $ | 161,841,372 | |
For the year ended September 30, 2018, there were no transfers between any levels. As of September 30, 2018 there were no Level 3 investments held in the Fund.
SCHEDULE OF INVESTMENTS SUMMARY
As of September 30, 2018
Sector | | % of Total Investments | |
Consumer Discretionary | | | 3.9 | % |
Consumer Staples | | | 9.2 | |
Energy | | | 1.8 | |
Financials | | | 16.7 | |
Health Care | | | 5.9 | |
Industrials | | | 6.1 | |
Information Technology | | | 10.7 | |
Materials | | | 5.1 | |
Real Estate | | | 17.6 | |
Utilities | | | 23.0 | |
Total Investments | | | 100.0 | % |
The accompanying notes are an integral part of these financial statements.
INNOVATOR LUNT LOW VOL/HIGH BETA TACTICAL ETF
STATEMENT OF ASSETS AND LIABILITIES
September 30, 2018
ASSETS: | | | | |
Investments, at cost | | $ | 158,071,730 | |
Investments, at value | | $ | 161,841,372 | |
Cash | | | 291,954 | |
Receivables: | | | | |
Capital shares | | | 33,128,646 | |
Dividends | | | 200,233 | |
Total Assets | | | 195,462,205 | |
LIABILITIES: | | | | |
Payables: | | | | |
Securities Purchased In-Kind | | | 32,924,235 | |
Advisory fees | | | 54,147 | |
Total Liabilities | | | 32,978,382 | |
NET ASSETS | | $ | 162,483,823 | |
NET ASSETS CONSIST OF: | | | | |
Paid-in capital | | $ | 180,397,744 | |
Total distributable earnings (accumulated deficit) | | | (17,913,921 | ) |
NET ASSETS | | $ | 162,483,823 | |
Shares outstanding ($0.01 par value common stock, unlimited shares authorized) | | | 5,150,002 | |
Net asset value, per share | | $ | 31.55 | |
The accompanying notes are an integral part of these financial statements.
INNOVATOR LUNT LOW VOL/HIGH BETA TACTICAL ETF
STATEMENT OF OPERATIONS
For the Year Ended September 30, 2018
INVESTMENT INCOME: | | | | |
Dividend income (net of foreign withholding taxes of $15,356) | | $ | 3,573,734 | |
EXPENSES: | | | | |
Advisory fees | | | 880,560 | |
Interest expense | | | 56,698 | |
Total Expense | | | 937,258 | |
Net Investment Income | | | 2,636,476 | |
REALIZED AND UNREALIZED GAIN (LOSS): | | | | |
Net realized gain (loss) on | | | | |
Investments | | | (18,160,065 | ) |
In-kind redemptions | | | 14,210,781 | |
Short sales | | | (12,035 | ) |
Total net realized loss | | | (3,961,319 | ) |
Net change in unrealized appreciation (depreciation) on investments | | | 2,202,960 | |
Net realized and change in unrealized depreciation on investments | | | (1,758,359 | ) |
Net Increase in Net Assets Resulting From Operations | | $ | 878,117 | |
The accompanying notes are an integral part of these financial statements.
INNOVATOR LUNT LOW VOL/HIGH BETA TACTICAL ETF
STATEMENTS OF CHANGES IN NET ASSETS
| | Year Ended September 30, 2018 | | | For the Period October 19, 20161 to September 30, 2017 | |
OPERATIONS: | | | | | | | | |
Net investment income | | $ | 2,636,476 | | | $ | 1,712,693 | |
Net realized gain (loss) on investments and in-kind redemptions | | | (3,961,319 | ) | | | 17,585,703 | |
Net change in unrealized appreciation on investments | | | 2,202,960 | | | | 1,566,682 | |
Net increase in net assets resulting from operations | | | 878,117 | | | | 20,865,078 | |
Distributions to Shareholders | | | (2,605,818 | ) | | | (1,669,141 | )2 |
SHAREHOLDER TRANSACTIONS: | | | | | | | | |
Proceeds from shares sold | | | 446,332,544 | | | | 337,635,354 | |
Cost of shares redeemed | | | (416,421,797 | ) | | | (222,530,514 | ) |
Net increase in net assets resulting from shareholder transactions | | | 29,910,747 | | | | 115,104,840 | |
Increase in net assets | | | 28,183,046 | | | | 134,300,777 | |
NET ASSETS: | | | | | | | | |
Beginning of period | | | 134,300,777 | | | | – | |
End of period | | $ | 162,483,823 | | | $ | 134,300,777 | 3 |
CHANGES IN SHARES OUTSTANDING: | | | | | | | | |
Shares outstanding, beginning of period | | | 4,300,002 | | | | – | |
Shares sold | | | 13,850,000 | | | | 11,650,002 | |
Shares redeemed | | | (13,000,000 | ) | | | (7,350,000 | ) |
Shares outstanding, end of period | | | 5,150,002 | | | | 4,300,002 | |
1 Commencement of operations.
2 Distributions from net investment income.
3 Including undistributed net investment income of $43,552 at period ended September 30, 2017.
The accompanying notes are an integral part of these financial statements.
INNOVATOR LUNT LOW VOL/HIGH BETA TACTICAL ETF
FINANCIAL HIGHLIGHTS
| | Year Ended September 30, 2018 | | | For the Period October 19, 20161 to September 30, 2017 | |
Per Share Operating Performance: | | | | | | | | |
(for a share of capital stock outstanding throughout each period) | | | | | | | | |
Net asset value, beginning of period | | $ | 31.23 | | | $ | 25.36 | |
Income from Investment Operations: | | | | | | | | |
Net investment income2 | | | 0.47 | | | | 0.47 | |
Net realized and unrealized gain on investments | | | 0.32 | 3 | | | 5.82 | |
Total gain from investment operations | | | 0.79 | | | | 6.29 | |
Less distributions from: | | | | | | | | |
Net investment income | | | (0.47 | ) | | | (0.42 | ) |
Net asset value, end of period | | $ | 31.55 | | | $ | 31.23 | |
Market value, end of period | | $ | 31.51 | | | $ | 31.27 | |
Total Return at Net Asset Value | | | 2.55 | % | | | 24.88 | %4 |
Total Return at Market Value | | | 2.46 | % | | | 24.91 | %4 |
Ratios/Supplemental Data: | | | | | | | | |
Net assets, end of period (000's) omitted | | $ | 162,484 | | | $ | 134,301 | |
Ratio to average net assets of: | | | | | | | | |
Expenses | | | 0.52 | %5 | | | 0.49 | %6 |
Net investment income | | | 1.47 | % | | | 1.66 | %6 |
Portfolio turnover rate7 | | | 667 | % | | | 179 | % |
1 | Commencement of Operations. |
2 | Based on average daily shares outstanding. |
3 | Net realized and unrealized gain (loss) per share in this caption are balancing amounts necessary to reconcile the change in net asset value per share for the period, and may not reconcile with the aggregate gain (loss) in the Statement of Operations due to share transactions for the period. |
5 | The ratio of expenses to average net assets includes interest expense fees of 0.03%. |
6 | Annualized for periods less than one year. |
7 | Portfolio turnover rate is not annualized and excludes the value of portfolio securities received or delivered as a result of in-kind creations or redemptions of the Fund's capital shares. |
The accompanying notes are an integral part of these financial statements.
Notes to Financial Statements
September 30, 2018
1. ORGANIZATION
The Fund is classified as a non-diversified series of the Trust. The Innovator ETFs Trust II (the “Trust”) was organized as a Massachusetts business trust on December 17, 2013, and is authorized to issue an unlimited number of shares. The Trust is an open-end management investment company, registered under the Investment Company Act of 1940, as amended (the “1940 Act”). Effective April 1, 2018, the Trust changed from Elkhorn ETF Trust to Innovator ETFs Trust II. As a result, the Elkhorn Lunt LowVol/High Beta Tactical ETF Fund’s name was changed to the Innovator Lunt Low Vol/High Beta Tactical ETF (the “Fund”), the Fund’s ticker Symbol remained the same (LVHB). The Fund lists and principally trades its shares on Cboe BZX Exchange, Inc. (“Cboe BZX” or the “Exchange”). The Fund commenced operations on October 19, 2016. The Fund seeks investment results that generally correspond (before fees and expenses) to the price and yield of the Lunt Capital US Large Cap Equity Rotation Index.
The Fund is an investment company and accordingly follows the investment company accounting and reporting guidance of the Financial Accounting Standards Board (“FASB”) Accounting Standards Codification Topic 946 “Financial Services — Investment Companies”.
2. SIGNIFICANT ACCOUNTING POLICIES
The following is a summary of significant accounting policies consistently followed by the Fund in the preparation of its financial statements. These policies are in conformity with accounting principles generally accepted in the United States of America (“GAAP”).
Investment Valuation:
The Fund calculates its net asset value (“NAV”) each day the New York Stock Exchange (the “NYSE”) is open for trading as of the close of regular trading on the NYSE, normally 4:00 p.m. Eastern time (the “NAV Calculation Time”).
Common stocks and other equity securities listed on any national or foreign exchange are valued at the last sale price on the business day as of which such value is being determined. Portfolio securities traded on more than one securities exchange are valued at the last sale price or official closing price, as applicable, on the business day as of which such value is being determined at the close of the exchange representing the principal market for such securities. Such valuations are typically categorized as Level 1 in the fair value hierarchy described below.
Notes to Financial Statements
September 30, 2018, Continued
If a market quotation is not readily available or is deemed not to reflect market value the Pricing Committee determines the price of the security held by the Fund based on a determination of the security’s fair value pursuant to policies and procedures approved by the Board. In addition, the Fund may use fair valuation to price securities that trade on a foreign exchange when a significant event has occurred after the foreign exchange closes but before the time at which the Fund’s NAV is calculated. Such valuations are typically categorized as Level 2 or Level 3 in the fair value hierarchy described below.
Certain securities may not be able to be priced by pre-established pricing methods. Such securities may be valued by the Pricing Committee or its delegate at fair value. These securities generally include but are not limited to, restricted securities (securities which may not be publicly sold without registration under the 1933 Act) for which a pricing service is unable to provide a market price; securities whose trading has been formally suspended; a security whose market price is not available from a pre-established pricing source; a security with respect to which an event has occurred that is likely to materially affect the value of the security after the market has closed but before the calculation of the Fund’s NAV (as may be the case in foreign markets on which the security is primarily traded) or make it difficult or impossible to obtain a reliable market quotation; and a security whose price, as provided by the pricing service, does not reflect the security’s “fair value.” A variety of factors may be considered in determining the fair value of such securities. Valuing the Fund’s investments using fair value pricing will result in using prices for those investments that may differ from current market valuations.
Fair valuation measurement:
FASB established a framework for measuring fair value in accordance with U.S. GAAP. Under Accounting Standards Codification, Fair Value Measurement (“ASC 820”), various inputs are used in determining the value of the exchange traded fund’s investments. The inputs or methodology used for valuing securities are not necessarily an indication of the risk associated with investing in those securities. The three Levels of inputs of the fair value hierarchy are defined as follows:
| | Level 1 — | Unadjusted quoted prices in active markets for identical assets or liabilities. |
| | Level 2 — | Observable inputs other than quoted prices included in Level 1 that are observable for the asset or liability, either directly or indirectly. These inputs may include quoted prices for the identical instrument on an inactive market, prices for similar securities, interest rates, prepayment speeds, credit risk, yield curves, default rates and similar data. |
Notes to Financial Statements
September 30, 2018, Continued
| | Level 3 — | Unobservable inputs for the asset or liability, to the extent relevant observable inputs are not available; representing the Fund’s own assumptions about the assumptions a market participant would use in valuing the asset or liability, and would be based on the best information available. |
A financial instrument’s level within the fair value hierarchy is based on the lowest level of any input that is significant to the fair value measurement.
The availability of observable inputs can vary from security to security and is affected by a wide variety of factors, including, for example, the type of security, whether the security is new and not yet established in the marketplace, the liquidity of markets, and other characteristics particular to the security. To the extent that valuation is based on models or inputs that are less observable or unobservable in the market, the determination of fair value requires more judgment. Accordingly, the degree of judgment exercised in determining fair value is greatest for instruments categorized in Level 3.
The hierarchy classification of inputs used to value the Fund’s investments at September 30, 2018, is disclosed at the end of the Fund’s Schedule of Investments.
Cash includes interest bearing cash balances that are held at one or more major financial institutions.
Investment Transactions and Investment Income:
Investment transactions are recorded on the trade date. Realized gains and losses on sales of investment securities are calculated using specific identification basis. Dividend income, if any, is recorded on the ex-dividend date or, in the case of foreign securities, as soon as the Fund is informed of the ex- dividend dates. Withholding taxes on foreign dividends have been provided for in accordance with applicable country’s tax rules and rate. Interest income on interest bearing cash account is included in interest income.
Use of Estimates:
In preparing financial statements in conformity with GAAP, management is required to make estimates and assumptions that affect the reported amounts of assets and liabilities and disclosure of contingent assets and liabilities as of the date of the financial statements and the reported amounts of increases and decreases in net assets from operations during the reporting period. Actual results could differ from these estimates.
Notes to Financial Statements
September 30, 2018, Continued
Tax Information, Dividends and Distributions to Shareholders
The Fund is treated as a separate entity for federal income tax purposes. The Fund intends to qualify as a regulated investment company (“RIC”) under Subchapter M of the Internal Revenue Code of 1986, as amended (the “Internal Revenue Code”). To qualify and remain eligible for the special tax treatment accorded to RICs, the Fund must meet certain annual income and quarterly asset diversification requirements and must distribute annually at least 90% of the sum of (i) its investment company taxable income (which includes dividends, interest and net short-term capital gains) and (ii) certain net tax-exempt income, if any. If so qualified, the Fund will not be subject to federal income tax to the extent it distributes substantially all of its net investment income and capital gains to shareholders.
Distributions to Shareholders are recorded on the ex-dividend date. The Fund generally pays out dividends from its net investment income, if any, quarterly, and distributes its net capital gains, if any, to shareholders at least annually. The amount of dividends and distributions from net investment income and net realized capital gains are determined in accordance with Federal income tax regulations, which may differ from GAAP. These “book/tax” differences are either considered temporary or permanent in nature. To the extent these differences are permanent in nature, such amounts are reclassified within the components of net assets based on their Federal tax basis treatment; temporary differences do not require reclassification. Dividends and distributions, which exceed earnings and profit for tax purposes are reported as a tax return of capital.
Management evaluates the Fund’s tax positions to determine if the tax positions taken meet the minimum recognition threshold in connection with accounting for uncertainties in income tax positions taken or expected to be taken for the purposes of measuring and recognizing tax liabilities in the financial statements. Recognition of tax benefits of an uncertain tax position is required only when the position is “more likely than not” to be sustained assuming examination by taxing authorities. Interest and penalties related to income taxes would be recorded as income tax expense in the Statement of Operations. The Fund’s federal income tax returns are subject to examination by the Internal Revenue Service (IRS) for a period of three fiscal years after they are filed. State and local tax returns may be subject to examination for an additional fiscal year depending on the jurisdiction. As of September 30, 2018, the Fund did not have a liability for any unrecognized tax benefits. As of September 30, 2018, the Fund has no examination in progress and management is not aware of any tax positions for which it is reasonably possible that the amounts of unrecognized tax benefits will significantly change in the next twelve months. The Fund is subject to examination by U.S. Federal tax authorities for all tax years since inception.
Notes to Financial Statements
September 30, 2018, Continued
Indemnification
In the normal course of business, the Fund enters into contracts that contain a variety of representations and warranties which provide general indemnities. The Fund’s maximum exposure under these arrangements is unknown, as this would involve future claims that may be made against the Fund that have not yet occurred. However, based on industry experience, the Fund expects this risk of loss due to these warranties and indemnities to be remote.
3. INVESTMENT ADVISORY AND OTHER AGREEMENTS
Effective April 1, 2018, Innovator Capital Management, LLC (the “Adviser”) was appointed to serve as the investment adviser to the Innovator Lunt Low Vol/High Beta Tactical ETF, pursuant to an Interim Investment Advisory Agreement with the Trust on behalf of the Fund (“Interim Advisory Agreement”). The Interim Advisory Agreement will remain in effect for 150 days from its effectiveness, or until Fund shareholders approve a new, permanent investment advisory agreement (“New Advisory Agreement”), whichever is earlier. Elkhorn Investments, LLC served as the Fund’s Adviser until March 31, 2018.
On April 10, 2018, the Board of Trustees (the “Board”) approved the New Advisory Agreement between the Trust and Innovator and recommended that the New Advisory Agreement be submitted to Fund shareholders for approval. The New Advisory Agreement was approved at the June 20, 2018 shareholder meeting. For more information on Innovator, visit www.innovatoretfs.com.
Advisory and Other Fees:
The Fund pays to the Adviser, a related party, a fee calculated daily and payable monthly at an annual rate (stated as a percentage of the average daily net assets of the Fund) in return for providing investment management and supervisory services as follows:
Subject to the supervision of the Board, the Adviser pays substantially all expenses associated with the operation of the Fund, except for distribution and service fees payable pursuant to a Rule 12b-1 plan, if any, brokerage commissions and other expenses connected with the execution of portfolio transactions, taxes, interest, and extraordinary expenses.
Notes to Financial Statements
September 30, 2018, Continued
Administrator, Custodian, Accounting Agent and Transfer Agent Services:
The Bank of New York Mellon (in each capacity, the “Administrator”, “Custodian,” “Accounting Agent” or “Transfer Agent”) serves as the Fund’s Administrator, Custodian, Accounting Agent and Transfer Agent pursuant to the Fund Administration and Accounting Agreement. The Bank of New York Mellon is a subsidiary of The Bank of New York Mellon Corporation, a financial holding company.
Distribution and Service Fees:
Foreside Fund Services, LLC (the “Distributor”) serves as the Fund’s distributor pursuant to a Distribution Service Agreement. The Trust has adopted a distribution and service plan (“Rule 12b-1 Plan”) pursuant to Rule 12b-1 under the 1940 Act. Under the Rule 12b-1 Plan, the Fund is authorized to pay an amount up to a maximum annual rate of 0.25% of its average net assets in connection with the sale and distribution of its shares and pay service fees in connection with the provision of ongoing services to shareholders. No fees are currently paid by the Fund under the plan, and the Fund will not pay 12b-1 fees any time before March 31, 2019.
4. CREATION AND REDEMPTION TRANSACTIONS
There were an unlimited number of shares of beneficial interest at $0.01 par value authorized by the Trust. Individual shares of the Fund may only be purchased and sold at market prices on a national securities exchange through a broker-dealer. Such transactions may be subject to customary commission rates imposed by the broker-dealer, and market prices for the Fund’s shares may be at, above or below its NAV depending on the premium or discount at which the Fund’s shares trade.
The Fund issues and redeems shares at its NAV only in a large specified number of shares each called a “Creation Unit,” or multiples thereof, and only with “authorized participants” who have entered into contractual arrangements with the Distributor. A Creation Unit for the Fund consists of 50,000 shares. Except when aggregated in Creation Units, shares of the Fund is not redeemable. Transactions in shares for the Fund are disclosed in detail in the Statement of Changes in Net Assets. The consideration for a purchase of Creation Units generally consists of the in-kind deposit of specified securities and an amount of cash or, as permitted or required by the Fund, of cash. A fixed transaction fee is imposed on each creation and redemption transaction. In addition, a variable charge for certain creation and redemption transactions will be imposed.
Notes to Financial Statements
September 30, 2018, Continued
5. INVESTMENT TRANSACTIONS
For the year ended September 30, 2018, the cost of purchases and the proceeds from sales of investment securities (excluding short- term investments) were as follows:
| | Purchases | | | Sales | |
| | $ | 1,186,094,282 | | | $ | 1,166,439,171 | |
For the year ended September 30, 2018, the cost of in-kind subscriptions and the proceeds from in-kind redemptions were as follows:
| | In-kind Subscriptions | | | In-kind Redemptions | |
| | $ | 423,780,601 | | | $ | 414,254,298 | |
6. FEDERAL INCOME TAX MATTERS
At September 30, 2018, the cost of investments and net unrealized appreciation (depreciation) for federal income tax purposes were as follows:
| | Federal Tax Cost of Investments | | | Gross Unrealized Appreciation | | | Gross Unrealized Depreciation | | | Net Unrealized Appreciation (Depreciation) | |
| | $ | 158,074,740 | | | $ | 5,273,406 | | | $ | (1,506,774 | ) | | $ | 3,766,632 | |
The differences between book and tax basis cost of investments and net unrealized appreciation (depreciation) are primarily attributable to wash sales.
At September 30, 2018, the components of undistributed or accumulated earnings/loss on a tax-basis were as follows:
| | Undistributed Net Investment Income (Loss) | | | Accumulated Capital and Other Gains (Losses) | | | Net Unrealized Appreciation (Depreciation) | | | Total Distributable Earnings (Accumulated Deficit) | |
| | $ | 74,210 | | | $ | (21,754,763 | ) | | $ | 3,766,632 | | | $ | (17,913,921 | ) |
Notes to Financial Statements
September 30, 2018, Continued
The tax character of distributions paid by the Fund from ordinary income during the fiscal year ended September 30, 2018 and September 30, 2017, were as follows:
| | Year Ended | | | Period Ended | |
| | September 30, 2018 | | | September 30, 2017 | |
| | Ordinary Income | | | Ordinary Income | |
| | $ | 2,605,818 | | | $ | 1,669,141 | |
Certain capital and qualified late year ordinary losses incurred after October 31 and December 31, respectively, and within the current taxable year, are deemed to arise on the first business day of the Fund’s next taxable year. During the fiscal year ended September 30, 2018, the Fund deferred short term post-October losses of $(21,836,366) and long term post-October gains of $81,603.
At September 30, 2018, for Federal income tax purposes, the Fund had no capital loss carryforwards available to offset future capital gains.
For financial reporting purposes, capital accounts are adjusted to reflect the tax character of permanent book/tax differences. These differences are primarily due to redemptions-in-kind and tax equalization utilized. At September 30, 2018, the effect of permanent book/tax reclassifications resulted in increase (decrease) to the components of net assets were as follows:
| | | | | Distributable Earnings (Accumulated Deficit) | | | Paid-In Capital | |
| | | | | | $ | (16,516,520 | ) | | $ | 16,516,520 | |
7. PRINCIPAL RISKS
In the normal course of business, the Fund makes investments in financial instruments where the risk of potential loss exists due to changes in the market. The following is a description of select risks of investing in the Fund.
Index Risk. The Fund is not actively managed. The Fund invests in securities included in or representative of its Index regardless of its investment merit. Therefore, the Fund would not necessarily buy or sell a security unless that security is added or removed, respectively, from the Index, even if that security generally is underperforming.
Notes to Financial Statements
September 30, 2018, Continued
Non-Diversified Risk. Because the Fund is non-diversified and can invest a greater portion of its assets in securities of individual issuers than diversified funds, changes in the market value of a single investment could cause greater fluctuations in share price than would a diversified fund.
The Fund’s prospectus contains additional information regarding risks associated with investments in the Fund.
8. CHANGE IN INDEPENDENT REGISTERED PUBLIC ACCOUNTING FIRM
Grant Thornton LLP was previously the independent registered public accounting firm for the Trust. Effective June 20, 2018, that firm resigned and was replaced by Cohen & Company, Ltd. (“Cohen”). Cohen’s appointment as the independent registered public accounting firm for the Fund was recommended by the audit committee of the board of trustees and approved by the full board.
During the prior period October 19, 2016 (commencement of operations) through September 30, 2017, and the subsequent interim period through June 20, 2018, there were no: (1) disagreements with Grant Thornton LLP on any matter of accounting principles or practices, financial statement disclosure or auditing scope or procedures, which disagreements if not resolved to their satisfaction would have caused them to make reference in connection with their opinion to the subject matter of the disagreement, or (2) reportable events.
The audit reports of Grant Thornton LLP on the financial statements of the Trust as of and for the prior period October 19, 2016 (commencement of operations) through September 30, 2017 did not contain any adverse opinion or disclaimer of opinion, nor were they qualified or modified as to uncertainty, audit scope or accounting principles.
9. NEW ACCOUNTING PRONOUNCEMENT
In August 2018, the FASB issued Accounting Standards Update (ASU) No. 2018-13, Fair Value Measurement (Topic 820): Disclosure Framework—Changes to the Disclosure Requirements for Fair Value Measurements. The amendments in the ASU modify the disclosure requirements on fair value measurements in Topic 820. The ASU is effective for interim and annual reporting periods beginning after December 15, 2019. Management is currently evaluating the impact, if any, of applying this provision and believes the adoption of this ASU will not have a material impact on the financial statements.
Notes to Financial Statements
September 30, 2018, Continued
10. RESULTS OF THE SPECIAL MEETING OF SHAREHOLDERS OF THE TRUST
(Unaudited)
A special meeting of the Fund’s shareholders was held on June 20, 2018. The matters voted on by the shareholders and the results of the vote at the shareholders meeting were as follows:
Proposal 1: | | | | | | | | | | | | |
To approve a new investment management agreement on behalf of the Fund |
| | Shares Voted | | | % of Shares Voted | | | % of Outstanding Shares Voted | |
For | | | 3,063,558 | | | | 51.13 | % | | | 51.06 | % |
Against | | | 20,540 | | | | 0.34 | % | | | 0.34 | % |
Abstain | | | 9,788 | | | | 0.16 | % | | | 0.16 | % |
Broker Non-Vote | | | 2,897,532 | | | | 48.36 | % | | | 48.29 | % |
Proposal 2: |
To approve a new investment sub-advisory agreement on behalf of the Fund |
| | | | | | | | | | | | |
| | Shares Voted | | | % of Shares Voted | | | % of Outstanding Shares Voted | |
For | | | 3,062,327 | | | | 51.11 | % | | | 51.04 | % |
Against | | | 21,771 | | | | 0.36 | % | | | 0.36 | % |
Abstain | | | 9,788 | | | | 0.16 | % | | | 0.16 | % |
Broker Non-Vote | | | 2,897,532 | | | | 48.36 | % | | | 48.29 | % |
Proposal 3-1: | | | | | | | | | | | | |
Election of Trustees: Mark Berg | | | | | | | | | | | | |
| | Shares Voted | | | % of Shares Voted | | | % of Outstanding Shares Voted | |
For | | | 5,981,434 | | | | 99.83 | % | | | 99.69 | % |
Withhold | | | 9,984 | | | | 0.17 | % | | | 0.17 | % |
Notes to Financial Statements
September 30, 2018, Continued
Proposal 3-2: |
Election of Trustees: H. Bruce Bond |
| | Shares Voted | | | % of Shares Voted | | | % of Outstanding Shares Voted | |
For | | | 5,981,434 | | | | 99.83 | % | | | 99.69 | % |
Withhold | | | 9,984 | | | | 0.17 | % | | | 0.17 | % |
Proposal 3-3: |
Election of Trustees: Joe Stowell |
| | Shares Voted | | | % of Shares Voted | | | % of Outstanding Shares Voted | |
For | | | 5,983,728 | | | | 99.87 | % | | | 99.73 | % |
Withhold | | | 7,690 | | | | 0.13 | % | | | 0.13 | % |
Proposal 3-4: |
Election of Trustees: Brain J. Wildman |
| | Shares Voted | | | % of Shares Voted | | | % of Outstanding Shares Voted | |
For | | | 5,981,434 | | | | 99.83 | % | | | 99.69 | % |
Withhold | | | 9,984 | | | | 0.17 | % | | | 0.17 | % |
11. SUBSEQUENT EVENT
Management has evaluated the impact of all subsequent events on the Fund through the date the financial statements were issued, and has determined that there were no subsequent events requiring recognition or disclosure in the financial statements.
REPORT OF INDEPENDENT REGISTERED PUBLIC ACCOUNTING FIRM
To the Shareholders of Innovator Lunt Low Vol/High Beta Tactical ETF and
Board of Trustees of Innovator ETFs Trust II
Opinion on the Financial Statements
We have audited the accompanying statement of assets and liabilities, including the schedule of investments, of Innovator Lunt Low Vol/High Beta Tactical ETF (the “Fund”), a series of Innovator ETFs Trust II, as of September 30, 2018, and the related statements of operations and changes in net assets and financial highlights for the year then ended, including the related notes (collectively referred to as the “financial statements”). In our opinion, the financial statements present fairly, in all material respects, the financial position of the Fund as of September 30, 2018, the results of its operations, the changes in its net assets, and the financial highlights for the year then ended, in conformity with accounting principles generally accepted in the United States of America.
The Fund’s financial statements and financial highlights for the period October 19, 2016 (commencement of operations) through September 30, 2017, were audited by other auditors whose report dated November 29, 2017, expressed an unqualified opinion on those financial statements and financial highlights.
Basis for Opinion
These financial statements are the responsibility of the Fund’s management. Our responsibility is to express an opinion on the Fund’s financial statements based on our audit. We are a public accounting firm registered with the Public Company Accounting Oversight Board (United States) (“PCAOB”) and are required to be independent with respect to the Fund in accordance with the U.S. federal securities laws and the applicable rules and regulations of the Securities and Exchange Commission and the PCAOB.
We conducted our audit in accordance with the standards of the PCAOB. Those standards require that we plan and perform the audit to obtain reasonable assurance about whether the financial statements are free of material misstatement, whether due to error or fraud.
REPORT OF INDEPENDENT REGISTERED PUBLIC ACCOUNTING FIRM
Our audit included performing procedures to assess the risks of material misstatement of the financial statements, whether due to error or fraud, and performing procedures that respond to those risks. Such procedures included examining, on a test basis, evidence regarding the amounts and disclosures in the financial statements. Our procedures included confirmation of securities owned as of September 30, 2018, by correspondence with the custodian and brokers. Our audit also included evaluating the accounting principles used and significant estimates made by management, as well as evaluating the overall presentation of the financial statements. We believe that our audit provides a reasonable basis for our opinion.
We have served as the auditor of one or more of Innovator Capital Management, LLC’s investment companies since 2017.
COHEN & COMPANY, LTD.
Cleveland, Ohio
November 27, 2018
TRUSTEES AND OFFICERS (Unaudited)
Name, Address and Age | Position with the Trust | Length of Time Served* | Principal Occupation(s) During Past 5 Years | Number of Portfolios in Fund Complex Overseen by Trustee or Officer | Other Directorships Held by Trustee or Officer |
Independent Trustees |
Mark Berg 120 N. Hale Street Suite 200, Wheaton, IL 60187 Age: 46 | Trustee | Since 2017 | President and Founding Principal of Timothy Financial Counsel Inc. (Since 2001). | 2 | None |
Joe Stowell 120 N. Hale Street Suite 200, Wheaton, IL 60187 Age: 48 | Trustee | Since 2017 | Chief Operating Officer, Woodmen Valley Chapel (Since September 2015); Executive Vice President and Chief Operating Officer, English Language Institute/China (From 2007 to 2015). | 2 | None |
Brian J. Wildman 120 N. Hale Street Suite 200, Wheaton, IL 60187 Age: 54 | Trustee | Since 2017 | Executive Vice President, Consumer Banking (Since March 2016), Chief Risk Officer (From April 2013 to March 2016), Head of Wealth Management (2003-2013) and Head of Commercial Services (2010-2013), MB Financial Bank. | 2 | MB Financial Bank (Since 2003); and Missionary Furlough Homes, Inc. (Since 2008). |
TRUSTEES AND OFFICERS (Unaudited), Continued
Interested Trustee & Officer |
H. Bruce Bond 120 N. Hale Street Suite 200, Wheaton, IL 60187 Age: 54 | Interested Trustee, President and Principal Executive Officer | Since 2017 | Chief Executive Officer of Innovator Capital Management, LLC (May 2017 to present); formerly Chairman (2010-2013) and President and CEO (2006-2010), Invesco PowerShares Capital Management LLC; formerly Co-Founder, President and CEO, PowerShares Capital Management (2002 to 2006); formerly Chairman; PowerShares Fund Board (2002 to 2013). | 2 | None |
Officers |
John W. Southard 120 N. Hale Street, Suite 200, Wheaton, IL 60187 Age: 47 | Vice President, Treasurer and Principal Financial Accounting Officer | Since May 2017 | Chief Investment Officer, Innovator Capital Management, LLC (May 2017 to present); Director and Co-Founder, T2 Capital Management, LLC (2010 to present); formerly Co-Founder and Head of Research and Trading, PowerShares Capital Management (2002 to 2009) | 2 | Independent Trustee, ETF Managers Group, LLC (2012 to present) |
Michael Wiederholt 120 N. Hale Street, Suite 200, Wheaton, IL 60187 Age: 42 | Chief Compliance Officer | Since December 2017 | Vice President of Technology and Operations Management, Innovator Capital Management, LLC (2017 to present); Director of Business Operations, Elkhorn Capital Group (2013 to 2017) | 2 | None |
TRUSTEES AND OFFICERS (Unaudited), Continued
James Nash 10 High Street, Suite 302 Boston, MA 02110 Age: 1981 | Chief Compliance Officer and Anti-Money Laundering Officer | Since June 2018 | Foreside Fund Officer Services, LLC, 2016 – present, Fund Chief Compliance Officer; JPMorgan Chase & Co., 2014 – 2016, Senior Associate, Regulatory Administration Advisor; Linedata Services, 2011 – 2014, Product Analyst | N/A | N/A |
* | The Fund’s Trustees serve for an indefinite term until their resignation, death or removal. The Fund’s officers are elected annually by the Board and serve at the Board’s pleasure. |
The Statement of Additional Information includes additional information about the Trustees and is available upon request, without charge, by calling 1-877-386-3890.
Board Considerations Regarding Approval of Investment Management Agreement (Unaudited)
At a meeting held on June 20, 2018, the Board of Trustees of Innovator ETF Trust II (the “Trust”), including the Independent Board Members, approved the Investment Management Agreement (the “Agreement”) between Innovator Capital Management, LLC (the “Adviser”) and the Innovator Lunt Low Vol/High Beta Tactical ETF (a “Fund”).
The Adviser provided information describing: (i) the nature, extent and quality of services to be provided, (ii) the costs of services to be provided and estimated profits to be realized by the Adviser, (iii) the extent to which economies of scale may be realized by the Adviser as the Fund grows, (iv) whether the fee levels reflect any possible economies of scale for the benefit of the Fund’s shareholders, (v) comparisons of services rendered to and amounts paid by other registered investment companies and (vi) any benefits to be realized by the Adviser from its relationship with the Fund. Based on all of the information considered and the conclusions reached, the Trustees, including the Independent Trustees, determined to approve the Agreement for the Fund. No single factor was determinative in the Board’s analysis.
Nature, Extent and Quality of Services. In evaluating the nature, extent and quality of the Adviser’s services, the Trustees considered information concerning the functions to be performed by the Adviser for the Fund and the personnel and resources of the Adviser, including the investment management team that will be responsible for the day-to-day management of the Fund. The Trustees considered the information from the Adviser regarding its financial condition that it was sufficiently stable to support its performance of the services under the Agreement. The Trustees also considered the services to be provided by the Adviser in its oversight of the Fund’s service providers.
Based on their review, the Trustees concluded that the nature, extent and quality of the services to be provided by the Adviser to the Fund under the Agreement were expected to be appropriate and reasonable.
Fees, Expenses and Profitability. The Trustees discussed the information provided by the Adviser on the Fund’s proposed investment management fee as compared to information provided by the Adviser on other similar products. The Trustees noted that the proposed annual investment management fee to be charged to the Fund was a unitary fee, and that the Adviser has agreed to pay all other expenses of the Fund except brokerage commissions and other expenses connected with the execution of portfolio transactions, taxes, interest, distribution and service fees payable pursuant to a Rule 12b-1 Plan, if any, and extraordinary expenses. The Trustees also compared the Fund’s proposed unitary investment management fee against the mean and median advisory fees of an
Board Considerations Regarding Approval of Investment Management Agreement (Unaudited), Continued
applicable ETF peer group. The Trustees noted that the Innovator Lunt Low Vol/High Beta Tactical ETF had a unitary investment management fee greater than the average/median advisory fees for its ETF peer group and other peer data, but that the net unitary fee, after payment of licensing fees, was 0.24% and was consistent with the net pricing on other funds managed by the Adviser. The Trustees also considered the tactical nature of the Innovator Lunt Low Vol/High Beta Tactical ETF. The Board concluded that the unitary investment management fee to be charged to the Fund is reasonable and appropriate in light of the services expected to be provided by the Adviser.
In conjunction with their review of the unitary investment management fees, the Trustees considered information provided by the Adviser on its costs to be incurred in connection with the proposed Agreement and its estimated profitability, and they noted the Adviser’s statement that it will likely lose money in its two years of operating the Fund and that any profitability would not be excessive. The Trustees concluded that the estimated profits to be realized by the Adviser with respect to the Fund appeared to be reasonable.
Economies of Scale and Whether the Fee Levels Reflect These Economies of Scale. The Trustees considered the information provided by the Adviser as to the extent to which economies of scale may be realized as the Fund grows and whether the fee levels reflect economies of scale for the benefit of shareholders. The Trustees noted that any reduction in fixed costs associated with the management of the Fund would be enjoyed by the Adviser, but that a unitary fee provides a level of certainty in expenses for the Fund. The Trustees considered whether the proposed advisory fee rate for the Fund is reasonable in relation to the projected asset size of the Fund. The Trustees concluded that the flat investment management fee for the Fund was reasonable and appropriate.
The Trustees noted that the Adviser had not identified any further benefits that it would derive from its relationship with the Fund, and had noted that it will not, initially, have any soft- dollar arrangements.
Based on all of the information considered and the conclusions reached, the Board, including the Independent Trustees, determined to approve the Agreement for the Fund.
Supplemental Information (Unaudited)
Investors should consider the investment objective and policies, risk considerations, charges and ongoing expenses of an investment carefully before investing. The prospectus contains this and other information relevant to an investment in the Fund. Please read the prospectus carefully before investing. A copy of the Prospectus may be obtained without charge by writing to the Trust’s Distributor, or by calling toll free at 1-800-208-5212 or visiting www.innovatoretfs.com.
QUARTERLY PORTFOLIO HOLDING INFORMATION
The Fund’s complete schedule of portfolio holdings for the first and third quarters is filed with the SEC on Form N-Q. The Fund’s Form N-Q is available without charge, upon request, by calling 1-800-208-5212, or on the SEC’s website at www.sec.gov. The Trust’s Form N-Q may be reviewed and copied at the SEC’s Public Reference Room in Washington, DC. Information on the operation of the Public Reference Room may be obtained by calling 1-800-SEC-0330.
PROXY VOTING INFORMATION
The Fund’s Proxy Voting Policies and Procedures are available without charge, upon request, by calling 1-800-208-5212 and on the SEC’s website at www.sec.gov. Information relating to how the Fund voted proxies relating to portfolio securities held during each year ended June 30 is also available on the SEC’S website at www.sec.gov.
DELIVERY OF SHAREHOLDER DOCUMENTS – HOUSEHOLDING
In order to reduce expenses, the Fund delivers one copy of an annual/semiannual report, prospectus and/or proxy statement on behalf of two or more shareholders at a shared address (householding). Householding for the Fund is available through certain broker-dealers. If you are interested in enrolling in householding and receiving a single copy of the prospectus and other shareholder documents, please contact your broker-dealer. If you currently are enrolled in householding and wish to change your householding status, please contact your broker-dealer.
Supplemental Information (Unaudited), Continued
TAX INFORMATION
Form 1099-DIV and other year-end tax information provide shareholders with actual calendar year amounts that should be included in their tax returns. Shareholders should consult their tax advisors. The Fund designates the following amounts or, if subsequently determined to be different, the maximum allowable for its period ended September 30, 2018.
| | Qualified Dividend Income* | | | Dividends Received Deduction* | |
| | | 100 | % | | | 100 | % |
* | The above percentage is based on ordinary income dividends paid to shareholders during the Fund’s fiscal year. |
FREQUENCY DISTRIBUTION OF PREMIUM AND DISCOUNT
The table below presents information about the differences between the daily market trading prices for shares of the Fund and the Fund’s NAV. The Fund’s market price is based on the midpoint between the highest bid and the lowest offer on the stock exchange on which the shares of the Fund are listed for trading, as of the close of trading. Shares of the Fund will trade at market prices rather than NAV. The share may trade at prices greater than NAV (at a premium), at NAV, or less than NAV (at a discount).
The NAV of the Fund will generally fluctuate with changes in the market value of the Fund’s holdings. The market prices of shares will generally fluctuate in accordance with changes in NAV as well as the relative supply of and demand for shares. Premiums or discounts are the differences (expressed as a percentage) between the NAV and market price of the Fund.
The following information in the table below shows the frequency distributions of premium and discount for the Fund for the period from commencement of trading on secondary market of the Fund to September 30, 2018.
Supplemental Information (Unaudited), Continued
Each line in the table shows the number of trading days in which the Fund traded within the premium/discount range indicated. All data presented here represents past performance, which cannot be used to predict future results.
Innovator Lunt Low Vol/High Beta Tactical ETF
October 20, 2016* – September 30, 2018
Basis Point Differential | | | Market Price Above or Equal to NAV Number of Days | | | Market Price Below NAV Number of Days | |
0-24.99 | | | | 255 | | | | 204 | |
25-49.9 | | | | 1 | | | | 0 | |
50-99.9 | | | | 0 | | | | 2 | |
100-149.9 | | | | 2 | | | | 0 | |
150-199.9 | | | | 0 | | | | 1 | |
>200 | | | | 0 | | | | 0 | |
Total | | | | 258 | | | | 207 | |
* Commencement of trading on secondary market.
INVESTMENT ADVISOR
Innovator Capital Management, LLC
120 North Hale Street, Suite 200
Wheaton, IL 60187
SUB-ADVISOR
Penserra Capital Management, LLC
140 Broadway, 26th Floor
New York, NY 10005
DISTRIBUTOR
Foreside Fund Services, LLC
Three Canal Plaza, Suite 100
Portland, ME 04101
ADMINISTRATOR, CUSTODIAN, FUND ACCOUNTANT & TRANSFER AGENT
The Bank of New York Mellon
101 Barclay Street
New York, NY 10286
LEGAL COUNSEL
Chapman and Cutler LLP
111 West Monroe Street,
Chicago, Illinois 60603
INDEPENDENT REGISTERED PUBLIC ACCOUNTING FIRM
Cohen & Company, Ltd.
1350 Euclid Avenue, Suite 800
Cleveland, Ohio 44115
Item 2. Code of Ethics.
| | (a) | The registrant, as of the end of the period covered by this report, has adopted a code of ethics that applies to the registrant’s principal executive officer, principal financial officer, principal accounting officer or controller, or persons performing similar functions, regardless of whether these individuals are employed by the registrant or a third party. |
| | (c) | There have been no amendments, during the period covered by this report, to a provision of the code of ethics that applies to the registrant’s principal executive officer, principal financial officer, principal accounting officer or controller, or persons performing similar functions, regardless of whether these individuals are employed by the registrant or a third party, and that relates to any element of the code of ethics description. |
| | (d) | The registrant has not granted any waivers, including an implicit waiver, from a provision of the code of ethics that applies to the registrant’s principal executive officer, principal financial officer, principal accounting officer or controller, or persons performing similar functions, regardless of whether these individuals are employed by the registrant or a third party, that relates to one or more of the items set forth in paragraph (b) of this item’s instructions. |
Item 3. Audit Committee Financial Expert.
As of the end of the period covered by the report, the registrant’s board of trustees has determined that Brian Wildman is qualified to serve as an audit committee financial expert serving on its audit committee and that he is “independent,” as defined by Item 3 of Form N-CSR.
Item 4. Principal Accountant Fees and Services.
Audit Fees
| | (a) | The aggregate fees billed for each of the last two fiscal years for professional services rendered by the principal accountant for the audit of the registrant's annual financial statements or services that are normally provided by the accountant in connection with statutory and regulatory filings or engagements for those fiscal years are N/A for 2017 and $14,000.00 for 2018. |
Audit-Related Fees
| | (b) | The aggregate fees billed in each of the last two fiscal years for assurance and related services by the principal accountant that are reasonably related to the performance of the audit of the registrant's financial statements and are not reported under paragraph (a) of this Item are N/A for 2017 and $0 for 2018. |
Tax Fees
| | (c) | The aggregate fees billed in each of the last two fiscal years for professional services rendered by the principal accountant for tax compliance, tax advice, and tax planning are N/A for 2017 and $3,500 for 2018. |
All Other Fees
| | (d) | The aggregate fees billed in each of the last two fiscal years for products and services provided by the principal accountant, other than the services reported in paragraphs (a) through (c) of this Item are N/A for 2017 and $0 for 2018. |
(e)(1) | Disclose the audit committee's pre-approval policies and procedures described in paragraph (c)(7) of Rule 2-01 of Regulation S-X. |
The Trust’s Audit Committee shall pre-approve all audit and permitted non-audit services provided by a fund’s independent registered public accounting firm relating to the operations or financial reporting of the fund. Prior to the commencement of any audit or non-audit services to a fund, the Audit Committee reviews the services to determine whether they are appropriate and permissible under applicable law.
The Audit Committee has adopted policies and procedures to, among other purposes, provide a framework for the Committee’s consideration of non-audit services by the audit firms that audit the funds. The policies and procedures require that any non-audit service provided by a fund audit firm to an Innovator fund and any non-audit service provided by a fund auditor to a Fund Service Provider that relates directly to the operations and financial reporting of an Innovator fund (“Covered Service”) are subject to approval by the Audit Committee before such service is provided.
All Covered Services shall be approved in advance of provision of the service either: (i) by the Audit Committee, or (ii) by the Chair of the Audit Committee.
(e)(2) | The percentage of services described in each of paragraphs (b) through (d) of this Item that were approved by the audit committee pursuant to paragraph (c)(7)(i)(C) of Rule 2-01 of Regulation S-X are as follows: |
(b) 100%
(c) 100%
(d) 100%
| | (f) | The percentage of hours expended on the principal accountant's engagement to audit the registrant's financial statements for the most recent fiscal year that were attributed to work performed by persons other than the principal accountant's full-time, permanent employees was less than fifty percent. |
| | (g) | The aggregate non-audit fees billed by the registrant's accountant for services rendered to the registrant, and rendered to the registrant's investment adviser (not including any sub-adviser whose role is primarily portfolio management and is subcontracted with or overseen by another investment adviser), and any entity controlling, controlled by, or under common control with the adviser that provides ongoing services to the registrant for each of the last two fiscal years of the registrant was N/A for 2017 and $38,500 for 2018. |
| | (h) | The registrant's audit committee of the board of directors has considered whether the provision of non-audit services that were rendered to the registrant's investment adviser (not including any sub-adviser whose role is primarily portfolio management and is subcontracted with or overseen by another investment adviser), and any entity controlling, controlled by, or under common control with the investment adviser that provides ongoing services to the registrant that were not pre-approved pursuant to paragraph (c)(7)(ii) of Rule 2-01 of Regulation S-X is compatible with maintaining the principal accountant's independence. |
Item 5. Audit Committee of Listed Registrants.
| | (a) | The registrant has a separately designated audit committee consisting of all the independent directors of the registrant. The members of the audit committee are: Joe Stowell, Mark Berg and Brian Wildman. |
Item 6. Investments.
| | (a) | Schedule of Investments in securities of unaffiliated issuers as of the close of the reporting period is included as part of the report to shareholders filed under Item 1 of this form. |
Item 7. Disclosure of Proxy Voting Policies and Procedures for Closed-End Management Investment Companies.
Not applicable.
Item 8. Portfolio Managers of Closed-End Management Investment Companies.
Not applicable.
Item 9. Purchases of Equity Securities by Closed-End Management Investment Company and Affiliated Purchasers.
Not applicable.
Item 10. Submission of Matters to a Vote of Security Holders.
There have been no material changes to the procedures by which the shareholders may recommend nominees to the registrant’s board of trustees, where those changes were implemented after the registrant last provided disclosure in response to the requirements of Item 407(c)(2)(iv) of Regulation S-K (17 CFR 229.407) (as required by Item 22(b)(15) of Schedule 14A (17 CFR 240.14a-101)), or this Item.
Item 11. Controls and Procedures.
| | (a) | The registrant’s principal executive and principal financial officers, or persons performing similar functions, have concluded that the registrant’s disclosure controls and procedures (as defined in Rule 30a-3(c) under the Investment Company Act of 1940, as amended (the “1940 Act”) (17 CFR 270.30a-3(c))) are effective, as of a date within 90 days of the filing date of the report that includes the disclosure required by this paragraph, based on their evaluation of these controls and procedures required by Rule 30a-3(b) under the 1940 Act (17 CFR 270.30a-3(b)) and Rules 13a-15(b) or 15d-15(b) under the Securities Exchange Act of 1934, as amended (17 CFR 240.13a-15(b) or 240.15d-15(b)). |
| | (b) | There were no changes in the registrant’s internal control over financial reporting (as defined in Rule 30a-3(d) under the 1940 Act (17 CFR 270.30a-3(d))) that occurred during the registrant’s last fiscal quarter that has materially affected, or is reasonably likely to materially affect, the registrant’s internal control over financial reporting. |
Item 12. Disclosure of Securities Lending Activities for Closed-End Management Investment Companies.
Not applicable.
Item 13. Exhibits.
| | (a)(1) | Code of ethics, or any amendment thereto, that is the subject of disclosure required by Item 2 is attached hereto. |
| | (a)(2) | Certifications pursuant to Rule 30a-2(a) under the 1940 Act and Section 302 of the Sarbanes-Oxley Act of 2002 are attached hereto. |
| | (b) | Certifications pursuant to Rule 30a-2(b) under the 1940 Act and Section 906 of the Sarbanes-Oxley Act of 2002 are attached hereto. |
SIGNATURES
Pursuant to the requirements of the Securities Exchange Act of 1934 and the Investment Company Act of 1940, the registrant has duly caused this report to be signed on its behalf by the undersigned, thereunto duly authorized.
| (Registrant) | Innovator ETFs Trust II (formerly, Elkhorn ETF Trust) |
| By (Signature and Title)* | /s/ Bruce Bond |
| | Bruce Bond, President and Chief Executive Officer (principal executive officer) |
Pursuant to the requirements of the Securities Exchange Act of 1934 and the Investment Company Act of 1940, this report has been signed below by the following persons on behalf of the registrant and in the capacities and on the dates indicated.
| By (Signature and Title)* | /s/ Bruce Bond |
| | Bruce Bond, President and Chief Executive Officer (principal executive officer) |
| By (Signature and Title)* | /s/ John Southard |
| | John Southard, Chief Financial Officer (principal financial officer) |
* Print the name and title of each signing officer under his or her signature.