TABLE OF CONTENTS
Letter to Shareholders. | 1 |
Fund Performance. | 2 |
Expense Example. | 4 |
Schedule of Investments | 6 |
Statement of Assets and Liabilities | 12 |
Statement of Operations | 13 |
Statements of Changes in Net Assets | 14 |
Financial Highlights | 15 |
Notes to Financial Statements | 16 |
Report of Independent Registered Public Accounting Firm | 28 |
Trustees and Officers | 30 |
Additional Information | 33 |
Letter to Shareholders (Unaudited)
Dear Shareholders,
Thank you for your continued support of the Innovator Lunt Low Vol/High Beta Tactical ETF. The following shareholder letter covers the one-year period ended September 30, 2019.
Building on a nearly eight-year live track record, we remain optimistic the underlying strategy will continue to add value for shareholders. The ETF began the reporting period invested in the low volatility stocks and remained in low-vol throughout the entire reporting period to the benefit of shareholders. Following a multi-year period of low dispersion between the low-vol and high-beta stocks, levels have recently increased. The wider dispersion between these two factors may be captured through the tactical rotation found in the ETF. The continued widening of performance between high-beta and low volatility stocks serves as a tailwind. Over the last one year and since its inception the ETF has outperformed the S&P 500 Index, serving as a compelling way to own low-volatility with the ability to rotate out of the factor as needed.
I believe the ETF remains an ideal way to access the strategy due to the tax-efficiencies of the ETF structure. We appreciate your interest in the ETF and look forward to partnering on current and future Innovator ETFs.
Sincerely,

Bruce Bond
Chief Executive Officer
The views in this report were those of the Fund’s CEO as of September 30, 2019 and may not reflect his views on the date that this report is first published or anytime thereafter. These views are intended to assist shareholders in understanding their investments and do not constitute investment advice.
Investing involves risks. Principal loss is possible. Along with general market risks, an ETF that concentrates its investments in the securities of a particular industry, market, sector, or geographic area may be more volatile than a fund that invests in a broader range of industries. Additionally, the Fund may invest in securities that have additional risks. Foreign companies can be more volatile, less liquid, and subject to the risk of currency fluctuations. This risk is greater for emerging markets. Small- and mid-cap companies can have limited liquidity and greater volatility than large-cap companies. Also, ETFs face numerous market trading risks, including the potential lack of an active market for Fund shares, losses from trading in secondary markets, periods of high volatility and disruption in the creation/ redemption process of the Fund. Unlike mutual funds, ETFs may trade at a premium or discount to their net asset value. ETFs are bought and sold at market price and not individually redeemed from the fund. Brokerage commissions will reduce returns.
Fund Performance
September 30, 2019 (Unaudited)
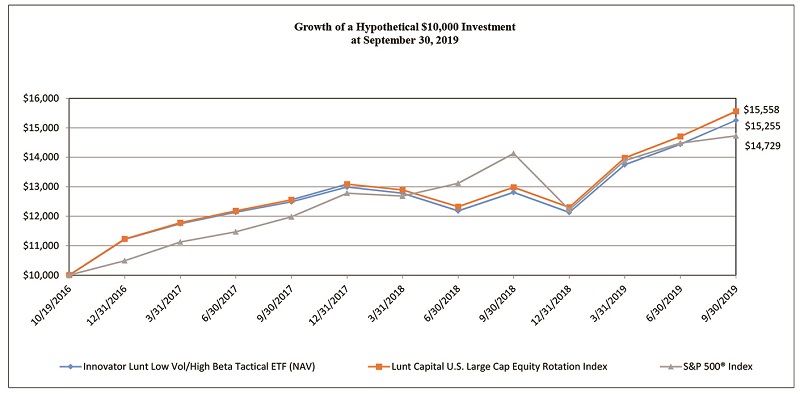
The following chart compares the value of a hypothetical $10,000 investment in the Innovator Lunt Low Vol/High Beta Tactical ETF from its inception (October 19, 2016) to September 30, 2019 as compared with the Lunt Capital U.S. Large Cap Equity Rotation Index and the S&P 500® Index.
| | | Average Annual Total Returns As of September 30, 2019 | |
| | | One Year | | | Since Inception(a) | |
Innovator Lunt Low Vol/High Beta Tactical ETF | | | | | | | | |
NAV Return | | | 19.11 | % | | | 15.40 | % |
Market Return | | | 19.23 | % | | | 15.42 | % |
Lunt Capital U.S. Large Cap Equity Rotation Index | | | 19.86 | % | | | 16.18 | % |
S&P 500® Index | | | 4.25 | % | | | 14.04 | % |
(a) | Commenced operations on October 19, 2016. |
Performance data quoted represents past performance and does not guarantee future results. The investment return and principal value of an investment will fluctuate so that an investor’s shares, when redeemed, may be worth more or less than their original cost. Current performance of the Fund may be lower or higher than the performance quoted. As of the latest prospectus, the net expense ratio of the Fund was 0.52%. This expense ratio includes other expenses of 0.03%. For the most recent performance, please visit the Fund’s website at innovatoretfs.com.
Fund Performance
September 30, 2019 (Unaudited) (Continued)
The line graph and performance table do not reflect the deduction of taxes that a shareholder may pay on fund distributions or the redemption of Fund shares. Returns shown for the Fund, the Lunt Capital U.S. Large Cap Equity Rotation Index and the S&P 500® Index include the reinvestment of all dividends, if any.
The Lunt Capital U.S. Large Cap Equity Rotation Index utilizes Lunt Capital’s proprietary relative strength methodology to rotate between the holdings of one of two sub-indices, the S&P 500® Low Volatility Index and the S&P 500® High Beta Index. The S&P 500® Low Volatility Index is composed of the 100 securities comprising the S&P 500® Index that have exhibited the lowest realized volatility over the prior 12 months. The S&P 500® High Beta Index is composed of the 100 securities comprising the S&P 500® Index that have exhibited the highest sensitivity to market movements, or “beta”, over the prior 12 months.
The S&P 500® Index is an unmanaged, capitalization-weighted index generally representative of the U.S. market for large capitalization stocks.
The Fund’s portfolio holdings may differ significantly from the securities held in the relevant index and, unlike an exchange-traded fund, the performance of an unmanaged index does not reflect deductions for transaction costs, taxes, management fees or other expenses.
You cannot invest directly in an index.
Premium/Discount Information:
Information regarding the differences between the price of the Fund’s shares on the secondary market and the Fund’s net asset value is available at innovatoretfs.com/LVHB.
Expense Example
For the Period Ended
September 30, 2019 (Unaudited)
As a shareholder of the Fund you incur two types of costs: (1) transaction costs including brokerage commissions on the purchase and sales of Fund shares; and (2) ongoing costs, including management fees and other Fund expenses. This example is intended to help you understand your ongoing costs (in dollars) of investing in the Fund and to compare these costs with the ongoing costs of investing in other funds.
This example is based on an investment of $1,000 invested at the beginning of the period and held for the entire period from April 1, 2019 through September 30, 2019.
ACTUAL EXPENSES
The first line under the Fund in the table below provides information about actual account values and actual expenses. You may use the information in this line, together with the amount you invested, to estimate the expenses that you paid over the period. Simply divide your account value by $1,000 (for example, an $8,600 account value divided by $1,000 = 8.6), then multiply the result by the number in the first line for the Fund under the heading entitled “Expenses Paid During the Period” to estimate the expenses you paid on your account during this period.
HYPOTHETICAL EXAMPLE FOR COMPARISON PURPOSES
The second line under the Fund in the table provides information about hypothetical account values and hypothetical expenses based on the Fund’s actual expense ratio and an assumed rate of return of 5% per year before expenses, which is not the Fund’s actual return. The hypothetical account values and expenses may not be used to estimate the actual ending account balance or expenses you paid for the period. You may use this information to compare the ongoing costs of investing in the Fund and other funds. To do so, compare this 5% hypothetical example with the 5% hypothetical examples that appear in the shareholder reports of the other funds. Please note that the expenses shown in the table are meant to highlight your ongoing costs only and do not reflect any transactional costs, such as brokerage commissions paid on purchases and sales of Fund shares. Therefore, the second line under the Fund in the table is useful in comparing ongoing Fund costs only and will not help you determine the relative total costs of owning different funds. In addition, if these transactional costs were included, your costs would have been higher.
Expense Example
For the Period Ended
September 30, 2019 (Unaudited) (Continued)
| | | | | | | | | | | Annualized | | | | | |
| | | Beginning | | | Ending | | | Expense Ratio | | | Expenses Paid | |
| | | Account Value | | | Account Value | | | for the Period | | | During the Period (a) | |
Innovator Lunt Low Vol/High Beta Tactical ETF (NAV) | | | | | | | | | | | | | | | | |
Actual | | $ | 1,000.00 | | | $ | 1,109.60 | | | | 0.49 | % | | $ | 2.59 | |
Hypothetical (5% return before expenses) | | | 1,000.00 | | | | 1,022.61 | | | | 0.49 | % | | | 2.48 | |
(a) | Expenses are equal to the Fund’s annualized expense ratio, multiplied by the average account value over the period, multiplied by 183/365 (to reflect the six month period). |
Schedule of Investments
September 30, 2019
| | | Shares | | | Value | |
COMMON STOCKS - 80.48% | | | | | | | | |
Agriculture - 0.94% | | | | | | | | |
Archer-Daniels-Midland Co. (b) | | | 31,283 | | | $ | 1,284,793 | |
| | | | | | | | | |
Banks - 3.88% | | | | | | | | |
BB&T Corp. (b) | | | 24,111 | | | | 1,286,804 | |
JPMorgan Chase & Co. | | | 10,898 | | | | 1,282,586 | |
US Bancorp (b) | | | 26,499 | | | | 1,466,455 | |
Wells Fargo & Co. | | | 24,771 | | | | 1,249,449 | |
| | | | | | | | 5,285,294 | |
Beverages - 2.08% | | | | | | | | |
PepsiCo, Inc. | | | 10,974 | | | | 1,504,536 | |
The Coca-Cola Co. | | | 24,448 | | | | 1,330,949 | |
| | | | | | | | 2,835,485 | |
Chemicals - 1.81% | | | | | | | | |
Air Products & Chemicals, Inc. | | | 5,412 | | | | 1,200,706 | |
Ecolab, Inc. | | | 6,403 | | | | 1,268,050 | |
| | | | | | | | 2,468,756 | |
Commercial Services - 1.87% | | | | | | | | |
IHS Markit Ltd. (a)(b) | | | 18,367 | | | | 1,228,385 | |
Verisk Analytics, Inc. (b) | | | 8,291 | | | | 1,311,139 | |
| | | | | | | | 2,539,524 | |
Computers - 0.88% | | | | | | | | |
Accenture PLC - Class A | | | 6,243 | | | | 1,200,841 | |
| | | | | | | | | |
Cosmetics & Personal Care - 1.85% | | | | | | | | |
Colgate-Palmolive Co. | | | 16,650 | | | | 1,223,942 | |
The Procter & Gamble Co. | | | 10,426 | | | | 1,296,785 | |
| | | | | | | | 2,520,727 | |
Diversified Financial Services - 5.47% | | | | | | | | |
American Express Co. | | | 9,424 | | | | 1,114,671 | |
Cboe Global Markets, Inc. | | | 9,590 | | | | 1,101,987 | |
CME Group, Inc. | | | 6,163 | | | | 1,302,488 | |
Intercontinental Exchange, Inc. (b) | | | 14,575 | | | | 1,344,835 | |
Nasdaq, Inc. | | | 12,239 | | | | 1,215,945 | |
The Western Union Co. (b) | | | 59,183 | | | | 1,371,270 | |
| | | | | | | | 7,451,196 | |
The accompanying notes are an integral part of these financial statements.
Schedule of Investments
September 30, 2019 (Continued)
| | | Shares | | | Value | |
Electric – 24.80% | | | | | | | | |
Alliant Energy Corp. | | | 28,061 | | | $ | 1,513,330 | |
Ameren Corp. | | | 18,625 | | | | 1,490,931 | |
American Electric Power Co., Inc. | | | 16,634 | | | | 1,558,439 | |
CenterPoint Energy, Inc. | | | 51,389 | | | | 1,550,920 | |
CMS Energy Corp. (b) | | | 24,184 | | | | 1,546,567 | |
Consolidated Edison, Inc. | | | 16,016 | | | | 1,513,032 | |
Dominion Energy, Inc. (b) | | | 18,682 | | | | 1,513,989 | |
DTE Energy Co. | | | 11,555 | | | | 1,536,353 | |
Duke Energy Corp. (b) | | | 17,217 | | | | 1,650,422 | |
Entergy Corp. | | | 13,470 | | | | 1,580,839 | |
Evergy, Inc. | | | 24,210 | | | | 1,611,418 | |
Eversource Energy (b) | | | 19,353 | | | | 1,654,101 | |
Exelon Corp. | | | 32,072 | | | | 1,549,398 | |
FirstEnergy Corp. (b) | | | 30,498 | | | | 1,470,919 | |
NextEra Energy, Inc. (b) | | | 6,986 | | | | 1,627,668 | |
Pinnacle West Capital Corp. | | | 15,132 | | | | 1,468,863 | |
PPL Corp. | | | 41,763 | | | | 1,315,117 | |
Public Service Enterprise Group, Inc. | | | 24,104 | | | | 1,496,376 | |
Sempra Energy | | | 10,389 | | | | 1,533,520 | |
The Southern Co. | | | 23,723 | | | | 1,465,370 | |
WEC Energy Group, Inc. (b) | | | 16,525 | | | | 1,571,528 | |
Xcel Energy, Inc. | | | 24,004 | | | | 1,557,620 | |
| | | | | | | | 33,776,720 | |
Electronics – 0.98% | | | | | | | | |
Honeywell International, Inc. | | | 7,885 | | | | 1,334,142 | |
| | | | | | | | | |
Environmental Control – 2.36% | | | | | | | | |
Republic Services, Inc. | | | 19,006 | | | | 1,644,969 | |
Waste Management, Inc. | | | 13,567 | | | | 1,560,205 | |
| | | | | | | | 3,205,174 | |
Food – 3.79% | | | | | | | | |
Hormel Foods Corp. (b) | | | 28,358 | | | | 1,240,095 | |
McCormick & Co., Inc. (b) | | | 6,952 | | | | 1,086,598 | |
Mondelez International, Inc. – Class A | | | 26,597 | | | | 1,471,346 | |
The Hershey Co. | | | 8,753 | | | | 1,356,627 | |
| | | | | | | | 5,154,666 | |
The accompanying notes are an integral part of these financial statements.
Schedule of Investments
September 30, 2019 (Continued)
| | | Shares | | | Value | |
Gas - 1.94% | | | | | | | | |
Atmos Energy Corp. (b) | | | 12,788 | | | $ | 1,456,425 | |
NiSource, Inc. (b) | | | 39,748 | | | | 1,189,260 | |
| | | | | | | | 2,645,685 | |
Healthcare - Products - 0.96% | | | | | | | | |
Medtronic PLC | | | 12,046 | | | | 1,308,437 | |
| | | | | | | | | |
Insurance - 13.41% | | | | | | | | |
Aflac, Inc. | | | 25,822 | | | | 1,351,007 | |
Aon PLC | | | 6,129 | | | | 1,186,391 | |
Arthur J Gallagher & Co. (b) | | | 16,129 | | | | 1,444,675 | |
Assurant, Inc. | | | 9,769 | | | | 1,229,136 | |
Berkshire Hathaway, Inc. - Class B (a) | | | 6,078 | | | | 1,264,346 | |
Chubb Ltd. | | | 8,653 | | | | 1,396,940 | |
Cincinnati Financial Corp. (b) | | | 10,981 | | | | 1,281,153 | |
Everest Re Group Ltd. | | | 4,554 | | | | 1,211,774 | |
Globe Life, Inc. | | | 14,168 | | | | 1,356,728 | |
Loews Corp. | | | 23,812 | | | | 1,225,842 | |
Marsh & McLennan Companies, Inc. (b) | | | 13,146 | | | | 1,315,257 | |
The Allstate Corp. | | | 11,412 | | | | 1,240,256 | |
The Hartford Financial Services Group, Inc. | | | 22,686 | | | | 1,374,998 | |
The Travelers Companies, Inc. (b) | | | 9,268 | | | | 1,378,059 | |
| | | | | | | | 18,256,562 | |
Oil & Gas - 0.89% | | | | | | | | |
Exxon Mobil Corp. (b) | | | 17,208 | | | | 1,215,057 | |
| | | | | | | | | |
Pharmaceuticals - 1.78% | | | | | | | | |
Johnson & Johnson | | | 9,230 | | | | 1,194,177 | |
Merck & Co., Inc. | | | 14,587 | | | | 1,227,934 | |
| | | | | | | | 2,422,111 | |
Retail - 5.03% | | | | | | | | |
Genuine Parts Co. (b) | | | 13,917 | | | | 1,385,994 | |
McDonald's Corp. | | | 6,565 | | | | 1,409,571 | |
The Home Depot, Inc. | | | 5,461 | | | | 1,267,061 | |
Walmart, Inc. (b) | | | 11,534 | | | | 1,368,855 | |
Yum! Brands, Inc. | | | 12,500 | | | | 1,417,875 | |
| | | | | | | | 6,849,356 | |
The accompanying notes are an integral part of these financial statements.
Schedule of Investments
September 30, 2019 (Continued)
| | | Shares | | | Value | |
Software - 3.74% | | | | | | | | |
Citrix Systems, Inc. | | | 15,054 | | | $ | 1,453,011 | |
Fidelity National Information Services, Inc. (b) | | | 8,608 | | | | 1,142,798 | |
Jack Henry & Associates, Inc. (b) | | | 8,224 | | | | 1,200,457 | |
Paychex, Inc. (b) | | | 15,669 | | | | 1,296,923 | |
| | | | | | | | 5,093,189 | |
Telecommunications - 0.96% | | | | | | | | |
Verizon Communications, Inc. | | | 21,732 | | | | 1,311,744 | |
| | | | | | | | | |
Water - 1.06% | | | | | | | | |
American Water Works Co., Inc. (b) | | | 11,640 | | | | 1,446,037 | |
TOTAL COMMON STOCKS (Cost $93,760,725) | | | | | | | 109,605,496 | |
| | | | | | | | | |
REAL ESTATE INVESTMENT TRUSTS - 19.15% | | | | | | | | |
Apartments - 6.12% | | | | | | | | |
Apartment Investment & Management Co. - Class A | | | 25,450 | | | | 1,326,963 | |
AvalonBay Communities, Inc. | | | 6,701 | | | | 1,442,926 | |
Equity Residential (b) | | | 16,984 | | | | 1,465,040 | |
Essex Property Trust, Inc. | | | 4,174 | | | | 1,363,437 | |
Mid-America Apartment Communities, Inc. | | | 10,623 | | | | 1,381,096 | |
UDR, Inc. | | | 28,040 | | | | 1,359,379 | |
| | | | | | | | 8,338,841 | |
Diversified - 4.63% | | | | | | | | |
American Tower Corp. | | | 5,845 | | | | 1,292,505 | |
Crown Castle International Corp. (b) | | | 9,345 | | | | 1,299,049 | |
Duke Realty Corp. | | | 37,076 | | | | 1,259,472 | |
SBA Communications Corp. | | | 4,741 | | | | 1,143,292 | |
Vornado Realty Trust | | | 20,607 | | | | 1,312,047 | |
| | | | | | | | 6,306,365 | |
Office Property - 2.74% | | | | | | | | |
Alexandria Real Estate Equities, Inc. (b) | | | 8,178 | | | | 1,259,739 | |
Boston Properties, Inc. | | | 9,507 | | | | 1,232,678 | |
SL Green Realty Corp. | | | 15,156 | | | | 1,239,003 | |
| | | | | | | | 3,731,420 | |
Regional Malls - 0.89% | | | | | | | | |
Simon Property Group, Inc. | | | 7,758 | | | | 1,207,533 | |
The accompanying notes are an integral part of these financial statements.
Schedule of Investments
September 30, 2019 (Continued)
| | | Shares | | | Value | |
Shopping Centers - 1.97% | | | | | | | | |
Federal Realty Investment Trust | | | 9,951 | | | $ | 1,354,729 | |
Regency Centers Corp. | | | 19,146 | | | | 1,330,456 | |
| | | | | | | | 2,685,185 | |
Single Tenant - 0.97% | | | | | | | | |
Realty Income Corp. | | | 17,162 | | | | 1,315,982 | |
| | | | | | | | | |
Storage - 1.83% | | | | | | | | |
Extra Space Storage, Inc. | | | 10,734 | | | | 1,253,946 | |
Public Storage | | | 5,064 | | | | 1,242,047 | |
| | | | | | | | 2,495,993 | |
TOTAL REAL ESTATE INVESTMENT TRUSTS (Cost $22,911,235) | | | | | | | 26,081,319 | |
| | | | | | | | | |
INVESTMENTS PURCHASED WITH PROCEEDS FROM SECURITIES LENDING - 26.10% | | | | | | | | |
Mount Vernon Liquid Assets Portfolio, LLC, 2.13% (c) | | | 35,548,757 | | | | 35,548,757 | |
TOTAL INVESTMENTS PURCHASED WITH PROCEEDS FROM SECURITIES LENDING | | | | | | | | |
(Cost $35,548,757) | | | | | | | 35,548,757 | |
| | | | | | | | | |
SHORT TERM INVESTMENTS - 0.73% | | | | | | | | |
Money Market Funds - 0.73% | | | | | | | | |
First American Government Obligations Fund - Class X, 1.87%(c) | | | 998,244 | | | | 998,244 | |
TOTAL SHORT TERM INVESTMENTS (Cost $998,244) | | | | | | | 998,244 | |
| | | | | | | | | |
Total Investments (Cost $153,218,961) - 126.46% | | | | | | | 172,233,816 | |
Liabilities in Excess of Other Assets - (26.46)% | | | | | | | (36,038,554 | ) |
TOTAL NET ASSETS - 100.00% | | | | | | $ | 136,195,262 | |
The accompanying notes are an integral part of these financial statements.
Schedule of Investments
September 30, 2019 (Continued)
| | | % of Net | |
Asset Type | | Assets | |
Common Stocks | | | 80.48 | % |
Real Estate Investment Trusts | | | 19.15 | |
Investments Purchased with Proceeds From Securities Lending | | | 26.10 | |
Short Term Investments | | | 0.73 | |
Total Investments | | | 126.46 | |
Liabilities in Excess of Other Assets | | | (26.46 | ) |
Net Assets | | | 100.00 | % |
Percentages are stated as a percent of net assets.
(a) | Non-income producing security. |
(b) | All or a portion of this security is on loan as of September 30, 2019. The total value of securities on loan is $34,909,774, or 25.63% of net assets. See Note 6. |
(c) | Represents annualized seven-day yield as of the end of the reporting period. |
The accompanying notes are an integral part of these financial statements.
Statement of Assets and Liabilities
September 30, 2019
Assets: | | | | |
Investments, at value (a)(b) | | $ | 172,233,816 | |
Dividends and interest receivables | | | 222,626 | |
Securities lending income receivable | | | 3,275 | |
Total Assets | | | 172,459,717 | |
| | | | | |
Liabilities: | | | | |
Payable to Adviser | | | 54,530 | |
Distribution payable | | | 661,168 | |
Payable for collateral upon return of securities loaned | | | 35,548,757 | |
Total Liabilities | | | 36,264,455 | |
Net Assets | | $ | 136,195,262 | |
| | | | | |
Net Assets Consist of: | | | | |
Capital stock | | $ | 140,772,441 | |
Total distributable earnings/(accumulated deficit) | | | (4,577,179 | ) |
Net Assets | | $ | 136,195,262 | |
| | | | | |
Net Asset Value: | | | | |
Net assets | | $ | 136,195,262 | |
Shares of beneficial interest outstanding (unlimited shares without par value authorized) | | | 3,700,000 | |
Net asset value price per share | | $ | 36.81 | |
| | | | | |
(a) Cost of investments | | $ | 153,218,961 | |
(b) Including $34,909,774 of securities on loan at value. | | | | |
The accompanying notes are an integral part of these financial statements.
Statement of Operations
For the Year Ended September 30, 2019
Investment Income: | | | | |
Dividends | | $ | 3,157,241 | |
Less: Foreign withholding taxes withheld | | | (3,468 | ) |
Interest | | | 6,743 | |
Securities lending income, net | | | 14,924 | |
Total Investment Income | | | 3,175,440 | |
| | | | | |
Expenses: | | | | |
Investment advisory fee | | | 623,909 | |
Net Expenses | | | 623,909 | |
Net Investment Income/(Loss) | | | 2,551,531 | |
| | | | | |
Realized and Unrealized Gain/(Loss): | | | | |
Net realized gain/(loss) on: | | | | |
Investments | | | (1,854,567 | ) |
Redemptions sold in-kind | | | 6,066,981 | |
Net change in unrealized appreciation/(depreciation) on Investments | | | 15,245,213 | |
Net Realized and Unrealized Gain/(Loss) | | | 19,457,627 | |
Net Increase/(Decrease) in Net Assets Resulting from Operations | | $ | 22,009,158 | |
The accompanying notes are an integral part of these financial statements.
Statements of Changes in Net Assets
| | | Year Ended September 30, 2019 | | | Year Ended September 30, 2018 | |
| | | | | | | | | |
Operations: | | | | | | | | |
Net investment income/(loss) | | $ | 2,551,531 | | | $ | 2,636,476 | |
Net realized gain/(loss) | | | 4,212,414 | | | | (3,961,319 | ) |
Net change in unrealized appreciation/(depreciation) | | | 15,245,213 | | | | 2,202,960 | |
Net Increase/(Decrease) in Net Assets Resulting From Operations | | | 22,009,158 | | | | 878,117 | |
| | | | | | | | | |
Distributions Paid to Shareholders: | | | | | | | | |
Distributions paid to shareholders | | | (2,642,583 | ) | | | (2,605,818 | ) |
Total Distributions to Shareholders | | | (2,642,583 | ) | | | (2,605,818 | ) |
| | | | | | | | | |
Fund Share Transactions: | | | | | | | | |
Proceeds from shares sold | | | 39,520,873 | | | | 446,332,544 | |
Cost of shares redeemed | | | (85,176,009 | ) | | | (416,421,797 | ) |
Net Increase/(Decrease) in Net Assets From Capital Share Transactions | | | (45,655,136 | ) | | | 29,910,747 | |
| | | | | | | | | |
Total Increase/(Decrease) in Net Assets | | | (26,288,561 | ) | | | 28,183,046 | |
| | | | | | | | | |
Net Assets: | | | | | | | | |
Beginning of period | | | 162,483,823 | | | | 134,300,777 | |
End of period | | $ | 136,195,262 | | | $ | 162,483,823 | |
| | | | | | | | | |
Change in Shares Outstanding: | | | | | | | | |
Shares sold | | | 1,200,000 | | | | 13,850,000 | |
Shares redeemed | | | (2,650,002 | ) | | | (13,000,000 | ) |
Net Increase/(Decrease) | | | (1,450,002 | ) | | | 850,000 | |
The accompanying notes are an integral part of these financial statements.
Financial Highlights
| | | Year Ended September 30, 2019 | | | Year Ended September 30, 2018 | | | | Period Ended September 30, 2017 (a) | | |
Per Share Operating Performance | | | | | | | | | | | | | | |
(For a share outstanding throughout each period) | | | | | | | | | | | | | | |
| | | | | | | | | | | | | | | |
Net Asset Value, Beginning of Period | | $ | 31.55 | | | $ | 31.23 | | | | $ | 25.36 | | |
| | | | | | | | | | | | | | | |
Investment Operations: | | | | | | | | | | | | | | |
Net investment income/(loss)(b) | | | 0.66 | | | | 0.47 | | | | | 0.47 | | |
Net realized and unrealized gain/(loss) | | | 5.29 | | | | 0.32 | | (g) | | | 5.82 | | |
Total From Investment Operations | | | 5.95 | | | | 0.79 | | | | | 6.29 | | |
| | | | | | | | | | | | | | | |
Dividends Paid to Shareholders: | | | | | | | | | | | | | | |
Distributions paid from net investment income | | | (0.69 | ) | | | (0.47 | ) | | | | (0.42 | ) | |
Total Distributions Paid | | | (0.69 | ) | | | (0.47 | ) | | | | (0.42 | ) | |
Change in Net Asset Value for the Period | | | 5.26 | | | | 0.32 | | | | | 5.87 | | |
Net Asset Value, End of Period | | $ | 36.81 | | | $ | 31.55 | | | | $ | 31.23 | | |
| | | | | | | | | | | | | | | |
Total Return | | | 19.11 | % | | | 2.55 | % | | | | 24.88 | % | (c) |
| | | | | | | | | | | | | | | |
Ratios/Supplemental Data: | | | | | | | | | | | | | | |
Net assets, end of period (000) | | $ | 136,195 | | | $ | 162,484 | | | | $ | 134,301 | | |
Ratio of net expenses to average net assets: | | | 0.49 | % | | | 0.52 | % | (e) | | | 0.49 | % | (d) |
Ratio of net investment income/(loss) to average net assets: | | | 2.00 | % | | | 1.47 | % | | | | 1.66 | % | (d) |
Portfolio turnover rate (f) | | | 44 | % | | | 667 | % | | | | 179 | % | (c) |
| (a) | Since Commencement of Operations on October 19, 2016. |
| (b) | Net investment income/(loss) per share has been calculated based on average shares outstanding during the period. |
| (c) | Not annualized. |
| (d) | Annualized. |
| (e) | The ratio of net expenses to average net assets includes interest expense fees of 0.03%. |
| (f) | Excludes in-kind transactions associated with creations and redemptions of the Fund. |
| (g) | Net realized and unrealized gain/(loss) per share includes balancing amounts necessary to reconcile the change in net asset value per share for the period, and may not reconcile with the aggregate gain/(loss) in the Statement of Operations due to share transactions for the period. |
The accompanying notes are an integral part of these financial statements.
Notes to Financial Statements
September 30, 2019
1. ORGANIZATION
The Innovator ETFs Trust II (the “Trust”) was organized as a Massachusetts business trust on December 17, 2013, and is authorized to issue an unlimited number of shares. The Trust is an open-end management investment company, registered under the Investment Company Act of 1940, as amended (the “1940 Act”). Effective April 1, 2018, the Trust changed from Elkhorn ETF Trust to Innovator ETFs Trust II. As a result, the Elkhorn Lunt Low Vol/High Beta Tactical ETF Fund’s name was changed to the Innovator Lunt Low Vol/High Beta Tactical ETF (the “Fund”), the Fund’s ticker symbol remained the same (LVHB). The Fund is classified as a non-diversified series of the Trust. The Fund commenced operations on October 19, 2016. The Fund lists and principally trades its shares on Cboe BZX Exchange, Inc. (“Cboe BZX” or the “Exchange”). The Fund seeks investment results that generally correspond (before fees and expenses) to the price and yield of the Lunt Capital US Large Cap Equity Rotation Index.
The Fund is an investment company and accordingly follows the investment company accounting and reporting guidance of the Financial Accounting Standards Board (“FASB”) Accounting Standards Codification (“ASC”) Topic 946 “Financial Services — Investment Companies”.
2. SIGNIFICANT ACCOUNTING POLICIES
The following is a summary of significant accounting policies consistently followed by the Fund in the preparation of its financial statements. These policies are in conformity with accounting principles generally accepted in the United States of America (“U.S. GAAP”).
Valuation:
The net asset value (“NAV”) of the Fund is determined as of the close of regular trading on the NYSE (normally 4:00 p.m. ET). If the NYSE closes early on a valuation day, the Fund shall determine NAV as of that time.
Portfolio securities generally shall be valued utilizing prices provided by independent pricing services. The Trust’s Pricing Committee (“Pricing Committee”) is responsible for establishing valuation of portfolio securities and other instruments held by the Fund in accordance with the Trust’s valuation procedures.
Notes to Financial Statements
September 30, 2019 (Continued)
Common stocks, preferred stocks and other equity securities listed on any national or foreign exchange (excluding the NASDAQ National Market (“NASDAQ”) and the London Stock Exchange Alternative Investment Market (“AIM”)) are generally valued at the last sale price on the exchange on which they are principally traded or, for NASDAQ and AIM securities, the official closing price. Securities traded on more than one securities exchange are valued at the last sale price or official closing price, as applicable, at the close of the exchange representing the principal market for such securities. Securities traded in the over-the-counter market are valued at the mean of the bid and the asked price, if available, and otherwise at their closing bid price. Redeemable securities issued by open-end investment companies shall be valued at the investment company’s applicable net asset value, with the exception of exchange-traded open-end investment companies which are priced as equity securities. Shares of Mount Vernon Liquid Assets Portfolio, LLC are not traded on an exchange and are valued at the investment company’s net asset value per share as provided by the underlying fund’s administrator. Fixed income securities, swaps, currency-, credit- and commodity-linked notes, and other similar instruments will be valued using a pricing service. Fixed income securities having a remaining maturity of 60 days or less when purchased will be valued at cost adjusted for amortization of premiums and accretion of discounts, provided the Pricing Committee has determined that the use of amortized cost is an appropriate reflection of fair value given market and issuer specific conditions existing at the time of the determination. Foreign securities and other assets denominated in foreign currencies are translated into U.S. dollars at the exchange rate of such currencies against the U.S. dollar as provided by the pricing service. All assets denominated in foreign currencies will be converted into U.S. dollars at the exchange rates in effect at the time of valuation. Restricted securities (with the exception of Rule 144A Securities for which market quotations are available) will normally be valued at fair value as determined by the Pricing Committee.
Notes to Financial Statements
September 30, 2019 (Continued)
If no quotation can be obtained from a pricing service, then the Pricing Committee will then attempt to obtain one or more broker quotes for the security. If no quotation is available from either a pricing service or one or more brokers or if the Pricing Committee has reason to question the reliability or accuracy of a quotation supplied or the use of amortized cost, the value of any portfolio security held by the Fund for which reliable market quotations are not readily available will be determined by the Pricing Committee in a manner that most appropriately reflects fair market value of the security on the valuation date. The use of a fair valuation method may be appropriate if, for example: (i) market quotations do not accurately reflect fair value of an investment; (ii) an investment’s value has been materially affected by events occurring after the close of the exchange or market on which the investment is principally traded (for example, a foreign exchange or market); (iii) a trading halt closes an exchange or market early; or (iv) other events result in an exchange or market delaying its normal close.
Fair valuation measurement:
FASB established a framework for measuring fair value in accordance with U.S. GAAP. Under ASC, Fair Value Measurement (“ASC 820”), various inputs are used in determining the value of the exchange traded fund’s investments. The inputs or methodology used for valuing securities are not necessarily an indication of the risk associated with investing in those securities. The three Levels of inputs of the fair value hierarchy are defined as follows:
| | Level 1 — | Unadjusted quoted prices in active markets for identical assets or liabilities. |
| | Level 2 — | Observable inputs other than quoted prices included in Level 1 that are observable for the asset or liability, either directly or indirectly. These inputs may include quoted prices for the identical instrument on an inactive market, prices for similar securities, interest rates, prepayment speeds, credit risk, yield curves, default rates and similar data. |
| | Level 3 — | Unobservable inputs for the asset or liability, to the extent relevant observable inputs are not available; representing the Fund’s own assumptions about the assumptions a market participant would use in valuing the asset or liability, and would be based on the best information available. |
Notes to Financial Statements
September 30, 2019 (Continued)
A financial instrument’s level within the fair value hierarchy is based on the lowest level of any input that is significant to the fair value measurement.
The availability of observable inputs can vary from security to security and is affected by a wide variety of factors, including, for example, the type of security, whether the security is new and not yet established in the marketplace, the liquidity of markets, and other characteristics particular to the security. To the extent that valuation is based on models or inputs that are less observable or unobservable in the market, the determination of fair value requires more judgment. Accordingly, the degree of judgment exercised in determining fair value is greatest for instruments categorized in Level 3.
The following table summarizes valuation of the Fund’s investments under the fair value hierarchy levels as of September 30, 2019:
| | | Level 1 | | | Level 2 | | | Level 3 | | | Total | |
Assets | | | | | | | | | | | | | | | | |
Common Stocks | | $ | 109,605,496 | | | $ | — | | | $ | — | | | $ | 109,605,496 | |
Real Estate Investment Trusts | | | 26,081,319 | | | | — | | | | — | | | | 26,081,319 | |
Investments Purchased with Proceeds From Securities Lending | | | — | | | | 35,548,757 | | | | — | | | | 35,548,757 | |
Short Term Investments | | | 998,244 | | | | — | | | | — | | | | 998,244 | |
Total Assets | | $ | 136,685,059 | | | $ | 35,548,757 | | | $ | — | | | $ | 172,233,816 | |
See the Schedule of Investments for the investments detailed by industry classification.
There were no level 3 investments held by the Fund during the reporting period.
Investment Transactions and Investment Income:
Investment transactions are recorded on the trade date. Realized gains and losses on sales of investment securities are calculated using specific identification basis. Dividend income, if any, is recorded on the ex-dividend date or, in the case of foreign securities, as soon as the Fund is informed of the ex- dividend dates. Withholding taxes on foreign dividends have been provided for in accordance with applicable country’s tax rules and rate. Interest income, including accretion of discounts and amortization of premiums, is recorded on an accrual basis using the effective yield method.
Notes to Financial Statements
September 30, 2019 (Continued)
Distributions received from the Fund’s investments in a Real Estate Investment Trust (“REIT”) may be characterized as ordinary income, net capital gain, or a return of capital. The proper characterization of REIT distributions is generally not known until after the end of each calendar year. As such, the Fund must use estimates in reporting the character of their income and distributions for financial statement purposes. The actual character of distributions to the Fund’s shareholders will be reflected on the Form 1099 received by shareholders after the end of the calendar year. Due to the nature of REIT investments, a portion of the distributions received by the Fund’s shareholders may represent a return of capital.
Use of Estimates:
In preparing financial statements in conformity with U.S. GAAP, management is required to make estimates and assumptions that affect the reported amounts of assets and liabilities and disclosure of contingent assets and liabilities as of the date of the financial statements and the reported amounts of increases and decreases in net assets from operations during the reporting period. Actual results could differ from these estimates.
Tax Information, Dividends and Distributions to Shareholders:
The Fund is treated as a separate entity for federal income tax purposes. The Fund intends to qualify as a regulated investment company (“RIC”) under Subchapter M of the Internal Revenue Code of 1986, as amended (the “Internal Revenue Code”). To qualify and remain eligible for the special tax treatment accorded to RICs, the Fund must meet certain annual income and quarterly asset diversification requirements and must distribute annually at least 90% of the sum of (i) its investment company taxable income (which includes dividends, interest and net short-term capital gains) and (ii) certain net tax-exempt income, if any. If so qualified, the Fund will not be subject to federal income tax to the extent it distributes substantially all of its net investment income and capital gains to shareholders.
Distributions to shareholders are recorded on the ex-dividend date. The Fund generally pays out dividends from its net investment income, if any, quarterly, and distributes its net capital gains, if any, to shareholders at least annually. The amount of dividends and distributions from net investment income and net realized capital gains are determined in accordance with Federal income tax regulations, which may differ from U.S. GAAP. These “book/tax” differences are either considered temporary or permanent in nature. To the extent these differences are permanent in nature, such amounts are reclassified within the components of net assets based on their Federal tax basis treatment; temporary differences do not require reclassification. Dividends and distributions, which exceed earnings and profit for tax purposes are reported as a tax return of capital.
Notes to Financial Statements
September 30, 2019 (Continued)
Management evaluates the Fund’s tax positions to determine if the tax positions taken meet the minimum recognition threshold in connection with accounting for uncertainties in income tax positions taken or expected to be taken for the purposes of measuring and recognizing tax liabilities in the financial statements. Tax benefits associated with an uncertain tax position can be recognized only when the position is “more likely than not” to be sustained assuming examination by taxing authorities. Interest and penalties related to income taxes would be recorded as income tax expense in the Statement of Operations. During the period ended September 30, 2019, the Fund did not incur any interest or penalties. The Fund’s federal income tax returns are subject to examination by the Internal Revenue Service (IRS) for a period of three fiscal years after they are filed. State and local tax returns may be subject to examination for an additional fiscal year depending on the jurisdiction. As of September 30, 2019, the Fund did not have a liability for any unrecognized tax benefits. As of September 30, 2019, the Fund has no examinations in progress and management is not aware of any tax positions for which it is reasonably possible that the amounts of unrecognized tax benefits will significantly change in the next twelve months. The Fund is subject to examination by U.S. Federal tax authorities for all tax years since inception.
U.S. GAAP requires that certain components of net assets relating to permanent differences be reclassified between distributable earnings/(accumulated deficit) and additional paid-in capital. These reclassifications have no effect on net assets or net asset value per share. The permanent differences primarily relate to redemptions in-kind. For the year ended September 30, 2019, the following table shows the reclassification made:
| | | Distributable Earnings / (Accumulated Deficit) | | | Pain-In Capital | |
| | | $ | (6,029,833 | ) | | $ | 6,029,833 | |
Indemnification:
In the normal course of business, the Fund enters into contracts that contain a variety of representations and warranties which provide general indemnities. The Fund’s maximum exposure under these arrangements is unknown, as this would involve future claims that may be made against the Fund that have not yet occurred. However, based on industry experience, the Fund expects this risk of loss due to these warranties and indemnities to be remote.
Notes to Financial Statements
September 30, 2019 (Continued)
3. INVESTMENT ADVISORY AND OTHER AGREEMENTS
Investment Advisory:
Effective April 1, 2018, Innovator Capital Management, LLC (the “Adviser”) was appointed to serve as the investment adviser to the Fund, pursuant to an Interim Investment Advisory Agreement with the Trust on behalf of the Fund (“Interim Advisory Agreement”).
On April 10, 2018, the Board of Trustees of Elkhorn ETF Trust approved the New Advisory Agreement between the Trust and Innovator and recommended that the New Advisory Agreement be submitted to Fund shareholders for approval. The New Advisory Agreement was approved at the June 20, 2018 shareholder meeting.
Pursuant to the New Advisory Agreement the Fund pays to the Advisor a fee calculated daily and payable monthly, at an annual rate of 0.49% of the Fund’s average daily net assets, in return for management and supervisory services.
Subject to the supervision of the Board of Trustees (the “Board”), the Adviser pays substantially all expenses associated with the operation of the Fund, except for fees paid under the New Advisory Agreement, distribution and service fees payable pursuant to a Rule 12b-1 plan, if any, brokerage commissions and other expenses connected with the execution of portfolio transactions, taxes, interest, and extraordinary expenses.
Sub-Advisory:
Penserra Capital Management LLC (the “Sub-Adviser”) acts as sub-adviser to the Fund pursuant to sub-advisory agreement between the Adviser and the Sub-Adviser with respect to the Fund (“Sub-Advisory Agreement”) and, pursuant to the Sub-Advisory Agreement, is responsible for execution of the Sub-Adviser’s strategy for the Fund. The Sub-Adviser is responsible for the day-to-day management of the Fund’s portfolio. Pursuant to the Sub-Advisory Agreement between the Adviser and the Sub-Adviser, the Adviser pays the Sub-Adviser a fee for the services and facilities it provides payable on a monthly basis.
Notes to Financial Statements
September 30, 2019 (Continued)
Other Agreements:
U.S. Bancorp Fund Services, LLC, doing business as U.S. Bank Global Fund Services (“Fund Services”), serves as the Fund’s Administrator, Accounting Agent and Transfer Agent pursuant to service agreements with the Trust on behalf of the Fund. U.S. Bank N.A., an affiliate of Fund Services, serves as the Fund’s custodian pursuant to a custodian agreement with the Trust on behalf of the Fund. Prior to January 25, 2019, The Bank of New York Mellon served in these capacities. Foreside Fund Services, LLC (the “Distributor”) serves as the Fund’s distributor pursuant to a Distribution Service Agreement.
4. CREATION AND REDEMPTION TRANSACTIONS
There were an unlimited number of shares of beneficial interest (without par value) authorized by the Trust. Individual shares of the Fund may only be purchased and sold at market prices on the Exchange through a broker-dealer. Such transactions may be subject to customary commission rates imposed by the broker-dealer, and market prices for the Fund’s shares may be at, above or below its NAV depending on the premium or discount at which the Fund’s shares trade.
The Fund issues and redeems shares at its NAV only in a large specified number of shares each called a “Creation Unit,” or multiples thereof, and only with “authorized participants” who have entered into contractual arrangements with the Distributor. A Creation Unit for the Fund consists of 50,000 shares. Except when aggregated in Creation Units, shares of the Fund are not redeemable. Transactions in shares for the Fund are disclosed in detail in the Statements of Changes in Net Assets. The consideration for a purchase of Creation Units generally consists of the in-kind deposit of specified securities and an amount of cash or, as permitted or required by the Fund, of cash. A fixed transaction fee of $500 is currently imposed on each creation and redemption transaction. The transaction fee is applicable to each purchase and redemption transaction regardless of the number of creation units in the transaction.
5. INVESTMENT TRANSACTIONS
For the year ended September 30, 2019, the cost of purchases and the proceeds from sales of investment securities (excluding short- term investments and in-kind purchases and sales) were as follows:
Purchases | | | Sales | |
U.S. Government | | | Other | | | U.S. Government | | | Other | |
| $ | — | | | $ | 71,925,942 | | | $ | — | | | $ | 57,367,078 | |
Notes to Financial Statements
September 30, 2019 (Continued)
For the year ended September 30, 2019, the in-kind transactions associated with creations and redemptions were as follows:
| | | In-Kind | | | In-Kind | |
| | | Creations | | | Redemptions | |
| | | $ | 24,060,131 | | | $ | 84,041,139 | |
Net Capital gains or losses resulting from in-kind redemptions are excluded the Fund’s taxable gains and are not distributed to shareholders.
6. SECURITIES LENDING
The Fund may lend up to 331/3% of the value of the securities in its portfolio to brokers, dealers and financial institutions (but not individuals) under terms of participation in a securities lending program administered by the securities lending agent. The Trust has entered into a Securities Lending Agreement (“SLA”) with U.S. Bank, N.A., the fund’s custodian (the “Agent”). Under the terms of the SLA, the Fund may lend securities to certain broker-dealers and banks in exchange for collateral in the amount of at least 102% of the value of U.S. securities loaned or at least 105% of the value of non-U.S. securities loaned, marked to market daily. The collateral can be received in the form of cash collateral and/or non-cash collateral. Non-cash collateral can include U.S. Government Securities and letters of credit. The cash collateral is invested in the Mount Vernon Liquid Assets Portfolio, LLC (“Mount Vernon”), as noted in the Fund's Schedule of Investments. Mount Vernon seeks to maximize current income to the extent consistent with the preservation of capital and liquidity; and to maintain a stable NAV of $1.00. The market value of the loaned securities is determined daily at the close of business of the Fund and any additional required collateral is delivered to the Fund on the next business day. The Fund continues to benefit from interest or dividends on the securities loaned and may also earn a return from the collateral. The Fund pays various fees in connection with the investment of cash collateral. The Fund pays the Agent fees based on the investment income received from securities lending activities. Although risk is mitigated by the collateral, the Fund could experience a delay in recovering its securities and possible loss of income or value if the borrower fails to return them. Cash and cash equivalent collateral on securities lending transactions are on an overnight and continuous basis.
Notes to Financial Statements
September 30, 2019 (Continued)
As of September 30, 2019, the values of the securities on loan, cash collateral received and fees and interest earned were as follows:
| | | Value of Securities on Loan | | | Cash Collateral Received | | | Fees and Interest Earned | |
| | | $ | 34,909,774 | | | $ | 35,548,757 | | | $ | 14,924 | |
Due to the absence of a master netting agreement related to the Fund’s participation in securities lending, no additional offsetting disclosures have been made on behalf of the Fund for the total borrowings listed above.
7. FEDERAL INCOME TAX MATTERS
At September 30, 2019, the cost of investments and net unrealized appreciation/(depreciation) for federal income tax purposes were as follows:
| | | Cost of Portfolio | | | Gross Unrealized Appreciation | | | Gross Unrealized Depreciation | | | Net Unrealized Appreciation/ (Depreciation) | |
| | | $ | 153,250,369 | | | $ | 20,386,289 | | | $ | (1,402,842 | ) | | $ | 18,983,447 | |
The differences between book and tax basis cost of investments and net unrealized appreciation/(depreciation) are primarily attributable to wash sales and dividends payable.
At September 30, 2019, the components of undistributed or accumulated earnings/loss on a tax-basis were as follows:
Accumulated Capital and Other Losses | | | Dividends Payable | | | Undistributed Net Ordinary Income | | | Unrealized Appreciation/ (Depreciation) on Investments | | | Total Distributable Earnings/ (Accumulated Deficit) | |
| | | | | | | | | | | | | | | | | | | |
| $ | (23,543,784 | ) | | $ | (661,168 | ) | | $ | 644,326 | | | $ | 18,983,447 | | | $ | (4,577,179 | ) |
Notes to Financial Statements
September 30, 2019 (Continued)
The tax character of distributions paid during the fiscal years ended September 30, 2019 and September 30, 2018, were as follows:
| | | Year Ended September 30, 2019 | | | Year Ended September 30, 2018 | |
Distributions paid from: | | | | | | | | |
Net Ordinary Income | | $ | 1,981,415 | | | $ | 2,605,818 | |
Net Long-Term Capital Gains | | | — | | | | — | |
Return of Capital | | | — | | | | — | |
Total Distributions Paid | | $ | 1,981,415 | | | $ | 2,605,818 | |
Certain capital and qualified late year ordinary losses incurred after October 31 and December 31, respectively, and within the current taxable year, are deemed to arise on the first business day of the Fund’s next taxable year. During the fiscal year ended September 30, 2019, the Fund did not elect to defer qualified post-October capital or late year ordinary losses.
At September 30, 2019, for Federal income tax purposes, the fund has capital loss carryforwards available to offset future capital gains for unlimited period. To the extent that these loss carryforwards are utilized, capital gains so offset will not be distributed to shareholders.
| | | Indefinite Short-Term | | | Indefinite Long-Term | |
| | $ | (23,543,784 | ) | | $ | — | |
Notes to Financial Statements
September 30, 2019 (Continued)
8. PRINCIPAL RISKS
In the normal course of business, the Fund makes investments in financial instruments where the risk of potential loss exists due to changes in the market. The following is a description of select risks of investing in the Fund.
Index Risk. The Fund is not actively managed. The Fund invests in securities included in or representative of its Index regardless of its investment merit. Therefore, the Fund would not necessarily buy or sell a security unless that security is added or removed, respectively, from the Index, even if that security generally is underperforming.
Non-Diversified Risk. Because the Fund is non-diversified and can invest a greater portion of its assets in securities of individual issuers than diversified funds, changes in the market value of a single investment could cause greater fluctuations in share price than would a diversified fund.
The Fund’s prospectus contains additional information regarding risks associated with investments in the Fund.
9. SUBSEQUENT EVENT
On March 21, 2019, the Board of Trustees approved a change in the Fund’s fiscal year end from September 30 to October 31, effective October 1, 2019.
Management has evaluated the impact of all subsequent events on the Fund through the date the financial statements were issued, and has determined that there were no other subsequent events requiring recognition or disclosure in the financial statements.
Report of Independent Registered Public Accounting Firm
To the Shareholders of Innovator Lunt Low Vol/High Beta Tactical ETF and
Board of Trustees of Innovator ETFs Trust II
Opinion on the Financial Statements
We have audited the accompanying statement of assets and liabilities, including the schedule of investments, of Innovator Lunt Low Vol/High Beta Tactical ETF (the “Fund”), a series of Innovator ETFs Trust II, as of September 30, 2019, and the related statement of operations for the year then ended, and the statements of changes in net assets, including the related notes, and the financial highlights for each of the two years in the period then ended (collectively referred to as the “financial statements”). In our opinion, the financial statements present fairly, in all material respects, the financial position of the Fund as of September 30, 2019, the results of its operations for the year then ended, and the changes in its net assets and the financial highlights for each of the two years in the period then ended, in conformity with accounting principles generally accepted in the United States of America.
The Fund’s financial highlights for the period October 19, 2016 (commencement of operations) through September 30, 2017, were audited by other auditors whose report dated November 29, 2017, expressed an unqualified opinion on those financial highlights.
Basis for Opinion
These financial statements are the responsibility of the Fund’s management. Our responsibility is to express an opinion on the Fund’s financial statements based on our audits. We are a public accounting firm registered with the Public Company Accounting Oversight Board (United States) (“PCAOB”) and are required to be independent with respect to the Fund in accordance with the U.S. federal securities laws and the applicable rules and regulations of the Securities and Exchange Commission and the PCAOB.
We conducted our audits in accordance with the standards of the PCAOB. Those standards require that we plan and perform the audit to obtain reasonable assurance about whether the financial statements are free of material misstatement, whether due to error or fraud.
Our audits included performing procedures to assess the risks of material misstatement of the financial statements, whether due to error or fraud, and performing procedures that respond to those risks. Such procedures included examining, on a test basis, evidence regarding the amounts and disclosures in the financial statements. Our procedures included confirmation of securities owned as of September 30, 2019, by correspondence with the custodian. Our audits also included evaluating the accounting principles used and significant estimates made by management, as well as evaluating the overall presentation of the financial statements. We believe that our audits provide a reasonable basis for our opinion.
We have served as the auditor of one or more of Innovator Capital Management, LLC’s investment companies since 2017.
COHEN & COMPANY, LTD.
Cleveland, Ohio
November 26, 2019
Trustees and Officers (Unaudited)
Name, Address and Year of Birth | Position(s) with the Trust | Length of Time Served* | Principal Occupation(s) During Past 5 Years | Number of Portfolios in Fund Complex(a) Overseen by Trustee or Officer | Other Directorships Held by Trustee or Officer in the Past Five Years |
Independent Trustees |
Mark Berg 109 N. Hale Street, Wheaton, IL 60187 Year of Birth: 1971 | Trustee | Since 2017 | Founding Principal and Chief Executive Officer (2019-present), Founding Principal and President (2001-2019), Timothy Financial Counsel Inc. | 34 | None |
Joe Stowell 109 N. Hale Street, Wheaton, IL 60187 Year of Birth: 1968 | Trustee | Since 2017 | Chief Operating Officer, Woodmen Valley Chapel (2015 - present); Executive Vice President and Chief Operating Officer, English Language Institute/China (2007 - 2015). | 34 | Board of Advisors, Westmont College |
Brian J. Wildman 109 N. Hale Street, Wheaton, IL 60187 Year of Birth: 1963 | Trustee | Since 2017 | President, Timothy Financial Counsel Inc. (2019-present); Executive Vice President, Consumer Banking (2016 –2019), Chief Risk Officer (2013 - 2016), MB Financial Bank. | 34 | MB Financial Bank (2003- 2019); Missionary Furlough Homes, Inc. (Since 2008). |
Trustees and Officers (Unaudited) (Continued)
Interested Trustee & Officer |
H. Bruce Bond (b) 109 N. Hale Street, Wheaton, IL 60187 Year of Birth: 1963 | Interested Trustee, President and Principal Executive Officer | Since 2017 | Chief Executive Officer of Innovator Capital Management, LLC (2017 - present). | 34 | None |
Officers |
John W. Southard 109 N. Hale Street, Wheaton, IL 60187 Year of Birth: 1969 | Vice President, Treasurer and Principal Financial Accounting Officer | Since 2017 | Chief Investment Officer, Innovator Capital Management, LLC (2017 - present); Director and Co-Founder, T2 Capital Management, LLC (2010 - present). | 34 | Independent Trustee, ETF Managers Group, LLC (2012 - 2018) |
James Nash (c) 10 High Street, Suite 302 Boston, MA 02110 Year of Birth: 1981 | Chief Compliance Officer and Anti-Money Laundering Officer | Since 2018 | Fund Chief Compliance Officer, Foreside Fund Officer Services, LLC (2016 – present); Senior Associate and Regulatory Administration Advisor, JPMorgan Chase & Co. (2014 – 2016). | 34 | None |
* | The Fund’s Trustees serve for an indefinite term until their resignation, death or removal. The Fund’s officers are elected annually by the Board and serve at the Board’s pleasure. |
Trustees and Officers (Unaudited) (Continued)
(a) | The Fund Complex includes the Fund, each series of Innovator ETFs Trust and Innovator ETFs Trust II. |
(b) | H. Bruce Bond is deemed to be an interested person of the Trust (as defined in the 1940 Act) because of his affiliation with the Advisor. |
(c) | Jim Nash is an employee of Foreside Fund Officer Services, LLC, a wholly-owned subsidiary of the Fund’s principal underwriter. |
The Statement of Additional Information includes additional information about the Trustees and is available upon request, without charge, by calling 1-877-386-3890.
Additional Information (Unaudited)
Investors should consider the investment objective and policies, risk considerations, charges and ongoing expenses of an investment carefully before investing. The prospectus contains this and other information relevant to an investment in the Fund. Please read the prospectus carefully before investing. A copy of the Prospectus may be obtained without charge by writing to the Trust’s Distributor, or by calling toll free at 1-800-208-5212 or visiting www.innovatoretfs.com/LVHB.
1. QUARTERLY PORTFOLIO HOLDING INFORMATION
The Fund’s complete schedule of portfolio holdings for the first and third quarters is filed with the SEC on Form N-Q. The Fund’s Form N-Q is available without charge, upon request, by calling 1-800-208-5212, or on the SEC’s website at www.sec.gov. The Trust’s Form N-Q may be reviewed and copied at the SEC’s Public Reference Room in Washington, DC. Information on the operation of the Public Reference Room may be obtained by calling 1-800-SEC-0330.
2. PROXY VOTING INFORMATION
The Fund’s Proxy Voting Policies and Procedures are available without charge, upon request, by calling 1-800-208-5212 and on the SEC’s website at www.sec.gov. Information relating to how the Fund voted proxies relating to portfolio securities held during each year ended June 30 is also available on the SEC’S website at www.sec.gov.
3. DELIVERY OF SHAREHOLDER DOCUMENTS – HOUSEHOLDING
In order to reduce expenses, the Fund delivers one copy of an annual/semiannual report, prospectus and/or proxy statement on behalf of two or more shareholders at a shared address (householding). If you are interested in enrolling in householding and receiving a single copy of the prospectus and other shareholder documents, or if you currently are enrolled in householding and wish to change your householding status, please call 1-877-FUND890 (877-386-3890). You may change your status at any time.
Additional Information (Unaudited) (Continued)
4. TAX INFORMATION
For the fiscal year ended September 30, 2019, certain dividends paid by the Fund may be subject to a maximum tax rate of 15%, as provided for by the Jobs and Growth Tax Relief Reconciliation Act of 2003.
The following table lists the percentages of dividend income distributed for the year ended September 30, 2019, that were designated as qualified dividend income under the Jobs and Growth Tax Relief Reconciliation Act of 2003 and qualify for the corporate dividends received deduction, respectively.
| | | % of Dividend Income Distributed | |
| | | Qualified Dividend Income | | | Corporate Dividends Received Deduction | |
| | | | 100.00 | % | | | 98.83 | % |
The following table lists the percentage of ordinary income distributions paid by the Fund, for the year ended September 30, 2019, that was designated as short-term capital gain distributions under Internal Revenue Code Section 871(k)(2)(c).
| | | % of Ordinary Income Distributions | |
| | | Short-Term Capital Gain Distributions | |
| | | | 0.00 | % |
INVESTMENT ADVISOR
Innovator Capital Management, LLC
109 North Hale Street,
Wheaton, IL 60187
INVESTMENT SUB-ADVISOR
Penserra Capital Management, LLC
140 Broadway, 26th Floor
New York, NY 10005
DISTRIBUTOR
Foreside Fund Services, LLC
Three Canal Plaza, Suite 100
Portland, ME 04101
ADMINISTRATOR, FUND ACCOUNTANT & TRANSFER AGENT
U.S. Bancorp Fund Services, LLC
615 East Michigan Street
Milwaukee, WI 53202
CUSTODIAN
U.S. Bank N.A.
1555 North RiverCenter Drive, Suite 302
Milwaukee, WI 53212
LEGAL COUNSEL
Chapman and Cutler LLP
111 West Monroe Street,
Chicago, Illinois 60603
INDEPENDENT REGISTERED PUBLIC ACCOUNTING FIRM
Cohen & Company, Ltd.
1350 Euclid Avenue, Suite 800
Cleveland, Ohio 44115
The registrant has adopted a code of ethics that applies to the registrant’s principal executive officer and principal financial officer. The registrant has not made any substantive amendments to its code of ethics during the period covered by this report. The registrant has not granted any waivers from any provisions of the code of ethics during the period covered by this report.
The registrant’s board of trustees has determined that there is at least one audit committee financial expert serving on its audit committee. Brian Wildman is the “audit committee financial expert” and is considered to be “independent” as each term is defined in Item 3 of Form N-CSR.
The registrant has engaged its principal accountant to perform audit services, audit-related services, tax services and other services during the past two fiscal years. “Audit services” refer to performing an audit of the registrant's annual financial statements or services that are normally provided by the accountant in connection with statutory and regulatory filings or engagements for those fiscal years. “Audit-related services” refer to the assurance and related services by the principal accountant that are reasonably related to the performance of the audit. “Tax services” refer to professional services rendered by the principal accountant for tax compliance, tax advice, and tax planning. The following table details the aggregate fees billed or expected to be billed for each of the last two fiscal years for audit fees, audit-related fees, tax fees and other fees by the principal accountant.
The audit committee has adopted pre-approval policies and procedures that require the audit committee to pre-approve all audit and non-audit services of the registrant, including services provided to any entity affiliated with the registrant.
The percentage of fees billed by the principal accountant applicable to non-audit services pursuant to waiver of pre-approval requirement were as follows:
All of the principal accountant’s hours spent on auditing the registrant’s financial statements were attributed to work performed by full-time permanent employees of the principal accountant.
Not applicable to registrants who are not listed issuers (as defined in Rule 10A-3 under the Securities Exchange Act of 1934).
The registrant is an issuer as defined in Rule 10A-3 under the Securities Exchange Act of 1934, (the “Act”) and has a separately-designated standing audit committee established in accordance with Section 3(a)(58)(A) of the Act. The independent members of the committee, consisting of the entire Board, are as follows: Brian Wildman, Joe Stowell and Mark Berg.
Not applicable to open-end investment companies.
Not applicable to open-end investment companies.
Not applicable to open-end investment companies.
There have been no material changes to the procedures by which shareholders may recommend nominees to the registrant’s board of trustees.
Not applicable to open-end investment companies.
Pursuant to the requirements of the Securities Exchange Act of 1934 and the Investment Company Act of 1940, the registrant has duly caused this report to be signed on its behalf by the undersigned, thereunto duly authorized.
Pursuant to the requirements of the Securities Exchange Act of 1934 and the Investment Company Act of 1940, this report has been signed below by the following persons on behalf of the registrant and in the capacities and on the dates indicated.