Exhibit 99.1
0 NEW YORK CITY REIT Third Quarter Investor Presentation 9 Times Square - New York, NY _
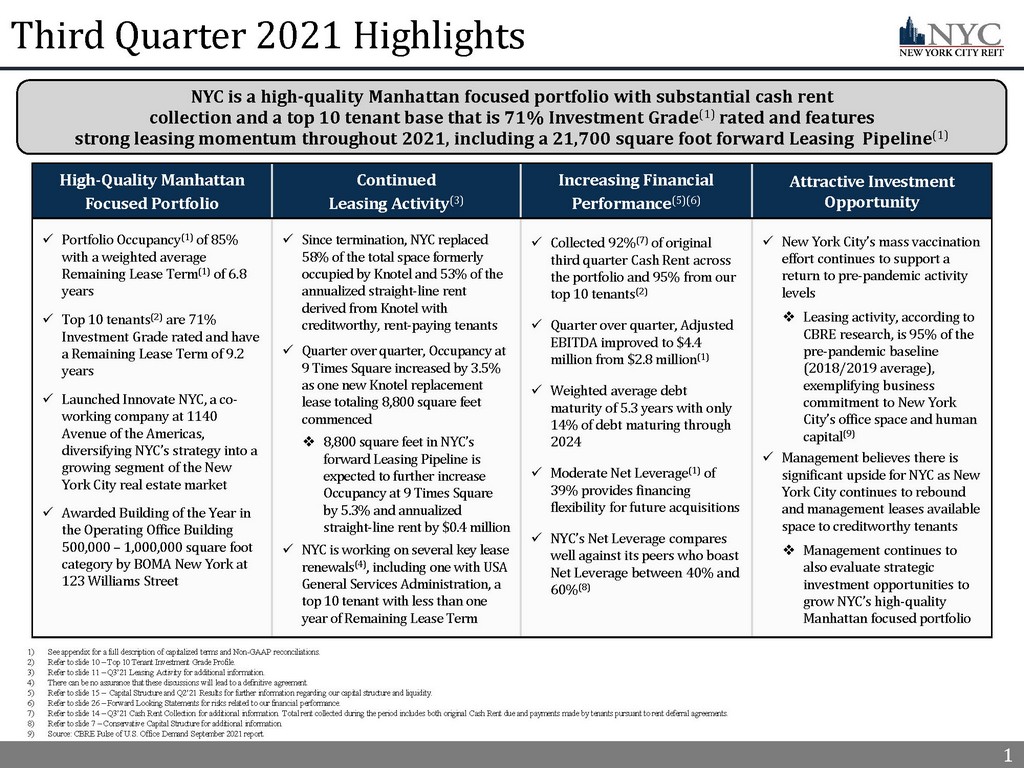
1 Third Quarter 2021 Highlights 1) See appendix for a full description of capitalized terms and Non - GAAP reconciliations. 2) Refer to slide 10 – Top 10 Tenant Investment Grade Profile. 3) Refer to slide 11 – Q3’21 Leasing Activity for additional information. 4) There can be no assurance that these discussions will lead to a definitive agreement. 5) Refer to slide 15 – Capital Structure and Q2’21 Results for further information regarding our capital structure and liquidity. 6) Refer to slide 26 – Forward Looking Statements for risks related to our financial performance. 7) Refer to slide 14 – Q3’21 Cash Rent Collection for additional information. Total rent collected during the period includes both original Cash Rent due and payments made by tenants pursuant to rent deferral agreements. 8) Refer to slide 7 – Conservative Capital Structure for additional information. 9) Source: CBRE Pulse of U.S. Office Demand September 2021 report. 1 High - Quality Manhattan Focused Portfolio Continued Leasing Activity (3) Increasing Financial Performance (5)(6) Attractive Investment Opportunity x Portfolio Occupancy (1) of 85% with a weighted average Remaining Lease Term (1) of 6.8 years x Top 10 tenants (2) are 71% Investment Grade rated and have a Remaining Lease Term of 9.2 years x Launched Innovate NYC, a co - working company at 1140 Avenue of the Americas, diversifying NYC’s strategy into a growing segment of the New York City real estate market x Awarded Building of the Year in the Operating Office Building 500,000 – 1,000,000 square foot category by BOMA New York at 123 Williams Street x Since termination, NYC replaced 58% of the total space formerly occupied by Knotel and 53% of the annualized straight - line rent derived from Knotel with creditworthy, rent - paying tenants x Quarter over quarter, Occupancy at 9 Times Square increased by 3.5% as one new Knotel replacement lease totaling 8,800 square feet commenced □ 8,800 square feet in NYC’s forward Leasing Pipeline is expected to further increase Occupancy at 9 Times Square by 5.3% and annualized straight - line rent by $0.4 million x NYC is working on several key lease renewals (4) , including one with USA General Services Administration, a top 10 tenant with less than one year of Remaining Lease Term x Collected 92% (7) of original third quarter Cash Rent across the portfolio and 95% from our top 10 tenants (2) x Quarter over quarter, Adjusted EBITDA improved to $4.4 million from $2.8 million (1) x Weighted average debt maturity of 5.3 years with only 14% of debt maturing through 2024 x Moderate Net Leverage (1) of 39% provides financing flexibility for future acquisitions x NYC’s Net Leverage compares well against its peers who boast Net Leverage between 40% and 60% (8) x New York City’s mass vaccination effort continues to support a return to pre - pandemic activity levels □ Leasing activity, according to CBRE research, is 95% of the pre - pandemic baseline (2018/2019 average), exemplifying business commitment to New York City’s office space and human capital (9) x Management believes there is significant upside for NYC as New York City continues to rebound and management leases available space to creditworthy tenants □ Management continues to also evaluate strategic investment opportunities to grow NYC’s high - quality Manhattan focused portfolio NYC is a high - quality Manhattan focused portfolio with substantial cash rent collection and a top 10 tenant base that is 71% Investment Grade (1) rated and features strong leasing momentum throughout 2021, including a 21,700 square foot forward Leasing Pipeline (1)
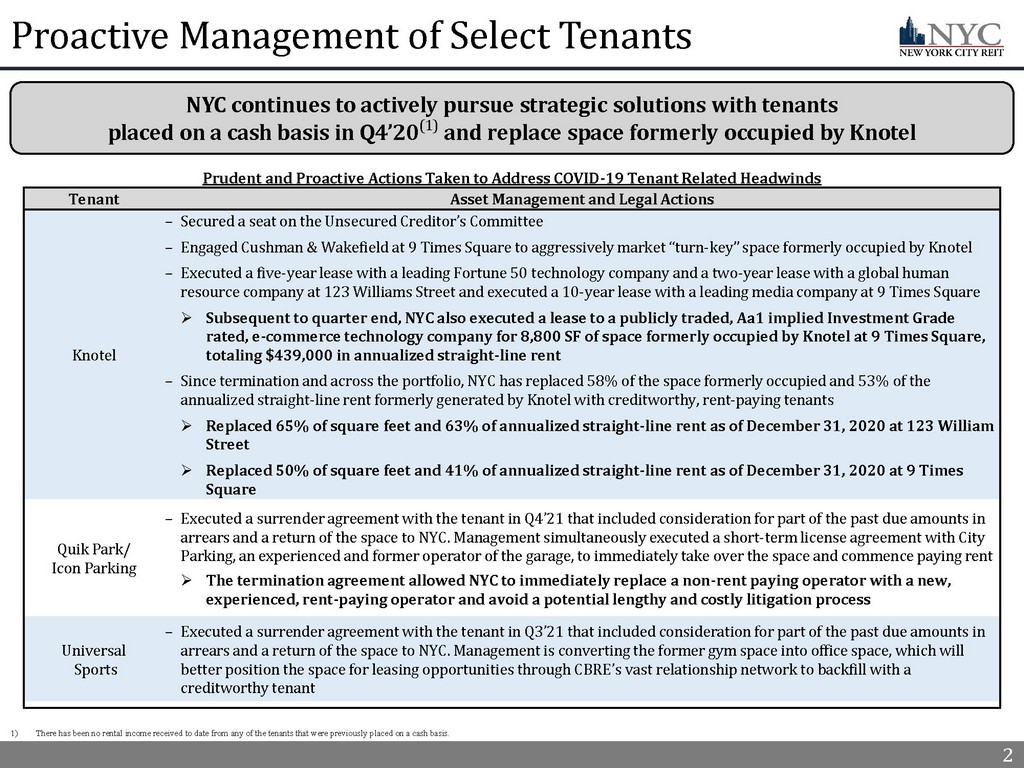
2 2 Proactive Management of Select Tenants NYC continues to actively pursue strategic solutions with tenants placed on a cash basis in Q4’20 (1) and replace space formerly occupied by Knotel Prudent and Proactive Actions Taken to Address COVID - 19 Tenant Related Headwinds Tenant Asset Management and Legal Actions Knotel – Secured a seat on the Unsecured Creditor’s Committee – Engaged Cushman & Wakefield at 9 Times Square to aggressively market “turn - key” space formerly occupied by Knotel – Executed a five - year lease with a leading Fortune 50 technology company and a two - year lease with a global human resource company at 123 Williams Street and executed a 10 - year lease with a leading media company at 9 Times Square » Subsequent to quarter end, NYC also executed a lease to a publicly traded, Aa1 implied Investment Grade rated, e - commerce technology company for 8,800 SF of space formerly occupied by Knotel at 9 Times Square, totaling $439,000 in annualized straight - line rent – Since termination and across the portfolio, NYC has replaced 58% of the space formerly occupied and 53% of the annualized straight - line rent formerly generated by Knotel with creditworthy, rent - paying tenants » Replaced 65% of square feet and 63% of annualized straight - line rent as of December 31, 2020 at 123 William Street » Replaced 50% of square feet and 41% of annualized straight - line rent as of December 31, 2020 at 9 Times Square Quik Park/ Icon Parking – Executed a surrender agreement with the tenant in Q4’21 that included consideration for part of the past due amounts in arrears and a return of the space to NYC. Management simultaneously executed a short - term license agreement with City Parking, an experienced and former operator of the garage, to immediately take over the space and commence paying rent » The termination agreement allowed NYC to immediately replace a non - rent paying operator with a new, experienced, rent - paying operator and avoid a potential lengthy and costly litigation process Universal Sports – Executed a surrender agreement with the tenant in Q3’21 that included consideration for part of the past due amounts in arrears and a return of the space to NYC. Management is converting the former gym space into office space, which will better position the space for leasing opportunities through CBRE’s vast relationship network to backfill with a creditworthy tenant 1) There has been no rental income received to date from any of the tenants that were previously placed on a cash basis.
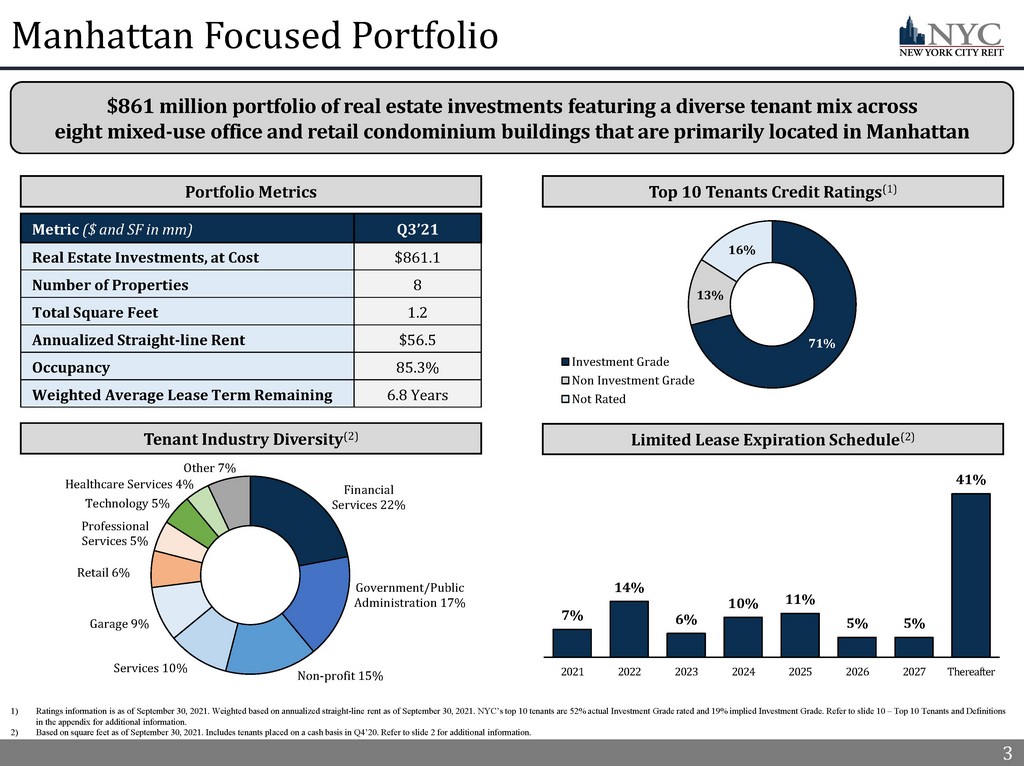
3 Manhattan Focused Portfolio Metric ($ and SF in mm) Q3’21 Real Estate Investments, at Cost $861.1 Number of Properties 8 Total Square Feet 1.2 Annualized Straight - line Rent $56.5 Occupancy 85.3% Weighted Average Lease Term Remaining 6.8 Years 1) Ratings information is as of September 30, 2021. Weighted based on annualized straight - line rent as of September 30, 2021. NYC’s top 10 tenants are 52% actual Investment Grade rated and 19% implied Investment Grade. Refer to slide 10 – Top 10 Tenants and Definitions in the appendix for additional information. 2) Based on square feet as of September 30, 2021. Includes tenants placed on a cash basis in Q4’20. Refer to slide 2 for additio nal information. 3 7% 14% 6% 10% 11% 5% 5% 41% 2021 2022 2023 2024 2025 2026 2027 Thereafter Financial Services 22% Government/Public Administration 17% Non - profit 15% Services 10% Garage 9% Retail 6% Professional Services 5% Technology 5% Healthcare Services 4% Other 7% $861 million portfolio of real estate investments featuring a diverse tenant mix across eight mixed - use office and retail condominium buildings that are primarily located in Manhattan Top 10 Tenants Credit Ratings (1) Tenant Industry Diversity (2) Limited Lease Expiration Schedule (2) Portfolio Metrics 71% 13% 16% Investment Grade Non Investment Grade Not Rated
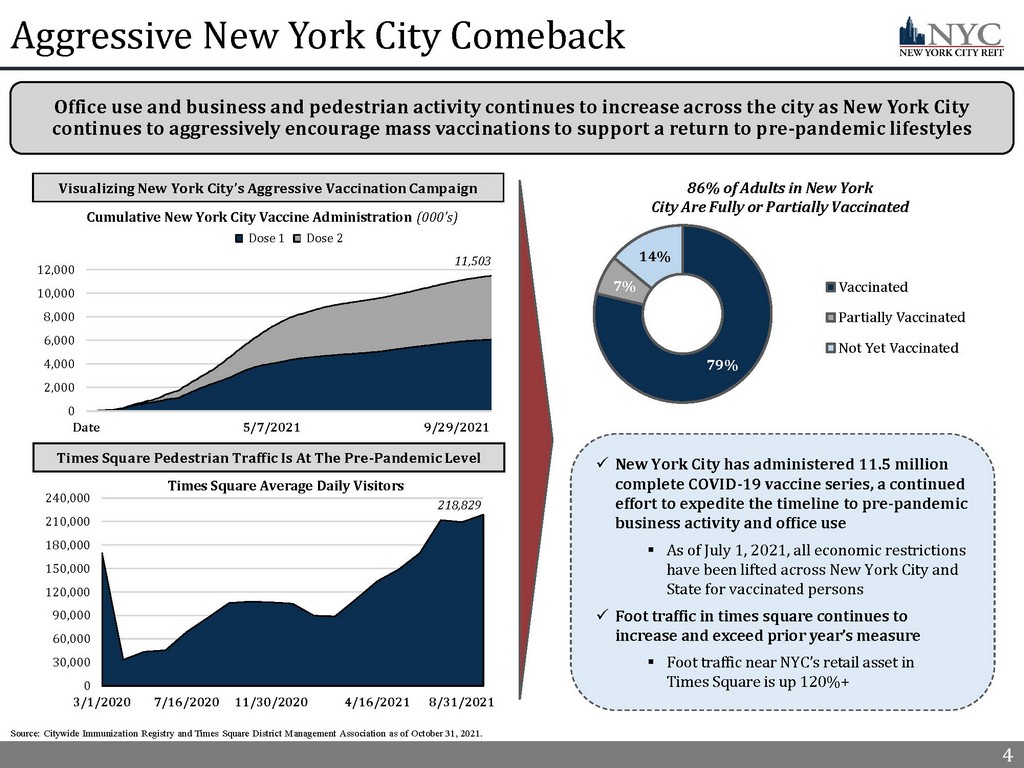
4 79% 7% 14% Vaccinated Partially Vaccinated Not Yet Vaccinated Aggressive New York City Comeback 4 Visualizing New York City’s Aggressive Vaccination Campaign x New York City has administered 11.5 million complete COVID - 19 vaccine series, a continued effort to expedite the timeline to pre - pandemic business activity and office use ▪ As of July 1, 2021, all economic restrictions have been lifted across New York City and State for vaccinated persons x Foot traffic in times square continues to increase and exceed prior year’s measure ▪ Foot traffic near NYC’s retail asset in Times Square is up 120%+ Office use and business and pedestrian activity continues to increase across the city as New York City continues to aggressively encourage mass vaccinations to support a return to pre - pandemic lifestyles Times Square Pedestrian Traffic Is At The Pre - Pandemic Level Source: Citywide Immunization Registry and Times Square District Management Association as of October 31, 2021. 0 30,000 60,000 90,000 120,000 150,000 180,000 210,000 240,000 3/1/2020 7/16/2020 11/30/2020 4/16/2021 8/31/2021 Times Square Average Daily Visitors 218,829 0 2,000 4,000 6,000 8,000 10,000 12,000 Date 5/7/2021 9/29/2021 Cumulative New York City Vaccine Administration (000’s) Series1 Series2 11,503 86% of Adults in New York City Are Fully or Partially Vaccinated Dose 1 Dose 2
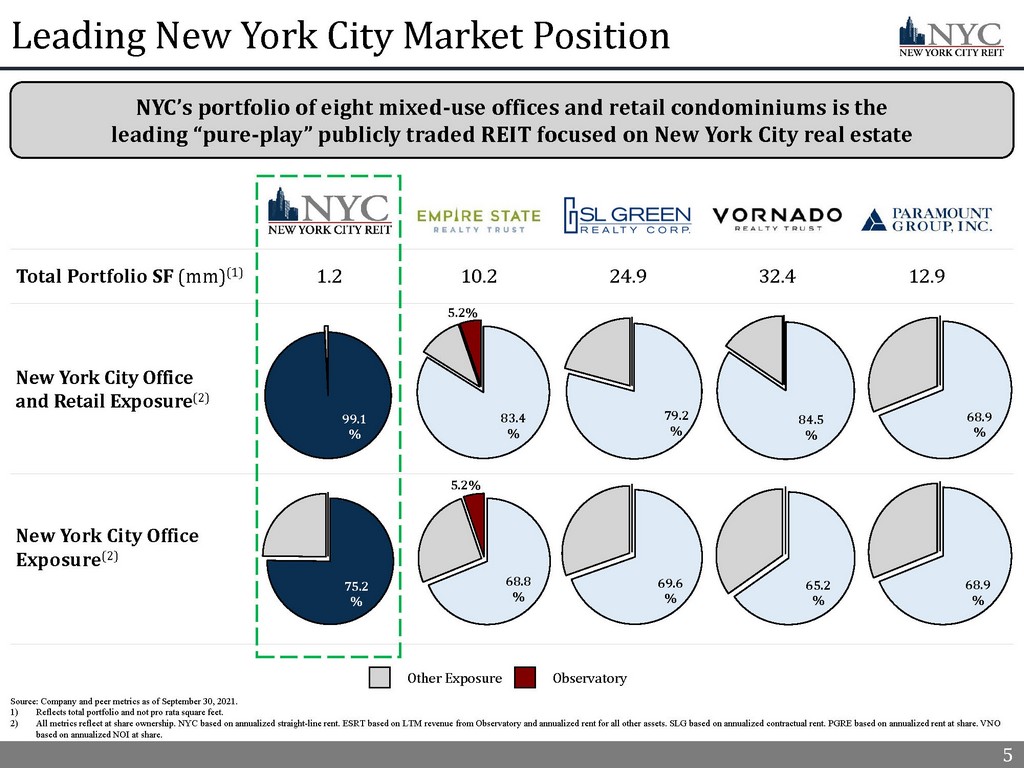
5 Leading New York City Market Position NYC’s portfolio of eight mixed - use offices and retail condominiums is the leading “pure - play” publicly traded REIT focused on New York City real estate Total Portfolio SF (mm) (1) 5 New York City Office and Retail Exposure (2) New York City Office Exposure (2) Other Exposure Observatory Source: Company and peer metrics as of September 30, 2021 . 1) Reflects total portfolio and not pro rata square feet. 2) All metrics reflect at share ownership. NYC based on annualized straight - line rent. ESRT based on LTM revenue from Observatory a nd annualized rent for all other assets. SLG based on annualized contractual rent. PGRE based on annualized rent at share. VN O based on annualized NOI at share. 1.2 10.2 24.9 32.4 12.9 75.2 % 69.6 % 65.2 % 68.9 % 83.4 % 79.2 % 84.5 % 68.9 % 5.2% 68.8 % 5.2% 99.1 %
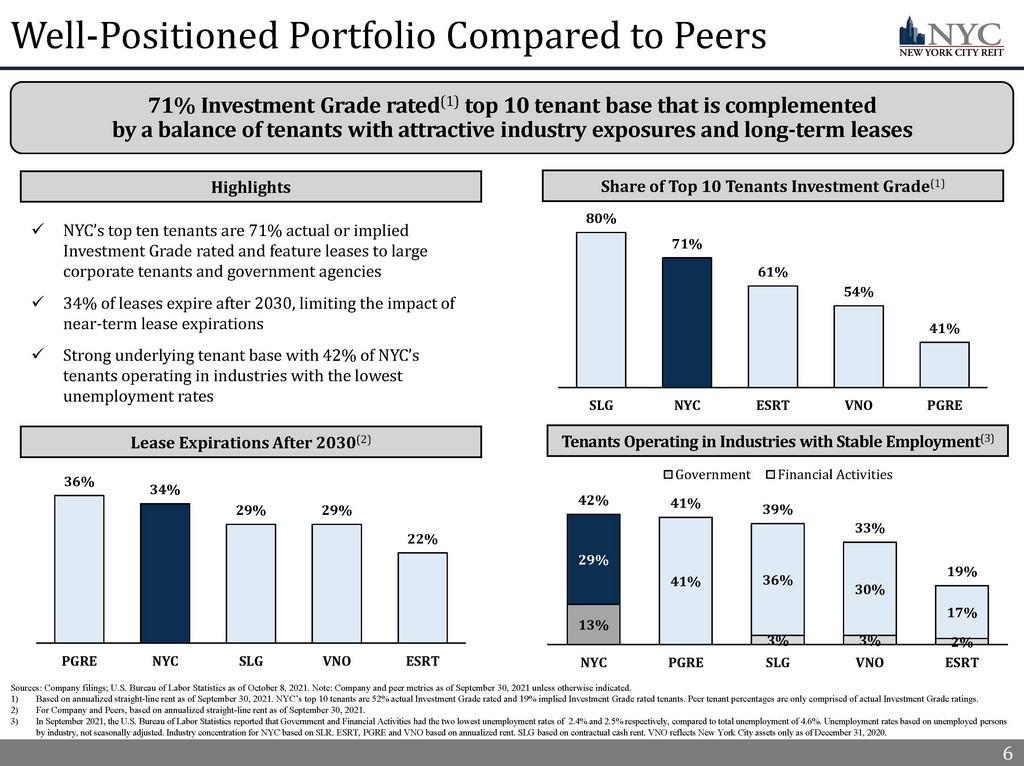
6 Well - Positioned Portfolio Compared to Peers 6 Sources: Company filings; U.S. Bureau of Labor Statistics as of October 8, 2021. Note: Company and peer metrics as of Septemb er 30, 2021 unless otherwise indicated. 1) Based on annualized straight - line rent as of September 30, 2021. NYC’s top 10 tenants are 52% actual Investment Grade rated and 19% implied Investment Grade rated tenants. Peer tenant percentages are only comprised of actual Investment Grade ratings. 2) For Company and Peers, based on annualized straight - line rent as of September 30, 2021. 3) In September 2021, the U.S. Bureau of Labor Statistics reported that Government and Financial Activities had the two lowest u nem ployment rates of 2.4% and 2.5% respectively, compared to total unemployment of 4.6%. Unemployment rates based on unemployed pe rsons by industry, not seasonally adjusted. Industry concentration for NYC based on SLR. ESRT, PGRE and VNO based on annualized ren t. SLG based on contractual cash rent. VNO reflects New York City assets only as of December 31, 2020. Tenants Operating in Industries with Stable Employment (3) Share of Top 10 Tenants Investment Grade (1) Lease Expirations After 2030 (2) Highlights 71% Investment Grade rated (1) top 10 tenant base that is complemented by a balance of tenants with attractive industry exposures and long - term leases 36% 34% 29% 29% 22% PGRE NYC SLG VNO ESRT x NYC’s top ten tenants are 71% actual or implied Investment Grade rated and feature leases to large corporate tenants and government agencies x 34% of leases expire after 2030, limiting the impact of near - term lease expirations x Strong underlying tenant base with 42% of NYC’s tenants operating in industries with the lowest unemployment rates 13% 3% 3% 2% 29% 41% 36% 30% 17% 42% 41% 39% 33% 19% NYC PGRE SLG VNO ESRT Government Financial Activities 80% 71% 61% 54% 41% SLG NYC ESRT VNO PGRE
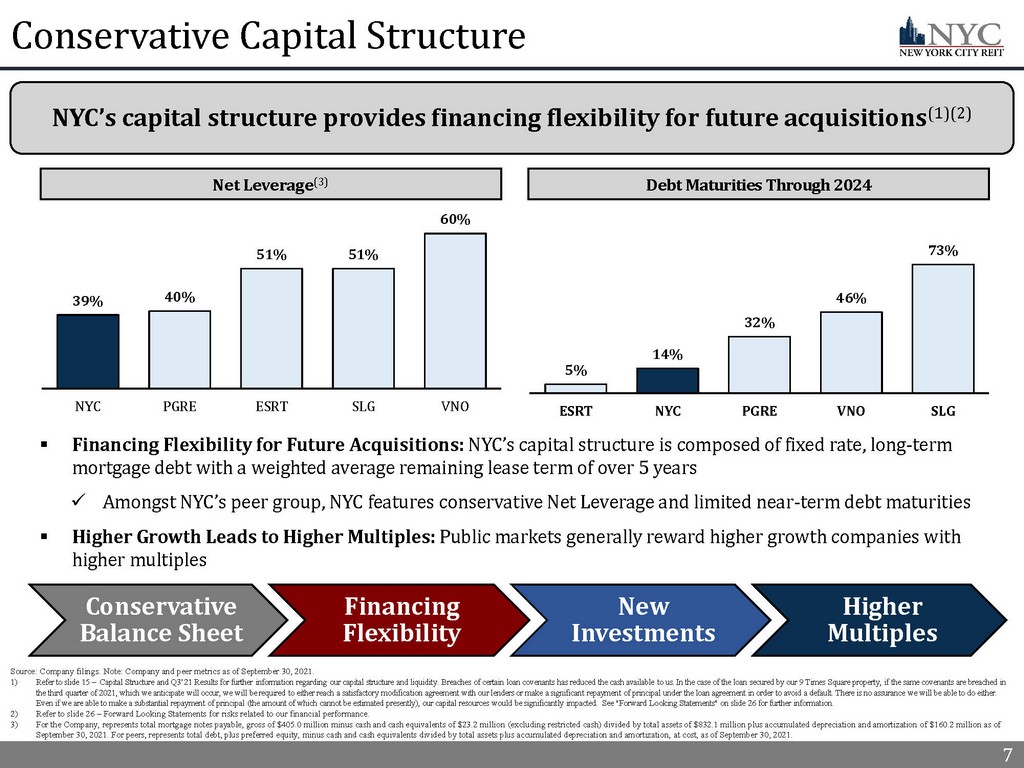
7 Conservative Capital Structure ▪ Financing Flexibility for Future Acquisitions: NYC’s capital structure is composed of fixed rate, long - term mortgage debt with a weighted average remaining lease term of over 5 years x Amongst NYC’s peer group, NYC features conservative Net Leverage and limited near - term debt maturities ▪ Higher Growth Leads to Higher Multiples: Public markets generally reward higher growth companies with higher multiples Conservative Balance Sheet Financing Flexibility New Investments Higher Multiples 7 NYC’s capital structure provides financing flexibility for future acquisitions (1)(2) Debt Maturities Through 2024 Net Leverage (3) Source: Company filings. Note: Company and peer metrics as of September 30, 2021. 1) Refer to slide 15 – Capital Structure and Q3’21 Results for further information regarding our capital structure and liquidity. Breaches of certai n l oan covenants has reduced the cash available to us. In the case of the loan secured by our 9 Times Square property, if the sa me covenants are breached in the third quarter of 2021, which we anticipate will occur, we will be required to either reach a satisfactory modification ag ree ment with our lenders or make a significant repayment of principal under the loan agreement in order to avoid a default. Ther e i s no assurance we will be able to do either. Even if we are able to make a substantial repayment of principal (the amount of which cannot be estimated presently), our cap ita l resources would be significantly impacted. See "Forward Looking Statements" on slide 26 for further information. 2) Refer to slide 26 – Forward Looking Statements for risks related to our financial performance. 3) For the Company, represents total mortgage notes payable, gross of $405.0 million minus cash and cash equivalents of $23.2 mi lli on (excluding restricted cash) divided by total assets of $832.1 million plus accumulated depreciation and amortization of $1 60. 2 million as of September 30, 2021. For peers, represents total debt, plus preferred equity, minus cash and cash equivalents divided by total as sets plus accumulated depreciation and amortization, at cost, as of September 30, 2021. 39% 40% 51% 51% 60% NYC PGRE ESRT SLG VNO 5% 14% 32% 46% 73% ESRT NYC PGRE VNO SLG

8 8 Real Estate Portfolio Highlights
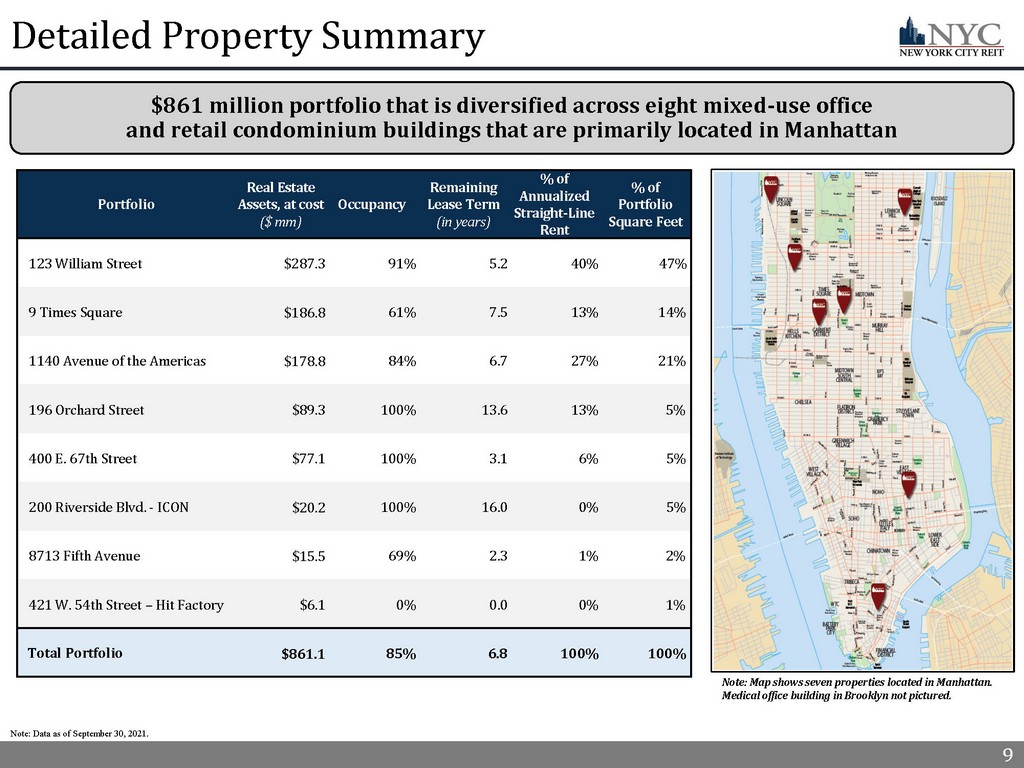
9 9 Detailed Property Summary Note: Data as of September 30, 2021. Portfolio Real Estate Assets, at cost ($ mm) Occupancy Remaining Lease Term (in years) % of Annualized Straight - Line Rent % of Portfolio Square Feet 123 William Street $287.3 91% 5.2 40% 47% _ 9 Times Square $186.8 61% 7.5 13% 14% _ 1140 Avenue of the Americas $178.8 84% 6.7 27% 21% _ 196 Orchard Street $89.3 100% 13.6 13% 5% _ 400 E. 67th Street $77.1 100% 3.1 6% 5% _ 200 Riverside Blvd. - ICON $20.2 100% 16.0 0% 5% _ 8713 Fifth Avenue $15.5 69% 2.3 1% 2% _ 421 W. 54th Street – Hit Factory $6.1 0% 0.0 0% 1% _ Total Portfolio $861.1 85% 6.8 100% 100% _ Note: Map shows seven properties located in Manhattan. Medical office building in Brooklyn not pictured. $861 million portfolio that is diversified across eight mixed - use office and retail condominium buildings that are primarily located in Manhattan

10 10 Note: Cash Rent collection data as of October 31, 2021. Total rent collected during the period includes both original Cash Re nt due and payments made by tenants pursuant to rent deferral agreements or otherwise. Eliminating the impact of deferred rent p aid , we collected the same percentage of original Cash Rent due. Portfolio data as of September 30, 2021 unless otherwise noted. 1) Weighted based on annualized straight - line rent as of September 30, 2021. 2) Ratings information as of September 30, 2021. Weighted based on annualized straight - line rent. NYC’s top 10 tenants are 52% actu al Investment Grade (“IG”) rated and 19% implied Investment Grade. 3) Provides a rent credit of $0.7 million (including $0.6 million for second quarter 2020, and $0.1 million for third quarter 20 20) and $1.3 million (including $0.1 million for third quarter 2020, $0.5 million for fourth quarter 2020, $0.4 million in the fi rs t quarter 2021, $0.3 million in the second quarter 2021, and $0.2 million in the third quarter 2021) deferral in exchange for a 60 - month lease e xtension, adding $16.7 million of new gross annual rent over the extension term. 4) Provides a rent credit of $0.9 million (including $0.4 million for fourth quarter 2020, $0.2 million for first quarter 2021, $0. 2 million for second quarter 2021, and $0.1 million for third quarter 2021) and $0.6 million (including $0.1 million for thir d q uarter 2020, $0.1 million for fourth quarter 2020 and $0.4 million for first quarter 2021) deferral in exchange for a 24 - month lease extensio n, adding $4.7 million of new gross annual rent over the extension term. Top 10 Tenant Investment Grade Profile Tenant Space Type Tenant Industry Credit Rating (2) Q3’21 Original Cash Rent Collection Remaining Lease Term (in years) % of Portfolio SLR % of Portfolio SF City National Bank Office / Retail Financial Services A2 100% 11.8 7.7% 3.6% _ Equinox Retail Fitness Caa3 Approved Agreement (3) 17.2 6.1% 3.0% _ Planned Parenthood Federation of America, Inc. Office Non - Profit Baa2* 100% 9.8 5.9% 6.6% _ Cornell University Office Healthcare Services Aa1 100% 2.8 4.4% 3.0% _ Dept. of Youth & Community Development Office Government Aa2 100% 5.9 4.0% 4.1% _ CVS Retail Retail Baa2 100% 12.9 3.8% 1.0% _ Waterfall Asset Management LLC Office Financial Services Not Rated 100% 0.9 3.6% 2.6% _ USA General Services Administration Office Government Aaa 100% 0.7 3.5% 4.9% _ I Love NY Gifts Retail Retail Not Rated Approved Agreement (4) 14.7 3.5% 0.8% _ Marshalls Retail Retail A2* 100% 7.1 2.9% 2.0% _ *Implied Rating 71% IG Rated 95% 9.2 45.4% 31.5% _ Credit Rating: A2 Credit Rating: Aa1 Credit Rating: Baa2* Credit Rating: Aaa Credit Rating: Aa2 NYC’s top 10 tenants (1) feature a balance of large Investment Grade corporate tenants such as City National Bank, CVS and Marshalls and government agencies

11 11 Completed 12 new leases in 2021 that total over 86,000 square feet and $4.3 million of annualized straight - line rent with a weighted average Remaining Lease Term of six years plus a 21,700 square foot forward Leasing Pipeline that is expected to increase Occupancy to 87% Q3’21 Leasing Activity Prior Lease New Lease Moody’s Credit Rating Aa2 Aa2 Square Feet 45,313 45,313 Lease Expiration year 2022 2027 Remaining Lease Term 1.1 Years 5.0 Years 11 5 - Year Lease Extension with an Aa2 Credit Tenant (2) Replaced Over Half of Knotel’s Former Space Within the Quarter Leasing Commentary x As measured by the VTS Office Demand Index, demand for New York City office space is near the pre - pandemic 2018 - 2019 average after reaching its highest VODI level since March 2020 (1) ▪ To be near the pre - pandemic average indicates that the office rental market is seeing new demand for office space at about t he same rate as it was in the two calendar years leading up to the pandemic (2018 and 2019) ▪ Leasing activity for New York City office space totaled 3.5 million SF in Q2’21, a 20% quarter - over - quarter increase x Portfolio Occupancy remained resilient at 85% while Occupancy at 9 Times Square increased by 3.5% as 8,800 SF commenced in th e third quarter 2021, adding $0.4 million in annualized straight - line rent ▪ NYC is working on several key lease renewals, including one in advanced discussions with an Aa2 credit rated tenant at 123 William Street that would increase annualized straight - line rent from the tenant by approximately $300,000 (2) x Forward Leasing Pipeline of 21,700 SF that includes one lease executed after quarter end for space formerly occupied by Knote l a t 9 Times Square and two executed LOIs. The Leasing Pipeline is expected to increase portfolio Occupancy to 87% and Occupancy at 9 Times Square by 5% and add $0.4 million of annualized straight - line rent at the property x Through Q3’21, NYC has replaced more than half of the former space occupied by Knotel with creditworthy, rent - paying tenants Knotel New Leases (3) Square Feet 71,200 41,000 Square Feet Replacement % N/A 58% Tenant Quality Bankrupt Rent Paying Tenant Industry Co - Working Diversified 1) VTS Office Demand Index (VODI) September 2021 report released on October 27, 2021. 2) A final amendment is subject to negotiation and execution of a definitive agreement as well as any internal approvals that ma y b e needed by the tenant for which there can be no assurance. 3) Includes one lease signed after quarter end totaling 8,800 SF and $0.4 million of annualized straight - line rent.
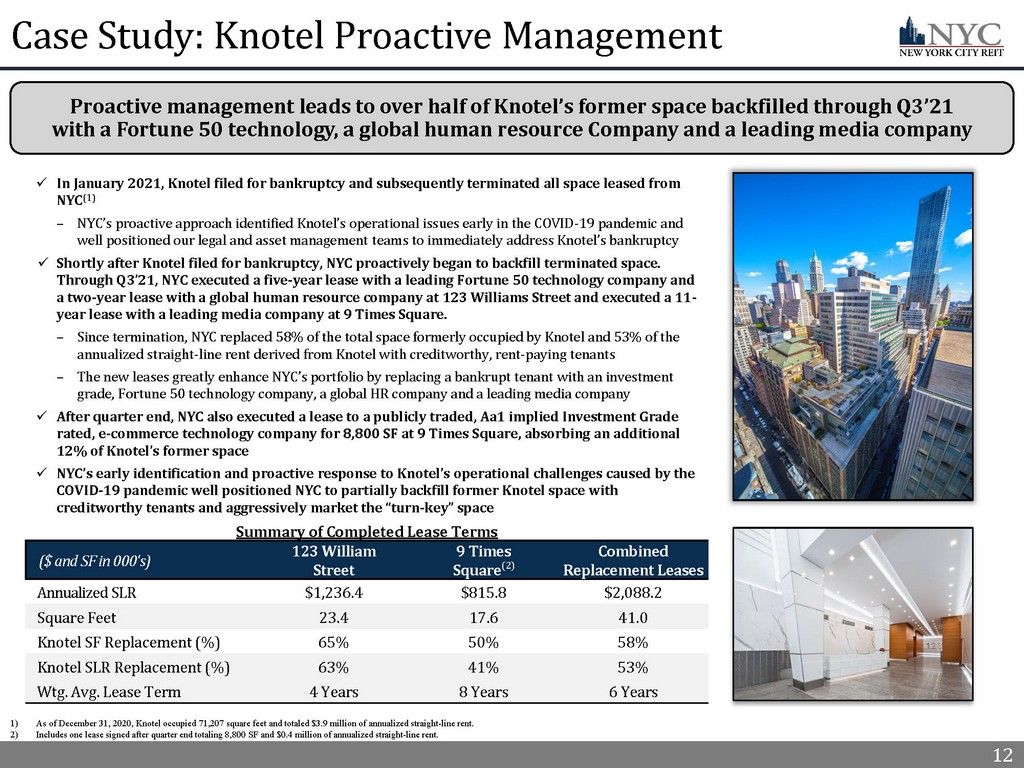
12 12 Case Study: Knotel Proactive Management x In January 2021, Knotel filed for bankruptcy and subsequently terminated all space leased from NYC (1) – NYC’s proactive approach identified Knotel’s operational issues early in the COVID - 19 pandemic and well positioned our legal and asset management teams to immediately address Knotel’s bankruptcy x Shortly after Knotel filed for bankruptcy, NYC proactively began to backfill terminated space. Through Q3’21, NYC executed a five - year lease with a leading Fortune 50 technology company and a two - year lease with a global human resource company at 123 Williams Street and executed a 11 - year lease with a leading media company at 9 Times Square. – Since termination, NYC replaced 58% of the total space formerly occupied by Knotel and 53% of the annualized straight - line rent derived from Knotel with creditworthy, rent - paying tenants – The new leases greatly enhance NYC’s portfolio by replacing a bankrupt tenant with an investment grade, Fortune 50 technology company, a global HR company and a leading media company x After quarter end, NYC also executed a lease to a publicly traded, Aa1 implied Investment Grade rated, e - commerce technology company for 8,800 SF at 9 Times Square, absorbing an additional 12% of Knotel’s former space x NYC’s early identification and proactive response to Knotel’s operational challenges caused by the COVID - 19 pandemic well positioned NYC to partially backfill former Knotel space with creditworthy tenants and aggressively market the “turn - key” space Summary of Completed Lease Terms ($ and SF in 000's) 123 William Street 9 Times Square (2) Combined Replacement Leases Annualized SLR $1,236.4 $815.8 $2,088.2 Square Feet 23.4 17.6 41.0 Knotel SF Replacement (%) 65% 50% 58% Knotel SLR Replacement (%) 63% 41% 53% Wtg . Avg. Lease Term 4 Years 8 Years 6 Years Proactive management leads to over half of Knotel’s former space backfilled through Q3’21 with a Fortune 50 technology, a global human resource Company and a leading media company 1) As of December 31, 2020, Knotel occupied 71,207 square feet and totaled $3.9 million of annualized straight - line rent. 2) Includes one lease signed after quarter end totaling 8,800 SF and $0.4 million of annualized straight - line rent.
13 Financial Highlights

14 Q3’21 Cash Rent Collection 14 Original Cash Rent collection continues to improve in 2021 as Approved Agreements (1) executed in 2020 and early 2021 expire and tenants resume paying original Cash Rent due Original Cash Rent Collection Detail Note: Collection data as of October 31, 2021. Total rent collected during the period includes both original Cash Rent due and pa yments made by tenants pursuant to rent deferral agreements or otherwise. Excludes third quarter Cash Rent received or Deferr al Agreements executed after October 31, 2021 that would apply to third quarter Cash Rent or any Deferral Agreement that would apply to third quarter Cash Rent. Elimi nat ing the impact of deferred rent paid, we collected the same percentage of original Cash Rent due. This information may not be indicative of any future period and remains subject to changes based ongoing collection efforts and negotiation of additional ag reements. The impact of the COVID - 19 pandemic on our rental revenue for the third quarter of 2021 and thereafter cannot be deter mined at present. The ultimate impact on our future results of operations and liquidity will depend on the overall length and severity of the COVID - 19 pandemic, which management is unable to predict. 1) See Definitions in the appendix for a full description. 92% 91% 87% 82% Q3'2021 Q2'2021 Q1'2021 Q4'2020 93% collected 92% collected 92% collected July August September x Collected 95% of original Cash Rent due from NYC’s top 10 tenants x Collected 100 % of deferred rent billed in Q3’21 related to Approved Agreements x NYC expects original Cash Rent collection to remain strong as Approved Agreements expire and tenants resume paying original Cash Rent due
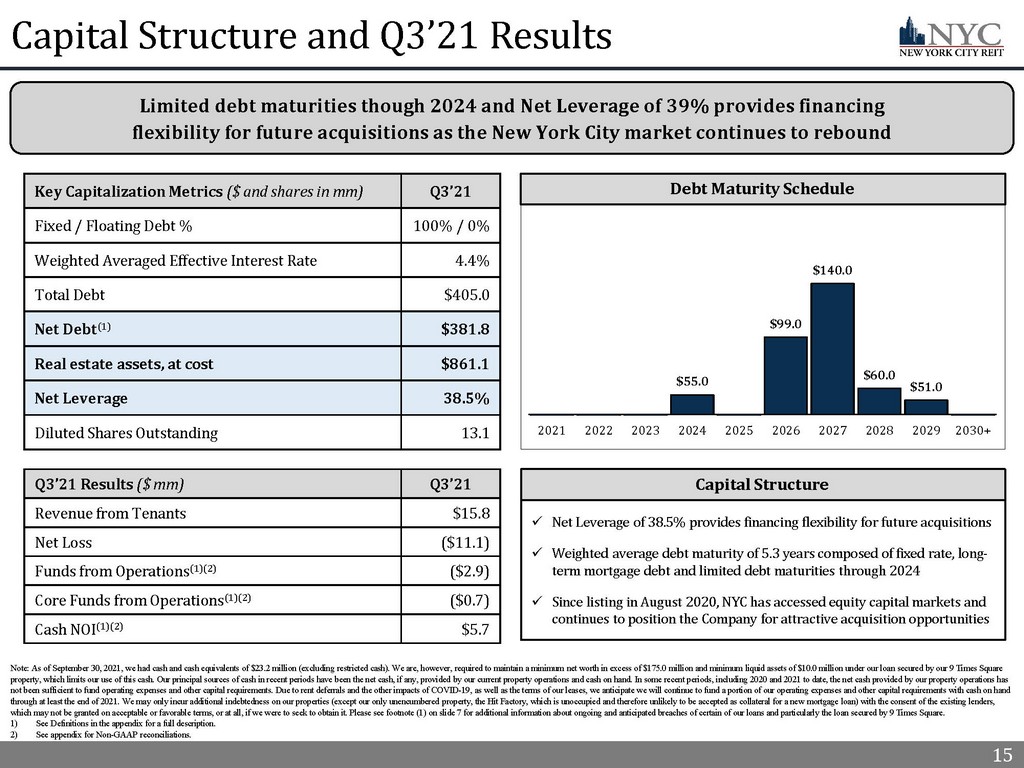
15 15 Capital Structure and Q3’21 Results Note: As of September 30, 2021, we had cash and cash equivalents of $23.2 million (excluding restricted cash). We are, howeve r, required to maintain a minimum net worth in excess of $175.0 million and minimum liquid assets of $10.0 million under our loa n s ecured by our 9 Times Square property, which limits our use of this cash. Our principal sources of cash in recent periods have been the net cash, if any, pro vided by our current property operations and cash on hand. In some recent periods, including 2020 and 2021 to date, the net c ash provided by our property operations has not been sufficient to fund operating expenses and other capital requirements. Due to rent deferrals and the other impacts of CO VID - 19, as well as the terms of our leases, we anticipate we will continue to fund a portion of our operating expenses and other capital requirements with cash on hand through at least the end of 2021. We may only incur additional indebtedness on our properties (except our only unencumbered p rop erty, the Hit Factory, which is unoccupied and therefore unlikely to be accepted as collateral for a new mortgage loan) with the consent of the existing lenders, which may not be granted on acceptable or favorable terms, or at all, if we were to seek to obtain it. Please see footnote (1 ) o n slide 7 for additional information about ongoing and anticipated breaches of certain of our loans and particularly the loan se cured by 9 Times Square. 1) See Definitions in the appendix for a full description. 2) See appendix for Non - GAAP reconciliations. Limited debt maturities though 2024 and Net Leverage of 39% provides financing flexibility for future acquisitions as the New York City market continues to rebound Capital Structure x Net Leverage of 38.5% provides financing flexibility for future acquisitions x Weighted average debt maturity of 5.3 years composed of fixed rate, long - term mortgage debt and limited debt maturities through 2024 x Since listing in August 2020, NYC has accessed equity capital markets and continues to position the Company for attractive acquisition opportunities Q3’21 Results ($ mm) Q3’21 Revenue from Tenants $15.8 Net Loss ($11.1) Funds from Operations (1)(2) ($2.9) Core Funds from Operations (1)(2) ($0.7) Cash NOI (1)(2) $5.7 Key Capitalization Metrics ($ and shares in mm) Q3’21 Fixed / Floating Debt % 100% / 0% Weighted Averaged Effective Interest Rate 4.4% Total Debt $405.0 Net Debt (1) $381.8 Real estate assets, at cost $861.1 Net Leverage 38.5% Diluted Shares Outstanding 13.1 Debt Maturity Schedule $55.0 $99.0 $140.0 $60.0 $51.0 $40.0 $60.0 $80.0 $100.0 $120.0 $140.0 $160.0 $180.0 2021 2022 2023 2024 2025 2026 2027 2028 2029 2030+

16 16 Management and Board of Directors
17 17 Experienced Management Team Michael Weil Chief Executive Officer, President and Chairman of the Board of Directors ▪ Founding partner of AR Global ▪ Formerly, Mr. Weil served as Executive Vice President of AR Capital, where he supervised the origination of investment opport uni ties for all AR Capital - sponsored investment programs ▪ Served as president of the Board of Directors of the Real Estate Investment Securities Association (n/k/a ADISA) Chris Masterson Chief Financial Officer and Treasurer ▪ Elected Chief Financial Officer and Treasurer of New York City REIT in September 2019 ▪ Currently serves as Chief Financial Officer of Global Net Lease, Inc. (NYSE: GNL) ▪ Past experience includes accounting positions with Goldman Sachs and KPMG Jason Slear Executive Vice President of Real Estate Acquisitions and Dispositions ▪ Responsible for sourcing, negotiating and closing AR Global’s real estate acquisitions and dispositions ▪ Oversaw the acquisition of over $3.5 billion of real estate assets and the lease - up of over 10 million square feet during profes sional career Boris Korotkin Senior Vice President of Capital Markets ▪ Responsible for leading all debt capital market transactions ▪ Former Executive Vice President of Transaction Structuring for American Financial Realty Trust Ori Kravel Senior Vice President of Corporate Development ▪ Responsible for corporate development and business strategy ▪ Executed over $12 billion of capital market transactions and over $25 billion of M&A transactions Christopher Chao Senior Vice President of Asset Management ▪ Responsible for asset management and leasing activity ▪ Former asset management and acquisitions director for Paramount Group, Inc., a 9 million square foot New York City office por tfo lio
18 18 Board of Directors Michael Weil | Director and Executive Chairman ▪ Founding partner of AR Global ▪ Formerly, Mr. Weil served as Executive Vice President of AR Capital, where he supervised the origination of investment opportunities for all AR Capital - sponsored investment programs ��� Prior to the establishment of AR Capital, Mr. Weil served as Senior Vice President of Sales and Leasing for American Financial Realty Trust (AFRT), where he was responsible for the disposition and leasing activity for an approximately 30 million square foot portfolio ▪ Served as president of the Board of Directors of the Real Estate Investment Securities Association (n/k/a ADISA) Lee Elman | Independent Director and Audit Committee Chairman ▪ Independent director of the Company since February 2016 ▪ Founder & President of Elman Investors Inc., an international real - estate investment bank ▪ 40+ years of real estate investment experience in the US and abroad ▪ Mr. Elman holds a J.D. from Yale Law School and a B.A. from Princeton University’s Woodrow Wilson School of Public and International Affairs Abby Wenzel | Independent Director ▪ Ms. Wenzel was a member of the law firm of Cozen O’Conner, resident in the New York Office from April 2009 until her retirement in June 2019. Ms. Wenzel practiced in in the Real Estate Group and capital markets practice area, focusing on capital markets, finance and sale leaseback transactions ▪ Prior to joining Cozen O’Connor, Ms. Wenzel was a partner with Wolf Block, LLP, managing partner of its New York office and chair of its structured finance practice from October 1999 until April 2009 Elizabeth Tuppeny | Lead Independent Director ▪ Chief Executive Officer and founder of Domus, Inc., since 1993 ▪ 30 years of experience in the branding and advertising industries, with a focus on Fortune 50 companies ▪ Ms. Tuppeny also founded EKT Development, LLC to pursue entertainment projects in publishing, feature film and education video games Strong Corporate Governance x Majority independent Board of Directors, with additional oversight provided by committees comprised solely of independent directors x PricewaterhouseCoopers LLP currently acts as the independent auditor for NYC x NYC is supported by robust financial accounting and reporting teams, and maintains financial reporting processes, controls and procedures x Management and shareholders fully aligned to compensate based on operational outperformance
19 19 Appendix
20 20 Definitions Annualized Straight - Line Rent : Straight - line rent which is annualized and calculated using most recent available lease terms as of the period end indicated . Approved Agreement : Represents Deferral Agreements as well as amendments granting the tenant a rent credit for some portion of original Cash Rent due . The rent credit is generally coupled with an extension of the lease . As of October 31 , 2021 , we granted rent credits with respect to 2 . 2 % of third quarter original Cash Rent due . The terms of the lease amendments providing for rent credits differ by tenant in terms of the length and amount of the credit . A “Deferral Agreement” is an executed or approved amendment to an existing lease agreement to defer a certain portion of Cash Rent due . Cash NOI : We define Cash NOI as NOI excluding amortization of above/below market lease intangibles and straight - line adjustments that are included in GAAP lease revenues . Cash Rent : Represents total of all contractual rents on a cash basis due from tenants as stipulated in the originally executed lease agreements at inception or any lease amendments thereafter prior to a Deferral Agreement, refer to slide 14 for further information . “Original Cash Rent” refers to contractual rents on a cash basis due from tenants as stipulated in their originally executed lease agreement at inception or as amended, prior to any rent deferral agreement . We calculate “Original Cash Rent collections” by comparing the total amount of rent collected during the period to the original Cash Rent due . Total rent collected during the period includes both original Cash Rent due and payments made by tenants pursuant to rent deferral agreements . Eliminating the impact of deferred rent paid, we collected the same percentage of original Cash Rent due . Core FFO : In calculating Core FFO, we start with FFO, then we exclude the impact of discrete non - operating transactions and other events which we do not consider representative of the comparable operating results of our real estate operating portfolio, which is our core business platform . Specific examples of discrete non - operating items include acquisition and transaction related costs for dead deals, debt extinguishment costs, listing related costs and expenses (including the vesting and conversion of Class B units and cash expenses and fees which are non - recurring in nature incurred in connection with the listing of Class A common stock on the NYSE and related transactions), and non - cash equity - based compensation . We add back non - cash write - offs of deferred financing costs and prepayment penalties incurred with the early extinguishment of debt which are included in net income but are considered financing cash flows when paid in the statement of cash flows . We consider these write - offs and prepayment penalties to be capital transactions and not indicative of operations . By excluding expensed acquisition and transaction dead deal costs as well as non - operating costs, we believe Core FFO provides useful supplemental information that is comparable for each type of real estate investment and is consistent with management’s analysis of the investing and operating performance of our properties . In future periods, we may also exclude other items from Core FFO that we believe may help investors compare our results . FFO : We define FFO, a non - GAAP measure, consistent with the standards established over time by the Board of Governors of NAREIT, as restated in a White Paper approved by the Board of Governors of NAREIT effective in December 2018 (the “White Paper”) . The White Paper defines FFO as net income or loss computed in accordance with GAAP, excluding depreciation and amortization related to real estate, gains and losses from the sale of certain real estate assets, gains and losses from change in control and impairment write - downs of certain real estate assets and investments in entities when the impairment is directly attributable to decreases in the value of depreciable real estate held by the entity . Adjustments for unconsolidated partnerships and joint ventures are calculated to reflect FFO . Our FFO calculation complies with NAREIT’s definition . Investment Grade : As used herein, investment grade includes both actual investment grade ratings of the tenant or guarantor, if available, or implied investment grade . Implied investment grade may include actual ratings of tenant parent, guarantor parent (regardless of whether or not the parent has guaranteed the tenant’s obligation under the lease) or by using a proprietary Moody’s analytical tool, which generates an implied rating by measuring a company’s probability of default . Ratings information is as of September 30 , 2021 . Top 10 tenants are 52 % actual investment grade rated and 19 % implied investment grade rated
21 21 Definitions Leasing Pipeline : Includes ( i ) all leases fully executed by both parties as of October 31 , 2021 , but after September 30 , 2021 , and (ii) all leases under negotiation with an executed LOI by both parties as of October 31 , 2021 . This represents one executed lease that commenced in the fourth quarter of 2021 totaling 8 , 780 square feet and two LOIs that total 12 , 966 square feet . Excludes license agreements entered into with a new operator on October 26 , 2021 at the 200 Riverside Boulevard and 400 E . 67 th Street - Laurel Condominium properties which replaced prior lease agreements with the original tenant terminated on the same date . Leasing pipeline should not be considered an indication of future performance . Net Debt : Total debt of $ 405 . 0 million less cash and cash equivalents of $ 23 . 2 million (excluding restricted cash) as of September 30 , 2021 . Net Leverage : For the Company and for September 30 , 2021 , represents total mortgage notes payable, gross of $ 405 . 0 million minus cash and cash equivalents of $ 23 . 2 million (excluding restricted cash) divided by total assets of $ 832 . 1 million plus accumulated depreciation and amortization of $ 160 . 2 million as of September 30 , 2021 . For peers, represents total debt, plus preferred equity, minus cash and cash equivalents divided by total assets plus accumulated depreciation and amortization, at cost, as of September 30 , 2021 . NOI : Defined as a non - GAAP financial measure used by us to evaluate the operating performance of our real estate . NOI is equal to total revenues, excluding contingent purchase price consideration, less property operating and maintenance expense . NOI excludes all other items of expense and income included in the financial statements in calculating net (loss) . Occupancy : Represents percentage of square footage of which the tenant has taken possession of divided by the respective total rentable square feet as of the date or period end indicated . Remaining Lease Term : Represents the outstanding tenant lease term . Weighted based on Annualized Straight - Line rent as of the date or period end indicated .
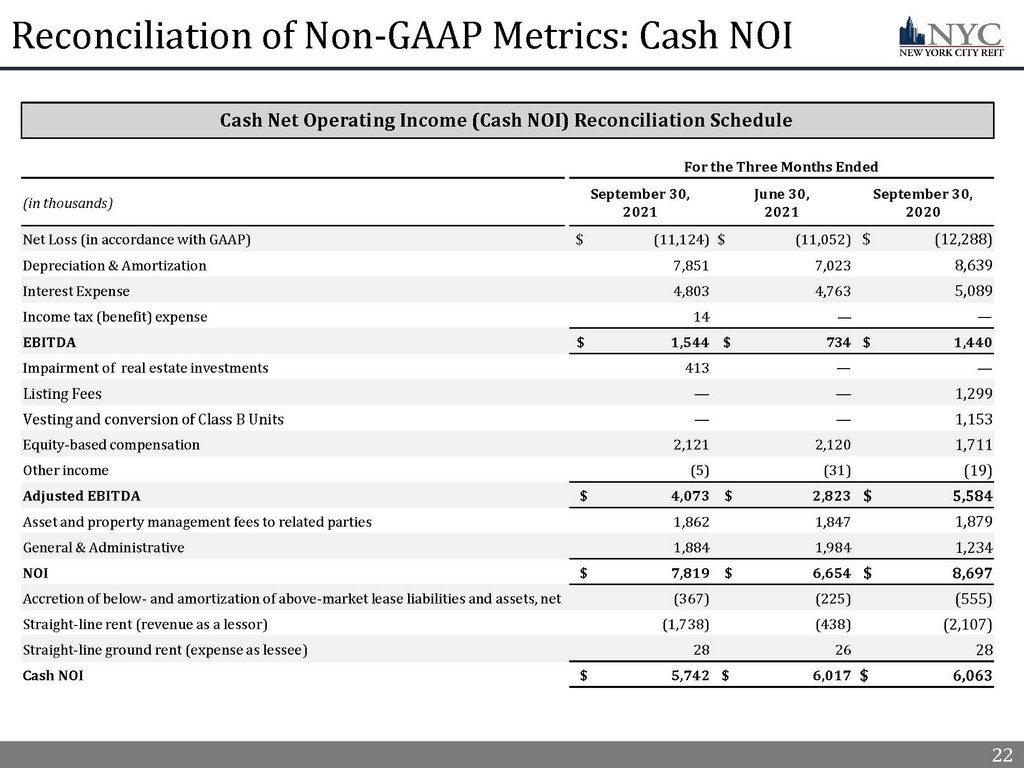
22 22 Reconciliation of Non - GAAP Metrics: Cash NOI For the Three Months Ended (in thousands) September 30, 2021 June 30, 2021 September 30, 2020 Net Loss (in accordance with GAAP) $ (11,124) $ (11,052) $ (12,288) Depreciation & Amortization 7,851 7,023 8,639 Interest Expense 4,803 4,763 5,089 Income tax (benefit) expense 14 — — EBITDA $ 1,544 $ 734 $ 1,440 Impairment of real estate investments 413 — — Listing Fees — — 1,299 Vesting and conversion of Class B Units — — 1,153 Equity - based compensation 2,121 2,120 1,711 Other income (5) (31) (19) Adjusted EBITDA $ 4,073 $ 2,823 $ 5,584 Asset and property management fees to related parties 1,862 1,847 1,879 General & Administrative 1,884 1,984 1,234 NOI $ 7,819 $ 6,654 $ 8,697 Accretion of below - and amortization of above - market lease liabilities and assets, net (367) (225) (555) Straight - line rent (revenue as a lessor) (1,738) (438) (2,107) Straight - line ground rent (expense as lessee) 28 26 28 Cash NOI $ 5,742 $ 6,017 $ 6,063 Cash Net Operating Income (Cash NOI) Reconciliation Schedule
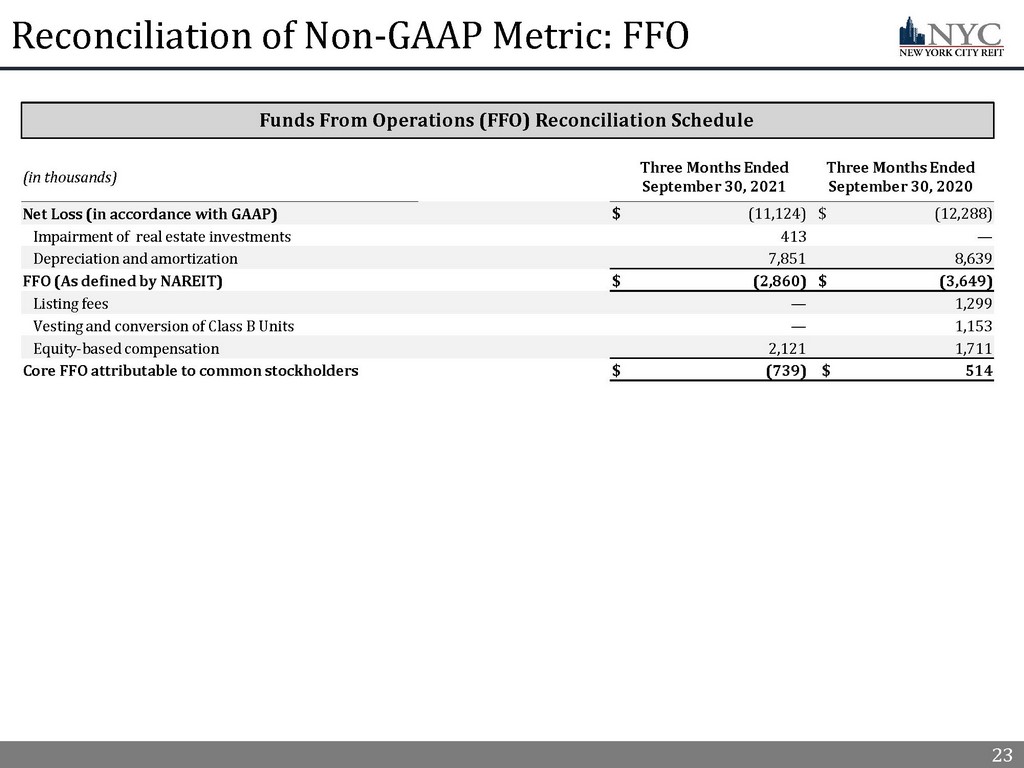
23 23 Reconciliation of Non - GAAP Metric: FFO (in thousands) Three Months Ended September 30, 2021 Three Months Ended September 30, 2020 Net Loss (in accordance with GAAP) $ (11,124) $ (12,288) Impairment of real estate investments 413 — Depreciation and amortization 7,851 8,639 FFO (As defined by NAREIT) $ (2,860) $ (3,649) Listing fees — 1,299 Vesting and conversion of Class B Units — 1,153 Equity - based compensation 2,121 1,711 Core FFO attributable to common stockholders $ (739) $ 514 Funds From Operations (FFO) Reconciliation Schedule
24 24 Legal Notices
25 25 Important Information References in this presentation to the “Company,” “we,” “us” and “our” refer to New York City REIT, Inc. (“NYC”) and its cons oli dated subsidiaries. This presentation contains estimates and information concerning the Company’s industry and the Company’s peer companies that are based on industry publications, reports and peer company public filings. The Company has not independently verified the accuracy of the data contained in these industry publications, reports and peer company public filings. These estimates and information involve a number of assumptions and limitations, and you are cautioned not to rely on or give undue weight to thi s information. The industry in which we operate is subject to a high degree of uncertainty and risk due to variety of factors, in cluding those described in the “Risk Factors” and “Management's Discussion and Analysis of Financial Condition and Results of Operati ons ” sections of the Company’s Annual Report on Form 10 - K filed with the SEC on March 29, 2021 and the Company's subsequent Quarterly Reports on Form 10 - Q filed with the SEC. These and other factors could cause results to differ materially from those expressed in these publications and reports. The majority of the concessions granted to our tenants as a result of the COVID - 19 pandemic are rent deferrals or temporary rent abatements with the original lease term unchanged and collection of deferred rent deemed probable. As a result of relief gran ted by the FASB and the SEC related to lease modification accounting, rental revenue used to calculate Net Income and, NAREIT FFO an d Core FFO has not been, and we do not expect it to be, significantly impacted by these types of deferrals.
26 26 Forward Looking Statements Certain statements made in this presentation are “forward - looking statements” (as defined in Section 21E of the Exchange Act), w hich reflect the expectations of the Company regarding future events. You can identify forward - looking statements by the use of forward looking terminology such as “believes,” “expects,” “m ay,” “will,” “would,” “could,” “should,” “seeks,” “intends,” “plans,” “projects,” “estimates,” “anticipates,” “predicts,” or “potential” or the negative of these words and phrases or similar word s o r phrases. The forward - looking statements involve a number of risks, uncertainties and other factors that could cause actual results to differ materially from those contained in the forward - looking statements. These forward - looking statements include, but are not limited to, market and other expectations, objectives, and intentions, as well as any other statements that are not historica l f acts. Our potential risks and uncertainties are presented in the section titled “Item 1A. Risk Factors” in the Company’s Annual Rep ort on Form 10 - K filed with the SEC on March 29, 2021 as well as other subsequent reports filed with the SEC. Forward - looking statements speak as of the date they were made and we disclaim any obliga tion to update and revise statements contained in these materials to reflect changed assumptions, the occurrence of unanticipated events or changes to future operating results over tim e, unless required by law. The following are some of the risks and uncertainties relating to us, although not all risks and uncertainties, that could cause our actual results to differ materia lly from those presented in our forward - looking statements: • Our properties may be adversely affected by economic cycles and risks inherent to New York City. • Our ability to fund our capital requirements will depend on, among other things, the amount of cash we are able to generate f rom our operations, which is dependent on, among other things, the impact of the COVID - 19 pandemic on our tenants and other factors outside of our control, and our ability to access capital f rom outside sources, which may not be available on acceptable or favorable terms, or at all. • If we are not able to generate sufficient cash from operations, we may have to reduce the amount of dividends we pay or ident ify other financing sources. • Funding dividends from other sources such as borrowings, asset sales or equity issuances limits the amount we can use for pro per ty acquisitions, investments and other corporate purposes. • We are subject to risks associated with a pandemic, epidemic or outbreak of a contagious disease, such as the ongoing global COV ID - 19 pandemic, including negative impacts on our tenants and their respective businesses. • Market and economic challenges experienced by the U.S. and global economies may adversely impact aspects of our operating res ult s and operating condition. • We depend on tenants for our rental revenue and, accordingly, our rental revenue is dependent upon the success and economic v iab ility of our tenants. If a tenant or lease guarantor declares bankruptcy or becomes insolvent, we may be unable to collect balances due under relevant leases. • We anticipate our ongoing breach of the loan secured by our 9 Times Square property may lead to an event of default under the lo an in the quarter ended September 30, 2021. There is no assurance we will be able to reach a satisfactory agreement with our lender or otherwise make a significant repayment of pr inc ipal (the exact amount of which cannot be estimated presently) as required by the loan agreement to cure the covenant breaches which may give rise to an event of default and the lender acc ele rating the principal amount due under the loan and exercising other remedies including foreclosing on the property. Further, funding any substantial principal repayment would significantl y i mpact our capital resources which could have a material adverse effect on our ability to fund our operating expenses (including debt service obligations), acquisitions, capital expe ndi tures and dividends to the holders of shares of our common stock. • As of September 30, 2021, we have $5.2 million cash maintained in segregated and restricted cash accounts resulting from the cov enant breaches under our loan, all of which is cash from our 1140 Avenue of the Americas property. In addition, due to the covenant breaches resulting in cash traps, all cash generated f rom our 9 Times Square, Laurel/Riverside and 8713 Fifth Avenue properties is required to be held in a segregated account and we will not have access to any excess cash flows, if any, gener ate d from these properties. Breaches of loan covenants has reduced the cash available to us and further breaches will limit our ability to access cash generated by our properties and significa ntl y impact our capital resources. There is no assurance we will be able to cure the breaches and access the excess cash generated by these properties, if any. • In owning properties we may experience, among other things, unforeseen costs associated with complying with laws and regulati ons and other costs, potential difficulties selling properties and potential damages or losses resulting from climate change. • We depend on the Advisor and Property Manager to provide us with executive officers, key personnel and all services required for us to conduct our operations. • All of our executive officers face conflicts of interest, such as conflicts created by the terms of our agreements with the A dvi sor and compensation payable thereunder, conflicts allocating investment opportunities to us, and conflicts in allocating their time and attention to our matters. Conflicts that arise may no t be resolved in our favor and could result in actions that are adverse to us. • We have long - term agreements with our Advisor and its affiliates that may be terminated only in limited circumstances and may re quire us to pay a termination fee in some cases. • We have substantial indebtedness and may be unable to repay, refinance, restructure or extend our indebtedness as it becomes due . Increases in interest rates could increase the amount of our debt payments. We may incur additional indebtedness in the future. • The stockholder rights plan adopted by our board of directors, our classified board and other aspects of our corporate struct ure and Maryland law may discourage a third party from acquiring us in a manner that might result in a premium price to our stockholders. • Restrictions on share ownership contained in our charter may inhibit market activity in shares of our stock and restrict our bus iness combination opportunities. • We may fail to continue to qualify as a REIT.