Exhibit 99.1
0 NEW YORK CITY REIT 2021 Year in Review - January Investor Presentation 9 Times Square - New York, NY

1 NYC’s Board of Directors, led by Elizabeth Tuppeny, in conjunction with the advisor, executed on several initiatives throughout the COVID - 19 pandemic in 2020 and 2021 by utilizing the full resources of the advisor’s platform. Together, the Board and the advisor mitigated adverse impacts from the COVID - 19 pandemic by focusing on proactive asset management, increasing original Cash Rent (1)(2) collection rates and completing new leasing activity. As a result, NYC shareholders benefited from a 37% Total Return (1)(3) in 2021. NYC estimates that its NAV per share as of December 31, 2021 ranged from $22.12 - $28.10 (4) 2021 – Year in Review 1 2021 Highlights ▪ In Q1’21, Knotel, a former top 10 tenant, filed for bankruptcy and terminated all their leased space with NYC x NYC entered into new leases replacing 58% of the square feet and 53% of the Annualized Straight - line Rent (1) formerly derived from Knotel ▪ In Q4’21, NYC executed a termination agreement with Icon Parking and Quik Park, two non - compliant tenants, and immediately backfilled the space with a new operator x The new operator, City Parking, began paying in full the new original Cash Rent due under the license agreement in November 2021 ▪ Through Q3’21, NYC completed 12 new leases in 2021, totaling over 86,000 square feet and $4.3 million of Annualized Straight - line Rent x NYC has added credit - worthy, rent - paying tenants to its portfolio in 2021, including a fortune 50 technology company and a publicly traded, Aa1 implied Investment Grade (1) rated e - commerce technology company ▪ Forward Leasing Pipeline (1) of 21,700 SF for Q3’21 that included one lease executed shortly after the third quarter and two executed LOIs x The Leasing Pipeline is expected to increase portfolio Occupancy (1) to 87% and Occupancy at 9 Times Square by 5% ▪ NYC outperformed the S&P 500 by over 6% and a group of New York City focused REIT peers by over 24% (3) x NYC 2021 Total Return of 37% x New York City focused REIT peer performance of 12% ▪ NYC’s estimate of 2022 property - level income results in an estimated NAV per share of $22.12 - $28.10, indicating further significant upside potential for NYC shareholders (4) x 2022 estimated NAV per share represents a $11 - $17 per share premium on the January 7, 2022 closing price Proactive Asset and Property Management Successful Navigation Throughout COVID - 19 Impactful Leasing Activity Strong 2021 Shareholder Return (3)(4) ▪ Since Q4’20 and through Q4’21, NYC increased its original Cash Rent collection rate by 12% to 94% x Q4’21 portfolio original Cash Rent collection of 94% x 97% of original Cash Rent collection from NYC’s top 10 tenants in Q4’21 ▪ Diligently and proactively communicated with tenants to help them navigate the COVID - 19 pandemic and mitigate adverse economic impacts x NYC collected 100% of the deferred rent due in Q3’21 and Q4’21 that was subject to an Approved Agreement (1) 1) See appendix for a full description of capitalized terms. 2) Refer to slide 3 - Continued Cash Rent Collection Success for additional information. 3) Refer to slide 2 - Exceptional Investor Returns in 2021 for additional information. 4) Refer to slide 4 - 2022 Estimated NAV per Share for additional information and slide 13 of the Appendix for additional informati on relating to limitations on, and risks related to, the estimated NAV per share.

2 Exceptional Investor Returns in 2021 2 NYC investors benefited from an exceptional Total Return in 2021 of 37% as compared to several peer and index benchmarks, including New York City office peers and the S&P 500 Index Symbol / Index Name Type 2021 Total Return Out Performance NYC New York City REIT Inc. Office REIT 36.8% ROOF US Real Estate Small Cap ETF Small - Cap Real Estate ETF 32.8% 4.0% SLG SL Green Realty Corp. Office REIT 32.3% 4.5% S&P 500 S&P 500 Index S&P 500 Index 30.6% 6.2% S&P 600 S&P Small - Cap 600 Index S&P 600 Index 28.2% 8.6% IJR iShares Core S&P Small - Cap ETF Small - Cap Index ETF 27.8% 9.0% CUZ Cousins Properties Inc. Office REIT 26.6% 10.2% OPI Office Properties Income Trust. Office REIT 20.2% 16.6% VNO Vornado Realty Trust Office REIT 19.9% 16.9% RUT 2000 Russell 2000 Index FTSE Russell Small - Cap Index 16.5% 20.3% ESRT Empire State Realty Trust Inc. Office REIT - 0.2% 37.0% PGRE Paramount Group Inc. Office REIT - 2.6% 39.4% EQC Equity Commonwealth Office REIT - 3.9% 40.6% New York City Office Peer Group (1) Performance 12.3% 24.4% Office REIT Peer Group (2) Performance 13.2% 23.6% Index Group (3) Performance 27.2% 9.6% NYC’s Total Return of 37% outperformed the S&P 500 by over 6% and a group of New York City focused REIT peers by over 24% Source: S&P Capital IQ. Total Return calculated over the period beginning on January 1, 2021 through December 31, 2021. Total Return is calculated by taking the ending share price le ss the beginning share price plus dividends paid divided by the beginning share price, shown as a percentage. 1) Peer group includes SLG, VNO, ESRT and PGRE. 2) Peer group includes SLG, CUZ, OPI, VNO, ESRT, PGRE and EQC. 3) Index group includes ROOF, S&P 500, S&P 600, IJR and RUT 2000.
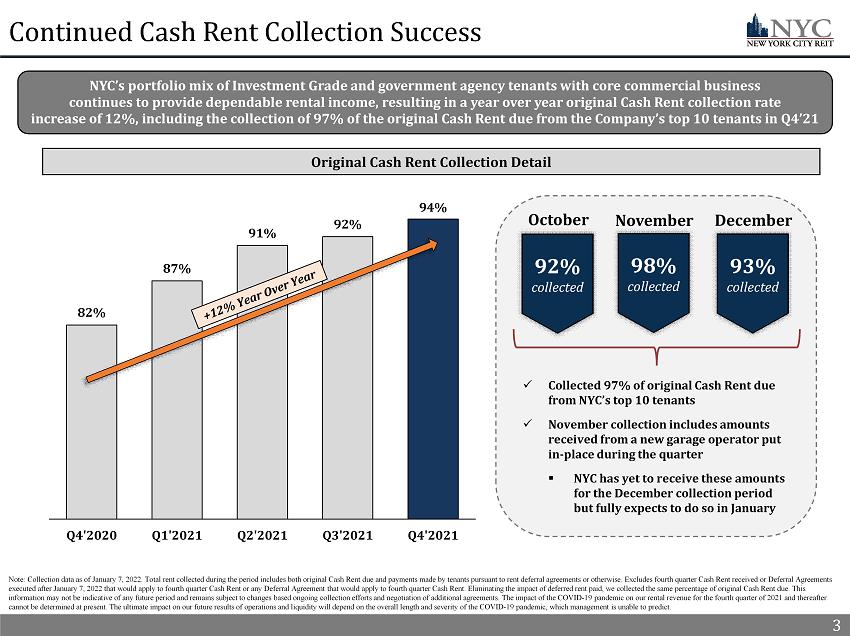
3 Continued Cash Rent Collection Success 3 Original Cash Rent Collection Detail Note: Collection data as of January 7, 2022. Total rent collected during the period includes both original Cash Rent due and pay ments made by tenants pursuant to rent deferral agreements or otherwise. Excludes fourth quarter Cash Rent received or Deferr al Agreements executed after January 7, 2022 that would apply to fourth quarter Cash Rent or any Deferral Agreement that would apply to fou rth quarter Cash Rent. Eliminating the impact of deferred rent paid, we collected the same percentage of original Cash Rent due. Th is information may not be indicative of any future period and remains subject to changes based ongoing collection efforts and ne got iation of additional agreements. The impact of the COVID - 19 pandemic on our rental revenue for the fourth quarter of 2021 and th ereafter cannot be determined at present. The ultimate impact on our future results of operations and liquidity will depend on the ove ral l length and severity of the COVID - 19 pandemic, which management is unable to predict. 94% 92% 91% 87% 82% Q4'2021 Q3'2021 Q2'2021 Q1'2021 Q4'2020 92% collected 98% collected 93% collected October November December x Collected 97 % of original Cash Rent due from NYC’s top 10 tenants x November collection includes amounts received from a new garage operator put in - place during the quarter ▪ NYC has yet to receive these amounts for the December collection period but fully expects to do so in January NYC’s portfolio mix of Investment Grade and government agency tenants with core commercial business continues to provide dependable rental income, resulting in a y ear over year original Cash Rent collection rate increase of 12%, including the collection of 97% of the original Cash Rent due from the Company’s top 10 tenants in Q4’21

4 2022 Estimated NAV per Share 4 NYC’s estimate of 2022 property - level income results in an estimated NAV per share of $22.12 - $28.10, indicating significant upside potential for NYC shareholders (1) Note: Refer to slide 5 - Notes to the Estimated NAV per Share for information on footnotes two through nine. 1) Refer to slides 13 of the Appendix for additional information relating to the limitations on, and risks related to, the estim ate d NAV per share and important disclosure notes used herein. Balance sheet accounts such as cash and cash equivalents, other assets, fair value of debt outstanding and other liabilities used herein as of the last reporting period of September 3 0, 2021. Although the Company does not believe that any activity affecting the Company’s assets and liabilities between September 30, 2021 and December 31, 2021 would have a material impact on estimated NAV per share, there can be no assurance t hat the estimated NAV per share would be materially the same if the book value of these particular items as of December 31, 2021 was used in calculating the estimated NAV. Estimated Net Asset Value ("NAV") Valuation ($ in mm, except for per share amounts and share count) Total 2022 estimated property-level revenue 65.0$ 65.0$ Less: Total 2022 estimated property-level operating expenses 32.9 32.9 2022 estimated property-level income 32.0$ 32.0$ New York City market capitalization rate 4.25% 4.75% Market value of NYC's portfolio 754.0$ 674.6$ plus: Cash and cash equivalents 23.2 23.2 plus: Other assets 19.0 19.0 Less: Fair value of debt outstanding 414.2 414.2 Less: Other liabilities 8.9 8.9 2022 Estimated Net Asset Value 373.1$ 293.7$ Basic and Diluted Shares Outstanding (as of December 31, 2021) 13.3 13.3 Estimated NAV per share $28.10 $22.12 January 7, 2022 closing price of common stock $10.76 $10.76 Valuation at Estimated Cap Rates ▪ Estimated NAV per share of $22.12 - $28.10 as of December 31, 2021 ▪ NYC’s estimated NAV per share represents a $11 - $17 per share premium on the January 7, 2022 closing price of $10.76 per share Highlights The advisor expects NYC’s portfolio mix of Investment Grade and government agency tenants and their core commercial businesses to continue to provide dependable rental income, as shown by NYC’s resilient and growing high Cash Rent collection rate, and result in increased property - level income and valuations (2) (3) (6) (7) (8) (9) (4) (5) (4)
5 Notes to the Estimated NAV per Share 2) Calculated based on estimated reimbursements and Cash Rent, excluding free rent, for all existing in - place leases for fiscal yea r 2022. Includes new leases and lease extension assumptions that the Company reasonably expect to complete for the fiscal year 2022. In preparation, management con sid ered factors such as space currently available and being negotiated for and the estimated applicable market rental terms. There can be no assurance that the Compa ny will complete these leases on their estimated terms or at all. The advisor believes that the use of Cash Rent is reasonable to use for this analysis as opposed t o A nnualized Straight - line Rent because estimated NAV per share is a estimation of 2022 property - level cash flows and is not a long - term discounted cash flow valuation. The proje cted property - level income does not include any acquisitions or dispositions except for the sale of the Hit Factory. As previously disclosed, this property is no t g enerating any net operating income. Acquisitions or dispositions would impact actual property - level income and the estimated NAV per share depending on how the Company funded th e acquisitions which could include the net proceeds from issuance of additional shares of Class A common stock. 3) Calculated based on estimated property operating expenses, occupancy and pricing for fiscal year 2022 at our current properti es, excluding the Hit Factory and any future acquisitions or dispositions. 4) The advisor believes that property - level income cannot be reconciled to the most comparable GAAP number because the advisor is m aking assumptions on future leasing activity and it is unable to reconcile to current Annualized Straight - line Rent without unreasonable expense. 5) Determined by the advisor in its sole discretion and based upon its knowledge and opinion of the New York City real estate ma rke t. 6) Represents cash and cash equivalents as of September 30, 2021. The advisor does not believe that any activity affecting the Company’s assets and liabilities between September 30, 2021 and December 31, 2021 would have a material impact on estimated NAV per share. 7) Represents restricted cash, prepaid expenses and other assets, excluding straight - line rent receivables as of September 30, 2021 . The advisor does not believe that any activity affecting the Company’s assets and liabilities between September 30, 2021 and December 31, 2021 would have a materia l i mpact on estimated NAV per share as of December 31, 2021. 8) Represents the fair value of the mortgage notes payable as of September 30, 2021. The fair value of mortgage note payable is dee med to be equivalent to its carrying value because it bears interest at a variable rate that fluctuates with the market and there has been no significant change in the cre dit risk or credit markets since origination. The advisor does not believe that any activity affecting the Company’s assets and liabilities between September 30, 2021 and December 31, 20 21 would have a material impact on estimated NAV per share. 9) Represents amounts associated with accounts payable and accrued expenses, excluding the liability for straight - line rent adjustm ents; and deferred rent and other liabilities as of September 30, 2021. The advisor does not believe that any activity affecting the Company’s assets and liabilities between September 30, 2021 and December 31, 20 21 would have a material impact on estimated NAV per share.
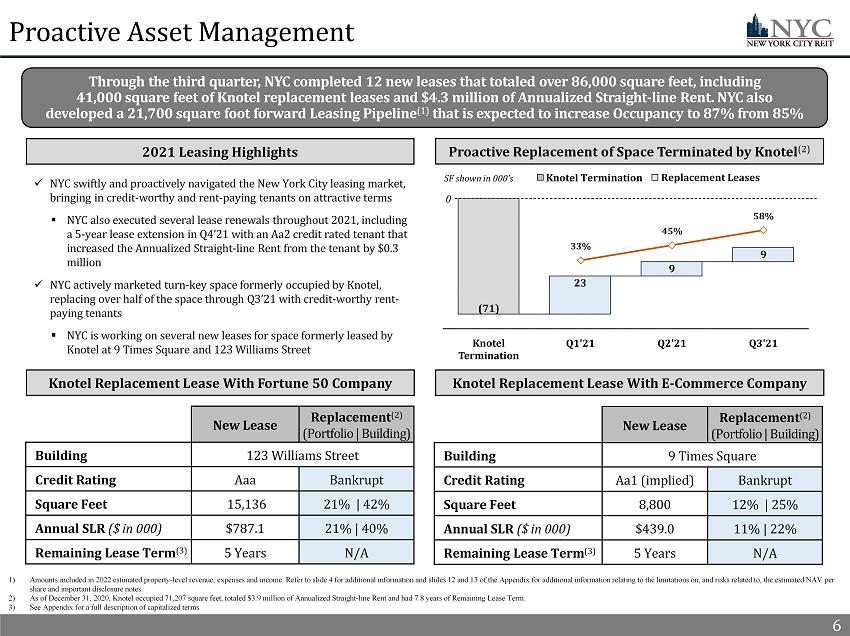
6 33% 45% 58% Through the third quarter, NYC completed 12 new leases that totaled over 86,000 square feet, including 41,000 square feet of Knotel replacement leases and $4.3 million of Annualized Straight - line Rent. NYC also developed a 21,700 square foot forward Leasing Pipeline (1) that is expected to increase Occupancy to 87% from 85% Proactive Asset Management New Lease Replacement (2) (Portfolio | Building) Building 123 Williams Street Credit Rating Aaa Bankrupt Square Feet 15,136 21% | 42% Annual SLR ($ in 000) $787.1 21% | 40% Remaining Lease Term (3) 5 Years N/A 6 Knotel Replacement Lease With Fortune 50 Company Proactive Replacement of Space Terminated by Knotel (2) 2021 Leasing Highlights x NYC swiftly and proactively navigated the New York City leasing market, bringing in credit - worthy and rent - paying tenants on attractive terms ▪ NYC also executed several lease renewals throughout 2021, including a 5 - year lease extension in Q4’21 with an Aa2 credit rated tenant that increased the Annualized Straight - line Rent from the tenant by $0.3 million x NYC actively marketed turn - key space formerly occupied by Knotel, replacing over half of the space through Q3’21 with credit - worthy rent - paying tenants ▪ NYC is working on several new leases for space formerly leased by Knotel at 9 Times Square and 123 Williams Street Knotel Replacement Lease With E - Commerce Company 1) Amounts included in 2022 estimated property - level revenue, expenses and income. Refer to slide 4 for additional information and slides 12 and 13 of the Appendix for additional information relating to the limitations on, and risks related to, the estimat ed NAV per share and important disclosure notes. 2) As of December 31, 2020, Knotel occupied 71 ,207 square feet, totaled $3.9 million of Annualized Straight - line Rent and had 7.8 years of Remaining Lease Term. 3) See Appendix for a full description of capitalized terms. Knotel Termination Replacement Leases 0 SF shown in 000’s New Lease Replacement (2) (Portfolio | Building) Building 9 Times Square Credit Rating Aa1 (implied) Bankrupt Square Feet 8,800 12% | 25% Annual SLR ($ in 000) $439.0 11% | 22% Remaining Lease Term (3) 5 Years N/A
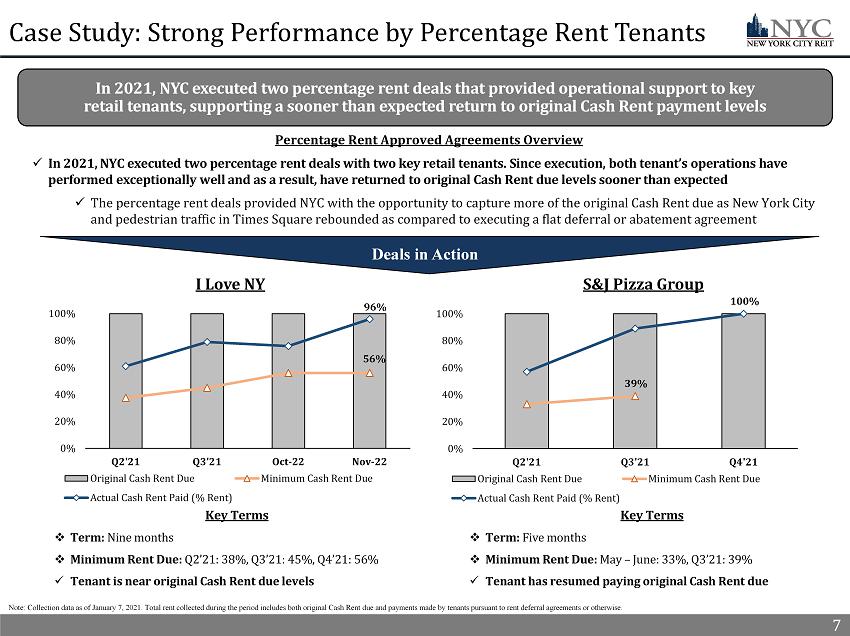
7 Percentage Rent Approved Agreements Overview x In 2021, NYC executed two percentage rent deals with two key retail tenants. Since execution, both tenant’s operations have performed exceptionally well and as a result, have returned to original Cash Rent due levels sooner than expected x The percentage rent deals provided NYC with the opportunity to capture more of the original Cash Rent due as New York City and pedestrian traffic in Times Square rebounded as compared to executing a flat deferral or abatement agreement 7 56% 96% 0% 20% 40% 60% 80% 100% Q2'21 Q3'21 Oct-22 Nov-22 I Love NY Original Cash Rent Due Minimum Cash Rent Due Actual Cash Rent Paid (% Rent) Deals in Action 39% 100% 0% 20% 40% 60% 80% 100% Q2'21 Q3'21 Q4'21 S&J Pizza Group Original Cash Rent Due Minimum Cash Rent Due Actual Cash Rent Paid (% Rent) Key Terms □ Term: Nine months □ Minimum Rent Due: Q2’21: 38%, Q3’21: 45%, Q4’21: 56% x Tenant is near original Cash Rent due levels Key Terms □ Term: Five months □ Minimum Rent Due: May – June: 33%, Q3’21: 39% x Tenant has resumed paying original Cash Rent due Note: Collection data as of January 7, 2021. Total rent collected during the period includes both original Cash Rent due and pay ments made by tenants pursuant to rent deferral agreements or otherwise. In 2021, NYC executed two percentage rent deals that provided operational support to key retail tenants, supporting a sooner than expected return to original Cash Rent payment levels Case Study: Strong Performance by Percentage Rent Tenants
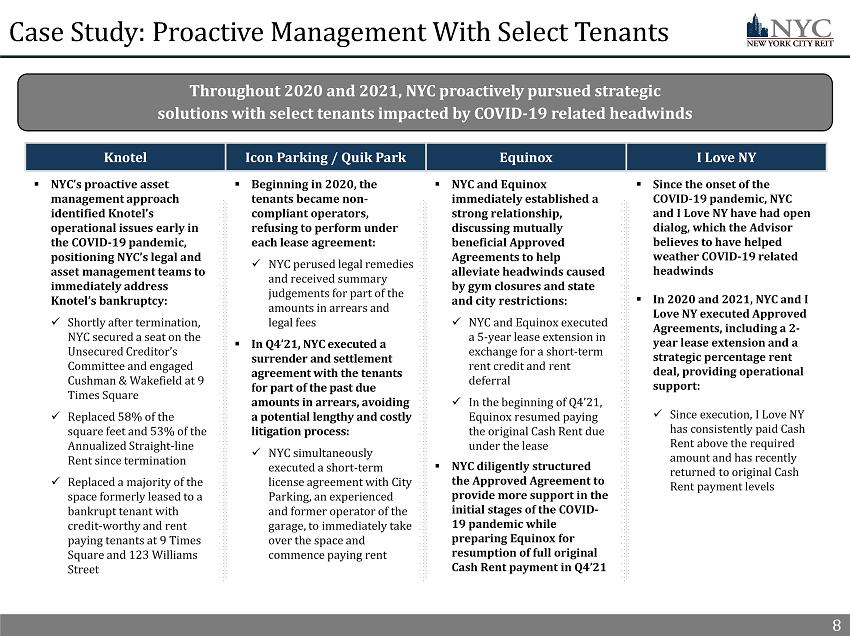
8 Case Study: Proactive Management With Select Tenants 8 ▪ NYC’s proactive asset management approach identified Knotel’s operational issues early in the COVID - 19 pandemic, positioning NYC’s legal and asset management teams to immediately address Knotel’s bankruptcy: x Shortly after termination, NYC secured a seat on the Unsecured Creditor’s Committee and engaged Cushman & Wakefield at 9 Times Square x Replaced 58% of the square feet and 53% of the Annualized Straight - line Rent since termination x Replaced a majority of the space formerly leased to a bankrupt tenant with credit - worthy and rent paying tenants at 9 Times Square and 123 Williams Street Throughout 2020 and 2021, NYC proactively pursued strategic solutions with select tenants impacted by COVID - 19 related headwinds Knotel Icon Parking / Quik Park Equinox I Love NY ▪ Beginning in 2020, the tenants became non - compliant operators, refusing to perform under each lease agreement: x NYC perused legal remedies and received summary judgements for part of the amounts in arrears and legal fees ▪ In Q4’21, NYC executed a surrender and settlement agreement with the tenants for part of the past due amounts in arrears, avoiding a potential lengthy and costly litigation process: x NYC simultaneously executed a short - term license agreement with City Parking, an experienced and former operator of the garage, to immediately take over the space and commence paying rent ▪ NYC and Equinox immediately established a strong relationship, discussing mutually beneficial Approved Agreements to help alleviate headwinds caused by gym closures and state and city restrictions: x NYC and Equinox executed a 5 - year lease extension in exchange for a short - term rent credit and rent deferral x In the beginning of Q4’21, Equinox resumed paying the original Cash Rent due under the lease ▪ NYC diligently structured the Approved Agreement to provide more support in the initial stages of the COVID - 19 pandemic while preparing Equinox for resumption of full original Cash Rent payment in Q4’21 ▪ Since the onset of the COVID - 19 pandemic, NYC and I Love NY have had open dialog, which the Advisor believes to have helped weather COVID - 19 related headwinds ▪ In 2020 and 2021, NYC and I Love NY executed Approved Agreements, including a 2 - year lease extension and a strategic percentage rent deal, providing operational support: x Since execution, I Love NY has consistently paid Cash Rent above the required amount and has recently returned to original Cash Rent payment levels

9 Appendix 9
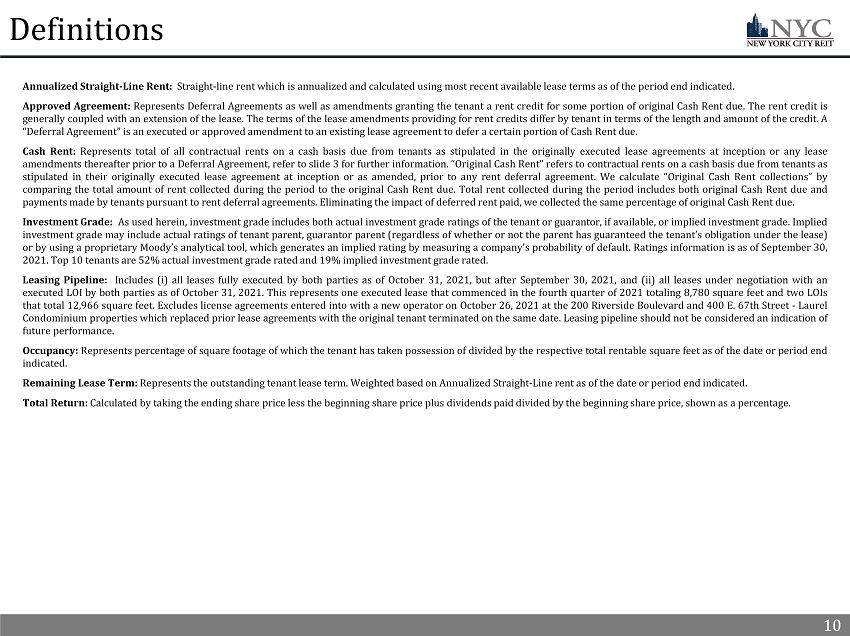
10 Definitions Annualized Straight - Line Rent : Straight - line rent which is annualized and calculated using most recent available lease terms as of the period end indicated . Approved Agreement : Represents Deferral Agreements as well as amendments granting the tenant a rent credit for some portion of original Cash Rent due . The rent credit is generally coupled with an extension of the lease . The terms of the lease amendments providing for rent credits differ by tenant in terms of the length and amount of the credit . A “Deferral Agreement” is an executed or approved amendment to an existing lease agreement to defer a certain portion of Cash Rent due . Cash Rent : Represents total of all contractual rents on a cash basis due from tenants as stipulated in the originally executed lease agreements at inception or any lease amendments thereafter prior to a Deferral Agreement, refer to slide 3 for further information . “Original Cash Rent” refers to contractual rents on a cash basis due from tenants as stipulated in their originally executed lease agreement at inception or as amended, prior to any rent deferral agreement . We calculate “Original Cash Rent collections” by comparing the total amount of rent collected during the period to the original Cash Rent due . Total rent collected during the period includes both original Cash Rent due and payments made by tenants pursuant to rent deferral agreements . Eliminating the impact of deferred rent paid, we collected the same percentage of original Cash Rent due . Investment Grade : As used herein, investment grade includes both actual investment grade ratings of the tenant or guarantor, if available, or implied investment grade . Implied investment grade may include actual ratings of tenant parent, guarantor parent (regardless of whether or not the parent has guaranteed the tenant’s obligation under the lease) or by using a proprietary Moody’s analytical tool, which generates an implied rating by measuring a company’s probability of default . Ratings information is as of September 30 , 2021 . Top 10 tenants are 52 % actual investment grade rated and 19 % implied investment grade rated . Leasing Pipeline : Includes ( i ) all leases fully executed by both parties as of October 31 , 2021 , but after September 30 , 2021 , and (ii) all leases under negotiation with an executed LOI by both parties as of October 31 , 2021 . This represents one executed lease that commenced in the fourth quarter of 2021 totaling 8 , 780 square feet and two LOIs that total 12 , 966 square feet . Excludes license agreements entered into with a new operator on October 26 , 2021 at the 200 Riverside Boulevard and 400 E . 67 th Street - Laurel Condominium properties which replaced prior lease agreements with the original tenant terminated on the same date . Leasing pipeline should not be considered an indication of future performance . Occupancy : Represents percentage of square footage of which the tenant has taken possession of divided by the respective total rentable square feet as of the date or period end indicated . Remaining Lease Term : Represents the outstanding tenant lease term . Weighted based on Annualized Straight - Line rent as of the date or period end indicated . Total Return : Calculated by taking the ending share price less the beginning share price plus dividends paid divided by the beginning share price, shown as a percentage . 10

11 Legal Notices 11

12 Important Additional Information and Where to Find It References in this presentation to the “Company,” “we,” “us” and “our” refer to New York City REIT, Inc. (“NYC”) and its cons oli dated subsidiaries. This presentation contains estimates and information concerning the Company’s industry and the Company’s peer companies that are based on industry publications, reports and peer company public filings. The Company has not independently verified the accuracy of the data co nta ined in these industry publications, reports and peer company public filings. These estimates and information involve a number of assumptions and li mit ations, and you are cautioned not to rely on or give undue weight to this information. The industry in which we operate is subject to a high deg ree of uncertainty and risk due to variety of factors, including those described in the “Risk Factors” and “Management's Discussion and Analysis of Financial Co ndi tion and Results of Operations” sections of the Company’s Annual Report on Form 10 - K filed with the SEC on March 29, 2021 and the Company's subseque nt Quarterly Reports on Form 10 - Q filed with the SEC. These and other factors could cause results to differ materially from those expressed in these publications and reports. The majority of the concessions granted to our tenants as a result of the COVID - 19 pandemic are rent deferrals or temporary rent abatements with the original lease term unchanged and collection of deferred rent deemed probable. As a result of relief granted by the FASB and the SEC related to lease modification accounting, rental revenue used to calculate Net Income and, NAREIT FFO and Core FFO has not been, and we do not ex pect it to be, significantly impacted by these types of deferrals. NYC intends to file a proxy statement on Schedule 14A, an accompanying proxy card and other relevant documents with the SEC i n c onnection with such solicitation of proxies from NYC stockholders for NYC's 2022 annual meeting of stockholders. NYC STOCKHOLDERS ARE STRONGLY ENCOURAGED TO READ NYC'S DEFINITIVE PROXY STATEMENT (INCLUDING ANY AMENDMENTS OR SUPPLEMENTS THERETO) AND ALL OTHER DOCUMENTS FILED WITH THE SEC CAREFULLY AND IN THEIR ENTIRETY WHEN THEY BECOME AVAILABLE BECAUSE THEY WILL CONTAIN IMPORTANT INFORMATION. Investors and stockholders may obtain a copy of the definitive proxy statement, an accompanying proxy card, any amendments or su pplements to the definitive proxy statement and other documents filed by NYC with the SEC at no charge at the SEC's website at www.sec.gov. Co pie s will also be available at no charge in the “SEC Filings” subsection of the “Financial Information” section of NYC's Investor Relations website at inves tor s.newyorkcityreit.com or by contacting NYC's Investor Relations department at info@ar - global.com, as soon as reasonably practicable after such materials are electronically filed with, or furnished to, the SEC. Participants in the Solicitation NYC, its directors, and certain of its executive officers may be deemed to be participants in the solicitation of proxies fro m N YC stockholders in connection with matters to be considered at NYC's 2022 annual meeting of stockholders. Information regarding the direct and indirect int ere sts, by security holdings or otherwise, of NYC's directors and executive officers, in NYC is included in NYC's Proxy Statement on Schedule 14A for its 202 1 a nnual meeting of stockholders, filed with the SEC on March 30, 2021, NYC's Annual Report on Form 10 - K for the year ended December 31, 2021, filed with the SEC on March 29, 2021, and in NYC's Current Reports on Form 8 - K filed with the SEC from time to time. Changes to the direct or indirect inter ests of NYC's directors and executive officers are set forth in SEC filings on Initial Statements of Beneficial Ownership on Form 3, Statements of Change in Ownership on Form 4 and Annual Statements of Changes in Beneficial Ownership on Form 5. These documents are available free of charge as described abo ve. Updated information regarding the identities of potential participants and their direct or indirect interests, by security holdings or otherwise, in NYC will be set forth in the Proxy Statement for NYC's 2022 annual meeting of stockholders and other relevant documents to be filed with the SEC, if and when th ey become available. 12
13 Limitations on, and risks related to, the Estimated NAV per Share The Company’s estimated net asset value per share (“NAV”) as of December 31, 2021 contained herein was calculated by applying tw o different capitalization rates to property - level income projected for 2022 by the advisor to arrive at the estimated market value of the Company’s portfolio, and then deducting from this amou nt the fair value of the Company’s mortgage notes payable as of September 30, 2021 as set forth in the notes to the Company’s financial statements as of September 30, 2021, and adding the b ook value of cash and cash equivalents and other assets, net of other liabilities, as set forth in the Company’s financial statements as of September 30, 2021. The estimated NAV per share was cal cul ated by dividing the estimated NAV by the number of shares of the Company’s Class A common stock on a fully - diluted basis outstanding as of December 31, 2021. Other information is being provided shortly after the end of the Company's 2021 fiscal year, and accordingly information about that fiscal year remains unavailable pending the progress of its year - end financial close process. The estimated NAV per share was calculated as of a specific time, will likely change, and does not represent the amount a sto ckh older would receive from a third party now or in the future for his or her shares of the Company’s Class A common stock. There is no assurance that the trading price of the Company’s Class A commo n s tock will not continue to trade at a significant discount to, equal or exceed this estimate. The estimated NAV per share does not represent the book value of the Company’s real estate, which is ge ner ally based on the amortized cost of the property, subject to certain adjustments, or the Company’s enterprise value. The estimated NAV per share is not a representation or guarantee that the Com pan y’s shares of Class A common stock will or should trade at this amount, and investors should not rely on the estimated NAV per share in making a decision to buy or sell shares of the Compan y’s Class A common stock. The measures employed by the Company’s advisor to project property - level income and calculate this estimate of NAV per share may not be comparable to measures used by other companies and were based upon a number of estimates, assumptions, judgments and opinions made by the Company’s advisor that may not be accu rat e or complete, including estimates and assumptions such as capitalization rates and estimations of new or extended leases, future rent and expenses. The advisor’s estimation of propert y - l evel income does not include any acquisitions or dispositions in calendar year 2022 except for the sale of the Hit Factory. Acquisitions or dispositions would impact actual property - level incom e and the estimated NAV per share depending on how the Company funded the acquisitions which could include the net proceeds from issuance of additional shares of Class A common stock. The Hit Factory property, as previously disclosed, is not generating income. The estimated market value of the Company’s real estate assets is based solely on the advisor’s estimation of property - level inc ome for 2022, applying capitalization rates selected by the advisor based on its opinion and knowledge of the New York City real estate marke t , without any independent third - party review or third - party appraisals of assets and does not necessarily represent the value th e Company would receive or accept if the Company’s real estate assets were marketed for sale or a third - party appraisal of the Com pany’s real estate assets or the price the Company's board may accept if a third party made an offer for the shares of the Class A common stock. The estimated value also does not take into consid era tion transaction costs or other items such as tax adjustments that may impact the value a buyer might ascribe to the Company’s real estate assets was prepared. The cash and cash equivalents and ot her assets, net of other liabilities, used in calculating the estimated NAV were based on the book value in the Company’s financial statements as of September 30, 2021 and do not reflect activities sub seq uent to September 30, 2021. Although the Company does not believe that any activity affecting the Company’s assets and liabilities between September 30, 2021 and December 31, 2021 would have a m aterial impact on estimated NAV per share, there can be no assurance that the estimated NAV per share would be materially the same if the book value of these particular items as of Dec emb er 31, 2021 was used in calculating the estimated NAV. Estimation of Property - Level Income In connection with estimating NAV, the Company’s advisor prepared an unaudited estimation of the Company’s property - level income for all of calendar year 2022. This information is subjective in many respects and is not necessarily predicative of actual future results and should not be relied upon as such. The internal pr ospective financial information used by the Company’s advisor to prepare the property - level income estimation for 2022 was based on numerous variables and assumptions that were deemed to be rea sonable as of date when the estimation was finalized. These assumptions are inherently uncertain and may be beyond the Company’s control. Important factors that may affect actual result s a nd cause the Company to fail to meet the estimation include, but are not limited to, risks and uncertainties relating to the Company’s business (including that tenant pay the cash rent required in their respective leases and the Company does not incur significant additional expenses that are not anticipated), the potential adverse effects of the ongoing global COVID - 19 pandemic, including actions taken to contain or treat COVID - 19, on the Company’s tenants and the global economy and financial market, industry performance, the legal and regulatory environment, general business and ec onomic conditions and other factors described or referenced under the section entitled “Forward - Looking Statements” contained in the Appendix to this presentation, including those presented in t he section titled “Item 1A. Risk Factors” in the Company’s Annual Report on Form 10 - K filed with the SEC on March 29, 2021 as well as other subsequent reports filed with the SEC. There can be no assurance that the estimation will be realized or that actual results will not be significantly higher or lower than forecasted. In addition, the estimation was not prepared with a view toward complying with U.S. generally accepted accounting principles, th e published guidelines of the SEC regarding estimations and the use of non - GAAP measures or the guidelines established by the American Institute of Certified Public Accountants for preparation and pr esentation of prospective financial information. Neither the Company’s independent registered public accounting firm, nor any other independent accountants, have compiled, examined or pe rfo rmed any procedures with respect to the estimation contained in this presentation, nor have they expressed any opinion or any other form of assurance on the information or the potential for th e Company achieving the estimation. The estimation of property - level income is a non - GAAP financial measure and should not be considered in isolation from, or as a substitute for, financial informa tion presented in compliance with GAAP. The estimated property - level income for 2022 has not been reconciled the estimated net income (loss) for 2022, the most directly comparable GAAP financial me asure, the advisor believes that property - level income cannot be reconciled to the most comparable GAAP number because the advisor is making assumptions on future leasing activity and it is una ble to reconcile to current Annualized Straight - line Rent without unreasonable expense. 13
14 Forward Looking Statements Certain statements made in this presentation are “forward - looking statements” (as defined in Section 21E of the Exchange Act), w hich reflect the expectations of the Company regarding future events. You can identify forward - looking statements by the use of forward looking terminology such as “believes,” “expects,” “m ay,” “will,” “would,” “could,” “should,” “seeks,” “intends,” “plans,” “projects,” “estimates,” “anticipates,” “predicts,” or “potential” or the negative of these words and phrases or similar word s o r phrases. The forward - looking statements involve a number of risks, uncertainties and other factors that could cause actual results to differ materially from those contained in the forward - looking statements. These forward - looking statements include, but are not limited to, market and other expectations, objectives, and intentions, as well as any other statements that are not historica l f acts. Our potential risks and uncertainties are presented in the section titled “Item 1A. Risk Factors” in the Company’s Annual Rep ort on Form 10 - K filed with the SEC on March 29, 2021 as well as other subsequent reports filed with the SEC. Forward - looking statements speak as of the date they were made and we disclaim any obliga tion to update and revise statements contained in these materials to reflect changed assumptions, the occurrence of unanticipated events or changes to future operating results over tim e, unless required by law. The following are some of the risks and uncertainties relating to us, although not all risks and uncertainties, that could cause our actual results to differ materia lly from those presented in our forward - looking statements: • Our properties may be adversely affected by economic cycles and risks inherent to New York City. • Our ability to fund our capital requirements will depend on, among other things, the amount of cash we are able to generate f rom our operations, which is dependent on, among other things, the impact of the COVID - 19 pandemic on our tenants and other factors outside of our control, and our ability to access capital f rom outside sources, which may not be available on acceptable or favorable terms, or at all. • If we are not able to generate sufficient cash from operations, we may have to reduce the amount of dividends we pay or ident ify other financing sources. • Funding dividends from other sources such as borrowings, asset sales or equity issuances limits the amount we can use for pro per ty acquisitions, investments and other corporate purposes. • We are subject to risks associated with a pandemic, epidemic or outbreak of a contagious disease, such as the ongoing global COV ID - 19 pandemic, including negative impacts on our tenants and their respective businesses. • Market and economic challenges experienced by the U.S. and global economies may adversely impact aspects of our operating res ult s and operating condition. • We depend on tenants for our rental revenue and, accordingly, our rental revenue is dependent upon the success and economic v iab ility of our tenants. If a tenant or lease guarantor declares bankruptcy or becomes insolvent, we may be unable to collect balances due under relevant leases. • We anticipate our ongoing breach of the loan secured by our 9 Times Square property may ultimately lead to an event of defaul t u nder the loan. There is no assurance we will be able to reach a satisfactory agreement with our lender or otherwise make a significant repayment of principal (the exact amount of which can not be estimated presently) as required by the loan agreement to cure the covenant breaches which may give rise to an event of default and the lender accelerating the principal amount due un der the loan and exercising other remedies including foreclosing on the property. Further, funding any substantial principal repayment would significantly impact our capital reso urc es which could have a material adverse effect on our ability to fund our operating expenses (including debt service obligations), acquisitions, capital expenditures and dividends to the hol der s of shares of our common stock. • As of September 30, 2021, we have $5.2 million cash maintained in segregated and restricted cash accounts resulting from the cov enant breaches under our loan, all of which is cash from our 1140 Avenue of the Americas property. In addition, due to the covenant breaches resulting in cash traps, all cash generated f rom our 9 Times Square, Laurel/Riverside and 8713 Fifth Avenue properties is required to be held in a segregated account and we will not have access to any excess cash flows, if any, gener ate d from these properties. Breaches of loan covenants has reduced the cash available to us and further breaches will limit our ability to access cash generated by our properties and significa ntl y impact our capital resources. There is no assurance we will be able to cure the breaches and access the excess cash generated by these properties, if any. • In owning properties we may experience, among other things, unforeseen costs associated with complying with laws and regulati ons and other costs, potential difficulties selling properties and potential damages or losses resulting from climate change. • We depend on the Advisor and Property Manager to provide us with executive officers, key personnel and all services required for us to conduct our operations. • All of our executive officers face conflicts of interest, such as conflicts created by the terms of our agreements with the A dvi sor and compensation payable thereunder, conflicts allocating investment opportunities to us, and conflicts in allocating their time and attention to our matters. Conflicts that arise may no t be resolved in our favor and could result in actions that are adverse to us. • We have long - term agreements with our Advisor and its affiliates that may be terminated only in limited circumstances and may re quire us to pay a termination fee in some cases. • We have substantial indebtedness and may be unable to repay, refinance, restructure or extend our indebtedness as it becomes due . Increases in interest rates could increase the amount of our debt payments. We may incur additional indebtedness in the future. • The stockholder rights plan adopted by our board of directors, our classified board and other aspects of our corporate struct ure and Maryland law may discourage a third party from acquiring us in a manner that might result in a premium price to our stockholders. • Restrictions on share ownership contained in our charter may inhibit market activity in shares of our stock and restrict our bus iness combination opportunities. • We may fail to continue to qualify as a REIT. 14