Exhibit 99.1

0 NEW YORK CITY REIT Fourth Quarter Investor Presentation 9 Times Square - New York, NY _
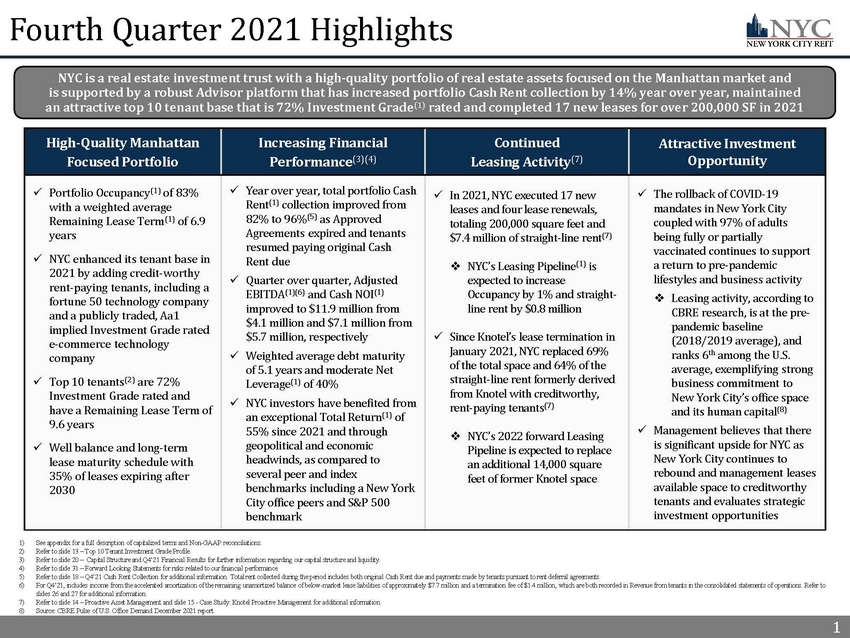
1 Fourth Quarter 2021 Highlights 1) See appendix for a full description of capitalized terms and Non - GAAP reconciliations. 2) Refer to slide 13 – Top 10 Tenant Investment Grade Profile. 3) Refer to slide 20 – Capital Structure and Q4’21 Financial Results for further information regarding our capital structure and liquidity. 4) Refer to slide 31 – Forward Looking Statements for risks related to our financial performance. 5) Refer to slide 18 – Q4’21 Cash Rent Collection for additional information. Total rent collected during the period includes both original Cash Rent due and payments made by tenants pursuant to rent deferral agreements. 6) For Q4’21, includes income from the accelerated amortization of the remaining unamortized balance of below - market lease liabilit ies of approximately $7.7 million and a termination fee of $1.4 million, which are both recorded in Revenue from tenants in t he consolidated statements of operations. Refer to slides 26 and 27 for additional information. 7) Refer to slide 14 – Proactive Asset Management and slide 15 - Case Study: Knotel Proactive Management for additional information . 8) Source: CBRE Pulse of U.S. Office Demand December 2021 report. 1 High - Quality Manhattan Focused Portfolio Increasing Financial Performance (3)(4) Continued Leasing Activity (7) Attractive Investment Opportunity x Portfolio Occupancy (1) of 83% with a weighted average Remaining Lease Term (1) of 6.9 years x NYC enhanced its tenant base in 2021 by adding credit - worthy rent - paying tenants, including a fortune 50 technology company and a publicly traded, Aa1 implied Investment Grade rated e - commerce technology company x Top 10 tenants (2) are 72% Investment Grade rated and have a Remaining Lease Term of 9.6 years x Well balance and long - term lease maturity schedule with 35% of leases expiring after 2030 x Year over year, total portfolio Cash Rent (1) collection improved from 82% to 96% (5) as Approved Agreements expired and tenants resumed paying original Cash Rent due x Quarter over quarter, Adjusted EBITDA (1)(6) and Cash NOI (1) improved to $11.9 million from $4.1 million and $7.1 million from $5.7 million, respectively x Weighted average debt maturity of 5.1 years and moderate Net Leverage (1) of 40% x NYC investors have benefited from an exceptional Total Return (1) of 55% since 2021 and through geopolitical and economic headwinds, as compared to several peer and index benchmarks including a New York City office peers and S&P 500 benchmark x In 2021, NYC executed 17 new leases and four lease renewals, totaling 200,000 square feet and $7.4 million of straight - line rent (7) □ NYC’s Leasing Pipeline (1) is expected to increase Occupancy by 1% and straight - line rent by $0.8 million x Since Knotel’s lease termination in January 2021, NYC replaced 69% of the total space and 64% of the straight - line rent formerly derived from Knotel with creditworthy, rent - paying tenants (7) □ NYC’s 2022 forward Leasing Pipeline is expected to replace an additional 14 ,000 square feet of former Knotel space x The rollback of COVID - 19 mandates in New York City coupled with 97% of adults being fully or partially vaccinated continues to support a return to pre - pandemic lifestyles and business activity □ Leasing activity, according to CBRE research, is at the pre - pandemic baseline (2018/2019 average), and ranks 6 th among the U.S. average, exemplifying strong business commitment to New York City’s office space and its human capital (8) x Management believes that there is significant upside for NYC as New York City continues to rebound and management leases available space to creditworthy tenants and evaluates strategic investment opportunities NYC is a real estate investment trust with a high - quality portfolio of real estate assets focused on the Manhattan market and is supported by a robust Advisor platform that has increased portfolio Cash Rent collection by 14% year over year, maintained an attractive top 10 tenant base that is 72% Investment Grade (1) rated and completed 17 new leases for over 200,000 SF in 2021
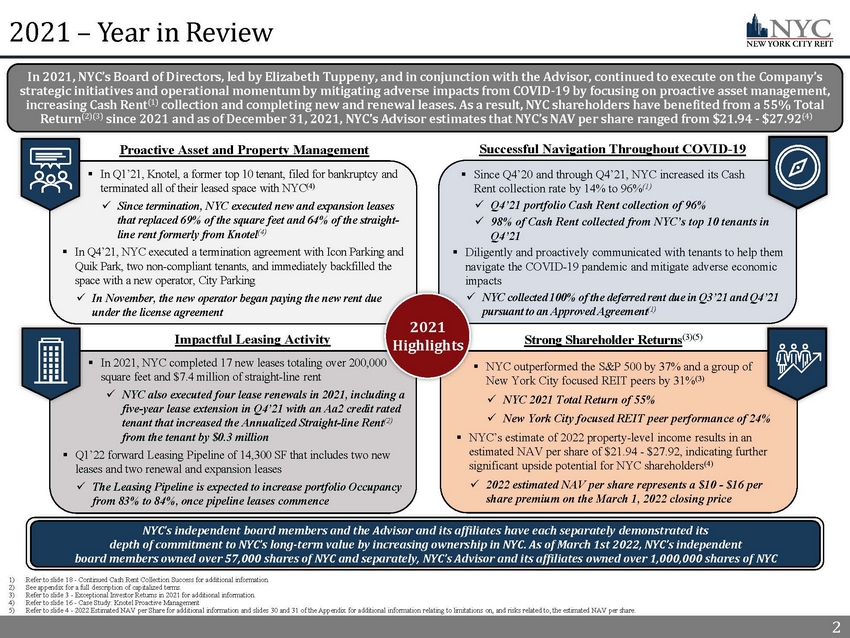
2 In 2021, NYC’s Board of Directors, led by Elizabeth Tuppeny, and in conjunction with the Advisor, continued to execute on the Co mpany’s strategic initiatives and operational momentum by mitigating adverse impacts from COVID - 19 by focusing on proactive asset manage ment, increasing Cash Rent (1) collection and completing new and renewal leases. As a result, NYC shareholders have benefited from a 55% Total Return (2)(3) since 2021 and as of December 31, 2021, NYC’s Advisor estimates that NYC’s NAV per share ranged from $21.94 - $27.92 (4) 2021 – Year in Review 2 2021 Highlights ▪ In Q1’21, Knotel, a former top 10 tenant, filed for bankruptcy and terminated all of their leased space with NYC (4) x Since termination, NYC executed new and expansion leases that replaced 69% of the square feet and 64% of the straight - line rent formerly from Knotel (4) ▪ In Q4’21, NYC executed a termination agreement with Icon Parking and Quik Park, two non - compliant tenants, and immediately backfilled the space with a new operator, City Parking x In November, the new operator began paying the new rent due under the license agreement ▪ In 2021, NYC completed 17 new leases totaling over 200,000 square feet and $7.4 million of straight - line rent x NYC also executed four lease renewals in 2021, including a five - year lease extension in Q4’21 with an Aa2 credit rated tenant that increased the Annualized Straight - line Rent (2) from the tenant by $0.3 million ▪ Q1’22 forward Leasing Pipeline of 14,300 SF that includes two new leases and two renewal and expansion leases x The Leasing Pipeline is expected to increase portfolio Occupancy from 83% to 84%, once pipeline leases commence ▪ NYC outperformed the S&P 500 by 37% and a group of New York City focused REIT peers by 31% (3) x NYC 2021 Total Return of 55% x New York City focused REIT peer performance of 24% ▪ NYC’s estimate of 2022 property - level income results in an estimated NAV per share of $21.94 - $27.92, indicating further significant upside potential for NYC shareholders (4) x 2022 estimated NAV per share represents a $10 - $16 per share premium on the March 1, 2022 closing price Proactive Asset and Property Management Successful Navigation Throughout COVID - 19 Impactful Leasing Activity Strong Shareholder Returns (3)(5) ▪ Since Q4’20 and through Q4’21, NYC increased its Cash Rent collection rate by 14% to 96% (1) x Q4’21 portfolio Cash Rent collection of 96% x 98% of Cash Rent collected from NYC’s top 10 tenants in Q4’21 ▪ Diligently and proactively communicated with tenants to help them navigate the COVID - 19 pandemic and mitigate adverse economic impacts x NYC collected 100% of the deferred rent due in Q3’21 and Q4’21 pursuant to an Approved Agreement (1) 1) Refer to slide 18 - Continued Cash Rent Collection Success for additional information. 2) See appendix for a full description of capitalized terms. 3) Refer to slide 3 - Exceptional Investor Returns in 2021 for additional information. 4) Refer to slide 16 - Case Study: Knotel Proactive Management 5) Refer to slide 4 - 2022 Estimated NAV per Share for additional information and slides 30 and 31 of the Appendix for additional i nformation relating to limitations on, and risks related to, the estimated NAV per share. NYC’s independent board members and the Advisor and its affiliates have each separately demonstrated its depth of commitment to NYC’s long - term value by increasing ownership in NYC. As of March 1st 2022, NYC’s independent board members owned over 57,000 shares of NYC and separately, NYC’s Advisor and its affiliates owned over 1,000,000 shares of NY C

3 Exceptional Investor Returns Since 2021 3 Since 2021 and through geopolitical and economic headwinds, NYC’s investors have benefited from an exceptional Total Return of 55% which compares exceptionally well to several peer and index benchmarks, including New York City office peers and the S&P 500 Index Symbol / Index Name Type Total Return Since 2021 Out Performance NYC New York City REIT Inc. Office REIT 55.0% SLG SL Green Realty Corp. Office REIT 41.0% 14.0% PGRE Paramount Group Inc. Office REIT 27.9% 27.1% ROOF US Real Estate Small Cap ETF Small - Cap Real Estate ETF 23.3% 31.7% CUZ Cousins Properties Inc. Office REIT 22.4% 32.6% VNO Vornado Realty Trust Office REIT 22.2% 32.8% OPI Office Properties Income Trust. Office REIT 21.7% 33.3% S&P 500 S&P 500 Index S&P 500 Index 18.3% 36.7% S&P 600 S&P Small - Cap 600 Index S&P 600 Index 18.3% 36.7% IJR iShares Core S&P Small - Cap ETF Small - Cap Index ETF 18.0% 37.0% ESRT Empire State Realty Trust Inc. Office REIT 5.0% 50.0% RUT 2000 Russell 2000 Index FTSE Russell Small - Cap Index 4.4% 50.6% EQC Equity Commonwealth Office REIT - 0.3% 55.3% New York City Office Peer Group (1) Performance 24.0% 31.0% Office REIT Peer Group (2) Performance 20.0% 35.0% Index Group (3) Performance 16.4% 38.6% NYC’s Total Return of 55% since 2021 outperformed the S&P 500 by 37% and a group of New York City focused REIT peers by 31% Source: S&P Capital IQ. Total Return calculated over the period beginning on January 1, 2021 through March 1, 2022. Total Return is calculated by taking the ending share price less t he beginning share price plus dividends paid divided by the beginning share price, shown as a percentage. 1) Peer group includes SLG, VNO, ESRT and PGRE. 2) Peer group includes SLG, CUZ, OPI, VNO, ESRT, PGRE and EQC. 3) Index group includes ROOF, S&P 500, S&P 600, IJR and RUT 2000.
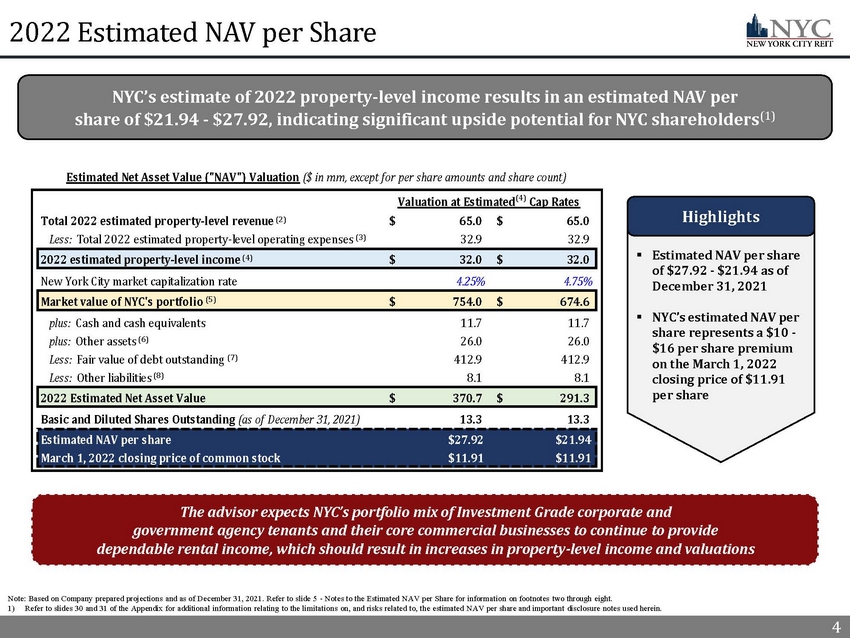
4 4 2022 Estimated NAV per Share 4 NYC’s estimate of 2022 property - level income results in an estimated NAV per share of $21.94 - $27.92, indicating significant upside potential for NYC shareholders (1) Note: Based on Company prepared projections and as of December 31, 2021. Refer to slide 5 - Notes to the Estimated NAV per Share for information on footnotes two through eight. 1) Refer to slides 30 and 31 of the Appendix for additional information relating to the limitations on, and risks related to, th e e stimated NAV per share and important disclosure notes used herein. Estimated Net Asset Value ("NAV") Valuation ($ in mm, except for per share amounts and share count) Total 2022 estimated property-level revenue 65.0$ 65.0$ Less: Total 2022 estimated property-level operating expenses 32.9 32.9 2022 estimated property-level income 32.0$ 32.0$ New York City market capitalization rate 4.25% 4.75% Market value of NYC's portfolio 754.0$ 674.6$ plus: Cash and cash equivalents 11.7 11.7 plus: Other assets 26.0 26.0 Less: Fair value of debt outstanding 412.9 412.9 Less: Other liabilities 8.1 8.1 2022 Estimated Net Asset Value 370.7$ 291.3$ Basic and Diluted Shares Outstanding (as of December 31, 2021) 13.3 13.3 Estimated NAV per share $27.92 $21.94 March 1, 2022 closing price of common stock $11.91 $11.91 Valuation at Estimated Cap Rates ▪ Estimated NAV per share of $27.92 - $21.94 as of December 31, 2021 ▪ NYC’s estimated NAV per share represents a $10 - $16 per share premium on the March 1, 2022 closing price of $11.91 per share Highlights The advisor expects NYC’s portfolio mix of Investment Grade corporate and government agency tenants and their core commercial businesses to continue to provide dependable rental income, which should result in increases in property - level income and valuations (2) (3) (6) (7) (8) (4) (5) (4)
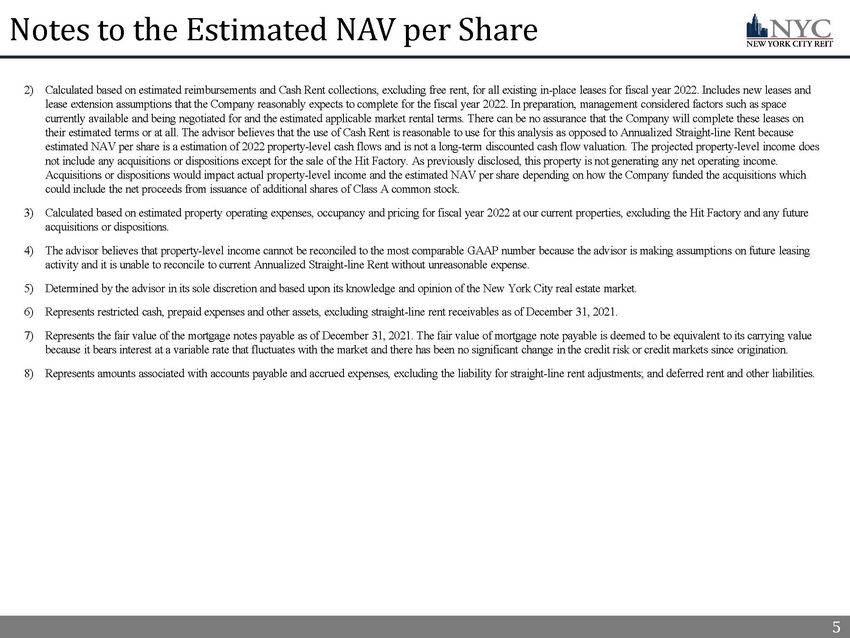
5 5 Notes to the Estimated NAV per Share 2) Calculated based on estimated reimbursements and Cash Rent collections, excluding free rent, for all existing in - place leases fo r fiscal year 2022. Includes new leases and lease extension assumptions that the Company reasonably expects to complete for the fiscal year 2022. In preparation, managem ent considered factors such as space currently available and being negotiated for and the estimated applicable market rental terms. There can be no assurance that th e Company will complete these leases on their estimated terms or at all. The advisor believes that the use of Cash Rent is reasonable to use for this analysis as opp ose d to Annualized Straight - line Rent because estimated NAV per share is a estimation of 2022 property - level cash flows and is not a long - term discounted cash flow valuation. The projected property - level income does not include any acquisitions or dispositions except for the sale of the Hit Factory. As previously disclosed, this property i s n ot generating any net operating income. Acquisitions or dispositions would impact actual property - level income and the estimated NAV per share depending on how the Comp any funded the acquisitions which could include the net proceeds from issuance of additional shares of Class A common stock. 3) Calculated based on estimated property operating expenses, occupancy and pricing for fiscal year 2022 at our current properti es, excluding the Hit Factory and any future acquisitions or dispositions. 4) The advisor believes that property - level income cannot be reconciled to the most comparable GAAP number because the advisor is m aking assumptions on future leasing activity and it is unable to reconcile to current Annualized Straight - line Rent without unreasonable expense. 5) Determined by the advisor in its sole discretion and based upon its knowledge and opinion of the New York City real estate ma rke t. 6) Represents restricted cash, prepaid expenses and other assets, excluding straight - line rent receivables as of December 31, 2021. 7) Represents the fair value of the mortgage notes payable as of December 31, 2021. The fair value of mortgage note payable is d eem ed to be equivalent to its carrying value because it bears interest at a variable rate that fluctuates with the market and there has been no significant change in the cre dit risk or credit markets since origination. 8) Represents amounts associated with accounts payable and accrued expenses, excluding the liability for straight - line rent adjustm ents; and deferred rent and other liabilities. 5
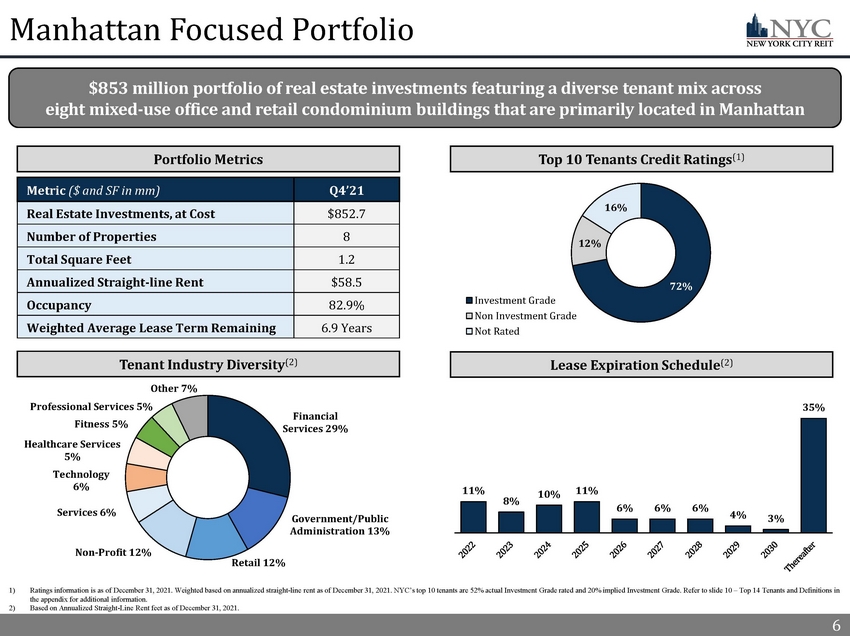
6 Manhattan Focused Portfolio Metric ($ and SF in mm) Q4’21 Real Estate Investments, at Cost $852.7 Number of Properties 8 Total Square Feet 1.2 Annualized Straight - line Rent $58.5 Occupancy 82.9% Weighted Average Lease Term Remaining 6.9 Years 1) Ratings information is as of December 31, 2021. Weighted based on annualized straight - line rent as of December 31, 2021. NYC’s t op 10 tenants are 52% actual Investment Grade rated and 20% implied Investment Grade. Refer to slide 10 ��� Top 14 Tenants and Definitions in the appendix for additional information. 2) Based on Annualized Straight - Line Rent feet as of December 31 , 2021. 6 11% 8% 10% 11% 6% 6% 6% 4% 3% 35% Financial Services 29% Government/Public Administration 13% Retail 12% Non - Profit 12% Services 6% Technology 6% Healthcare Services 5% Fitness 5% Professional Services 5% Other 7% $853 million portfolio of real estate investments featuring a diverse tenant mix across eight mixed - use office and retail condominium buildings that are primarily located in Manhattan Top 10 Tenants Credit Ratings (1) Tenant Industry Diversity (2) Lease Expiration Schedule (2) Portfolio Metrics 72% 12% 16% Investment Grade Non Investment Grade Not Rated
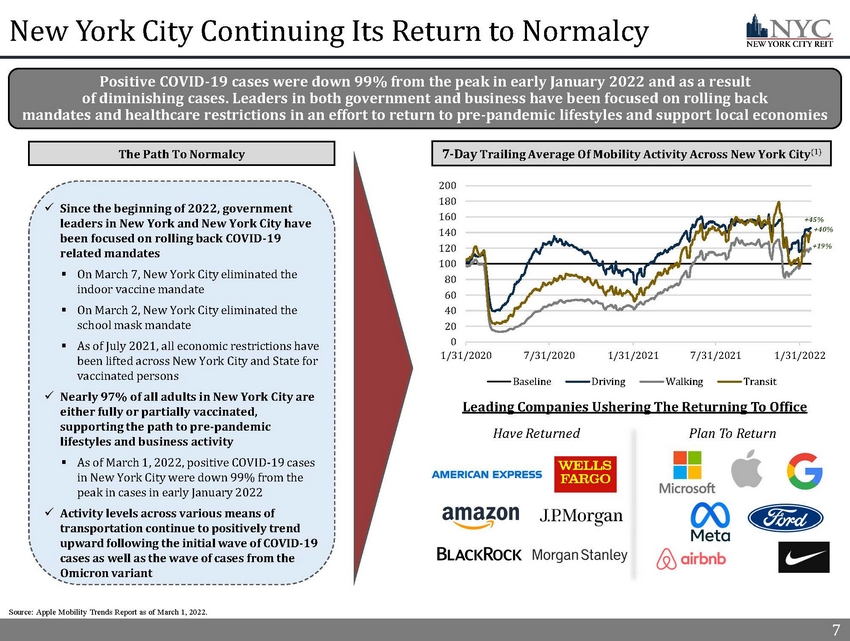
7 New York City Continuing Its Return to Normalcy 7 Positive COVID - 19 cases were down 99% from the peak in early January 2022 and as a result of diminishing cases. Leaders in both government and business have been focused on rolling back mandates and healthcare restrictions in an effort to return to pre - pandemic lifestyles and support local economies The Path To Normalcy Source: Apple Mobility Trends Report as of March 1, 2022. 0 20 40 60 80 100 120 140 160 180 200 1/31/2020 7/31/2020 1/31/2021 7/31/2021 1/31/2022 Baseline Driving Walking Transit 7 - Day Trailing Average Of Mobility Activity Across New York City (1) +45% +40% +19% Leading Companies Ushering The Returning To Office Have Returned Plan To Return x Since the beginning of 2022, government leaders in New York and New York City have been focused on rolling back COVID - 19 related mandates ▪ On March 7, New York City eliminated the indoor vaccine mandate ▪ On March 2, New York City eliminated the school mask mandate ▪ As of July 2021, all economic restrictions have been lifted across New York City and State for vaccinated persons x Nearly 97% of all adults in New York City are either fully or partially vaccinated, supporting the path to pre - pandemic lifestyles and business activity ▪ As of March 1, 2022, positive COVID - 19 cases in New York City were down 99% from the peak in cases in early January 2022 x Activity levels across various means of transportation continue to positively trend upward following the initial wave of COVID - 19 cases as well as the wave of cases from the Omicron variant
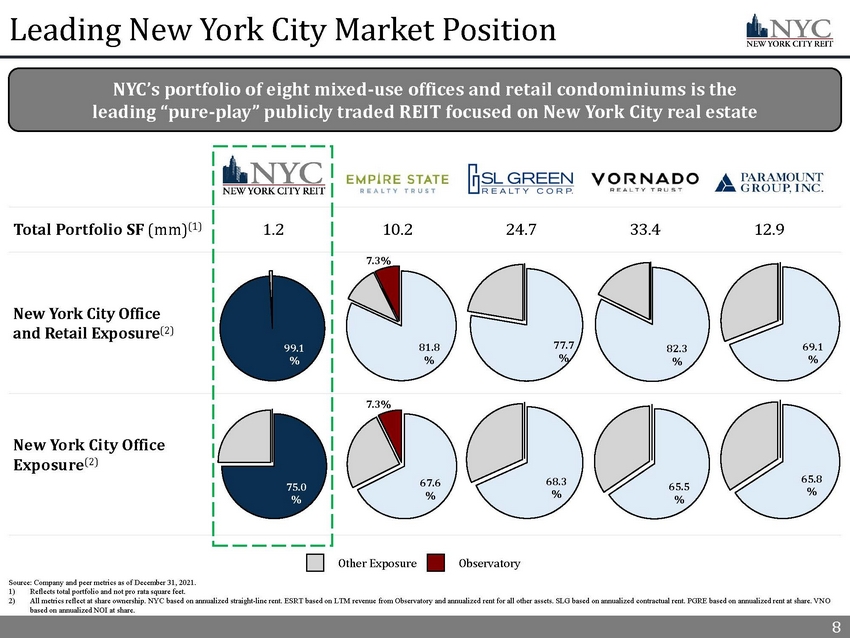
8 Leading New York City Market Position NYC’s portfolio of eight mixed - use offices and retail condominiums is the leading “pure - play” publicly traded REIT focused on New York City real estate Total Portfolio SF (mm) (1) 8 New York City Office and Retail Exposure (2) New York City Office Exposure (2) Other Exposure Observatory Source: Company and peer metrics as of December 31, 2021 . 1) Reflects total portfolio and not pro rata square feet. 2) All metrics reflect at share ownership. NYC based on annualized straight - line rent. ESRT based on LTM revenue from Observatory a nd annualized rent for all other assets. SLG based on annualized contractual rent. PGRE based on annualized rent at share. VN O based on annualized NOI at share. 1.2 10.2 24.7 33.4 12.9 75.0 % 68.3 % 65.5 % 65.8 % 81.8 % 77.7 % 82.3 % 69.1 % 7.3% 67.6 % 7.3% 99.1 %

9 Well - Positioned Portfolio Compared to Peers 9 Sources: Company filings; U.S. Bureau of Labor Statistics as of December 31, 2021. Note: Company and peer metrics as of Decem ber 31, 2021 unless otherwise indicated. 1) Based on annualized straight - line rent as of December 31, 2021. NYC’s top 10 tenants were 52% actual Investment Grade rated and 20% implied Investment Grade rated tenants. Peer tenant percentages are only comprised of actual Investment Grade ratings. 2) For Company and Peers, based on annualized straight - line rent as of December 31, 2021. 3) In February 2022, the U.S. Bureau of Labor Statistics reported that Government and Financial Activities had the two lowest un emp loyment rates of 1.9% and 2.2% respectively, compared to total unemployment of 4.4%. Unemployment rates based on unemployed per sons by industry, not seasonally adjusted. Industry concentration for NYC based on SLR. ESRT, PGRE and VNO based on annualized rent. SLG based on contractual cash rent. VNO reflects New York City assets only as of December 31, 2021. Tenants Operating in Industries with Stable Employment (3) Share of Top 10 Tenants Investment Grade (1) Lease Expirations After 2030 (2) Highlights 72% Investment Grade rated (1) top 10 tenant base that is complemented by a balance of tenants with attractive industry exposures and long - term leases 37% 35% 33% 27% 24% PGRE NYC VNO SLG ESRT x NYC’s top ten tenants are 72% actual or implied Investment Grade rated and feature leases to large corporate tenants and government agencies x 35% of leases expire after 2030, limiting the impact of near - term lease expirations x Strong underlying tenant base with 42% of NYC’s tenants operating in industries with the lowest unemployment rates 13% 3% 2% 2% 29% 41% 37% 26% 17% 42% 41% 40% 28% 19% NYC PGRE SLG VNO ESRT Government Financial Activities 80% 72% 61% 55% 41% SLG NYC ESRT VNO PGRE

10 Conservative Capital Structure ▪ Conservative Capital Structure: NYC’s capital structure is composed of fixed rate, long - term mortgage debt with a weighted average debt maturity of five years x NYC features conservative Net Leverage and limited near - term debt maturities ▪ Higher Growth Leads to Higher Multiples: Public markets generally reward higher growth companies with higher multiples Conservative Balance Sheet Financing Flexibility New Investments Higher Multiples 10 NYC’s capital structure features conservative Net Leverage and limited near - term debt maturities Debt Maturities Through 2025 Net Leverage (3) Source: Company filings. Note: Company and peer metrics as of December 31, 2021. 1) For the Company, represents total mortgage notes payable, gross of $405.0 million minus cash and cash equivalents of $11.7 mi lli on (excluding restricted cash) divided by total assets of $823.1 million plus accumulated depreciation and amortization of $1 57. 9 million as of December 31, 2021. For peers, represents total debt, plus preferred equity, minus cash and cash equivalents divided by total ass ets plus accumulated depreciation and amortization, at cost, as of December 31, 2021. 39% 40% 48% 54% 62% PGRE NYC SLG ESRT VNO 14% 18% 32% 41% 52% NYC ESRT PGRE SLG VNO
11 11 Real Estate Portfolio Highlights
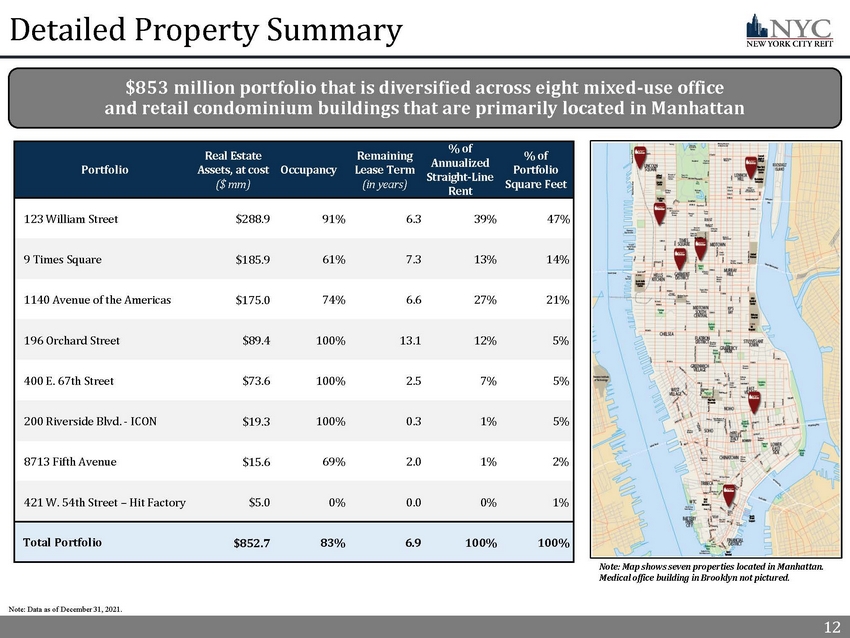
12 12 Detailed Property Summary Note: Data as of December 31, 2021. Portfolio Real Estate Assets, at cost ($ mm) Occupancy Remaining Lease Term (in years) % of Annualized Straight - Line Rent % of Portfolio Square Feet 123 William Street $288.9 91% 6.3 39% 47% _ 9 Times Square $185.9 61% 7.3 13% 14% _ 1140 Avenue of the Americas $175.0 74% 6.6 27% 21% _ 196 Orchard Street $89.4 100% 13.1 12% 5% _ 400 E. 67th Street $73.6 100% 2.5 7% 5% _ 200 Riverside Blvd. - ICON $19.3 100% 0.3 1% 5% _ 8713 Fifth Avenue $15.6 69% 2.0 1% 2% _ 421 W. 54th Street – Hit Factory $5.0 0% 0.0 0% 1% _ Total Portfolio $852.7 83% 6.9 100% 100% _ Note: Map shows seven properties located in Manhattan. Medical office building in Brooklyn not pictured. $853 million portfolio that is diversified across eight mixed - use office and retail condominium buildings that are primarily located in Manhattan
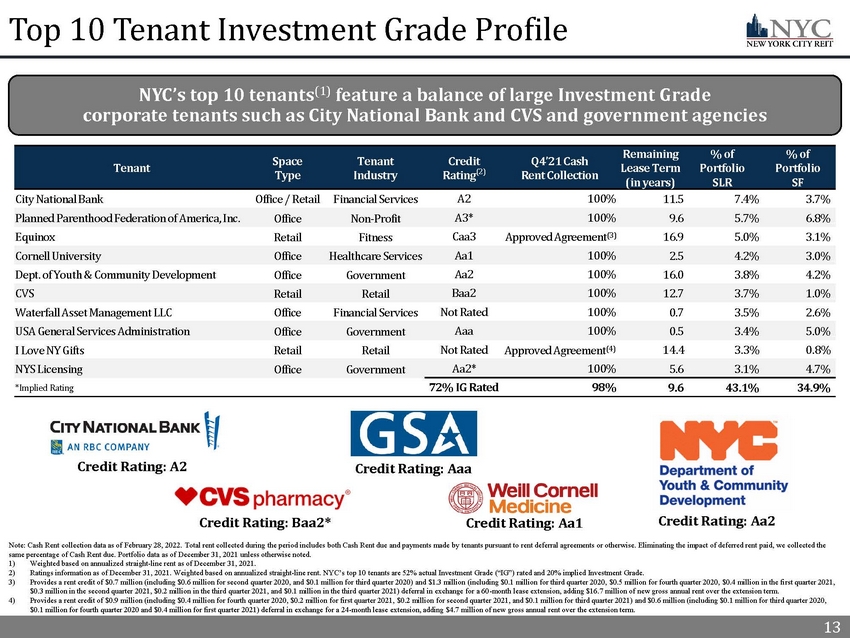
13 13 Note: Cash Rent collection data as of February 28, 2022. Total rent collected during the period includes both Cash Rent due a nd payments made by tenants pursuant to rent deferral agreements or otherwise. Eliminating the impact of deferred rent paid, we col lected the same percentage of Cash Rent due. Portfolio data as of December 31, 2021 unless otherwise noted. 1) Weighted based on annualized straight - line rent as of December 31, 2021. 2) Ratings information as of December 31, 2021. Weighted based on annualized straight - line rent. NYC’s top 10 tenants are 52% actua l Investment Grade (“IG”) rated and 20% implied Investment Grade. 3) Provides a rent credit of $0.7 million (including $0.6 million for second quarter 2020, and $0.1 million for third quarter 20 20) and $1.3 million (including $0.1 million for third quarter 2020, $0.5 million for fourth quarter 2020, $0.4 million in the fi rs t quarter 2021, $0.3 million in the second quarter 2021, $0.2 million in the third quarter 2021, and $0.1 million in the third quarter 2021) def erral in exchange for a 60 - month lease extension, adding $16.7 million of new gross annual rent over the extension term. 4) Provides a rent credit of $0.9 million (including $0.4 million for fourth quarter 2020, $0.2 million for first quarter 2021, $0. 2 million for second quarter 2021, and $0.1 million for third quarter 2021) and $0.6 million (including $0.1 million for thir d q uarter 2020, $0.1 million for fourth quarter 2020 and $0.4 million for first quarter 2021) deferral in exchange for a 24 - month lease extensio n, adding $4.7 million of new gross annual rent over the extension term. Top 10 Tenant Investment Grade Profile Tenant Space Type Tenant Industry Credit Rating (2) Q4’21 Cash Rent Collection Remaining Lease Term (in years) % of Portfolio SLR % of Portfolio SF City National Bank Office / Retail Financial Services A2 100% 11.5 7.4% 3.7% _ Planned Parenthood Federation of America, Inc. Office Non - Profit A3* 100% 9.6 5.7% 6.8% _ Equinox Retail Fitness Caa3 Approved Agreement (3) 16.9 5.0% 3.1% _ Cornell University Office Healthcare Services Aa1 100% 2.5 4.2% 3.0% _ Dept. of Youth & Community Development Office Government Aa2 100% 16.0 3.8% 4.2% _ CVS Retail Retail Baa2 100% 12.7 3.7% 1.0% _ Waterfall Asset Management LLC Office Financial Services Not Rated 100% 0.7 3.5% 2.6% _ USA General Services Administration Office Government Aaa 100% 0.5 3.4% 5.0% _ I Love NY Gifts Retail Retail Not Rated Approved Agreement (4) 14.4 3.3% 0.8% _ NYS Licensing Office Government Aa2* 100% 5.6 3.1% 4.7% _ *Implied Rating 72% IG Rated 98% 9.6 43.1% 34.9% _ Credit Rating: A2 Credit Rating: Aa1 Credit Rating: Baa2* Credit Rating: Aaa Credit Rating: Aa2 NYC’s top 10 tenants (1) feature a balance of large Investment Grade corporate tenants such as City National Bank and CVS and government agencies

14 14 33% 45% 58% 69% In 2021, NYC’s Advisor completed 17 new leases that totaled over 200,000 square feet and $7.4 million of straight - line rent (1) and four lease renewals with high - quality rent - paying tenants. NYC’s Advisor also developed a 14,300 square foot forward Leasing Pipeline (2) that is expected to increase Occupancy from 83% to 84% Proactive Asset Management New Lease Replacement (3) (Portfolio | Building) Building 123 William Street Credit Rating Aaa Bankrupt Square Feet 15,136 21% | 42% Annual SLR ($ in 000) $787.1 21% | 40% Remaining Lease Term (4) 5 Years N/A 14 Knotel Replacement Lease With Fortune 50 Company Proactive Replacement of Space Terminated by Knotel (3) 2021 Leasing Highlights x NYC swiftly and proactively navigated the New York City market by executing new and renewal leases with credit - worthy and rent - paying tenants on attractive terms ▪ NYC executed four lease renewals in 2021, including a five - year lease extension in Q4’21 with an Aa2 credit rated tenant that increased the straight - line rent from the tenant by $0.3 million ▪ NYC actively marketed turn - key space formerly occupied by Knotel, replacing 69% the former tenant’s space since January 2021 with credit - worthy rent - paying tenants x Management expects to benefit in 2022 from the leasing momentum NYC generated in 2021 as new leases commence and the New York City market continues to rebound as COVID - 19 mandates are rolled back Replacement and Expansion For Former Knotel Space 1) As of lease execution date. 2) Amounts included in 2022 estimated property - level revenue, expenses and income. Refer to slide 5 for additional information and slides 29 and 30 of the Appendix for additional information relating to the limitations on, and risks related to, the estimat ed NAV per share and important disclosure notes. 3) As of December 31, 2020, Knotel occupied 71 ,207 square feet, totaled $3.9 million of Annualized Straight - line Rent and had 7.8 years of Remaining Lease Term. 4) See Appendix for a full description of capitalized terms. Knotel Termination Replacement Leases 0 SF shown in 000’s Increase From Expansion Replacement (3) (Portfolio | Building) Building 123 William Street Credit Rating Not Rated Bankrupt Square Feet 4,635 6% | 12% Annual SLR ($ in 000) $210.0 5% | 11% Remaining Lease Term (4) 5 Years N/A
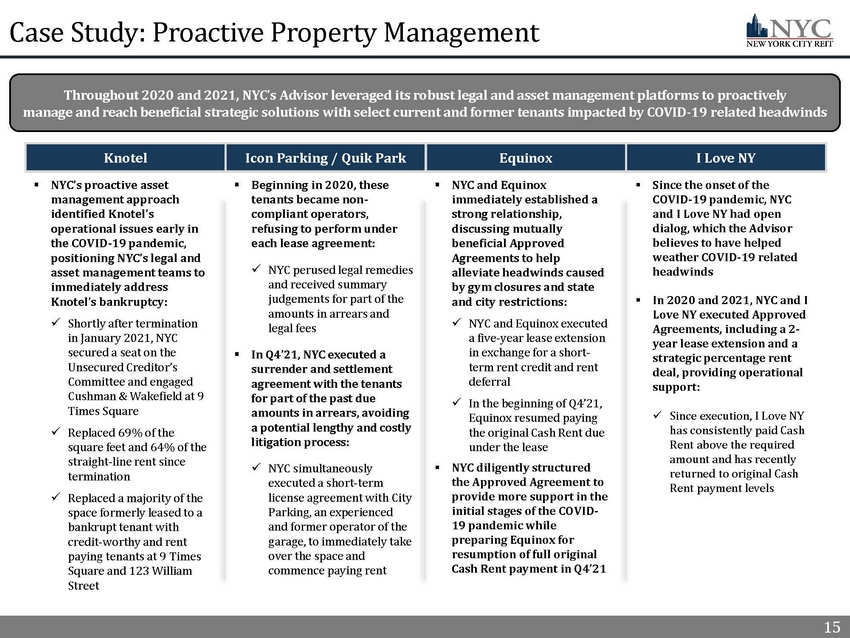
15 15 Case Study: Proactive Property Management 15 ▪ NYC’s proactive asset management approach identified Knotel’s operational issues early in the COVID - 19 pandemic, positioning NYC’s legal and asset management teams to immediately address Knotel’s bankruptcy: x Shortly after termination in January 2021, NYC secured a seat on the Unsecured Creditor’s Committee and engaged Cushman & Wakefield at 9 Times Square x Replaced 69% of the square feet and 64% of the straight - line rent since termination x Replaced a majority of the space formerly leased to a bankrupt tenant with credit - worthy and rent paying tenants at 9 Times Square and 123 William Street Throughout 2020 and 2021, NYC’s Advisor leveraged its robust legal and asset management platforms to proactively manage and reach beneficial strategic solutions with select current and former tenants impacted by COVID - 19 related headwinds Knotel Icon Parking / Quik Park Equinox I Love NY ▪ Beginning in 2020, these tenants became non - compliant operators, refusing to perform under each lease agreement: x NYC perused legal remedies and received summary judgements for part of the amounts in arrears and legal fees ▪ In Q4’21, NYC executed a surrender and settlement agreement with the tenants for part of the past due amounts in arrears, avoiding a potential lengthy and costly litigation process: x NYC simultaneously executed a short - term license agreement with City Parking, an experienced and former operator of the garage, to immediately take over the space and commence paying rent ▪ NYC and Equinox immediately established a strong relationship, discussing mutually beneficial Approved Agreements to help alleviate headwinds caused by gym closures and state and city restrictions: x NYC and Equinox executed a five - year lease extension in exchange for a short - term rent credit and rent deferral x In the beginning of Q4’21, Equinox resumed paying the original Cash Rent due under the lease ▪ NYC diligently structured the Approved Agreement to provide more support in the initial stages of the COVID - 19 pandemic while preparing Equinox for resumption of full original Cash Rent payment in Q4’21 ▪ Since the onset of the COVID - 19 pandemic, NYC and I Love NY had open dialog, which the Advisor believes to have helped weather COVID - 19 related headwinds ▪ In 2020 and 2021, NYC and I Love NY executed Approved Agreements, including a 2 - year lease extension and a strategic percentage rent deal, providing operational support: x Since execution, I Love NY has consistently paid Cash Rent above the required amount and has recently returned to original Cash Rent payment levels
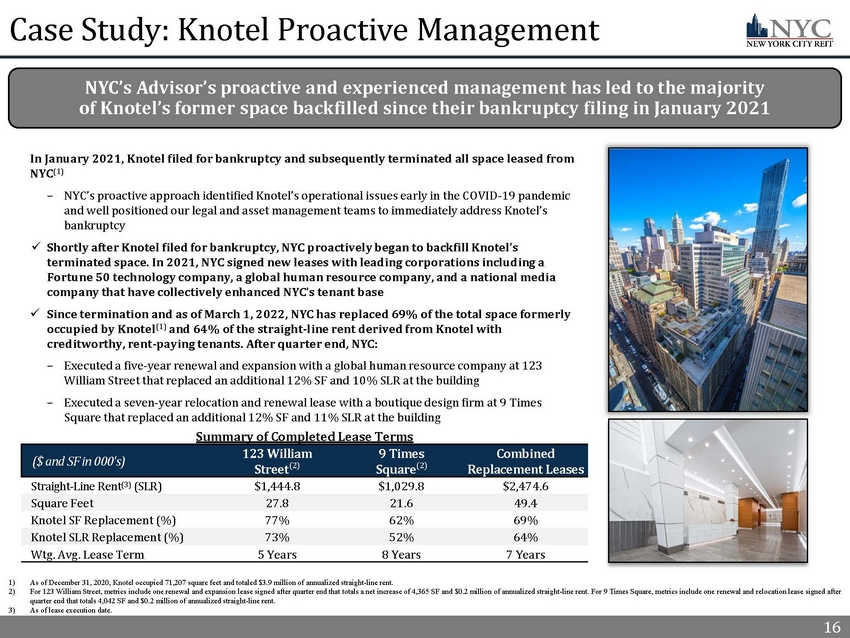
16 16 Case Study: Knotel Proactive Management In January 2021, Knotel filed for bankruptcy and subsequently terminated all space leased from NYC (1) – NYC’s proactive approach identified Knotel’s operational issues early in the COVID - 19 pandemic and well positioned our legal and asset management teams to immediately address Knotel’s bankruptcy x Shortly after Knotel filed for bankruptcy, NYC proactively began to backfill Knotel’s terminated space. In 2021, NYC signed new leases with leading corporations including a Fortune 50 technology company, a global human resource company, and a national media company that have collectively enhanced NYC’s tenant base x Since termination and as of March 1, 2022, NYC has replaced 69% of the total space formerly occupied by Knotel (1) and 64% of the straight - line rent derived from Knotel with creditworthy, rent - paying tenants. After quarter end, NYC: – Executed a five - year renewal and expansion with a global human resource company at 123 William Street that replaced an additional 12% SF and 10% SLR at the building – Executed a seven - year relocation and renewal lease with a boutique design firm at 9 Times Square that replaced an additional 12% SF and 11% SLR at the building Summary of Completed Lease Terms ($ and SF in 000's) 123 William Street (2) 9 Times Square (2) Combined Replacement Leases Straight - Line Rent (3) (SLR) $1,444.8 $1,029.8 $2,474.6 Square Feet 27.8 21.6 49.4 Knotel SF Replacement (%) 77% 62% 69% Knotel SLR Replacement (%) 73% 52% 64% Wtg. Avg. Lease Term 5 Years 8 Years 7 Years NYC’s Advisor’s proactive and experienced management has led to the majority of Knotel’s former space backfilled since their bankruptcy filing in January 2021 1) As of December 31, 2020, Knotel occupied 71,207 square feet and totaled $3.9 million of annualized straight - line rent. 2) For 123 William Street, metrics include one renewal and expansion lease signed after quarter end that totals a net increase o f 4 ,365 SF and $0.2 million of annualized straight - line rent. For 9 Times Square, metrics include one renewal and relocation lease signed after quarter end that totals 4,042 SF and $0.2 million of annualized straight - line rent. 3) As of lease execution date.
17 Financial Highlights
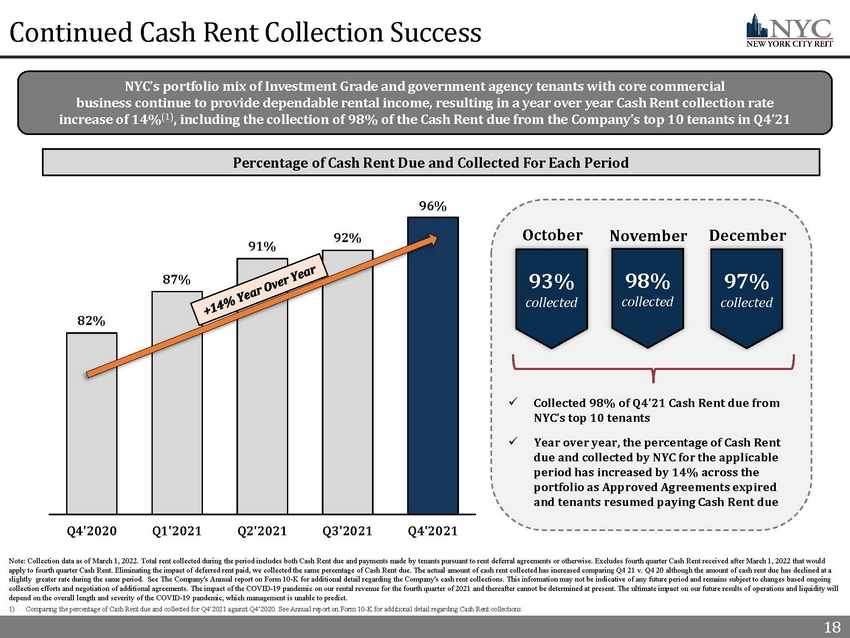
18 Continued Cash Rent Collection Success 18 Percentage of Cash Rent Due and Collected For Each Period Note: Collection data as of March 1, 2022. Total rent collected during the period includes both Cash Rent due and payments ma de by tenants pursuant to rent deferral agreements or otherwise. Excludes fourth quarter Cash Rent received after March 1, 2022 tha t would apply to fourth quarter Cash Rent. Eliminating the impact of deferred rent paid, we collected the same percentage of Cash Ren t d ue. The actual amount of cash rent collected has increased comparing Q4 21 v. Q4 20 although the amount of cash rent due has dec lined at a slightly greater rate during the same period. See The Company's Annual report on Form 10 - K for additional detail regarding the Company's cash rent collections. This information may not be indicative of any future period and remains subject to changes b as ed ongoing collection efforts and negotiation of additional agreements. The impact of the COVID - 19 pandemic on our rental revenue for the f ourth quarter of 2021 and thereafter cannot be determined at present. The ultimate impact on our future results of operations an d liquidity will depend on the overall length and severity of the COVID - 19 pandemic, which management is unable to predict. 1) Comparing the percentage of Cash Rent due and collected for Q4’2021 against Q4’2020. See Annual report on Form 10 - K for addition al detail regarding Cash Rent collections. 96% 92% 91% 87% 82% Q4'2021 Q3'2021 Q2'2021 Q1'2021 Q4'2020 93% collected 98% collected 97% collected October November December x Collected 98 % of Q4’21 Cash Rent due from NYC’s top 10 tenants x Year over year, the percentage of Cash Rent due and collected by NYC for the applicable period has increased by 14% across the portfolio as Approved Agreements expired and tenants resumed paying Cash Rent due NYC’s portfolio mix of Investment Grade and government agency tenants with core commercial business continue to provide dependable rental income, resulting in a y ear over year Cash Rent collection rate increase of 14% (1) , including the collection of 98% of the Cash Rent due from the Company’s top 10 tenants in Q4’21

19 Percentage Rent Approved Agreements Overview x In 2021, NYC executed two percentage rent deals with two key retail tenants. Since execution, both tenant’s operations have performed exceptionally well and as a result, have returned to near or complete original Cash Rent collection levels sooner t han expected x The percentage rent deals provided NYC with the opportunity to capture more of the Cash Rent due as New York City and pedestrian traffic in Times Square rebounded as compared to executing a flat deferral or abatement agreement 19 56% 92% 0% 20% 40% 60% 80% 100% Q2'21 Q3'21 Q4'21 I Love NY Original Cash Rent Due Minimum Cash Rent Due Actual Cash Rent Paid (% Rent) Deals in Action 39% 100% 0% 20% 40% 60% 80% 100% Q2'21 Q3'21 Q4'21 S&J Pizza Group Original Cash Rent Due Minimum Cash Rent Due Actual Cash Rent Paid (% Rent) Key Terms □ Term: Nine months □ Minimum Rent Due: Q2’21: 38%, Q3’21: 45%, Q4’21: 56% x Tenant is near original Cash Rent due levels Key Terms □ Term: Five months □ Minimum Rent Due: May – June: 33%, Q3’21: 39% x Tenant has resumed paying original Cash Rent due Note: Collection data as of March 1, 2022. Total rent collected during the period includes both original Cash Rent due and pa yme nts made by tenants pursuant to rent deferral agreements or otherwise. In 2021, NYC executed two percentage rent deals that provided operational support to key retail tenants, supporting a sooner than expected return to original Cash Rent payment levels Case Study: Strong Performance by Percentage Rent Tenants
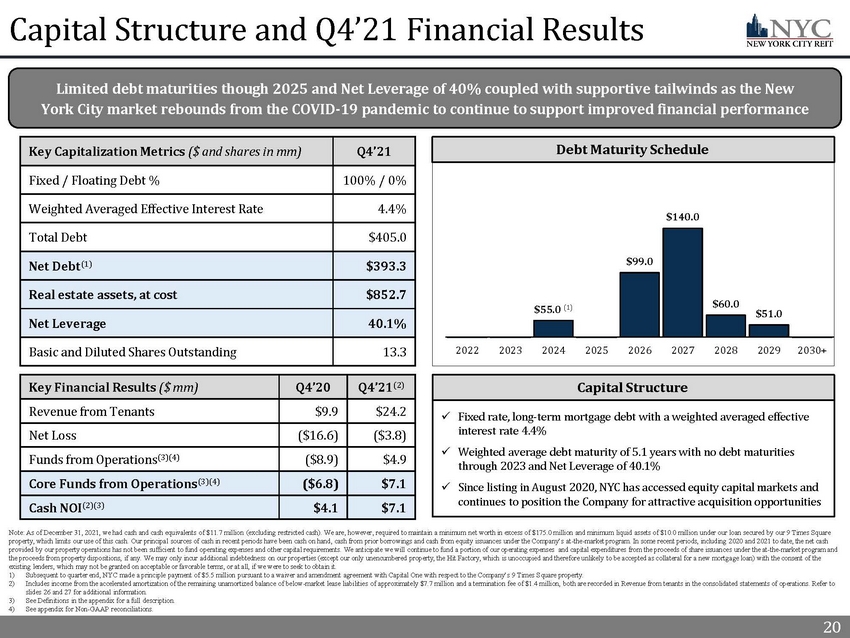
20 20 Capital Structure and Q4’21 Financial Results Note: As of December 31, 2021, we had cash and cash equivalents of $11.7 million (excluding restricted cash). We are, however , r equired to maintain a minimum net worth in excess of $175.0 million and minimum liquid assets of $10.0 million under our loan se cured by our 9 Times Square property, which limits our use of this cash. Our principal sources of cash in recent periods have been cash on hand, cash fro m p rior borrowings and cash from equity issuances under the Company’s at - the - market program. In some recent periods, including 2020 and 2021 to date, the net cash provided by our property operations has not been sufficient to fund operating expenses and other capital requirements. We ant ici pate we will continue to fund a portion of our operating expenses and capital expenditures from the proceeds of share issuan ces under the at - the - market program and the proceeds from property dispositions, if any. We may only incur additional indebtedness on our properties (except our only un encumbered property, the Hit Factory, which is unoccupied and therefore unlikely to be accepted as collateral for a new mortg age loan) with the consent of the existing lenders, which may not be granted on acceptable or favorable terms, or at all, if we were to seek to obtain it. 1) Subsequent to quarter end, NYC made a principle payment of $5.5 million pursuant to a waiver and amendment agreement with Cap ita l One with respect to the Company’s 9 Times Square property. 2) Includes income from the accelerated amortization of the remaining unamortized balance of below - market lease liabilities of appr oximately $7.7 million and a termination fee of $1.4 million, both are recorded in Revenue from tenants in the consolidated s tat ements of operations. Refer to slides 26 and 27 for additional information. 3) See Definitions in the appendix for a full description. 4) See appendix for Non - GAAP reconciliations. Limited debt maturities though 2025 and Net Leverage of 40% coupled with supportive tailwinds as the New York City market rebounds from the COVID - 19 pandemic to continue to support improved financial performance Capital Structure x Fixed rate, long - term mortgage debt with a weighted averaged effective interest rate 4.4% x Weighted average debt maturity of 5.1 years with no debt maturities through 2023 and Net Leverage of 40.1% x Since listing in August 2020, NYC has accessed equity capital markets and continues to position the Company for attractive acquisition opportunities Key Financial Results ($ mm) Q4’20 Q4’21 (2) Revenue from Tenants $9.9 $24.2 Net Loss ($16.6) ($3.8) Funds from Operations (3)(4) ($8.9) $4.9 Core Funds from Operations (3)(4) ($6.8) $7.1 Cash NOI (2)(3) $4.1 $7.1 Key Capitalization Metrics ($ and shares in mm) Q4’21 Fixed / Floating Debt % 100% / 0% Weighted Averaged Effective Interest Rate 4.4% Total Debt $405.0 Net Debt (1) $393.3 Real estate assets, at cost $852.7 Net Leverage 40.1% Basic and Diluted Shares Outstanding 13.3 Debt Maturity Schedule $55.0 (1) $99.0 $140.0 $60.0 $51.0 $40.0 $60.0 $80.0 $100.0 $120.0 $140.0 $160.0 $180.0 2022 2023 2024 2025 2026 2027 2028 2029 2030+

21 21 Management and Board of Directors
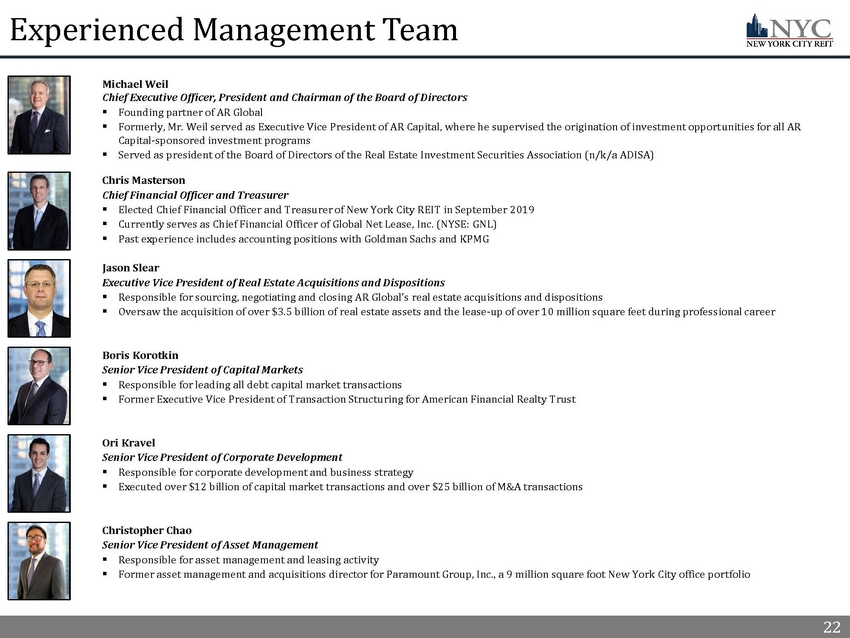
22 22 Experienced Management Team Michael Weil Chief Executive Officer, President and Chairman of the Board of Directors ▪ Founding partner of AR Global ▪ Formerly, Mr. Weil served as Executive Vice President of AR Capital, where he supervised the origination of investment opport uni ties for all AR Capital - sponsored investment programs ▪ Served as president of the Board of Directors of the Real Estate Investment Securities Association (n/k/a ADISA) Chris Masterson Chief Financial Officer and Treasurer ▪ Elected Chief Financial Officer and Treasurer of New York City REIT in September 2019 ▪ Currently serves as Chief Financial Officer of Global Net Lease, Inc. (NYSE: GNL) ▪ Past experience includes accounting positions with Goldman Sachs and KPMG Jason Slear Executive Vice President of Real Estate Acquisitions and Dispositions ▪ Responsible for sourcing, negotiating and closing AR Global’s real estate acquisitions and dispositions ▪ Oversaw the acquisition of over $3.5 billion of real estate assets and the lease - up of over 10 million square feet during profes sional career Boris Korotkin Senior Vice President of Capital Markets ▪ Responsible for leading all debt capital market transactions ▪ Former Executive Vice President of Transaction Structuring for American Financial Realty Trust Ori Kravel Senior Vice President of Corporate Development ▪ Responsible for corporate development and business strategy ▪ Executed over $12 billion of capital market transactions and over $25 billion of M&A transactions Christopher Chao Senior Vice President of Asset Management ▪ Responsible for asset management and leasing activity ▪ Former asset management and acquisitions director for Paramount Group, Inc., a 9 million square foot New York City office por tfo lio
23 23 Board of Directors Michael Weil | Director and Executive Chairman ▪ Founding partner of AR Global ▪ Formerly, Mr. Weil served as Executive Vice President of AR Capital, where he supervised the origination of investment opportunities for all AR Capital - sponsored investment programs ▪ Prior to the establishment of AR Capital, Mr. Weil served as Senior Vice President of Sales and Leasing for American Financial Realty Trust (AFRT), where he was responsible for the disposition and leasing activity for an approximately 30 million square foot portfolio ▪ Served as president of the Board of Directors of the Real Estate Investment Securities Association (n/k/a ADISA) Lee Elman | Independent Director and Audit Committee Chairman ▪ Independent director of the Company since February 2016 ▪ Founder & President of Elman Investors Inc., an international real - estate investment bank ▪ 40+ years of real estate investment experience in the US and abroad ▪ Mr. Elman holds a J.D. from Yale Law School and a B.A. from Princeton University’s Woodrow Wilson School of Public and International Affairs Abby Wenzel | Independent Director ▪ Ms. Wenzel was a member of the law firm of Cozen O’Conner, resident in the New York Office from April 2009 until her retirement in June 2019. Ms. Wenzel practiced in in the Real Estate Group and capital markets practice area, focusing on capital markets, finance and sale leaseback transactions ▪ Prior to joining Cozen O’Connor, Ms. Wenzel was a partner with Wolf Block, LLP, managing partner of its New York office and chair of its structured finance practice from October 1999 until April 2009 Elizabeth Tuppeny | Lead Independent Director ▪ Chief Executive Officer and founder of Domus, Inc., since 1993 ▪ 30 years of experience in the branding and advertising industries, with a focus on Fortune 50 companies ▪ Ms. Tuppeny also founded EKT Development, LLC to pursue entertainment projects in publishing, feature film and education video games Strong Corporate Governance x Majority independent Board of Directors, with additional oversight provided by committees comprised solely of independent directors x PricewaterhouseCoopers LLP currently acts as the independent auditor for NYC x NYC is supported by robust financial accounting and reporting teams, and maintains financial reporting processes, controls and procedures x Management and shareholders fully aligned to compensate based on operational outperformance x NYC’s independent board members and the Advisor and its affiliates have each separately demonstrated its depth of commitment to NYC’s long - term value by increasing ownership in NYC. As of March 1 st 2022, NYC’s independent board members owned over 57,000 shares of NYC and separately, NYC’s Advisor and its affiliates owned over 1,000,000 shares of NYC

24 24 Appendix
25 25 Definitions Adjusted EBITDA : We believe that Adjusted EBITDA, which is defined as earnings before interest, taxes, depreciation and amortization adjusted for acquisition and transaction - related expenses, listing - related costs and expenses, other non - cash items such as the vesting and conversion of the Class B Units, equity - based compensation expense and including our pro - rata share from unconsolidated joint ventures, is an appropriate measure of our ability to incur and service debt . Adjusted EBITDA should not be considered as an alternative to cash flows from operating activities, as a measure of our liquidity or as an alternative to net income as an indicator of our operating activities . Other REITs may calculate Adjusted EBITDA differently and our calculation should not be compared to that of other REITs . Annualized Straight - Line Rent : Straight - line rent which is annualized and calculated using most recent available lease terms as of the period end indicated . Approved Agreement : Represents Deferral Agreements as well as amendments granting the tenant a rent credit for some portion of original Cash Rent due . The rent credit is generally coupled with an extension of the lease . The terms of the lease amendments providing for rent credits differ by tenant in terms of the length and amount of the credit . A “Deferral Agreement” is an executed or approved amendment to an existing lease agreement to defer a certain portion of Cash Rent due . Cash NOI : We define Cash NOI as NOI excluding amortization of above/below market lease intangibles and straight - line adjustments that are included in GAAP lease revenues . Cash Rent : Represents total of all contractual rents on a cash basis due from tenants as stipulated in the originally executed lease agreements for the applicable period taking into account any deferrals or lease amendments . “Original Cash Rent” refers to contractual rents on a cash basis due from tenants as stipulated in their originally executed lease agreement based on leases in place for the applicable period, prior to any rent deferral agreement . We calculate “Original Cash Rent collections” by comparing the total amount of rent collected during the period to the original Cash Rent due for the applicable period . Total rent collected during the period includes both original Cash Rent due and payments made by tenants pursuant to rent deferral agreements . Core FFO : In calculating Core FFO, we start with FFO, then we exclude the impact of discrete non - operating transactions and other events which we do not consider representative of the comparable operating results of our real estate operating portfolio, which is our core business platform . Specific examples of discrete non - operating items include acquisition and transaction related costs for dead deals, debt extinguishment costs, listing related costs and expenses (including the vesting and conversion of Class B units and cash expenses and fees which are non - recurring in nature incurred in connection with the listing of Class A common stock on the NYSE and related transactions), and non - cash equity - based compensation . We add back non - cash write - offs of deferred financing costs and prepayment penalties incurred with the early extinguishment of debt which are included in net income but are considered financing cash flows when paid in the statement of cash flows . We consider these write - offs and prepayment penalties to be capital transactions and not indicative of operations . By excluding expensed acquisition and transaction dead deal costs as well as non - operating costs, we believe Core FFO provides useful supplemental information that is comparable for each type of real estate investment and is consistent with management’s analysis of the investing and operating performance of our properties . In future periods, we may also exclude other items from Core FFO that we believe may help investors compare our results . EBITDA : Defined as earnings before interest, taxes, depreciation and amortization (“EBITDA”) . We believe that EBITDA is an appropriate measure of our ability to incur and service debt . EBITDA should not be considered as an alternative to cash flows from operating activities, as a measure of our liquidity or as an alternative to net income as an indicator of our operating activities . FFO : We define FFO, a non - GAAP measure, consistent with the standards established over time by the Board of Governors of NAREIT, as restated in a White Paper approved by the Board of Governors of NAREIT effective in December 2018 (the “White Paper”) . The White Paper defines FFO as net income or loss computed in accordance with GAAP, excluding depreciation and amortization related to real estate, gains and losses from the sale of certain real estate assets, gains and losses from change in control and impairment write - downs of certain real estate assets and investments in entities when the impairment is directly attributable to decreases in the value of depreciable real estate held by the entity . Adjustments for unconsolidated partnerships and joint ventures are calculated to reflect FFO . Our FFO calculation complies with NAREIT’s definition . Investment Grade : As used herein, investment grade includes both actual investment grade ratings of the tenant or guarantor, if available, or implied investment grade . Implied investment grade may include actual ratings of tenant parent, guarantor parent (regardless of whether or not the parent has guaranteed the tenant’s obligation under the lease) or by using a proprietary Moody’s analytical tool, which generates an implied rating by measuring a company’s probability of default . Ratings information is as of December 31 , 2021 . Top 10 tenants are 52 % actual investment grade rated and 20 % implied investment grade rated . Leasing Pipeline : Includes ( i ) all leases fully executed by both parties as of March 1 , 2022 , but after December 31 , 2021 , and (ii) all leases under negotiation with an executed LOI by both parties as of March 1 , 2022 . This represents two executed lease that commences totaling 8 , 900 square feet and two renewal and expansion leases that total 5 , 400 square feet . Leasing pipeline should not be considered an indication of future performance . Net Debt : Total debt of $ 405 . 0 million less cash and cash equivalents of $ 11 . 7 million (excluding restricted cash) as of December 31 , 2021 . Net Leverage : For the Company and for December 31 , 2021 , represents total mortgage notes payable, gross of $ 405 . 0 million minus cash and cash equivalents of $ 11 . 7 million (excluding restricted cash) divided by total assets of $ 823 . 1 million plus accumulated depreciation and amortization of $ 157 . 9 million as of December 31 , 2021 . For peers, represents total debt, plus preferred equity, minus cash and cash equivalents divided by total assets plus accumulated depreciation and amortization, at cost, as of December 31 , 2021 . NOI : Defined as a non - GAAP financial measure used by us to evaluate the operating performance of our real estate . NOI is equal to total revenues, excluding contingent purchase price consideration, less property operating and maintenance expense . NOI excludes all other items of expense and income included in the financial statements in calculating net (loss) . Occupancy : Represents percentage of square footage of which the tenant has taken possession of divided by the respective total rentable square feet as of the date or period end indicated . Remaining Lease Term : Represents the outstanding tenant lease term . Weighted based on Annualized Straight - Line rent as of the date or period end indicated . Total Return : Calculated by taking the ending share price on March 1 , 2022 less the beginning share price on January 1 , 2021 plus dividends paid divided by the beginning share price on January 1 , 2021 and shown as a percentage .
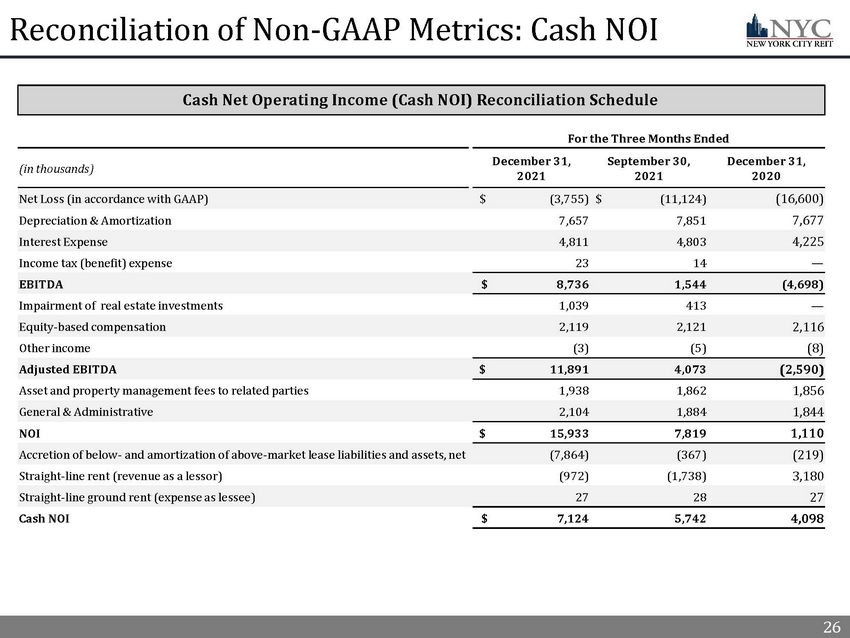
26 26 Reconciliation of Non - GAAP Metrics: Cash NOI For the Three Months Ended (in thousands) December 31, 2021 September 30, 2021 December 31, 2020 Net Loss (in accordance with GAAP) $ (3,755) $ (11,124) (16,600) Depreciation & Amortization 7,657 7,851 7,677 Interest Expense 4,811 4,803 4,225 Income tax (benefit) expense 23 14 — EBITDA $ 8,736 1,544 (4,698) Impairment of real estate investments 1,039 413 — Equity - based compensation 2,119 2,121 2,116 Other income (3) (5) (8) Adjusted EBITDA $ 11,891 4,073 (2,590) Asset and property management fees to related parties 1,938 1,862 1,856 General & Administrative 2,104 1,884 1,844 NOI $ 15,933 7,819 1,110 Accretion of below - and amortization of above - market lease liabilities and assets, net (7,864) (367) (219) Straight - line rent (revenue as a lessor) (972) (1,738) 3,180 Straight - line ground rent (expense as lessee) 27 28 27 Cash NOI $ 7,124 5,742 4,098 Cash Net Operating Income (Cash NOI) Reconciliation Schedule
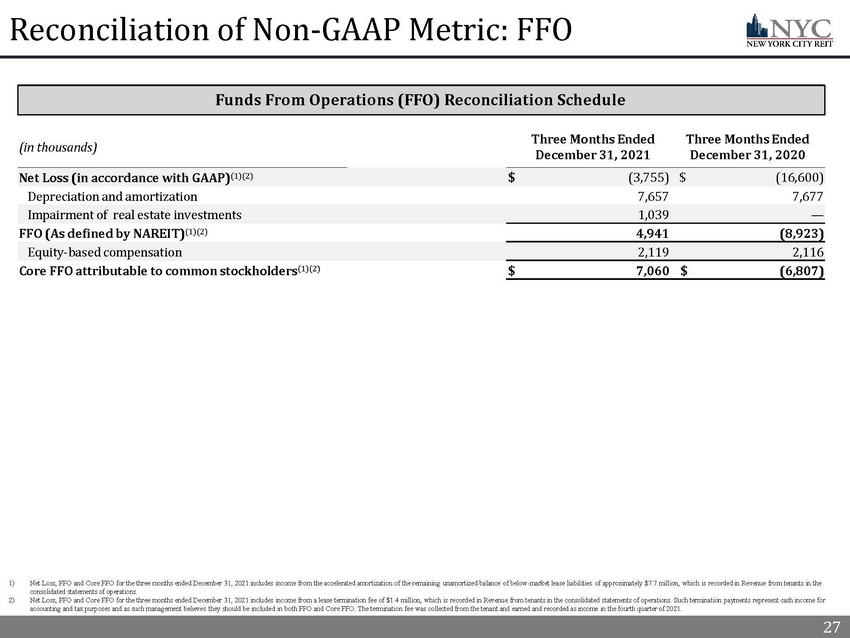
27 27 Reconciliation of Non - GAAP Metric: FFO (in thousands) Three Months Ended December 31, 2021 Three Months Ended December 31, 2020 Net Loss (in accordance with GAAP) (1)(2) $ (3,755) $ (16,600) Depreciation and amortization 7,657 7,677 Impairment of real estate investments 1,039 — FFO (As defined by NAREIT) (1)(2) 4,941 (8,923) Equity - based compensation 2,119 2,116 Core FFO attributable to common stockholders (1)(2) $ 7,060 $ (6,807) Funds From Operations (FFO) Reconciliation Schedule 1) Net Loss, FFO and Core FFO for the three months ended December 31, 2021 includes income from the accelerated amortization of the remaining unamortized balance of below - market lease liabilities of approximately $7.7 million, which is recorded in Revenue fro m tenants in the consolidated statements of operations. 2) Net Loss, FFO and Core FFO for the three months ended December 31, 2021 includes income from a lease termination fee of $1.4 mil lion, which is recorded in Revenue from tenants in the consolidated statements of operations. Such termination payments represent cash income for accounting and tax purposes and as such management believes they should be included in both FFO and Core FFO. The termination fe e was collected from the tenant and earned and recorded as income in the fourth quarter of 2021.
28 28 Legal Notices
29 29 Important Additional Information and Where to Find It References in this presentation to the “Company,” “we,” “us” and “our” refer to New York City REIT, Inc. (“NYC”) and its cons oli dated subsidiaries. This presentation contains estimates and information concerning the Company’s industry and the Company’s peer companies that are based on industry publications, reports and peer company public filings. The Company has not independently verified the accuracy of the data co nta ined in these industry publications, reports and peer company public filings. These estimates and information involve a number of assumptions and li mit ations, and you are cautioned not to rely on or give undue weight to this information. The industry in which we operate is subject to a high deg ree of uncertainty and risk due to variety of factors, including those described in the “Risk Factors” and “Management's Discussion and Analysis of Financial Co ndi tion and Results of Operations” sections of the Company’s Annual Report on Form 10 - K filed with the SEC on March 29, 2021 and all other filings file d with the SEC after that date. These and other factors could cause results to differ materially from those expressed in these publications and reports . The majority of the concessions granted to our tenants as a result of the COVID - 19 pandemic are rent deferrals or temporary rent abatements with the original lease term unchanged and collection of deferred rent deemed probable. As a result of relief granted by the FASB and the SEC related to lease modification accounting, rental revenue used to calculate Net Income, NAREIT FFO, Core FFO, EBITDA, and Adjusted EBITDA has n ot been, and we do not expect it to be, significantly impacted by these types of deferrals. NYC intends to file a proxy statement on Schedule 14A, an accompanying proxy card and other relevant documents with the SEC i n c onnection with such solicitation of proxies from NYC stockholders for NYC's 2022 annual meeting of stockholders. NYC STOCKHOLDERS ARE STRONGLY ENCOURAGED TO READ NYC'S DEFINITIVE PROXY STATEMENT (INCLUDING ANY AMENDMENTS OR SUPPLEMENTS THERETO) AND ALL OTHER DOCUMENTS FILED WITH THE SEC CAREFULLY AND IN THEIR ENTIRETY WHEN THEY BECOME AVAILABLE BECAUSE THEY WILL CONTAIN IMPORTANT INFORMATION. Investors and stockholders may obtain a copy of the definitive proxy statement, an accompanying proxy card, any amendments or su pplements to the definitive proxy statement and other documents filed by NYC with the SEC at no charge at the SEC's website at www.sec.gov. Co pie s will also be available at no charge in the “SEC Filings” subsection of the “Financial Information” section of NYC's Investor Relations website at inves tor s.newyorkcityreit.com or by contacting NYC's Investor Relations department at info@ar - global.com, as soon as reasonably practicable after such materials are electronically filed with, or furnished to, the SEC. Participants in the Solicitation NYC, its directors, and certain of its executive officers may be deemed to be participants in the solicitation of proxies fro m N YC stockholders in connection with matters to be considered at NYC's 2022 annual meeting of stockholders. Information regarding the direct and indirect int ere sts, by security holdings or otherwise, of NYC's directors and executive officers, in NYC will be included in NYC’s Proxy Statement on Schedule 14A for it s 2 022 annual meeting of stockholders, and is included in NYC’s Proxy Statement on Schedule 14A for its 2021 annual meeting of stockholders, filed wit h t he SEC on March 30, 2021, NYC’s Annual Report on Form 10 - K filed with the SEC on March 29, 2021, and all other filings filed with the SEC after that date. Changes to the direct or indirect interests of NYC's directors and executive officers are set forth in SEC filings on Initial Statements of Beneficial Ow nership on Form 3, Statements of Change in Ownership on Form 4 and Annual Statements of Changes in Beneficial Ownership on Form 5. These documents are availab le free of charge as described above. Updated information regarding the identities of potential participants and their direct or indirect interest s, by security holdings or otherwise, in NYC will be set forth in the Proxy Statement for NYC's 2022 annual meeting of stockholders and other relevant d ocu ments to be filed with the SEC, if and when they become available. 29
30 30 Limitations on, and risks related to, the Estimated NAV per Share The Company’s estimated net asset value per share (“NAV”) as of December 31, 2021 contained herein was calculated by applying tw o different capitalization rates to property - level income projected for 2022 by the advisor to arrive at the estimated market value of the Company’s portfolio, and then deducting from this amou nt the fair value of the Company’s mortgage notes payable as of December 31, 2021 as set forth in the notes to the Company’s financial statements as of December 31 , 2021, and adding the book value of cash and cash equivalents and other assets, net of other liabilities, as set forth in the Company’s financial statements as of December 31, 2021. The estimated NAV per share was calc ula ted by dividing the estimated NAV by the number of shares of the Company’s Class A common stock on a fully - diluted basis outstanding as of December 31, 2021. The estimated NAV per share was calculated as of a specific time, will likely change, and does not represent the amount a sto ckh older would receive from a third party now or in the future for his or her shares of the Company’s Class A common stock. There is no assurance that the trading price of the Company’s Class A commo n s tock will not continue to trade at a significant discount to, equal or exceed this estimate. The estimated NAV per share does not represent the book value of the Company’s real estate, which is ge ner ally based on the amortized cost of the property, subject to certain adjustments, or the Company’s enterprise value. The estimated NAV per share is not a representation or guarantee that the Com pan y’s shares of Class A common stock will or should trade at this amount, and investors should not rely on the estimated NAV per share in making a decision to buy or sell shares of the Compan y’s Class A common stock. The measures employed by the Company’s advisor to project property - level income and calculate this estimate of NAV per share may not be comparable to measures used by other companies and were based upon a number of estimates, assumptions, judgments and opinions made by the Company’s advisor that may not be accu rat e or complete, including estimates and assumptions such as capitalization rates and estimations of new or extended leases, future rent and expenses. The advisor’s estimation of propert y - l evel income does not include any acquisitions or dispositions in calendar year 2022 except for the sale of the Hit Factory. Acquisitions or dispositions would impact actual property - level incom e and the estimated NAV per share depending on how the Company funded the acquisitions which could include the net proceeds from issuance of additional shares of Class A common stock. The Hit Factory property, as previously disclosed, is not generating income. The estimated market value of the Company’s real estate assets is based solely on the advisor’s estimation of property - level inc ome for 2022, applying capitalization rates selected by the advisor based on its opinion and knowledge of the New York City real estate marke t , without any independent third - party review or third - party appraisals of assets and does not necessarily represent the value th e Company would receive or accept if the Company’s real estate assets were marketed for sale or a third - party appraisal of the Com pany’s real estate assets or the price the Company's board may accept if a third party made an offer for the shares of the Class A common stock. The estimated value also does not take into consid era tion transaction costs or other items such as tax adjustments that may impact the value a buyer might ascribe to the Company’s real estate assets. Estimation of Property - Level Income In connection with estimating NAV, the Company’s advisor prepared an unaudited estimation of the Company’s property - level income for all of calendar year 2022. This information is subjective in many respects and is not necessarily predicative of actual future results and should not be relied upon as such. The internal pr ospective financial information used by the Company’s advisor to prepare the property - level income estimation for 2022 was based on numerous variables and assumptions that were deemed to be rea sonable as of date when the estimation was finalized. These assumptions are inherently uncertain and may be beyond the Company’s control. Important factors that may affect actual result s a nd cause the Company to fail to meet the estimation include, but are not limited to, risks and uncertainties relating to the Company’s business (including that tenant pay the cash rent required in their respective leases and the Company does not incur significant additional expenses that are not anticipated), the potential adverse effects of the ongoing global COVID - 19 pandemic, including actions taken to contain or treat COVID - 19, on the Company’s tenants and the global economy and financial market, industry performance, including volatility in the financial markets resulting fr om the ongoing war in Ukraine, the legal and regulatory environment, general business and economic conditions and other factors described or referenced under the section entitled “Forward - Looking S tatements” contained in the Appendix to this presentation, including those presented in the section titled “Item 1A. Risk Factors” in the Company’s Annual Report on Form 10 - K filed with t he SEC on March 29, 2021 and all other filings filed with the SEC after that date. There can be no assurance that the estimation will be realized or that actual results will not be significantly hi ghe r or lower than forecasted. In addition, the estimation was not prepared with a view toward complying with U.S. generally accepted accounting principles, th e published guidelines of the SEC regarding estimations and the use of non - GAAP measures or the guidelines established by the American Institute of Certified Public Accountants for preparation and pr esentation of prospective financial information. Neither the Company’s independent registered public accounting firm, nor any other independent accountants, have compiled, examined or pe rfo rmed any procedures with respect to the estimation contained in this presentation, nor have they expressed any opinion or any other form of assurance on the information or the potential for th e Company achieving the estimation. The estimation of property - level income is a non - GAAP financial measure and should not be considered in isolation from, or as a substitute for, financial informa tion presented in compliance with GAAP. The estimated property - level income for 2022 has not been reconciled the estimated net income (loss) for 2022, the most directly comparable GAAP financial me asure, the advisor believes that property - level income cannot be reconciled to the most comparable GAAP number because the advisor is making assumptions on future leasing activity and it is una ble to reconcile to current Annualized Straight - line Rent without unreasonable expense. 30
31 31 Forward Looking Statements Certain statements made in this presentation are “forward - looking statements” (as defined in Section 21E of the Exchange Act), w hich reflect the expectations of the Company regarding future events. You can identify forward - looking statements by the use of forward looking terminology such as “believes,” “expects,” “m ay,” “will,” “would,” “could,” “should,” “seeks,” “intends,” “plans,” “projects,” “estimates,” “anticipates,” “predicts,” or “potential” or the negative of these words and phrases or similar word s o r phrases. The forward - looking statements involve a number of risks, uncertainties and other factors that could cause actual results to differ materially from those contained in the forward - looking statements. These forward - looking statements include, but are not limited to, market and other expectations, objectives, and intentions, as well as any other statements that are not historica l f acts. Our potential risks and uncertainties are presented in the section titled “Item 1A. Risk Factors” in the Company’s Annual Rep ort on Form 10 - K filed with the SEC on March 29, 2021 as well as other subsequent reports filed with the SEC. Forward - looking statements speak as of the date they were made and we disclaim any obliga tion to update and revise statements contained in these materials to reflect changed assumptions, the occurrence of unanticipated events or changes to future operating results over tim e, unless required by law. The following are some of the risks and uncertainties relating to us, although not all risks and uncertainties, that could cause our actual results to differ materia lly from those presented in our forward - looking statements: • Our properties may be adversely affected by economic cycles and risks inherent to New York City. • Our ability to fund our capital requirements will depend on, among other things, the amount of cash we are able to generate f rom our operations, which is dependent on, among other things, the impact of the COVID - 19 pandemic on our tenants and other factors outside of our control, and our ability to access capital f rom outside sources, which may not be available on acceptable or favorable terms, or at all. • If we are not able to generate sufficient cash flows from operations, we may continue to fund dividends from sources other th an cash flow from operations and may have to reduce the amount of dividends we pay or identify other financing sources. • Funding dividends from other sources such as borrowings, asset sales or equity issuances limits the amount we can use for pro per ty acquisitions, investments and other corporate purposes. • We are subject to risks associated with a pandemic, epidemic or outbreak of a contagious disease, such as the ongoing global COV ID - 19 pandemic, including negative impacts on our tenants and their respective businesses. • Inflation and continuing increases in the inflation rate may have an adverse effect on our investments and results of operati ons . • Increases in interest rates could increase the amount of our debt payments. • Market and economic challenges experienced by the U.S. and global economies may adversely impact aspects of our operating res ult s and operating condition. • We depend on tenants for our rental revenue and, accordingly, our rental revenue is dependent upon the success and economic v iab ility of our tenants. Lease terminations, tenant default and bankruptcy have adversely affected and could in the future adversely affect the income and cash flow produced by our properti es. • In owning properties we may experience, among other things, unforeseen costs associated with complying with laws and regulati ons and other costs, potential difficulties selling properties and potential damages or losses resulting from climate change. • We depend on our Advisor and our Property Manager to provide us with executive officers, key personnel and all services requi red for us to conduct our operations and our operating performance may be impacted by any adverse changes in the financial health or reputation of our Advisor and our Property Mana ger . • All of our executive officers face conflicts of interest, such as conflicts created by the terms of our agreements with the A dvi sor and compensation payable thereunder, conflicts allocating investment opportunities to us, and conflicts in allocating their time and attention to our matters. Conflicts that arise may no t be resolved in our favor and could result in actions that are adverse to us. • We have long - term agreements with our Advisor and its affiliates that may be terminated only in limited circumstances and may re quire us to pay a termination fee in some cases. • We have substantial indebtedness and may be unable to repay, refinance, restructure or extend our indebtedness as it becomes due . We may incur additional indebtedness in the future. • We have been in breach of several of our mortgage loans during 2021 encumbering certain of our properties for multiple quarte rs and have been or will be unable to use excess cash flow, if any, from those properties until the breaches are cured. If we experience additional lease terminations, it is possible that cer tain of the covenants on other loans may be breached and we may also become restricted from accessing excess cash flows from those properties. • The stockholder rights plan adopted by our board of directors, our classified board and other aspects of our corporate struct ure and Maryland law may discourage a third party from acquiring us in a manner that might result in a premium price to our stockholders. • Restrictions on share ownership contained in our charter may inhibit market activity in shares of our stock and restrict our bus iness combination opportunities. • We may fail to continue to qualify as a REIT. 31