Exhibit 99.1

0 NEW YORK CITY REIT Third Quarter Investor Presentation 9 Times Square - New York, NY _

1 Third Quarter 2022 Highlights 1) See appendix for a full description of capitalized terms and Non - GAAP reconciliations. 2) Refer to slide 9 – Top 10 Tenant Investment Grade Profile. 3) Refer to slide 10 – Proactive Asset Management for additional information. 4) Refer to slide 3 – Continued Original Cash Rent Collection Success for additional information. Total rent collected during the p eriod includes both Original Cash Rent due and payments made by tenants pursuant to rent deferral agreements. 5) Refer to slide 13 – Capital Structure and Q3’22 Financial Results for further information regarding our capital structure and liquidity. 1 NYC is a real estate investment trust with a high - quality real estate portfolio focused on the Manhattan market and tenants with core commercial businesses. NYC features a portfolio with near complete portfolio Original Cash Rent (1) collection, an attractive top 10 tenant base that is 79% Investment Grade (1) rated and a strong leasing platform with demonstrated success x Portfolio Occupancy (1) of 85% with a weighted average Remaining Lease Term (1) of 7.3 years x Resilient tenant base featuring government agencies and Investment Grade corporate tenants with core commercial business x Top 10 tenants (2) that are 79% Investment Grade rated and have a Remaining Lease Term of 9.9 years x Well balanced and long - term lease maturity schedule with 39% of leases expiring after 2030 x Since Knotel’s termination, NYC replaced 82% of the square footage (“SF”) and 74% of the Annualized Straight - line Rent (“SLR”) (1) formerly derived from Knotel x Year to date, NYC completed seven new leases, increasing portfolio Occupancy by 2%, including an 8% increase at 9 Times Square x Year over year, office usage at NYC’s three office properties increased by 19% on average as companies adopt mandatory in - office policies x 100% fixed debt capital structure with a weighted average debt maturity of 4.4 years at a 4.4% weighted average interest rate x Year over year, total portfolio Original Cash Rent (1) collection improved from 92% to 99% (4) and complete collection among NYC’s top 10 tenants in Q3’22 x As of November 1st, 2022, NYC’s independent board members owned 83,000 shares of NYC and separately, NYC’s Advisor and its affiliates owned nearly 3.0 million shares of NYC, demonstrating their depth of commitment by increasing ownership in NYC High Quality Manhattan Focused Portfolio Continued Leasing Momentum and Knotel Replacement (3) Conservative Debt Profile and Board and Advisor Shareholder Alignment (4)(5)
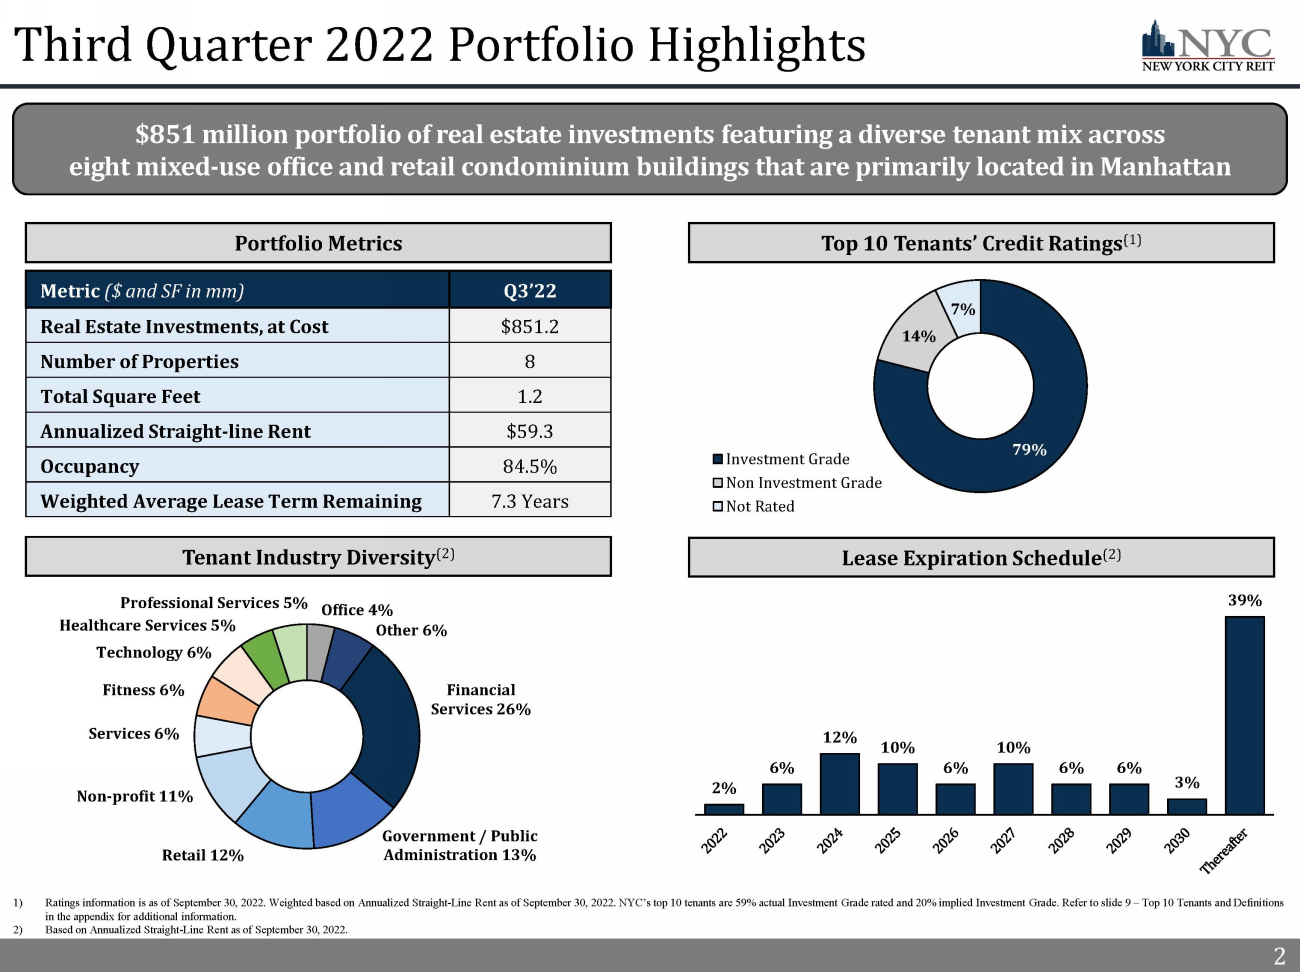
2 Third Quarter 2022 Portfolio Highlights Metric ($ and SF in mm) Q3’22 Real Estate Investments, at Cost $851.2 Number of Properties 8 Total Square Feet 1.2 Annualized Straight - line Rent $59.3 Occupancy 84.5% Weighted Average Lease Term Remaining 7.3 Years 1) Ratings information is as of September 30, 2022. Weighted based on Annualized Straight - Line Rent as of September 30, 2022. NYC’s top 10 tenants are 59% actual Investment Grade rated and 20% implied Investment Grade. Refer to slide 9 – Top 10 Tenants and Definitions in the appendix for additional information. 2) Based on Annualized Straight - Line Rent as of September 30 , 2022. 2 2% 6% 12% 10% 6% 10% 6% 6% 3% 39% Financial Services 26% Government / Public Administration 13% Retail 12% Non - profit 11% Services 6% Fitness 6% Technology 6% Healthcare Services 5% Professional Services 5% Office 4% Other 6% $851 million portfolio of real estate investments featuring a diverse tenant mix across eight mixed - use office and retail condominium buildings that are primarily located in Manhattan Top 10 Tenants’ Credit Ratings (1) Tenant Industry Diversity (2) Lease Expiration Schedule (2) Portfolio Metrics 79% 14% 7% Investment Grade Non Investment Grade Not Rated
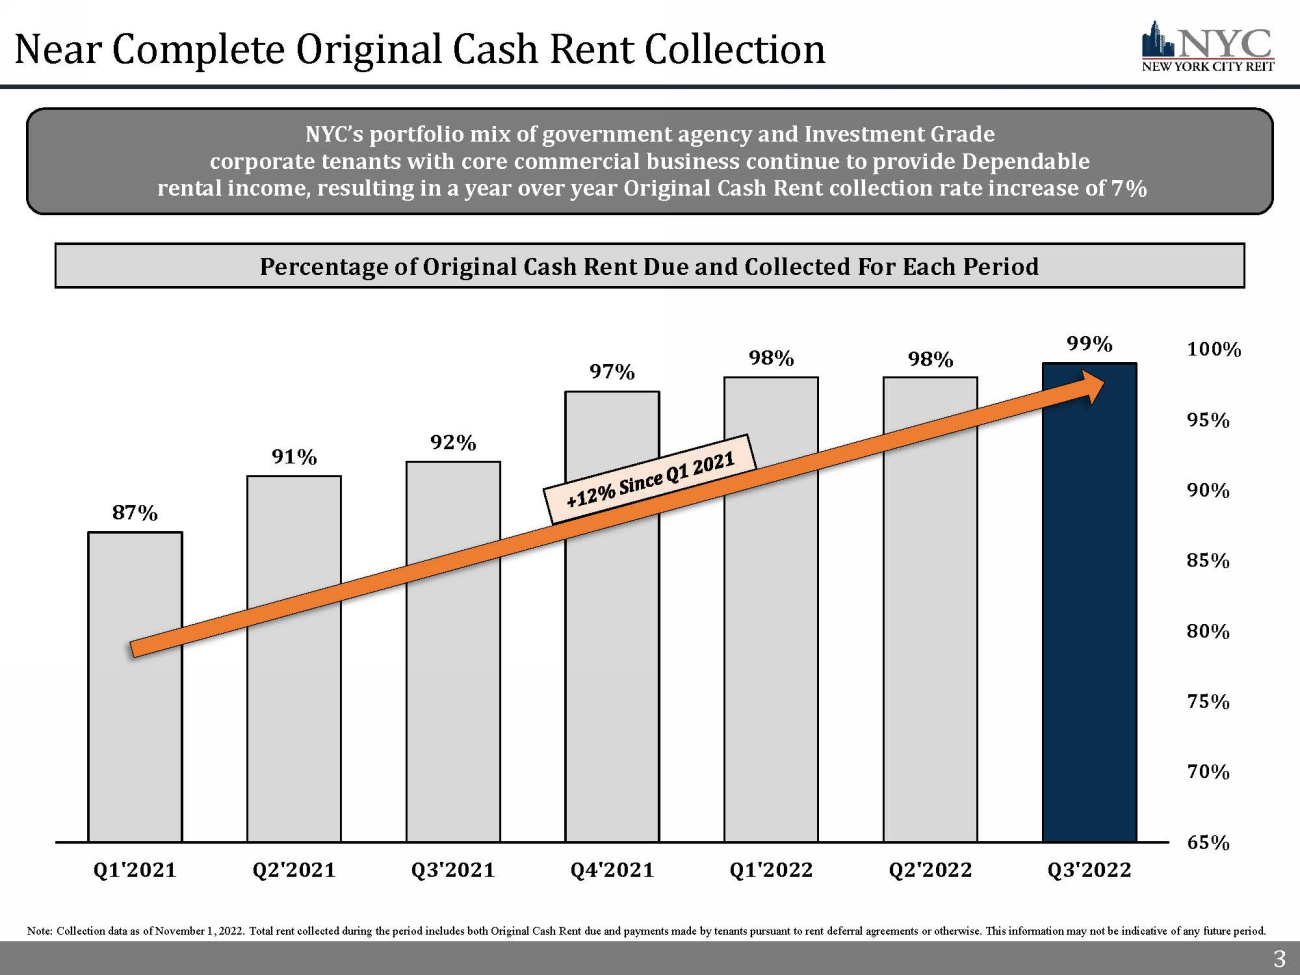
3 Near Complete Original Cash Rent Collection 3 Percentage of Original Cash Rent Due and Collected For Each Period Note: Collection data as of November 1, 2022. Total rent collected during the period includes both Original Cash Rent due and pa yments made by tenants pursuant to rent deferral agreements or otherwise. This information may not be indicative of any futur e p eriod. 99% 98% 98% 97% 92% 91% 87% 65% 70% 75% 80% 85% 90% 95% 100% Q3'2022 Q2'2022 Q1'2022 Q4'2021 Q3'2021 Q2'2021 Q1'2021 NYC’s portfolio mix of government agency and Investment Grade corporate tenants with core commercial business continue to provide Dependable rental income, resulting in a y ear over year Original Cash Rent collection rate increase of 7%
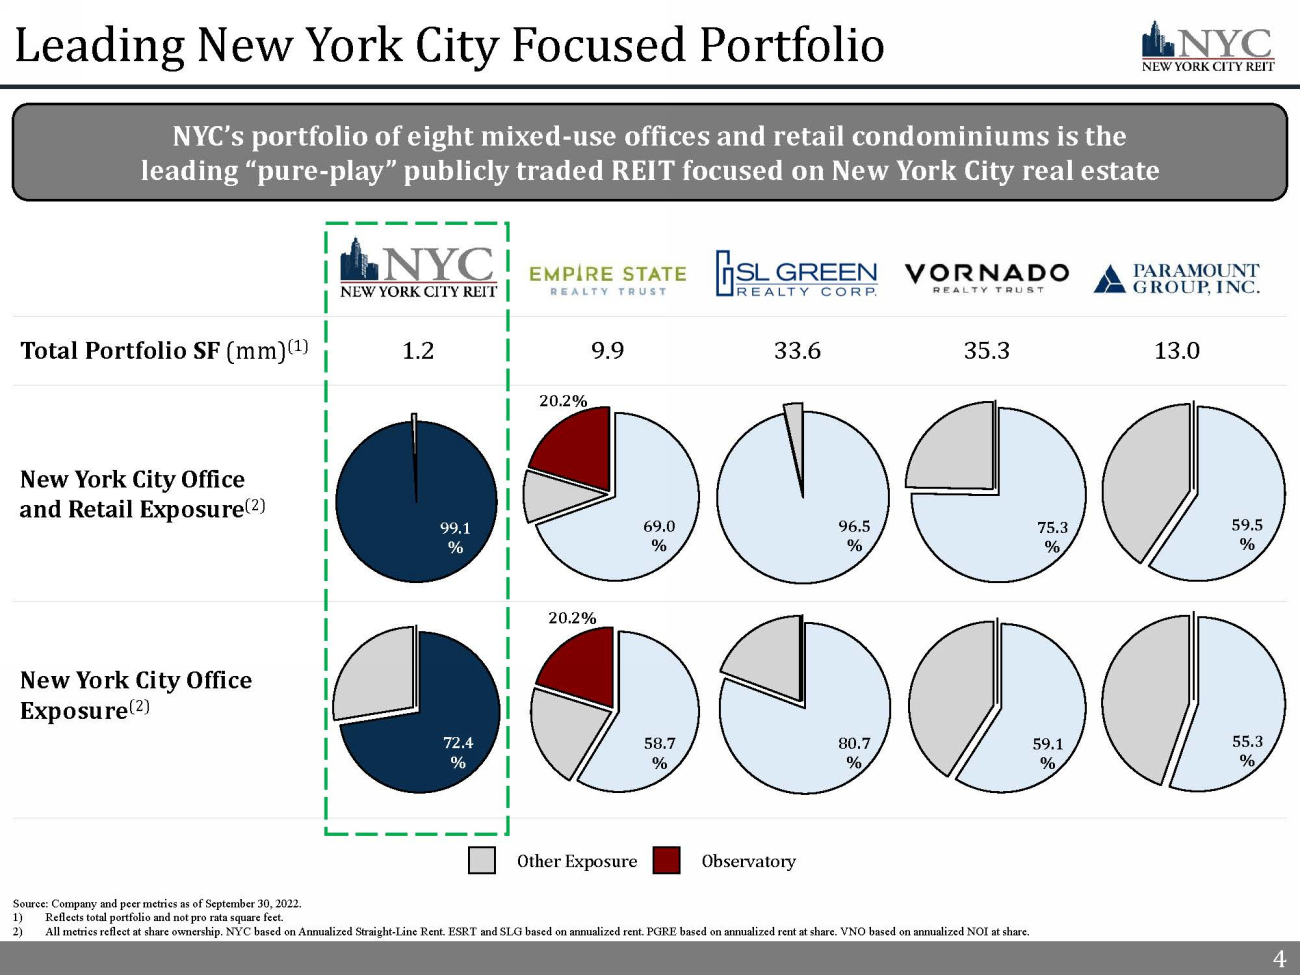
4 Leading New York City Focused Portfolio NYC’s portfolio of eight mixed - use offices and retail condominiums is the leading “pure - play” publicly traded REIT focused on New York City real estate Total Portfolio SF (mm) (1) 4 New York City Office and Retail Exposure (2) New York City Office Exposure (2) Other Exposure Observatory Source: Company and peer metrics as of September 30, 2022 . 1) Reflects total portfolio and not pro rata square feet. 2) All metrics reflect at share ownership. NYC based on Annualized Straight - Line Rent. ESRT and SLG based on annualized rent. PGRE based on annualized rent at share. VNO based on annualized NOI at share. 1.2 9.9 33.6 35.3 13.0 72.4 % 80.7 % 59.1 % 55.3 % 69.0 % 96.5 % 75.3 % 59.5 % 20.2% 58.7 % 20.2% 99.1 %
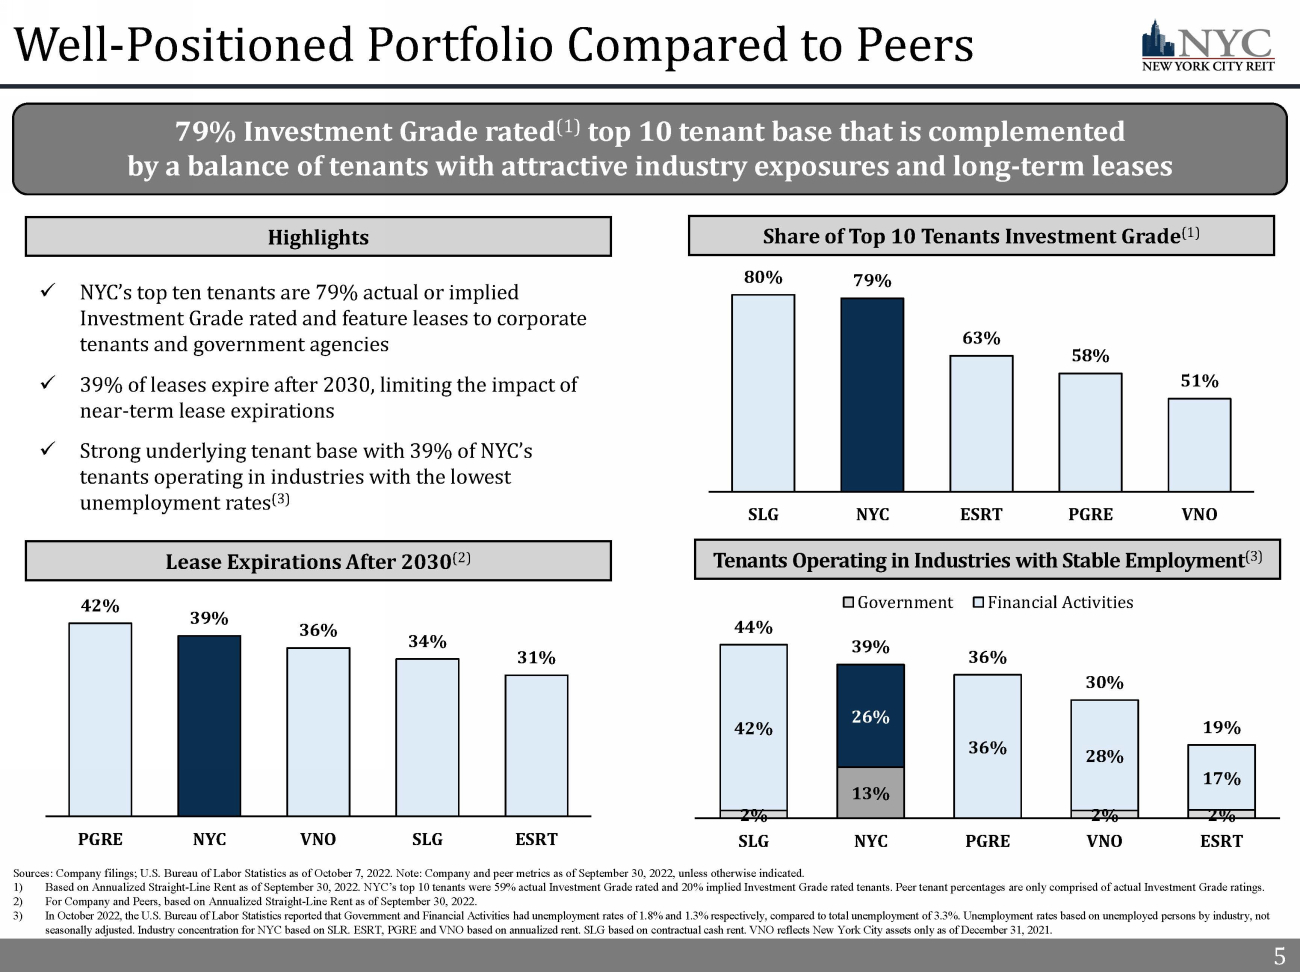
5 Well - Positioned Portfolio Compared to Peers 5 Sources: Company filings; U.S. Bureau of Labor Statistics as of October 7, 2022. Note: Company and peer metrics as of Septemb er 30, 2022, unless otherwise indicated. 1) Based on Annualized Straight - Line Rent as of September 30, 2022. NYC’s top 10 tenants were 59% actual Investment Grade rated and 20% implied Investment Grade rated tenants. Peer tenant percentages are only comprised of actual Investment Grade ratings. 2) For Company and Peers, based on Annualized Straight - Line Rent as of September 30, 2022. 3) In October 2022, the U.S. Bureau of Labor Statistics reported that Government and Financial Activities had unemployment rates of 1.8% and 1.3% respectively, compared to total unemployment of 3.3%. Unemployment rates based on unemployed persons by industr y, not seasonally adjusted. Industry concentration for NYC based on SLR. ESRT, PGRE and VNO based on annualized rent. SLG based on c ont ractual cash rent. VNO reflects New York City assets only as of December 31, 2021. Tenants Operating in Industries with Stable Employment (3) Share of Top 10 Tenants Investment Grade (1) Lease Expirations After 2030 (2) Highlights 79% Investment Grade rated (1) top 10 tenant base that is complemented by a balance of tenants with attractive industry exposures and long - term leases 42% 39% 36% 34% 31% PGRE NYC VNO SLG ESRT x NYC’s top ten tenants are 79% actual or implied Investment Grade rated and feature leases to corporate tenants and government agencies x 39% of leases expire after 2030, limiting the impact of near - term lease expirations x Strong underlying tenant base with 39% of NYC’s tenants operating in industries with the lowest unemployment rates (3) 2% 13% 2% 2% 42% 26% 36% 28% 17% 44% 39% 36% 30% 19% SLG NYC PGRE VNO ESRT Government Financial Activities 80% 79% 63% 58% 51% SLG NYC ESRT PGRE VNO
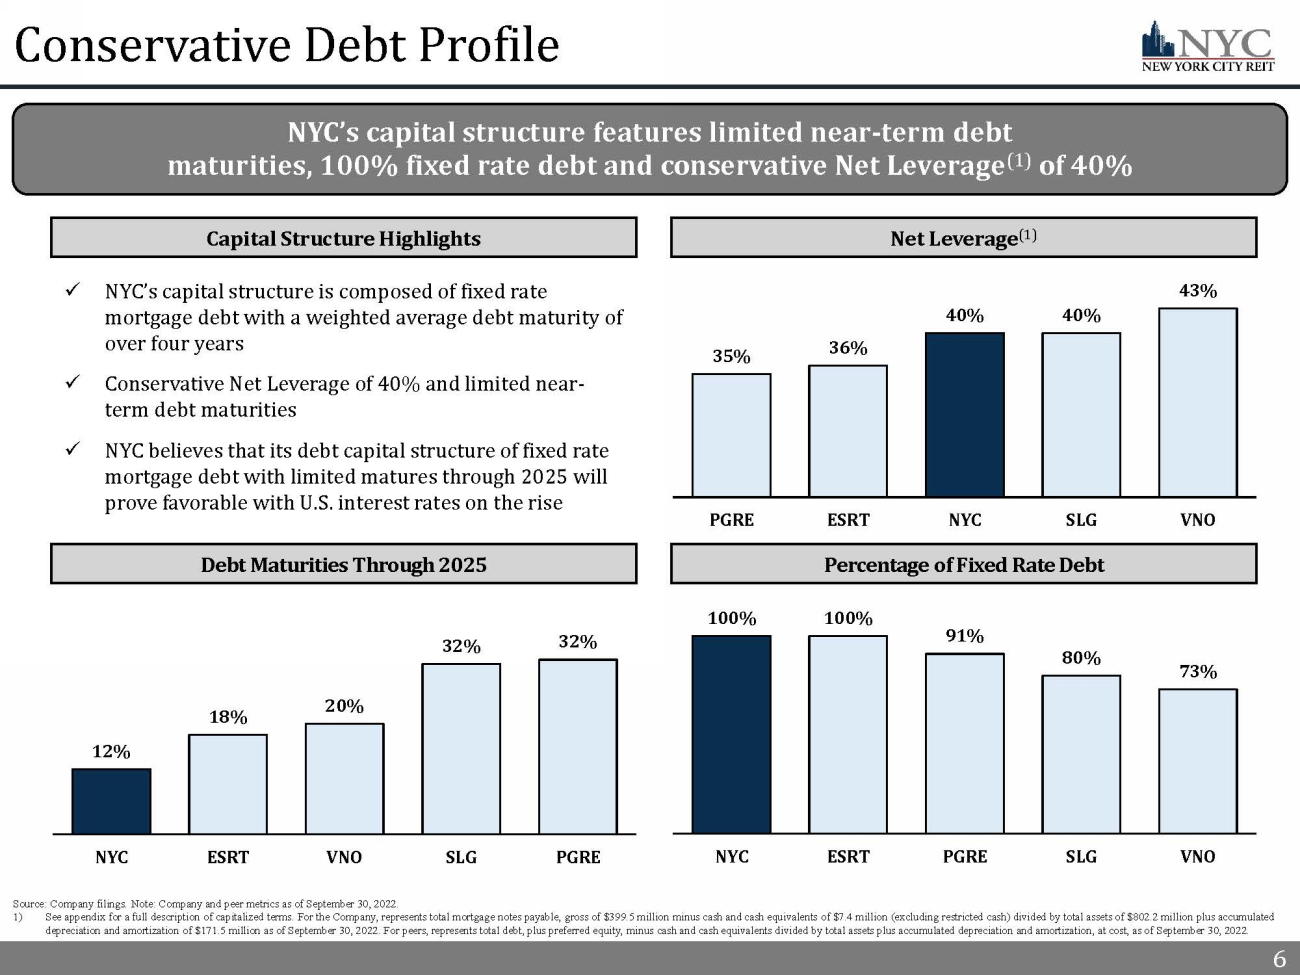
6 6 Conservative Debt Profile x NYC’s capital structure is composed of fixed rate mortgage debt with a weighted average debt maturity of over four years x Conservative Net Leverage of 40 % and limited near - term debt maturities x NYC believes that its debt capital structure of fixed rate mortgage debt with limited matures through 2025 will prove favorable with U.S. interest rates on the rise 6 NYC’s capital structure features limited near - term debt maturities, 100% fixed rate debt and conservative Net Leverage (1) of 40% Debt Maturities Through 2025 Capital Structure Highlights Source: Company filings. Note: Company and peer metrics as of September 30, 2022. 1) See appendix for a full description of capitalized terms. For the Company, represents total mortgage notes payable, gross of $39 9.5 million minus cash and cash equivalents of $7.4 million (excluding restricted cash) divided by total assets of $802.2 mil lio n plus accumulated depreciation and amortization of $171.5 million as of September 30, 2022. For peers, represents total debt, plus preferred eq uit y, minus cash and cash equivalents divided by total assets plus accumulated depreciation and amortization, at cost, as of Sep tem ber 30, 2022. 12% 18% 20% 32% 32% NYC ESRT VNO SLG PGRE Percentage of Fixed Rate Debt Net Leverage (1) 35% 36% 40% 40% 43% PGRE ESRT NYC SLG VNO 100% 100% 91% 80% 73% NYC ESRT PGRE SLG VNO
7 7 Real Estate Portfolio Highlights
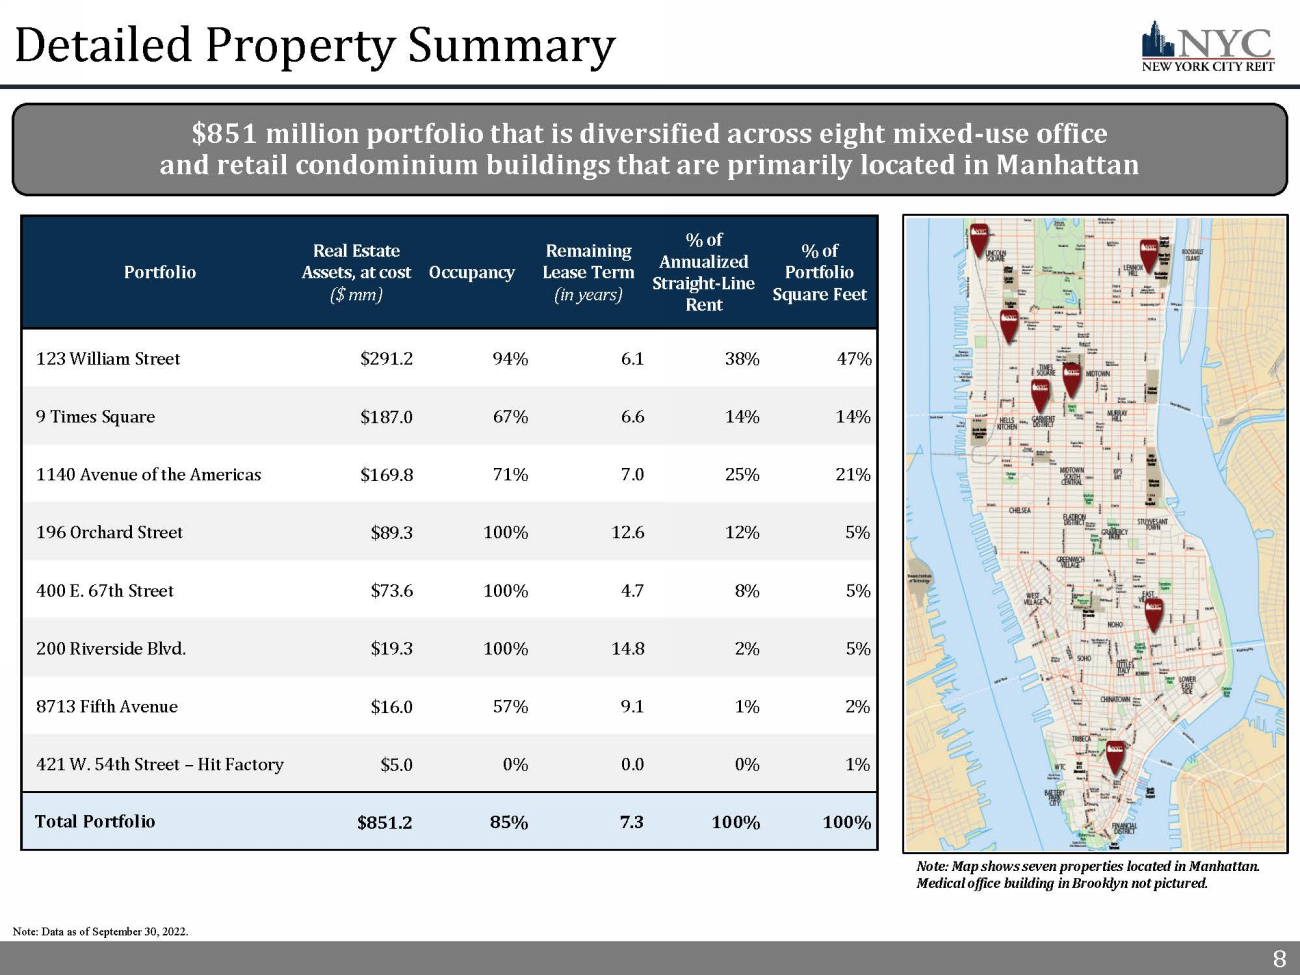
8 8 Detailed Property Summary Note: Data as of September 30, 2022. Portfolio Real Estate Assets, at cost ($ mm) Occupancy Remaining Lease Term (in years) % of Annualized Straight - Line Rent % of Portfolio Square Feet 123 William Street $291.2 94% 6.1 38% 47% _ 9 Times Square $187.0 67% 6.6 14% 14% _ 1140 Avenue of the Americas $169.8 71% 7.0 25% 21% _ 196 Orchard Street $89.3 100% 12.6 12% 5% _ 400 E. 67th Street $73.6 100% 4.7 8% 5% _ 200 Riverside Blvd. $19.3 100% 14.8 2% 5% _ 8713 Fifth Avenue $16.0 57% 9.1 1% 2% _ 421 W. 54th Street – Hit Factory $5.0 0% 0.0 0% 1% _ Total Portfolio $851.2 85% 7.3 100% 100% _ Note: Map shows seven properties located in Manhattan. Medical office building in Brooklyn not pictured. $851 million portfolio that is diversified across eight mixed - use office and retail condominium buildings that are primarily located in Manhattan
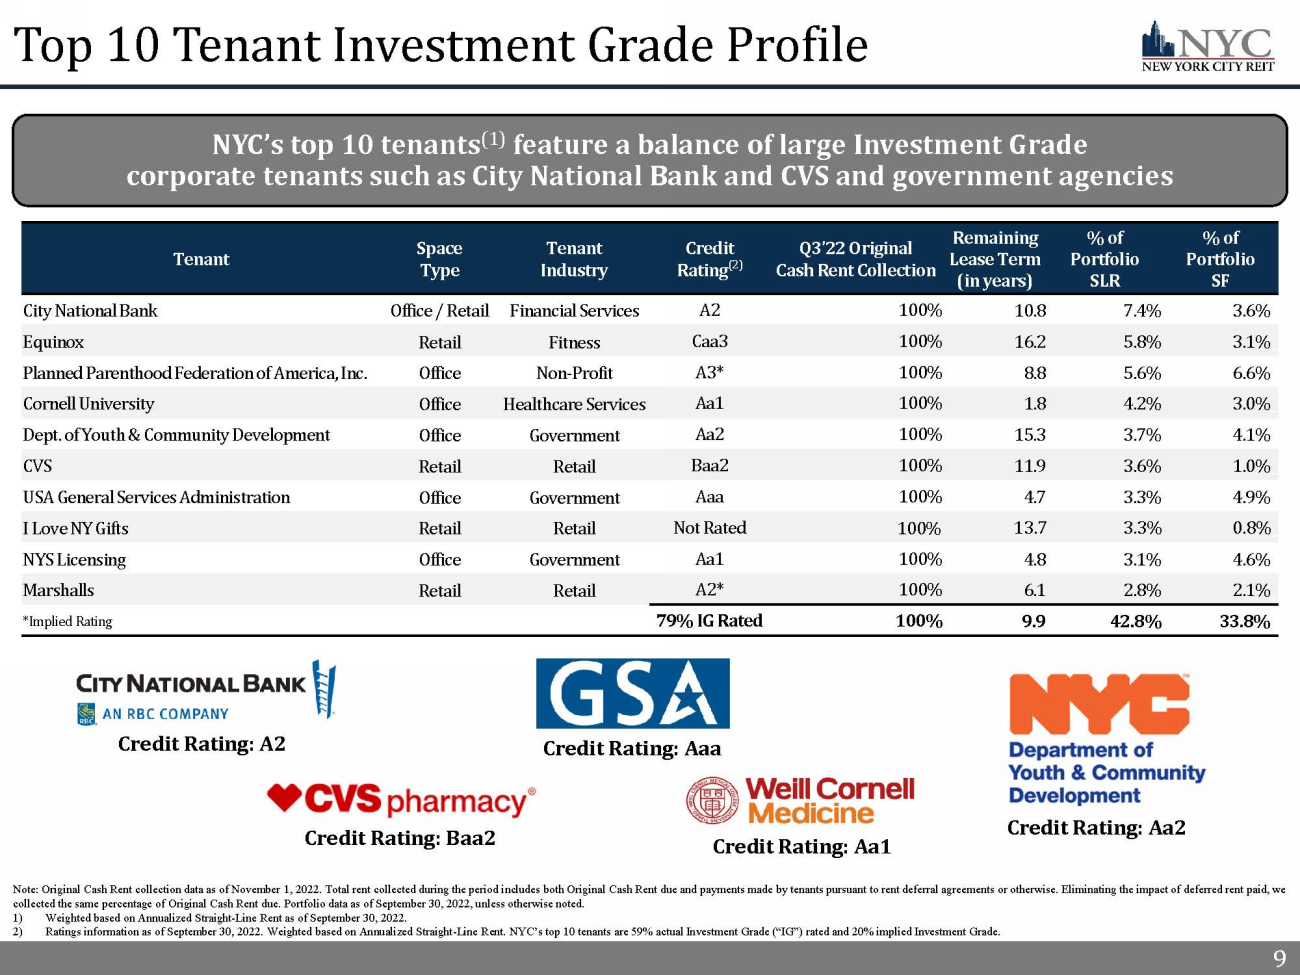
9 9 Note: Original Cash Rent collection data as of November 1, 2022. Total rent collected during the period includes both Origina l C ash Rent due and payments made by tenants pursuant to rent deferral agreements or otherwise. Eliminating the impact of deferr ed rent paid, we collected the same percentage of Original Cash Rent due. Portfolio data as of September 30, 2022, unless otherwise noted. 1) Weighted based on Annualized Straight - Line Rent as of September 30, 2022. 2) Ratings information as of September 30, 2022. Weighted based on Annualized Straight - Line Rent. NYC’s top 10 tenants are 59% actu al Investment Grade (“IG”) rated and 20% implied Investment Grade. Top 10 Tenant Investment Grade Profile Tenant Space Type Tenant Industry Credit Rating (2) Q3’22 Original Cash Rent Collection Remaining Lease Term (in years) % of Portfolio SLR % of Portfolio SF City National Bank Office / Retail Financial Services A2 100% 10.8 7.4% 3.6% _ Equinox Retail Fitness Caa3 100% 16.2 5.8% 3.1% _ Planned Parenthood Federation of America, Inc. Office Non - Profit A3* 100% 8.8 5.6% 6.6% _ Cornell University Office Healthcare Services Aa1 100% 1.8 4.2% 3.0% _ Dept. of Youth & Community Development Office Government Aa2 100% 15.3 3.7% 4.1% _ CVS Retail Retail Baa2 100% 11.9 3.6% 1.0% _ USA General Services Administration Office Government Aaa 100% 4.7 3.3% 4.9% _ I Love NY Gifts Retail Retail Not Rated 100% 13.7 3.3% 0.8% _ NYS Licensing Office Government Aa1 100% 4.8 3.1% 4.6% _ Marshalls Retail Retail A2* 100% 6.1 2.8% 2.1% _ *Implied Rating 79% IG Rated 100% 9.9 42.8% 33.8% _ Credit Rating: A2 Credit Rating: Aa1 Credit Rating: Baa2 Credit Rating: Aaa Credit Rating: Aa2 NYC’s top 10 tenants (1) feature a balance of large Investment Grade corporate tenants such as City National Bank and CVS and government agencies
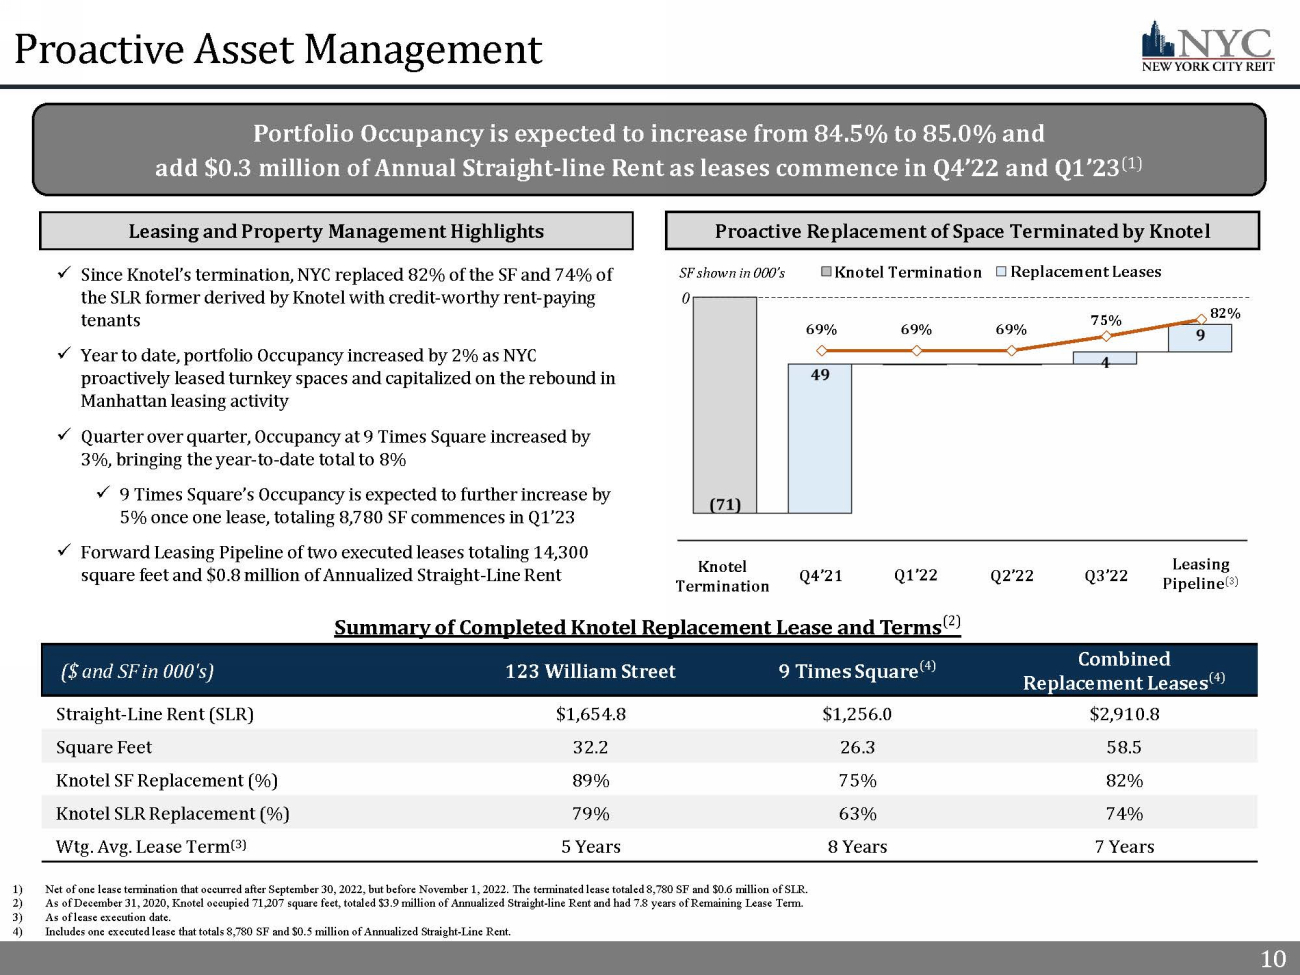
10 10 69% 69% 69% 75% 82% Portfolio Occupancy is expected to increase from 84.5% to 85.0% and add $0.3 million of Annual Straight - line Rent as leases commence in Q4’22 and Q1’23 (1) Proactive Asset Management 10 Summary of Completed Knotel Replacement Lease and Terms (2) Proactive Replacement of Space Terminated by Knotel Leasing and Property Management Highlights x Since Knotel’s termination, NYC replaced 82% of the SF and 74% of the SLR former derived by Knotel with credit - worthy rent - paying tenants x Year to date, portfolio Occupancy increased by 2% as NYC proactively leased turnkey spaces and capitalized on the rebound in Manhattan leasing activity x Quarter over quarter, Occupancy at 9 Times Square increased by 3%, bringing the year - to - date total to 8% x 9 Times Square’s Occupancy is expected to further increase by 5% once one lease, totaling 8,780 SF commences in Q1’23 x Forward Leasing Pipeline of two executed leases totaling 14,300 square feet and $0.8 million of Annualized Straight - Line Rent 1) Net of one lease termination that occurred after September 30, 2022, but before November 1, 2022. The terminated lease totale d 8 ,780 SF and $0.6 million of SLR. 2) As of December 31, 2020, Knotel occupied 71 ,207 square feet, totaled $3.9 million of Annualized Straight - line Rent and had 7.8 years of Remaining Lease Term. 3) As of lease execution date. 4) Includes one executed lease that totals 8,780 SF and $0.5 million of Annualized Straight - Line Rent. ($ and SF in 000's) 123 William Street 9 Times Square (4) Combined Replacement Leases (4) Straight - Line Rent (SLR) $1,654.8 $1,256.0 $2,910.8 Square Feet 32.2 26.3 58.5 Knotel SF Replacement (%) 89% 75% 82% Knotel SLR Replacement (%) 79% 63% 74% Wtg . Avg. Lease Term (3) 5 Years 8 Years 7 Years Knotel Termination Replacement Leases 0 SF shown in 000’s Knotel Termination Leasing Pipeline (3) Q4’21 Q1’22 Q2’22 Q3’22
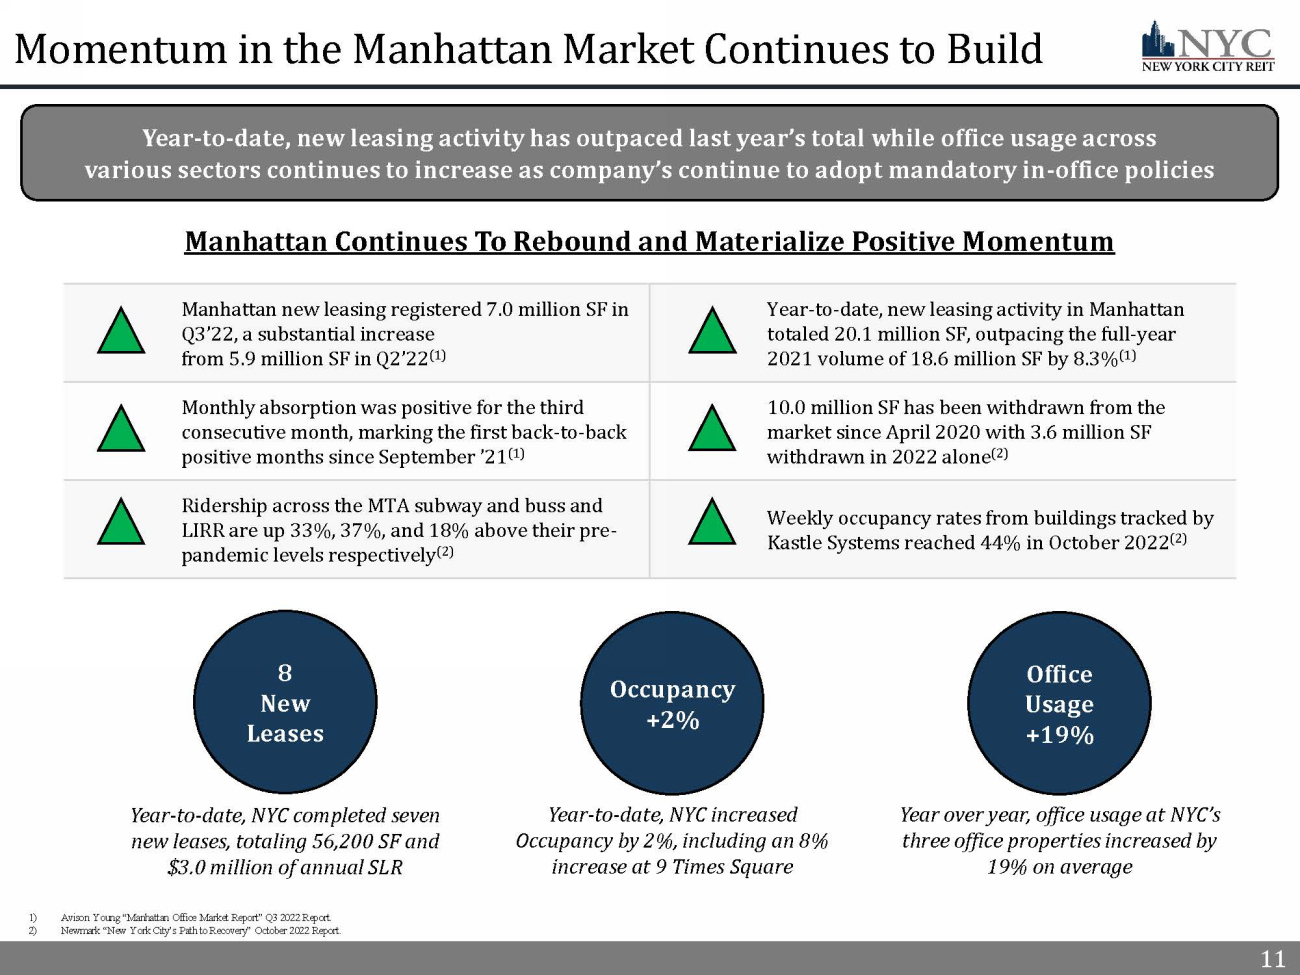
11 Momentum in the Manhattan Market Continues to Build 1) Avison Young “Manhattan Office Market Report” Q3 2022 Report. 2) Newmark “New York City’s Path to Recovery” October 2022 Report. 11 Year - to - date, new leasing activity has outpaced last year’s total while office usage across various sectors continues to increase as company’s continue to adopt mandatory in - office policies Manhattan Continues To Rebound and Materialize Positive Momentum Manhattan new leasing registered 7.0 million SF in Q3’22, a substantial increase from 5.9 million SF in Q2’22 (1) Year - to - date, new leasing activity in Manhattan totaled 20.1 million SF, outpacing the full - year 2021 volume of 18.6 million SF by 8.3% (1) Monthly absorption was positive for the third consecutive month, marking the first back - to - back positive months since September ’21 (1) 10.0 million SF has been withdrawn from the market since April 2020 with 3.6 million SF withdrawn in 2022 alone (2) Ridership across the MTA subway and buss and LIRR are up 33%, 37%, and 18% above their pre - pandemic levels respectively (2) Weekly occupancy rates from buildings tracked by Kastle Systems reached 44% in October 2022 (2) 8 New Leases Year - to - date, NYC completed seven new leases, totaling 56,200 SF and $3.0 million of annual SLR Occupancy +2% Year - to - date, NYC increased Occupancy by 2%, including an 8% increase at 9 Times Square Office Usage +19% Year over year, office usage at NYC’s three office properties increased by 19% on average
12 Financial Highlights
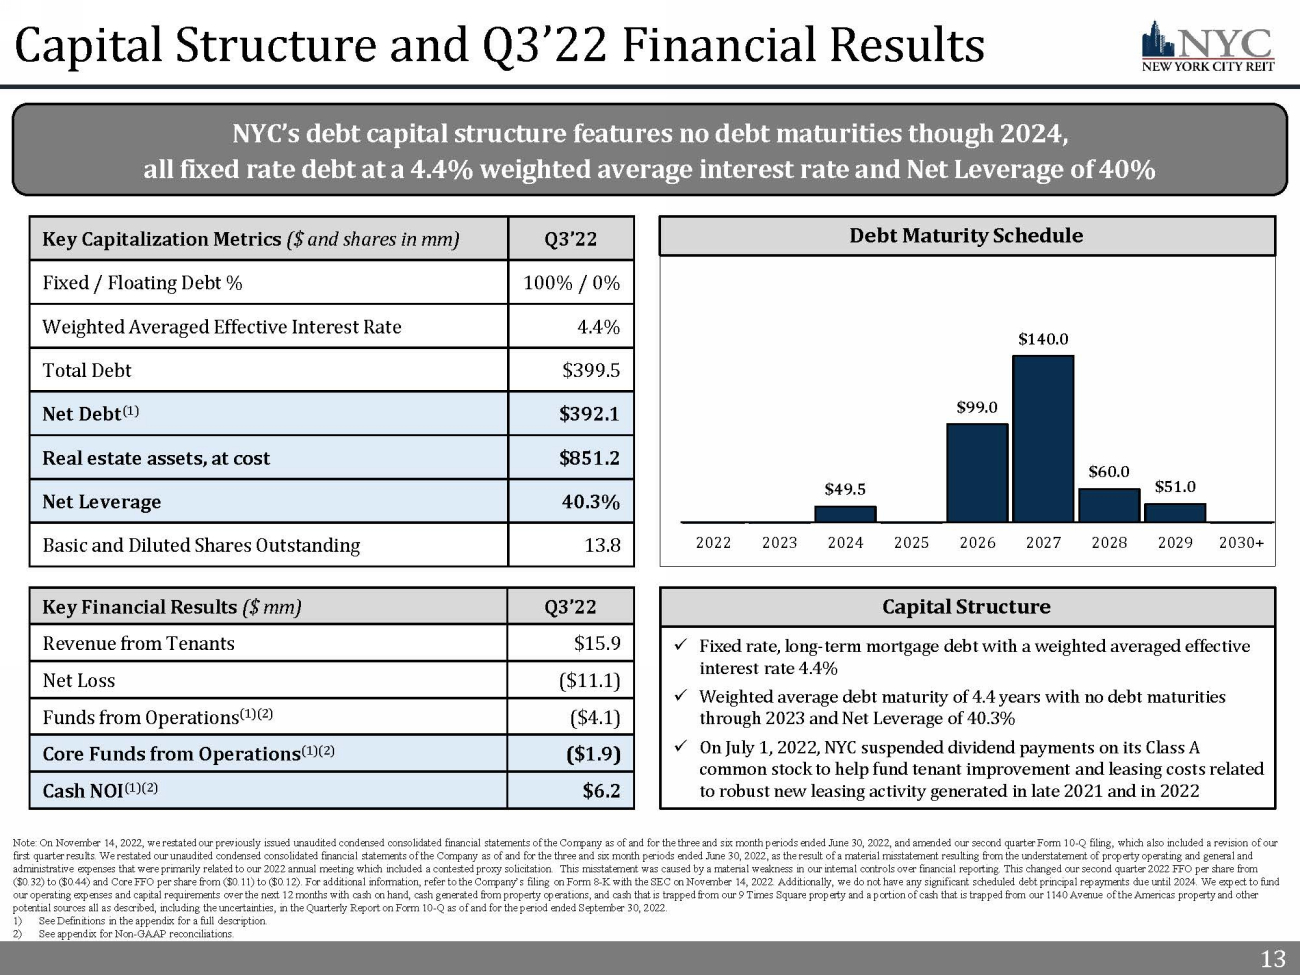
13 13 Capital Structure and Q3’22 Financial Results Note: On November 14, 2022, we restated our previously issued unaudited condensed consolidated financial statements of the Co mpa ny as of and for the three and six month periods ended June 30, 2022, and amended our second quarter Form 10 - Q filing, which als o included a revision of our first quarter results. We restated our unaudited condensed consolidated financial statements of the Company as of and for the th ree and six month periods ended June 30, 2022, as the result of a material misstatement resulting from the understatement of pro perty operating and general and administrative expenses that were primarily related to our 2022 annual meeting which included a contested proxy solicitation. T his misstatement was caused by a material weakness in our internal controls over financial reporting. This changed our second qu arter 2022 FFO per share from ($0.32) to ($0.44) and Core FFO per share from ($0.11) to ($0.12). For additional information, refer to the Company’s filing on Form 8 - K with the SEC on November 14, 2022. Additionally, we do not have any significant scheduled debt principal repayments due until 2024. We expect to fund our operating expenses and capital requirements over the next 12 months with cash on hand, cash generated from property opera tio ns, and cash that is trapped from our 9 Times Square property and a portion of cash that is trapped from our 1140 Avenue of t he Americas property and other potential sources all as described, including the uncertainties, in the Quarterly Report on Form 10 - Q as of and for the period e nded September 30, 2022. 1) See Definitions in the appendix for a full description. 2) See appendix for Non - GAAP reconciliations. NYC’s debt capital structure features no debt maturities though 2024, all fixed rate debt at a 4.4% weighted average interest rate and Net Leverage of 40% Key Capitalization Metrics ($ and shares in mm) Q3’22 Fixed / Floating Debt % 100% / 0% Weighted Averaged Effective Interest Rate 4.4% Total Debt $399.5 Net Debt (1) $392.1 Real estate assets, at cost $851.2 Net Leverage 40.3% Basic and Diluted Shares Outstanding 13.8 Debt Maturity Schedule $49.5 $99.0 $140.0 $60.0 $51.0 $40.0 $60.0 $80.0 $100.0 $120.0 $140.0 $160.0 $180.0 2022 2023 2024 2025 2026 2027 2028 2029 2030+ Key Financial Results ($ mm) Q3’22 Revenue from Tenants $15.9 Net Loss ($11.1) Funds from Operations (1)(2) ($4.1) Core Funds from Operations (1)(2) ($1.9) Cash NOI (1)(2) $6.2 Capital Structure x Fixed rate, long - term mortgage debt with a weighted averaged effective interest rate 4.4% x Weighted average debt maturity of 4.4 years with no debt maturities through 2023 and Net Leverage of 40.3% x On July 1, 2022, NYC suspended dividend payments on its Class A common stock to help fund tenant improvement and leasing costs related to robust new leasing activity generated in late 2021 and in 2022
14 14 Management and Board of Directors
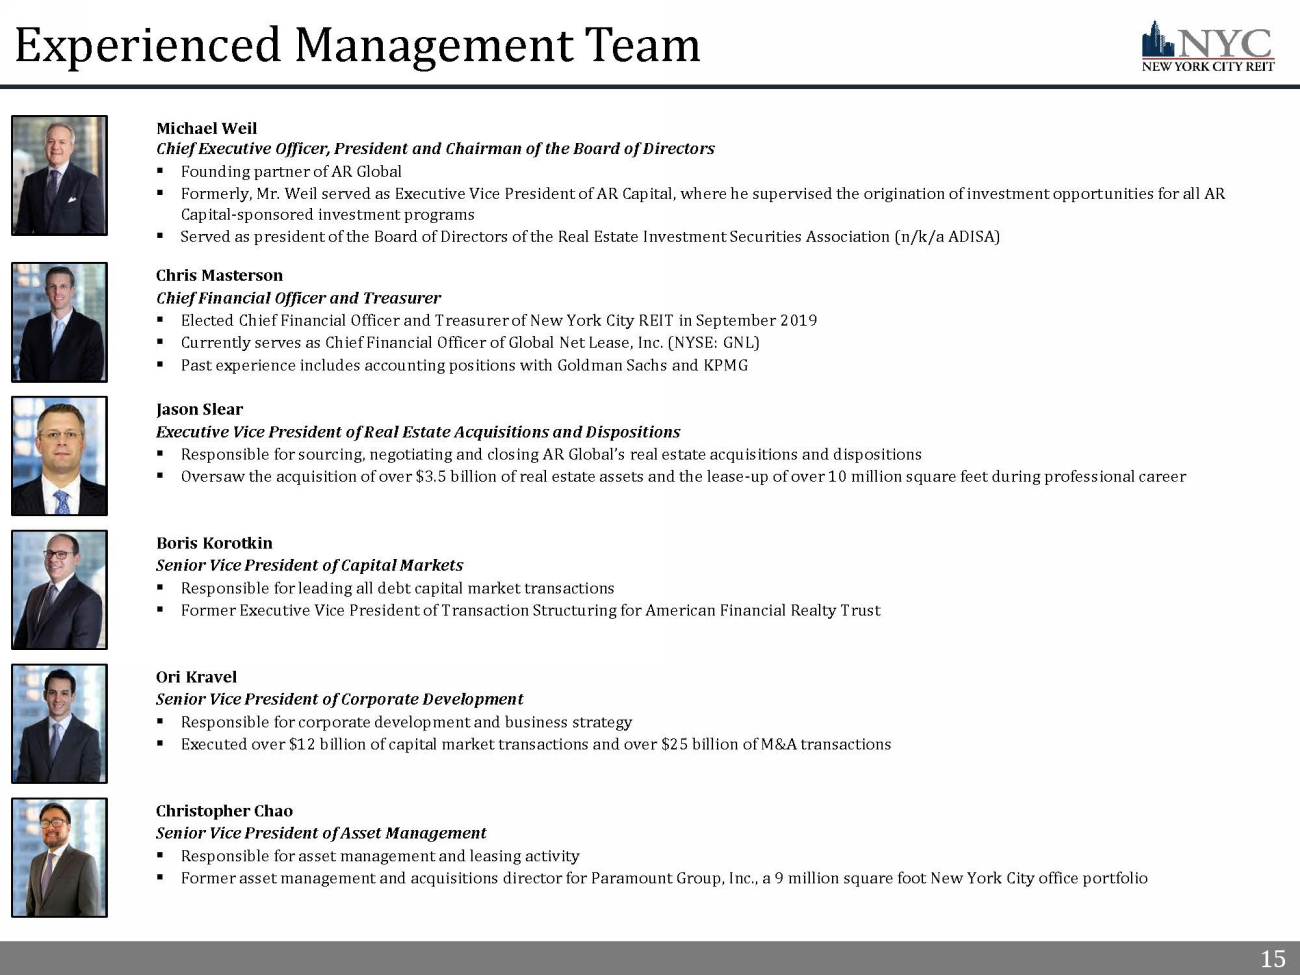
15 15 Experienced Management Team Michael Weil Chief Executive Officer, President and Chairman of the Board of Directors ▪ Founding partner of AR Global ▪ Formerly, Mr. Weil served as Executive Vice President of AR Capital, where he supervised the origination of investment opport uni ties for all AR Capital - sponsored investment programs ▪ Served as president of the Board of Directors of the Real Estate Investment Securities Association (n/k/a ADISA) Chris Masterson Chief Financial Officer and Treasurer ▪ Elected Chief Financial Officer and Treasurer of New York City REIT in September 2019 ▪ Currently serves as Chief Financial Officer of Global Net Lease, Inc. (NYSE: GNL) ▪ Past experience includes accounting positions with Goldman Sachs and KPMG Jason Slear Executive Vice President of Real Estate Acquisitions and Dispositions ▪ Responsible for sourcing, negotiating and closing AR Global’s real estate acquisitions and dispositions ▪ Oversaw the acquisition of over $3.5 billion of real estate assets and the lease - up of over 10 million square feet during profes sional career Boris Korotkin Senior Vice President of Capital Markets ▪ Responsible for leading all debt capital market transactions ▪ Former Executive Vice President of Transaction Structuring for American Financial Realty Trust Ori Kravel Senior Vice President of Corporate Development ▪ Responsible for corporate development and business strategy ▪ Executed over $12 billion of capital market transactions and over $25 billion of M&A transactions Christopher Chao Senior Vice President of Asset Management ▪ Responsible for asset management and leasing activity ▪ Former asset management and acquisitions director for Paramount Group, Inc., a 9 million square foot New York City office por tfo lio
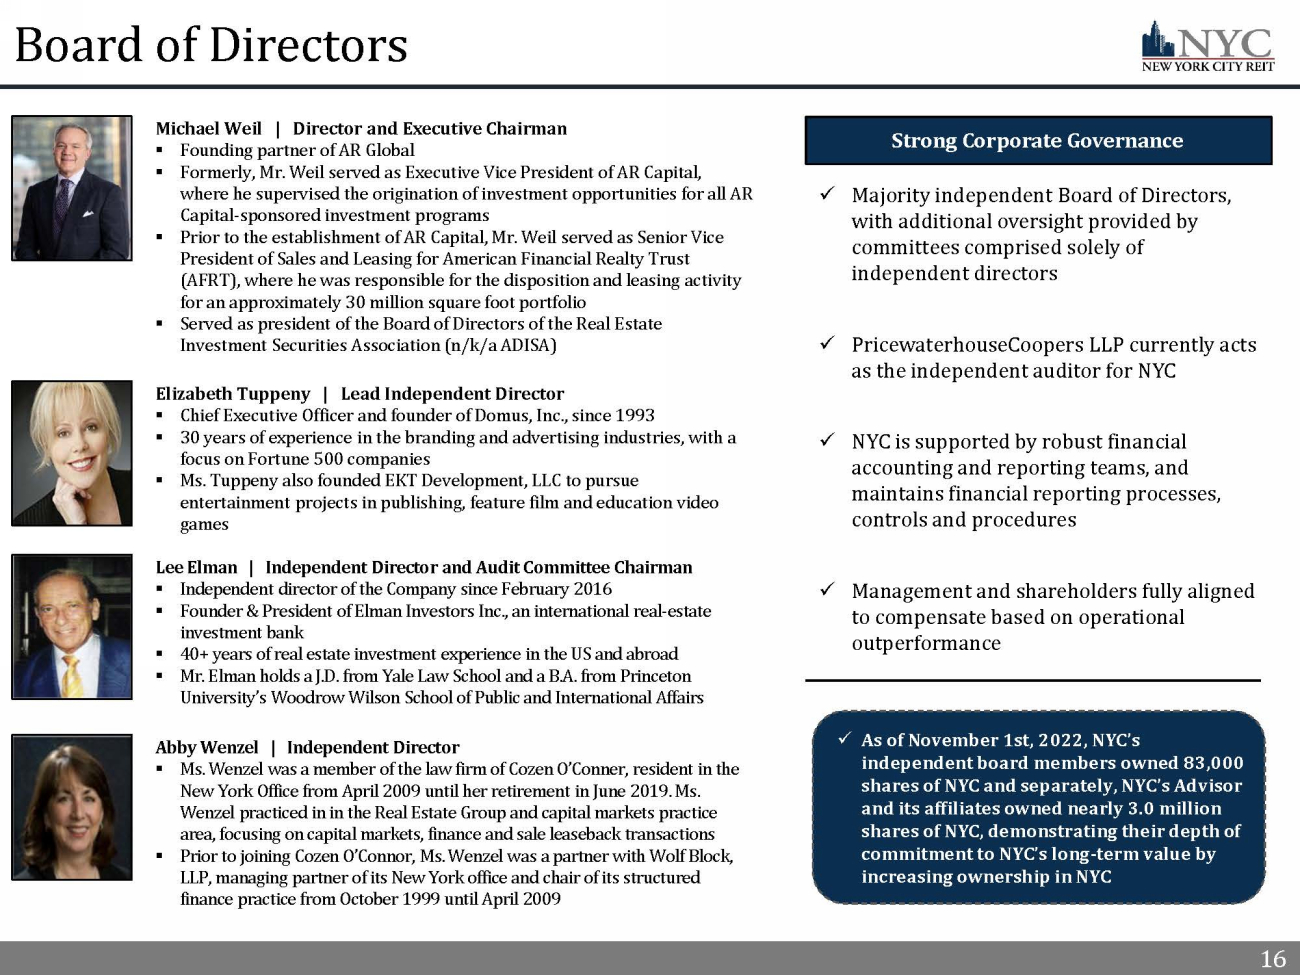
16 16 Board of Directors Michael Weil | Director and Executive Chairman ▪ Founding partner of AR Global ▪ Formerly, Mr. Weil served as Executive Vice President of AR Capital, where he supervised the origination of investment opportunities for all AR Capital - sponsored investment programs ▪ Prior to the establishment of AR Capital, Mr. Weil served as Senior Vice President of Sales and Leasing for American Financial Realty Trust (AFRT), where he was responsible for the disposition and leasing activity for an approximately 30 million square foot portfolio ▪ Served as president of the Board of Directors of the Real Estate Investment Securities Association (n/k/a ADISA) Lee Elman | Independent Director and Audit Committee Chairman ▪ Independent director of the Company since February 2016 ▪ Founder & President of Elman Investors Inc., an international real - estate investment bank ▪ 40+ years of real estate investment experience in the US and abroad ▪ Mr. Elman holds a J.D. from Yale Law School and a B.A. from Princeton University’s Woodrow Wilson School of Public and International Affairs Abby Wenzel | Independent Director ▪ Ms. Wenzel was a member of the law firm of Cozen O’Conner, resident in the New York Office from April 2009 until her retirement in June 2019. Ms. Wenzel practiced in in the Real Estate Group and capital markets practice area, focusing on capital markets, finance and sale leaseback transactions ▪ Prior to joining Cozen O’Connor, Ms. Wenzel was a partner with Wolf Block, LLP, managing partner of its New York office and chair of its structured finance practice from October 1999 until April 2009 Elizabeth Tuppeny | Lead Independent Director ▪ Chief Executive Officer and founder of Domus, Inc., since 1993 ▪ 30 years of experience in the branding and advertising industries, with a focus on Fortune 500 companies ▪ Ms. Tuppeny also founded EKT Development, LLC to pursue entertainment projects in publishing, feature film and education video games Strong Corporate Governance x Majority independent Board of Directors, with additional oversight provided by committees comprised solely of independent directors x PricewaterhouseCoopers LLP currently acts as the independent auditor for NYC x NYC is supported by robust financial accounting and reporting teams, and maintains financial reporting processes, controls and procedures x Management and shareholders fully aligned to compensate based on operational outperformance x As of November 1st, 2022, NYC’s independent board members owned 83,000 shares of NYC and separately, NYC’s Advisor and its affiliates owned nearly 3.0 million shares of NYC, demonstrating their depth of commitment to NYC’s long - term value by increasing ownership in NYC
17 17 Appendix
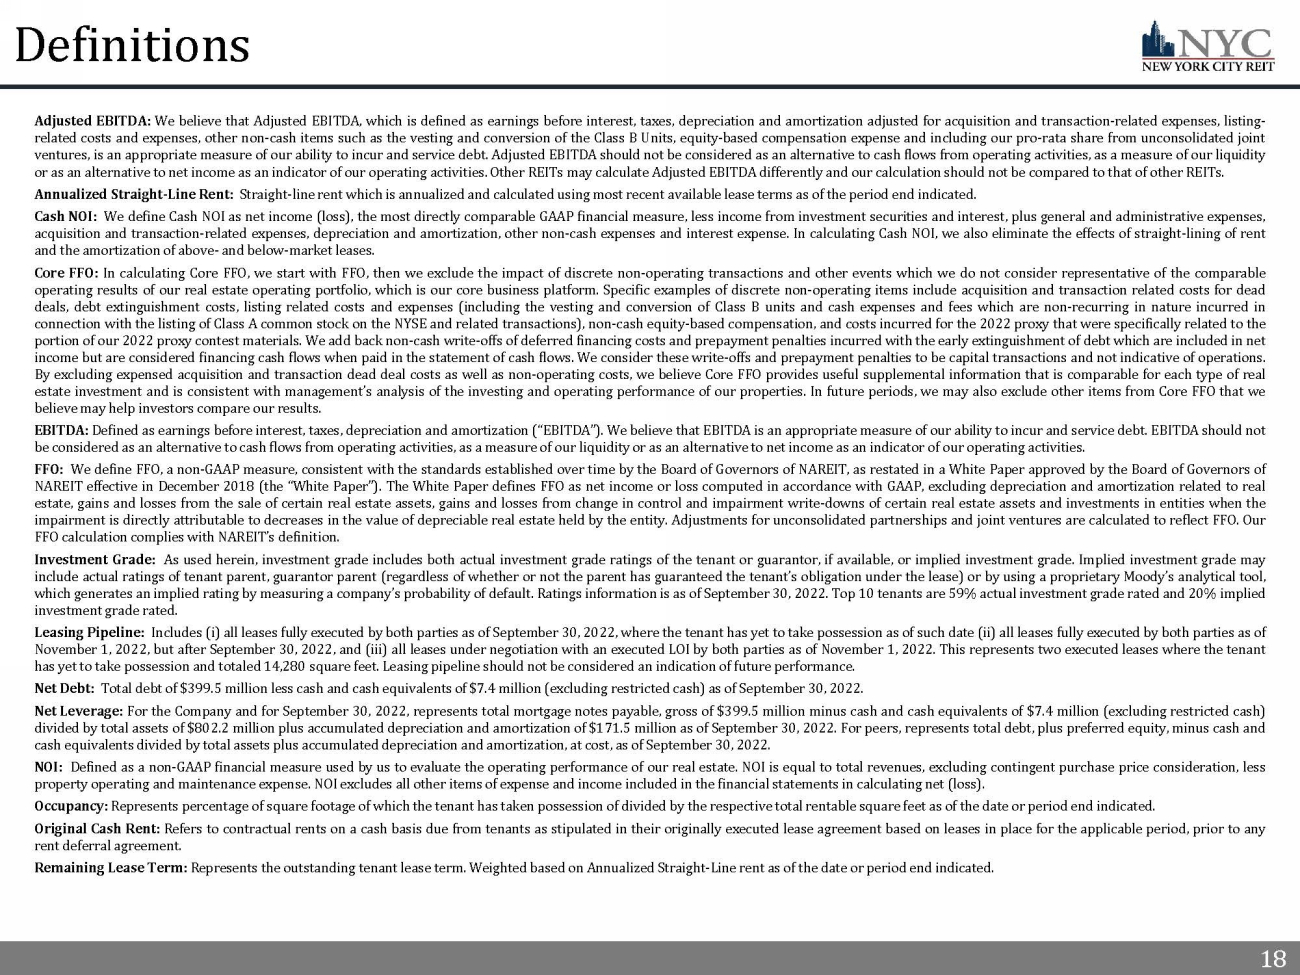
18 18 Definitions Adjusted EBITDA : We believe that Adjusted EBITDA, which is defined as earnings before interest, taxes, depreciation and amortization adjusted for acquisition and transaction - related expenses, listing - related costs and expenses, other non - cash items such as the vesting and conversion of the Class B Units, equity - based compensation expense and including our pro - rata share from unconsolidated joint ventures, is an appropriate measure of our ability to incur and service debt . Adjusted EBITDA should not be considered as an alternative to cash flows from operating activities, as a measure of our liquidity or as an alternative to net income as an indicator of our operating activities . Other REITs may calculate Adjusted EBITDA differently and our calculation should not be compared to that of other REITs . Annualized Straight - Line Rent : Straight - line rent which is annualized and calculated using most recent available lease terms as of the period end indicated . Cash NOI : We define Cash NOI as net income (loss), the most directly comparable GAAP financial measure, less income from investment securities and interest, plus general and administrative expenses, acquisition and transaction - related expenses, depreciation and amortization, other non - cash expenses and interest expense . In calculating Cash NOI, we also eliminate the effects of straight - lining of rent and the amortization of above - and below - market leases . Core FFO : In calculating Core FFO, we start with FFO, then we exclude the impact of discrete non - operating transactions and other events which we do not consider representative of the comparable operating results of our real estate operating portfolio, which is our core business platform . Specific examples of discrete non - operating items include acquisition and transaction related costs for dead deals, debt extinguishment costs, listing related costs and expenses (including the vesting and conversion of Class B units and cash expenses and fees which are non - recurring in nature incurred in connection with the listing of Class A common stock on the NYSE and related transactions), non - cash equity - based compensation, and costs incurred for the 2022 proxy that were specifically related to the portion of our 2022 proxy contest materials . We add back non - cash write - offs of deferred financing costs and prepayment penalties incurred with the early extinguishment of debt which are included in net income but are considered financing cash flows when paid in the statement of cash flows . We consider these write - offs and prepayment penalties to be capital transactions and not indicative of operations . By excluding expensed acquisition and transaction dead deal costs as well as non - operating costs, we believe Core FFO provides useful supplemental information that is comparable for each type of real estate investment and is consistent with management’s analysis of the investing and operating performance of our properties . In future periods, we may also exclude other items from Core FFO that we believe may help investors compare our results . EBITDA : Defined as earnings before interest, taxes, depreciation and amortization (“EBITDA”) . We believe that EBITDA is an appropriate measure of our ability to incur and service debt . EBITDA should not be considered as an alternative to cash flows from operating activities, as a measure of our liquidity or as an alternative to net income as an indicator of our operating activities . FFO : We define FFO, a non - GAAP measure, consistent with the standards established over time by the Board of Governors of NAREIT, as restated in a White Paper approved by the Board of Governors of NAREIT effective in December 2018 (the “White Paper”) . The White Paper defines FFO as net income or loss computed in accordance with GAAP, excluding depreciation and amortization related to real estate, gains and losses from the sale of certain real estate assets, gains and losses from change in control and impairment write - downs of certain real estate assets and investments in entities when the impairment is directly attributable to decreases in the value of depreciable real estate held by the entity . Adjustments for unconsolidated partnerships and joint ventures are calculated to reflect FFO . Our FFO calculation complies with NAREIT’s definition . Investment Grade : As used herein, investment grade includes both actual investment grade ratings of the tenant or guarantor, if available, or implied investment grade . Implied investment grade may include actual ratings of tenant parent, guarantor parent (regardless of whether or not the parent has guaranteed the tenant’s obligation under the lease) or by using a proprietary Moody’s analytical tool, which generates an implied rating by measuring a company’s probability of default . Ratings information is as of September 30 , 2022 . Top 10 tenants are 59 % actual investment grade rated and 20 % implied investment grade rated . Leasing Pipeline : Includes ( i ) all leases fully executed by both parties as of September 30 , 2022 , where the tenant has yet to take possession as of such date (ii) all leases fully executed by both parties as of November 1 , 2022 , but after September 30 , 2022 , and (iii) all leases under negotiation with an executed LOI by both parties as of November 1 , 2022 . This represents two executed leases where the tenant has yet to take possession and totaled 14 , 280 square feet . Leasing pipeline should not be considered an indication of future performance . Net Debt : Total debt of $ 399 . 5 million less cash and cash equivalents of $ 7 . 4 million (excluding restricted cash) as of September 30 , 2022 . Net Leverage : For the Company and for September 30 , 2022 , represents total mortgage notes payable, gross of $ 399 . 5 million minus cash and cash equivalents of $ 7 . 4 million (excluding restricted cash) divided by total assets of $ 802 . 2 million plus accumulated depreciation and amortization of $ 171 . 5 million as of September 30 , 2022 . For peers, represents total debt, plus preferred equity, minus cash and cash equivalents divided by total assets plus accumulated depreciation and amortization, at cost, as of September 30 , 2022 . NOI : Defined as a non - GAAP financial measure used by us to evaluate the operating performance of our real estate . NOI is equal to total revenues, excluding contingent purchase price consideration, less property operating and maintenance expense . NOI excludes all other items of expense and income included in the financial statements in calculating net (loss) . Occupancy : Represents percentage of square footage of which the tenant has taken possession of divided by the respective total rentable square feet as of the date or period end indicated . Original Cash Rent : Refers to contractual rents on a cash basis due from tenants as stipulated in their originally executed lease agreement based on leases in place for the applicable period, prior to any rent deferral agreement . Remaining Lease Term : Represents the outstanding tenant lease term . Weighted based on Annualized Straight - Line rent as of the date or period end indicated .
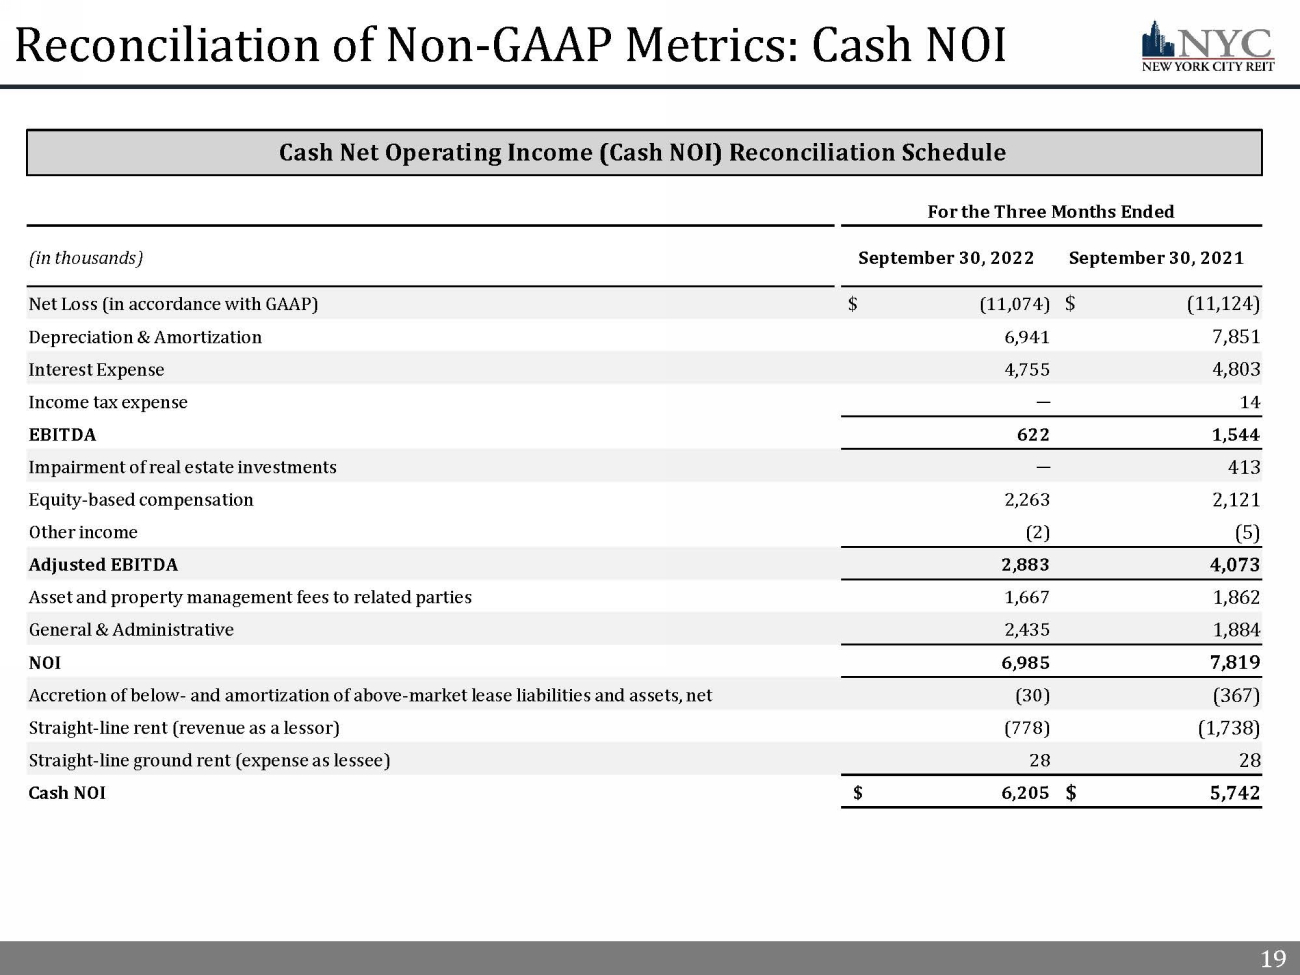
19 19 Reconciliation of Non - GAAP Metrics: Cash NOI For the Three Months Ended (in thousands) September 30, 2022 September 30, 2021 Net Loss (in accordance with GAAP) $ (11,074) $ (11,124) Depreciation & Amortization 6,941 7,851 Interest Expense 4,755 4,803 Income tax expense ─ 14 EBITDA 622 1,544 Impairment of real estate investments ─ 413 Equity - based compensation 2,263 2,121 Other income (2) (5) Adjusted EBITDA 2,883 4,073 Asset and property management fees to related parties 1,667 1,862 General & Administrative 2,435 1,884 NOI 6,985 7,819 Accretion of below - and amortization of above - market lease liabilities and assets, net (30) (367) Straight - line rent (revenue as a lessor) (778) (1,738) Straight - line ground rent (expense as lessee) 28 28 Cash NOI $ 6,205 $ 5,742 Cash Net Operating Income (Cash NOI) Reconciliation Schedule
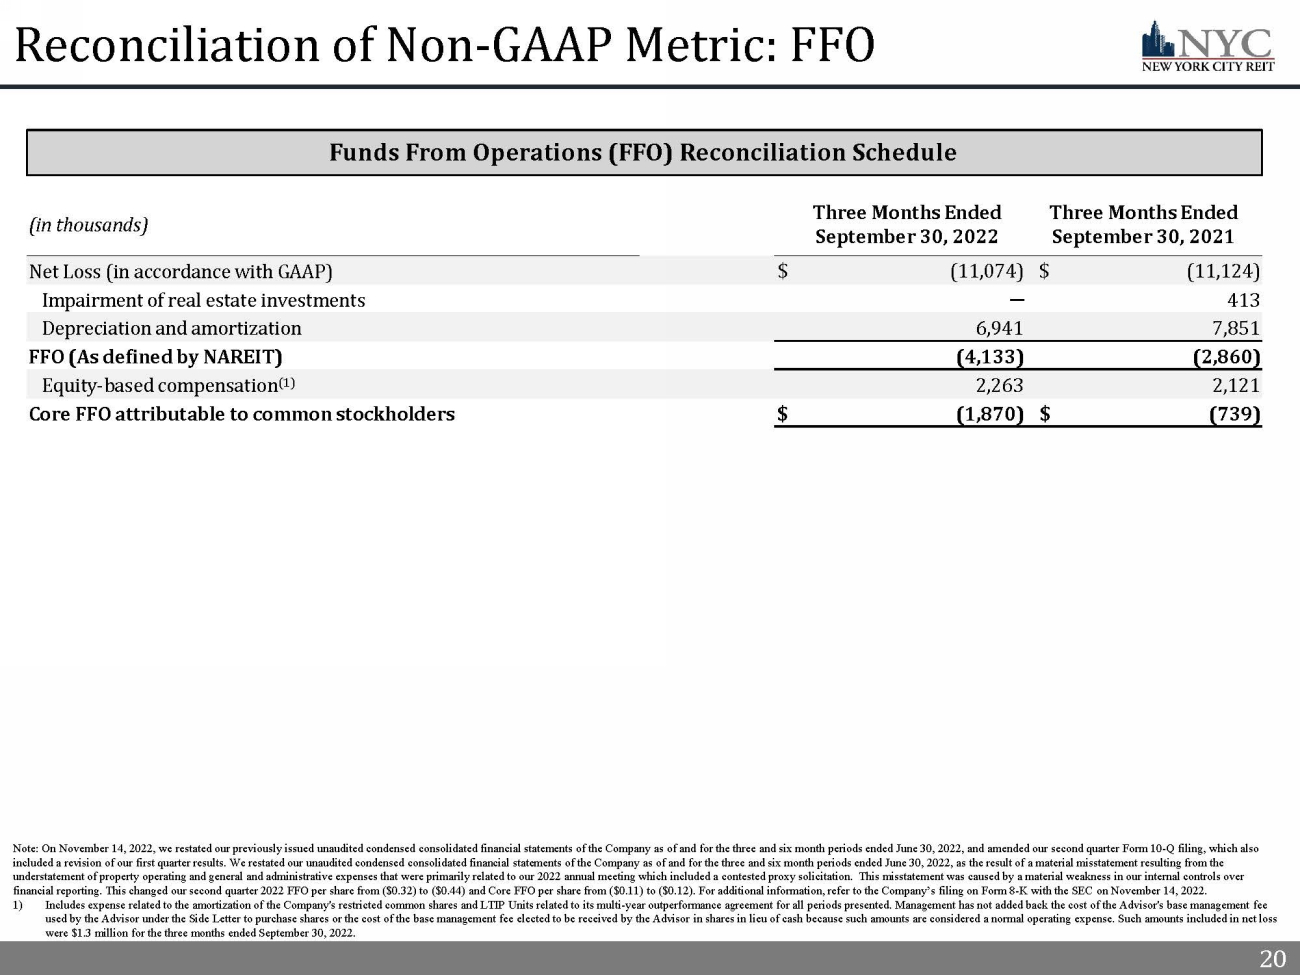
20 20 Reconciliation of Non - GAAP Metric: FFO (in thousands) Three Months Ended September 30, 2022 Three Months Ended September 30, 2021 Net Loss (in accordance with GAAP) $ (11,074) $ (11,124) Impairment of real estate investments ─ 413 Depreciation and amortization 6,941 7,851 FFO (As defined by NAREIT) (4,133) (2,860) Equity - based compensation (1) 2,263 2,121 Core FFO attributable to common stockholders $ (1,870) $ (739) Funds From Operations (FFO) Reconciliation Schedule Note: On November 14, 2022, we restated our previously issued unaudited condensed consolidated financial statements of the Co mpa ny as of and for the three and six month periods ended June 30, 2022, and amended our second quarter Form 10 - Q filing, which als o included a revision of our first quarter results. We restated our unaudited condensed consolidated financial statements of th e C ompany as of and for the three and six month periods ended June 30, 2022, as the result of a material misstatement resulting fro m the understatement of property operating and general and administrative expenses that were primarily related to our 2022 annual m eet ing which included a contested proxy solicitation. This misstatement was caused by a material weakness in our internal contr ols over financial reporting. This changed our second quarter 2022 FFO per share from ($0.32) to ($0.44) and Core FFO per share from ( $0. 11) to ($0.12). For additional information, refer to the Company’s filing on Form 8 - K with the SEC on November 14, 2022. 1) Includes expense related to the amortization of the Company's restricted common shares and LTIP Units related to its multi - year outperformance agreement for all periods presented. Management has not added back the cost of the Advisor's base management f ee used by the Advisor under the Side Letter to purchase shares or the cost of the base management fee elected to be received by the Advisor in shares in lieu of cash because such amounts are considered a normal operating expens e. Such amounts included in net loss were $1.3 million for the three months ended September 30, 2022.
21 21 Legal Notices
22 22 Important Additional Information and Where to Find It References in this presentation to the “Company,” “we,” “us” and “our” refer to New York City REIT, Inc. (“NYC”) and its cons oli dated subsidiaries. This presentation contains estimates and information concerning the Company’s industry and the Company’s peer companies that are based on industry publications, reports and peer company public filings. The Company has not independently verified the accuracy of the data co nta ined in these industry publications, reports and peer company public filings. These estimates and information involve a number of assumptions and li mit ations, and you are cautioned not to rely on or give undue weight to this information. The industry in which we operate is subject to a high deg ree of uncertainty and risk due to variety of factors, including those described in the “Risk Factors” and “Management's Discussion and Analysis of Financial Co ndi tion and Results of Operations” sections of the Company’s Annual Report on Form 10 - K filed with the SEC on March 18, 2022 and all other filings file d with the SEC after that date. These and other factors could cause results to differ materially from those expressed in these publications and reports . The majority of the concessions granted to our tenants as a result of the COVID - 19 pandemic are rent deferrals or temporary rent abatements with the original lease term unchanged and collection of deferred rent deemed probable. As a result of relief granted by the FASB and the SEC related to lease modification accounting, rental revenue used to calculate Net Income, NAREIT FFO, Core FFO, NOI, Cash NOI, EBITDA, and Adjust ed EBITDA has not been, and we do not expect it to be, significantly impacted by these types of deferrals. 22
23 23 Forward Looking Statements Certain statements made in this presentation are “forward - looking statements” (as defined in Section 21E of the Exchange Act), w hich reflect the expectations of the Company regarding future events. You can identify forward - looking statements by the use of forward looking terminology such as “believes,” “expects,” “may,” “will,” “wou ld,” “could,” “should,” “seeks,” “intends,” “plans,” “projects,” “estimates,” “anticipates,” “predicts,” or “potential” or the negative of these words and phrases or similar words or phrases. The forward - lo oking statements involve a number of risks, uncertainties and other factors that could cause actual results to differ materially from those contained in the forward - looking statements. These forward - looking st atements include, but are not limited to, market and other expectations, objectives, and intentions, as well as any other statements that are not historical facts. Our potential risks and uncertainties are presented in the section titled “Item 1A. Risk Factors” in the Company’s Annual Rep ort on Form 10 - K filed with the SEC on March 18, 2022 as well as other subsequent reports filed with the SEC including, but not limited to, the Current Report on Form 8 - K, Amendment 1 to the Quarterly Report o n Form 10 - Q as of and for the period ended June 30, 2022 and our Quarterly Report as of and for the period ended September 30, 2022 all filed on November 14, 2022. Forward - looking statements speak as of the date they were made and we disclaim any obligation to update and revise statements contained in these materials to reflect changed assumptions, the occurrence of unanticipated events or chan ges to future operating results over time, unless required by law. The following are some of the risks and uncertainties relating to us, although not all risks and uncertainties, that could cause our actual re sults to differ materially from those presented in our forward - looking statements: • Our properties may be adversely affected by economic cycles and risks inherent to New York City. • Our ability to fund our capital requirements will depend on, among other things, the amount of cash we are able to generate f rom our operations, which is dependent on, among other things, the impact of the COVID - 19 pandemic on our tenants and other factors outside of our control, and our ability to access capital from outside so urces, which may not be available on acceptable or favorable terms, or at all. • Certain of our unaudited financial statements were required to be restated or revised and our management and audit committee has identified a material weakness in our internal control over financial reporting. • While we have suspended our policy regarding dividends, in the event we resume payment of dividends, and if we are not able t o g enerate sufficient cash flows from operations, we may continue to fund dividends from sources other than cash flow from operations and may have to reduce the amount of dividends we pay or identify ot her financing sources. • Funding dividends from other sources such as borrowings, asset sales or equity issuances limits the amount we can use for pro per ty acquisitions, investments and other corporate purposes. • We are subject to risks associated with a pandemic, epidemic or outbreak of a contagious disease, such as the global COVID - 19 pa ndemic, including negative impacts on our tenants and their respective businesses. • Geopolitical instability due to the ongoing military conflict between Russia and Ukraine may impact the economic conditions i n t he United States. • Inflation and continuing increases in the inflation rate may have an adverse effect on our investments and results of operati ons . • Increases in interest rates could increase the amount of our debt payments. • Market and economic challenges experienced by the U.S. and global economies may adversely impact aspects of our operating res ult s and operating condition. • We depend on tenants for our rental revenue and, accordingly, our rental revenue is dependent upon the success and economic v iab ility of our tenants. Lease terminations, tenant default and bankruptcy have adversely affected and could in the future adversely affect the income and cash flow produced by our properties. • In owning properties we may experience, among other things, unforeseen costs associated with complying with laws and regulati ons and other costs, potential difficulties selling properties and potential damages or losses resulting from climate change. • We depend on our Advisor and our Property Manager to provide us with executive officers, key personnel and all services requi red for us to conduct our operations and our operating performance may be impacted by any adverse changes in the financial health or reputation of our Advisor and our Property Manager. • All of our executive officers face conflicts of interest, such as conflicts created by the terms of our agreements with the A dvi sor and compensation payable thereunder, conflicts allocating investment opportunities to us, and conflicts in allocating their time and attention to our matters. Conflicts that arise may not be res olv ed in our favor and could result in actions that are adverse to us. • We have long - term agreements with our Advisor and its affiliates that may be terminated only in limited circumstances and may re quire us to pay a termination fee in some cases. • We have substantial indebtedness and may be unable to repay, refinance, restructure or extend our indebtedness as it becomes due . We may incur additional indebtedness in the future. • We have been in breach of several of our mortgage loans during 2021and 2022 encumbering certain of our properties for multipl e q uarters and have been or will be unable to use excess cash flow, if any, from those properties until the breaches are cured. If we experience additional lease terminations, it is possible that certa in of the covenants on other loans may be breached and we may also become restricted from accessing excess cash flows from those properties. • The stockholder rights plan adopted by our board of directors, our classified board and other aspects of our corporate struct ure and Maryland law may discourage a third party from acquiring us in a manner that might result in a premium price to our stockholders. • Certain provisions in our bylaws and agreements and the share ownership waivers granted to Bellevue, the Advisor and its affi lia tes may deter, delay or prevent a change in our control. • Restrictions on share ownership contained in our charter may inhibit market activity in shares of our stock and restrict our bus iness combination opportunities. • We may fail to continue to qualify as a REIT. 23