Exhibit 99.1
NEW YORK CITY REIT 2 nd Quarter 2019 Investor Presentation
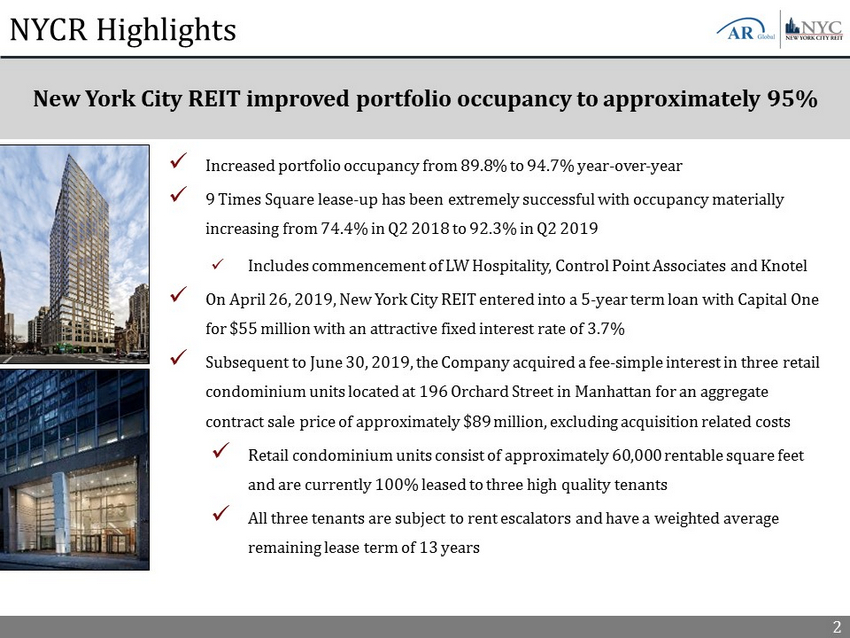
2 NYCR Highlights x Increased portfolio occupancy from 89.8% to 94.7% year - over - year x 9 Times Square lease - up has been extremely successful with occupancy materially increasing from 74.4% in Q2 2018 to 92.3% in Q2 2019 x Includes commencement of LW Hospitality, Control Point Associates and Knotel x On April 26, 2019, New York City REIT entered into a 5 - year term loan with Capital One for $55 million with an attractive fixed interest rate of 3.7% x Subsequent to June 30, 2019, the Company acquired a fee - simple interest in three retail condominium units located at 196 Orchard Street in Manhattan for an aggregate contract sale price of approximately $89 million, excluding acquisition related costs x Retail condominium units consist of approximately 60,000 rentable square feet and are currently 100% leased to three high quality tenants x All three tenants are subject to rent escalators and have a weighted average remaining lease term of 13 years New York City REIT improved portfolio occupancy to approximately 95%
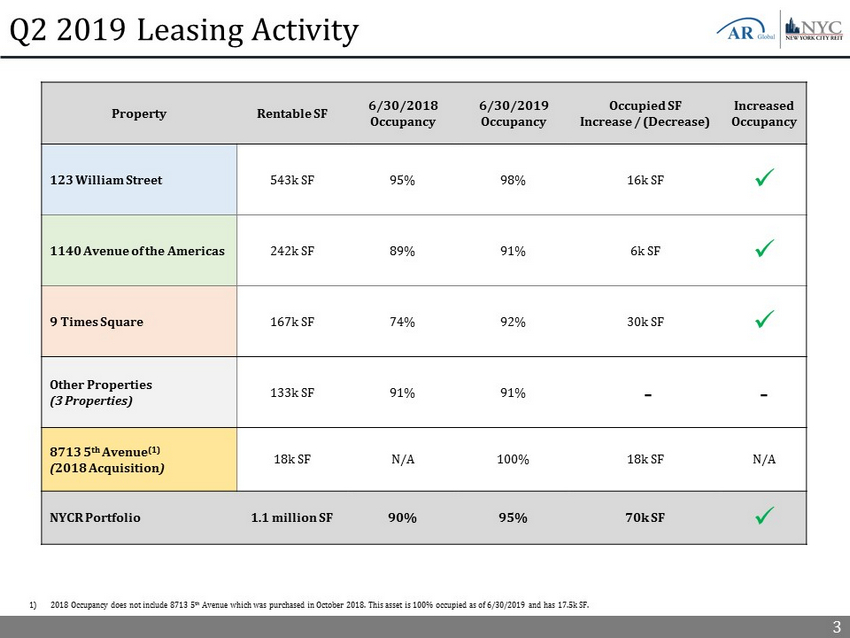
3 Q2 2019 Leasing Activity Property Rentable SF 6/30/2018 Occupancy 6/30/2019 Occupancy Occupied SF Increase / (Decrease) Increased Occupancy 123 William Street 543k SF 95% 98% 16k SF x 1140 Avenue of the Americas 242k SF 89% 91% 6k SF x 9 Times Square 167k SF 74% 92% 30k SF x Other Properties (3 Properties) 133k SF 91% 91% - - 8713 5 th Avenue (1) ( 2018 Acquisition ) 18k SF N/A 100% 18k SF N/A NYCR Portfolio 1.1 million SF 90% 95% 70k SF x 1) 2018 Occupancy does not include 8713 5 th Avenue which was purchased in October 2018. This asset is 100% occupied as of 6/30/2019 and has 17.5k SF.
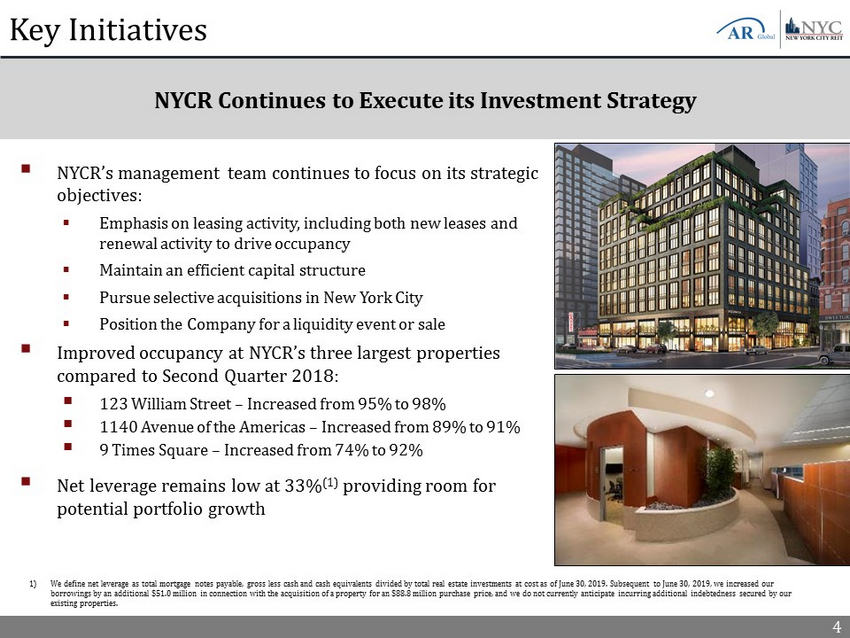
4 Key Initiatives 1) We define net leverage as total mortgage notes payable, gross less cash and cash equivalents divided by total real estate inv est ments at cost as of June 30, 2019. Subsequent to June 30, 2019, we increased our borrowings by an additional $51.0 million in connection with the acquisition of a property for an $88.8 million purchase pric e, and we do not currently anticipate incurring additional indebtedness secured by our existing properties. NYCR Continues to Execute its Investment Strategy ▪ NYCR’s management team continues to focus on its strategic objectives: ▪ Emphasis on leasing activity, including both new leases and renewal activity to drive occupancy ▪ Maintain an efficient capital structure ▪ Pursue selective acquisitions in New York City ▪ Position the Company for a liquidity event or sale ▪ Improved occupancy at NYCR’s three largest properties compared to Second Quarter 2018: ▪ 123 William Street – Increased from 95% to 98% ▪ 1140 Avenue of the Americas – Increased from 89% to 91% ▪ 9 Times Square – Increased from 74% to 92% ▪ Net leverage remains low at 33% (1) providing room for potential portfolio growth
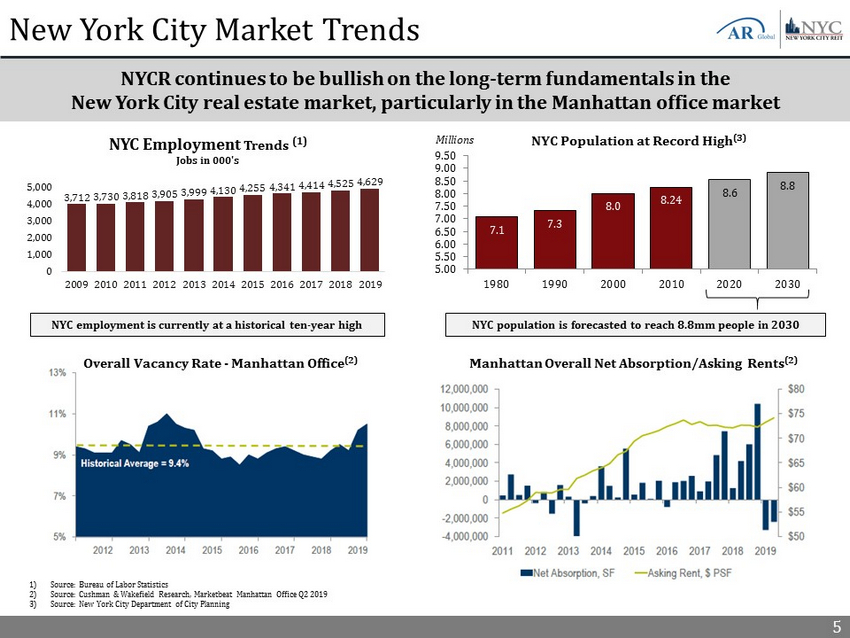
5 NYCR continues to be bullish on the long - term fundamentals in the New York City real estate market, particularly in the Manhattan office market New York City Market Trends Manhattan Overall Net Absorption/Asking Rents (2) NYC population is forecasted to reach 8.8mm people in 2030 Overall Vacancy Rate - Manhattan Office (2) 7.1 7.3 8.0 8.24 8.6 8.8 5.00 5.50 6.00 6.50 7.00 7.50 8.00 8.50 9.00 9.50 1980 1990 2000 2010 2020 2030 Millions NYC employment is currently at a historical ten - year high NYC Population at Record High (3) 3,712 3,730 3,818 3,905 3,999 4,130 4,255 4,341 4,414 4,525 4,629 0 1,000 2,000 3,000 4,000 5,000 2009 2010 2011 2012 2013 2014 2015 2016 2017 2018 2019 NYC Employment Trends (1) Jobs in 000's 1) Source: Bureau of Labor Statistics 2) Source: Cushman & Wakefield Research, Marketbeat Manhattan Office Q2 2019 3) Source: New York City Department of City Planning
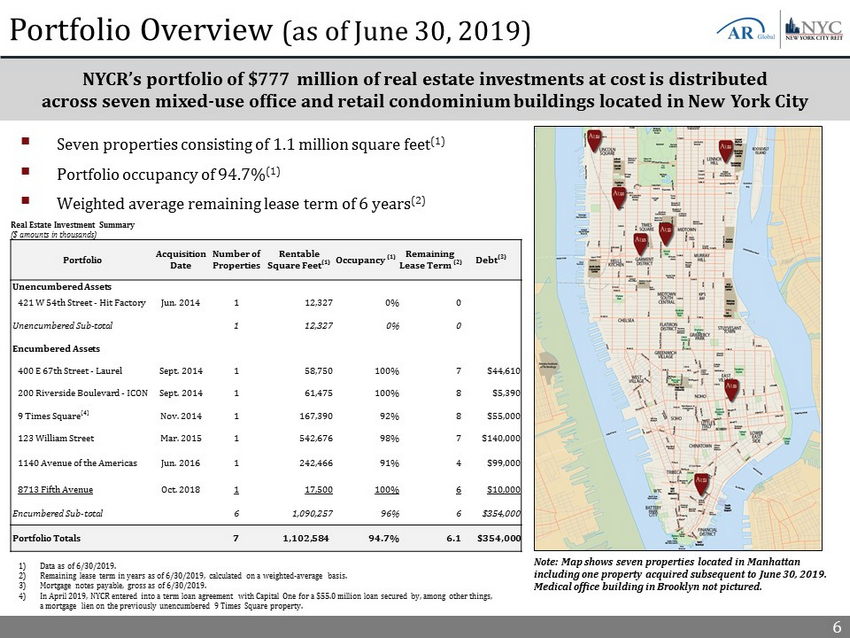
6 Portfolio Overview (as of June 30, 2019) 1) Data as of 6/30/2019. 2) Remaining lease term in years as of 6/30/2019, calculated on a weighted - average basis. 3) Mortgage notes payable, gross as of 6/30/2019. 4) In April 2019, NYCR entered into a term loan agreement with Capital One for a $55.0 million loan secured by, among other thin gs, a mortgage lien on the previously unencumbered 9 Times Square property. ▪ Seven properties consisting of 1.1 million square feet (1) ▪ Portfolio occupancy of 94.7% (1) ▪ Weighted average remaining lease term of 6 years (2) NYCR’s portfolio of $777 million of real estate investments at cost is distributed across seven mixed - use office and retail condominium buildings located in New York City Note: Map shows seven properties located in Manhattan including one property acquired subsequent to June 30, 2019. Medical office building in Brooklyn not pictured. Real Estate Investment Summary ($ amounts in thousands) Portfolio Acquisition Date Number of Properties Rentable Square Feet (1) Occupancy (1) Remaining Lease Term (2) Debt (3) Unencumbered Assets 421 W 54th Street - Hit Factory Jun. 2014 1 12,327 0% 0 Unencumbered Sub - total 1 12,327 0% 0 Encumbered Assets 400 E 67th Street - Laurel Sept. 2014 1 58,750 100% 7 $44,610 200 Riverside Boulevard - ICON Sept. 2014 1 61,475 100% 8 $5,390 9 Times Square (4) Nov. 2014 1 167,390 92% 8 $55,000 123 William Street Mar. 2015 1 542,676 98% 7 $140,000 1140 Avenue of the Americas Jun. 2016 1 242,466 91% 4 $99,000 8713 Fifth Avenue Oct. 2018 1 17,500 100% 6 $10,000 Encumbered Sub - total 6 1,090,257 96% 6 $354,000 Portfolio Totals 7 1,102,584 94.7% 6.1 $354,000
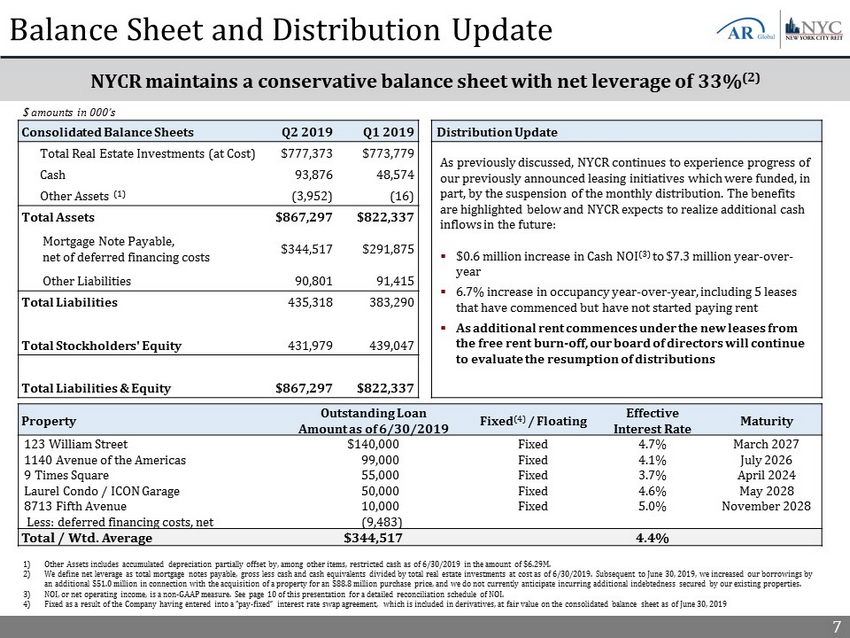
7 Balance Sheet and Distribution Update $ amounts in 000’s 1) Other Assets includes accumulated depreciation partially offset by, among other items, restricted cash as of 6/30/2019 in the am ount of $ 6.29 M. 2) We define net leverage as total mortgage notes payable, gross less cash and cash equivalents divided by total real estate investments at cost as of 6/3 0/2 019 . Subsequent to June 30, 2019, we increased our borrowings by an additional $51.0 million in connection with the acquisition of a property for an $88.8 million purchase price, and we do n ot currently anticipate incurring additional indebtedness secured by our existing properties. 3) NOI, or net operating income, is a non - GAAP measure. See page 10 of this presentation for a detailed reconciliation schedule of NOI. 4) Fixed as a result of the Company having entered into a “pay - fixed” interest rate swap agreement, which is included in derivative s, at fair value on the consolidated balance sheet as of June 30, 2019 Consolidated Balance Sheets Q2 2019 Q1 2019 Total Real Estate Investments (at Cost) $777,373 $773,779 Cash 93,876 48,574 Other Assets (1) (3,952) (16) Total Assets $867,297 $822,337 Mortgage Note Payable, net of deferred financing costs $344,517 $291,875 Other Liabilities 90,801 91,415 Total Liabilities 435,318 383,290 Total Stockholders' Equity 431,979 439,047 Total Liabilities & Equity $867,297 $822,337 Property Outstanding Loan Amount as of 6/30/2019 Fixed (4) / Floating Effective Interest Rate Maturity 123 William Street $140,000 Fixed 4.7% March 2027 1140 Avenue of the Americas 99,000 Fixed 4.1% July 2026 9 Times Square 55,000 Fixed 3.7% April 2024 Laurel Condo / ICON Garage 50,000 Fixed 4.6% May 2028 8713 Fifth Avenue 10,000 Fixed 5.0% November 2028 Less: deferred financing costs, net (9,483) Total / Wtd. Average $344,517 4.4% Distribution Update As previously discussed, NYCR continues to experience progress of our previously announced leasing initiatives which were funded, in part, by the suspension of the monthly distribution. The benefits are highlighted below and NYCR expects to realize additional cash inflows in the future: ▪ $0.6 million increase in Cash NOI (3) to $7.3 million year - over - year ▪ 6.7% increase in occupancy year - over - year, including 5 leases that have commenced but have not started paying rent ▪ As additional rent commences under the new leases from the free rent burn - off, our board of directors will continue to evaluate the resumption of distributions NYCR maintains a conservative balance sheet with net leverage of 33% (2)
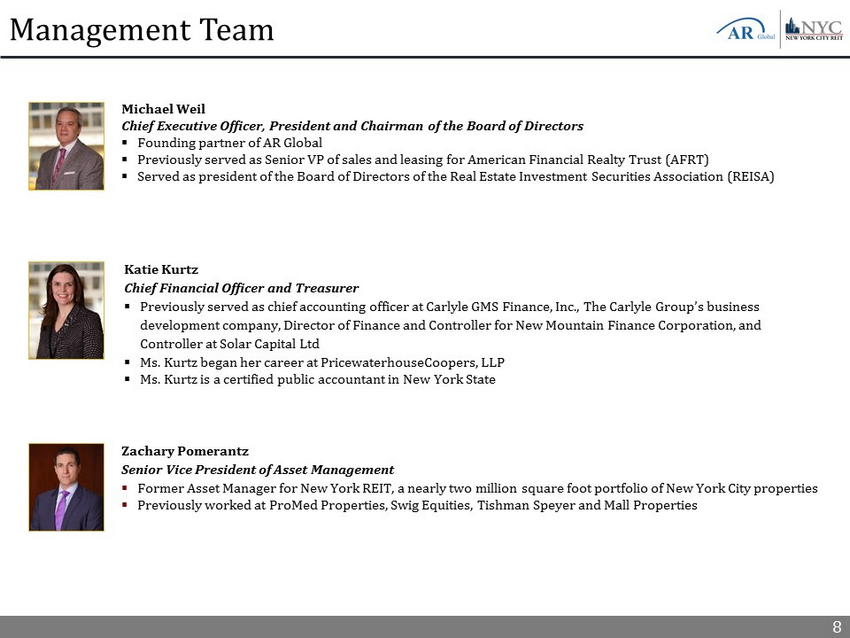
8 Management Team Katie Kurtz Chief Financial Officer and Treasurer ▪ Previously served as chief accounting officer at Carlyle GMS Finance, Inc., The Carlyle Group’s business development company, Director of Finance and Controller for New Mountain Finance Corporation, and Controller at Solar Capital Ltd ▪ Ms. Kurtz began her career at PricewaterhouseCoopers, LLP ▪ Ms. Kurtz is a certified public accountant in New York State Michael Weil Chief Executive Officer, President and Chairman of the Board of Directors ▪ Founding partner of AR Global ▪ Previously served as Senior VP of sales and leasing for American Financial Realty Trust (AFRT) ▪ Served as president of the Board of Directors of the Real Estate Investment Securities Association (REISA) Zachary Pomerantz Senior Vice President of Asset Management ▪ Former Asset Manager for New York REIT, a nearly two million square foot portfolio of New York City properties ▪ Previously worked at ProMed Properties, Swig Equities, Tishman Speyer and Mall Properties
9 Supplemental Information On March 13 , 2019 , the Company filed an amendment to its charter changing its name from American Realty Capital New York City REIT, Inc . to New York City REIT, Inc . On April 26 , 2019 , the Company, entered into a term loan agreement with Capital One, National Association, as administrative agent, and the other lenders party thereto for a $ 55 . 0 million loan with an interest rate fixed at 3 . 6725 % by a swap agreement . The loan has a maturity date of April 26 , 2024 , and requires monthly interest - only payments, with the principal balance due on the maturity date . The loan is secured by, among other things, a mortgage lien on the Company’s previously unencumbered 9 Times Square property . Subsequent to June 30 , 2019 , the Company acquired a fee - simple interest in three condominium units located at 196 Orchard Street in Manhattan for an aggregate contract sale price of approximately $ 88 . 8 million, excluding acquisition related costs . The Company funded $ 51 . 0 million of the purchase price with proceeds from a loan and funded the remaining $ 37 . 8 million of the purchase price from cash on hand, including a portion of the proceeds from the April 2019 loan described above . Note: Refer to NYCR’s Quarterly Report on Form 10 - Q for the quarter ended June 30, 2019 filed on August 14, 2019 for a full desc ription.
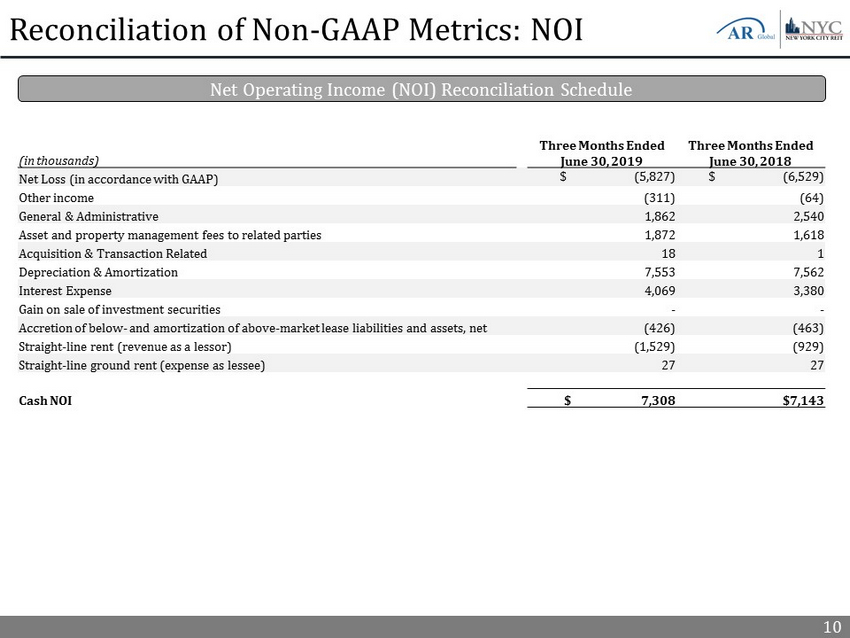
10 Reconciliation of Non - GAAP Metrics: NOI Net Operating Income (NOI) Reconciliation Schedule (in thousands) Three Months Ended June 30, 2019 Three Months Ended June 30, 2018 Net Loss (in accordance with GAAP) $ (5,827) $ (6,529) Other income (311) (64) General & Administrative 1,862 2,540 Asset and property management fees to related parties 1,872 1,618 Acquisition & Transaction Related 18 1 Depreciation & Amortization 7,553 7,562 Interest Expense 4,069 3,380 Gain on sale of investment securities - - Accretion of below - and amortization of above - market lease liabilities and assets, net (426) (463) Straight - line rent (revenue as a lessor) (1,529) (929) Straight - line ground rent (expense as lessee) 27 27 Cash NOI $ 7,308 $7,143
11 Important Information Risk Factors For a discussion of the risks which should be considered in connection with our company, see the section entitled “Item 1 A . Risk Factors” in New York City REIT, Inc . ’s (the “Company” or “NYCR”) Annual Report on Form 10 - K filed with the U . S . Securities and Exchange Commission (“SEC”) on March 15 , 2019 . Forward - Looking Statements This presentation may contain forward - looking statements . These forward - looking statements involve substantial risks and uncertainties . Actual results or events could differ materially from the plans, intentions and expectations disclosed in the forward - looking statements the Company makes . You can identify forward - looking statements by the use of forward looking terminology such as “believes,” “expects,” “may,” “will,” “would,” “could,” “should,” “seeks,” “intends,” “plans,” “projects,” “estimates,” “anticipates,” “predicts,” or “potential” or the negative of these words and phrases or similar words or phrases . Please review the end of this presentation and the Company’s Annual Report on Form 10 - K and Quarterly Reports on Form 10 - Q for a more complete list of risk factors, as well as a discussion of forward - looking statements .
12 Risk Factors There are risks associated with an investment in our Company . The following is a summary of some of these risks . For a discussion of the risks which should be considered in connection with our Company, see the section entitled “Item 1 A . Risk Factors” in the Company’s Annual Report on Form 10 - K filed with the SEC on March 15 , 2019 . • All of our executive officers are also officers, managers or holders of a direct or indirect controlling interest in our advisor, New York City Advisors, LLC (our "Advisor") and other entities affiliated with AR Global Investments, LLC (the successor business to AR Capital, LLC, "AR Global") ; as a result, our executive officers, our Advisor and its affiliates face conflicts of interest, including significant conflicts created by our Advisor’s compensation arrangements with us and other investor entities advised by AR Global affiliates, and conflicts in allocating time among these entities and us, which could negatively impact our operating results ; • We depend on tenants for our revenue and, accordingly, our revenue is dependent upon the success and economic viability of our tenants ; • We may not be able to achieve our rental rate objectives on new and renewal leases and our expenses could be greater, which may impact operations ; • Effective March 1 , 2018 , we ceased paying distributions . There can be no assurance we will be able to resume paying distributions at our previous level or at all ; • Our properties may be adversely affected by economic cycles and risks inherent to the New York metropolitan statistical area ("MSA"), especially New York City ; • We are obligated to pay fees, which may be substantial, to our Advisor and its affiliates ; • We may fail to continue to qualify to be treated as a real estate investment trust for United States federal income tax purposes ("REIT") ; • Because investment opportunities that are suitable for us may also be suitable for other AR Global - advised programs or investors, our Advisor and its affiliates may face conflicts of interest relating to the purchase of properties and other investments and such conflicts may not be resolved in our favor, meaning that we could invest in less attractive assets, which could reduce the investment return to our stockholders ; • No public market currently exists, or may ever exist, for shares of our common stock and our shares are, and may continue to be, illiquid ; • Our stockholders are limited in their ability to sell their shares pursuant to our share repurchase program (the "SRP") which is currently suspended and may have to hold their shares for an indefinite period of time ; • If we and our Advisor are unable to find suitable investments, then we may not be able to achieve our investment objectives, or resume paying distributions ; and • As of June 30 , 2019 , we owned only seven properties and therefore have limited diversification .

13 ▪ For account information, including balances and the status of submitted paperwork, please call us at (866) 902 - 0063 ▪ Financial Advisors may view client accounts, statements and tax forms at www.dstvision.com ▪ Shareholders may access their accounts at www.ar - global.com NewYorkCityREIT.com