| FREE WRITING PROSPECTUS | ||
| FILED PURSUANT TO RULE 433 | ||
| REGISTRATION FILE NO.: 333-172366-12 | ||
 |  |
Free Writing Prospectus
Structural and Collateral Term Sheet
$1,255,596,034
(Approximate Aggregate Cut-off Date Balance of Mortgage Pool)
$1,103,355,000
(Approximate Aggregate Principal Balance of Offered Certificates)
WFRBS Commercial Mortgage Trust 2014-LC14
as Issuing Entity
Wells Fargo Commercial Mortgage Securities, Inc.
as Depositor
Wells Fargo Bank, National Association
Ladder Capital Finance LLC
Rialto Mortgage Finance, LLC
The Royal Bank of Scotland
as Sponsors and Mortgage Loan Sellers
Commercial Mortgage Pass-Through Certificates
Series 2014-LC14
January 27, 2014
| WELLS FARGO SECURITIES | RBS | |
Co-Lead Manager and Co-Bookrunner | Co-Lead Manager and Co-Bookrunner | |
Deutsche Bank Securities Co-Manager | ||
STATEMENT REGARDING THIS FREE WRITING PROSPECTUS
The depositor has filed a registration statement (including a prospectus) with the Securities and Exchange Commission (‘‘SEC’’) (SEC File No. 333-172366) for the offering to which this communication relates. Before you invest, you should read the prospectus in the registration statement and other documents the depositor has filed with the SEC for more complete information about the depositor, the issuing entity and this offering. You may get these documents for free by visiting EDGAR on the SEC Web site at www.sec.gov. Alternatively, the depositor, any underwriter, or any dealer participating in the offering will arrange to send you the prospectus after filing if you request it by calling toll free 1-800-745-2063 (8 a.m. – 5 p.m. EST) or by emailing wfs.cmbs@wellsfargo.com.
Nothing in this document constitutes an offer of securities for sale in any other jurisdiction where the offer or sale is not permitted. The information contained herein is preliminary as of the date hereof, supersedes any such information previously delivered to you and will be superseded by any such information subsequently delivered and ultimately by the final prospectus relating to the securities. These materials are subject to change, completion, supplement or amendment from time to time.
STATEMENT REGARDING ASSUMPTIONS AS TO SECURITIES, PRICING ESTIMATES AND OTHER INFORMATION
The attached information contains certain tables and other statistical analyses (the “Computational Materials”) which have been prepared in reliance upon information furnished by the Mortgage Loan Sellers. Numerous assumptions were used in preparing the Computational Materials, which may or may not be reflected herein. As such, no assurance can be given as to the Computational Materials’ accuracy, appropriateness or completeness in any particular context; or as to whether the Computational Materials and/or the assumptions upon which they are based reflect present market conditions or future market performance. The Computational Materials should not be construed as either projections or predictions or as legal, tax, financial or accounting advice. You should consult your own counsel, accountant and other advisors as to the legal, tax, business, financial and related aspects of a purchase of these securities. Any weighted average lives, yields and principal payment periods shown in the Computational Materials are based on prepayment and/or loss assumptions, and changes in such prepayment and/or loss assumptions may dramatically affect such weighted average lives, yields and principal payment periods. In addition, it is possible that prepayments or losses on the underlying assets will occur at rates higher or lower than the rates shown in the attached Computational Materials. The specific characteristics of the securities may differ from those shown in the Computational Materials due to differences between the final underlying assets and the preliminary underlying assets used in preparing the Computational Materials. The principal amount and designation of any security described in the Computational Materials are subject to change prior to issuance. None of Wells Fargo Securities, LLC (“WFS”), RBS Securities Inc. (“RBSSI”), Deutsche Bank Securities Inc. or any of their respective affiliates make any representation or warranty as to the actual rate or timing of payments or losses on any of the underlying assets or the payments or yield on the securities. The information in this presentation is based upon management forecasts and reflects prevailing conditions and management’s views as of this date, all of which are subject to change. In preparing this presentation, we have relied upon and assumed, without independent verification, the accuracy and completeness of all information available from public sources or which was provided to us by or on behalf of the Mortgage Loan Sellers or which was otherwise reviewed by us.
This free writing prospectus contains certain forward-looking statements. If and when included in this free writing prospectus, the words “expects”, “intends”, “anticipates”, “estimates” and analogous expressions and all statements that are not historical facts, including statements about our beliefs or expectations, are intended to identify forward-looking statements. Any forward-looking statements are made subject to risks and uncertainties which could cause actual results to differ materially from those stated. Those risks and uncertainties include, among other things, declines in general economic and business conditions, increased competition, changes in demographics, changes in political and social conditions, regulatory initiatives and changes in customer preferences, many of which are beyond our control and the control of any other person or entity related to this offering. The forward-looking statements made in this free writing prospectus are made as of the date stated on the cover. We have no obligation to update or revise any forward-looking statement.
Wells Fargo Securities is the trade name for certain capital markets and investment banking services of Wells Fargo & Company and its subsidiaries, including Wells Fargo Securities, LLC, member FINRA and SIPC, and Wells Fargo Bank, National Association.
RBS is a trade name for the investment banking business of RBSSI. Securities, syndicated loan arranging, financial advisory and other investment banking activities are performed by RBSSI and their securities affiliates. Lending, derivatives and other commercial banking activities are performed by The Royal Bank of Scotland plc and their banking affiliates. RBSSI is a member of SIPC, FINRA and the NYSE.
IRS CIRCULAR 230 NOTICE
THIS TERM SHEET IS NOT INTENDED OR WRITTEN TO BE USED, AND CANNOT BE USED, FOR THE PURPOSE OF AVOIDING U.S. FEDERAL, STATE OR LOCAL TAX PENALTIES. THIS TERM SHEET IS WRITTEN AND PROVIDED BY THE DEPOSITOR IN CONNECTION WITH THE PROMOTION OR MARKETING BY THE DEPOSITOR AND THE CO-LEAD BOOKRUNNING MANAGERS OF THE TRANSACTION OR MATTERS ADDRESSED HEREIN. INVESTORS SHOULD SEEK ADVICE BASED ON THEIR PARTICULAR CIRCUMSTANCES FROM AN INDEPENDENT TAX ADVISOR.
IMPORTANT NOTICE REGARDING THE OFFERED CERTIFICATES
The Offered Certificates referred to in these materials and the asset pool backing them are subject to modification or revision (including the possibility that one or more classes of certificates may be split, combined or eliminated at any time prior to issuance or availability of a final prospectus) and are offered on a “when, as and if issued” basis. Prospective investors should understand that, when considering the purchase of the Offered Certificates, a contract of sale will come into being no sooner than the date on which the relevant class of certificates has been priced and the underwriters have confirmed the allocation of certificates to be made to investors; any “indications of interest” expressed by any prospective investor, and any “soft circles” generated by the underwriters, will not create binding contractual obligations for such prospective investors, on the one hand, or the underwriters, the depositor or any of their respective agents or affiliates, on the other hand.
As a result of the foregoing, a prospective investor may commit to purchase certificates that have characteristics that may change, and each prospective investor is advised that all or a portion of the certificates referred to in these materials may be issued without all or certain of the characteristics described in these materials. The underwriters’ obligation to sell certificates to any prospective investor is conditioned on the certificates and the transaction having the characteristics described in these materials. If the underwriters determine that a condition is not satisfied in any material respect, such prospective investor will be notified, and neither the depositor nor the underwriters will have any obligation to such prospective investor to deliver any portion of the Offered Certificates which such prospective investor has committed to purchase, and there will be no liability between the underwriters, the depositor or any of their respective agents or affiliates, on the one hand, and such prospective investor, on the other hand, as a consequence of the non-delivery.
Each prospective investor has requested that the underwriters provide to such prospective investor information in connection with such prospective investor’s consideration of the purchase of the certificates described in these materials. These materials are being provided to each prospective investor for informative purposes only in response to such prospective investor’s specific request. The underwriters described in these materials may from time to time perform investment banking services for, or solicit investment banking business from, any company named in these materials. The underwriters and/or their affiliates or respective employees may from time to time have a long or short position in any security or contract discussed in these materials.
The information contained herein supersedes any previous such information delivered to any prospective investor and will be superseded by information delivered to such prospective investor prior to the time of sale.
IMPORTANT NOTICE RELATING TO AUTOMATICALLY-GENERATED EMAIL DISCLAIMERS
Any legends, disclaimers or other notices that may appear at the bottom of any email communication to which this free writing prospectus is attached relating to (1) these materials not constituting an offer (or a solicitation of an offer), (2) no representation that these materials are accurate or complete and may not be updated or (3) these materials possibly being confidential, are not applicable to these materials and should be disregarded. Such legends, disclaimers or other notices have been automatically generated as a result of these materials having been sent via Bloomberg or another system.
THE INFORMATION IN THIS STRUCTURAL AND COLLATERAL TERM SHEET IS NOT COMPLETE AND MAY BE AMENDED PRIOR TO THE TIME OF SALE. THIS TERM SHEET IS NOT AN OFFER TO SELL THESE SECURITIES AND IT IS NOT A SOLICITATION OF AN OFFER TO BUY THESE SECURITIES IN ANY JURISDICTION WHERE THE OFFER OR SALE IS NOT PERMITTED.
2
WFRBS Commercial Mortgage Trust 2014-LC14 | Certificate Structure |
I. Certificate Structure
Expected Ratings (DBRS/Fitch/Moody’s)(1) | Approximate Initial Certificate Principal Balance or Notional Amount(2) | Approx. Initial Credit Support(3) | Pass-Through Rate Description | Weighted Average Life (Years)(4) | Expected Principal Window(4) | Certificate Principal to Value Ratio(5) | Certificate Principal U/W NOI Debt Yield(6) | ||||||||||||
| Offered Certificates | |||||||||||||||||||
| A-1 | AAA(sf)/AAAsf/Aaa(sf) | $66,263,000 | 30.000% | (7) | 2.70 | 03/14 – 12/18 | 45.8% | 15.8% | |||||||||||
| A-2 | AAA(sf)/AAAsf/Aaa(sf) | $189,675,000 | 30.000% | (7) | 4.95 | 12/18 – 02/19 | 45.8% | 15.8% | |||||||||||
| A-3 | AAA(sf)/AAAsf/Aaa(sf) | $80,000,000 | 30.000% | (7) | 6.74 | 11/20 – 11/20 | 45.8% | 15.8% | |||||||||||
| A-4 | AAA(sf)/AAAsf/Aaa(sf) | $175,000,000 | 30.000% | (7) | 9.76 | 10/23 – 12/23 | 45.8% | 15.8% | |||||||||||
| A-5 | AAA(sf)/AAAsf/Aaa(sf) | $278,492,000 | 30.000% | (7) | 9.87 | 12/23 – 01/24 | 45.8% | 15.8% | |||||||||||
| A-SB | AAA(sf)/AAAsf/Aaa(sf) | $89,487,000 | 30.000% | (7) | 7.41 | 02/19 – 10/23 | 45.8% | 15.8% | |||||||||||
A-S(8) | AAA(sf)/AAAsf/Aaa(sf) | $95,739,000 | 22.375% | (7) | 9.90 | 01/24 – 01/24 | 50.8% | 14.2% | |||||||||||
| X-A | AAA(sf)/AAAsf/Aaa(sf) | $974,656,000 | (9) | N/A | Variable(10) | N/A | N/A | N/A | N/A | ||||||||||
| X-B | AAA(sf)/BBB-sf/NR | $193,048,000 | (11) | N/A | Variable(12) | N/A | N/A | N/A | N/A | ||||||||||
B(8) | AA(low)(sf)/AA-sf/Aa3(sf) | $81,614,000 | 15.875% | (7) | 9.92 | 01/24 – 02/24 | 55.0% | 13.1% | |||||||||||
C(8) | A(low)(sf)/A-sf/A3(sf) | $47,085,000 | 12.125% | (7) | 9.99 | 02/24 – 02/24 | 57.5% | 12.5% | |||||||||||
PEX(8) | A(low)(sf)/A-sf/A1(sf) | $224,438,000 | 12.125% | (7) | 9.93 | 01/24 – 02/24 | 57.5% | 12.5% | |||||||||||
| Non-Offered Certificates | |||||||||||||||||||
| X-C | AAA(sf)/NR/NR | $87,892,034 | (13) | N/A | Variable(14) | N/A | N/A | N/A | N/A | ||||||||||
| D | BBB(low)(sf)/BBB-sf/NR | $64,349,000 | 7.000% | (7) | 9.99 | 02/24 – 02/24 | 60.8% | 11.9% | |||||||||||
| E | BB(sf)/BBsf/NR | $21,973,000 | 5.250% | (7) | 9.99 | 02/24 – 02/24 | 62.0% | 11.6% | |||||||||||
| F | B(sf)/Bsf/NR | $12,556,000 | 4.250% | (7) | 9.99 | 02/24 – 02/24 | 62.6% | 11.5% | |||||||||||
| G | NR/NR/NR | $53,363,034 | 0.000% | (7) | 10.00 | 02/24 – 07/24 | 65.4% | 11.0% | |||||||||||
| Notes: | ||
| (1) | The expected ratings presented are those of DBRS, Inc. (“DBRS”), Fitch Ratings, Inc. (“Fitch”) and Moody’s Investors Service, Inc. (“Moody’s”) which the depositor hired to rate the offered certificates. One or more other nationally recognized statistical rating organizations that were not hired by the depositor may use information they receive pursuant to Rule 17g-5 under the Securities Exchange Act of 1934, as amended (the “Exchange Act”) or otherwise, to rate or provide market reports and/or published commentary related to the offered certificates. We cannot assure you as to what ratings a non-hired nationally recognized statistical rating organization would assign or that its reports will not express differing, possibly negative, views of the mortgage loans and/or the offered certificates. The ratings of each class of offered certificates address the likelihood of the timely distribution of interest and, except in the case of the Class X-A and Class X-B certificates, the ultimate distribution of principal due on those classes on or before the Rated Final Distribution Date. See “Risk Factors—Risks Related to the Offered Certificates— Ratings of the Certificates Have Substantial Limitations” and “Ratings” in the free writing prospectus, dated January 27, 2014 (the “Free Writing Prospectus”). | |
| (2) | The principal balances and notional amounts set forth in the table are approximate. The actual initial principal balances and notional amounts may be larger or smaller depending on the aggregate cut-off date principal balance of the mortgage loans definitively included in the pool of mortgage loans, which aggregate cut-off date principal balance may be as much as 5% larger or smaller than the amount presented in the Free Writing Prospectus. | |
| (3) | The approximate initial credit support with respect to the Class A-1, A-2, A-3, A-4, A-5 and A-SB Certificates represents the approximate credit enhancement for the Class A-1, A-2, A-3, A-4, A-5 and A-SB Certificates in the aggregate. The percentage indicated under the column “Approx. Initial Credit Support” with respect to the Class C Certificates and the Class PEX Certificates represents the approximate credit support for the Class C regular interest, which will have an initial outstanding principal balance on the closing date of $47,085,000. | |
| (4) | Weighted Average Lives and Expected Principal Windows are calculated based on an assumed prepayment rate of 0% CPR and the “Structuring Assumptions” described on Annex B to the Free Writing Prospectus. | |
| (5) | The Certificate Principal to Value Ratio for each Class of Certificates (other than the Class A-1, A-2, A-3, A-4, A-5 and A-SB Certificates and other than the Exchangeable Certificates) is calculated by dividing the aggregate principal balance of such class of certificates and all classes of certificates (other than the Exchangeable Certificates), if any, that are senior to such class, by the aggregate appraised value of approximately $1,920,243,504 (calculated as described in the Free Writing Prospectus) of the mortgaged properties securing the mortgage loans (excluding, with respect to each pari passu loan combination, a pro rata portion of the related appraised value allocated to the related companion loan(s) based on their cut-off date principal balance). The Certificate Principal to Value Ratios for each of the Class A-1, A-2, A-3, A-4, A-5 and A-SB Certificates are calculated by dividing the aggregate principal balance of the Class A-1, A-2, A-3, A-4, A-5 and A-SB Certificates by such aggregate appraised value (excluding, with respect to each pari passu loan combination, a pro rata portion of the related appraised value allocated to the related companion loan(s) based on their cut-off date principal balance). The Certificate Principal to Value Ratio for each of the Class A-S, B and C Certificates is calculated by dividing the aggregate principal balance of the Class A-S regular interest, the Class B regular interest or the Class C regular interest, as applicable, and all other classes of certificates (other than the Exchangeable Certificates) and the regular interests that are senior to such class, by such aggregate appraised value (excluding, with respect to each pari passu loan combination, a pro rata portion of the related appraised value allocated to the related companion loan(s) based on their cut-off date principal balance). The Certificate Principal to Value Ratio of the Class PEX Certificates is equal to the Certificate Principal to Value Ratio of the Class C Certificates. In any event, however, excess mortgaged property value associated with a mortgage loan will not be available to offset losses on any other mortgage loan (unless such mortgage loans are cross-collateralized and the cross-collateralization remains in effect). | |
| (6) | The Certificate Principal U/W NOI Debt Yield for each Class of Certificates (other than the Class A-1, A-2, A-3, A-4, A-5 and A-SB Certificates and other than the Exchangeable Certificates) is calculated by dividing the underwritten net operating income (which excludes, with respect to each pari passu loan combination, a pro rata portion of the related underwritten net operating income allocated to the related companion loan(s) based on their cut-off date principal balance) for the mortgage pool of approximately $138,437,218 (calculated as described in the Free Writing Prospectus) by the aggregate certificate principal balance of such class of certificates and all classes of certificates (other than the Exchangeable Certificates), if any, that are senior to such class of certificates. The Certificate Principal U/W NOI Debt Yield for each of the Class A-1, A-2, A-3, A-4, A-5 and A-SB Certificates is calculated by dividing such mortgage pool underwritten net operating income (which excludes, with respect to each pari passu loan combination, a pro rata portion of the related underwritten net operating income allocated to the related companion loan(s) based on their cut-off date principal balance) by the aggregate principal balance of the Class A-1, A-2, A-3, A-4, A-5 and A-SB Certificates. The Certificate Principal U/W NOI Debt Yield for each of the Class A-S, B and C Certificates is calculated by dividing the underwritten net operating income (which excludes, with respect to each pari passu loan combination, a pro rata portion of the related underwritten net operating income allocated to the related companion loan(s) based on their cut-off date principal balance) for the mortgage pool of approximately $138,437,218 (calculated as described in the Free Writing Prospectus) by the aggregate principal balance of the Class A-S regular interest, the Class B regular interest or the Class C regular interest, as applicable, and all other classes of certificates (other than the Exchangeable Certificates) and the regular interests that are senior to such class. The Certificate Principal U/W NOI Debt Yield of the Class PEX Certificates is equal to the Certificate Principal U/W NOI Debt Yield for the Class C Certificates. In any event, however, cash flow from each mortgaged property supports only the related | |
| THE INFORMATION IN THIS STRUCTURAL AND COLLATERAL TERM SHEET IS NOT COMPLETE AND MAY BE AMENDED PRIOR TO THE TIME OF SALE. THIS TERM SHEET IS NOT AN OFFER TO SELL THESE SECURITIES AND IT IS NOT A SOLICITATION OF AN OFFER TO BUY THESE SECURITIES IN ANY JURISDICTION WHERE THE OFFER OR SALE IS NOT PERMITTED. |
3
WFRBS Commercial Mortgage Trust 2014-LC14 | Certificate Structure |
| mortgage loan and will not be available to support any other mortgage loan (unless such mortgage loans are cross-collateralized and the cross-collateralization remains in effect). | ||
| (7) | The pass-through rates for the Class A-1, A-2, A-3, A-4, A-5, A-SB, A-S, B, C, D, E, F and G Certificates in each case will be one of the following: (i) a fixed rate per annum, (ii) the weighted average of the net mortgage interest rates on the mortgage loans for the related distribution date, (iii) a variable rate per annum equal to the lesser of (a) a fixed rate and (b) the weighted average of the net mortgage interest rates on the mortgage loans for the related distribution date or (iv) a variable rate per annum equal to the weighted average of the net mortgage interest rates on the mortgage loans for the related distribution date minus a specified percentage. For purposes of the calculation of the weighted average of the net mortgage interest rates on the mortgage loans for each distribution date, the mortgage interest rates will be adjusted as necessary to a 30/360 basis. The Class PEX Certificates will not have a pass-through rate, but will be entitled to receive the sum of the interest distributable on the Class PEX Components. The pass-through rate for the Class A-S Certificates, the Class A-S regular interest and the Class PEX Component A-S will, at all times, be the same. The pass-through rate for the Class B Certificates, the Class B regular interest and the Class PEX Component B will, at all times, be the same. The pass-through rate for the Class C Certificates, the Class C regular interest and the Class PEX Component C will, at all times, be the same. | |
| (8) | The Class A-S, B, C and PEX Certificates are “Exchangeable Certificates”. On the closing date, the upper-tier REMIC of the issuing entity will issue the Class A-S, B and C regular interests (each a “regular interest”) which will have outstanding principal balances on the closing date of $95,739,000, $81,614,000 and $47,085,000, respectively. The regular interests will be held in a grantor trust for the benefit of the holders of the Class A-S, B, C and PEX Certificates. The Class A-S, B, C and PEX Certificates will, at all times, represent undivided beneficial ownership interests in a grantor trust that will hold those regular interests. Each class of the Class A-S, B and C Certificates will, at all times, represent an undivided beneficial ownership interest in a percentage of the outstanding certificate principal balance of the regular interest with the same alphabetical class designation. The Class PEX Certificates will, at all times, represent an undivided beneficial ownership interest in the remaining percentages of the outstanding certificate principal balances of the Class A-S, B and C regular interests and which portions of those regular interests are referred to in this Term Sheet as the Class PEX Component A-S, Class PEX Component B and Class PEX Component C (collectively, the “Class PEX Components”). Following any exchange of Class A-S, B and C Certificates for Class PEX Certificates or any exchange of Class PEX Certificates for Class A-S, B and C Certificates as described in the Free Writing Prospectus, the percentage interest of the outstanding certificate principal balances of the Class A-S, B and C regular interest that is represented by the Class A-S, B, C and PEX Certificates will be increased or decreased accordingly. The initial certificate principal balance of each of the Class A-S, B and C Certificates shown in the table represents the maximum certificate principal balance of such class without giving effect to any exchange. The initial certificate principal balance of the Class PEX Certificates is equal to the aggregate of the initial certificate principal balance of the Class A-S, B and C Certificates and represents the maximum certificate principal balance of the Class PEX Certificates that could be issued in an exchange. The certificate principal balances of the Class A-S, B and C Certificates to be issued on the closing date will be reduced, in required proportions, by an amount equal to the certificate principal balance of the Class PEX Certificates issued on the closing date. Distributions and allocations of payments and losses with respect to the Exchangeable Certificates are described in this Term Sheet under “Allocations and Distributions on the Class A-S, B, C and PEX Certificates” and under “Description of the Offered Certificates—Distributions” in the Free Writing Prospectus. The maximum certificate principal balance of the Class PEX Certificates is set forth in the table but is not included in the certificate principal balance of the certificates set forth on the cover page of this Term Sheet or on the top of the cover page of the Free Writing Prospectus. | |
| (9) | The Class X-A Certificates are notional amount certificates. The Notional Amount of the Class X-A Certificates will be equal to the aggregate principal balance of the Class A-1, A-2, A-3, A-4, A-5 and A-SB Certificates and the Class A-S Regular Interest outstanding from time to time (without regard to any exchange of Class A-S, B and C Certificates for Class PEX Certificates). The Class X-A Certificates will not be entitled to distributions of principal. | |
| (10) | The pass-through rate for the Class X-A Certificates for any distribution date will be a per annum rate equal to the excess, if any, of (a) the weighted average of the net mortgage interest rates on the mortgage loans for the related distribution date, over (b) the weighted average of the pass-through rates on the Class A-1, A-2, A-3, A-4, A-5 and A-SB Certificates and the Class A-S Regular Interest for the related distribution date, weighted on the basis of their respective aggregate principal balances outstanding immediately prior to that distribution date. For purposes of the calculation of the weighted average of the net mortgage interest rates on the mortgage loans for each distribution date, the mortgage interest rates will be adjusted as necessary to a 30/360 basis. | |
| (11) | The Class X-B Certificates are notional amount certificates. The Notional Amount of the Class X-B Certificates will be equal to the aggregate principal balance of the Class B and C regular interests and the Class D Certificates outstanding from time to time. The Class X-B Certificates will not be entitled to distributions of principal. | |
| (12) | The pass-through rate for the Class X-B Certificates for any distribution date will be a per annum rate equal to the excess, if any, of (a) the weighted average of the net mortgage interest rates on the mortgage loans for the related distribution date, over (b) the weighted average of the pass-through rates on the Class B and C regular interests and the Class D Certificates for the related distribution date, weighted on the basis of their respective aggregate principal balances outstanding immediately prior to that distribution date. For purposes of the calculation of the weighted average of the net mortgage interest rates on the mortgage loans for each distribution date, the mortgage interest rates will be adjusted as necessary to a 30/360 basis. | |
| (13) | The Class X-C Certificates are notional amount certificates. The Notional Amount of the Class X-C Certificates will be equal to the aggregate principal balance of the Class E, F and G Certificates outstanding from time to time. The Class X-C Certificates will not be entitled to distributions of principal. | |
| (14) | The pass-through rate for the Class X-C certificates for any distribution date will be a per annum rate equal to the excess, if any, of (a) the weighted average of the net mortgage interest rates on the mortgage loans for the related distribution date, over (b) the weighted average of the pass-through rates on the Class E, F and G Certificates for the related distribution date, weighted on the basis of their respective aggregate principal balances outstanding immediately prior to that distribution date. For purposes of the calculation of the weighted average of the net mortgage interest rates on the mortgage loans for each distribution date, the mortgage interest rates will be adjusted as necessary to a 30/360 basis. |
| THE INFORMATION IN THIS STRUCTURAL AND COLLATERAL TERM SHEET IS NOT COMPLETE AND MAY BE AMENDED PRIOR TO THE TIME OF SALE. THIS TERM SHEET IS NOT AN OFFER TO SELL THESE SECURITIES AND IT IS NOT A SOLICITATION OF AN OFFER TO BUY THESE SECURITIES IN ANY JURISDICTION WHERE THE OFFER OR SALE IS NOT PERMITTED. |
4
WFRBS Commercial Mortgage Trust 2014-LC14 | Issue Characteristics |
II. Transaction Highlights
Mortgage Loan Sellers:
| Number of | Number of | % of Cut-off | ||||||||||
| Mortgage | Mortgaged | Aggregate Cut-off | Date Pool | |||||||||
| Mortgage Loan Seller | Loans | Properties | Date Balance | Balance | ||||||||
| Wells Fargo Bank, National Association | 27 | 31 | $538,774,885 | 42.9 | % | |||||||
| Ladder Capital Finance LLC | 19 | 67 | 366,847,347 | 29.2 | ||||||||
| Rialto Mortgage Finance, LLC | 16 | 35 | 203,801,951 | 16.2 | ||||||||
The Royal Bank of Scotland(1) | 9 | 11 | 146,171,851 | 11.6 | ||||||||
| Total | 71 | 144 | $1,255,596,034 | 100.0 | % | |||||||
| (1) | The mortgage loan seller referred to herein as The Royal Bank of Scotland is comprised of two affiliated companies: The Royal Bank of Scotland plc and RBS Financial Products Inc. With respect to the mortgage loans being sold for deposit into the trust by The Royal Bank of Scotland: (a) five (5) of the mortgage loans, having an aggregate cut-off date principal balance of $111,693,569 and representing approximately 8.9% of the aggregate principal balance of the pool of mortgage loans as of the cut-off date, were originated by and are being sold to the trust only by The Royal Bank of Scotland plc and (b) four (4) of the mortgage loans, having a cut-off date principal balance of $34,478,282 and representing approximately 2.7% of the aggregate principal balance of the pool of mortgage loans as of the cut-off date are being sold to the trust by RBS Financial Products Inc. |
Loan Pool:
| Cut-off Date Balance: | $1,255,596,034 |
| Number of Mortgage Loans: | 71 |
| Average Cut-off Date Balance per Mortgage Loan: | $17,684,451 |
| Number of Mortgaged Properties: | 144 |
Average Cut-off Date Balance per Mortgaged Property(1): | $8,719,417 |
| Weighted Average Mortgage Interest Rate: | 5.021% |
| Ten Largest Mortgage Loans as % of Cut-off Date Pool Balance: | 48.6% |
| Weighted Average Original Term to Maturity or ARD (months): | 108 |
| Weighted Average Remaining Term to Maturity or ARD (months): | 107 |
Weighted Average Original Amortization Term (months)(2): | 346 |
Weighted Average Remaining Amortization Term (months)(2): | 345 |
| Weighted Average Seasoning (months): | 1 |
| (1) | Information regarding mortgage loans secured by multiple properties is based on an allocation according to relative appraised values or the allocated loan amounts or property-specific release prices set forth in the related loan documents or such other allocation as the related mortgage loan seller deemed appropriate. |
| (2) | Excludes any mortgage loan that does not amortize. |
Credit Statistics:
Weighted Average U/W Net Cash Flow DSCR(1): | 1.65x |
Weighted Average U/W Net Operating Income Debt Yield(1): | 11.0% |
Weighted Average Cut-off Date Loan-to-Value Ratio(1): | 66.4% |
Weighted Average Balloon or ARD Loan-to-Value Ratio(1): | 57.4% |
% of Mortgage Loans with Additional Subordinate Debt(2): | 15.7% |
% of Mortgage Loans with Single Tenants(3): | 1.2% |
| (1) | With respect to the AmericasMart Mortgage Loan, the PennCap Portfolio Mortgage Loan and The Outlet Collection | Jersey Gardens Mortgage Loan, each of which is part of a pari passu loan combination, loan-to-value ratio, debt service coverage ratio and debt yield calculations include the related pari passu companion loan(s) unless otherwise stated. See Annex A-1 to the Free Writing Prospectus. Debt service coverage ratio, debt yield and loan-to-value ratio information takes no account of subordinate debt (whether or not secured by the related mortgaged property), if any, that is allowed under the terms of any mortgage loan. |
| (2) | The percentage figure expressed as “% of Mortgage loans with Additional Subordinate Debt” is determined as a percentage of cut-off date principal balance and does not take into account future subordinate debt (whether or not secured by the mortgaged property), if any, that may be permitted under the terms of any mortgage loan or the Pooling and Servicing Agreement. See “Description of the Mortgage Pool—Subordinate and/or Other Financing” in the Free Writing Prospectus. |
| (3) | Excludes mortgage loans that are secured by multiple single tenant properties. |
| THE INFORMATION IN THIS STRUCTURAL AND COLLATERAL TERM SHEET IS NOT COMPLETE AND MAY BE AMENDED PRIOR TO THE TIME OF SALE. THIS TERM SHEET IS NOT AN OFFER TO SELL THESE SECURITIES AND IT IS NOT A SOLICITATION OF AN OFFER TO BUY THESE SECURITIES IN ANY JURISDICTION WHERE THE OFFER OR SALE IS NOT PERMITTED. |
5
WFRBS Commercial Mortgage Trust 2014-LC14 | Issue Characteristics |
Loan Structural Features:
Amortization: Based on the Cut-off Date Pool Balance, 87.2% of the mortgage pool (68 mortgage loans) has scheduled amortization, as follows:
49.4% (47 mortgage loans) requires amortization during the entire loan term
37.8% (21 mortgage loans) provides for an interest-only period followed by an amortization period
Interest-Only: Based on the Cut-off Date Pool Balance, 12.8% of the mortgage pool (3 mortgage loans) provides for interest-only payments during the entire loan term. The Weighted Average Cut-off Date Loan-to-Value Ratio and Weighted Average U/W Net Cash Flow DSCR for those mortgage loans is 57.3% and 2.38x, respectively.
Hard Lockboxes: Based on the Cut-off Date Pool Balance, 54.0% of the mortgage pool (26 mortgage loans) has hard lockboxes in place.
Reserves: The mortgage loans require amounts to be escrowed monthly as follows (excluding any mortgage loans with springing provisions):
| Real Estate Taxes: | 80.8% of the pool |
| Insurance: | 49.5% of the pool |
| Capital Replacements: | 69.2% of the pool |
| TI/LC: | 76.9% of the pool(1) |
| (1) | The percentage of Cut-off Date Balance for loans with TI/LC reserves is based on the aggregate principal balance allocable to office, retail, industrial and mixed use properties. |
Call Protection/Defeasance: Based on the Cut-off Date Pool Balance, the mortgage pool has the following call protection and defeasance features:
85.3% of the mortgage pool (58 mortgage loans) features a lockout period, then defeasance only until an open period
8.7% of the mortgage pool (8 mortgage loans) features a lockout period, then the greater of a prepayment period premium or yield maintenance until an open period
3.2% of the mortgage pool (1 mortgage loan) features no lockout period, but requires the greater of a prepayment premium or yield maintenance for a period, then defeasance or the greater of a prepayment premium or yield maintenance until an open period
1.7% of the mortgage pool (3 mortgage loans) features a lockout period, then defeasance or the greater of a prepayment premium or yield maintenance until an open period
1.2% of the mortgage pool (1 mortgage loan) features a lockout period, then the greater of a prepayment period premium or yield maintenance for a period, then defeasance or the greater of a prepayment premium or yield maintenance until an open period
Please refer to Annex A-1 to the Free Writing Prospectus for further description of individual loan call protection.
| THE INFORMATION IN THIS STRUCTURAL AND COLLATERAL TERM SHEET IS NOT COMPLETE AND MAY BE AMENDED PRIOR TO THE TIME OF SALE. THIS TERM SHEET IS NOT AN OFFER TO SELL THESE SECURITIES AND IT IS NOT A SOLICITATION OF AN OFFER TO BUY THESE SECURITIES IN ANY JURISDICTION WHERE THE OFFER OR SALE IS NOT PERMITTED. |
6
WFRBS Commercial Mortgage Trust 2014-LC14 | Issue Characteristics |
III. Issue Characteristics
| Securities Offered: | $1,103,355,000 approximate monthly pay, multi-class, commercial mortgage REMIC pass-through certificates consisting of twelve classes (Classes A-1, A-2, A-3, A-4, A-5, A-SB, A-S, B, C, PEX, X-A and X-B), which are offered pursuant to a registration statement filed with the SEC. |
| Mortgage Loan Sellers: | Wells Fargo Bank, National Association (“WFB”); Ladder Capital Finance LLC (“LCF”); Rialto Mortgage Finance, LLC (“RMF”); and The Royal Bank of Scotland (“RBS”). |
| Co-lead Bookrunning Managers: | Wells Fargo Securities, LLC and RBS Securities Inc. |
| Co-Manager: | Deutsche Bank Securities Inc. |
| Rating Agencies: | DBRS, Inc., Fitch Ratings, Inc. and Moody’s Investors Service, Inc. |
| Master Servicer: | Wells Fargo Bank, National Association |
| Special Servicer: | Rialto Capital Advisors, LLC |
| Certificate Administrator: | Wells Fargo Bank, National Association |
| Trustee: | Deutsche Bank Trust Company Americas |
| Trust Advisor: | Trimont Real Estate Advisors, Inc. |
| Initial Majority Subordinate Certificateholder: | Rialto CMBS, LLC or another affiliate of Rialto Capital Advisors, LLC |
| Cut-off Date: | The Cut-off Date with respect to each mortgage loan is the due date for the monthly debt service payment that is due in February 2014 (or, in the case of any mortgage loan that has its first due date in March 2014, the date that would have been its due date in February 2014 under the terms of that mortgage loan if a monthly debt service payment were scheduled to be due in that month). |
| Expected Closing Date: | On or about February 20, 2014. |
| Determination Dates: | The 11th day of each month (or if that day is not a business day, the next succeeding business day), commencing in March 2014. |
| Distribution Dates: | The fourth business day following the Determination Date in each month, commencing in March 2014. |
| Rated Final Distribution Date: | The Distribution Date in March 2047. |
| Interest Accrual Period: | With respect to any Distribution Date, the calendar month preceding the month in which such Distribution Date occurs. |
| Day Count: | The Offered Certificates will accrue interest on a 30/360 basis. |
| Minimum Denominations: | $10,000 for each Class of Offered Certificates (other than the Class X-A and Class X-B Certificates) and $1,000,000 for the Class X-A and Class X-B Certificates. Investments may also be made in any whole dollar denomination in excess of the applicable minimum denomination. |
| Clean-up Call: | 1% |
| Delivery: | DTC, Euroclear and Clearstream Banking |
| ERISA/SMMEA Status: | Each Class of Offered Certificates is expected to be eligible for exemptive relief under ERISA. No Class of Offered Certificates will be SMMEA eligible. |
| Risk Factors: | THE CERTIFICATES INVOLVE CERTAIN RISKS AND MAY NOT BE SUITABLE FOR ALL INVESTORS. SEE THE “RISK FACTORS” SECTION OF THE FREE WRITING PROSPECTUS. |
| Bond Analytics Information: | The Certificate Administrator will be authorized to make distribution date settlements, CREFC® reports and certain supplemental reports (other than confidential information) available to certain financial modeling and data provision services, including Bloomberg Financial Markets L.P., Trepp LLC, Intex Solutions, Inc., Markit Group Limited, Interactive Data Corp., BlackRock Financial Management, Inc and CMBS.com, Inc. |
| THE INFORMATION IN THIS STRUCTURAL AND COLLATERAL TERM SHEET IS NOT COMPLETE AND MAY BE AMENDED PRIOR TO THE TIME OF SALE. THIS TERM SHEET IS NOT AN OFFER TO SELL THESE SECURITIES AND IT IS NOT A SOLICITATION OF AN OFFER TO BUY THESE SECURITIES IN ANY JURISDICTION WHERE THE OFFER OR SALE IS NOT PERMITTED. |
7
WFRBS Commercial Mortgage Trust 2014-LC14 | Characteristics of the Mortgage Pool |
IV. Characteristics of the Mortgage Pool(1)
A. Ten Largest Mortgage Loans
Mortgage Loan Seller | Mortgage Loan Name | City | State | Number of Mortgage Loans / Mortgaged Properties | Mortgage Loan Cut-off Date Balance ($) | % of Cut- off Date Pool Balance (%) | Property Type | Number of SF, Rooms, Pads, Units or Beds | Cut-off Date Balance Per SF, Room, Pad, Unit or Bed ($) | Cut-off Date LTV Ratio (%) | Balloon or ARD LTV Ratio (%) | U/W NCF DSCR (x) | U/W NOI Debt Yield (%) | ||||||||||||||
| WFB | AmericasMart | Atlanta | GA | 1 / 1 | $139,602,104 | 11.1% | Other | 4,563,219 | $122 | 60.7% | 46.2% | 1.68x | 12.9 | % | |||||||||||||
| LCF | PennCap Portfolio | Various | PA | 1 / 32 | 90,000,000 | 7.2 | Various | 1,432,661 | 86 | 75.0 | 66.0 | 1.39 | 10.7 | ||||||||||||||
| WFB | The Outlet Collection | Jersey Gardens | Elizabeth | NJ | 1 / 1 | 80,000,000 | 6.4 | Retail | 1,298,801 | 269 | 49.5 | 49.5 | 2.84 | 11.5 | ||||||||||||||
| WFB | Westin New York at Times Square – Leased Fee | New York | NY | 1 / 1 | 55,000,000 | 4.4 | Other | 17,574 | 3,130 | 61.8 | 61.8 | 1.95 | 6.5 | ||||||||||||||
| WFB | Miami International Airport Industrial Portfolio | Miami | FL | 1 / 1 | 48,500,000 | 3.9 | Mixed Use | 749,851 | 65 | 64.8 | 58.9 | 1.47 | 9.3 | ||||||||||||||
| RMF | Williams Center Towers | Tulsa | OK | 1 / 1 | 45,500,000 | 3.6 | Office | 765,809 | 59 | 72.2 | 64.4 | 1.46 | 10.8 | ||||||||||||||
| RBS | FRAPAG Portfolio | Various | Various | 1 / 3 | 41,410,000 | 3.3 | Various | 699,355 | 59 | 71.6 | 58.9 | 1.31 | 9.4 | ||||||||||||||
| LCF | Canadian Pacific Plaza | Minneapolis | MN | 1 / 1 | 39,750,000 | 3.2 | Office | 393,902 | 101 | 74.3 | 66.0 | 1.52 | 10.7 | ||||||||||||||
| LCF | Calidus Student Housing Portfolio | Various | Various | 1 / 4 | 38,814,000 | 3.1 | Multifamily | 2,016 | 19,253 | 67.5 | 58.9 | 1.42 | 10.3 | ||||||||||||||
| WFB | Caruth Plaza | Dallas | TX | 1 / 1 | 32,200,000 | 2.6 | Retail | 206,192 | 156 | 67.2 | 62.0 | 1.40 | 9.2 | ||||||||||||||
| Top Three Total/Weighted Average | 3 / 34 | $309,602,104 | 24.7% | 62.0% | 52.8% | 1.90x | 11.9 | % | |||||||||||||||||||
| Top Five Total/Weighted Average | 5 / 36 | $413,102,104 | 32.9% | 62.3% | 54.7% | 1.85x | 10.9 | % | |||||||||||||||||||
| Top Ten Total/Weighted Average | 10 / 46 | $610,776,104 | 48.6% | 65.0% | 57.1% | 1.71x | 10.6 | % | |||||||||||||||||||
| Non-Top Ten Total/Weighted Average | 61 / 98 | $644,819,930 | 51.4% | 67.7% | 57.8% | 1.59x | 11.4 | % | |||||||||||||||||||
| (1) | With respect to the AmericasMart Mortgage Loan, the PennCap Portfolio Mortgage Loan and The Outlet Collection | Jersey Gardens Mortgage Loan, each of which is part of a pari passu loan combination, Cut-off Date Balance per square foot, loan-to-value ratio, debt service coverage ratio and debt yield calculations include the related pari passu companion loan(s) (unless otherwise stated). With respect to each Mortgage Loan, debt service coverage ratio, debt yield and loan-to-value ratio information takes no account of subordinate debt (whether or not secured by the related mortgaged property), if any, that is allowed under the terms of any mortgage loan. |
| THE INFORMATION IN THIS STRUCTURAL AND COLLATERAL TERM SHEET IS NOT COMPLETE AND MAY BE AMENDED PRIOR TO THE TIME OF SALE. THIS TERM SHEET IS NOT AN OFFER TO SELL THESE SECURITIES AND IT IS NOT A SOLICITATION OF AN OFFER TO BUY THESE SECURITIES IN ANY JURISDICTION WHERE THE OFFER OR SALE IS NOT PERMITTED. |
8
WFRBS Commercial Mortgage Trust 2014-LC14 | Characteristics of the Mortgage Pool |
B. Summary of Pari Passu Split Loan Structures
| Property Name | Mortgage Loan Seller | Related Notes in Loan Group (Original Balance) | Holder of Note | Whether Note is Lead Servicing for the Entire Loan Combination | Current Master Servicer Under Related Securitization Servicing Agreement | Current Special Servicer Under Related Securitization Servicing Agreement | |||||
| AmericasMart | WFB | $140,000,000(1) | WFRBS 2014-LC14 | No | Wells Fargo Bank, National Association | Rialto Capital Advisors | |||||
| WFB | $140,000,000(1) | WFRBS 2013-C18 | Yes | Wells Fargo Bank, National Association | Midland Loan Services | ||||||
| Bank of America, National Association | $140,000,000(1) | MSBAM 2014-C14 | No | Wells Fargo Bank, National Association | Rialto Capital Advisors | ||||||
| WFB | $140,000,000(1) | (1) | No | TBD | TBD | ||||||
| PennCap Portfolio | LCF | $90,000,000 | WFRBS 2014-LC14 | Yes | Wells Fargo Bank, National Association | Rialto Capital Advisors | |||||
| LCF | $33,700,000 | (2) | No | TBD | TBD | ||||||
| The Outlet Collection | Jersey Gardens | WFB | $80,000,000 | WFRBS 2014-LC14 | No | Wells Fargo Bank, National Association | Rialto Capital Advisors | |||||
| WFB | $130,000,000 | WFRBS 2013-UBS1 | No | Wells Fargo Bank, National Association | CWCapital Asset Management LLC | ||||||
| WFB | $140,000,000 | WFRBS 2013-C18 | Yes | Wells Fargo Bank, National Association | Midland Loan Services |
| (1) | The AmericasMart Mortgage Loan is comprised of two separate promissory notes, each in the original principal amount of $70,000,000. These two notes are treated as one mortgage loan for all purposes in this Term Sheet unless otherwise indicated. There are six (6) pari passu companion loans related to such AmericasMart Mortgage Loan, each in the original principal amount of $70,000,000. Two of such pari passu companion loans were securitized in WFRBS 2013-C18 and two of such pari passu companion loans are expected to be contributed to the MSBAM 2014-C14 Trust. One of such pari passu companion loans is currently held by Wells Fargo Bank, National Association, the related mortgage loan seller for the AmericasMart Mortgage Loan for this securitization, and one of such pari passu companion loans is currently held by Bank of America, National Association. Each of such pari passu companion loans that continues to be held by Wells Fargo Bank, National Association and Bank of America, National Association, respectively, is expected to be contributed to a future securitization. No assurances can be given that any of such pari passu companion loans will be contributed to a future securitization. No assurances can be provided that any non-securitized pari passu notes will not be split further. |
| (2) | The related pari passu companion loan is currently held by the mortgage loan seller for the mortgage loan included in the WFRBS 2014-LC14 trust. |
C. Mortgage Loans with Additional Secured and Mezzanine Financing(1)(2)
| Loan No. | Mortgage Loan Seller | Mortgage Loan Name | Mortgage Loan Cut-off Date Balance ($) | % of Cut- off Date Balance (%) | Sub Debt Cut-off Date Balance ($) | Mezzanine Debt Cut-off Date Balance ($) | Total Debt Interest Rate (%)(3) | Mortgage Loan U/W NCF DSCR (x) | Total Debt U/W NCF DSCR (x) | Mortgage Loan Cut- off Date U/W NOI Debt Yield (%) | Total Debt Cut-off Date U/W NOI Debt Yield (%) | Mortgage Loan Cut-off Date LTV Ratio (%) | Total Debt Cut-off Date LTV Ratio (%) | |||||||||||||
| 2 | LCF | PennCap Portfolio | $90,000,000 | 7.2% | $0 | $14,900,000 | 6.399% | 1.39x | 1.15x | 10.7% | 9.6% | 75.0% | 84.0% | |||||||||||||
| 9 | LCF | Calidus Student Housing Portfolio | 38,814,000 | 3.1 | 0 | 4,000,000 | 5.971 | 1.42 | 1.20 | 10.3 | 9.4 | 67.5 | 74.5 | |||||||||||||
| 13 | RMF | Museo Apartments | 25,750,000 | 2.1 | 0 | 4,000,000 | 5.448 | 1.87 | 1.32 | 8.7 | 7.5 | 72.2 | 83.5 | |||||||||||||
| 14 | LCF | West Side Mall | 25,600,000 | 2.0 | 0 | 2,000,000 | 5.780 | 1.27 | 1.11 | 9.5 | 8.8 | 74.4 | 80.2 | |||||||||||||
| 24 | RMF | Georgia Multifamily Portfolio | 17,000,000 | 1.4 | 0 | 6,500,000 | 7.424 | 1.85 | 1.00 | 13.6 | 9.9 | 55.5 | 76.7 | |||||||||||||
Total/Weighted Average(1)(2) | $197,164,000 | 15.7% | $0 | $31,400,000 | 6.199% | 1.48x | 1.16x | 10.5% | 9.2% | 71.4% | 80.9% | |||||||||||||||
| (1) | With respect to the PennCap Portfolio Mortgage Loan, which is part of a pari passu loan combination, loan-to-value ratio, debt service coverage ratio and debt yield calculations include the pari passu companion loan unless otherwise stated. See Annex A-1 to the Free Writing Prospectus. |
| (2) | All total debt calculations are calculated including the PennCap Portfolio pari passu companion loan which is not shown in the table above but has an outstanding principal balance as of the cut-off date of $33,700,000. |
| (3) | Total Debt Interest Rate for any specified mortgage loan reflects the weighted average of the interest rates on the respective components of the total debt. |
| THE INFORMATION IN THIS STRUCTURAL AND COLLATERAL TERM SHEET IS NOT COMPLETE AND MAY BE AMENDED PRIOR TO THE TIME OF SALE. THIS TERM SHEET IS NOT AN OFFER TO SELL THESE SECURITIES AND IT IS NOT A SOLICITATION OF AN OFFER TO BUY THESE SECURITIES IN ANY JURISDICTION WHERE THE OFFER OR SALE IS NOT PERMITTED. |
9
WFRBS Commercial Mortgage Trust 2014-LC14 | Characteristics of the Mortgage Pool |
D. Previous Securitization History(1)
| Loan No. | Mortgage Loan Seller | Mortgage Loan or Mortgaged Property Name | City | State | Property Type | Mortgage Loan or Mortgaged Property Cut-off Date Balance ($) | % of Cut-off Date Pool Balance (%) | Previous Securitization | ||||||||
| 1 | WFB | AmericasMart | Atlanta | GA | Other | $139,602,104 | 11.1% | WBCMT 2005-C19, WBCMT 2005-C20 | ||||||||
| 2.01 | LCF | 3701 Corporate | Center Valley | PA | Office | 8,716,249 | 0.7 | GSMS 2011-GC5 | ||||||||
| 2.02 | LCF | 3773 Corporate | Center Valley | PA | Office | 7,930,477 | 0.6 | GSMS 2011-GC5 | ||||||||
| 2.03 | LCF | 1605 Valley Center | Bethlehem | PA | Office | 6,300,728 | 0.5 | MSC 2011-C2 | ||||||||
| 2.04 | LCF | 1525 Valley Center | Bethlehem | PA | Office | 5,878,739 | 0.5 | MSC 2011-C2 | ||||||||
| 2.05 | LCF | 1560 Valley Center | Bethlehem | PA | Office | 4,925,627 | 0.4 | JPMCC 2011-C5 | ||||||||
| 2.06 | LCF | 1550 Valley Center | Bethlehem | PA | Office | 4,248,989 | 0.3 | JPMCC 2011-C5 | ||||||||
| 2.07 | LCF | 1455 Valley Center | Bethlehem | PA | Office | 4,219,887 | 0.3 | JPMCC 2011-C5 | ||||||||
| 2.09 | LCF | 1510 Valley Center | Bethlehem | PA | Office | 3,448,666 | 0.3 | JPMCC 2011-C5 | ||||||||
| 2.10 | LCF | 1495 Valley Center | Bethlehem | PA | Office | 3,077,607 | 0.2 | MSC 2011-C2 | ||||||||
| 2.11 | LCF | 1640 Valley Center | Bethlehem | PA | Office | 2,902,991 | 0.2 | JPMCC 2011-C5 | ||||||||
| 2.12 | LCF | 57 S Commerce | Hanover Township | PA | Industrial | 2,742,926 | 0.2 | GSMS 2011-GC5 | ||||||||
| 2.13 | LCF | 1650 Valley Center | Bethlehem | PA | Office | 2,510,105 | 0.2 | JPMCC 2011-C5 | ||||||||
| 2.15 | LCF | 1660 Valley Center | Bethlehem | PA | Office | 2,080,841 | 0.2 | JPMCC 2011-C5 | ||||||||
| 2.16 | LCF | 1530 Valley Center | Bethlehem | PA | Office | 1,993,533 | 0.2 | JPMCC 2011-C5 | ||||||||
| 2.18 | LCF | 2196 Avenue C | Bethlehem | PA | Industrial | 1,673,403 | 0.1 | GSMS 2011-GC5 | ||||||||
| 2.19 | LCF | 2202 Hangar Place | Hanover Township | PA | Industrial | 1,673,403 | 0.1 | GSMS 2011-GC5 | ||||||||
| 2.20 | LCF | 754 Roble Road | Hanover Township | PA | Industrial | 1,586,095 | 0.1 | GSMS 2011-GC5 | ||||||||
| 2.23 | LCF | 974 Marcon Blvd | Hanover Township | PA | Industrial | 1,447,858 | 0.1 | GSMS 2011-GC5 | ||||||||
| 2.24 | LCF | 2201 Hangar Place | Hanover Township | PA | Industrial | 1,433,306 | 0.1 | GSMS 2011-GC5 | ||||||||
| 2.25 | LCF | 7355 William Avenue | Upper Macungie Township | PA | Industrial | 1,433,306 | 0.1 | GSMS 2011-GC5 | ||||||||
| 2.26 | LCF | 944 Marcon Blvd | Hanover Township | PA | Industrial | 1,418,755 | 0.1 | GSMS 2011-GC5 | ||||||||
| 2.27 | LCF | 954 Marcon Blvd | Hanover Township | PA | Industrial | 1,345,998 | 0.1 | GSMS 2011-GC5 | ||||||||
| 2.28 | LCF | 7277 William Avenue | Upper Macungie Township | PA | Industrial | 1,331,447 | 0.1 | GSMS 2011-GC5 | ||||||||
| 2.29 | LCF | 2041 Avenue C | Bethlehem | PA | Industrial | 1,244,139 | 0.1 | GSMS 2011-GC5 | ||||||||
| 2.30 | LCF | 964 Marcon Blvd | Hanover Township | PA | Industrial | 1,098,626 | 0.1 | GSMS 2011-GC5 | ||||||||
| 2.31 | LCF | 7562 Penn Drive | Upper Macungie Township | PA | Industrial | 1,098,626 | 0.1 | GSMS 2011-GC5 | ||||||||
| 2.32 | LCF | 764 Roble Road | Hanover Township | PA | Industrial | 1,069,523 | 0.1 | GSMS 2011-GC5 | ||||||||
| 3 | WFB | The Outlet Collection | Jersey Gardens | Elizabeth | NJ | Retail | 80,000,000 | 6.4 | BSCMS 2004-T16, GMACC 2004-C2 | ||||||||
| 5 | WFB | Miami International Airport Industrial Portfolio | Miami | FL | Mixed Use | 48,500,000 | 3.9 | MLCFC 2007-5 | ||||||||
| 10 | WFB | Caruth Plaza | Dallas | TX | Retail | 32,200,000 | 2.6 | BSCMS 2004-PWR6 | ||||||||
| 15 | WFB | The Pointe at Wellington Green | Wellington | FL | Retail | 25,000,000 | 2.0 | WBCMT 2004-C12 | ||||||||
| 16 | LCF | 465 Park Avenue Retail Condominium | New York | NY | Mixed Use | 20,000,000 | 1.6 | GSMS 2004-GG2 | ||||||||
| 19.01 | RMF | Off Dep Pearl MS | Pearl | MS | Retail | 3,000,000 | 0.2 | WBCMT 2006-C25 | ||||||||
| 19.02 | RMF | Michigan Road | Indianapolis | IN | Retail | 2,700,000 | 0.2 | JPMCC 2003-LN1 | ||||||||
| 22 | WFB | Camelot Village MHC | Streetsboro | OH | Manufactured Housing Community | 17,460,140 | 1.4 | GECMC 2004-C2 | ||||||||
| 24.01 | RMF | Pinnacle West | Albany | GA | Multifamily | 4,301,285 | 0.3 | CSMC 2006-C5 |
| THE INFORMATION IN THIS STRUCTURAL AND COLLATERAL TERM SHEET IS NOT COMPLETE AND MAY BE AMENDED PRIOR TO THE TIME OF SALE. THIS TERM SHEET IS NOT AN OFFER TO SELL THESE SECURITIES AND IT IS NOT A SOLICITATION OF AN OFFER TO BUY THESE SECURITIES IN ANY JURISDICTION WHERE THE OFFER OR SALE IS NOT PERMITTED. |
10
WFRBS Commercial Mortgage Trust 2014-LC14 | Characteristics of the Mortgage Pool |
| Loan No. | Mortgage Loan Seller | Mortgage Loan or Mortgaged Property Name | City | State | Property Type | Mortgage Loan or Mortgaged Property Cut-off Date Balance ($) | % of Cut-off Date Pool Balance (%) | Previous Securitization | ||||||||
| 24.02 | RMF | Hidden Oaks | Albany | GA | Multifamily | 3,904,243 | 0.3 | CSMC 2006-C3 | ||||||||
| 24.03 | RMF | Lake of the Woods | College Park | GA | Multifamily | 2,759,439 | 0.2 | CSMC 2006-C5 | ||||||||
| 24.04 | RMF | Wellston Ridge | Warner Robins | GA | Multifamily | 2,316,076 | 0.2 | CSMC 2006-C5 | ||||||||
| 24.05 | RMF | Oakdale Villas | Warner Robins | GA | Multifamily | 2,157,260 | 0.2 | CSMC 2006-C5 | ||||||||
| 24.06 | RMF | Northcrest | Warner Robins | GA | Multifamily | 1,561,697 | 0.1 | CSMC 2006-C5 | ||||||||
| 25 | WFB | Hickory Hills MHC | Bath | PA | Manufactured Housing Community | 15,482,704 | 1.2 | BACM 2004-3 | ||||||||
| 26.01 | LCF | Tropicana | Duluth | MN | Multifamily | 2,970,785 | 0.2 | LBUBS 2006-C1 | ||||||||
| 26.02 | LCF | Railview | Proctor | MN | Multifamily | 2,083,537 | 0.2 | LBUBS 2006-C1 | ||||||||
| 26.03 | LCF | Linderhof | New Ulm | MN | Multifamily | 1,988,831 | 0.2 | LBUBS 2006-C1 | ||||||||
| 26.04 | LCF | Piedmont Manor | Duluth | MN | Multifamily | 1,754,558 | 0.1 | LBUBS 2006-C1 | ||||||||
| 26.05 | LCF | Spirit Mountain | Proctor | MN | Multifamily | 1,679,789 | 0.1 | LBUBS 2006-C1 | ||||||||
| 27 | RBS | Residence Inn – Mystic CT | Mystic | CT | Hospitality | 14,750,000 | 1.2 | SBM7 2000-NL1 | ||||||||
| 29 | RBS | Sanctuary Beach Resort | Marina | CA | Hospitality | 14,700,000 | 1.2 | GCCFC 2007-GG11 | ||||||||
| 34.01 | WFB | Parkway Self Storage – Palm Coast | Palm Coast | FL | Self Storage | 3,420,000 | 0.3 | HCC 2006-1 | ||||||||
| 34.02 | WFB | Morningstar Storage – Fayetteville | Fayetteville | NC | Self Storage | 3,120,000 | 0.2 | BACM 2004-2 | ||||||||
| 34.03 | WFB | Extra Space Storage – Beaumont | Beaumont | CA | Self Storage | 2,610,000 | 0.2 | BSCMS 2007-PW15 | ||||||||
| 34.04 | WFB | Value Self Storage – Holiday | Holiday | FL | Self Storage | 2,250,000 | 0.2 | WBCMT 2005-C21 | ||||||||
| 34.05 | WFB | Extra Space Storage – San Bernardino | San Bernardino | CA | Self Storage | 1,000,000 | 0.1 | MSC 2007-IQ14 | ||||||||
| 36.01 | LCF | Cool Springs | Franklin | TN | Retail | 4,019,156 | 0.3 | LBUBS 2004-C1 | ||||||||
| 36.02 | LCF | Gunbarrel | Chattanooga | TN | Retail | 2,046,451 | 0.2 | LBUBS 2004-C1 | ||||||||
| 36.03 | LCF | 1200 Market | Chattanooga | TN | Office | 1,640,848 | 0.1 | LBUBS 2004-C1 | ||||||||
| 38 | WFB | Security Public Storage – Daly City | Daly City | CA | Self Storage | 10,488,364 | 0.8 | BSCMS 2006-T22 | ||||||||
| 40 | LCF | Nogales Plaza | Nogales | AZ | Retail | 8,663,259 | 0.7 | WBCMT 2003-C8 | ||||||||
| 42 | WFB | Security Public Storage – San Francisco | San Francisco | CA | Self Storage | 8,490,689 | 0.7 | MSC 2006-T21 | ||||||||
| 46 | RBS | Best Western Plus – Miramar | San Diego | CA | Hospitality | 7,192,199 | 0.6 | DLJCM 1999-CG2 | ||||||||
| 47 | RBS | Holiday Inn Express – Sorrento Valley | San Diego | CA | Hospitality | 7,092,126 | 0.6 | LBUBS 2004-C4 | ||||||||
| 50 | LCF | King City Square | Mount Vernon | IL | Retail | 6,496,780 | 0.5 | MLMT 2002-MW1 | ||||||||
| 53 | RBS | La Quinta – Old Town | San Diego | CA | Hospitality | 5,493,957 | 0.4 | LBUBS 2004-C4 | ||||||||
| 58 | WFB | Hamilton Crossings | Buford | GA | Retail | 4,894,842 | 0.4 | CD 2007-CD5 | ||||||||
| 64 | WFB | Triple Crown Plaza | Ocala | FL | Retail | 3,521,851 | 0.3 | MLMT 2008-C1 | ||||||||
| 68 | WFB | Security Public Storage – Hayward | Hayward | CA | Self Storage | 2,297,332 | 0.2 | MSC 2006-T21 | ||||||||
| 69 | WFB | River Run Plaza | Bakersfield | CA | Retail | 2,200,000 | 0.2 | LBUBS 2004-C2 | ||||||||
| Total | $606,642,152 | 48.3% | ||||||||||||||
| (1) | The table above represents the most recent securitization with respect to the mortgaged property securing the related mortgage loan, based on information provided by the related borrower or obtained through searches of a third-party database. While the above mortgage loans may have been securitized multiple times in prior transactions, mortgage loans are only listed in the above chart if the mortgage loan paid off a mortgage loan in another securitization. The information has not otherwise been confirmed by the mortgage loan sellers. |
| THE INFORMATION IN THIS STRUCTURAL AND COLLATERAL TERM SHEET IS NOT COMPLETE AND MAY BE AMENDED PRIOR TO THE TIME OF SALE. THIS TERM SHEET IS NOT AN OFFER TO SELL THESE SECURITIES AND IT IS NOT A SOLICITATION OF AN OFFER TO BUY THESE SECURITIES IN ANY JURISDICTION WHERE THE OFFER OR SALE IS NOT PERMITTED. |
11
WFRBS Commercial Mortgage Trust 2014-LC14 | Characteristics of the Mortgage Pool |
E. Mortgage Loans with Scheduled Balloon Payments and Related Classes | |
Class A-2(1) | ||||||||||||||||||||||||||||||||||
| Loan No. | Mortgage Loan Seller | Mortgage Loan Name | State | Property Type | Mortgage Loan Cut-off Date Balance ($) | % of Cut-off Date Pool Balance (%) | Mortgage Loan Balance at Maturity ($) | % of Class A-2 Certificate Principal Balance (%)(2) | SF/ Rooms/ Pads/ Units | Loan per SF /Room/ Pad/Unit ($) | U/W NCF DSCR (x) | U/W NOI Debt Yield (%) | Cut-off Date LTV Ratio (%) | Balloon or ARD LTV Ratio (%) | Rem. IO Period (mos.) | Rem. Term to Maturity (mos.) | ||||||||||||||||||
4 | WFB | Westin New York at Times Square – Leased Fee | NY | Other | $55,000,000 | 4.4 | % | $55,000,000 | 29.0 | % | 17,574 | $3,130 | 1.95x | 6.5% | 61.8% | 61.8% | 60 | 60 | ||||||||||||||||
| 5 | WFB | Miami International Airport Industrial Portfolio | FL | Mixed Use | 48,500,000 | 3.9 | 44,117,287 | 23.3 | 749,851 | 65 | 1.47 | 9.3 | 64.8 | 58.9 | 0 | 60 | ||||||||||||||||||
| 13 | RMF | Museo Apartments | TX | Multifamily | 25,750,000 | 2.1 | 25,750,000 | 13.6 | 276 | 93,297 | 1.87 | 8.7 | 72.2 | 72.2 | 58 | 58 | ||||||||||||||||||
| 24 | RMF | Georgia Multifamily Portfolio | GA | Multifamily | 17,000,000 | 1.4 | 16,235,121 | 8.6 | 1,044 | 16,284 | 1.85 | 13.6 | 55.5 | 53.0 | 23 | 59 | ||||||||||||||||||
| 27 | RBS | Residence Inn – Mystic CT | CT | Hospitality | 14,750,000 | 1.2 | 13,568,253 | 7.2 | 133 | 110,902 | 1.63 | 11.5 | 70.6 | 64.9 | 0 | 60 | ||||||||||||||||||
| 30 | LCF | Clinton MHC | MI | Manufactured Housing Community | 14,200,000 | 1.1 | 13,232,742 | 7.0 | 1,000 | 14,200 | 2.08 | 14.9 | 71.0 | 66.2 | 0 | 60 | ||||||||||||||||||
| 33 | LCF | Westridge Apartments | ND | Multifamily | 12,953,996 | 1.0 | 9,776,932 | 5.2 | 96 | 134,937 | 1.90 | 18.5 | 62.2 | 46.9 | 0 | 59 | ||||||||||||||||||
| 43 | LCF | Staybridge Suites – Omaha | NE | Hospitality | 8,100,000 | 0.6 | 7,451,385 | 3.9 | 102 | 79,412 | 1.92 | 13.5 | 68.9 | 63.4 | 0 | 60 | ||||||||||||||||||
| Total/Weighted Average | $196,253,996 | 15.6 | % | $185,131,721 | 97.6 | % | 1.79x | 10.2% | 65.0% | 61.3% | 26 | 60 | ||||||||||||||||||||||
| (1) | The table above presents the mortgage loan(s) whose balloon payments would be applied to pay down the principal balance of the Class A-2 Certificates, assuming a 0% CPR and applying the “Structuring Assumptions” described in the Free Writing Prospectus, including the assumptions that (i) none of the mortgage loans in the pool experience prepayments prior to maturity (or, in the case of an ARD loan, its anticipated repayment date), defaults or losses; (ii) there are no extensions of maturity dates of any mortgage loans in the pool; and (iii) each mortgage loan in the pool is paid in full on its stated maturity date (or, in the case of an ARD loan, its anticipated repayment date). Each Class of Certificates, including the Class A-2 Certificates, evidences undivided ownership interests in the entire pool of mortgage loans. Debt service coverage ratio, debt yield and loan-to-value ratio information takes no account of subordinate debt (whether or not secured by the mortgaged property), if any, that is allowed under the terms of any mortgage loan. See Annex A-1 to the Free Writing Prospectus. |
| (2) | Reflects the percentage equal to the Mortgage Loan Balance at Maturity divided by the initial Class A-2 Certificate Principal Balance. |
Class A-3(1) | ||||||||||||||||||||||||||||||||||
| Loan No. | Mortgage Loan Seller | Mortgage Loan Name | State | Property Type | Mortgage Loan Cut-off Date Balance ($) | % of Cut-off Date Pool Balance (%) | Mortgage Loan Balance at Maturity ($) | % of Class A-3 Certificate Principal Balance (%)(2) | SF | Loan per SF ($) | U/W NCF DSCR (x) | U/W NOI Debt Yield (%) | Cut-off Date LTV Ratio (%) | Balloon LTV Ratio (%) | Rem. IO Period (mos.) | Rem. Term to Maturity (mos.) | ||||||||||||||||||
| 3 | WFB | The Outlet Collection | Jersey Gardens | NJ | Retail | $80,000,000 | 6.4 | % | $80,000,000 | 100.0 | % | 1,298,801 | $269 | 2.84x | 11.5% | 49.5% | 49.5% | 81 | 81 | ||||||||||||||||
| Total/Weighted Average | $80,000,000 | 6.4 | % | $80,000,000 | 100.0 | % | 2.84x | 11.5% | 49.5% | 49.5% | 81 | 81 | ||||||||||||||||||||||
(1) | The table above presents the mortgage loan(s) whose balloon payments would be applied to pay down the principal balance of the Class A-3 Certificates, assuming a 0% CPR and applying the “Structuring Assumptions” described in the Free Writing Prospectus, including the assumptions that (i) none of the mortgage loans in the pool experience prepayments, defaults or losses; (ii) there are no extensions of maturity dates of any mortgage loans in the pool; and (iii) each mortgage loan in the pool is paid in full on its stated maturity date. Each Class of Certificates, including the Class A-3 Certificates, evidences undivided ownership interests in the entire pool of mortgage loans. Debt service coverage ratio, debt yield and loan-to-value ratio information takes no account of subordinate debt (whether or not secured by the mortgaged property), if any, that is allowed under the terms of any mortgage loan. See Annex A-1 to the Free Writing Prospectus. |
(2) | Reflects the percentage equal to the Mortgage Loan Balance at Maturity divided by the initial Class A-3 Certificate Principal Balance. |
| THE INFORMATION IN THIS STRUCTURAL AND COLLATERAL TERM SHEET IS NOT COMPLETE AND MAY BE AMENDED PRIOR TO THE TIME OF SALE. THIS TERM SHEET IS NOT AN OFFER TO SELL THESE SECURITIES AND IT IS NOT A SOLICITATION OF AN OFFER TO BUY THESE SECURITIES IN ANY JURISDICTION WHERE THE OFFER OR SALE IS NOT PERMITTED. |
12
(THIS PAGE INTENTIONALLY LEFT BLANK)
13
WFRBS Commercial Mortgage Trust 2014-LC14 | Characteristics of the Mortgage Pool |
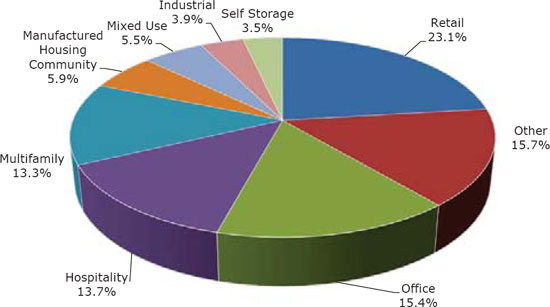
F. Property Type Distribution(1)
Property Type | Number of Mortgaged Properties | Aggregate Cut- off Date Balance ($) | % of Cut- off Date Balance| (%) | Weighted Average Cut-off Date LTV Ratio (%) | Weighted Average Balloon or ARD LTV Ratio (%) | Weighted Average U/W NCF DSCR (x) | Weighted Average U/W NOI Debt Yield (%) | Weighted Average U/W NCF Debt Yield (%) | Weighted Average Mortgage Rate (%) | |||||||||||
| Retail | 36 | $290,250,776 | 23.1% | 64.9% | 57.4% | 1.81x | 10.5% | 9.9% | 4.817% | |||||||||||
| Anchored | 10 | 137,479,208 | 10.9 | 70.3 | 61.4 | 1.41 | 9.9 | 9.2 | 5.119 | |||||||||||
| Regional Mall | 1 | 80,000,000 | 6.4 | 49.5 | 49.5 | 2.84 | 11.5 | 11.0 | 3.830 | |||||||||||
| Shadow Anchored | 11 | 35,581,093 | 2.8 | 72.7 | 61.1 | 1.52 | 11.1 | 10.2 | 5.325 | |||||||||||
| Unanchored | 12 | 25,020,474 | 2.0 | 71.6 | 54.1 | 1.41 | 11.2 | 10.4 | 5.438 | |||||||||||
| Single Tenant | 2 | 12,170,000 | 1.0 | 69.6 | 59.2 | 1.31 | 8.9 | 8.6 | 5.128 | |||||||||||
| Other | 3 | 197,099,779 | 15.7 | 60.8 | 50.5 | 1.75 | 11.1 | 10.7 | 4.848 | |||||||||||
| Trade Mart | 1 | 139,602,104 | 11.1 | 60.7 | 46.2 | 1.68 | 12.9 | 12.4 | 5.451 | |||||||||||
| Leased Fee | 2 | 57,497,675 | 4.6 | 61.1 | 60.8 | 1.93 | 6.7 | 6.7 | 3.385 | |||||||||||
| Office | 26 | 193,155,806 | 15.4 | 72.9 | 63.7 | 1.44 | 10.8 | 9.7 | 5.378 | |||||||||||
| Suburban | 23 | 104,112,980 | 8.3 | 73.0 | 63.0 | 1.40 | 10.7 | 9.6 | 5.545 | |||||||||||
| CBD | 3 | 89,042,826 | 7.1 | 72.8 | 64.7 | 1.49 | 10.8 | 9.8 | 5.183 | |||||||||||
| Hospitality | 17 | 172,430,907 | 13.7 | 65.8 | 54.6 | 1.73 | 13.2 | 11.7 | 5.173 | |||||||||||
| Limited Service | 14 | 142,115,907 | 11.3 | 65.1 | 53.1 | 1.75 | 13.3 | 11.8 | 5.215 | |||||||||||
| Extended Stay | 2 | 22,850,000 | 1.8 | 70.0 | 64.4 | 1.73 | 12.2 | 11.0 | 4.838 | |||||||||||
| Full Service | 1 | 7,465,000 | 0.6 | 68.0 | 53.6 | 1.50 | 13.3 | 10.9 | 5.402 | |||||||||||
| Multifamily | 28 | 166,702,683 | 13.3 | 67.7 | 60.4 | 1.54 | 10.8 | 10.1 | 5.158 | |||||||||||
| Garden | 22 | 122,758,026 | 9.8 | 67.7 | 61.0 | 1.59 | 10.9 | 10.3 | 5.085 | |||||||||||
| Student Housing | 4 | 38,814,000 | 3.1 | 67.5 | 58.9 | 1.42 | 10.3 | 9.5 | 5.350 | |||||||||||
| Low Rise | 1 | 3,047,120 | 0.2 | 74.3 | 62.1 | 1.35 | 10.6 | 9.2 | 5.490 | |||||||||||
| Mid Rise | 1 | 2,083,537 | 0.2 | 60.7 | 50.7 | 1.43 | 10.3 | 9.6 | 5.354 | |||||||||||
| Manufactured Housing Community | 4 | 74,642,844 | 5.9 | 70.1 | 60.6 | 1.67 | 11.0 | 10.8 | 5.008 | |||||||||||
| Manufactured Housing Community | 4 | 74,642,844 | 5.9 | 70.1 | 60.6 | 1.67 | 11.0 | 10.8 | 5.008 | |||||||||||
| Mixed Use | 2 | 68,500,000 | 5.5 | 61.7 | 55.7 | 1.48 | 9.7 | 9.0 | 4.440 | |||||||||||
| Industrial/Retail | 1 | 48,500,000 | 3.9 | 64.8 | 58.9 | 1.47 | 9.3 | 8.6 | 4.140 | |||||||||||
| Office/Retail | 1 | 20,000,000 | 1.6 | 54.1 | 48.0 | 1.52 | 10.7 | 10.0 | 5.168 | |||||||||||
| Industrial | 17 | 48,439,564 | 3.9 | 73.2 | 62.3 | 1.35 | 10.0 | 9.0 | 5.351 | |||||||||||
| Warehouse | 2 | 25,375,700 | 2.0 | 71.6 | 58.9 | 1.31 | 9.4 | 8.4 | 5.012 | |||||||||||
| Flex | 15 | 23,063,864 | 1.8 | 75.0 | 66.0 | 1.39 | 10.7 | 9.7 | 5.724 | |||||||||||
| Self Storage | 11 | 44,373,676 | 3.5 | 62.6 | 53.6 | 1.65 | 10.9 | 10.7 | 5.015 | |||||||||||
| Self Storage | 11 | 44,373,676 | 3.5 | 62.6 | 53.6 | 1.65 | 10.9 | 10.7 | 5.015 | |||||||||||
| Total/Weighted Average | 144 | $1,255,596,034 | 100.0% | 66.4% | 57.4% | 1.65x | 11.0% | 10.3% | 5.021% | |||||||||||
(1) | Because this table presents information relating to the mortgaged properties and not the mortgage loans, the information for mortgage loans secured by more than one mortgaged property is based on allocated amounts (allocating the mortgage loan principal balance to each of those properties according to the relative appraised values of the mortgaged properties or the allocated loan amounts or property-specific release prices set forth in the related mortgage loan documents or such other allocation as the related mortgage loan seller deemed appropriate). With respect to the AmericasMart Mortgage Loan, the PennCap Portfolio Mortgage Loan and The Outlet Collection | Jersey Gardens Mortgage Loan, loan-to-value ratio, debt service coverage ratio and debt yield calculations include the related pari passu companion loan(s) (unless otherwise stated). Debt service coverage ratio, debt yield and loan-to-value ratio information takes no account of subordinate debt (whether or not secured by the related mortgaged property) that is allowed under the terms of any mortgage loan. See Annex A-1 to the Free Writing Prospectus. |
| THE INFORMATION IN THIS STRUCTURAL AND COLLATERAL TERM SHEET IS NOT COMPLETE AND MAY BE AMENDED PRIOR TO THE TIME OF SALE. THIS TERM SHEET IS NOT AN OFFER TO SELL THESE SECURITIES AND IT IS NOT A SOLICITATION OF AN OFFER TO BUY THESE SECURITIES IN ANY JURISDICTION WHERE THE OFFER OR SALE IS NOT PERMITTED. |
14
WFRBS Commercial Mortgage Trust 2014-LC14 | Characteristics of the Mortgage Pool |
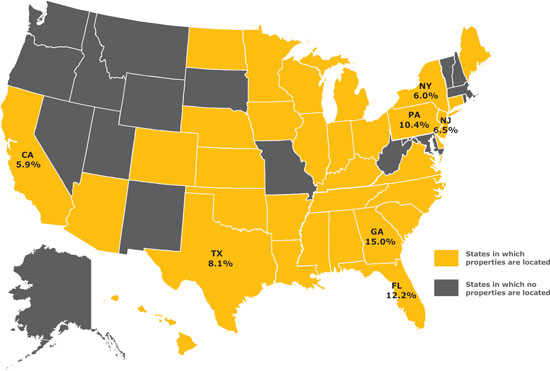
G. Geographic Distribution(1)(2)
Location | Number of Mortgaged Properties | Aggregate Cut- off Date Balance ($) | % of Cut- off Date Balance (%) | Weighted Average Cut-off Date LTV Ratio (%) | Weighted Average Balloon or ARD LTV Ratio (%) | Weighted Average U/W NCF DSCR (x) | Weighted Average U/W NOI Debt Yield (%) | Weighted Average U/W NCF Debt Yield (%) | Weighted Average Mortgage Rate (%) | |||||||||||||||
| Georgia | 13 | $188,566,090 | 15.0% | 62.0% | 48.8% | 1.64x | 12.4% | 11.8% | 5.354% | |||||||||||||||
| Florida | 9 | 152,774,720 | 12.2 | 69.6 | 60.8 | 1.39 | 9.3 | 8.7 | 4.760 | |||||||||||||||
| Pennsylvania | 34 | 131,082,704 | 10.4 | 73.7 | 64.5 | 1.40 | 10.5 | 9.5 | 5.530 | |||||||||||||||
| Texas | 8 | 101,483,898 | 8.1 | 69.4 | 62.3 | 1.58 | 10.3 | 9.6 | 5.038 | |||||||||||||||
| New Jersey | 2 | 82,117,949 | 6.5 | 49.7 | 49.5 | 2.81 | 11.5 | 11.0 | 3.870 | |||||||||||||||
| New York | 2 | 75,000,000 | 6.0 | 59.7 | 58.1 | 1.84 | 7.6 | 7.4 | 3.789 | |||||||||||||||
| California | 12 | 74,087,941 | 5.9 | 60.4 | 51.6 | 1.86 | 12.9 | 12.0 | 4.915 | |||||||||||||||
| Northern | 6 | 48,499,659 | 3.9 | 62.2 | 53.9 | 1.69 | 11.6 | 11.0 | 4.931 | |||||||||||||||
| Southern | 6 | 25,588,282 | 2.0 | 56.9 | 47.3 | 2.18 | 15.3 | 13.9 | 4.886 | |||||||||||||||
Other(3) | 64 | 450,482,733 | 35.9 | 69.4 | 59.1 | 1.55 | 11.5 | 10.6 | 5.250 | |||||||||||||||
| Total/Weighted Average | 144 | $1,255,596,034 | 100.0% | 66.4% | 57.4% | 1.65x | 11.0% | 10.3% | 5.021% | |||||||||||||||
| (1) | The Mortgaged Properties are located in 33 states. |
| (2) | Because this table presents information relating to the mortgaged properties and not the mortgage loans, the information for mortgage loans secured by more than one mortgaged property is based on allocated amounts (allocating the mortgage loan principal balance to each of those properties according to the relative appraised values of the mortgaged properties or the allocated loan amounts or property-specific release prices set forth in the related mortgage loan documents or such other allocation as the related mortgage loan seller deemed appropriate). With respect to the AmericasMart Mortgage Loan, the PennCap Portfolio Mortgage Loan and The Outlet Collection | Jersey Gardens Mortgage Loan, loan-to-value ratio, debt service coverage ratio and debt yield calculations include the related pari passu companion loan(s) (unless otherwise stated). Debt service coverage ratio, debt yield and loan-to-value ratio information takes no account of subordinate debt (whether or not secured by the related mortgaged property), if any, that is allowed under the terms of any mortgage loan. See Annex A-1 to the Free Writing Prospectus. |
| (3) | Includes 26 other states. |
| THE INFORMATION IN THIS STRUCTURAL AND COLLATERAL TERM SHEET IS NOT COMPLETE AND MAY BE AMENDED PRIOR TO THE TIME OF SALE. THIS TERM SHEET IS NOT AN OFFER TO SELL THESE SECURITIES AND IT IS NOT A SOLICITATION OF AN OFFER TO BUY THESE SECURITIES IN ANY JURISDICTION WHERE THE OFFER OR SALE IS NOT PERMITTED. |
15
| WFRBS Commercial Mortgage Trust 2014-LC14 | Characteristics of the Mortgage Pool |
| H. | Characteristics of the Mortgage Pool(1) |
| CUT-OFF DATE BALANCE | LOAN PURPOSE | ||||||||||||||||||
| Number of | Number of | ||||||||||||||||||
| Range of Cut-off Date | Mortgage | Aggregate Cut- | % of Cut-off | Mortgage | Aggregate Cut- | % of Cut-off | |||||||||||||
| Balances ($) | Loans | off Date Balance | Date Balance | Loan Purpose | Loans | off Date Balance | Date Balance | ||||||||||||
| 1,014,091 - 2,000,000 | 1 | $1,014,091 | 0.1% | Refinance | 46 | $808,210,604 | 64.4% | ||||||||||||
| 2,000,001 - 3,000,000 | 5 | 11,962,955 | 1.0 | Acquisition | 24 | 432,631,197 | 34.5 | ||||||||||||
| 3,000,001 - 4,000,000 | 3 | 10,361,797 | 0.8 | Various | 1 | 14,754,233 | 1.2 | ||||||||||||
| 4,000,001 - 5,000,000 | 6 | 27,719,744 | 2.2 | Total: | 71 | $1,255,596,034 | 100.0% | ||||||||||||
| 5,000,001 - 6,000,000 | 5 | 26,840,991 | 2.1 | ||||||||||||||||
| 6,000,001 - 7,000,000 | 3 | 19,744,745 | 1.6 | MORTGAGE RATE | |||||||||||||||
| 7,000,001 - 8,000,000 | 5 | 36,443,779 | 2.9 | Number of | |||||||||||||||
| 8,000,001 - 9,000,000 | 4 | 33,853,948 | 2.7 | Range of Mortgage Rates | Mortgage | Aggregate Cut- | % of Cut-off | ||||||||||||
| 9,000,001 - 10,000,000 | 1 | 9,125,000 | 0.7 | (%) | Loans | off Date Balance | Date Balance | ||||||||||||
| 10,000,001 - 15,000,000 | 15 | 189,996,468 | 15.1 | 3.287 - 3.500 | 1 | $55,000,000 | 4.4% | ||||||||||||
| 15,000,001 - 20,000,000 | 8 | 145,351,413 | 11.6 | 3.501 - 4.000 | 1 | 80,000,000 | 6.4 | ||||||||||||
| 20,000,001 - 30,000,000 | 5 | 132,405,000 | 10.5 | 4.001 - 4.250 | 1 | 48,500,000 | 3.9 | ||||||||||||
| 30,000,001 - 50,000,000 | 6 | 246,174,000 | 19.6 | 4.251 - 4.500 | 1 | 25,750,000 | 2.1 | ||||||||||||
| 50,000,001 - 70,000,000 | 1 | 55,000,000 | 4.4 | 4.501 - 4.750 | 2 | 19,757,472 | 1.6 | ||||||||||||
| 70,000,001 - 80,000,000 | 1 | 80,000,000 | 6.4 | 4.751 - 5.000 | 16 | 204,964,208 | 16.3 | ||||||||||||
| 80,000,001 - 90,000,000 | 1 | 90,000,000 | 7.2 | 5.001 - 5.250 | 17 | 289,839,819 | 23.1 | ||||||||||||
| 90,000,001 - 139,602,104 | 1 | 139,602,104 | 11.1 | 5.251 - 5.500 | 20 | 372,545,718 | 29.7 | ||||||||||||
| Total: | 71 | $1,255,596,034 | 100.0% | 5.501 - 5.750 | 10 | 145,938,817 | 11.6 | ||||||||||||
| Average: | $17,684,451 | 5.751 - 5.880 | 2 | 13,300,000 | 1.1 | ||||||||||||||
| Total: | 71 | $1,255,596,034 | 100.0% | ||||||||||||||||
| UNDERWRITTEN NOI DEBT SERVICE COVERAGE RATIO | Weighted Average: | 5.021% | |||||||||||||||||
| Number of | |||||||||||||||||||
| Range of U/W NOI | Mortgage | Aggregate Cut- | % of Cut-off | UNDERWRITTEN NOI DEBT YIELD | |||||||||||||||
| DSCRs (x) | Loans | off Date Balance | Date Balance | Number of | |||||||||||||||
| 1.20 | 1 | $5,100,000 | 0.4% | Range of U/W NOI | Mortgage | Aggregate Cut- | % of Cut-off | ||||||||||||
| 1.21 - 1.30 | 3 | 61,200,000 | 4.9 | Debt Yields (%) | Loans | off Date Balance | Date Balance | ||||||||||||
| 1.31 - 1.40 | 2 | 38,875,318 | 3.1 | 6.5 - 8.0 | 1 | $55,000,000 | 4.4% | ||||||||||||
| 1.41 - 1.50 | 11 | 149,527,181 | 11.9 | 8.1 - 9.0 | 6 | 119,550,000 | 9.5 | ||||||||||||
| 1.51 - 1.60 | 12 | 225,979,898 | 18.0 | 9.1 - 10.0 | 10 | 192,381,094 | 15.3 | ||||||||||||
| 1.61 - 1.70 | 9 | 181,025,577 | 14.4 | 10.1 - 11.0 | 22 | 361,201,222 | 28.8 | ||||||||||||
| 1.71 - 1.80 | 8 | 219,900,371 | 17.5 | 11.1 - 12.0 | 9 | 193,534,065 | 15.4 | ||||||||||||
| 1.81 - 1.90 | 5 | 65,533,655 | 5.2 | 12.1 - 13.0 | 2 | 154,302,104 | 12.3 | ||||||||||||
| 1.91 - 2.00 | 7 | 125,867,196 | 10.0 | 13.1 - 14.0 | 14 | 123,524,975 | 9.8 | ||||||||||||
| 2.01 - 2.25 | 8 | 80,511,224 | 6.4 | 14.1 - 15.0 | 3 | 28,265,163 | 2.3 | ||||||||||||
| 2.26 - 2.50 | 2 | 12,686,156 | 1.0 | 15.1 - 16.0 | 1 | 5,493,957 | 0.4 | ||||||||||||
| 2.51 - 3.00 | 2 | 87,092,126 | 6.9 | 16.1 - 19.0 | 2 | 20,046,122 | 1.6 | ||||||||||||
| 3.01 - 3.98 | 1 | 2,297,332 | 0.2 | 19.1 - 24.6 | 1 | 2,297,332 | 0.2 | ||||||||||||
| Total: | 71 | $1,255,596,034 | 100.0% | Total: | 71 | $1,255,596,034 | 100.0% | ||||||||||||
| Weighted Average: | 1.77x | Weighted Average: | 11.0% | ||||||||||||||||
| UNDERWRITTEN NCF DEBT SERVICE COVERAGE RATIO | |||||||||||||||||||
| Number of | UNDERWRITTEN NCF DEBT YIELD | ||||||||||||||||||
| Range of U/W NCF | Mortgage | Aggregate Cut- | % of Cut-off | Number of | |||||||||||||||
| DSCRs (x) | Loans | off Date Balance | Date Balance | Range of U/W NCF | Mortgage | Aggregate Cut- | % of Cut-off | ||||||||||||
| 1.20 | 1 | $5,100,000 | 0.4% | Debt Yields (%) | Loans | off Date Balance | Date Balance | ||||||||||||
| 1.21 - 1.30 | 5 | 98,175,318 | 7.8 | 6.5 - 8.0 | 1 | $55,000,000 | 4.4% | ||||||||||||
| 1.31 - 1.40 | 11 | 231,110,596 | 18.4 | 8.1 - 9.0 | 13 | 287,201,780 | 22.9 | ||||||||||||
| 1.41 - 1.50 | 13 | 202,909,950 | 16.2 | 9.1 - 10.0 | 20 | 374,786,345 | 29.8 | ||||||||||||
| 1.51 - 1.60 | 15 | 185,226,764 | 14.8 | 10.1 - 11.0 | 15 | 202,947,207 | 16.2 | ||||||||||||
| 1.61 - 1.70 | 7 | 218,727,226 | 17.4 | 11.1 - 12.0 | 8 | 93,197,074 | 7.4 | ||||||||||||
| 1.71 - 1.80 | 7 | 61,806,430 | 4.9 | 12.1 - 13.0 | 8 | 193,234,018 | 15.4 | ||||||||||||
| 1.81 - 1.90 | 4 | 73,164,136 | 5.8 | 13.1 - 14.0 | 2 | 12,686,156 | 1.0 | ||||||||||||
| 1.91 - 2.00 | 2 | 63,100,000 | 5.0 | 14.1 - 15.0 | 1 | 14,200,000 | 1.1 | ||||||||||||
| 2.01 - 2.25 | 3 | 26,886,156 | 2.1 | 15.1 - 17.0 | 1 | 7,092,126 | 0.6 | ||||||||||||
| 2.26 - 2.75 | 1 | 7,092,126 | 0.6 | 17.1 - 19.0 | 1 | 12,953,996 | 1.0 | ||||||||||||
| 2.76 - 3.00 | 1 | 80,000,000 | 6.4 | 19.1 - 24.1 | 1 | 2,297,332 | 0.2 | ||||||||||||
| 3.01 - 3.91 | 1 | 2,297,332 | 0.2 | Total: | 71 | $1,255,596,034 | 100.0% | ||||||||||||
| Total: | 71 | $1,255,596,034 | 100.0% | Weighted Average: | 10.3% | ||||||||||||||
| Weighted Average: | 1.65x | ||||||||||||||||||
| (1) | With respect to the AmericasMart Mortgage Loan, the PennCap Portfolio Mortgage Loan and The Outlet Collection | Jersey Gardens Mortgage Loan, loan-to-value ratio, debt service coverage ratio and debt yield calculations include the related pari passu companion loan (unless otherwise stated) in total debt. Debt service coverage ratio, debt yield and loan-to-value ratio information takes no account of subordinate debt (whether or not secured by the related mortgaged property), if any, that is allowed under the terms of any mortgage loan. See Annex A-1 to the Free Writing Prospectus. |
THE INFORMATION IN THIS STRUCTURAL AND COLLATERAL TERM SHEET IS NOT COMPLETE AND MAY BE AMENDED PRIOR TO THE TIME OF SALE. THIS TERM SHEET IS NOT AN OFFER TO SELL THESE SECURITIES AND IT IS NOT A SOLICITATION OF AN OFFER TO BUY THESE SECURITIES IN ANY JURISDICTION WHERE THE OFFER OR SALE IS NOT PERMITTED.
16
WFRBS Commercial Mortgage Trust 2014-LC14 | Characteristics of the Mortgage Pool |
| ORIGINAL TERM TO MATURITY OR ARD | CUT-OFF DATE LOAN-TO-VALUE RATIO | |||||||||||||||||||||||
| Number of | ||||||||||||||||||||||||
| Range of Original Terms to | Mortgage | Aggregate Cut- | % of Cut-off | Number of | ||||||||||||||||||||
| Maturity or ARD (months) | Loans | off Date Balance | Date Balance | Range of Cut-off Date LTV | Mortgage | Aggregate Cut- | % of Cut-off | |||||||||||||||||
| 60 | 8 | $196,253,996 | 15.6 | % | Ratios (%) | Loans | off Date Balance | Date Balance | ||||||||||||||||
| 84 | 1 | 80,000,000 | 6.4 | 29.3 - 30.0 | 1 | $2,297,332 | 0.2 | % | ||||||||||||||||
| 120 | 61 | 976,844,364 | 77.8 | 30.1 - 50.0 | 3 | 84,697,675 | 6.7 | |||||||||||||||||
| 126 | 1 | 2,497,675 | 0.2 | 50.1 - 55.0 | 3 | 35,755,385 | 2.8 | |||||||||||||||||
| Total: | 71 | $1,255,596,034 | 100.0 | % | 55.1 - 60.0 | 6 | 45,775,559 | 3.6 | ||||||||||||||||
| Weighted Average: | 108 months | 60.1 - 65.0 | 14 | 357,249,171 | 28.5 | |||||||||||||||||||
| REMAINING TERM TO MATURITY OR ARD | 65.1 - 70.0 | 17 | 231,919,731 | 18.5 | ||||||||||||||||||||
| Number of | 70.1 - 75.0 | 27 | 497,901,181 | 39.7 | ||||||||||||||||||||
| Range of Remaining Terms | Mortgage | Aggregate Cut- | % of Cut-off | Total: | 71 | $1,255,596,034 | 100.0 | % | ||||||||||||||||
| to Maturity or ARD (months) | Loans | off Date Balance | Date Balance | Weighted Average: | 66.4 | % | ||||||||||||||||||
| 58 - 60 | 8 | $196,253,996 | 15.6 | % | ||||||||||||||||||||
| 61 - 84 | 1 | 80,000,000 | 6.4 | BALLOON OR ARD LOAN-TO-VALUE RATIO | ||||||||||||||||||||
| 85 - 120 | 61 | 976,844,364 | 77.8 | Number of | ||||||||||||||||||||
| 121 - 125 | 1 | 2,497,675 | 0.2 | Range of Balloon LTV | Mortgage | Aggregate Cut- | % of Cut-off | |||||||||||||||||
| Total: | 71 | $1,255,596,034 | 100.0 | % | Ratios (%) | Loans | off Date Balance | Date Balance | ||||||||||||||||
| Weighted Average: | 107 months | 23.8 - 25.0 | 1 | $2,297,332 | 0.2 | % | ||||||||||||||||||
| ORIGINAL AMORTIZATION TERM(2) | 25.1 - 35.0 | 1 | 2,200,000 | 0.2 | ||||||||||||||||||||
| Range of Original | Number of | 35.1 - 40.0 | 1 | 2,497,675 | 0.2 | |||||||||||||||||||
| Amortization Terms | Mortgage | Aggregate Cut- | % of Cut-off | 40.1 - 45.0 | 1 | 7,092,126 | 0.6 | |||||||||||||||||
| (months) | Loans | off Date Balance | Date Balance | 45.1 - 50.0 | 14 | 329,931,090 | 26.3 | |||||||||||||||||
| Interest-Only | 3 | $160,750,000 | 12.8 | % | 50.1 - 55.0 | 11 | 110,422,218 | 8.8 | ||||||||||||||||
| 180 | 1 | 12,953,996 | 1.0 | 55.1 - 60.0 | 14 | 247,509,372 | 19.7 | |||||||||||||||||
| 181 - 240 | 1 | 11,375,318 | 0.9 | 60.1 - 65.0 | 20 | 326,858,122 | 26.0 | |||||||||||||||||
| 241 - 300 | 7 | 191,185,759 | 15.2 | 65.1 - 70.0 | 7 | 201,038,100 | 16.0 | |||||||||||||||||
| 301 - 360 | 59 | 879,330,961 | 70.0 | 70.1 - 72.2 | 1 | 25,750,000 | 2.1 | |||||||||||||||||
| Total: | 71 | $1,255,596,034 | 100.0 | % | Total: | 71 | $1,255,596,034 | 100.0 | % | |||||||||||||||
Weighted Average(3): | 346 months | Weighted Average: | 57.4 | % | ||||||||||||||||||||
(2) The original amortization term shown for any mortgage loan that is interest-only for part of its term does not include the number of months in its interest-only period and reflects only the number of months as of the commencement of amortization remaining from the end of such interest-only period. | ||||||||||||||||||||||||
| AMORTIZATION TYPE | ||||||||||||||||||||||||
| Number | ||||||||||||||||||||||||
| of | ||||||||||||||||||||||||
(3) Excludes the non-amortizing loans. | Mortgage | Aggregate Cut- | % of Cut-off | |||||||||||||||||||||
| REMAINING AMORTIZATION TERM(4) | Type of Amortization | Loans | off Date Balance | Date Balance | ||||||||||||||||||||
| Range of Remaining | Number of | Amortizing Balloon | 47 | $620,033,934 | 49.4 | % | ||||||||||||||||||
| Amortization Terms | Mortgage | Aggregate Cut- | % of Cut-off | Interest-only, Amortizing Balloon | 20 | 435,062,100 | 34.6 | |||||||||||||||||
| (months) | Loans | off Date Balance | Date Balance | Interest-only, Balloon | 2 | 105,750,000 | 8.4 | |||||||||||||||||
| Interest-Only | 3 | $160,750,000 | 12.8 | % | Interest-only, ARD | 1 | 55,000,000 | 4.4 | ||||||||||||||||
| 179 - 180 | 1 | 12,953,996 | 1.0 | Interest-only, Amortizing ARD | 1 | 39,750,000 | 3.2 | |||||||||||||||||
| 181 - 240 | 1 | 11,375,318 | 0.9 | Total: | 71 | $1,255,596,034 | 100.0 | % | ||||||||||||||||
| 241 - 300 | 7 | 191,185,759 | 15.2 | |||||||||||||||||||||
| 301 - 360 | 59 | 879,330,961 | 70.0 | ORIGINAL TERM OF INTEREST-ONLY PERIOD FOR PARTIAL IO LOANS | ||||||||||||||||||||
| Total: | 71 | $1,255,596,034 | 100.0 | % | Number of | |||||||||||||||||||
Weighted Average(5): | 345 months | Mortgage | Aggregate Cut- | % of Cut-off | ||||||||||||||||||||
| (4) The remaining amortization term shown for any mortgage loan that is interest-only for part of its term does not include the number of months in its interest-only period and reflects only the number of months as of the commencement of amortization remaining from the end of such interest-only period. | IO Term (months) | Loans | off Date Balance | Date Balance | ||||||||||||||||||||
| 12 | 2 | $17,565,000 | 1.4 | % | ||||||||||||||||||||
| 13 - 24 | 7 | 188,421,500 | 15.0 | |||||||||||||||||||||
| 25 - 36 | 5 | 117,800,000 | 9.4 | |||||||||||||||||||||
| (5) Excludes the non-amortizing loans. | 37 - 48 | 4 | 91,725,600 | 7.3 | ||||||||||||||||||||
| LOCKBOXES | 49 - 60 | 3 | 59,300,000 | 4.7 | ||||||||||||||||||||
| Number | Total: | 21 | $474,812,100 | 37.8 | % | |||||||||||||||||||
| of | Weighted Average: | 35 months | ||||||||||||||||||||||
| Mortgage | Aggregate Cut- | % of Cut-off | ||||||||||||||||||||||
| Type of Lockbox | Loans | off Date Balance | Date Balance | SEASONING | ||||||||||||||||||||
| Hard/Springing Cash Management | 19 | $346,736,703 | 27.6 | % | Number of | |||||||||||||||||||
| Hard/Upfront Cash Management | 7 | 330,972,104 | 26.4 | Mortgage | Aggregate Cut- | % of Cut-off | ||||||||||||||||||
| Springing (W/Out Estab. Account) | 26 | 300,144,961 | 23.9 | Seasoning (months) | Loans | off Date Balance | Date Balance | |||||||||||||||||
| Soft/Springing Cash Management | 9 | 146,978,936 | 11.7 | 0 | 22 | $394,245,600 | 31.4 | % | ||||||||||||||||
| Springing (With Estab. Account) | 2 | 48,033,569 | 3.8 | 1 - 3 | 48 | 854,477,469 | 68.1 | |||||||||||||||||
| None | 7 | 43,915,761 | 3.5 | 4 | 1 | 6,872,965 | 0.5 | |||||||||||||||||
| Soft/Upfront Cash Management | 1 | 38,814,000 | 3.1 | Total: | 71 | $1,255,596,034 | 100.0 | % | ||||||||||||||||
| Total: | 71 | $1,255,596,034 | 100.0 | % | Weighted Average: | 1 month | ||||||||||||||||||
| PREPAYMENT PROVISION SUMMARY | ||||||||||||||||||||||||
| Number of | % of Cut- | |||||||||||||||||||||||
| Mortgage | Aggregate Cut- | off Date | ||||||||||||||||||||||
| Prepayment Provision | Loans | off Date Balance | Balance | |||||||||||||||||||||
| Lockout/Defeasance/Open | 58 | $1,071,205,798 | 85.3 | % | ||||||||||||||||||||
| Lockout/YM%/Open | 8 | 108,613,852 | 8.7 | |||||||||||||||||||||
| YM%/YM% Defeasance/Open | 1 | 39,750,000 | 3.2 | |||||||||||||||||||||
| Lockout/YM% Defeasance/Open | 3 | 21,276,385 | 1.7 | |||||||||||||||||||||
| Lockout/YM%/YM% Defeasance/Open | 1 | 14,750,000 | 1.2 | |||||||||||||||||||||
| Total: | 71 | $1,255,596,034 | 100.0 | % | ||||||||||||||||||||
THE INFORMATION IN THIS STRUCTURAL AND COLLATERAL TERM SHEET IS NOT COMPLETE AND MAY BE AMENDED PRIOR TO THE TIME OF SALE. THIS TERM SHEET IS NOT AN OFFER TO SELL THESE SECURITIES AND IT IS NOT A SOLICITATION OF AN OFFER TO BUY THESE SECURITIES IN ANY JURISDICTION WHERE THE OFFER OR SALE IS NOT PERMITTED.
17
WFRBS Commercial Mortgage Trust 2014-LC14 | Certain Terms and Conditions |
V. Certain Terms and Conditions
| Interest Entitlements: | The interest entitlement of each Class of Offered Certificates on each Distribution Date generally will be the interest accrued during the related Interest Accrual Period on the related Certificate Principal Balance or Notional Amount at the related pass-through rate, net of any prepayment interest shortfalls allocated to that Class for such Distribution Date as described below. If prepayment interest shortfalls arise from voluntary prepayments (without Special Servicer consent) on particular non-specially serviced mortgage loans during any collection period, the Master Servicer is required to make a compensating interest payment to offset those shortfalls, generally up to an amount equal to the portion of its master servicing fees that accrue at one basis point per annum. The remaining amount of prepayment interest shortfalls will be allocated to reduce the interest entitlement on all Classes of Certificates (other than the Class X-A, X-B and X-C Certificates), pro rata, based on their respective amounts of accrued interest for the related Distribution Date (except with respect to the allocation among the Class A-S, B, C and PEX Certificates as described below under “Allocations and Distributions on the Class A-S, B, C and PEX Certificates”). If a Class receives less than the entirety of its interest entitlement on any Distribution Date, then the shortfall, excluding any shortfall due to prepayment interest shortfalls, will be added to its interest entitlement for the next succeeding Distribution Date. Interest entitlements on the Class E, D, C and B Certificates, in that order, may be reduced by certain Trust Advisor expenses (subject to the discussion below under “Allocations and Distributions on the Class A-S, B, C and PEX Certificates”). |
| Principal Distribution Amount: | The Principal Distribution Amount for each Distribution Date generally will be the aggregate amount of principal received or advanced in respect of the mortgage loans, net of any non-recoverable advances and interest thereon that are reimbursed to the Master Servicer, the Special Servicer or the Trustee during the related collection period. Non-recoverable advances and interest thereon are reimbursable from principal collections and advances before reimbursement from other amounts. The Principal Distribution Amount may also be reduced, with a corresponding loss, to the Class E and D Certificates and the Class C, B and A-S regular interests, then to the Class A-1, A-2, A-3, A-4, A-5 and A-SB Certificates (with any losses on the Class A-1, A-2, A-3, A-4, A-5 and A-SB Certificates allocated pro rata according to their respective Certificate Principal Balances immediately prior to that Distribution Date), in that order, in connection with certain Trust Advisor expenses to the extent that interest entitlements on the Class B and C regular interests and the Class D and E Certificates are insufficient to absorb the effect of the expense on any particular Distribution Date. For a discussion on the allocation of amounts distributable in respect of the Class A-S, B and C regular interests, see “Allocations and Distributions on the Class A-S, B, C and PEX Certificates” below. |
| Distributions: | On each Distribution Date, funds available for distribution from the mortgage loans, net of specified trust fees, expenses and reimbursements will generally be distributed in the following amounts and order of priority (in each case to the extent of remaining available funds): |
1. Class A-1, A-2, A-3, A-4, A-5, A-SB, X-A, X-B and X-C Certificates: To interest on the Class A-1, A-2, A-3, A-4, A-5, A-SB, X-A, X-B and X-C Certificates, pro rata, according to their respective interest entitlements. | |
| 2. Class A-1, A-2, A-3, A-4, A-5 and A-SB Certificates: To principal on the Class A-1, A-2, A-3, A-4, A-5 and A-SB Certificates in the following amounts and order of priority: (i) first, to principal on the Class A-SB Certificates, in an amount up to the Principal Distribution Amount for such Distribution Date until their Certificate Principal Balance is reduced to the Class A-SB Planned Principal Balance for such Distribution Date; (ii) second, to principal on the Class A-1 Certificates until their Certificate Principal Balance is reduced to zero, up to the remainder of the Principal Distribution Amount for such Distribution Date; (iii) third, to principal on the Class A-2 Certificates until their Certificate Principal Balance is reduced to zero, up to the remainder of the Principal Distribution Amount for such Distribution Date; (iv) fourth, to principal on the Class A-3 Certificates until their Certificate Principal Balance is reduced to zero, up to the remainder of the Principal Distribution Amount for such Distribution Date; (v) fifth, to principal on the Class A-4 Certificates until their Certificate Principal Balance is reduced to zero, up to the remainder of the Principal Distribution Amount for such Distribution Date; (vi) sixth, to principal on the Class A-5 Certificates until their Certificate Principal Balance is reduced to zero, up to the remainder of the Principal Distribution Amount for such Distribution Date; and (vii) seventh, to principal on the Class A-SB Certificates until their Certificate Principal Balance is reduced to zero, up to the remainder of the Principal Distribution Amount for such Distribution Date. However, if the Certificate Principal Balance of each and every Class of Principal Balance Certificates, other than the Class A-1, A-2, A-3, A-4, A-5 and A-SB Certificates, has been reduced to zero as a result of the allocation of Mortgage Loan losses and expenses and any of the Class A-1, A-2, A-3, A-4, A-5 and A-SB Certificates |
THE INFORMATION IN THIS STRUCTURAL AND COLLATERAL TERM SHEET IS NOT COMPLETE AND MAY BE AMENDED PRIOR TO THE TIME OF SALE. THIS TERM SHEET IS NOT AN OFFER TO SELL THESE SECURITIES AND IT IS NOT A SOLICITATION OF AN OFFER TO BUY THESE SECURITIES IN ANY JURISDICTION WHERE THE OFFER OR SALE IS NOT PERMITTED.
18
WFRBS Commercial Mortgage Trust 2014-LC14 | Certain Terms and Conditions |
remains outstanding, then the Principal Distribution Amount will be distributed on the Class A-1, A-2, A-3, A-4, A-5 and A-SB Certificates, pro rata, based on their respective outstanding Certificate Principal Balances, until their Certificate Principal Balances have been reduced to zero. 3. Class A-1, A-2, A-3, A-4, A-5 and A-SB Certificates: To reimburse the holders of the Class A-1, A-2, A-3, A-4, A-5 and A-SB Certificates, pro rata, for any previously unreimbursed losses (other than certain Trust Advisor expenses) on the mortgage loans that were previously allocated in reduction of the Certificate Principal Balances of such Classes. | |
4. Class A-S regular interest: To make distributions on the Class A-S regular interest as follows: (a) first, to interest on Class A-S regular interest in the amount of the interest entitlement for that Class; (b) next, to the extent of the portion of the Principal Distribution Amount remaining after distributions in respect of principal to each Class with a higher distribution priority (in this case, the Class A-1, A-2, A-3, A-4, A-5 and A-SB Certificates), to principal on the Class A-S regular interest until its principal balance is reduced to zero; and (c) next, to reimburse the holders of the Class A-S regular interest for any previously unreimbursed losses (other than certain Trust Advisor expenses) on the mortgage loans that were previously allocated to that Class in reduction of its principal balance. 5. Class B regular interest: To make distributions on the Class B regular interest as follows: (a) first, to interest on Class B regular interest in the amount of the interest entitlement for that Class; (b) next, to the extent of the portion of the Principal Distribution Amount remaining after distributions in respect of principal to each Class with a higher distribution priority (in this case, the Class A-1, A-2, A-3, A-4, A-5 and A-SB Certificates and the Class A-S regular interest), to principal on the Class B regular interest until its principal balance is reduced to zero; and (c) next, to reimburse the holders of the Class B regular interest for any previously unreimbursed losses (other than certain Trust Advisor expenses) on the mortgage loans that were previously allocated to that Class in reduction of its principal balance. 6. Class C regular interest: To make distributions on the Class C regular interest as follows: (a) first, to interest on Class C regular interest in the amount of the interest entitlement for that Class; (b) next, to the extent of the portion of the Principal Distribution Amount remaining after distributions in respect of principal to each Class with a higher distribution priority (in this case, the Class A-1, A-2, A-3, A-4, A-5 and A-SB Certificates and the Class A-S and B regular interests), to principal on the Class C regular interest until its principal balance is reduced to zero; and (c) next, to reimburse the holders of the Class C regular interest for any previously unreimbursed losses (other than certain Trust Advisor expenses) on the mortgage loans that were previously allocated to that Class in reduction of its principal balance. | |
| 7. After the Class A-1, A-2, A-3, A-4, A-5 and A-SB Certificates and Class A-S, B and C regular interests are paid all amounts to which they are entitled, the remaining funds available for distribution will be used to pay interest, principal and loss reimbursement amounts (other than certain Trust Advisor expenses) on the Class D, E, F and G Certificates sequentially in that order in a manner analogous to the Class C regular interest. | |
| Allocations and Distributions on the Class A-S, B, C and PEX Certificates: | On the closing date, the upper-tier REMIC of the issuing entity will issue the Class A-S, Class B and Class C regular interests (each a “regular interest”) which will have outstanding principal balances on the closing date of $95,739,000, $81,614,000 and $47,085,000, respectively. The regular interests will be held in a grantor trust for the benefit of the holders of the Class A-S, B, C and PEX Certificates. The Class A-S, B, C and PEX Certificates will, at all times, represent undivided beneficial ownership interests in a grantor trust that will hold those regular interests. Each class of the Class A-S, B, C and PEX Certificates will, at all times, represent an undivided beneficial ownership interest in a percentage of the outstanding principal balance of the regular interest with the same alphabetical class designation. The Class PEX Certificates will, at all times, represent an undivided beneficial ownership interest in the remaining percentages of the outstanding principal balances of the Class A-S, B and C regular interests and which percentage interests are referred to in this Term Sheet as the “Class PEX Component A-S, Class PEX Component B and Class PEX Component C” (collectively, the “Class PEX Components”). |
THE INFORMATION IN THIS STRUCTURAL AND COLLATERAL TERM SHEET IS NOT COMPLETE AND MAY BE AMENDED PRIOR TO THE TIME OF SALE. THIS TERM SHEET IS NOT AN OFFER TO SELL THESE SECURITIES AND IT IS NOT A SOLICITATION OF AN OFFER TO BUY THESE SECURITIES IN ANY JURISDICTION WHERE THE OFFER OR SALE IS NOT PERMITTED.
19
WFRBS Commercial Mortgage Trust 2014-LC14 | Certain Terms and Conditions |
Interest, principal, prepayment premiums, yield maintenance charges and voting rights that are allocated to the Class A-S, B or C regular interest will be distributed or allocated, as applicable, as between the Class A-S, B or C Certificates, as applicable, on the one hand, and Class PEX Component A-S, Class PEX Component B or Class PEX Component C, as applicable (and correspondingly, the Class PEX Certificates), on the other hand, pro rata, based on their respective percentage interests in the Class A-S, Class B or Class C regular interest, as applicable. In addition, any losses (including, without limitation, as a result of Trust Advisor expenses) that are allocated to the Class A-S, Class B or Class C regular interest will correspondingly be allocated as between the Class A-S, B or C Certificates, as applicable, on the one hand, and Class PEX Component A-S, Class PEX Component B or Class PEX Component C, as applicable (and correspondingly, the Class PEX Certificates), on the other hand, pro rata, based on their respective percentage interests in the Class A-S, Class B or Class C regular interest, as applicable. For a complete description of the allocations and distributions with respect to the Class A-S regular interest, the Class B regular interest and the Class C regular interest (and correspondingly the Class A-S, B, C and PEX Certificates and the Class PEX Component A-S, Class PEX Component B and Class PEX Component C), see “Description of the Offered Certificates” in the Free Writing Prospectus. See “Material Federal Income Tax Consequences” in the Free Writing Prospectus for a discussion of the tax treatment of the Exchangeable Certificates. | |
Exchanging Certificates through Combination and Recombination: | If you own Class A-S, B and C Certificates, you will be able to exchange them for a proportionate interest in the Class PEX Certificates, and vice versa, as described in the Free Writing Prospectus. You can exchange your Exchangeable Certificates by notifying the Certificate Administrator. If Exchangeable Certificates are outstanding and held by certificateholders, those certificates will receive principal and interest that would otherwise have been payable on the same proportion of certificates exchanged therefor if those certificates were outstanding and held by certificateholders. Any such allocations of principal and interest between classes of Exchangeable Certificates will have no effect on the principal or interest entitlements of any other class of certificates. The Free Writing Prospectus describes the available combinations of Exchangeable Certificates eligible for exchange. |
| Allocation of Yield Maintenance and Prepayment Premiums: | If any yield maintenance charges and prepayment premiums are collected during any particular collection period with respect to any mortgage loan, then on the distribution date corresponding to that collection period, the certificate administrator will pay a portion of the yield maintenance charges and prepayment premiums (net of liquidation fees payable therefrom) in the following manner: (1) pro rata, between (x) the group (“YM Group A”) of the Class A-1, A-2, A-3, A-4, A-5, A-SB and X-A Certificates and the Class A-S regular interest and (y) the group (“YM Group B” and, collectively with the YM Group A, the “YM Groups”) of Class B and C regular interests and the Class D and Class X-B Certificates, based upon the aggregate amount of principal distributed to the applicable classes of principal balance certificates (other than the Class A-S, B, C and PEX Certificates) and the Class A-S, B and C regular interests, as applicable, in each YM Group for that distribution date, and (2) among the classes of certificates and regular interest(s) in each YM Group, in the following manner, up to an amount equal to the product of (a) the yield maintenance or prepayment premium allocated to such YM Group, (b) the related Base Interest Fraction (as defined in the Free Writing Prospectus), and (c) a fraction, which in no event may be greater than 1.0, the numerator of which is equal to the amount of principal distributed to the holder(s) of such class or regular interest for that distribution date, and the denominator of which is the aggregate amount of principal distributed to all the certificates and the regular interests in that YM Group for that distribution date. Any yield maintenance charges or prepayment premium allocated to such YM Group remaining after such distributions to Principal Balance Certificates or regular interest(s) described above will be distributed to the Class X-A or Class X-B Certificates as applicable, in such YM Group. |
| No prepayment premiums or yield maintenance charges will be distributed to the holders of the Class X-C, E, F, G, V or R Certificates. The holders of the Class X-B Certificates will be entitled to receive all yield maintenance charges and prepayment premiums after the Class A-1, A-2, A-3, A-4, A-5, X-A, A-SB and D Certificates and the Class A-S, B and C regular interests (and, therefore, the Class A-S, B, C and PEX Certificates) have been retired. For a description of when prepayment premiums and yield maintenance charges are generally required on the mortgage loans, see Annex A-1 to the Free Writing Prospectus. See also “Risk Factors—Prepayments and Repurchases of the Mortgage Assets Will Affect the Timing of Your Cash Flow and May Affect Your Yield” in the prospectus attached to the Free Writing Prospectus. Prepayment premiums and yield maintenance charges will be distributed on each Distribution Date only to the extent they are actually received on the mortgage loans as of the related Determination Date. |
THE INFORMATION IN THIS STRUCTURAL AND COLLATERAL TERM SHEET IS NOT COMPLETE AND MAY BE AMENDED PRIOR TO THE TIME OF SALE. THIS TERM SHEET IS NOT AN OFFER TO SELL THESE SECURITIES AND IT IS NOT A SOLICITATION OF AN OFFER TO BUY THESE SECURITIES IN ANY JURISDICTION WHERE THE OFFER OR SALE IS NOT PERMITTED.
20
WFRBS Commercial Mortgage Trust 2014-LC14 | Certain Terms and Conditions |
| Realized Losses: | The Certificate Principal Balances of the Class A-1, A-2, A-3, A-4, A-5, A-SB, D, E, F and G Certificates, the Class A-S, B and C regular interests will be reduced without distribution on any Distribution Date as a write-off to the extent of any losses realized on the mortgage loans allocated to such Class or regular interest on such Distribution Date. Such losses (other than certain Trust Advisor expenses) will be applied in the following order, in each case until the related Certificate Principal Balance is reduced to zero: first, to Class G; second, to Class F; third, to Class E; fourth, to Class D; fifth, to the Class C regular interest; sixth, to the Class B regular interest; seventh, to the Class A-S regular interest; and, finally, pro rata, to Classes A-1, A-2, A-3, A-4, A-5 and A-SB based on their outstanding Certificate Principal Balances. Certain Trust Advisor expenses (if not absorbed by reductions of interest entitlements on the Class E and D Certificates and the Class C and B regular interests) will be applied as write-offs in a similar manner, except that such write-offs will be applied only to the Class E and D Certificates, the Class C, B and A-S regular interests, and the Class A-1, A-2, A-3, A-4, A-5 and A-SB Certificates (with any write-offs on the Class A-1, A-2, A-3, A-4, A-5 and A-SB Certificates to be allocated pro rata according to their respective Certificate Principal Balances immediately prior to that Distribution Date), in that order. Any realized losses allocated to the Class A-S, B and C regular interests will, in turn, be allocated to the Class A-S, B, C and PEX Certificates as described above in “Allocations and Distributions on the Class A-S, B, C and PEX Certificates”. The notional amount of the Class X-A Certificates will be reduced by the amount of all losses that are allocated to the Class A-1, A-2, A-3, A-4, A-5 or A-SB Certificates or the Class A-S regular interest as write-offs in reduction of their Certificate Principal Balances. The notional amount of the Class X-B Certificates will be reduced by the amount of all losses that are allocated to the Class B and C regular interests and the Class D Certificates as write-offs in reduction of their Certificate Principal Balances. The notional amount of the Class X-C Certificates will be reduced by the amount of all losses that are allocated to the Class E, F or G Certificates as write-offs in reduction of their Certificate Principal Balances. |
| Debt Service Advances: | The Master Servicer or, if the Master Servicer fails to do so, the Trustee, will be obligated to advance delinquent debt service payments (other than balloon payments and default interest) and assumed debt service payments on the mortgage loans (including each pari passu mortgage loan but not its related pari passu companion loans), except to the extent any such advance is deemed non-recoverable from collections on the related mortgage loan. In addition, if an Appraisal Reduction Amount exists for a given mortgage loan, the interest portion of any debt service advance for such mortgage loan will be reduced, which will have the effect of reducing the amount of interest available for distribution to the Certificates in reverse alphabetical order of their Class designations (except that interest payments on the Class A-1, A-2, A-3, A-4, A-5, A-SB, X-A, X-B and X-C Certificates would be affected on a pari passu basis). |
| Servicing Advances: | The Master Servicer or, if the Master Servicer fails to do so, the Trustee, will be obligated to make servicing advances with respect to each mortgage loan it services, including the payment of delinquent property taxes, insurance premiums and ground rent, except to the extent that those advances are deemed non-recoverable from collections on the related mortgage loan. The applicable master servicer under the WFRBS 2013-C18 securitization will have the primary obligation to make any servicing advances with respect to the AmericasMart loan combination and The Outlet Collection | Jersey Gardens loan combination. |
Appraisal Reduction Amounts: | An Appraisal Reduction Amount generally will be created in the amount, if any, by which the principal balance of a required appraisal loan (which is a mortgage loan with respect to which certain defaults, modifications or insolvency events have occurred as further described in the Free Writing Prospectus) plus other amounts overdue or advanced in connection with such mortgage loan exceeds 90% of the appraised value of the related mortgaged property plus certain escrows and reserves (including letters of credit) held with respect to the mortgage loan. A mortgage loan will cease to be a required appraisal loan when the same has ceased to be a specially serviced mortgage loan (if applicable), has been brought current for at least three consecutive months and no other circumstances exist that would cause such mortgage loan to be a required appraisal loan. Appraisal Reduction Amounts will affect the amount of debt service advances on the related mortgage loan. Appraisal Reduction Amounts will also be taken into account in the determination of the identity of the Class whose majority constitutes the “majority subordinate certificateholder” and is entitled to appoint the subordinate class representative. |
Clean-Up Call and Exchange Termination: | On each Distribution Date occurring after the aggregate unpaid principal balance of the mortgage loans is reduced below 1% of the initial aggregate principal balance of the mortgage loans as of the Cut-off Date, certain specified persons will have the option to purchase all of the remaining |
THE INFORMATION IN THIS STRUCTURAL AND COLLATERAL TERM SHEET IS NOT COMPLETE AND MAY BE AMENDED PRIOR TO THE TIME OF SALE. THIS TERM SHEET IS NOT AN OFFER TO SELL THESE SECURITIES AND IT IS NOT A SOLICITATION OF AN OFFER TO BUY THESE SECURITIES IN ANY JURISDICTION WHERE THE OFFER OR SALE IS NOT PERMITTED.
21
WFRBS Commercial Mortgage Trust 2014-LC14 | Certain Terms and Conditions |
mortgage loans (and the trust’s interest in all property acquired through exercise of remedies in respect of any mortgage loan) at the price specified in the Free Writing Prospectus. Exercise of the option will terminate the trust and retire the then-outstanding certificates. If the aggregate Certificate Principal Balances of each of the Class A-1, A-2, A-3, A-4, A-5, A-SB, PEX and D Certificates and the Class A-S, B and C regular interests have been reduced to zero, the trust may also be terminated in connection with an exchange of all the then-outstanding certificates, for the mortgage loans and REO properties then remaining in the issuing entity, but all of the holders of those Classes of outstanding certificates would have to voluntarily participate in the exchange. | |
| Liquidation Loan Waterfall: | Following the liquidation of any loan or property, the net liquidation proceeds generally will be applied (after reimbursement of advances and certain trust fund expenses), first, as a recovery of accrued interest, other than delinquent interest that was not advanced as a result of Appraisal Reduction Amounts, second, as a recovery of principal until all principal has been recovered, and then as a recovery of delinquent interest that was not advanced as a result of Appraisal Reduction Amounts. Please see “Description of the Offered Certificates—Distributions—Application of Mortgage Loan Collections” in the Free Writing Prospectus. |
| Majority Subordinate Certificateholder and Subordinate Class Representative: | A subordinate class representative may be appointed by the “majority subordinate certificate-holder”, which will be the holder(s) of a majority of: (a) during a “subordinate control period”, the most subordinate class among the Class F and G Certificates that has a Certificate Principal Balance, as notionally reduced by any Appraisal Reduction Amounts allocable to that class, that is at least equal to 25% of its total initial principal balance and (b) during a “collective consultation period”, the most subordinate class among the Class F and G Certificates that has a total principal balance, without regard to Appraisal Reduction Amounts, that is at least equal to 25% of its initial Certificate Principal Balance. The majority subordinate certificateholder will have a continuing right to appoint, remove or replace the subordinate class representative in its sole discretion. This right may be exercised at any time and from time to time. See “Servicing of the Mortgage Loans and Administration of the Trust Fund—The Majority Subordinate Certificateholder and the Subordinate Class Representative” in the Free Writing Prospectus. |
| Control and Consultation: | The rights of various parties to replace the Special Servicer and approve or consult with respect to major actions of the Special Servicer will vary according to defined periods. A “subordinate control period” will exist as long as the Class F Certificates have a Certificate Principal Balance, net of any Appraisal Reduction Amounts allocable to that class, that is not less than 25% of the initial principal balance of that class (unless a senior consultation period is deemed to occur generally or with respect to a particular mortgage loan, pursuant to clause (ii) of the definition of “senior consultation period”). In general, during a subordinate control period, (i) the subordinate class representative will be entitled to grant or withhold approval of asset status reports prepared, and material servicing actions proposed, by the Special Servicer, and (ii) the majority subordinate certificateholder, or the subordinate class representative on its behalf, will be entitled to terminate and replace the Special Servicer with or without cause, and appoint itself or another person as the successor special servicer (other than with respect to (i) the AmericasMart loan combination and (ii) The Outlet Collection | Jersey Gardens loan combination). It will be a condition to such appointment that DBRS, Fitch and Moody’s confirm that the appointment would not result in a qualification, downgrade or withdrawal of any of their then-current ratings of certificates. A “collective consultation period” will exist as long as the Class F Certificates have a Certificate Principal Balance that both (i) as notionally reduced by any Appraisal Reduction Amounts allocable to that class, is less than 25% of its initial principal balance and (ii) without regard to any Appraisal Reduction Amounts allocable to that class, is 25% or more of its initial Certificate Principal Balance (unless a senior consultation period is deemed to occur generally or with respect to a particular mortgage loan, pursuant to clause (ii) of the definition of “senior consultation period”). In general, during a collective consultation period, the Special Servicer will be required to consult with the Trust Advisor (in addition to the subordinate class representative, during a collective consultation period) in connection with asset status reports and material special servicing actions. A “senior consultation period” will exist as long as either (i) the Class F certificates have an aggregate principal balance, without regard to any Appraisal Reduction Amounts allocable to that class, that is less than 25% of its initial principal balance or (ii) during such time as the Class F certificates are the most subordinate class of control-eligible certificates that have a then outstanding principal balance, net of Appraisal Reduction Amounts, at least equal to 25% of its initial principal balance, the then-majority subordinate certificateholder has irrevocably waived its right to appoint a subordinate class representative and to exercise any of the rights of the majority subordinate certificateholder or cause the exercise of the rights of the subordinate class representative and such rights have not been reinstated to a successor majority subordinate certificateholder as set forth in the pooling and servicing agreement. In general, during a senior consultation period, the Special Servicer must seek to consult with the Trust Advisor in connection with asset status reports and material special servicing actions, and, in general, no subordinate class representative will be recognized or have any right to terminate the |
THE INFORMATION IN THIS STRUCTURAL AND COLLATERAL TERM SHEET IS NOT COMPLETE AND MAY BE AMENDED PRIOR TO THE TIME OF SALE. THIS TERM SHEET IS NOT AN OFFER TO SELL THESE SECURITIES AND IT IS NOT A SOLICITATION OF AN OFFER TO BUY THESE SECURITIES IN ANY JURISDICTION WHERE THE OFFER OR SALE IS NOT PERMITTED.
22
WFRBS Commercial Mortgage Trust 2014-LC14 | Certain Terms and Conditions |
Special Servicer or approve, direct or consult with respect to servicing matters. With respect to the PennCap Portfolio loan combination, the rights of the subordinate class representative described above will be subject to the consultation rights of each holder of a related pari passu companion loan described under “Loan Combinations” below. Furthermore, notwithstanding any contrary description set forth above, with respect to each of the AmericasMart mortgage loan and The Outlet Collection | Jersey Gardens mortgage loan, in general the related loan combination will be serviced under the WFRBS 2013-C18 pooling and servicing agreement, which grants to the subordinate class representative thereunder control rights that include the right to approve or disapprove various material servicing actions involving the loan combination but the subordinate class representative for this securitization (and each other holder of a non-controlling pari passu companion loan with respect to each such loan combination) will nonetheless have the right to be consulted on a non-binding basis with respect to such actions. For purposes of the servicing of each of the AmericasMart loan combination and The Outlet Collection | Jersey Gardens loan combination, the occurrence and continuance of a collective consultation period or senior consultation period with respect to the subordinate class representative under this securitization will not limit the control or other rights of the subordinate class representative under the WFRBS 2013-C18 securitization, and any collective consultation period or senior consultation period or similar period under the WFRBS 2013-C18 securitization will not limit the consultation rights of the subordinate class representative under this securitization. In general, loan combination control rights also include the right, in certain circumstances, to direct the replacement of the applicable special servicer for the related loan combination only. | |
| Replacement of Special Servicer by General Vote of Certificateholders: | During any ”collective consultation period” or “senior consultation period”, the Special Servicer may be terminated and replaced upon the affirmative direction of certificate owners holding not less than 75% of the appraisal-reduced voting rights of all certificates, following a proposal from certificate owners holding not less than 25% of the appraisal-reduced voting rights of all certificates. The certificateholders who initiate a vote on a termination and replacement of the Special Servicer without cause must cause DBRS, Fitch and Moody’s to confirm the then-current ratings of the certificates (or decline to review the matter) and cause the payment of the fees and expenses incurred in the replacement. |
| Appraisal Remedy: | Solely for purposes of determining whether a “subordinate control period” is in effect, whenever the Special Servicer obtains an appraisal or updated appraisal under the pooling and servicing agreement, the subordinate class representative, with respect to the mortgage loans (other than the AmericasMart mortgage loan or The Outlet Collection | Jersey Gardens mortgage loan) serviced by the Special Servicer will have the right (at its or their expense) to direct the Special Servicer to hire a qualified appraiser to prepare a second appraisal of the mortgaged property. The Special Servicer must thereafter determine whether, based on its assessment of such second appraisal, any recalculation of the Appraisal Reduction Amount is warranted. The Appraisal Reduction Amount, whether based on the first or the second appraisal, will become effective following the second appraisal, except that the Appraisal Reduction Amount based on the first appraisal shall become effective if the subordinate class representative declines to demand a second appraisal within a specified number of business days, or if a second appraisal is not received within 90 days after the direction of the subordinate class representative. In addition, for the same purposes, if there is a material change in the mortgaged property securing any mortgage loan for which an Appraisal Reduction Amount has been calculated, the majority certificateholder of the Class F or G Certificates or other designed certificateholders will be entitled (at its expense) to present an additional appraisal to the Special Servicer, which will generally be required to recalculate the Appraisal Reduction Amount based upon such additional appraisal. This latter right may not be exercised more frequently than once in any 12-month period for each mortgage loan for which an Appraisal Reduction Amount was calculated and can only be exercised during a subordinate control period or a collective consultation period as further described in the Free Writing Prospectus. |
| Sale of Defaulted Assets: | There will be no “fair value” purchase option. Instead, the pooling and servicing agreement will authorize the Special Servicer to sell defaulted mortgage loans serviced by the Special Servicer to the highest bidder in a manner generally similar to sales of REO properties. Subject to certain limitations set forth in the related intercreditor agreement, the PennCap Portfolio mortgage loan may not be sold unless that mortgage loan and the related pari passu companion loan(s) are sold together as one whole loan. The sale of a defaulted loan (other than a non-serviced mortgage loan) for less than par plus accrued interest and certain other fees and expenses owed on the loan will be subject to consent or consultation rights of the subordinate class representative and/or Trust Advisor and, in the case of the PennCap Portfolio mortgage loan, consultation rights of the holder of the related pari passu companion loan, as described in the Free Writing Prospectus. In the case of each of the AmericasMart mortgage loan and The Outlet Collection | Jersey Gardens |
THE INFORMATION IN THIS STRUCTURAL AND COLLATERAL TERM SHEET IS NOT COMPLETE AND MAY BE AMENDED PRIOR TO THE TIME OF SALE. THIS TERM SHEET IS NOT AN OFFER TO SELL THESE SECURITIES AND IT IS NOT A SOLICITATION OF AN OFFER TO BUY THESE SECURITIES IN ANY JURISDICTION WHERE THE OFFER OR SALE IS NOT PERMITTED.
23
WFRBS Commercial Mortgage Trust 2014-LC14 | Certain Terms and Conditions |
mortgage loan, pursuant to the respective intercreditor agreement and the WFRBS 2013-C18 pooling and servicing agreement, the applicable WFRBS 2013-C18 special servicer may offer to sell to any person (or may offer to purchase) for cash either such loan combination during such time as such loan combination constitutes a defaulted mortgage loan, and, in connection with any such sale, such WFRBS 2013-C18 special servicer is required to sell both the pari passu mortgage loan and each related pari passu companion loan in any such loan combination as a whole loan. The subordinate class representative for this securitization will have consultation rights as the holder of an interest in the related pari passu mortgage loan, as described in the Free Writing Prospectus. | |
| “As-Is” Appraisals: | Appraisals must be conducted on an “as-is” basis, and must be no more than 9 months old, for purposes of determining Appraisal Reduction Amounts, market value in connection with REO sales, etc. Required appraisals may consist of updates of prior appraisals. Internal valuations by the Special Servicer are permitted if the principal balance of a mortgage loan is less than $2,000,000. |
| Trust Advisor: | The Trust Advisor will perform certain review duties that will generally include a limited annual review of and report regarding the Special Servicer to the Certificate Administrator. The review and report generally will be based on: (a) during a collective consultation period or senior consultation period, any asset status reports and additional information delivered to the Trust Advisor by the Special Servicer with respect to any mortgage loan serviced by the Special Servicer, and/or (b) during a senior consultation period, in addition to the applicable information described above, a meeting with the Special Servicer to conduct a limited review of the Special Servicer’s operational practices on a platform basis in light of the servicing standard. In addition, during any collective consultation period or senior consultation period, the Special Servicer must seek to consult with the Trust Advisor (in addition to the subordinate class representative during a collective consultation period) in connection with material special servicing actions with respect to specially serviced mortgage loans serviced by the Special Servicer. Furthermore, under certain circumstances, but only during a senior consultation period, the Trust Advisor may recommend the replacement of the Special Servicer, in which case the Certificate Administrator will deliver notice of such recommendation to the certificateholders, and certificateholders with specified percentages of the voting rights may direct the replacement of the Special Servicer at their expense. Notwithstanding any contrary provision described above, the Trust Advisor will have no rights or duties in connection with the AmericasMart mortgage loan or The Outlet Collection | Jersey Gardens mortgage loan. The Trust Advisor may be removed and replaced without cause upon the affirmative direction of certificates owners holding not less than 75% of the appraisal-reduced voting rights of all certificates, following a proposal from certificate owners holding not less than 25% of the appraisal-reduced voting rights of all certificates. The certificateholders who initiate a vote on a termination and replacement of the Trust Advisor without cause must cause DBRS, Fitch and Moody’s to confirm the then-current ratings of the certificates (or decline to review the matter) and cause the payment of the fees and expenses incurred in the replacement. During any “subordinate control period”, the proposed replacement trust advisor will be subject to the subordinate class representative’s consent (such consent not to be unreasonably withheld). If a proposed termination and replacement of the Trust Advisor is not consummated within 180 days following the initial request of the certificateholders who requested a vote, the proposed termination and replacement shall have no further force or effect. The Trust Advisor generally may be discharged from its duties if and when the Class A-1, A-2, A-3, A-4, A-5, A-SB, A-S, B, C, PEX, D and E Certificates are retired. |
| Certain Fee Offsets: | If a workout fee is earned by the Special Servicer following a loan default with respect to any mortgage loan that it services, then certain limitations will apply to the collection and retention of a modification fee from the borrower. The modification fee generally must not exceed 1% of the principal balance of the loan as modified. In addition, if the loan re-defaults within a specified period of months and other conditions are satisfied, any subsequent workout or liquidation fee on that loan must be reduced by a portion of the previously-collected modification fee. Furthermore, workout fees, liquidation fees and modification fees collected with respect to any workout, liquidation and/or partial liquidation of a mortgage loan or loan combination that is serviced by a Special Servicer will be subject to an aggregate cap equal to the greater of (i) $1,000,000 and (ii) 1.00% of the stated principal balance of the subject mortgage loan or loan combination. |
| Deal Website: | The Certificate Administrator will be required to maintain a deal website which will include, among other items: (a) summaries of asset status reports prepared by the Special Servicer, (b) inspection reports, (c) appraisals, (d) various “special notices” described in the Free Writing Prospectus, (e) the “Investor Q&A Forum” and (f) a voluntary “Investor Registry”. Investors may |
THE INFORMATION IN THIS STRUCTURAL AND COLLATERAL TERM SHEET IS NOT COMPLETE AND MAY BE AMENDED PRIOR TO THE TIME OF SALE. THIS TERM SHEET IS NOT AN OFFER TO SELL THESE SECURITIES AND IT IS NOT A SOLICITATION OF AN OFFER TO BUY THESE SECURITIES IN ANY JURISDICTION WHERE THE OFFER OR SALE IS NOT PERMITTED.
24
WFRBS Commercial Mortgage Trust 2014-LC14 | Certain Terms and Conditions |
access the deal website following execution of a certification and confidentiality agreement. | |
| Initial Majority Subordinate Certificateholder: | It is expected that Rialto CMBS, LLC or another affiliate of Rialto Capital Advisors, LLC will be the initial majority subordinate certificateholder. |
| Loan Combinations: | Each of the mortgaged properties identified on Annex A-1 to the Free Writing Prospectus as AmericasMart, PennCap Portfolio and The Outlet Collection | Jersey Gardens secure both a mortgage loan to be included in the trust fund and one or more other mortgage loans that will not be included in the trust fund, which will be pari passu in right of payment with the trust mortgage loan. With respect to each group of mortgage loans, which we refer to as a “loan combination” only the PennCap Portfolio loan combination will be principally serviced under the pooling and servicing agreement. The AmericasMart loan combination and The Outlet Collection | Jersey Gardens loan combination will be serviced under the pooling and servicing agreement relating to the WFRBS 2013-C18 transaction. As of the closing date, the pari passu companion loans in such loan combinations will be held by the parties identified above under “IV. Characteristics of the Mortgage Pool—B. Summary of Pari Passu Split Loan Structures”. |
THE INFORMATION IN THIS STRUCTURAL AND COLLATERAL TERM SHEET IS NOT COMPLETE AND MAY BE AMENDED PRIOR TO THE TIME OF SALE. THIS TERM SHEET IS NOT AN OFFER TO SELL THESE SECURITIES AND IT IS NOT A SOLICITATION OF AN OFFER TO BUY THESE SECURITIES IN ANY JURISDICTION WHERE THE OFFER OR SALE IS NOT PERMITTED.
25
| AMERICASMART |

THE INFORMATION IN THIS STRUCTURAL AND COLLATERAL TERM SHEET IS NOT COMPLETE AND MAY BE AMENDED PRIOR TO THE TIME OF SALE. THIS TERM SHEET IS NOT AN OFFER TO SELL THESE SECURITIES AND IT IS NOT A SOLICITATION OF AN OFFER TO BUY THESE SECURITIES IN ANY JURISDICTION WHERE THE OFFER OR SALE IS NOT PERMITTED.
26
| AMERICASMART |

THE INFORMATION IN THIS STRUCTURAL AND COLLATERAL TERM SHEET IS NOT COMPLETE AND MAY BE AMENDED PRIOR TO THE TIME OF SALE. THIS TERM SHEET IS NOT AN OFFER TO SELL THESE SECURITIES AND IT IS NOT A SOLICITATION OF AN OFFER TO BUY THESE SECURITIES IN ANY JURISDICTION WHERE THE OFFER OR SALE IS NOT PERMITTED.
27
| AMERICASMART |
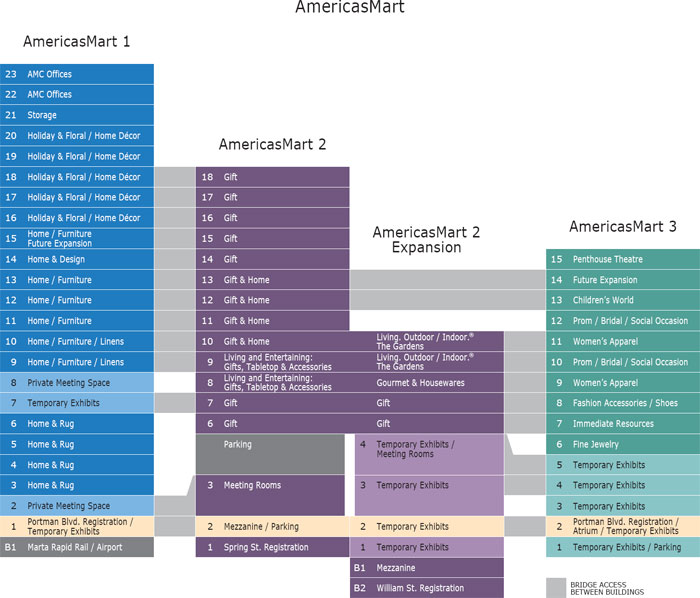
THE INFORMATION IN THIS STRUCTURAL AND COLLATERAL TERM SHEET IS NOT COMPLETE AND MAY BE AMENDED PRIOR TO THE TIME OF SALE. THIS TERM SHEET IS NOT AN OFFER TO SELL THESE SECURITIES AND IT IS NOT A SOLICITATION OF AN OFFER TO BUY THESE SECURITIES IN ANY JURISDICTION WHERE THE OFFER OR SALE IS NOT PERMITTED.
28
| AMERICASMART |
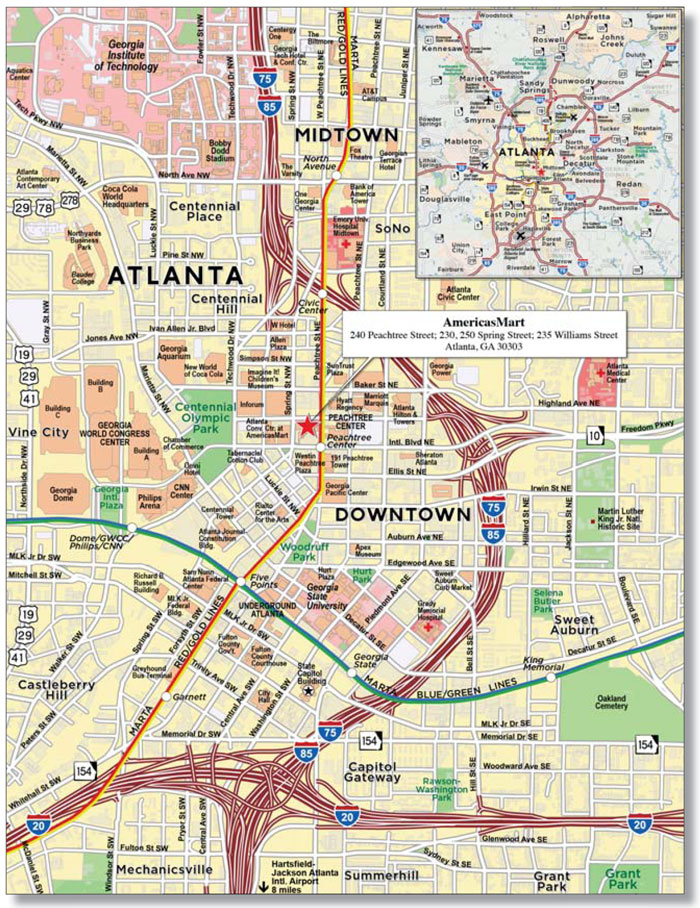
THE INFORMATION IN THIS STRUCTURAL AND COLLATERAL TERM SHEET IS NOT COMPLETE AND MAY BE AMENDED PRIOR TO THE TIME OF SALE. THIS TERM SHEET IS NOT AN OFFER TO SELL THESE SECURITIES AND IT IS NOT A SOLICITATION OF AN OFFER TO BUY THESE SECURITIES IN ANY JURISDICTION WHERE THE OFFER OR SALE IS NOT PERMITTED.
29
| No. 1 – AmericasMart | ||||||||
| Loan Information | Property Information | |||||||
| Mortgage Loan Seller: | Wells Fargo Bank, National Association | Single Asset/Portfolio: | Single Asset | |||||
| Credit Assessment (DBRS/Fitch/Moody’s): | NR/NR/NR | Property Type: | Other | |||||
Original Principal Balance(1): | $140,000,000 | Specific Property Type: | Trade Mart | |||||
Cut-off Date Principal Balance(1): | $139,602,104 | Location: | Atlanta, GA | |||||
| % of Initial Pool Balance: | 11.1% | Size(3): | 4,563,219 SF | |||||
| Loan Purpose: | Refinance | Cut-off Date Principal Balance Per SF(1): | $122.37 | |||||
| Borrower Name: | AmericasMart Real Estate, LLC | Year Built/Renovated: | 1961/2008 | |||||
| Sponsors: | AMC, Inc.; Portman Financial, Inc. | Title Vesting(4): | Various | |||||
| Mortgage Rate: | 5.451% | Property Manager: | Self-managed | |||||
| Note Date: | November 14, 2013 | 3rd Most Recent Occupancy (As of)(5): | 79.4% (8/31/2010) | |||||
| Anticipated Repayment Date: | NAP | 2nd Most Recent Occupancy (As of)(5): | 78.9% (8/31/2011) | |||||
| Maturity Date: | December 1, 2023 | Most Recent Occupancy (As of)(5): | 79.6% (8/31/2012) | |||||
| IO Period: | None | Current Occupancy (As of)(5): | 84.7% (10/1/2013) | |||||
| Loan Term (Original): | 120 months | |||||||
| Seasoning: | 2 months | Underwriting and Financial Information: | ||||||
| Amortization Term (Original): | 300 months | |||||||
| Loan Amortization Type: | Amortizing Balloon | 3rd Most Recent NOI (As of): | $63,685,942 (FYE 8/31/2012) | |||||
| Interest Accrual Method: | Actual/360 | 2nd Most Recent NOI (As of): | $69,102,131 (FYE 8/31/2013) | |||||
| Call Protection: | L(26),D(90),O(4) | Most Recent NOI (As of): | $70,681,418 (TTM 11/30/2013) | |||||
| Lockbox Type: | Hard/Upfront Cash Management | |||||||
Additional Debt(1): | Yes | |||||||
Additional Debt Type(1): | Pari Passu | |||||||
| U/W Revenues: | $138,877,801 | |||||||
| U/W Expenses: | $66,651,969 | |||||||
Escrows and Reserves(2): | U/W NOI: | $72,225,832 | ||||||
| U/W NCF: | $69,187,095 | |||||||
Type: | Initial | Monthly | Cap (If Any) | U/W NOI DSCR(1): | 1.76x | |||
| Taxes | $1,284,853 | $428,285 | NAP | U/W NCF DSCR(1): | 1.68x | |||
| Insurance | $0 | Springing | NAP | U/W NOI Debt Yield(1): | 12.9% | |||
| Replacement Reserves | $1,557,473 | Springing | $1,557,473 | U/W NCF Debt Yield(1): | 12.4% | |||
| TI/LC Reserve | $2,627,360 | Springing | $2,627,360 | As-Is Appraised Value: | $920,000,000 | |||
| Deferred Maintenance | $352,469 | $0 | NAP | As-Is Appraisal Valuation Date: | October 15, 2013 | |||
| Environmental Reserve | $380,000 | $0 | NAP | Cut-off Date LTV Ratio(1): | 60.7% | |||
| Ground Rent Reserve | $4,144 | Springing | $4,144 | LTV Ratio at Maturity or ARD(1): | 46.2% | |||
| (1) | The AmericasMart Loan Combination, totaling $560,000,000, is comprised of eight pari passu notes. Notes 3-1 and 3-2 had a combined original principal balance of $140,000,000, have a combined outstanding principal balance as of the Cut-off Date of $139,602,104 and will be contributed to the WFRBS 2014-LC14 Trust. Notes 1-1 and 1-2 had a combined original principal balance of $140,000,000 and were contributed to the WFRBS 2013-C18 Trust. Notes 2-1 and 2-2 had a combined original principal balance of $140,000,000 and are expected to be contributed to the MSBAM 2014-C14 Trust. The remaining two pari passu notes had an aggregate original principal balance of $140,000,000 and are expected be contributed to a future trust or trusts. All statistical information related to balances per square foot, loan-to-value ratios, debt service coverage ratios and debt yields are based on the AmericasMart Loan Combination. |
| (2) | See “Escrows” section. |
| (3) | Size includes 3,503,146 square feet of space leased by permanent tenants and 1,060,073 square feet of trade show and exhibition space. |
| (4) | See “Ground Lease and Air Rights Lease” section. |
| (5) | Current and historical occupancy is based on permanent space net rentable square footage. |
The Mortgage Loan. The mortgage loan (the “AmericasMart Loan Combination”) is evidenced by eight pari passu promissory notes (Notes 1-1 through 4-2) secured by the first mortgage encumbering a wholesale trade mart located in Atlanta, Georgia (the “AmericasMart Property”). The AmericasMart Loan Combination was co-originated on November 14, 2013 by Wells Fargo Bank, National Association and Bank of America, National Association. The AmericasMart Loan Combination had an original principal balance of $560,000,000, has an outstanding principal balance as of the Cut-off Date of $558,408,416 and accrues interest at an interest rate of 5.451% per annum. The AmericasMart Loan Combination had an initial term of 120 months, has a remaining term of 118 months as of the Cut-off Date and requires payments of principal and interest based on a 25-year amortization schedule. The AmericasMart Loan Combination matures on December 1, 2023. See “Description of the Mortgage Pool – Split Loan Structures – The AmericasMart Loan Combination” and “Servicing of the Mortgage Loans and Administration of the Trust Fund – Additional Matters Relating to the Servicing of the AmericasMart Loan Combination and The Outlet Collection | Jersey Gardens Loan Combination” in the Free Writing Prospectus.
Notes 3-1 and 3-2, which will be contributed to the WFRBS 2014-LC14 Trust, had an original principal balance of $140,000,000 and have an aggregate outstanding principal balance as of the Cut-off Date of $139,602,104 and collectively represent a non-controlling interest in the AmericasMart Loan Combination. Notes 1-1 and 1-2, which had an aggregate original principal balance of $140,000,000, collectively represent a controlling interest in the AmericasMart Loan Combination and were contributed to the WFRBS 2013-C18 Trust. Notes 2-1 and 2-2, which had an aggregate original principal balance of $140,000,000, collectively represent a non-controlling interest in the
THE INFORMATION IN THIS STRUCTURAL AND COLLATERAL TERM SHEET IS NOT COMPLETE AND MAY BE AMENDED PRIOR TO THE TIME OF SALE. THIS TERM SHEET IS NOT AN OFFER TO SELL THESE SECURITIES AND IT IS NOT A SOLICITATION OF AN OFFER TO BUY THESE SECURITIES IN ANY JURISDICTION WHERE THE OFFER OR SALE IS NOT PERMITTED.
30
| AMERICASMART |
AmericasMart Loan Combination and are expected to be contributed to the MSBAM 2014-C14 Trust. Notes 4-1 and 4-2, which had an aggregate original principal balance of $140,000,000 and each also represent non-controlling interests in the AmericasMart Loan Combination, are each expected to be contributed to a future trust or trusts. Each of the mortgage loans evidenced by Notes 1-1, 1-2, 2-1, 2-2, 4-1 and 4-2 are referred to herein as the “AmericasMart Companion Loans”. As of the loan closing date, each of the remaining pari passu notes (Notes 2-1, 2-2, 4-1 and 4-2) had an original principal balance of $70,000,000; however, the lender provides no assurances that any non-securitized pari passu notes will not be split further. The holders of the respective promissory notes evidencing the AmericasMart Loan Combination have entered into a co-lender agreement that sets forth the respective rights of each note holder.
Following the lockout period, the borrower has the right to defease the AmericasMart Loan Combination in whole, but not in part, on any date before September 1, 2023. In addition, the AmericasMart Loan Combination is prepayable without penalty on or after September 1, 2023.
Sources and Uses
| Sources | Uses | |||||||
| Original loan combination amount | $560,000,000 | 92.3% | Loan payoffs(1) | $583,027,371 | 96.1% | |||
| Sponsor’s new cash contribution | 46,660,201 | 7.7 | Acquisition of parcels | 13,212,500 | 2.2 | |||
| Reserves | 6,206,299 | 1.0 | ||||||
| Closing costs | 4,214,031 | 0.7 | ||||||
| Total Sources | $606,660,201 | 100.0% | Total Uses | $606,660,201 | 100.0% |
| (1) | Loan pay-offs include a $382,289,663 loan that was previously securitized in WBCMT 2005-C19 and WBCMT 2005-C20, a $153,100,808 corporate loan made by an affiliate of the borrower and a $47,636,900 construction loan secured by AmericasMart 2 Expansion which was not included as security for the prior loan securitized in WBCMT 2005-C19 and WBCMT 2005-C20. |
The Property. The AmericasMart Property is a wholesale trade mart that consists of four interconnected buildings totaling approximately 4.6 million square feet of rentable area located in Atlanta, Georgia. The four buildings, AmericasMart 1, AmericasMart 2, AmericasMart 2 Expansion and AmericasMart 3, were built in stages from 1961 through 2008 and were each designed as a department store for retailers. Of the total net rentable area, approximately 3.5 million square feet is permanent showroom space occupied by more than 1,500 tenants and approximately 1.1 million square feet is exhibition space temporarily leased to tenants during various trade shows throughout the year. Parking is provided by 1,103 parking spaces situated in parking garages located in AmericasMart 2 (five-story and 710 parking spaces) and AmericasMart 3 (393 ground level parking spaces), resulting in a parking ratio of 0.24 spaces per 1,000 square feet of net rentable square footage. The AmericasMart Property showcases consumer goods and provides a central location where manufacturers and wholesale retail purchasers can meet and transact. The AmericasMart Property also offers manufacturers, or their distributors and sales representatives, year-round centralized permanent showrooms for seasonal exhibitions of their products. By committing to permanent space, in addition to having the availability of a year-round sales facility, a manufacturer (or its distributors and sale representatives) has the ability to customize the build-out of its showroom and the tenant is assured of a specific location and has the ability to participate in trade shows held at the AmericasMart Property.
Also included in the net rentable area is ground floor retail leased to Wells Fargo, Starbucks, the United States Postal Service and Ray’s in the City restaurant. The AmericasMart Property’s average floor plate is approximately 78,000 square feet and the AmericasMart Property features 184 escalators, 27 passenger elevators, 22 freight elevators, 49 loading docks and 25 pedestrian bridges to facilitate the movement of people and merchandise between buildings.
AmericasMart 1 is a 23-story building that was built in 1961 and expanded in 1968 and 1986 and contains approximately 1.8 million square feet of net rentable area. Merchandise categories located at AmericasMart 1 include Home and Rug, Home Accents and Furniture, Home and Design, Holiday and Floral/Home Décor and Home Accents and Fine Linen. In addition, AmericasMart 1 offers four floors of exhibition space and ground floor retail tenants such as Starbucks, Wells Fargo, the United States Postal Service and Ray’s in the City Restaurant. AmericasMart 1 has 13 pedestrian bridges that connect it to AmericasMart 2, AmericasMart 3 and the Westin Peachtree Plaza hotel, located directly south of the AmericasMart Property. AmericasMart 1 accounts for approximately 40.6% of the net rentable square footage and 33.0% of the underwritten base rent of the AmericasMart Loan Combination.
AmericasMart 2 is an 18-story building that was built in 1992 and contains approximately 1.0 million square feet of net rentable area. AmericasMart 2’s merchandise categories include Gift, Living and Entertainment, Tabletops and Accessories and Home Accents and Gifts. AmericasMart 2 is connected to AmericasMart 1 by 13 pedestrian bridges and to AmericasMart 3 by two pedestrian bridges. AmericasMart 2 accounts for approximately 27.7% of the net rentable square footage and 38.0% of the underwritten base rent for the AmericasMart Loan Combination.
AmericasMart 2 Expansion is a 10-story building constructed in 2008 that is directly connected to AmericasMart 2. The AmericasMart 2 Expansion was not part of the collateral for the previously securitized loan in WBCMT 2005–C19 and WBCMT 2005–C20. The building contains approximately 465,000 square feet of net rentable area and contains four floors of exhibition space. Merchandise categories located at AmericasMart 2 Expansion include Gift, Gourmet & Housewares and Living, Indoor/Outdoor and the Gardens Industries. AmericasMart 2 Expansion is connected to AmericasMart 3 by seven pedestrian bridges and accounts for approximately 8.1% of the net rentable square footage and 9.7% of the underwritten base rent for the AmericasMart Loan Combination.
AmericasMart 3 is a 15-story building that was built in 1979 and expanded in 1988 and contains approximately 1.3 million square feet of net rentable area. The building has nine floors of permanent space and five floors of exhibition space and has the largest percentage of exhibition space among the four AmericasMart buildings. Merchandise categories include the following product lines: Fine Jewelry, Apparel, Accessories & Jewelry, Fashion Accessories & Shoes, Women’s & Men’s Apparel, Social Occasion, Prom and Bridal and Children’s World (which includes gifts, bedding, home furnishings and apparel). The building features a penthouse fashion theatre and a 13-story “Grand Atrium” which serves a focal point during trade shows and is often used to host fashion shows, dining and other special events. AmericasMart 3 accounts for approximately 21.8% of the net rentable square footage and 18.3% of the underwritten base rent for the AmericasMart Loan Combination.
THE INFORMATION IN THIS STRUCTURAL AND COLLATERAL TERM SHEET IS NOT COMPLETE AND MAY BE AMENDED PRIOR TO THE TIME OF SALE. THIS TERM SHEET IS NOT AN OFFER TO SELL THESE SECURITIES AND IT IS NOT A SOLICITATION OF AN OFFER TO BUY THESE SECURITIES IN ANY JURISDICTION WHERE THE OFFER OR SALE IS NOT PERMITTED.
31
| AMERICASMART |
As of October 1, 2013, the permanent space of the AmericasMart Property was 84.7% leased to over 1,500 tenants.
The following table presents certain information relating to the permanent space tenancy at the AmericasMart Property:
| Segment | Building | No. of Tenants | Net Rentable Area (SF) | Occupancy | In-Place Base Rent | % of Total Base Rent | In-Place Base Rent PSF | |
| Holiday/Floral | 1 | 150 | 467,688 | 92.7% | $14,007,816 | 13.6% | $32.30 | |
| Home Furnishings | 1 | 100 | 459,749 | 73.9% | $9,639,780 | 9.4% | $28.37 | |
| Rugs | 1 | 74 | 351,215 | 81.2% | $5,867,220 | 5.7% | $20.57 | |
| Fine Linens | 1 | 76 | 143,504 | 98.6% | $4,399,608 | 4.3% | $31.10 | |
| Gifts | 2 & 2E | 378 | 1,023,909 | 94.1% | $41,031,672 | 39.9% | $42.61 | |
| Accessories/Jewelry | 3 | 219 | 249,755 | 97.2% | $9,394,872 | 9.1% | $38.72 | |
| Women’s | 3 | 157 | 177,634 | 88.9% | $4,821,684 | 4.7% | $30.55 | |
| Bridal/Prom | 3 | 74 | 174,185 | 62.4% | $2,950,584 | 2.9% | $27.16 | |
| Children’s | 3 | 82 | 162,192 | 35.0% | $1,591,716 | 1.5% | $28.02 | |
| Gardens | 2E | 138 | 106,574 | 89.1% | $4,163,400 | 4.1% | $43.84 | |
| Gift & Resort | 2E | 34 | 63,491 | 88.5% | $2,136,600 | 2.1% | $38.02 | |
| Gourmet & Housewares | 2E | 62 | 57,860 | 79.4% | $1,673,928 | 1.6% | $36.46 | |
| Retail | 1 & 2E | 7 | 65,390 | 64.2% | $1,074,384 | 1.1% | $32.70 | |
| Total/Weighted Average | 1,551 | 3,503,146 | 84.7% | $102,753,264 | 100.0% | $34.62 | ||
The following table presents certain information relating to the lease rollover schedule at the AmericasMart Property:
Lease Expiration Schedule(1)(2)(3)
Year Ending December 31, | No. of Leases Expiring | Expiring NRSF | % of Total NRSF | Cumulative Expiring NRSF | Cumulative % of Total NRSF | Annual U/W Base Rent | % of Annual U/W Base Rent | Annual U/W Base Rent PSF(4) |
| MTM | 28 | 32,521 | 0.9% | 32,521 | 0.9% | $1,049,940 | 1.0% | $32.28 |
| 2013 | 230 | 274,725 | 7.8% | 307,246 | 8.8% | $10,234,176 | 10.0% | $37.25 |
| 2014 | 476 | 784,611 | 22.4% | 1,091,857 | 31.2% | $27,117,756 | 26.4% | $34.56 |
| 2015 | 424 | 770,649 | 22.0% | 1,862,506 | 53.2% | $26,737,200 | 26.0% | $34.69 |
| 2016 | 252 | 587,529 | 16.8% | 2,450,035 | 69.9% | $20,770,980 | 20.2% | $35.35 |
| 2017 | 102 | 348,433 | 9.9% | 2,798,468 | 79.9% | $11,710,980 | 11.4% | $33.61 |
| 2018 | 34 | 146,427 | 4.2% | 2,944,895 | 84.1% | $4,469,508 | 4.3% | $30.52 |
| 2019 | 3 | 9,968 | 0.3% | 2,954,863 | 84.3% | $330,156 | 0.3% | $33.12 |
| 2020 | 0 | 0 | 0.0% | 2,954,863 | 84.3% | $0 | 0.0% | $0.00 |
| 2021 | 0 | 0 | 0.0% | 2,954,863 | 84.3% | $0 | 0.0% | $0.00 |
| 2022 | 2 | 13,213 | 0.4% | 2,968,076 | 84.7% | $332,568 | 0.3% | $25.17 |
| 2023 | 0 | 0 | 0.0% | 2,968,076 | 84.7% | $0 | 0.0% | $0.00 |
| 2024 | 0 | 0 | 0.0% | 2,968,076 | 84.7% | $0 | 0.0% | $0.00 |
| Thereafter | 0 | 0 | 0.0% | 2,968,076 | 84.7% | $0 | 0.0% | $0.00 |
| Vacant | 0 | 535,070 | 15.3% | 3,503,146 | 100.0% | $0 | 0.0% | $0.00 |
| Total/Weighted Average | 1,551 | 3,503,146 | 100.0% | $102,753,264 | 100.0% | $34.62 |
(1) | Information obtained from the underwritten rent roll. |
| (2) | Excludes trade show and exhibition space. |
| (3) | Certain tenants may have lease termination options that are exercisable prior to the originally stated expiration date of the subject lease and that are not considered in the Lease Expiration Schedule. |
| (4) | The annual and Total/Weighted Average Annual U/W Base Rent PSF excludes vacant space. |
The following table presents historical occupancy of permanent space at the AmericasMart Property:
Historical Occupancy
FYE 8/31/2008(1)(2) | FYE 8/31/2009(1)(3) | FYE 8/31/2010(1)(4) | FYE 8/31/2011(1)(5) | FYE 8/31/2012(1)(6) | 10/1/2013(7) | |||||
| 95.5% | 83.8% | 79.4% | 78.9% | 79.6% | 84.7% |
| (1) | Information obtained from the borrower. Due to the nature of the operations at the AmericasMart Property, leasable square footage varies from year to year. |
| (2) | Based on 3,098,467 net rentable square feet. |
| (3) | Based on 3,466,867 net rentable square feet. The increase of leasable square footage is attributed to the completion of the AmericasMart 2 Expansion in 2008 with leasing commencing during 2009. |
| (4) | Based on 3,458,907 net rentable square feet. |
| (5) | Based on 3,453,018 net rentable square feet. |
| (6) | Based on 3,450,976 net rentable square feet. |
| (7) | Based on 3,503,146 net rentable square feet. |
THE INFORMATION IN THIS STRUCTURAL AND COLLATERAL TERM SHEET IS NOT COMPLETE AND MAY BE AMENDED PRIOR TO THE TIME OF SALE. THIS TERM SHEET IS NOT AN OFFER TO SELL THESE SECURITIES AND IT IS NOT A SOLICITATION OF AN OFFER TO BUY THESE SECURITIES IN ANY JURISDICTION WHERE THE OFFER OR SALE IS NOT PERMITTED.
32
| AMERICASMART |
The following table presents historical base rent per square foot for permanent space tenant leases at the AmericasMart Property:
Historical Average Base Rent (PSF)(1)
FYE 8/31/2010 | FYE 8/31/2011 | FYE 8/31/2012 | FYE 8/31/2013 | ||||
| $32.30 | $33.19 | $33.52 | $33.59 | ||||
| (1) | Information obtained from borrower operating statements. The average base rent is based on collected rent divided by the permanent square footage and does not take into account space leased during trade shows or exhibitions. | ||||||
Operating History and Underwritten Net Cash Flow. The following table presents certain information relating to the historical operating performance and Underwritten Net Cash Flow at the AmericasMart Property:
Cash Flow Analysis (2006 – 2010)
| FYE 8/31/2006 | FYE 8/31/2007 | FYE 8/31/2008 | FYE 8/31/2009 | FYE 8/31/2010 | ||||||
| In-Place Permanent Revenue | $94,346,200 | $97,611,795 | $100,937,701 | $95,413,044 | $90,841,368 | |||||
| Less Rent Abatements | 0 | 0 | 0 | 0 | 0 | |||||
| Grossed Up Vacant Space | 0 | 0 | 0 | 0 | 0 | |||||
| Trade Show Revenue | 31,117,126 | 34,007,712 | 34,533,367 | 26,451,605 | 24,030,928 | |||||
| Other Income | 7,849,912 | 7,969,525 | 8,353,752 | 6,794,609 | 6,731,016 | |||||
| Less Vacancy & Credit Loss | (379,363) | (503,956) | (1,010,575) | (4,651,069) | (121,715) | |||||
| Effective Gross Income | $132,933,875 | $139,085,076 | $142,814,245 | $124,008,189 | $121,481,597 | |||||
| Total Operating Expenses | $60,818,420 | $64,893,130 | $67,874,476 | $63,997,121 | $59,178,399 | |||||
| Net Operating Income | $72,115,455 | $74,191,946 | $74,939,769 | $60,011,068 | $62,303,198 | |||||
| TI/LC | 0 | 0 | 0 | 0 | 0 | |||||
| Capital Expenditures | 0 | 0 | 0 | 0 | 0 | |||||
| Net Cash Flow | $72,115,455 | $74,191,946 | $74,939,769 | $60,011,068 | $62,303,198 | |||||
NOI DSCR(1) | 1.76x | 1.81x | 1.82x | 1.46x | 1.52x | |||||
NCF DSCR(1) | 1.76x | 1.81x | 1.82x | 1.46x | 1.52x | |||||
NOI DY(1) | 12.9% | 13.3% | 13.4% | 10.7% | 11.2% | |||||
NCF DY(1) | 12.9% | 13.3% | 13.4% | 10.7% | 11.2% |
| (1) | DSCRs and debt yields are based on the AmericasMart Loan Combination. |
Cash Flow Analysis (2011 – 2013)
| FYE 8/31/2011 | FYE 8/31/2012 | FYE 8/31/2013 | TTM 11/30/2013 | U/W | U/W $ per SF | ||||||||
| In-Place Permanent Revenue | $92,651,855 | $93,899,496 | $97,527,822 | $98,491,878 | $102,753,264 | $22.52 | |||||||
| Less Rent Abatements | 0 | 0 | 0 | 0 | (1,904,943)(1) | (0.42) | |||||||
| Grossed Up Vacant Space | 0 | 0 | 0 | 0 | 15,649,899 | 3.43 | |||||||
| Trade Show Revenue | 25,269,079 | 27,199,382 | 30,517,581 | 31,277,177 | 30,517,581 | 6.69 | |||||||
| Other Income | 7,341,041 | 7,222,521 | 7,511,899 | 7,658,799 | 7,511,899 | 1.65 | |||||||
| Less Vacancy & Credit Loss | 99,323 | (536,610) | (245,940) | (27,663) | (15,649,899)(2) | (3.43) | |||||||
| Effective Gross Income | $125,361,298 | $127,784,789 | $135,311,362 | $137,400,191 | $138,877,801 | $30.43 | |||||||
| Total Operating Expenses | $62,054,303 | $64,098,847 | $66,209,231 | $66,718,773 | $66,651,969 | $14.61 | |||||||
| Net Operating Income | $63,306,995 | $63,685,942 | $69,102,131 | $70,681,418 | $72,225,832 | $15.83 | |||||||
| TI/LC | 0 | 0 | 0 | 0 | 2,263,158 | 0.50 | |||||||
| Straight-line of Upfront TI/LC Reserve | 0 | 0 | 0 | 0 | (262,736) | (0.06) | |||||||
| Capital Expenditures | 0 | 0 | 0 | 0 | 1,038,315 | 0.23 | |||||||
| Net Cash Flow | $63,306,995 | $63,685,942 | $69,102,131 | $70,681,418 | $69,187,095 | $15.16 | |||||||
NOI DSCR(3) | 1.54x | 1.55x | 1.68x | 1.72x | 1.76x | ||||||||
NCF DSCR(3) | 1.54x | 1.55x | 1.68x | 1.72x | 1.68x | ||||||||
NOI DY(3) | 11.3% | 11.4% | 12.4% | 12.7% | 12.9% | ||||||||
NCF DY(3) | 11.3% | 11.4% | 12.4% | 12.7% | 12.4% | ||||||||
| (1) | Includes all rent abatements through August 31, 2014. |
| (2) | The underwritten economic vacancy for the permanent space is 14.8%. The AmericasMart Property was 84.7% physically occupied (excluding the trade show and exhibition space) as of October 1, 2013. |
| (3) | DSCRs and debt yields are based on the AmericasMart Loan Combination. |
THE INFORMATION IN THIS STRUCTURAL AND COLLATERAL TERM SHEET IS NOT COMPLETE AND MAY BE AMENDED PRIOR TO THE TIME OF SALE. THIS TERM SHEET IS NOT AN OFFER TO SELL THESE SECURITIES AND IT IS NOT A SOLICITATION OF AN OFFER TO BUY THESE SECURITIES IN ANY JURISDICTION WHERE THE OFFER OR SALE IS NOT PERMITTED.
33
| AMERICASMART |
Appraisal. As of the appraisal valuation date of October 15, 2013, the AmericasMart Property had an “as-is” appraised value of $920,000,000.
Environmental Matters. According to a Phase I environmental site assessment dated October 30, 2013, recognized environmental conditions and historical recognized environmental conditions were identified. The AmericasMart Property has regulatory records of a leaking underground storage tank (“LUST”) incident. A 560-gallon diesel underground storage tank (“UST”) was removed from the northwest corner of AmericasMart 3 in 2005. Soil samples from beneath the previously removed UST revealed low levels of contamination and the Georgia Environmental Protection Division (“GEPD”) released a no further action status. A former tenant, the Greyhound Bus Terminal, also had records of a LUST incident in 1984 when Greyhound Lines reported a release in excess of 15,000 gallons of fuel oil from a UST system. The release was beneath the western portion of AmericasMart 2 and in 2005, 43,786 tons of contaminated soil and 56,000 gallons of contaminated ground water were removed. The GEPD reviewed the site and issued a no further action letter on June 26, 2009. The Phase I environmental site assessment recommended removing a 1,000 gallon diesel UST at AmericasMart 1 and replacing it with an aboveground diesel tank and removing a 12,000 gallon diesel UST at AmericasMart 3 and replacing it with a double-wall fiberglass vessel with leak detection, spill prevention and double-wall piping. A $380,000 reserve was escrowed at closing, which represents approximately 200% of the estimated remediation cost.
Market Overview and Competition. The AmericasMart Property is located on three city blocks within Atlanta’s central business district and is accessible via Peachtree Street, the principal north/south street through the immediate area; Spring Street and West Peachtree Street, which provides direct access between downtown and midtown; and Marietta Street, a north/south artery that also connects downtown and midtown as well as to the Buckhead neighborhood. In addition, the AmericasMart Property is accessible via the Metropolitan Atlanta Rapid Transit Authority (“MARTA”) train station, which is located below the AmericasMart 1 building. MARTA provides direct access to and from Atlanta’s Hartsfield-Jackson International Airport. Atlanta’s central business district is home to a mixture of hotels, convention facilities and entertainment venues, which include Phillips Arena and Fox Theater and Georgia Tech and Georgia State University. The AmericasMart Property draws retailers from all 50 states and over 70 international locations and benefits from being approximately 13 miles north of Hartsfield-Jackson International Airport, which is the busiest passenger airport in the world. The AmericasMart Property has more than 10,000 hotel rooms within one mile of the AmericasMart Property and the Westin Peachtree Plaza, the Ritz Carlton Atlanta, the Doubletree by Hilton, Holiday Inn Downtown, Hyatt Regency and an Aloft (scheduled to open in April 2014) are all within one block of the AmericasMart Property.
According to the appraisal, Atlanta ranks among the top 10 metropolitan areas for job growth. As of August 2013, the Atlanta metropolitan statistical area gained 57,100 jobs year-over-year and according to a third-party research report, as of August 2013, the Atlanta metropolitan statistical area reported an 18.5% year-over-year increase in home prices. According to a third party research report, Atlanta’s MSA population growth averaged 2.0% between 2002 and 2012, which is twice the national average. The Atlanta metropolitan statistical area is the headquarters for four global 500 corporations, 13 Fortune 500 corporations and 24 Fortune 1000 corporations. The Home Depot, UPS, Coca-Cola, Delta Airlines, Southern Company, Genuine Parts, SunTrust and First Data are all headquartered in Atlanta and its surrounding suburbs.
Some of the major recently constructed or planned projects within the Atlanta central business district include The Georgia Aquarium, a $200.0 million project that has attracted approximately 3.6 million visitors since opening in 2005; the 30,000 square foot Children’s Museum of Atlanta that opened in 2006; the College Football Hall of Fame, a 94,256 square foot project that is expected to feature approximately 30,000 square feet of exhibit space and a 45-yard indoor football field that is scheduled to open in the fall of 2014; and the National Center for Civil and Human Rights, which is scheduled to open in May 2014 and will be adjacent to the World of Coca-Cola and the Georgia Aquarium.
The following table presents certain information relating to comparable trade mart properties to the AmericasMart Property:
Competitive Set(1)
AmericasMart (Subject) | Dallas Market Center | Chicago Merchandise Mart | World Market Center | International Home Furnishings Mart | California Market Center | Decoration & Design Building | Decorative Center of Houston | |
| Location | Atlanta, GA | Dallas, TX | Chicago, IL | Las Vegas, NV | High Point, NC | Los Angeles, CA | New York, NY | Houston, TX |
| Property Type | Trade Mart | Trade Mart | Trade Mart | Trade Mart | Trade Mart | Trade Mart | Trade Mart | Trade Mart |
Year Built/ Renovated | 1961/2008 | 1957/1964 | 1930/NAP | 2005/2008 | 1921-2001/NAV | 1963/1985 | NAV/NAV | 1975& 1985/NAP |
| Merchandise Lines | Holiday/Floral, Home Furnishings, Accessories/Jewelry, Apparel, Gifts, Bridal/Prom, Gourmet & Housewares, Rugs and Fine Linens | Home Décor, Apparel, Gifts, Gourmet | Apparel, Accessories, Gifts, Furniture, Home Furnishings | Home Furnishings, Accessories | Home Furnishings | Apparel, Accessories, Gifts | Home Furnishings, Accessories | Home Furnishings, Accessories, Office |
| Total GLA | 4,563,219 SF | 8,800,000 SF | 4,200,000 SF | 4,900,000 SF | 2,684,373 SF | 1,900,000 SF | 584,000 SF | 650,000 SF |
| Total Occupancy | 85% | 85% | 95% | NAV | 89% | 90% | 92% | 83% |
| (1) | Information obtained from the appraisal. |
The Borrower. The borrower is AmericasMart Real Estate, LLC, a single purpose entity whose managing member has two independent directors. Legal counsel to the borrower delivered a non-consolidation opinion in connection with the origination of the AmericasMart Loan Combination. AMC, Inc. (“AMC”) and Portman Financial, Inc., the sponsors, are the guarantors of certain nonrecourse carveouts under the AmericasMart Loan Combination.
THE INFORMATION IN THIS STRUCTURAL AND COLLATERAL TERM SHEET IS NOT COMPLETE AND MAY BE AMENDED PRIOR TO THE TIME OF SALE. THIS TERM SHEET IS NOT AN OFFER TO SELL THESE SECURITIES AND IT IS NOT A SOLICITATION OF AN OFFER TO BUY THESE SECURITIES IN ANY JURISDICTION WHERE THE OFFER OR SALE IS NOT PERMITTED. |
34
| AMERICASMART |
The Sponsors. The loan sponsors are AMC, Inc., a privately held company wholly owned by John C. Portman and members of his immediate family, and Portman Financial Inc. The AmericasMart Property has been owned and managed since its development in 1961 by individuals and entities affiliated with the sponsors. The Portman family also owns Portman Holdings LLC, a real estate development company and John Portman & Associates, a global architectural firm. AMC has operated and developed other properties associated with the trade mart and trade show industry including the Design Center of the Americas in Fort Lauderdale, Florida; Atlanta Decorative Arts Center in Atlanta, Georgia; Brussels International Trade Mart in Brussels, Belgium and San Francisco Fashion Mart in San Francisco, California. Collectively, AMC, Inc., Portman Holdings LLC and John Portman & Associates comprise the Portman Companies. In addition to AmericasMart, the Portman Companies have developed and managed real estate projects around the world that include the Hilton San Diego Bayfront (San Diego, California); Westin Charlotte (Charlotte, North Carolina); The Portman Ritz Carlton (Shanghai, China); Marina Mandarin Hotel (Marina Square, Singapore), Le Meridien (San Francisco, California) and the New York Marriott Marquis (New York, New York).
Escrows. The loan documents provide for upfront reserves in the amount of $1,284,853 for real estate taxes, $352,469 for deferred maintenance, $1,557,473 for replacement reserves, $2,627,360 for tenant improvements and leasing commissions, $380,000 for an environmental reserve and $4,144 for ground rent. The loan documents provide for monthly deposits of $428,285 for real estate taxes. The loan documents do not require monthly escrows for insurance provided (i) no event of default has occurred and is continuing; (ii) the insurance required to be maintained by the borrower is maintained pursuant to one or more blanket insurance policies; and (iii) the borrower provides the lender with timely proof of payment of insurance premiums. The loan documents do not require monthly escrows for replacement reserves as long as the balance of the escrow account equals $1,557,473 (“Replacement Reserve Cap”). If the balance of the replacement reserve account is less than the Replacement Reserve Cap, within 60 days, the borrower is required to deposit an amount that would restore the balance of the replacement reserve account to equal the Replacement Reserve Cap. The loan documents do not require monthly escrows for tenant improvements and leasing commission reserves as long as the balance of the escrow account equals $2,627,360 (“TI/LC Reserve Cap”). If the balance of the tenant improvement and leasing commissions reserve account is less than the TI/LC Reserve Cap, within 60 days, the borrower is required to deposit an amount that would restore the balance of the tenant improvements and leasing commissions reserve account to equal the TI/LC Reserve Cap. The AmericasMart borrower has deposited with the lender one month’s ground rent. If the AmericasMart borrower fails to provide evidence of payment of ground rent, the lender may make payment from the ground rent reserve and the AmericasMart borrower will replenish the reserve within 15 days after disbursement.
Lockbox and Cash Management. The AmericasMart Loan Combination requires a lender-controlled lockbox account, which is already in place, and that the borrower directs permanent tenants to pay their rents directly into such lockbox account (exhibition tenants do not pay directly into the lockbox). The loan documents also require that all rents received by the borrower or the property manager be deposited into the lockbox account within three business days of receipt. Funds are then swept to a cash management account controlled by the lender and prior to the occurrence of a Cash Trap Event Period (as defined below), all excess funds after application in accordance with the loan documents are distributed to the borrower’s operating account. During a Cash Trap Event Period, all excess cash flow is retained in the cash management account.
A “Cash Trap Event Period” will commence upon (i) the occurrence and continuance of an event of default; (ii) the net operating income debt yield falling below 10.0% at the end of any calendar quarter; or (iii) the discontinuation of either of the International Gift and Home Furnishing Market Tradeshows occurring in January and July held at the AmericasMart Property. A Cash Trap Event Period will be cured, with regard to the circumstances in clause (i), upon the cure of such event of default (provided that a Cash Trap Event Period has not occurred pursuant to clause (ii) or (iii) above) or, with regard to the circumstances in clause (ii), the net operating income debt yield is equal to or greater than 10.0% for two consecutive calendar quarters (provided that a Cash Trap Event Period has not occurred pursuant to clause (i) or (iii) above).
Property Management. The AmericasMart Property is managed by an affiliate of the borrower.
Assumption. The borrower has a two-time right to transfer the AmericasMart Property, provided that no event of default has occurred and is continuing and certain other conditions are satisfied, including, but not limited to the following: (i) the proposed transferee being a qualified transferee with total assets of $1,000,000,000 and capital or statutory surplus or shareholders equity in excess of $500,000,000 and is regularly engaged in the business of owning and operating comparable properties in major metropolitan areas; (ii) execution of a recourse guaranty and an environmental indemnity by an affiliate of the transferee; and (iii) if requested by the lender, rating agency confirmation from DBRS, Fitch and Moody’s that the transfer will not result in a downgrade, withdrawal or qualification of the respective ratings assigned to the Series 2014-LC14 Certificates, and similar confirmations with respect to the ratings of any securities backed by the AmericasMart Companion Loans.
Partial Release. The AmericasMart borrower has the right to release the parcel of the AmericasMart Property consisting of the air rights over the AmericasMart 2 Expansion parcel at no cost other than the lender’s expenses only upon (x) the lender’s prior, written approval, to be granted in the lender’s sole, but reasonable, discretion and (y) receipt of a rating agency confirmation from DBRS, Fitch and Moody’s. Conditions to the release may include, among other conditions, (i) no event of default has occurred and is continuing; (ii) the loan-to-value ratio immediately after the release being equal to or less than the lesser of (a) 60.9% or (b) the loan-to-value ratio immediately prior to the release based on an appraised value at the time of the release; (iii) the net cash flow debt yield being equal to or greater than the greater of (a) 16.5% and (b) the net cash flow debt yield immediately prior to the release of the parcel; and (iv) the release will not adversely affect the liens, security interests and other rights of the lender under the loan documents not being released.
Real Estate Substitution. Not permitted.
Subordinate and Mezzanine Indebtedness. Not permitted.
THE INFORMATION IN THIS STRUCTURAL AND COLLATERAL TERM SHEET IS NOT COMPLETE AND MAY BE AMENDED PRIOR TO THE TIME OF SALE. THIS TERM SHEET IS NOT AN OFFER TO SELL THESE SECURITIES AND IT IS NOT A SOLICITATION OF AN OFFER TO BUY THESE SECURITIES IN ANY JURISDICTION WHERE THE OFFER OR SALE IS NOT PERMITTED. |
35
| AMERICASMART |
Ground Leases and Air Rights Lease. The AmericasMart 1 building includes one leasehold parcel totaling 0.2 acres out of total land area of 2.4 acres (the “AmericasMart 1 Ground Lease”), and an air rights parcel lease from MARTA totaling 0.02 acres (the “MARTA Air Rights Lease”). The AmericasMart 1 Ground Lease expires June 30, 2061 and the MARTA Air Rights Lease expires December 16, 2022. The portion of the AmericasMart Property encumbered by the air rights lease is a restaurant, which has a lease with the AmericasMart borrower that expires on February 28, 2022 with an annual rent of $240,312 throughout the lease term. The AmericasMart 3 building includes one leasehold parcel with William Edwards, the Episcopal Church, The University of Georgia and the related borrower, as ground lessors and tenants-in-common, respectively, totaling 0.21 acres out of total land area of 3.7 acres (the “AmericasMart 3 Ground Lease”). The AmericasMart 3 Ground Lease expires August 31, 2071. The loan documents also provide for springing recourse to the borrower and guarantors if any ground lease is terminated, cancelled or otherwise ceases to exist in violation of the loan terms. See “Description of the Mortgage Pool – Certain Terms of the Mortgage Loans – Encumbered Interests” in the Free Writing Prospectus.
Taxable Revenue Bonds/Tax Abatement. The construction of AmericasMart 2 Expansion was financed by the issuance of $180.5 million of taxable municipal bonds (“Bonds”) issued by the Development Authority of Fulton County (“Development Authority”). The Development Authority, as owner of the fee interest in the AmericasMart 2 Expansion, entered into a lease with the AmericasMart borrower. Since the Development Authority is exempt from property taxes, the AmericasMart borrower is only taxed on the leasehold value of the AmericasMart 2 Expansion. The lease payments to the Development Authority pay the principal and interest on the Bonds. The Bonds were pledged as collateral for the AmericasMart Loan Combination. The AmericasMart borrower owns the related Bonds and the Development Authority has encumbered its fee interest to the lien of the AmericasMart Loan Combination. The Bonds mature on January 1, 2019 and the tax abatement will expire at that time. The underwritten property taxes assume the full tax assessment.
Terrorism Insurance. The loan documents require that the “all risk” insurance policy required to be maintained by the borrower provides coverage for terrorism in an amount equal to the full replacement cost of the AmericasMart Property. The loan documents also require business interruption insurance covering no less than the 18-month period following the occurrence of a casualty event, together with a six-month extended period of indemnity.
THE INFORMATION IN THIS STRUCTURAL AND COLLATERAL TERM SHEET IS NOT COMPLETE AND MAY BE AMENDED PRIOR TO THE TIME OF SALE. THIS TERM SHEET IS NOT AN OFFER TO SELL THESE SECURITIES AND IT IS NOT A SOLICITATION OF AN OFFER TO BUY THESE SECURITIES IN ANY JURISDICTION WHERE THE OFFER OR SALE IS NOT PERMITTED. |
36
(THIS PAGE INTENTIONALLY LEFT BLANK)
37
| PENNCAP PORTFOLIO |
THE INFORMATION IN THIS STRUCTURAL AND COLLATERAL TERM SHEET IS NOT COMPLETE AND MAY BE AMENDED PRIOR TO THE TIME OF SALE. THIS TERM SHEET IS NOT AN OFFER TO SELL THESE SECURITIES AND IT IS NOT A SOLICITATION OF AN OFFER TO BUY THESE SECURITIES IN ANY JURISDICTION WHERE THE OFFER OR SALE IS NOT PERMITTED.
38
| PENNCAP PORTFOLIO |
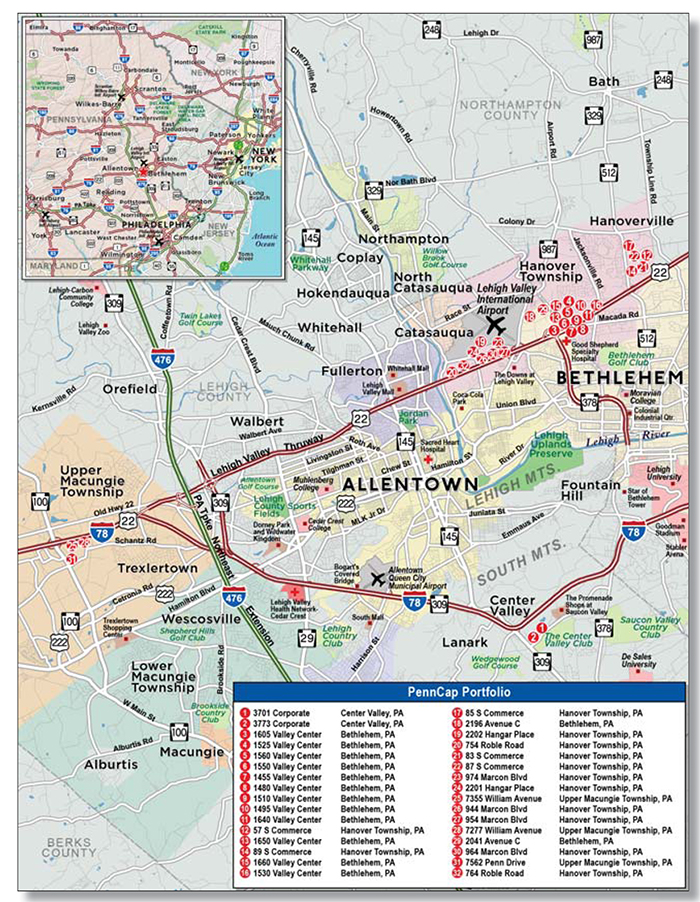
THE INFORMATION IN THIS STRUCTURAL AND COLLATERAL TERM SHEET IS NOT COMPLETE AND MAY BE AMENDED PRIOR TO THE TIME OF SALE. THIS TERM SHEET IS NOT AN OFFER TO SELL THESE SECURITIES AND IT IS NOT A SOLICITATION OF AN OFFER TO BUY THESE SECURITIES IN ANY JURISDICTION WHERE THE OFFER OR SALE IS NOT PERMITTED.
39
| No. 2 – PennCap Portfolio | |||||||
| Loan Information | Property Information | ||||||
| Mortgage Loan Seller: | Ladder Capital Finance LLC | Single Asset/Portfolio: | Portfolio | ||||
Credit Assessment (DBRS/Fitch/Moody’s): | NR/NR/NR | Property Type: | Various – See Table | ||||
Original Principal Balance(1): | $90,000,000 | Specific Property Type: | Various – See Table | ||||
Cut-off Date Principal Balance(1): | $90,000,000 | Location: | Various – See Table | ||||
| % of Initial Pool Balance: | 7.2% | Size: | 1,432,661 SF | ||||
| Loan Purpose: | Acquisition | Cut-off Date Principal Balance Per SF:(1)(4) | $86.34 | ||||
Borrower Names(2): | Various | Year Built/Renovated: | Various – See Table | ||||
| Sponsor: | PennCap Acquisitions, LP | Title Vesting: | Fee | ||||
| Mortgage Rate: | 5.7243% | Property Manager: | G&E Real Estate Management Services, Inc. | ||||
| Note Date: | December 31, 2013 | 3rd Most Recent Occupancy (As of): | NAV | ||||
| Anticipated Repayment Date: | NAP | 2nd Most Recent Occupancy (As of): | 88.2% (12/31/2011) | ||||
| Maturity Date: | January 6, 2024 | Most Recent Occupancy (As of): | 87.2% (12/31/2012) | ||||
| IO Period: | 24 months | Current Occupancy (As of): | 89.9% (11/1/2013) | ||||
| Loan Term (Original): | 120 months | ||||||
| Seasoning: | 1 month | Underwriting and Financial Information: | |||||
| Amortization Term (Original): | 360 months | ||||||
| Loan Amortization Type: | Interest-only, Amortizing Balloon | 3rd Most Recent NOI (As of)(7): | $11,551,068 (T8 12/31/2011 Annualized) | ||||
| Interest Accrual Method: | Actual/360 | 2nd Most Recent NOI (As of)(7): | $11,332,899 (12/31/2012) | ||||
Call Protection(3): | L(35),D(82),O(3) | Most Recent NOI (As of)(7): | $12,311,462 (TTM 9/30/2013) | ||||
| Lockbox Type: | Hard/Upfront Cash Management | ||||||
Additional Debt(1)(4): | Yes | U/W Revenues(7): | $21,920,002 | ||||
Additional Debt Type(1)(4): | Pari Passu; Mezzanine | U/W Expenses: | $8,654,705 | ||||
U/W NOI(7): | $13,265,296 | ||||||
Escrows and Reserves(5): | U/W NCF(7): | $12,000,670 | |||||
U/W NOI DSCR(1)(4): | 1.54x | ||||||
Type: | Initial | Monthly | Cap (If Any) | U/W NCF DSCR(1)4): | 1.39x | ||
| Taxes | $993,880 | $230,698 | NAP | U/W NOI Debt Yield(1)(4): | 10.7% | ||
| Insurance | $173,038 | $18,606 | NAP | U/W NCF Debt Yield(1)(4): | 9.7% | ||
| Replacement Reserves | $0 | $29,847 | NAP | As-Is Appraised Value(8): | $165,000,000 | ||
TI/LC Reserve(6) | $590,000 | $62,500 | $3,000,000 | As-Is Appraisal Valuation Date: | Various | ||
| Deferred Maintenance | $142,223 | $0 | NAP | Cut-off Date LTV Ratio(1)(4): | 75.0% | ||
| Tenant Specific TI/LC Reserve | $1,598,857 | $0 | NAP | LTV Ratio at Maturity or ARD(1)(4): | 66.0% | ||
| (1) | The PennCap Portfolio Loan Combination totaling $123,700,000 is comprised of two pari passu notes (Notes A-1 and A-2). Note A-1 had an original principal balance of $90,000,000, has an outstanding principal balance as of the Cut-off Date of $90,000,000 and will be contributed to the WFRBS 2014-LC14 Trust. Note A-2 had an original balance of $33,700,000 and is expected to be contributed to a future trust. All presented statistical information related to balances per square foot, loan-to-value ratios, debt service coverage ratios and debt yields are based on the PennCap Portfolio Loan Combination. |
| (2) | The borrowers consist of 27 separate single purpose entities which are all limited partnerships. |
| (3) | Defeasance of the full PennCap Portfolio Loan Combination is permitted after the later of (i) the date that is two years following the closing date of the securitization that includes Note A-2 and (ii) December 31, 2016. If the tenant at the 1530 Valley Center property exercises its purchase option, which it may do between December 1, 2015 and March 31, 2016 provided tenant has provided notice on or before June 1, 2015, the 1530 Valley Center property may be released upon prepayment of the PennCap Portfolio Loan Combination in the amount of $3,288,000 along with the payment of a prepayment fee of $164,400. |
(4) | See “Subordinate and Mezzanine Indebtedness” section. The equity interests in the PennCap Portfolio Loan Combination borrowers have been pledged to secure mezzanine indebtedness with a principal balance of $14,900,000. All LTV, DSCR, debt yield and Cut-off Date Principal Balance per square foot numbers shown in the chart above are based solely on the $123,700,000 PennCap Portfolio Loan Combination. As of the Cut-off Date, with respect to the PennCap Portfolio Loan Combination and the related mezzanine financing, the loan per square foot is $96.74, the underwritten NCF DSCR is 1.15x, the combined Cut-off Date LTV ratio is 84.0% and the combined underwritten NCF Debt Yield is 8.7%. |
| (5) | See “Escrows” section. |
| (6) | The required monthly deposits into the TI/LC Reserve shall be $112,500 during the first 24 months. |
| (7) | See “Cash Flow Analysis” section. |
| (8) | The appraised value is based on a portfolio valuation and incorporates a capitalization rate reduction of 0.50% applied by the appraiser to account for the portfolio nature of the collateral. The combined stand-alone appraised value of all of the PennCap Portfolio properties is $155,775,000 which equates to a Cut-off Date LTV Ratio of 79.4%. |
The Mortgage Loan. The mortgage loan (the “PennCap Portfolio Loan Combination”) is evidenced by two pari passu notes (Note A-1 and Note A-2) secured by a first mortgage encumbering 32 office, flex and warehouse buildings located in the Lehigh Valley area of Pennsylvania (the “PennCap Portfolio Properties”). The PennCap Portfolio Loan Combination was originated on December 31, 2013 by Ladder Capital Finance LLC. The PennCap Portfolio Loan Combination had an original principal balance of $123,700,000, has an outstanding principal balance as of the Cut-off Date of $123,700,000 and accrues interest at an interest rate of 5.7243% per annum. The PennCap Portfolio Loan Combination had an initial term of 120 months, has a remaining term of 119 months as of the Cut-off Date and requires interest-only payments for the first 24 payments following origination and thereafter requires payments of principal and interest based on a 30-year amortization schedule. The PennCap Portfolio Loan Combination matures on January 6,
THE INFORMATION IN THIS STRUCTURAL AND COLLATERAL TERM SHEET IS NOT COMPLETE AND MAY BE AMENDED PRIOR TO THE TIME OF SALE. THIS TERM SHEET IS NOT AN OFFER TO SELL THESE SECURITIES AND IT IS NOT A SOLICITATION OF AN OFFER TO BUY THESE SECURITIES IN ANY JURISDICTION WHERE THE OFFER OR SALE IS NOT PERMITTED.
40
| PENNCAP PORTFOLIO |
2024. See “Description of the Mortgage Pool–Split Loan Structures-The PennCap Portfolio Loan Combination” and “Servicing of the Mortgage Loans and Administration of the Trust Fund” in the Free Writing Prospectus.
Note A-1, which is the controlling note with respect to the PennCap Portfolio Loan Combination and will be contributed to the WFRBS 2014-LC14 Trust, had an original principal balance of $90,000,000 and has an outstanding principal balance as of the Cut-off Date of $90,000,000 (the “PennCap Portfolio Mortgage Loan”). Note A-2 had an original principal balance of $33,700,000 and is expected to be contributed to a future commercial mortgage trust (the “PennCap Portfolio Companion Loan”); however, the lender provides no assurances that any non-securitized note will not be split further. The PennCap Portfolio Mortgage Loan and the PennCap Portfolio Companion Loan together comprise the PennCap Portfolio Loan Combination.
Following the lockout period, the borrowers have the right to defease the PennCap Portfolio Loan Combination in whole, but not in part on any date before November 6, 2023. However, if the tenant at the 1530 Valley Center property exercises its purchase option, which it may do between December 1, 2015 and March 31, 2016 provided tenant has provided notice on or before June 1, 2015, the 1530 Valley Center property may be released upon prepayment of the PennCap Portfolio Loan Combination in the amount of $3,288,000 along with the payment of a prepayment fee of $164,400. No defeasance or yield maintenance is required in connection with such partial prepayment. In addition, the PennCap Portfolio Loan Combination is prepayable without penalty on any date on or after November 6, 2023.
Sources and Uses
| Sources | Uses | ||||||||
| Original loan combination amount | $123,700,000 | 71.8% | Purchase price | $166,832,003 | 96.9 | % | |||
| Mezzanine loan | 14,900,000 | 8.7 | Reserves | 2,631,019 | 1.5 | ||||
Sponsor’s new cash contribution(1) | 33,581,319 | 19.5 | Closing costs | 2,718,296 | 1.6 | ||||
| Total Sources | $172,181,319 | 100.0% | Total Uses | $172,181,319 | 100.0 | % | |||
| (1) | The sponsor’s new cash contribution includes $3,000,000 of participation profits rolled over by Aslar Associates from a profit participation agreement in the PennCap Portfolio Properties with the seller. Sponsor equity additionally includes $4,500,000 of equity which was funded via an unsecured loan provided by a seller-related entity, CPI OPI REIT, Inc., to PennCap Acquisitions, LP, a limited partner in the mezzanine loan borrower. |
The Properties. The PennCap Portfolio Properties are comprised of the fee interests in 17 suburban class A and B office properties and 15 suburban industrial properties, located within five business parks in the greater Lehigh Valley, Pennsylvania area and totaling 1,432,661 square feet. The parks include the Lehigh Valley Corporate Center, the Stabler Corporate Center, Lehigh Valley Industrial Parks I and III, South Commerce Way, and William Penn Corporate Center. As of November 1, 2013, the PennCap Portfolio Properties were 89.9% leased by approximately 105 tenants.
The PennCap Portfolio Properties are generally single or multi-story class A and B office buildings, built between 1989 and 2006, as well as single-story flex and warehouse buildings, built between 1980 and 1997.
THE INFORMATION IN THIS STRUCTURAL AND COLLATERAL TERM SHEET IS NOT COMPLETE AND MAY BE AMENDED PRIOR TO THE TIME OF SALE. THIS TERM SHEET IS NOT AN OFFER TO SELL THESE SECURITIES AND IT IS NOT A SOLICITATION OF AN OFFER TO BUY THESE SECURITIES IN ANY JURISDICTION WHERE THE OFFER OR SALE IS NOT PERMITTED.
41
| PENNCAP PORTFOLIO |
The following table presents certain information relating to the PennCap Portfolio Properties:
Property Name – Location(1) | Type | Allocated Cut- off Date Principal Balance | % of Portfolio Cut-off Date Principal Balance | Occupancy | Year Built/ Renovated | Net Rentable Area (SF) | Appraised Value(2) | ||
| 3701 Corporate - Center Valley | Office | $11,980,000 | 9.7% | 93.3% | 2006/NAP | 75,000 | $15,100,000 | ||
| 3773 Corporate - Center Valley | Office | $10,900,000 | 8.8% | 100.0% | 2001/NAP | 71,000 | $13,725,000 | ||
| 1605 Valley Center - Bethlehem | Office | $8,660,000 | 7.0% | 84.0% | 2002/NAP | 95,000 | $10,900,000 | ||
| 1525 Valley Center - Bethlehem | Office | $8,080,000 | 6.5% | 91.9% | 1999/NAP | 75,000 | $10,175,000 | ||
| 1560 Valley Center - Bethlehem | Office | $6,770,000 | 5.5% | 100.0% | 1989/NAP | 51,400 | $8,525,000 | ||
| 1550 Valley Center – Bethlehem | Office | $5,840,000 | 4.7% | 100.0% | 1989/NAP | 43,400 | $7,350,000 | ||
| 1455 Valley Center - Bethlehem | Office | $5,800,000 | 4.7% | 88.0% | 1996/NAP | 54,118 | $7,300,000 | ||
| 1480 Valley Center - Bethlehem | Office | $5,320,000 | 4.3% | 100.0% | 1991/NAP | 51,793 | $6,700,000 | ||
| 1510 Valley Center - Bethlehem | Office | $4,740,000 | 3.8% | 83.5% | 1989/NAP | 48,208 | $5,975,000 | ||
| 1495 Valley Center - Bethlehem | Office | $4,230,000 | 3.4% | 87.0% | 1991/NAP | 43,770 | $5,325,000 | ||
| 1640 Valley Center - Bethlehem | Office | $3,990,000 | 3.2% | 100.0% | 1997/NAP | 30,850 | $5,025,000 | ||
| 57 S Commerce - Hanover Township | Industrial | $3,770,000 | 3.0% | 92.1% | 1988/NAP | 76,400 | $4,750,000 | ||
| 1650 Valley Center - Bethlehem | Office | $3,450,000 | 2.8% | 100.0% | 1997/NAP | 29,240 | $4,350,000 | ||
| 89 S Commerce - Hanover Township | Industrial | $3,390,000 | 2.7% | 77.8% | 1997/NAP | 43,200 | $4,275,000 | ||
| 1660 Valley Center - Bethlehem | Office | $2,860,000 | 2.3% | 81.0% | 1997/NAP | 27,508 | $3,600,000 | ||
| 1530 Valley Center - Bethlehem | Office | $2,740,000 | 2.2% | 100.0% | 1989/NAP | 46,400 | $3,450,000 | ||
| 85 S Commerce - Hanover Township | Office | $2,400,000 | 1.9% | 100.0% | 1990/NAP | 21,119 | $3,025,000 | ||
| 2196 Avenue C - Bethlehem | Industrial | $2,300,000 | 1.9% | 100.0% | 1980/NAP | 31,140 | $2,900,000 | ||
| 2202 Hangar Place - Hanover Township | Industrial | $2,300,000 | 1.9% | 100.0% | 1982/NAP | 66,495 | $2,900,000 | ||
| 754 Roble Road - Hanover Township | Industrial | $2,180,000 | 1.8% | 89.7% | 1987/NAP | 46,800 | $2,750,000 | ||
| 83 S Commerce - Hanover Township | Office | $2,140,000 | 1.7% | 81.1% | 1990/NAP | 19,252 | $2,700,000 | ||
| 87 S Commerce - Hanover Township | Office | $2,100,000 | 1.7% | 60.0% | 1990/NAP | 22,653 | $2,650,000 | ||
| 974 Marcon Blvd - Hanover Township | Industrial | $1,990,000 | 1.6% | 35.8% | 1987/NAP | 39,200 | $2,500,000 | ||
| 2201 Hangar Place - Hanover Township | Industrial | $1,970,000 | 1.6% | 100.0% | 1982/NAP | 52,300 | $2,475,000 | ||
| 7355 William Avenue - Upper Macungie Township | Industrial | $1,970,000 | 1.6% | 89.0% | 1988/NAP | 43,425 | $2,475,000 | ||
| 944 Marcon Blvd - Hanover Township | Industrial | $1,950,000 | 1.6% | 83.3% | 1985/NAP | 38,400 | $2,450,000 | ||
| 954 Marcon Blvd - Hanover Township | Industrial | $1,850,000 | 1.5% | 100.0% | 1982/NAP | 30,140 | $2,325,000 | ||
| 7277 William Avenue - Upper Macungie Township | Industrial | $1,830,000 | 1.5% | 70.8% | 1989/NAP | 41,040 | $2,300,000 | ||
| 2041 Avenue C - Bethlehem | Industrial | $1,710,000 | 1.4% | 100.0% | 1987/NAP | 30,400 | $2,150,000 | ||
| 964 Marcon Blvd - Hanover Township | Industrial | $1,510,000 | 1.2% | 71.4% | 1986/NAP | 39,200 | $1,900,000 | ||
| 7562 Penn Drive - Upper Macungie Township | Industrial | $1,510,000 | 1.2% | 100.0% | 1989/NAP | 26,950 | $1,900,000 | ||
| 764 Roble Road - Hanover Township | Industrial | $1,470,000 | 1.2% | 100.0% | 1986/NAP | 21,860 | $1,850,000 | ||
| Total/Weighted Average | $123,700,000 | 100.0% | 89.9% | 1,432,661 | $155,775,000 | ||||
| (1) | All of the locations are in Pennsylvania. |
| (2) | The appraised value is for the individual value for each property. The appraiser applied a 0.50% capitalization rate reduction due to the portfolio nature of the loan which increases the appraised value of the portfolio to $165,000,000. |
THE INFORMATION IN THIS STRUCTURAL AND COLLATERAL TERM SHEET IS NOT COMPLETE AND MAY BE AMENDED PRIOR TO THE TIME OF SALE. THIS TERM SHEET IS NOT AN OFFER TO SELL THESE SECURITIES AND IT IS NOT A SOLICITATION OF AN OFFER TO BUY THESE SECURITIES IN ANY JURISDICTION WHERE THE OFFER OR SALE IS NOT PERMITTED.
42
| PENNCAP PORTFOLIO |
Lehigh Valley Corporate Center (50.5% of Portfolio Cut-off Date Principal Balance)
Twelve of the PennCap Portfolio Properties containing a total of 596,687 square feet are located within the Lehigh Valley Corporate Center. Those properties are collectively 92.2% occupied by 34 office tenants. The largest tenant is Lehigh Valley Academy which occupies 134,660 square feet through August 2023 and 6,749 square feet through August 2018. The Lehigh Valley Corporate Center is located in Hanover Township, Pennsylvania. Hanover Township is a bedroom community outside the City of Bethlehem, Pennsylvania. Additionally, Hanover Township is an employment center for Lehigh Valley. The Lehigh Valley Corporate Center is within minutes of Routes 33 & 378, and the Lehigh Valley International Airport. Business park amenities include over two miles of walking/jogging trails, a hotel, restaurant and retail within the center as well as attractive professional landscaping with ponds, fountains and sculptures.
Stabler Corporate Center (18.5% of Portfolio Cut-off Date Principal Balance)
Two of the PennCap Portfolio Properties containing a total of 146,000 square feet are located within the Stabler Corporate Center area, a planned mixed-use development. Those properties are collectively 96.6% occupied by 15 office tenants. The largest tenant is Aesculap, Inc. which occupies 55,700 square feet through August 2022. The subject neighborhood includes several single- and multi-tenanted office buildings, the campus of Penn State Lehigh Valley and a number of industrial uses.
Lehigh Valley Industrial Parks I and III (15.5% of Portfolio Cut-off Date Principal Balance)
Ten of the PennCap Portfolio Properties containing a total of 395,935 square feet are located within the Lehigh Valley Industrial Parks I & III. Those properties are collectively 88.0% occupied by 25 industrial tenants. The largest tenant is The Wasserstrom Company which occupies 66,495 square feet through June 2014. The surrounding neighborhood is a mixed-use development including residential, commercial and industrial uses. Lehigh Valley Industrial Parks I & III are situated near Route 22 and consist of a variety of warehouse, flex and office uses. The Lehigh Valley International Airport is located approximately 1.2 miles northeast of the properties.
South Commerce Way (11.2% of Portfolio Cut-off Date Principal Balance)
Five of the PennCap Portfolio Properties containing a total of 182,624 square feet are located on South Commerce Way in Hanover Township, Pennsylvania. Those properties are collectively 84.5% occupied by 18 office and warehouse tenants. The largest tenant is Communication Data Services, Inc. which occupies 25,090 square feet through November 2015. Hanover Township is a bedroom community outside the City of Bethlehem, Pennsylvania. Retail and commercial land uses are found along the major arterial roadways that serve this community. Additionally, Hanover Township is an employment center for Lehigh Valley. The area immediately surrounding and directly influencing the subject properties are dominated by business-campus land uses. These campuses include multi-story, multi-tenanted office buildings similar to the PennCap Portfolio Properties as well as single-story, light industrial developments.
William Penn Corporate Center (4.3% of Portfolio Cut-off Date Principal Balance)
Three of the PennCap Portfolio Properties containing a total of 111,415 square feet are located within the William Penn Corporate Center in Upper Macungie Township, Pennsylvania. Those properties are collectively 85.0% occupied by 13 industrial tenants. The largest tenant is TECO-Westinghouse which occupies 24,340 square feet through September 2016. Upper Macungie Township includes a mix of residential, commercial and light industrial land uses. Residential uses consist of a broad mix of single and multi-family dwellings. The predominant land use in the township is light industrial. The area immediately surrounding the William Penn Corporate Center consists primarily of light industrial facilities and several hotel properties.
THE INFORMATION IN THIS STRUCTURAL AND COLLATERAL TERM SHEET IS NOT COMPLETE AND MAY BE AMENDED PRIOR TO THE TIME OF SALE. THIS TERM SHEET IS NOT AN OFFER TO SELL THESE SECURITIES AND IT IS NOT A SOLICITATION OF AN OFFER TO BUY THESE SECURITIES IN ANY JURISDICTION WHERE THE OFFER OR SALE IS NOT PERMITTED.
43
| PENNCAP PORTFOLIO |
The following table presents certain information relating to the tenancy at the PennCap Portfolio Properties:
Major Tenants
| Tenant Name | Credit Rating(Fitch/Moody’s/ S&P)(1) | Tenant NRSF | % of NRSF | Annual U/W Base Rent PSF(2) | Annual U/W Base Rent(2) | % of Total Annual U/W Base Rent | Lease Expiration Date | |||||||
| Major Tenants | ||||||||||||||
| Lehigh Valley Academy | NR/NR/NR | 141,409 | 9.9% | $15.94 | $2,254,027 | 15.8% | Various(3) | |||||||
| Aesculap, Inc. | NR/NR/NR | 55,700 | 3.9% | $17.75 | $988,675 | 6.9% | 8/31/2022(4) | |||||||
| Flowserve US Inc. | BBB/Baa2/BBB- | 51,793 | 3.6% | $12.34 | $639,126 | 4.5% | 12/31/2022(5) | |||||||
| Telerx Marketing Inc. | A+/A2/AA | 50,960(6) | 3.6% | $7.21 | $367,422 | 2.6% | 8/31/2019(7) | |||||||
| The Wasserstrom Co. | NR/NR/NR | 66,495 | 4.6% | $4.45 | $295,903 | 2.1% | 6/30/2014 | |||||||
| Total Major Tenants | 366,357 | 25.6% | $12.41 | $4,545,153 | 31.8% | |||||||||
| Non-Major Tenants | 914,795 | 63.9% | $10.65 | $9,743,110 | 68.2% | |||||||||
| Occupied Collateral Total | 1,281,152 | 89.4% | $11.15 | $14,288,263 | 100.0% | |||||||||
| Vacant Space | 151,509 | 10.6% | ||||||||||||
| Collateral Total | 1,432,661 | 100.0% | ||||||||||||
| (1) | Certain ratings are those of the parent company whether or not the parent guarantees the lease. |
| (2) | U/W Base Rent PSF and U/W Base Rent include contractual rent steps through October 1, 2014. |
| (3) | Lehigh Valley Academy has two lease expirations. The 6,749 square feet expires August 31, 2018 and 134,660 square feet expires August 31, 2023. |
| (4) | Aesculap, Inc. has the right to terminate its lease on August 31, 2020 with fifteen months’ notice and the payment of a termination fee equal to unamortized leasing costs. |
| (5) | Flowserve US Inc. has the right to reduce its space by up to 21,000 square feet after the January 1, 2020 with nine months’ notice and the payment of a termination fee equal to unamortized leasing costs. |
| (6) | Telerx Marketing Inc. is not currently occupying its 944 Marcon location (20,820 square feet) although it continues to pay rent. |
| (7) | Telerx Marketing Inc. has the right to terminate its lease at any time after August 31, 2016 with nine months’ prior written notice and payment of an amount equal to unamortized leasing costs. |
The following table presents certain information relating to the lease rollover schedule at the PennCap Portfolio Properties:
Lease Expiration Schedule(1)(2)
Year Ending December 31, | No. of Leases Expiring | Expiring NRSF | % of Total NRSF | Cumulative Expiring NRSF | Cumulative % of Total NRSF | Annual U/W Base Rent | Annual U/W Base Rent PSF(3) | ||||||||
| MTM | 0 | 0 | 0.0% | 0 | 0.0% | $0 | $0.00 | ||||||||
| 2014 | 21 | 196,441 | 13.7% | 196,441 | 13.7% | $1,634,971 | $8.32 | ||||||||
| 2015 | 24 | 137,826 | 9.6% | 334,267 | 23.3% | $1,288,058 | $9.35 | ||||||||
| 2016 | 17 | 194,776 | 13.6% | 529,043 | 36.9% | $2,023,276 | $10.39 | ||||||||
| 2017 | 21 | 155,195 | 10.8% | 684,238 | 47.8% | $1,759,042 | $11.33 | ||||||||
| 2018 | 24 | 149,557 | 10.4% | 833,795 | 58.2% | $1,553,914 | $10.39 | ||||||||
| 2019 | 12 | 117,405 | 8.2% | 951,200 | 66.4% | $1,291,000 | $11.00 | ||||||||
| 2020 | 2 | 49,970 | 3.5% | 1,001,170 | 69.9% | $383,703 | $7.68 | ||||||||
| 2021 | 2 | 10,095 | 0.7% | 1,011,265 | 70.6% | $137,705 | $13.64 | ||||||||
| 2022 | 4 | 135,227 | 9.4% | 1,146,492 | 80.0% | $2,079,251 | $15.38 | ||||||||
| 2023 | 14 | 134,660 | 9.4% | 1,281,152 | 89.4% | $2,137,343 | $15.87 | ||||||||
| 2024 | 0 | 0 | 0.0% | 1,281,152 | 89.4% | $0 | $0.00 | ||||||||
| Thereafter | 0 | 0 | 0.0% | 1,281,152 | 89.4% | $0 | $0.00 | ||||||||
| Vacant | 0 | 151,509 | 10.6% | 1,432,661 | 100.0% | $0 | $0.00 | ||||||||
| Total/Weighted Average | 141 | 1,432,661 | 100.0% | $14,288,263 | $11.15 |
| (1) | Information obtained from the underwritten rent roll. |
| (2) | Certain tenants may have lease termination options that are exercisable prior to the stated expiration date of the subject lease and that are not considered in the Lease Expiration Schedule. |
| (3) | Weighted Average Annual U/W Base Rent PSF excludes vacant space. |
The following table presents historical occupancy percentages at the PennCap Portfolio Properties:
Historical Occupancy
12/31/2010(1) | 12/31/2011(2) | 12/31/2012(2) | 11/1/2013 | |||
| NAV | 88.2% | 87.2% | 89.9% | |||
(1) Not available from the seller. | ||||||
| (2) Information obtained from the borrower. | ||||||
THE INFORMATION IN THIS STRUCTURAL AND COLLATERAL TERM SHEET IS NOT COMPLETE AND MAY BE AMENDED PRIOR TO THE TIME OF SALE. THIS TERM SHEET IS NOT AN OFFER TO SELL THESE SECURITIES AND IT IS NOT A SOLICITATION OF AN OFFER TO BUY THESE SECURITIES IN ANY JURISDICTION WHERE THE OFFER OR SALE IS NOT PERMITTED.
44
| PENNCAP PORTFOLIO |
Underwritten Net Cash Flow. The following table presents certain information relating to the historical operating performance and the Underwritten Net Cash Flow at the PennCap Portfolio Properties:
Cash Flow Analysis
2011(1) | 2012 | TTM 9/30/2013 | U/W(2) | U/W $ per SF | |||||||
| Base Rent | $12,419,483 | $12,760,626 | $13,373,046 | $14,288,264 | $9.97 | ||||||
| Grossed Up Vacant Space | 0 | 0 | 0 | 1,563,135 | 1.09 | ||||||
| Total Reimbursables | 6,201,134 | 5,900,727 | 6,972,321 | 8,456,905 | 5.90 | ||||||
| Other Income | 89,237 | (6,384) | 53,037 | 42,528 | 0.03 | ||||||
| Less Vacancy & Credit Loss | 0 | 0 | 0 | (2,430,830)(3) | (1.70) | ||||||
| Effective Gross Income | $18,709,853 | $18,654,969 | $20,398,404 | $21,920,002 | $15.30 | ||||||
| Total Operating Expenses | $7,158,785 | $7,322,070 | $8,086,942 | $8,654,705 | $6.04 | ||||||
| Net Operating Income | $11,551,068 | $11,332,899 | $12,311,462 | $13,265,296 | $9.26 | ||||||
| TI/LC | 0 | 0 | 0 | 834,829 | 0.58 | ||||||
| Capital Expenditures | 0 | 0 | 0 | 429,798 | 0.30 | ||||||
| Net Cash Flow | $11,551,068 | $11,332,899 | $12,311,462 | $12,000,670 | $8.38 | ||||||
NOI DSCR(4) | 1.34x | 1.31x | 1.43x | 1.54x | |||||||
NCF DSCR(4) | 1.34x | 1.31x | 1.43x | 1.39x | |||||||
NOI DY(4) | 9.3% | 9.2% | 10.0% | 10.7% | |||||||
NCF DY(4) | 9.3% | 9.2% | 10.0% | 9.7% |
| (1) | The PennCap Portfolio Properties were acquired by the prior owners in May 2011 except for the 1480 Valley Center Parkway property, which was acquired in August 2012. The 2011 historicals are based upon the May 2011 to December 2011 annualized NOI for the partial year under the prior ownership. |
| (2) | Primary factors for increases from trailing 12 months ending September 30, 2013 Effective Gross Income to underwritten Effective Gross Income include $300,000 for leaseup of the 1480 Valley Center property, $150,000 for leaseup of the 1660 Valley Center property, $400,000 for leaseup of the 1650 Valley Center property, and $200,000 for leaseup of the 3701 Corporate property. The underwritten Base Rent also includes $392,099 in contractual rent steps through April 2014. |
| (3) | The underwritten economic vacancy is 9.8%. The PennCap Office Portfolio Properties were 89.9% physically occupied as of November 1, 2013. |
| (4) | DSCRs and debt yields are based on the PennCap Portfolio Loan Combination. |
Appraisal. As of the appraisal valuation date ranging from November 15, 2013 to November 18, 2013, the PennCap Portfolio Properties had an “as-is” appraised value of $165,000,000 on a portfolio basis. As noted, each property was valued on an individual property basis. The sum of the individual property valuations had an “as-is” appraised value of $155,775,000.
Environmental Matters. According to the Phase I environmental site assessments dated from December 2, 2013 to December 5, 2013, there was no evidence of any recognized environmental conditions at the PennCap Portfolio Properties.
Market Overview and Competition. According to the appraisal, the PennCap Portfolio Properties are located within the Lehigh Valley area of Pennsylvania within the Allentown/Bethlehem/Easton metropolitan area. Lehigh Valley includes the cities of Allentown, Bethlehem and Easton, which serve as the commercial cores of this region. The Lehigh Valley also includes Carbon, Lehigh and Northampton counties in east-central Pennsylvania.
According to the appraisal, the 2013 population within a 1-, 3-, and 5-mile radii of the PennCap Portfolio Properties are 3,908, 48,074 and 144,872, respectively. Within the same radii the median household income is $95,392, $64,410, $52,112, respectively. There are approximately 56,412 households within a 5-mile radius of the properties and the expected growth from 2013 to 2018 is 0.14%. The following presents certain information relating to the business parks within which the PennCap Portfolio Properties are located:
The Lehigh Valley Industrial Market is comprised of two areas that are commonly referred to as the Airport/Route 33 area and the Route 100 area. The Airport/Route 33 area surrounds Lehigh Valley International Airport and consists primarily of Lehigh Valley Industrial Parks I through VII. These parks encompass over 3,000 acres and are occupied by over 300 firms. The Route 100 area is located near the interchange of Route 100 with Interstate 78, several miles west of Allentown. Route 100 also offers a diverse mix of uses, with much of the recent development in this area being major warehouse/distribution facilities.
According to a third party market research report, there was approximately 19.8 million square feet of industrial space in buildings having less than 100,000 square feet throughout Lehigh Valley as of the end of the third quarter of 2013. The vacancy rate for the period was reported at 8.7% and 401,486 square feet was absorbed year to date. The average asking rent was $5.59 per square foot. Within the Lehigh Valley flex market, as of the third quarter of 2013, the current rental rate was $8.86 per square foot triple-net with a vacancy rate of 9.9%.
According to a third party market research report, as of the third quarter 2013, there was approximately 8.6 million square feet of office space throughout Lehigh Valley. The vacancy rate for the period was reported at 16.9% and 43,642 square feet was absorbed year to date. The average asking rent for the region was $18.68 per square foot (full service gross).
As of the third quarter 2013, the Lehigh Valley East submarket reported approximately 2.5 million square feet (which constitutes approximately 30.0% of the Lehigh Valley Market inventory) with an overall vacancy rate of 17.5% and a class B vacancy rate of 22.8%. The submarket rental rate was in-line with the overall market rate of $18.69 per square foot (full service gross).
THE INFORMATION IN THIS STRUCTURAL AND COLLATERAL TERM SHEET IS NOT COMPLETE AND MAY BE AMENDED PRIOR TO THE TIME OF SALE. THIS TERM SHEET IS NOT AN OFFER TO SELL THESE SECURITIES AND IT IS NOT A SOLICITATION OF AN OFFER TO BUY THESE SECURITIES IN ANY JURISDICTION WHERE THE OFFER OR SALE IS NOT PERMITTED.
45
| PENNCAP PORTFOLIO |
The following table presents certain information relating to comparable office properties for the PennCap Portfolio Properties:
Competitive Set – Office Properties(1)
| PennCap Portfolio (Subject) | 3101 Emrick Boulevard | 894 Marcon Boulevard | 7462 Penn Drive | 7248 Tilghman Street | 7535 Windsor Drive | 968 Postal Road | ||||||||
| Location | Lehigh Valley, PA | Bethlehem, PA | Allentown, PA | Allentown, PA | Allentown, PA | Allentown, PA | Allentown, PA | |||||||
| Property Type | Office | Office | Flex | Flex | Office | Office | Office | |||||||
| Year Built/Renovated | 1989-2006/NAP | 2005/NAV | 1987/NAV | 1988/NAV | 1987/NAV | 1985/NAV | 1987/NAV | |||||||
| Number of Stories | 1 – 3 | 3 | 1 | 1 | 1 | 4 | 3 | |||||||
| Total GLA | 805,711 SF | 100,800 SF | 28,800 SF | 13,050 SF | 43,782 SF | 136,419 SF | 22,000 SF | |||||||
| Total Occupancy | 92% | 97% | 100% | 100% | 100% | 98% | 100% |
| (1) | Information obtained from the appraisals and third party sources. |
The following table presents certain information relating to comparable industrial properties for the PennCap Portfolio Properties:
Competitive Set – Industrial Properties(1)
| PennCap Portfolio (Subject) | 7584 Morris Court | 7035 Schantz Road | 6575 Snowdrift Road | 881 Marcon Boulevard | 1685 Valley Center Parkway | 2202 North Irving Street | |||||||
| Location | Lehigh Valley, PA | Fogelsville, PA | Allentown, PA | Allentown, PA | Allentown, PA | Bethlehem, PA | Allentown, PA | ||||||
| Property Type | Industrial | Flex/Indu | Flex/Indu | Office | Office | Office | Office | ||||||
| Year Built/Renovated | 1980-1997/NAP | 1990/NAV | 2005/NAV | 1989/NAV | 1989/NAV | 1996/NAV | 1987/NAV | ||||||
| Number of Stories | 1 – 3 | 1 | 1 | 1 | 1 | 1 | 1 | ||||||
| Total GLA | 626,950 SF | 53,907 SF | 41,287 SF | 47,091 SF | 32,644 SF | 27,200 SF | 27,750 SF | ||||||
| Total Occupancy | 87% | 100% | 100% | 100% | 75% | 100% | 100% |
| (1) | Information obtained from the appraisals and third party sources. |
The Borrowers. The borrowers consist of 27 single purpose entities and the general partner of each entity has two independent directors. Legal counsel to the borrowers delivered a non-consolidation opinion in connection with the origination of the PennCap Portfolio Loan Combination. Lisa Pektor, Louis P. Pektor, and Aslar Associates, LLC are the indirect owners of the borrower and guarantors of certain nonrecourse carveouts under the PennCap Portfolio Loan Combination.
The Sponsor. The sponsor is PennCap Acquisitions, LP (“PennCap Properties”). Louis P. Pektor and Lisa Pektor are the principals of PennCap Properties. PennCap Properties was originally a venture between Louis and Lisa Pektor and The Blackstone Group and was formed in May 2011 to own and operate the PennCap Portfolio Properties. At closing, Louis and Lisa Pektor acquired all of The Blackstone Group’s interests in the PennCap Portfolio Properties. The Pektor family has been in the business of development and management for approximately 25 years, investing exclusively in the Lehigh Valley area of Pennsylvania. The acquisition of the PennCap Portfolio Properties has resulted in litigation. See “Description of the Mortgage Pool- Default History, Bankruptcy Issues, and Other Proceedings” and “Description of the Mortgage Pool—Litigation Considerations” in the Free Writing Prospectus.
Escrows. The loan documents provide for an upfront escrow at closing in the amount of $993,880 for taxes, $173,038 for insurance premiums, $142,223 for deferred maintenance and $1,321,879 for existing tenant improvement obligations. Additionally, on January 13, 2014, $590,000 was escrowed for tenant improvements and leasing commissions and an additional $276,978 for existing tenant improvement obligations.
The loan documents provide for ongoing monthly escrow deposits of $230,698 for taxes, $18,606 for insurance premiums, $29,847 for replacement reserves and $62,500 for tenant improvements and leasing commissions (subject to a cap of $3,000,000). For the first 24 months of the loan term, ongoing monthly escrow deposits of $112,500 will be taken for tenant improvements and leasing commissions.
Lockbox and Cash Management. The PennCap Portfolio Loan Combination requires a lender-controlled lockbox account, which is already in place, with the borrowers directing tenants to pay their rents directly to such lockbox account. The loan documents also require that all cash revenues and all other monies received by the borrowers or the property manager relating to the PennCap Portfolio Properties be deposited into the lockbox account within one business day of receipt. Funds are then swept into a cash management account controlled by the servicer and applied in accordance with the cash management agreement to mortgage loan reserves, mortgage loan debt service, property operating expenses and other sums due under the mortgage loan documents. Prior to the occurrence of a Cash Trap Event Period (as defined below), all excess funds on deposit in the cash management account are disbursed to the borrowers’ operating account after payment of debt service on the mezzanine loan on a monthly basis.
Upon the occurrence of a Cash Trap Event Period all excess funds on deposit in the cash management account will be deposited into one or more reserves. Upon the occurrence of an Event of Default, the lender has the right to apply any sums swept into or on deposit in the cash management account in the manner and order it determines.
THE INFORMATION IN THIS STRUCTURAL AND COLLATERAL TERM SHEET IS NOT COMPLETE AND MAY BE AMENDED PRIOR TO THE TIME OF SALE. THIS TERM SHEET IS NOT AN OFFER TO SELL THESE SECURITIES AND IT IS NOT A SOLICITATION OF AN OFFER TO BUY THESE SECURITIES IN ANY JURISDICTION WHERE THE OFFER OR SALE IS NOT PERMITTED.
46
| PENNCAP PORTFOLIO |
A “Cash Trap Event Period” will commence upon the earliest of the following events: (i) the amortizing first mortgage net cash flow debt service coverage ratio falls below 1.25x, or (ii) if any tenant occupying 20% or more of the square footage of the PennCap Portfolio Properties goes dark, becomes insolvent, or files for bankruptcy; or (iii) in the case of a Philips Litigation Event (as defined below), if the borrowers do not deposit the amount owed within five business days of such event. A Cash Trap Event Period will expire in the case of a Philips Litigation Event, upon the amount owed by the borrowers in connection therewith being swept.
A “Philips Litigation Event” refers to a court finding in favor of Philips International, with respect to certain ongoing litigation against the borrowers. The maximum exposure to the borrowers is believed to be $572,648. See “Description of the Mortgage Pool-Litigation Considerations” in the Free Writing Prospectus”.
Property Management. The PennCap Portfolio Properties are managed by G&E Real Estate Management Services, Inc., with ALT Realty, LLC providing leasing, marketing and construction management services.
Assumption. The borrowers have the right to transfer the PennCap Portfolio Properties in connection with an assumption of the PennCap Portfolio Loan Combination provided that no event of default has occurred and is continuing and certain other conditions are satisfied, including (i) lender approval of the transferee, (ii) execution of a recourse guaranty and an environmental indemnity from a creditworthy guarantor acceptable to the lender and (iii) if requested by the lender, delivery of a rating agency confirmation from each of DBRS, Fitch, and Moody’s that the transfer will not result in a downgrade, withdrawal or qualification of the respective ratings assigned to the Series 2014-LC14 Certificates and similar confirmations with respect to the ratings of any securities backed by the PennCap Portfolio Companion Loan.
Partial Release. With limited exception, the PennCap Portfolio Loan Combination does not permit partial releases of real estate collateral during the term of the PennCap Portfolio Loan Combination. However, with respect to the 1530 Valley Center property, $3,288,000 (120% of the allocated loan amount for that property) of the PennCap Portfolio Loan Combination may be prepaid (allocable between the Note A-1 and Note A-2 on a pro rata basis), and the 1530 Valley Center property may be released, solely in connection with the tenant at the 1530 Valley Center property electing to exercise its purchase option for such site, which it may do between December 1, 2015 and March 31, 2016 provided tenant has provided notice on or before June 1, 2015. Conditions to the prepayment and release include confirmation of continued compliance with the laws of any adjacent PennCap Portfolio Properties and payment of a prepayment fee of $164,400 (allocable between Note A-1 and Note A-2 on a pro rata basis). No yield maintenance or defeasance is required above and beyond such prepayment fee.
Subordinate and Mezzanine Indebtedness. Ladder Capital Finance LLC has made a $14,900,000 mezzanine loan (the “PennCap Portfolio Mezzanine Loan”) to PennCap Properties Portfolio, LP, a Delaware limited partnership (the “PennCap Portfolio Mezzanine Borrower”), which is secured by a pledge by the PennCap Portfolio Mezzanine Borrower of its limited partnership interests in the PennCap Portfolio Loan Combination borrowers and limited liability company interests in general partners of the PennCap Portfolio Loan Combination borrowers. The PennCap Portfolio Mezzanine Loan requires monthly interest-only payments for the first 24 months and thereafter monthly payments of interest based on an interest rate of 12.00% per annum and principal based on a 30-year amortization schedule. The PennCap Properties Mezzanine Loan matures on January 6, 2024. The rights of the PennCap Portfolio Mezzanine Loan lender are further described under “Description of the Mortgage Pool – Subordinate and/or Other Financing – Existing (Secured and Mezzanine and Similar Financing)” in the Free Writing Prospectus.
Ground Lease. None.
Terrorism Insurance. The loan documents require that the “all risk” insurance policy required to be maintained by the borrowers provide coverage for terrorism in an amount equal to the full replacement cost of the PennCap Portfolio Properties. The loan documents also require business interruption insurance covering no less than the 12-month period following the occurrence of a casualty event, together with a six-month extended period of indemnity.
THE INFORMATION IN THIS STRUCTURAL AND COLLATERAL TERM SHEET IS NOT COMPLETE AND MAY BE AMENDED PRIOR TO THE TIME OF SALE. THIS TERM SHEET IS NOT AN OFFER TO SELL THESE SECURITIES AND IT IS NOT A SOLICITATION OF AN OFFER TO BUY THESE SECURITIES IN ANY JURISDICTION WHERE THE OFFER OR SALE IS NOT PERMITTED.
47
| THE OUTLET COLLECTION | JERSEY GARDENS |

THE INFORMATION IN THIS STRUCTURAL AND COLLATERAL TERM SHEET IS NOT COMPLETE AND MAY BE AMENDED PRIOR TO THE TIME OF SALE. THIS TERM SHEET IS NOT AN OFFER TO SELL THESE SECURITIES AND IT IS NOT A SOLICITATION OF AN OFFER TO BUY THESE SECURITIES IN ANY JURISDICTION WHERE THE OFFER OR SALE IS NOT PERMITTED.
48
| THE OUTLET COLLECTION | JERSEY GARDENS |
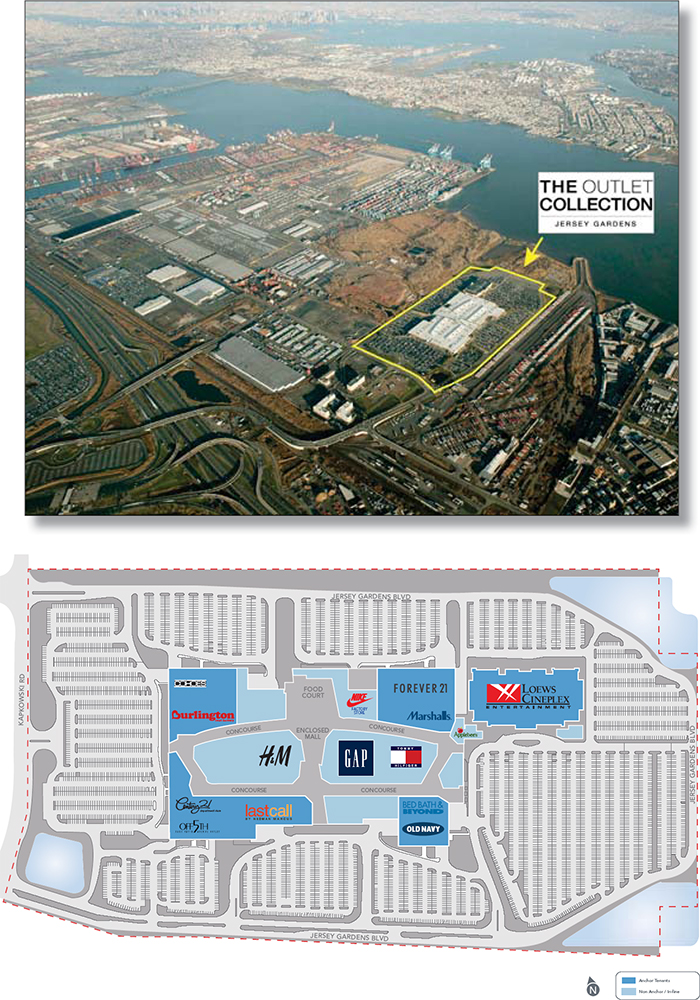
THE INFORMATION IN THIS STRUCTURAL AND COLLATERAL TERM SHEET IS NOT COMPLETE AND MAY BE AMENDED PRIOR TO THE TIME OF SALE. THIS TERM SHEET IS NOT AN OFFER TO SELL THESE SECURITIES AND IT IS NOT A SOLICITATION OF AN OFFER TO BUY THESE SECURITIES IN ANY JURISDICTION WHERE THE OFFER OR SALE IS NOT PERMITTED.
49
| THE OUTLET COLLECTION | JERSEY GARDENS |

THE INFORMATION IN THIS STRUCTURAL AND COLLATERAL TERM SHEET IS NOT COMPLETE AND MAY BE AMENDED PRIOR TO THE TIME OF SALE. THIS TERM SHEET IS NOT AN OFFER TO SELL THESE SECURITIES AND IT IS NOT A SOLICITATION OF AN OFFER TO BUY THESE SECURITIES IN ANY JURISDICTION WHERE THE OFFER OR SALE IS NOT PERMITTED.
50
| THE OUTLET COLLECTION | JERSEY GARDENS |
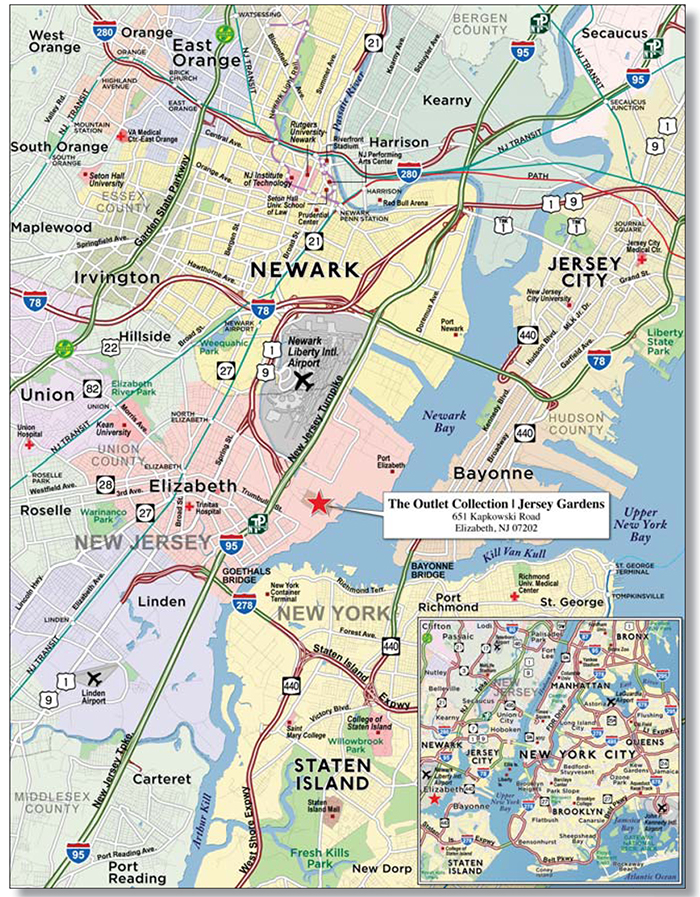
THE INFORMATION IN THIS STRUCTURAL AND COLLATERAL TERM SHEET IS NOT COMPLETE AND MAY BE AMENDED PRIOR TO THE TIME OF SALE. THIS TERM SHEET IS NOT AN OFFER TO SELL THESE SECURITIES AND IT IS NOT A SOLICITATION OF AN OFFER TO BUY THESE SECURITIES IN ANY JURISDICTION WHERE THE OFFER OR SALE IS NOT PERMITTED.
51
| No. 3 – The Outlet Collection | Jersey Gardens | ||||||||
| Loan Information | Property Information | |||||||
| Mortgage Loan Seller: | Wells Fargo Bank, National Association | Single Asset/Portfolio: | Single Asset | |||||
| Credit Assessment (DBRS/Fitch/Moody’s): | BBB(low)/BBB-/Baa3 | Property Type: | Retail | |||||
Original Principal Balance(1): | $80,000,000 | Specific Property Type: | Regional Mall | |||||
Cut-off Date Principal Balance(1): | $80,000,000 | Location: | Elizabeth, NJ | |||||
| % of Initial Pool Balance: | 6.4% | Size: | 1,298,801 SF | |||||
| Loan Purpose: | Refinance | Cut-off Date Principal Balance Per SF(1): | $269.48 | |||||
Borrower Names(2): | N.J. Metromall Urban Renewal, Inc.; JG Elizabeth II, LLC | Year Built/Renovated: | 1999/2013 | |||||
| Sponsor: | Glimcher Properties, LP | Title Vesting(2): | Fee | |||||
| Mortgage Rate: | 3.830% | Property Manager: | Self-managed | |||||
| Note Date: | October 31, 2013 | 3rd Most Recent Occupancy (As of): | 100.0% (12/31/2010) | |||||
| Anticipated Repayment Date: | NAP | 2nd Most Recent Occupancy (As of): | 99.5% (12/31/2011) | |||||
| Maturity Date: | November 1, 2020 | Most Recent Occupancy (As of): | 100.0% (12/31/2012) | |||||
| IO Period: | 84 months | Current Occupancy (As of)(4): | 99.4% (9/25/2013) | |||||
| Loan Term (Original): | 84 months | |||||||
| Seasoning: | 3 months | Underwriting and Financial Information: | ||||||
| Amortization Term (Original): | NAP | |||||||
| Loan Amortization Type: | Interest-only, Balloon | 3rd Most Recent NOI (As of): | $34,987,662 (12/31/2011) | |||||
| Interest Accrual Method: | Actual/360 | 2nd Most Recent NOI (As of): | $36,646,383 (12/31/2012) | |||||
| Call Protection: | L(27),D(53),O(4) | Most Recent NOI (As of): | $40,192,421 (TTM 9/30/2013) | |||||
| Lockbox Type: | Hard/Springing Cash Management | |||||||
Additional Debt(1): | Yes | |||||||
Additional Debt Type(1): | Pari Passu | |||||||
| U/W Revenues: | $66,662,980 | |||||||
| U/W Expenses: | $26,424,909 | |||||||
Escrows and Reserves(3): | U/W NOI(5): | $40,238,071 | ||||||
| U/W NCF: | $38,650,516 | |||||||
Type: | Initial | Monthly | Cap (If Any) | U/W NOI DSCR(1): | 2.96x | |||
| Taxes | $0 | Springing | NAP | U/W NCF DSCR(1): | 2.84x | |||
| Insurance | $0 | Springing | NAP | U/W NOI Debt Yield(1): | 11.5% | |||
| Replacement Reserves | $0 | Springing | NAP | U/W NCF Debt Yield(1): | 11.0% | |||
| TI/LC Reserve | $0 | Springing | NAP | As-Is Appraised Value: | $707,000,000 | |||
| Ground Lease Reserve | $0 | Springing | NAP | As-Is Appraisal Valuation Date: | October 4, 2013 | |||
| Tenants Specific TI/LC Reserve | $2,593,953 | $0 | NAP | Cut-off Date LTV Ratio(1): | 49.5% | |||
| Rent Concession Reserve | $61,775 | $0 | NAP | LTV Ratio at Maturity or ARD(1): | 49.5% | |||
| (1) | The Outlet Collection | Jersey Gardens Loan Combination, totalling $350,000,000, is comprised of three pari passu notes (Notes A-1, A-2 and A-3). Note A-3 had an original principal balance of $80,000,000, has an outstanding principal balance as of the Cut-off Date of $80,000,000 and will be contributed to the WFRBS 2014-LC14 Trust. Note A-1 had an original principal balance of $140,000,000 and was contributed to the WFRBS 2013-C18 Trust. Note A-2 had an original principal balance of $130,000,000 and was contributed to the WFRBS 2013-UBS1 Trust. All statistical information related to balances per square foot, loan-to-value ratios, debt service coverage ratios and debt yields are based on The Outlet Collection | Jersey Gardens Loan Combination. |
| (2) | See “Ground Lease and Payment in Lieu of Taxes (“PILOT”)” section. |
| (3) | See “Escrows” section.” |
| (4) | Current Occupancy includes 39,940 square feet attributed to temporary tenants. Excluding temporary tenants, Current Occupancy is 96.4%. |
| (5) | See “Cash Flow Analysis” section. |
The Mortgage Loan. The mortgage loan (“The Outlet Collection | Jersey Gardens Loan Combination”) is evidenced by three pari passu promissory notes (“Note A-1”, “Note A-2” and “Note A-3”) secured by a first mortgage encumbering a regional outlet mall located in Elizabeth, New Jersey (“The Outlet Collection | Jersey Gardens Property”). The Outlet Collection | Jersey Gardens Loan Combination was originated on October 31, 2013 by Wells Fargo Bank, National Association. The Outlet Collection | Jersey Gardens Loan Combination had an original principal balance of $350,000,000, has an outstanding principal balance as of the Cut-off Date of $350,000,000 and accrues interest at an interest rate of 3.830% per annum. The Outlet Collection | Jersey Gardens Loan Combination had an initial term of 84 months, has a remaining term of 81 months as of the Cut-off Date and requires interest-only payments through the term of The Outlet Collection | Jersey Gardens Loan Combination. The Outlet Collection | Jersey Gardens Loan Combination matures on November 1, 2020. See “Description of the Mortgage Pool – Split Loan Structures – The Outlet Collection | Jersey Gardens Loan Combination” and “Servicing of the Mortgage Loans and Administration of the Trust Fund - Additional Matters Relating to the Servicing of the AmericasMart Loan Combination and The Outlet Collection | Jersey Gardens Loan Combination” in the Free Writing Prospectus.
THE INFORMATION IN THIS STRUCTURAL AND COLLATERAL TERM SHEET IS NOT COMPLETE AND MAY BE AMENDED PRIOR TO THE TIME OF SALE. THIS TERM SHEET IS NOT AN OFFER TO SELL THESE SECURITIES AND IT IS NOT A SOLICITATION OF AN OFFER TO BUY THESE SECURITIES IN ANY JURISDICTION WHERE THE OFFER OR SALE IS NOT PERMITTED.
52
| THE OUTLET COLLECTION | JERSEY GARDENS |
Note A-3, which will be contributed to the WFRBS 2014-LC14 Trust, had an original principal balance of $80,000,000 and has an outstanding principal balance as of the Cut-off Date of $80,000,000 and represents a non-controlling interest in The Outlet Collection | Jersey Gardens Loan Combination. Note A-1, which had an original balance of $140,000,000 and represents the controlling interest in The Outlet Collection | Jersey Gardens Loan Combination, was contributed to the WFRBS 2013-C18 Trust and Note A-2, which had an original balance of $130,000,000 and represents a non-controlling interest in The Outlet Collection | Jersey Gardens Loan Combination, was contributed to the WFRBS 2013-UBS1 Trust (Note A-1 and A-2 collectively, “The Outlet Collection | Jersey Gardens Companion Loans”).
Following the lockout period, the borrower has the right to defease The Outlet Collection | Jersey Gardens Loan Combination in whole, but not in part, on any date before August 1, 2020. In addition, The Outlet Collection | Jersey Gardens Loan Combination is prepayable without penalty on or after August 1, 2020.
Sources and Uses
| Sources | Uses | ||||||||
| Original loan combination amount | $350,000,000 | 100.0% | Loan payoff(1) | $139,231,383 | 39.8 | % | |||
| Reserves | 2,655,728 | 0.8 | |||||||
| Closing costs | 3,402,450 | 1.0 | |||||||
| Return of equity | 204,710,439 | 58.5 | |||||||
| Total Sources | $350,000,000 | 100.0% | Total Uses | $350,000,000 | 100.0 | % | |||
| (1) | The Outlet Collection | Jersey Gardens Property was previously securitized in BSCMS 2004-T16 and GMACC 2004-C2. |
The Property. The Outlet Collection | Jersey Gardens Property is a two-story regional outlet mall located in Elizabeth, New Jersey that contains approximately 1.3 million square feet, all of which serve as collateral for The Outlet Collection | Jersey Gardens Loan Combination. The Outlet Collection | Jersey Gardens Property is anchored by Loews Theaters, Forever 21, Burlington Coat Factory, Marshalls, Bed Bath & Beyond, Century 21, Cohoes Fashions and Saks Off 5th. The Outlet Collection | Jersey Gardens Property is situated on 98.4 acres and was developed in 1999 by Glimcher Realty Trust (“Glimcher”) for a total cost of $216.3 million and recently renovated in 2013. The sponsor invested approximately $30.0 million in the 2013 renovation, which consisted of remodeling corridors, entrances, restrooms and the food court along with the introduction of brands such as Coach and Tommy Hilfiger. The Outlet Collection | Jersey Gardens Property is the largest outlet mall in New Jersey and the second most visited tourist destination in the state, attracting approximately 18 million shoppers annually from more than 160 countries.
Parking is provided by 5,330 surface parking spaces, resulting in a parking ratio of 4.1 spaces per 1,000 square feet of net rentable area. The Outlet Collection | Jersey Gardens Property boasts a unique mix of over 200 retail and manufacturer outlets, discount and off-price stores, full-price retailers, restaurants and entertainment tenants. Major retailers include Neiman Marcus Last Call, Nike Factory Store, VF Outlet, Old Navy, The Gap Outlet and H&M and for the trailing 12-month period ending June 30, 2013, tenants occupying less than 10,000 square feet had in-line sales of $715 per square foot with an average occupancy cost of 8.8%. For the same time period, gross sales totaled approximately $585.0 million, representing an increase of over 36.2% from 2010. As of September 25, 2013, The Outlet Collection | Jersey Gardens Property was 99.4% leased to 214 tenants (excluding temporary tenants, occupancy was 96.4%).
THE INFORMATION IN THIS STRUCTURAL AND COLLATERAL TERM SHEET IS NOT COMPLETE AND MAY BE AMENDED PRIOR TO THE TIME OF SALE. THIS TERM SHEET IS NOT AN OFFER TO SELL THESE SECURITIES AND IT IS NOT A SOLICITATION OF AN OFFER TO BUY THESE SECURITIES IN ANY JURISDICTION WHERE THE OFFER OR SALE IS NOT PERMITTED.
53
| THE OUTLET COLLECTION | JERSEY GARDENS |
The following table presents certain information relating to the tenancy at The Outlet Collection | Jersey Gardens Property:
Major Tenants
| Tenant Name | Credit Rating (Fitch/ Moody’s/ S&P)(1) | Tenant NRSF | % of NRSF | Annual U/W Base Rent PSF | Annual U/W Base Rent(2) | % of Total Annual U/W Base Rent(2) | Sales PSF(3) | Occupancy Cost(3) | Lease Expiration Date | |
| Anchor Tenants | ||||||||||
| Loews Theatres | NR/NR/NR | 110,000 | 8.5% | $12.55 | $1,380,119 | 4.4% | $357,401(4) | 24.2% | 12/31/2020 | |
| Forever 21 | NR/NR/NR | 58,879 | 4.5% | $16.98 | $1,000,000 | 3.2% | $275 | 6.2% | 1/31/2021 | |
| Burlington Coat Factory | NR/B3/NR | 80,259 | 6.2% | $12.12 | $972,739 | 3.1% | $249 | 4.9% | 1/31/2015 | |
| Marshalls | NR/A3/A | 49,245 | 3.8% | $15.91 | $783,354 | 2.5% | $397 | 4.6% | 1/31/2015 | |
| Bed Bath & Beyond | NR/NR/BBB+ | 41,225 | 3.2% | $17.47 | $720,000 | 2.3% | NAV | NAV | 1/31/2015 | |
| Century 21 | NR/NR/NR | 33,124 | 2.6% | $17.17 | $568,836 | 1.8% | NAV | NAV | 1/31/2015 | |
| Cohoes Fashions | NR/B3/NR | 58,819 | 4.5% | $7.14 | $420,000 | 1.3% | $167 | 4.3% | 1/1/2015 | |
| Saks Off 5th | NR/NR/NR | 30,463 | 2.3% | $12.00 | $365,551 | 1.2% | NAV | NAV | 11/22/2022 | |
| Total Anchor Tenants | 462,014 | 35.6% | $13.44 | $6,210,599 | 19.9% | |||||
| Junior Anchor Tenants | ||||||||||
| Tommy Hilfiger | NR/NR/NR | 22,878 | 1.8% | $50.00 | $1,143,904 | 3.7% | $920 | 5.4% | 1/31/2023 | |
Nike Factory Store(5) | NR/A1/AA- | 25,007 | 1.9% | $29.46 | $736,814 | 2.4% | $816 | 3.8% | 12/31/2024 | |
| H&M | NR/NR/NR | 20,000 | 1.5% | $29.76 | $595,200 | 1.9% | $525 | 5.7% | 1/31/2021 | |
| Neiman Marcus Last Call | NR/Caa2/B | 27,696 | 2.1% | $17.23 | $477,135 | 1.5% | $388 | 5.0% | 11/30/2014 | |
| VF Outlet (Macy’s) | BBB/Baa3/BBB | 22,438 | 1.7% | $20.00 | $448,760 | 1.4% | $116 | 17.2% | 8/31/2015 | |
| Old Navy | BBB-/Baa3/BBB- | 21,536 | 1.7% | $20.00 | $430,720 | 1.4% | $531 | 3.8% | 5/31/2015 | |
| Group USA | NR/NR/NR | 23,563 | 1.8% | $16.00 | $377,008 | 1.2% | $183 | 9.1% | 12/31/2018 | |
| The Gap Outlet | BBB-/Baa3/BBB- | 20,515 | 1.6% | $17.01 | $349,010 | 1.1% | $884 | 1.9% | 1/31/2015 | |
| Modell’s Sporting Goods | NR/NR/NR | 21,409 | 1.6% | $13.00 | $278,317 | 0.9% | $235 | 5.5% | 1/31/2017 | |
| Total Junior Anchor Tenants | 205,042 | 15.8% | $23.59 | $4,836,868 | 15.5% | |||||
Non-Anchor Tenants(6) | 624,545 | 48.1% | $39.02 | $20,195,567 | 64.6% | |||||
Occupied Collateral Total(6) | 1,291,601 | 99.4% | $26.37 | $31,243,034 | 100.0% | |||||
| Vacant Space | 7,200 | 0.6% | ||||||||
| Collateral Total | 1,298,801 | 100.0% | ||||||||
| (1) | Certain ratings are those of the parent company whether or not the parent guarantees the lease. |
| (2) | Underwritten base rent includes contractual rent escalations through October 2014 and income from five tenants, representing approximately 30,764 square feet (2.4% of net rentable area) that either do not have executed leases (leases were out for tenants signature) or were not in occupancy and paying rent on their new space. Since initial securitization of the A-2 note in the WFRBS 2013-UBS1 Trust, as of the Cut-off Date, three of the eight tenants representing 9,991 square feet (0.7% of net rentable area) are open for business and paying full rent. |
| (3) | Sales PSF and Occupancy Costs represent the trailing 12-month period ending June 30, 2013. Sales PSF and Occupancy Costs do not include utility reimbursement figures, and are not available for tenants who have not reported a full year of sales data. |
| (4) | Sales reflect average sales per screen based on 22 screens. |
| (5) | Nike Factory Store modified their lease in August 2013 to expand by 5,007 square feet and extend the lease term five years. All figures are reflective of the new lease terms. |
| (6) | Includes 39,940 square feet attributed to temporary tenants that were not included in the Annual U/W Base Rent, along with 66,982 square feet attributed to tenants paying a percentage of sales in lieu of base rent, for a total of 106,922 square feet. The Annual U/W Base Rent PSF for Non-Anchor Tenants and Occupied Collateral Total exclude the square footage attributed to these tenants. |
THE INFORMATION IN THIS STRUCTURAL AND COLLATERAL TERM SHEET IS NOT COMPLETE AND MAY BE AMENDED PRIOR TO THE TIME OF SALE. THIS TERM SHEET IS NOT AN OFFER TO SELL THESE SECURITIES AND IT IS NOT A SOLICITATION OF AN OFFER TO BUY THESE SECURITIES IN ANY JURISDICTION WHERE THE OFFER OR SALE IS NOT PERMITTED.
54
THE OUTLET COLLECTION | JERSEY GARDENS |
The following table presents certain information relating to the historical sales and occupancy costs at The Outlet Collection | Jersey Gardens Property:
Historical Sales (PSF) and Occupancy Costs(1)
| Tenant Name | 2010 | 2011 | 2012 | TTM 6/30/2013 |
| Loews Theatres | NAV | NAV | NAV | $357,401(2) |
| Forever 21 | NAV | $247 | $252 | $275 |
| Burlington Coat Factory | $191 | $198 | $236 | $249 |
| Marshalls | $293 | $314 | $351 | $397 |
| Bed Bath & Beyond | NAV | NAV | NAV | $193 |
| Century 21 | NAV | NAV | NAV | NAV |
| Cohoes Fashions | $150 | $160 | $170 | $167 |
Saks Off 5th | $354 | $374 | NAV | NAV |
Total Anchor(3) | $262 | $321 | $336 | $344 |
Total Anchor Occupancy Costs(3) | 5.3% | 5.4% | 5.4% | 5.9% |
Total Major(4) | $441 | $461 | $471 | $483 |
Total Major Occupancy Costs(4) | 7.8% | 6.1% | 5.7% | 5.6% |
Total In-line (<10,000 square feet)(5) | $625 | $685 | $692 | $715 |
Total In-line Occupancy Costs(5) | 8.8% | 8.0% | 7.6% | 8.8% |
| (1) | Historical Sales (PSF) and Occupancy Costs are based on historical statements provided by the borrower. Occupancy costs do not include utility reimbursements. |
| (2) | Sales reflect average sales per screen based on 22 screens. |
| (3) | Total Anchor Sales PSF and Occupancy Cost include all anchor tenants (except for Loews) listed in the Major Tenants table who reported 12 months of sales figures. |
| (4) | Total Major Tenants (> 10,000 square feet) Sales PSF and Occupancy Cost include in-line tenants greater than 10,000 square feet that have been open for the previous 12-month period, as provided by the borrower. |
| (5) | Total In-Line Tenants (< 10,000 square feet) Sales PSF and Occupancy Cost include in-line tenants less than 10,000 square feet that have been open for the previous 12-month period, as provided by the borrower. |
The following table presents certain information relating to the lease rollover schedule at The Outlet Collection | Jersey Gardens Property:
Lease Expiration Schedule(1)(2)
Year Ending December 31, | No. of Leases Expiring | Expiring NRSF | % of Total NRSF | Cumulative Expiring NRSF | Cumulative % of Total NRSF | Annual U/W Base Rent | % of Annual U/W Base Rent | Annual U/W Base Rent PSF(3) |
MTM(4) | 38 | 39,940 | 3.1% | 39,940 | 3.1% | $0 | 0.0% | $0.00 |
| 2013 | 6 | 9,140 | 0.7% | 49,080 | 3.8% | $304,640 | 1.0% | $33.46 |
| 2014 | 25 | 106,082 | 8.2% | 155,162 | 11.9% | $3,451,861 | 11.0% | $32.54 |
| 2015 | 27 | 389,315 | 30.0% | 544,477 | 41.9% | $6,437,350 | 20.6% | $16.93 |
| 2016 | 12 | 39,805 | 3.1% | 584,282 | 45.0% | $926,249 | 3.0% | $35.05 |
| 2017 | 17 | 98,417 | 7.6% | 682,699 | 52.6% | $2,091,014 | 6.7% | $26.50 |
| 2018 | 13 | 49,566 | 3.8% | 732,265 | 56.4% | $1,663,511 | 5.3% | $33.56 |
| 2019 | 14 | 57,071 | 4.4% | 789,336 | 60.8% | $1,525,821 | 4.9% | $30.55 |
| 2020 | 14 | 156,936 | 12.1% | 946,272 | 72.9% | $2,788,231 | 8.9% | $18.44 |
| 2021 | 10 | 138,067 | 10.6% | 1,084,339 | 83.5% | $5,212,731 | 16.7% | $37.76 |
| 2022 | 18 | 98,400 | 7.6% | 1,182,739 | 91.1% | $2,507,202 | 8.0% | $29.10 |
| 2023 | 12 | 66,055 | 5.1% | 1,248,794 | 96.1% | $2,690,674 | 8.6% | $40.73 |
| 2024 | 6 | 42,807 | 3.3% | 1,291,601 | 99.4% | $1,589,114 | 5.1% | $37.12 |
| Thereafter | 2 | 0 | 0.0% | 1,291,601 | 99.4% | $54,637 | 0.2% | $0.00 |
| Vacant | 0 | 7,200 | 0.6% | 1,298,801 | 100.0% | $0 | 0.0% | $0.00 |
| Total/Weighted Average | 214 | 1,298,801 | 100.0% | $31,243,034 | 100.0% | $26.37 |
| (1) | Information obtained from the underwritten rent roll. |
| (2) | Certain tenants may have lease termination options that are exercisable prior to the originally stated expiration date of the subject lease and that are not considered in the Lease Expiration Schedule. |
| (3) | The annual and Total/Weighted Average Annual U/W Base Rent PSF excludes vacant space, Annual U/W Base Rent attributed to tenants paying percentage rent in lieu of base rent and square footage attributed to temporary tenants. These rents were included in the underwritten percentage rent and other income. |
| (4) | Includes 38 temporary tenants. The rent for temporary tenants has been included in the underwritten other income. |
THE INFORMATION IN THIS STRUCTURAL AND COLLATERAL TERM SHEET IS NOT COMPLETE AND MAY BE AMENDED PRIOR TO THE TIME OF SALE. THIS TERM SHEET IS NOT AN OFFER TO SELL THESE SECURITIES AND IT IS NOT A SOLICITATION OF AN OFFER TO BUY THESE SECURITIES IN ANY JURISDICTION WHERE THE OFFER OR SALE IS NOT PERMITTED.
55
| THE OUTLET COLLECTION | JERSEY GARDENS |
The following table presents historical occupancy at The Outlet Collection | Jersey Gardens Property:
Historical Occupancy
12/31/2008(1) | 12/31/2009(1) | 12/31/2010(1) | 12/31/2011(1) | 12/31/2012(1) | 9/25/2013(2) | |||||
| 100.0% | 99.0% | 100.0% | 99.5% | 100.0% | 99.4% |
| (1) | Information obtained from the borrower. |
| (2) | Occupancy includes 39,940 square feet attributed to temporary tenants. As of September 25, 2013, the occupancy excluding temporary tenants was 96.4%. |
The following table presents historical base rent per square foot at The Outlet Collection | Jersey Gardens Property:
Historical Average Base Rent (PSF)(1)
12/31/2010 | 12/31/2011 | 12/31/2012 | 9/30/2013 | |||
| $20.09 | $21.04 | $21.94 | $23.34 |
| (1) | Information obtained from borrower operating statements. The average base rent is based on the gross potential rent divided by the total square footage and does not take into account vacancies, temporary tenants or tenants paying percentage rent in lieu of base rent. |
Operating History and Underwritten Net Cash Flow. The following table presents certain information relating to the historical operating performance and Underwritten Net Cash Flow at The Outlet Collection | Jersey Gardens Property:
Cash Flow Analysis
| 2011 | 2012 | TTM 9/30/2013 | U/W | U/W $ per SF | |||||||
Base Rent | $27,320,757 | $28,491,353 | $30,309,606 | $31,243,034 | $24.06 | ||||||
Grossed Up Vacant Space | 0 | 0 | 0 | 250,932 | 0.19 | ||||||
Percentage Rent | 4,080,168 | 4,685,424 | 5,802,622 | 6,033,369 | 4.65 | ||||||
Total Reimbursables | 20,527,216 | 20,702,521 | 21,192,737 | 23,887,463 | 18.39 | ||||||
Other Income | 6,078,270 | 5,765,033 | 6,007,541 | 6,193,001 | 4.77 | ||||||
Less Vacancy & Credit Loss | 0 | 0 | (516,500) | (944,819)(1) | (0.73) | ||||||
Effective Gross Income | $58,006,411 | $59,644,331 | $62,796,006 | $66,662,980(2) | $51.33 | ||||||
Total Operating Expenses | $23,018,749 | $22,997,948 | $22,603,585 | $26,424,909 | $20.35 | ||||||
| Net Operating Income | $34,987,662 | $36,646,383 | $40,192,421 | $40,238,071(2) | $30.98 | ||||||
TI/LC | 0 | 0 | 0 | 1,327,796 | 1.02 | ||||||
Capital Expenditures | 0 | 0 | 0 | 259,760 | 0.20 | ||||||
| Net Cash Flow | $34,987,662 | $36,646,383 | $40,192,421 | $38,650,516 | $29.76 | ||||||
NOI DSCR(3) | 2.57x | 2.70x | 2.96x | 2.96x | |||||||
NCF DSCR(3) | 2.57x | 2.70x | 2.96x | 2.84x | |||||||
NOI DY(3) | 10.0% | 10.5% | 11.5% | 11.5% | |||||||
NCF DY(3) | 10.0% | 10.5% | 11.5% | 11.0% | |||||||
| (1) | The underwritten economic vacancy is 3.0%. The Outlet Collection | Jersey Gardens Property was 99.4% physically occupied as of September 25, 2013. The Outlet Collection | Jersey Gardens Property has maintained a consistent average occupancy of 98.1% since 2002. |
| (2) | The increase in Effective Gross Income and Net Operating Income from the TTM 9/30/2013 to the U/W is due to the inclusion of contractual rent escalations through October 2014 and recent leasing activity, including 30,764 square feet of renewal/expansion leases and some leases that are out for signature. Since initial securitization of the A-2 note in the WFRBS 2013-UBS1 Trust, as of the Cut-off Date, three of the eight tenants representing 9,991 square feet (0.7% of net rentable area) are open for business and paying full rent. |
| (3) | DSCRs and debt yields are based on The Outlet Collection | Jersey Gardens Loan Combination. |
Appraisal. As of the appraisal valuation date of October 4, 2013, The Outlet Collection | Jersey Gardens Property had an “as-is” appraised value of $707,000,000.
Environmental Matters. According to a Phase I environmental site assessment dated October 8, 2013, there was no evidence of any current recognized environmental conditions at The Outlet Collection | Jersey Gardens Property; however, one historical recognized environmental condition was noted. The Outlet Collection | Jersey Gardens Property was part of the former Elizabeth Landfill, which was utilized by several municipalities in New Jersey. According to the Phase I environmental consultant, all required landfill closure and remediation work has been completed and a “No Further Action Letter” and “Covenant Not to Sue” was issued in 1999. As part of the ongoing monitoring, the Phase I environmental consultant recommended that the engineering controls (cap, leachate drainage system, storm-water drainage system, gas venting system, etc.) and institutional controls continue to be maintained by the New Jersey Department of Environmental Protection.
THE INFORMATION IN THIS STRUCTURAL AND COLLATERAL TERM SHEET IS NOT COMPLETE AND MAY BE AMENDED PRIOR TO THE TIME OF SALE. THIS TERM SHEET IS NOT AN OFFER TO SELL THESE SECURITIES AND IT IS NOT A SOLICITATION OF AN OFFER TO BUY THESE SECURITIES IN ANY JURISDICTION WHERE THE OFFER OR SALE IS NOT PERMITTED.
56
| THE OUTLET COLLECTION | JERSEY GARDENS |
Market Overview and Competition. The Outlet Collection | Jersey Gardens Property is located adjacent to the New Jersey Turnpike, approximately 17 miles southwest of midtown Manhattan and approximately three miles south of Newark International Airport. Regional access is provided by the New Jersey Turnpike, which is traveled by over 250,000 cars daily and provides direct access to The Outlet Collection | Jersey Gardens Property. With a population of more than 125,000, the city of Elizabeth is New Jersey’s fourth largest city and contains most major governmental offices and courts servicing Union County. Elizabeth is also home to Port Newark, the largest industrial seaport in North America, which provides over 150,000 jobs and is the world’s largest containership port and the largest Foreign Trade Zone in the United States. The largest employers in the area include Newark Airport (24,000), Verizon (17,000), Prudential (16,000), and Public Service Electric and Gas Company (11,000).
The Outlet Collection | Jersey Gardens Property provides a shuttle bus to Newark International Airport, which is located directly across the New Jersey Turnpike from The Outlet Collection | Jersey Gardens Property, and that transports over 10,000 monthly riders, including airport employees, local hotel guests and international travelers. The Outlet Collection | Jersey Gardens Property is also easily accessible via public transportation, with two New Jersey Transit train stations and transit buses providing convenient access throughout the trade area. Another demand driver for The Outlet Collection | Jersey Gardens Property has been its location within Elizabeth’s award-winning Urban Enterprise Zone (“UEZ”) program, which offers a reduced 3.5% sales tax (compared to the 7.0% rate charged statewide). The UEZ was named the number one program in the nation by the National Association of State Development Agencies and has provided more than $50.0 million in additional funds for reinvestment in Elizabeth. Further, the state of New Jersey does not charge a sales tax on clothing or shoes, which creates a unique demand driver given The Outlet Collection | Jersey Gardens Property’s proximity to New York City.
According to the appraisal, The Outlet Collection | Jersey Gardens Property’s trade area encompasses a 40-mile radius. As of 2013, the estimated population within a 20-mile and 40-mile radius of The Outlet Collection | Jersey Gardens Property was approximately 10.7 million and 17.0 million, respectively. The estimated household income within the same 20-mile and 40-mile radius was approximately $84,002 and $93,628, respectively. According to a third party market research report, The Outlet Collection | Jersey Gardens Property is located within the Northern New Jersey retail market, which has an estimated inventory of approximately 196.2 million square feet with a 6.1% vacancy rate, as of the third quarter of 2013. The appraiser concluded a market rent of $24.65 per square foot, on a triple net basis, for The Outlet Collection | Jersey Gardens Property.
The following table presents certain information relating to comparable retail properties for The Outlet Collection | Jersey Gardens Property:
Competitive Set(1)
The Outlet Collection | Jersey Gardens (Subject) | Staten Island Mall | Newport Centre | Woodbridge Center | Menlo Park Mall | The Outlets at Bergen Town Center | Woodbury Commons | ||||||||
| Location | Elizabeth, NJ | Staten Island, NY | Jersey City, NJ | Woodbridge, NJ | Edison, NJ | Paramus, NJ | Central Valley, NY | |||||||
| Distance from Subject | -- | 11.0 miles | 12.5 miles | 14.0 miles | 14.5 miles | 26.0 miles | 55.0 miles | |||||||
| Property Type | Regional Mall | Super-Regional Mall | Super-Regional Mall | Super-Regional Mall | Super-Regional Mall | Outlet Center | Outlet Center | |||||||
| Year Built/Renovated | 1999/2013 | 1973/1993 | 1987/2005 | 1971/2003 | 1960/2003 | 1957/1967, 1973, 2007-2011 | 1985/1998 | |||||||
| Anchors | Loews Theatres, Forever 21, Burlington Coat Factory, Marshalls, Bed Bath & Beyond, Century 21, Cohoes Fashions, Off Saks Off 5th | Sears, JC Penney, Macy’s | Sears, JC Penney, Kohl’s, Macy’s | Sears, Macy’s, Lord & Taylor, JC Penney, Boscov’s | Macy’s, Nordstrom, AMC Theater, Workout World | Bloomingdales Outlet, Century 21, Homegoods, Marshall’s Nordstrom Rack, Off 5th, Old Navy, Target, Whole Foods | Neiman Marcus Last Call, Off 5th, Barney’s New York, Polo Ralph Lauren, Eddie Bauer | |||||||
| Total GLA | 1,298,801 SF | 1,274,000 SF | 1,147,000 SF | 1,630,000 SF | 1,243,000 SF | 1,001,916 SF | 848,000 SF | |||||||
| In-line Sales PSF | $715 | NAV | $550 | $450 | $400 | $560 | $1,400 | |||||||
Total Occupancy | 99% | 94% | 98% | 96% | 92% | 92% | 100% |
| (1) | Information obtained from the appraisal. |
The Borrowers. The borrowers are NJ Metromall Urban Renewal, Inc. (the fee owner) and JG Elizabeth II, LLC (the leasehold owner), as further detailed in the “Ground Lease and Payment in Lieu of Taxes (“PILOT”)” section, both single purpose entities with two independent directors. Legal counsel to the borrower delivered a non-consolidation opinion in connection with the origination of The Outlet Collection | Jersey Gardens Loan Combination. Glimcher Properties Limited Partnership (“GPLP”), the sponsor, is the guarantor of certain nonrecourse carveouts under The Outlet Collection | Jersey Gardens Loan Combination.
The Sponsor. The loan sponsor is GPLP, a subsidiary of Glimcher. Based in Columbus, Ohio, Glimcher was formed in 1994 to continue and expand the operations of The Glimcher Company, initially founded in 1959 by Herbert Glimcher. Glimcher owns and/or manages a total of 27 enclosed regional malls, open-air centers or outlet centers in 14 states aggregating approximately 19.1 million square feet of gross leasable area, which was approximately 95.0% occupied as of September 30, 2013. In 2009 and 2012, Glimcher had ownership interests in two malls that either were the subject of deeds in lieu of foreclosure or were modified following default. See “Description of the Mortgage Pool – Default History, Bankruptcy Issues and Other Proceedings” in the Free Writing Prospectus.
THE INFORMATION IN THIS STRUCTURAL AND COLLATERAL TERM SHEET IS NOT COMPLETE AND MAY BE AMENDED PRIOR TO THE TIME OF SALE. THIS TERM SHEET IS NOT AN OFFER TO SELL THESE SECURITIES AND IT IS NOT A SOLICITATION OF AN OFFER TO BUY THESE SECURITIES IN ANY JURISDICTION WHERE THE OFFER OR SALE IS NOT PERMITTED.
57
| THE OUTLET COLLECTION | JERSEY GARDENS |
Escrows. The loan documents provide for upfront reserves in the amount of $2,593,953 for unfunded TI/LC costs associated with ten tenants and $61,775 for rent concessions associated with The Gap. The loan documents do not require monthly escrows for real estate taxes provided the following conditions are met: (i) no event of default has occurred and is continuing; (ii) the borrower has provided the lender with timely proof of payment; and (iii) a Cash Trap Event Period (as defined below) does not currently exist. The loan documents do not require monthly escrows for insurance provided (i) no event of default has occurred and is continuing; (ii) the insurance required to be maintained by the borrower is maintained pursuant to one or more blanket policies; and (iii) the borrower provides the lender with timely proof of payment of insurance premiums. The loan documents do not require monthly escrows for replacement reserves as long as no Cash Trap Event Period exists and is continuing. During a Cash Trap Event Period, the borrower is required to deposit monthly replacement reserves in an amount equal to $21,647. The loan documents do not require monthly escrows for tenant improvements and leasing commissions as long as no Cash Trap Event Period exists and is continuing. During a Cash Trap Event Period, the borrower is required to deposit monthly tenant improvement and leasing commission reserves in an amount equal to $52,645. In addition, during a Cash Trap Event Period, the borrower is required to make monthly deposits into a ground rent reserve account in an amount equal to one-twelfth of the estimated annual ground rent payment payable during the next ensuing 12 months.
A “Cash Trap Event Period” will commence upon (i) the occurrence and continuance of an event of default or (ii) the debt service coverage ratio (based on a 30-year amortization term) for the trailing 12-month period falling below 1.25x at the end of any calendar quarter. A Cash Trap Event Period will expire, with regard to the circumstances in clause (i), upon the cure of such event of default, or, with regard to the circumstances in clause (ii), the debt service coverage ratio (based on a 30-year amortization term) being equal to or greater than 1.25x for two consecutive calendar quarters.
Lockbox and Cash Management. The Outlet Collection | Jersey Gardens Loan Combination requires a lender-controlled lockbox account, which is already in place, and that the borrower direct tenants to pay their rents directly into such lockbox account. The loan documents also require that all rents received by the borrower or the property manager be deposited into the lockbox account within one business day of receipt. Prior to the occurrence of a Cash Trap Event Period, all funds on deposit in the lockbox account are swept into the borrower’s operating account on a daily basis. During a Cash Trap Event Period, all excess cash flow is swept on a monthly basis to a cash management account under control of the lender.
Property Management. The Outlet Collection | Jersey Gardens Property is managed by an affiliate of the borrower.
Assumption. The borrower has the two-time right to transfer The Outlet Collection | Jersey Gardens Property, provided that no event of default has occurred and is continuing and certain other conditions are satisfied, including, but not limited to the following: (i) the lender’s reasonable determination that the proposed transferee and guarantor satisfy the lender’s credit review and underwriting standards, taking into consideration transferee experience, financial strength and general business standing; (ii) execution of a recourse guaranty and an environmental indemnity by an affiliate of the transferee; and (iii) if requested by the lender, rating agency confirmation from DBRS, Fitch and Moody’s that the transfer will not result in a downgrade, withdrawal or qualification of the respective ratings assigned to the Series 2014-LC14 Certificates, and similar confirmations with respect to the ratings of any securities backed by The Outlet Collection | Jersey Gardens Companion Loans.
In addition, transfers of equity interests in the borrower are permitted so long as Glimcher owns more than 30.0% of direct or indirect equity interests in GPLP (and controls GPLP) and the borrower or a Qualified Equity Holder (as defined below) owns more than 51.0% of the direct or indirect equity interests in GPLP (and controls GPLP).
A “Qualified Equity Holder” means an entity which meets certain criteria, including but not limited to (i) an affiliate, or other institution having total assets in excess of $600.0 million and is regularly engaged in the business of owning and operating properties similar to The Outlet Collection | Jersey Gardens Property, or (ii) any party for whom written confirmation from KBRA, Moody’s and S&P has been obtained that the transfer to the entity in question will not result in a downgrade, withdrawal or qualification of the then-current ratings assigned to the Series 2014-LC14 Certificates, and similar confirmations with respect to the ratings of any securities backed by The Outlet Collection | Jersey Gardens Companion Loans.
Partial Release. Not permitted.
Real Estate Substitution. Not permitted.
Subordinate and Mezzanine Indebtedness. Not permitted.
Additional Indebtedness. GPLP is permitted to pledge its indirect ownership of the borrower to a “Qualified Pledgee” (generally defined as an entity with $600.0 million in assets under management and shareholder equity of at least $250.0 million), subject to certain conditions, including: (i) no more than 49.0% of equity ownership interest in the borrower may be pledged; (ii) the credit facility must be recourse to GPLP and is secured by a substantial portion of its assets; (iii) the repayment of the credit facility relies substantially on cash flow assets other than The Outlet Collection | Jersey Gardens Property; and (iv) no event of default has occurred or is continuing.
Ground Lease and Payment in Lieu of Taxes (“PILOT”). The Outlet Collection | Jersey Gardens Property is subject to a prior lien for amounts required under a PILOT arrangement with the City of Elizabeth, New Jersey. To accommodate statutory requirements for the PILOT structure, the borrowers are comprised of a fee borrower (NJ Metromall Urban Renewal, Inc.) and an affiliated leasehold borrower (JG Elizabeth, LLC), and the lease payments made by the leasehold borrower to the fee borrower equal the required PILOT payments, and are paid by the fee borrower to US Bank Trust (the “PILOT Lender”), as trustee for the PILOT bondholders. The PILOT Lender has a statutory lien on The Outlet Collection | Jersey Gardens Property that is effectively equivalent in priority and character
THE INFORMATION IN THIS STRUCTURAL AND COLLATERAL TERM SHEET IS NOT COMPLETE AND MAY BE AMENDED PRIOR TO THE TIME OF SALE. THIS TERM SHEET IS NOT AN OFFER TO SELL THESE SECURITIES AND IT IS NOT A SOLICITATION OF AN OFFER TO BUY THESE SECURITIES IN ANY JURISDICTION WHERE THE OFFER OR SALE IS NOT PERMITTED.
58
| THE OUTLET COLLECTION | JERSEY GARDENS |
to a municipal tax lien. If the PILOT payments are not made, the City of Elizabeth has a special assessment lien against The Outlet Collection | Jersey Gardens Property in the same amount as the PILOT payments that are due but not yet paid.
The remaining PILOT obligations during the loan term range from $10,799,250 in 2013 through $12,770,113 in 2020, and the PILOT payments continue until February 1, 2031. The borrower affiliate that owns the adjacent retail site, and/or its tenants are contractually obligated to reimburse the borrower for 22.9% of the PILOT obligation.
Terrorism Insurance. The loan documents require that the “all risk” insurance policy required to be maintained by the borrower provides coverage for terrorism in an amount equal to the full replacement cost of The Outlet Collection | Jersey Gardens Property; provided, however, that the borrower will not be required to spend more than 200% of the cost of property coverage immediately prior to the date that TRIA or a similar government backstop is no longer in effect. The loan documents also require business interruption insurance covering no less than the 24-month period following the occurrence of a casualty event, together with an extended period of indemnity, which shall continue for the lesser of (i) the period of time until income returns to the same level as it was prior to loss and (ii) 12 months.
THE INFORMATION IN THIS STRUCTURAL AND COLLATERAL TERM SHEET IS NOT COMPLETE AND MAY BE AMENDED PRIOR TO THE TIME OF SALE. THIS TERM SHEET IS NOT AN OFFER TO SELL THESE SECURITIES AND IT IS NOT A SOLICITATION OF AN OFFER TO BUY THESE SECURITIES IN ANY JURISDICTION WHERE THE OFFER OR SALE IS NOT PERMITTED.
59
WESTIN NEW YORK AT TIMES SQUARE – LEASED FEE |

THE INFORMATION IN THIS STRUCTURAL AND COLLATERAL TERM SHEET IS NOT COMPLETE AND MAY BE AMENDED PRIOR TO THE TIME OF SALE. THIS TERM SHEET IS NOT AN OFFER TO SELL THESE SECURITIES AND IT IS NOT A SOLICITATION OF AN OFFER TO BUY THESE SECURITIES IN ANY JURISDICTION WHERE THE OFFER OR SALE IS NOT PERMITTED.
60
WESTIN NEW YORK AT TIMES SQUARE – LEASED FEE |
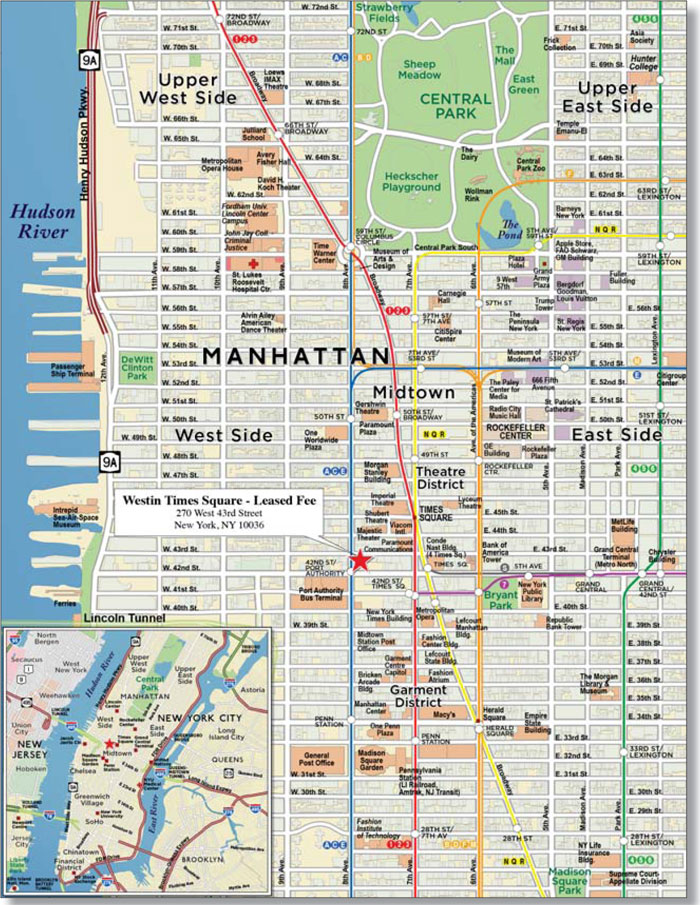
THE INFORMATION IN THIS STRUCTURAL AND COLLATERAL TERM SHEET IS NOT COMPLETE AND MAY BE AMENDED PRIOR TO THE TIME OF SALE. THIS TERM SHEET IS NOT AN OFFER TO SELL THESE SECURITIES AND IT IS NOT A SOLICITATION OF AN OFFER TO BUY THESE SECURITIES IN ANY JURISDICTION WHERE THE OFFER OR SALE IS NOT PERMITTED.
61
| No. 4 – Westin New York at Times Square – Leased Fee | |||||||||
| Loan Information | Property Information | ||||||||
| Mortgage Loan Seller: | Wells Fargo Bank, National Association | Single Asset/Portfolio: | Single Asset | ||||||
Credit Assessment (DBRS/Fitch/Moody’s): | AAA/NR/A2 | Property Type: | Other | ||||||
| Original Principal Balance: | $55,000,000 | Specific Property Type: | Leased Fee | ||||||
| Cut-off Date Principal Balance: | $55,000,000 | Location: | New York, NY | ||||||
| % of Initial Pool Balance: | 4.4% | Size(3): | 17,574 SF | ||||||
| Loan Purpose: | Acquisition | Cut-off Date Principal Balance Per SF: | $3,129.62 | ||||||
| Borrower Name: | THR 43 Land LLC | Year Built/Renovated: | 2000/2013 | ||||||
| Sponsor: | Tishman Hotel & Realty, LP | Title Vesting: | Fee | ||||||
| Mortgage Rate: | 3.287% | Property Manager: | NAP | ||||||
| Note Date: | January 24, 2014 | 3rd Most Recent Occupancy (As of): | 100.0% (12/31/2010) | ||||||
| Anticipated Repayment Date: | February 1, 2019 | 2nd Most Recent Occupancy (As of): | 100.0% (12/31/2011) | ||||||
| Maturity Date: | February 1, 2039 | Most Recent Occupancy (As of): | 100.0% (12/31/2012) | ||||||
| IO Period: | 60 months | Current Occupancy (As of): | 100.0% (2/1/2014) | ||||||
| Loan Term (Original): | 60 months | ||||||||
| Seasoning: | 0 months | Underwriting and Financial Information: | |||||||
| Amortization Term (Original): | NAP | ||||||||
| Loan Amortization Type: | Interest-only, ARD | 3rd Most Recent NOI (As of)(4): | NAP | ||||||
| Interest Accrual Method: | Actual/360 | 2nd Most Recent NOI (As of)(4): | NAP | ||||||
| Call Protection: | L(24),D(32),O(4) | Most Recent NOI (As of)(4): | NAP | ||||||
| Lockbox Type: | Hard/Upfront Cash Management | ||||||||
Additional Debt(1): | Yes | U/W Revenues: | $3,575,000 | ||||||
Additional Debt Type(1): | Future Unsecured | U/W Expenses: | $0 | ||||||
| U/W NOI: | $3,575,000 | ||||||||
| U/W NCF: | $3,575,000 | ||||||||
| U/W NOI DSCR: | 1.95x | ||||||||
| U/W NCF DSCR: | 1.95x | ||||||||
Escrows and Reserves(2): | U/W NOI Debt Yield: | 6.5% | |||||||
| U/W NCF Debt Yield: | 6.5% | ||||||||
Type: | Initial | Monthly | Cap (If Any) | As-Is Appraised Value: | $89,000,000 | ||||
| Taxes | $0 | Springing | NAP | As-Is Appraisal Valuation Date: | December 9, 2013 | ||||
| Insurance | $0 | Springing | NAP | Cut-off Date LTV Ratio: | 61.8% | ||||
| FF&E | $0 | Springing | NAP | LTV Ratio at Maturity or ARD: | 61.8% | ||||
| (1) | See “Other Indebtedness” section. |
| (2) | See “Escrows” section. |
| (3) | Size represents the land area. |
| (4) | See “Property” section. |
The Mortgage Loan. The mortgage loan (the “Westin New York at Times Square – Leased Fee Mortgage Loan”) is evidenced by a promissory note secured by a first mortgage encumbering the fee simple interest in the land which lies beneath the Westin New York at Times Square Hotel located in New York, New York (the “Westin New York at Times Square – Leased Fee Property”). The Westin New York at Times Square – Leased Fee Mortgage Loan was originated on January 24, 2014 by Wells Fargo Bank, National Association. The Westin New York at Times Square – Leased Fee Mortgage Loan had an original principal balance of $55,000,000, has an outstanding principal balance as of the Cut-off Date of $55,000,000 and accrues interest at an interest rate of 3.287% per annum. The Westin New York at Times Square – Leased Fee Mortgage Loan had an initial term of 60 months, has a remaining term of 60 months as of the Cut-off Date and requires interest-only payments through the Anticipated Repayment Date (“ARD”). The ARD is February 1, 2019 and the final maturity date is February 1, 2039. In the event the Westin New York at Times Square – Leased Fee Mortgage Loan is not paid in full on or before the ARD, the borrower will be required to make payments of interest only based on the greater of (i) 8.287% or (ii) the greater of (a) the current 10-year offer side swap rate or (b) the treasury rate, plus 6.600%. The ARD automatically triggers a full cash flow sweep whereby all excess cash flow will be used to pay down the principal balance of the Westin New York at Times Square – Leased Fee Mortgage Loan.
Following the lockout period, the borrower has the right to defease the Westin New York at Times Square – Leased Fee Mortgage Loan in whole, but not in part, on any date before November 1, 2018. In addition, the Westin New York at Times Square – Leased Fee Mortgage Loan is prepayable without penalty on or after November 1, 2018.
THE INFORMATION IN THIS STRUCTURAL AND COLLATERAL TERM SHEET IS NOT COMPLETE AND MAY BE AMENDED PRIOR TO THE TIME OF SALE. THIS TERM SHEET IS NOT AN OFFER TO SELL THESE SECURITIES AND IT IS NOT A SOLICITATION OF AN OFFER TO BUY THESE SECURITIES IN ANY JURISDICTION WHERE THE OFFER OR SALE IS NOT PERMITTED.
62
WESTIN NEW YORK AT TIMES SQUARE – LEASED FEE |
Sources and Uses
| Sources | Uses | ||||||||
| Original loan amount | $55,000,000 | 100.0% | Purchase price(1) | $44,125,000 | 80.2 | % | |||
| Closing costs | 437,495 | 0.8 | |||||||
| Return of equity | 10,437,505 | 19.0 | |||||||
| Total Sources | $55,000,000 | 100.0% | Total Uses | $55,000,000 | 100.0 | % |
| (1) | See “Leased Fee Acquisition” section for further detail on the estimated purchase price, which is an estimate based on the appraiser’s projection of unabated taxes over the next four years. |
The Property. The Westin New York at Times Square – Leased Fee Property consists of a land parcel totaling 17,574 square feet, or 0.4 acres, located in New York, New York and underlying the leasehold improvements (the “Westin New York at Times Square Hotel”). The Westin New York at Times Square Hotel is subject to a ground lease with the Westin New York at Times Square – Leased Fee Mortgage Loan borrower (the “Westin New York at Times Square Ground Lease”), which expires on July 14, 2096 and has an annual rental rate of $3,575,000 with 1.5% annual rent increases.
Built in 2000 and renovated in 2013, the Westin New York at Times Square Hotel (the leasehold improvements, which are not collateral for the Westin New York at Times Square – Leased Fee Mortgage Loan) contains 46 stories and 873 guest rooms. Amenities at the Westin New York at Times Square Hotel include over 34,000 square feet of flexible meeting space spread across 32 meeting rooms, two food and beverage outlets located off the main lobby, a sundry shop and a fitness center. In addition, the Westin New York at Times Square Hotel’s south entrance provides access to the neighboring E-Walk retail complex, which contains approximately 200,000 square feet of commercial space including retail shops, restaurants and a 13-screen Regal movie theatre. As of year-end 2013, the Westin New York at Times Square Hotel exhibited an occupancy rate of 92.0%, ADR of $329.48 and RevPAR of $303.09. Approximately $46.5 million (approximately $53,143 per key) in capital improvements have been spent at the Westin New York at Times Square Hotel from construction in 2000 through 2012 and a five-year, $34.2 million ($39,182 per key) property improvement plan recently commenced and is expected to be completed in 2016. The majority of the expenditures will go towards guest room renovations.
Leased Fee Acquisition. The Westin New York at Times Square – Leased Fee Property was previously owned by the City and State of New York, who leased the land to the Westin New York at Times Square Hotel owner, an affiliate of Tishman Hotel & Realty LP (“Tishman”). The previous ground lease agreement, dated July 15, 1997, between 42nd Street Development Project, Inc. and Dream Team Hotel Associates, LLC, required lease payments determined by a combination of fixed rent and percentage rent calculations. The 2013 ground rent payment due to the City and State of New York was $2,574,000. In July 2013, Tishman began negotiations with the City and State of New York to purchase the Westin New York at Times Square – Leased Fee Property based on their purchase option in the Westin New York at Times Square Ground Lease.
In conjunction with the Westin New York Times Square Ground Lease and construction of the Westin New York at Times Square Hotel, the City of New York granted Tishman a Payment in Lieu of Taxes (“PILOT”) program which provided the Westin New York at Times Square Hotel with a 100% abatement of its tax expense through 2017. In exchange for the fee interest in the Westin New York at Times Square – Leased Fee Property, Tishman agreed to begin paying its full share of the taxes due on the Westin New York at Times Square Hotel, effectively ending the PILOT program four years earlier than originally scheduled. The cumulative tax expense from 2014 to 2017, as projected by the appraisal, is $44,125,000. An amendment to the ground lease dated December 31, 2013 assigns the Westin New York at Times Square – Leased Fee Property to THR 43 Land LLC, the borrower under the Westin New York at Times Square – Leased Fee Mortgage Loan.
Operating History and Underwritten Net Cash Flow. The following table presents certain information relating to the historical operating performance and Underwritten Net Cash Flow at the Westin New York At Times Square – Leased Fee Property:
Cash Flow Analysis
| U/W | ARD 2/1/2019 | ||||
| Ground Lease Payment | $3,575,000(1) | $3,851,290(2) | |||
| Less Vacancy & Credit Loss | 0 | 0 | |||
| Effective Gross Income | $3,575,000 | $3,851,290 | |||
| Total Operating Expenses | 0 | 0 | |||
| Net Operating Income | $3,575,000 | $3,851,290 | |||
| TI/LC | 0 | 0 | |||
| Capital Expenditures | 0 | 0 | |||
| Net Cash Flow | $3,575,000 | $3,851,290 | |||
| NOI DSCR | 1.95x | 2.10x | |||
| NCF DSCR | 1.95x | 2.10x | |||
| NOI DY | 6.5% | 7.0% | |||
| NCF DY | 6.5% | 7.0% |
| (1) | Underwriting is based on the current ground lease payment. |
| (2) | Analysis showing the ground rent at the ARD. |
Appraisal. As of the appraisal valuation date of December 9, 2013, the Westin New York at Times Square – Leased Fee Property had an “as-is” appraised value of $89,000,000.
THE INFORMATION IN THIS STRUCTURAL AND COLLATERAL TERM SHEET IS NOT COMPLETE AND MAY BE AMENDED PRIOR TO THE TIME OF SALE. THIS TERM SHEET IS NOT AN OFFER TO SELL THESE SECURITIES AND IT IS NOT A SOLICITATION OF AN OFFER TO BUY THESE SECURITIES IN ANY JURISDICTION WHERE THE OFFER OR SALE IS NOT PERMITTED.
63
WESTIN NEW YORK AT TIMES SQUARE – LEASED FEE |
Environmental Matters. According to a Phase I environmental site assessment dated December 17, 2013, there was no evidence of any recognized environmental conditions at the Westin New York at Times Square – Leased Fee Property.
Market Overview and Competition. The Westin New York at Times Square – Leased Fee Property is located on the southeast corner of West 43rd Street and Eighth Avenue within the Times Square neighborhood of Midtown Manhattan. Times Square has been the subject of a major renovation by the City of New York with the goal of making the area more pedestrian-friendly, particularly catering to the large number of tourists visiting Manhattan. The latest renovation to the neighborhood is the creation of 60,000 square feet of pedestrian space along Broadway. In 2012, tourism generated a record $55.3 billion in economic impact and New York City welcomed an all-time high of 52 million visitors. Located less than a block away from the Westin New York at Times Square – Leased Fee Property, the Times Square/42nd Street/Eighth Avenue interlinked subway stations offer access to 12 different subway lines (A, C, E, N, Q, R, 1, 2, 3, 7 and shuttle to Grand Central Terminal); the stations are currently undergoing a 10-year, $250 million renovation and upgrade to match the increasing flow of passengers to Times Square. The Times Square neighborhood is generally defined as the area bounded by Sixth Avenue to the east, Ninth Avenue to the west, 40th Street to the south and 54th Street to the north.
In 2012, tourism supported approximately 363,050 New York-area hospitality and leisure jobs—a 27% increase since 2006. Times Square now accounts for 17,000 hotel rooms, 21.0% of Manhattan’s total hotel supply. According to a third party hospitality research firm, Times Square hotels generate over $190 million in sales and hotel occupancy tax revenues to the City and State of New York. According to a third party market research firm, the average hotel occupancy in the Times Square hotel market was 85.4% as of year-to-date June 2013, ADR was $262.42 and RevPAR was $224.21, compared to 84.2%, $250.51 and $211.01, respectively, as of year-to-date June 2012. The Manhattan market is continuing to increase RevPAR despite the continued development of lodging facilities throughout the New York City area. Since 2006, Manhattan has witnessed a 27.2% hotel supply increase; however, demand increased 29.2% over the same period.
The following table presents certain information relating to the Westin New York at Times Square Hotel’s competitive set:
Subject and Market Historical Occupancy, ADR and RevPAR(1)
Competitive Set | Westin New York at Times Square Hotel | Penetration Factor | |||||||||||||||
Year | Occupancy | ADR | RevPAR | Occupancy | ADR | RevPAR | Occupancy | ADR | RevPAR | ||||||||
| 11/30/2013 TTM | 92.0% | $319.42 | $293.76 | 91.6% | $325.74 | $298.54 | 99.7% | 102.0% | 101.6% | ||||||||
| 11/30/2012 TTM | 91.5% | $311.18 | $284.80 | 92.8% | $320.77 | $297.59 | 101.4% | 103.1% | 104.5% | ||||||||
| 11/30/2011 TTM | 89.8% | $303.50 | $272.48 | 89.9% | $312.23 | $280.64 | 100.1% | 102.9% | 103.0% | ||||||||
| (1) | Information obtained from a third party hospitality research report dated December 18, 2013. According to such third party hospitality report, the competitive set includes the following hotels: Marriott Marquis New York, Renaissance New York Times Square Hotel, Crowne Plaza Times Square Manhattan, Millennium Broadway, Doubletree Guest Suites Times Square New York, Hilton Times Square and W Hotel New York Times Square. |
The Borrower. The borrower is THR 43 Land LLC, a Delaware limited liability company and single purpose entity with two independent directors. Legal counsel to the borrower delivered a non-consolidation opinion in connection with the origination of the Westin New York at Times Square – Leased Fee Mortgage Loan. Tishman Hotel & Realty, LP is the guarantor of certain nonrecourse carveouts under the Westin New York at Times Square – Leased Fee Mortgage Loan.
The Sponsor. The sponsor is Tishman Hotel & Realty, LP, a vertically integrated real estate owner, operator, developer and advisor. Over the last 30 years, Tishman has developed, managed and advised on more than 35 million square feet of commercial real estate, including more than 50,000 hotel rooms. As of January 2014, Tishman’s hotel portfolio includes the Intercontinental New York Times Square, Walt Disney World Dolphin & Swan, Sheraton Chicago Hotel and Towers, Sheraton Old San Juan Hotel (Puerto Rico) and Warner Center Marriott (Los Angeles). In addition, Tishman owns the 200,000 square-foot E-Walk retail complex, which is located adjacent to the Westin New York at Times Square – Leased Fee Property.
Escrows. The loan documents do not require ongoing monthly escrows for property taxes, insurance and FF&E reserves as long as (i) the Westin New York at Times Square Ground Lease requires the tenant thereunder to pay all property taxes, insurance and capital improvement items with respect to the Westin New York at Times Square – Leased Fee Property, (ii) the Westin New York at Times Square Ground Lease is in full force and effect, (iii) no event of default has occurred and is continuing and (iv) the borrower provides satisfactory evidence to the lender of payment of property taxes and insurance and that FF&E funds are reserved pursuant to the Westin New York at Times Square management agreement.
Lockbox and Cash Management. The Westin New York at Times Square – Leased Fee Mortgage Loan requires a lender-controlled lockbox account, which is already in place, and that the borrower direct the tenant to pay its rent directly into such lockbox account. The loan documents also require that all rents received by the borrower be deposited into the lockbox account within two business days of receipt. Funds are then swept to a cash management account controlled by the lender and prior to the occurrence of a Cash Trap Event Period (as defined below), all excess funds after application in accordance with the loan documents are distributed to the borrower’s operating account. During a Cash Trap Event Period, all excess cash flow is retained in the cash management account.
A “Cash Trap Event Period” will commence upon the earlier of (i) the occurrence and continuance of an event of default; (ii) a monetary default of the tenant under the Westin New York at Times Square Ground Lease; or (iii) the expiration of the Westin New York at Times Square Ground Lease. A Cash Trap Event Period will be cured, with respect to the circumstances outlined in clauses (i) and (ii), upon the cure of such default. A Cash Trap Event Period triggered by the circumstances outlined in clause (iii) will not expire.
THE INFORMATION IN THIS STRUCTURAL AND COLLATERAL TERM SHEET IS NOT COMPLETE AND MAY BE AMENDED PRIOR TO THE TIME OF SALE. THIS TERM SHEET IS NOT AN OFFER TO SELL THESE SECURITIES AND IT IS NOT A SOLICITATION OF AN OFFER TO BUY THESE SECURITIES IN ANY JURISDICTION WHERE THE OFFER OR SALE IS NOT PERMITTED.
64
WESTIN NEW YORK AT TIMES SQUARE – LEASED FEE |
Property Management. Not applicable.
Assumption. The borrower has the right to transfer the Westin New York at Times Square – Leased Fee Property, provided that no event of default has occurred and is continuing and certain other conditions are satisfied, including (i) the lender’s reasonable determination that the proposed transferee and guarantor satisfy the lender’s credit review and underwriting standards, taking into consideration transferee’s experience, financial strength and general business standing; (ii) execution of a recourse guaranty and an environmental indemnity by an affiliate of the transferee; and (iii) if requested by the lender, rating agency confirmation from DBRS, Fitch and Moody’s that the transfer will not result in a downgrade, withdrawal or qualification of the respective ratings assigned to the Series 2014-LC14 Certificates.
Real Estate Substitution. Not Permitted.
Subordinate and Mezzanine Indebtedness. Not Permitted.
Other Indebtedness. The Westin New York at Times Square – Leased Fee Mortgage Loan documents permit the borrower to incur additional unsecured debt in connection with tenant improvements, leasing commissions, FF&E and other amounts due under the Westin New York at Times Square Ground Lease, among other things.
In addition, pledges of equity interests in the borrower are permitted, so long as they are considered permitted pledges in accordance with the loan documents.
See “Description of the Mortgage Pool – Other Additional Financing” in the Free Writing Prospectus for further detail.
Ground Lease. Not applicable.
Terrorism Insurance. The loan documents require that the “all risk” insurance policy required to be maintained by the borrower provide coverage for terrorism in an amount equal to the full replacement cost of the Westin New York at Times Square – Leased Fee Property; provided however, that the borrower will not be required to spend more than 200% of the cost of the all-risk insurance coverage immediately prior to the date that TRIPRA or a similar government backstop is no longer in effect. The loan documents also require business interruption insurance covering no less than the 18-month period following the occurrence of a casualty event, together with a twelve-month extended period of indemnity.
THE INFORMATION IN THIS STRUCTURAL AND COLLATERAL TERM SHEET IS NOT COMPLETE AND MAY BE AMENDED PRIOR TO THE TIME OF SALE. THIS TERM SHEET IS NOT AN OFFER TO SELL THESE SECURITIES AND IT IS NOT A SOLICITATION OF AN OFFER TO BUY THESE SECURITIES IN ANY JURISDICTION WHERE THE OFFER OR SALE IS NOT PERMITTED.
65
(THIS PAGE INTENTIONALLY LEFT BLANK)
66
| MIAMI INTERNATIONAL AIRPORT INDUSTRIAL PORTFOLIO |
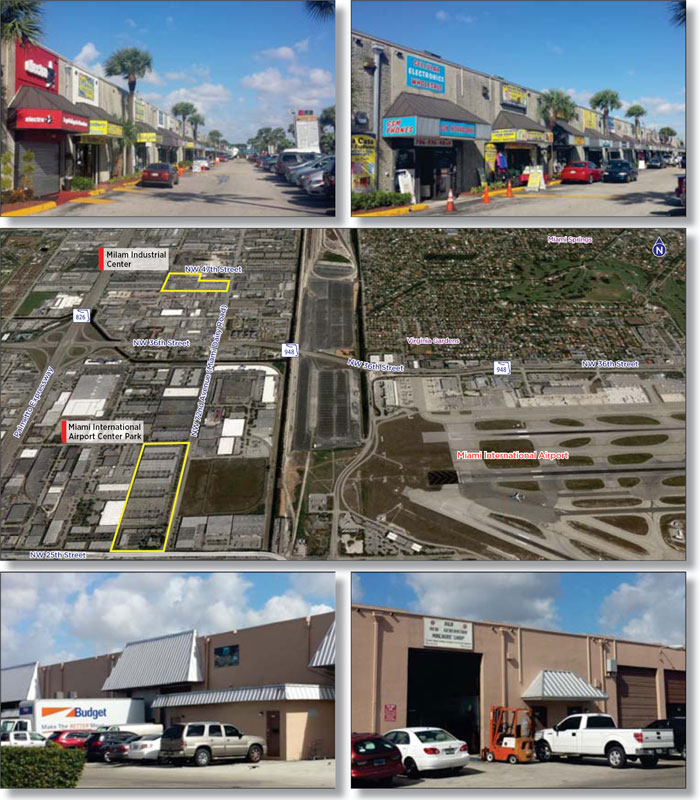
THE INFORMATION IN THIS STRUCTURAL AND COLLATERAL TERM SHEET IS NOT COMPLETE AND MAY BE AMENDED PRIOR TO THE TIME OF SALE. THIS TERM SHEET IS NOT AN OFFER TO SELL THESE SECURITIES AND IT IS NOT A SOLICITATION OF AN OFFER TO BUY THESE SECURITIES IN ANY JURISDICTION WHERE THE OFFER OR SALE IS NOT PERMITTED.
67
| MIAMI INTERNATIONAL AIRPORT INDUSTRIAL PORTFOLIO |
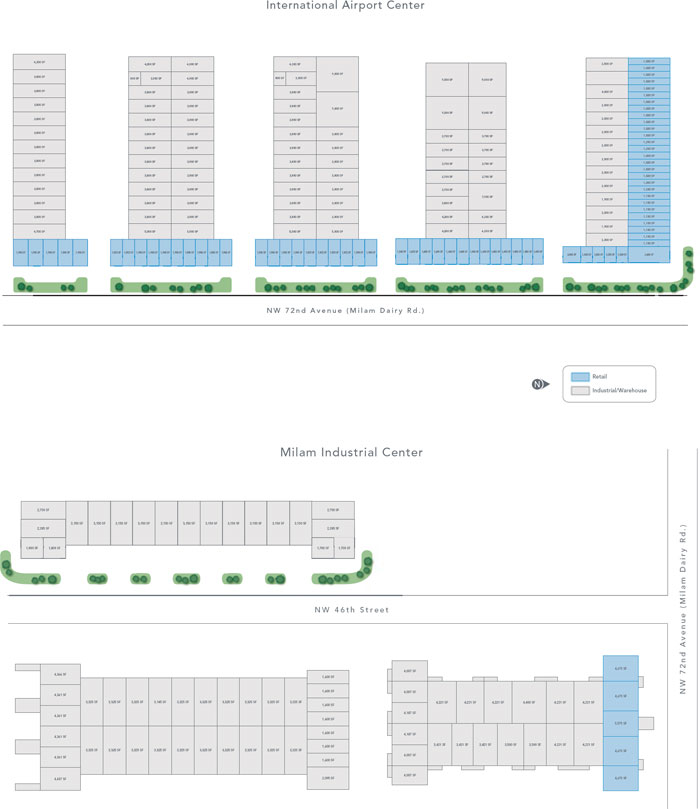
THE INFORMATION IN THIS STRUCTURAL AND COLLATERAL TERM SHEET IS NOT COMPLETE AND MAY BE AMENDED PRIOR TO THE TIME OF SALE. THIS TERM SHEET IS NOT AN OFFER TO SELL THESE SECURITIES AND IT IS NOT A SOLICITATION OF AN OFFER TO BUY THESE SECURITIES IN ANY JURISDICTION WHERE THE OFFER OR SALE IS NOT PERMITTED.
68
| MIAMI INTERNATIONAL AIRPORT INDUSTRIAL PORTFOLIO |
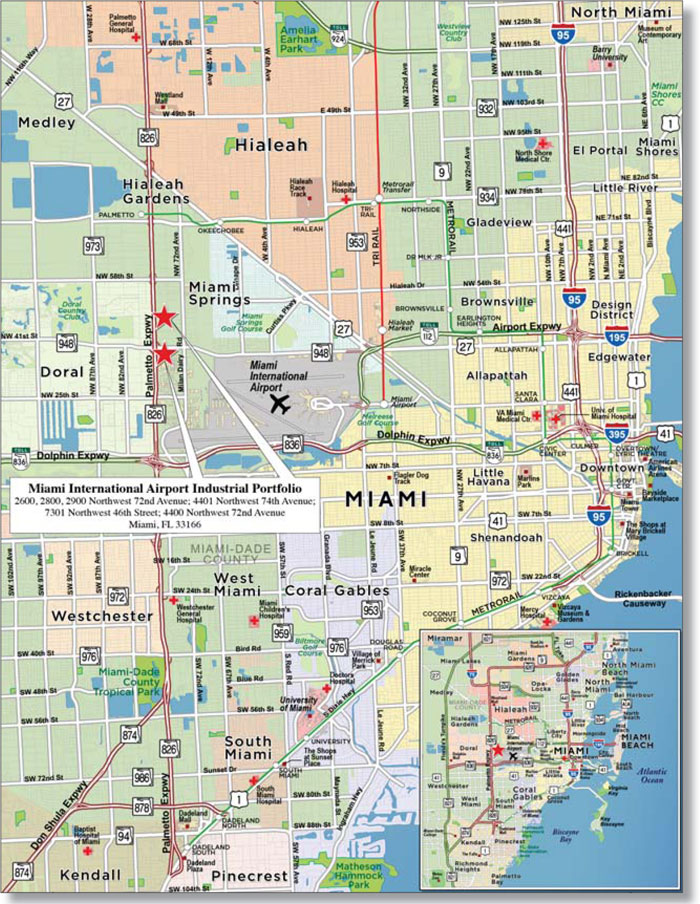
THE INFORMATION IN THIS STRUCTURAL AND COLLATERAL TERM SHEET IS NOT COMPLETE AND MAY BE AMENDED PRIOR TO THE TIME OF SALE. THIS TERM SHEET IS NOT AN OFFER TO SELL THESE SECURITIES AND IT IS NOT A SOLICITATION OF AN OFFER TO BUY THESE SECURITIES IN ANY JURISDICTION WHERE THE OFFER OR SALE IS NOT PERMITTED.
69
| No. 5 – Miami International Airport Industrial Portfolio |
| Loan Information | Property Information | |||||
| Mortgage Loan Seller: | Wells Fargo Bank, National Association | Single Asset/Portfolio: | Portfolio | |||
Credit Assessment (DBRS/Fitch/Moody’s): | NR/NR/NR | Property Type: | Mixed Use | |||
| Original Principal Balance: | $48,500,000 | Specific Property Type: | Industrial/Retail | |||
| Cut-off Date Principal Balance: | $48,500,000 | Location: | Miami, FL | |||
| % of Initial Pool Balance: | 3.9% | Size: | 749,851 SF | |||
| Loan Purpose: | Refinance | Cut-off Date Principal Balance Per SF: | $64.68 | |||
Borrower Names(1): | Various | Year Built/Renovated(4): | Various | |||
| Sponsor: | Francis Greenburger | Title Vesting: | Fee | |||
| Mortgage Rate: | 4.140% | Property Manager: | Americas Property Management Corp. | |||
| Note Date: | January 22, 2014 | 3rd Most Recent Occupancy (As of): | 85.4% (12/31/2010) | |||
| Anticipated Repayment Date: | NAP | 2nd Most Recent Occupancy (As of): | 86.1% (12/31/2011) | |||
| Maturity Date: | February 1, 2019 | Most Recent Occupancy (As of): | 87.6% (12/31/2012) | |||
| IO Period: | None | Current Occupancy (As of): | 86.2% (12/31/2013) | |||
| Loan Term (Original): | 60 months | |||||
| Seasoning: | 0 months | |||||
| Amortization Term (Original): | 360 months | Underwriting and Financial Information: | ||||
| Loan Amortization Type: | Amortizing Balloon | 3rd Most Recent NOI: | $4,242,228 (12/31/2011) | |||
| Interest Accrual Method: | Actual/360 | 2nd Most Recent NOI: | $4,504,160 (12/31/2012) | |||
| Call Protection: | L(24),D(32),O(4) | Most Recent NOI: | $4,164,167 (TTM 10/31/2013) | |||
| Lockbox Type: | Soft/Springing Cash Management | |||||
Additional Debt(2): | Yes | U/W Revenues: | $6,418,785 | |||
Additional Debt Type(2): | Existing Unsecured | U/W Expenses: | $1,906,307 | |||
| U/W NOI: | $4,512,478 | |||||
| U/W NCF: | $4,165,296 | |||||
Escrows and Reserves(3): | U/W NOI DSCR: | 1.60x | ||||
| U/W NCF DSCR: | 1.47x | |||||
Type: | Initial | Monthly | Cap (If Any) | U/W NOI Debt Yield: | 9.3% | |
| Taxes | $238,002 | $59,501 | NAP | U/W NCF Debt Yield: | 8.6% | |
| Insurance | $0 | Springing | NAP | As-Is Appraised Value: | $74,900,000 | |
| Replacement Reserves | $0 | $6,249 | $224,995 | As-Is Appraisal Valuation Date: | November 21, 2013 | |
| TI/LC Reserve | $0 | $20,833 | $750,000 | Cut-off Date LTV Ratio: | 64.8% | |
| Roof Repair Reserve | $1,200,000 | $0 | NAP | LTV Ratio at Maturity or ARD: | 58.9% | |
| (1) | The borrowers are comprised of six special purpose entities as tenants-in-common. |
| (2) | See “Other Indebtedness” section. |
| (3) | See “Escrows” section. |
| (4) | See “The Property” section. |
The Mortgage Loan. The mortgage loan (the “Miami International Airport Industrial Portfolio Mortgage Loan”) is evidenced by a single promissory note that is secured by a first mortgage encumbering a portfolio comprised of two mixed-use industrial and retail properties located in Miami, Florida (the “Miami International Airport Industrial Portfolio Properties”). The Miami International Airport Industrial Portfolio Mortgage Loan was originated on January 22, 2014 by Wells Fargo Bank, National Association. The Miami International Airport Industrial Portfolio Mortgage Loan had an original principal balance of $48,500,000, has an outstanding principal balance as of the Cut-off Date of $48,500,000 and accrues interest at an interest rate of 4.140% per annum. The Miami International Airport Industrial Portfolio Mortgage Loan had an initial term of 60 months, has a remaining term of 60 months as of the Cut-off Date and requires payments of principal and interest based on a 30-year amortization schedule. The Miami International Airport Industrial Portfolio Mortgage Loan matures on February 1, 2019.
Following the lockout period, the borrowers have the right to defease the Miami International Airport Industrial Portfolio Mortgage Loan in whole, but not in part, on any date before November 1, 2018. In addition, the Miami International Airport Industrial Portfolio Mortgage Loan is prepayable without penalty on or after November 1, 2018.
THE INFORMATION IN THIS STRUCTURAL AND COLLATERAL TERM SHEET IS NOT COMPLETE AND MAY BE AMENDED PRIOR TO THE TIME OF SALE. THIS TERM SHEET IS NOT AN OFFER TO SELL THESE SECURITIES AND IT IS NOT A SOLICITATION OF AN OFFER TO BUY THESE SECURITIES IN ANY JURISDICTION WHERE THE OFFER OR SALE IS NOT PERMITTED.
70
| MIAMI INTERNATIONAL AIRPORT INDUSTRIAL PORTFOLIO |
Sources and Uses
| Sources | Uses | ||||||||
| Original loan amount | $48,500,000 | 87.6% | Loan payoff | $53,500,000 | 96.7% | ||||
| Sponsor’s new cash contribution | 6,838,725 | 12.4 | Reserves | 1,438,002 | 2.7 | ||||
| Closing costs | 400,723 | 0.7 | |||||||
| Total Sources | $55,338,725 | 100.0% | Total Uses | $55,338,725 | 100.0% |
| (1) | The Miami International Airport Industrial Portfolio Properties were previously securitized in MLCFC 2007-5. |
The Property. The Miami International Airport Industrial Portfolio Properties are comprised of two class B, mixed-use industrial and retail properties located in Miami, Florida, approximately one mile directly west of Miami International Airport. The Miami International Airport Industrial Portfolio Properties contain 11 single-story industrial and showroom buildings located in two industrial business parks approximately one-mile apart. In the aggregate, the Miami International Airport Industrial Portfolio Properties contain approximately 749,851 square feet.
Miami International Airport Industrial Center
The Miami International Airport Industrial Center property is situated on a 20.5-acre parcel and contains approximately 491,083 square feet (65.5% of total net rentable area) in eight industrial and showroom buildings constructed between 1984 and 1987. Approximately 364,050 square feet (74.1% of net rentable area at the Miami Airport Industrial Center property) is comprised of industrial and warehouse space and approximately 127,033 square feet (25.9% of net rentable area at the Miami Airport Industrial Center property) is comprised of retail/showroom space. The industrial and warehouse space is located at the rear of the showroom spaces and features a clear height of approximately 20 feet and 80 dock-high door spaces. The showroom spaces generally range from approximately 1,000 to 3,000 square feet, have frontage along 72nd Ave (a main thoroughfare in the area) and primarily feature an array of international electronics (mainly mobile phones, computers and cameras) wholesalers and retailers. The Miami Industrial Airport Center property was 88.5% occupied by 134 tenants as of December 31, 2013.
Milam Industrial Center
The Milam Industrial Center property is located one-mile north of the Miami International Airport Industrial Center property, is situated on a 9.2-acre parcel and contains approximately 258,768 square feet (34.5% of total net rentable area) in three industrial buildings constructed between 1977 and 1979. Most of the space (approximately 233,068 square feet, or 90.1% of the net rentable area at the Milam Industrial Center property) is comprised of light industrial and warehouse uses, with the remainder improved with a small amount of showroom space (25,700 square feet, or 9.9% of the net rentable area at the Milam Industrial Center property). The industrial and warehouse space features a clear height of approximately 20 feet and includes 14 dock-high door spaces and 26 drive-in door spaces. The tenancy at the Milam Industrial Center property is mainly comprised of small aviation storage, welders, fabricators and kitchen supply companies. The Milam Industrial Center property was 81.7% occupied by 57 tenants as of December 31, 2013.
The sponsor purchased the Miami International Airport Industrial Portfolio Properties for $67.3 million in 2007 and has invested approximately $3.4 million since the acquisition for a total cost basis of $70.7 million, resulting in $22.2 million of equity, ahead of the Miami International Airport Industrial Portfolio Mortgage Loan. The Miami International Airport Industrial Portfolio Properties’ monthly occupancy averaged 85.1% over the last six years, which include the recessionary period of 2008 - 2009, 86.5% since January 2010 and never dropped below 75.6% occupancy (May 2009). As of December 31, 2013, the Miami International Airport Industrial Portfolio Properties were 86.2% occupied by 191 tenants, with no tenant contributing more than 2.7% of the total annual underwritten base rent.
The following table presents certain information relating to the Miami International Airport Industrial Portfolio Properties:
| Property Name | NRSF | % of NRSF | Annual U/W Base Rent | % of Annual U/W Base Rent | Annual U/W Base Rent PSF(1) | Occupancy | Industrial SF | % of Industrial SF | Appraised Value | |||||||||
| Miami International Airport Center | 491,083 | 65.5% | $4,902,553 | 76.0% | $11.28 | 88.5% | 364,050 | 74.1% | $56,500,000 | |||||||||
| Milam Industrial Center | 258,768 | 34.5% | $1,551,673 | 24.0% | $7.33 | 81.7% | 233,068 | 90.1% | $18,400,000 | |||||||||
| Total/Weighted Average | 749,851 | 100.0% | $6,454,226 | 100.0% | $9.99 | 86.2% | 597,118 | 79.6% | $74,900,000 |
| (1) | Annual U/W Base Rent PSF excludes vacant space. |
THE INFORMATION IN THIS STRUCTURAL AND COLLATERAL TERM SHEET IS NOT COMPLETE AND MAY BE AMENDED PRIOR TO THE TIME OF SALE. THIS TERM SHEET IS NOT AN OFFER TO SELL THESE SECURITIES AND IT IS NOT A SOLICITATION OF AN OFFER TO BUY THESE SECURITIES IN ANY JURISDICTION WHERE THE OFFER OR SALE IS NOT PERMITTED.
71
| MIAMI INTERNATIONAL AIRPORT INDUSTRIAL PORTFOLIO |
The following table presents certain information relating to the tenancy at the Miami International Airport Industrial Portfolio Properties:
Major Tenants
| Tenant Name | Credit Rating(Fitch/Moody’s/ S&P) | Tenant NRSF | % of NRSF | Annual U/W Base Rent PSF(1) | Annual U/W Base Rent(1) | % of Total Annual U/W Base Rent | Lease Expiration Date | |
| Major Tenants | ||||||||
| Commodity Forwarders | NR/NR/NR | 19,400 | 2.6% | $8.84 | $171,496 | 2.7% | 5/31/2018 | |
| General MRO | NR/NR/NR | 15,600 | 2.1% | $7.88 | $122,922 | 1.9% | 12/31/2014 | |
| Techstar Electronics | NR/NR/NR | 8,300 | 1.1% | $14.42 | $119,692 | 1.9% | Various(2) | |
| Ezone 2.0 | NR/NR/NR | 13,159 | 1.8% | $7.02 | $92,376 | 1.4% | 6/30/2016 | |
| Organic Harvest | NR/NR/NR | 9,000 | 1.2% | $10.25 | $92,256 | 1.4% | 9/30/2018 | |
| Inphonex Com | NR/NR/NR | 6,500 | 0.9% | $14.15 | $91,944 | 1.4% | 8/31/2014 | |
| Flight Power | NR/NR/NR | 13,088 | 1.7% | $6.75 | $88,344 | 1.4% | 5/31/2014 | |
| Total Major Tenants | 85,047 | 11.3% | $9.16 | $779,030 | 12.1% | |||
| Non-Major Tenants | 560,981 | 74.8% | $10.11 | $5,675,196 | 87.9% | |||
| Occupied Collateral Total | 646,028 | 86.2% | $9.99 | $6,454,226 | 100.0% | |||
| Vacant Space | 103,823 | 13.8% | ||||||
| Collateral Total | 749,851 | 100.0% | ||||||
| (1) | Annual U/W Base Rent and Annual U/W Base Rent PSF include contractual rent steps through August 2014. |
| (2) | Techstar Electronics has two leases: 6,400 square feet (0.9% of total net rentable area) expiring on September 30, 2014, and 1,900 square feet (0.3% of total net rentable area) expiring on January 31, 2017. |
The following table presents certain information relating to the lease rollover schedule at the Miami International Airport Industrial Portfolio Properties:
Lease Expiration Schedule(1)(2)
Year Ending December 31, | No. of Leases Expiring | Expiring NRSF | % of Total NRSF | Cumulative Expiring NRSF | Cumulative % of Total NRSF | Annual U/W Base Rent | Annual U/W Base Rent PSF(3) |
| MTM | 1 | 3,800 | 0.5% | 3,800 | 0.5% | $24,516 | $6.45 |
| 2014 | 97 | 310,153 | 41.4% | 313,953 | 41.9% | $2,904,394 | $9.36 |
| 2015 | 61 | 195,152 | 26.0% | 509,105 | 67.9% | $2,102,244 | $10.77 |
| 2016 | 23 | 95,608 | 12.8% | 604,713 | 80.6% | $895,958 | $9.37 |
| 2017 | 1 | 1,900 | 0.3% | 606,613 | 80.9% | $41,800 | $22.00 |
| 2018 | 6 | 35,995 | 4.8% | 642,608 | 85.7% | $447,200 | $12.42 |
| 2019 | 1 | 1,520 | 0.2% | 644,128 | 85.9% | $38,114 | $25.08 |
| 2020 | 0 | 0 | 0.0% | 644,128 | 85.9% | $0 | $0.00 |
| 2021 | 0 | 0 | 0.0% | 644,128 | 85.9% | $0 | $0.00 |
| 2022 | 0 | 0 | 0.0% | 644,128 | 85.9% | $0 | $0.00 |
| 2023 | 0 | 0 | 0.0% | 644,128 | 85.9% | $0 | $0.00 |
| 2024 | 0 | 0 | 0.0% | 644,128 | 85.9% | $0 | $0.00 |
| Thereafter | 1 | 1,900(4) | 0.3% | 646,028 | 86.2% | $0 | $0.00 |
| Vacant | 0 | 103,823 | 13.8% | 749,851 | 100.0% | $0 | $0.00 |
| Total/Weighted Average | 191 | 749,851 | 100.0% | $6,454,226 | $9.99 |
| (1) | Information obtained from the underwritten rent roll. |
| (2) | Certain tenants may have lease termination options that are exercisable prior to the originally stated expiration date of the subject lease and that are not considered in the Lease Expiration Schedule. |
| (3) | Weighted Average Annual U/W Base Rent PSF excludes vacant space. |
(4) | Represents the property management office, for which no rent has been underwritten. |
THE INFORMATION IN THIS STRUCTURAL AND COLLATERAL TERM SHEET IS NOT COMPLETE AND MAY BE AMENDED PRIOR TO THE TIME OF SALE. THIS TERM SHEET IS NOT AN OFFER TO SELL THESE SECURITIES AND IT IS NOT A SOLICITATION OF AN OFFER TO BUY THESE SECURITIES IN ANY JURISDICTION WHERE THE OFFER OR SALE IS NOT PERMITTED.
72
| MIAMI INTERNATIONAL AIRPORT INDUSTRIAL PORTFOLIO |
The following table presents historical occupancy percentages at the Miami International Airport Industrial Portfolio Properties:
Historical Occupancy
12/31/2010(1) | 12/31/2011(1) | 12/31/2012(1) | 12/31/2013 | |||
| 85.4% | 86.1% | 87.6% | 86.2% | |||
(1) Information obtained from the borrowers. | ||||||
Operating History and Underwritten Net Cash Flow. The following table presents certain information relating to the historical operating performance and Underwritten Net Cash Flow at the Miami International Airport Industrial Portfolio Properties:
Cash Flow Analysis(1)
| 2011 | 2012 | TTM 10/31/2013 | U/W | U/W $ per SF | |||||||
| Base Rent | $6,206,146 | $6,024,849 | $5,971,429 | $6,454,226 | $8.61 | ||||||
| Grossed Up Vacant Space | 0 | 0 | 0 | 813,711 | 1.09 | ||||||
| Total Reimbursables | 8,803 | 9,805 | 10,815 | 0 | 0.00 | ||||||
| Other Income | 2,594 | 47,618 | 23,048 | 23,000 | 0.03 | ||||||
| Less Vacancy & Credit Loss | (97,566) | 0 | 0 | (872,152)(1) | (1.16) | ||||||
| Effective Gross Income | $6,119,977 | $6,082,272 | $6,005,292 | $6,418,785 | $8.56 | ||||||
| Total Operating Expenses | $1,877,749 | $1,578,112 | $1,841,125 | $1,906,307 | $2.54 | ||||||
| Net Operating Income | $4,242,228 | $4,504,160 | $4,164,167 | $4,512,478 | $6.02 | ||||||
| TI/LC | 0 | 0 | 0 | 272,197 | 0.36 | ||||||
| Capital Expenditures | 0 | 0 | 0 | 74,985(2) | 0.10 | ||||||
| Net Cash Flow | $4,242,228 | $4,504,160 | $4,164,167 | $4,165,296 | $5.55 | ||||||
| NOI DSCR | 1.50x | 1.59x | 1.47x | 1.60x | |||||||
| NCF DSCR | 1.50x | 1.59x | 1.47x | 1.47x | |||||||
| NOI DY | 8.7% | 9.3% | 8.6% | 9.3% | |||||||
| NCF DY | 8.7% | 9.3% | 8.6% | 8.6% | |||||||
| (1) | The underwritten economic vacancy is 12.0%. The Miami International Airport Industrial Portfolio Properties were 86.2% physically occupied as of December 31, 2013. |
| (2) | One-fifth of the upfront escrow for roof repairs ($240,000) was deducted from the underwritten capital expenditures. Inclusive of this number, underwritten capital expenditures would total $314,985 ($0.42 U/W $ per SF). |
Appraisal. As of the appraisal valuation date of November 21, 2013, the Miami International Airport Center property had an “as-is” appraised value of $56,500,000 and the Milam Industrial Center property had an “as-is” appraised value of $18,400,000, resulting in a combined appraised value of $74,900,000.
Environmental Matters. According to the Phase I environmental assessment dated December 6, 2013, there was no evidence of any recognized environmental conditions at the Miami International Airport Industrial Portfolio Properties.
Market Overview and Competition. The Miami International Airport Industrial Portfolio Properties are located along 72nd Avenue in Miami, Florida, approximately one-mile west of Miami International Airport and 7.5 miles west of the Miami central business district. Miami International Airport encompasses over 10 square miles and is the fourth largest airport in the United States in terms of total passengers and total cargo, second in terms of international travel and first in international cargo. Total passenger traffic as of year-end 2012 totaled more than 39.4 million passengers, the highest level ever recorded. International traffic also increased 5.2% in 2012. Furthermore, an underground cargo tunnel was constructed from the east terminal to the western cargo areas, cutting down the average time it takes to transport cargo from 45 to 15 minutes. Miami-Dade County has long served as the “Gateway to Latin America”, and as such, the region and more importantly the Miami International Airport has become a hub of international travel, commerce and finance.
The Miami International Airport Industrial Portfolio Properties have both regional access and local access. Regional access is provided by Highway 826 (Palmetto Expressway), Highway 821 (Florida Turnpike) and Highway 836 (Dolphin Expressway), all within 10 miles of the Miami International Airport Industrial Portfolio Properties. Local access is provided by NW 72nd Avenue, NW 36th Street and NW 25th Street.
According to a third party market research report, the Miami-Dade County industrial market is one of the largest in the United States. The Miami-Dade County industrial market contains approximately 229.0 million square feet in twelve different submarkets. During the third quarter of 2013, 1.4 million square feet was absorbed in the Miami-Dade County industrial market and over 2.5 million square feet has been absorbed year-to-date. Overall vacancy decreased to 6.1%, down from 6.7% in the first quarter of 2013. The Miami International Airport Industrial Portfolio Properties are located within the Miami Airport industrial submarket, the largest submarket in the Miami-Dade County industrial market, totaling 75.6 million square feet and accounting for approximately 33.0% of the overall market inventory. The Miami Airport industrial submarket exhibits a vacancy rate of 6.3% with a weighted average asking rent of $9.01 per square foot on a gross basis. The Miami International Airport Industrial Portfolio Properties are located in the Miami Airport East class B micro-market, which has a total inventory of 7.1 million square feet, has an average 12.5% vacancy rate over the past three years and exhibits a current vacancy rate of 8.7% as of the third quarter of 2013.
THE INFORMATION IN THIS STRUCTURAL AND COLLATERAL TERM SHEET IS NOT COMPLETE AND MAY BE AMENDED PRIOR TO THE TIME OF SALE. THIS TERM SHEET IS NOT AN OFFER TO SELL THESE SECURITIES AND IT IS NOT A SOLICITATION OF AN OFFER TO BUY THESE SECURITIES IN ANY JURISDICTION WHERE THE OFFER OR SALE IS NOT PERMITTED.
73
| MIAMI INTERNATIONAL AIRPORT INDUSTRIAL PORTFOLIO |
The following table presents certain information relating to comparable industrial properties for the Miami International Airport Industrial Portfolio Properties:
Competitive Set(1)
Miami International Airport Industrial Portfolio (Subject) | MICC Center 12 | MICC Center 10 | MICC Center 5 | International Corporate Park | Prologis Palmetto Tradeport | |
| Location | Miami, FL | Miami, FL | Miami, FL | Miami, FL | Doral, FL | Miami, FL |
Distance from Subject(2) | -- | 2.0 miles | 1.9 miles | 2.0 miles | 3.7 miles | 5.2 miles |
| Property Type | Industrial | Industrial | Industrial | Industrial | Industrial | Industrial |
| Year Built/Renovated | 1977/NAP | 1985/NAV | 1971/NAV | 1981/NAV | 2002/NAV | 1990/NAV |
| Clear Height | 20´ | 16´-20´ | 20´-24´ | 20´-22´ | NAV | 24´ |
| Dock-High Doors | 94 | 6 | 59 | 23 | 5 | 36 |
| Total GLA | 749,851 SF | 111,100 SF | 112,766 SF | 144,000 SF | 70,713 SF | 303,400 SF |
| Total Occupancy | 86% | 95% | 94% | 96% | 100.0% | 84% |
| (1) | Information obtained from the appraisal dated November 21, 2013. |
| (2) | Distances are based on the distance from the Miami International Airport Center property. |
The Borrowers. The borrowers are comprised of six separate limited liability companies as tenants-in-common, each of which is a single purpose entity (collectively, the “Miami International Airport Industrial Portfolio Borrower”). Legal counsel to the Miami International Airport Industrial Portfolio Borrower delivered a non-consolidation opinion in connection with the origination of the Miami International Airport Industrial Portfolio Mortgage Loan. Francis Greenburger is the guarantor of certain nonrecourse carveouts under the Miami International Airport Industrial Portfolio Mortgage Loan.
The Sponsor. The loan sponsor is Francis Greenburger, the founder, chairman and CEO of Time Equities, Inc. (“TEI”). TEI is a privately held, full service real estate firm involved in the acquisition, development, conversion and management of commercial and residential properties throughout the United States, Canada and Germany. Founded in 1968, TEI owns a diverse portfolio of over 180 commercial and residential properties totaling approximately 17.8 million square feet, including 7.5 million square feet of office space, 3.3 million square feet of industrial space and 3.0 million square feet of retail space. Francis Greenburger has been involved in numerous defaults, deeds-in-lieu of foreclosure, restructurings and one partnership bankruptcy dating back to the savings and loan crisis in the 1990’s. Further, Mr. Greenburger has been and is the subject of certain litigation. See “Description of the Mortgage Pool – Default History, Bankruptcy Issues and Other Proceedings” and “Description of the Mortgage Pool – Litigation Considerations” in the Free Writing Prospectus for further detail.
Escrows. The loan documents provide for upfront escrows in the amount of $238,002 for real estate taxes and $1,200,000 for roof repairs. The roof repairs must be completed within three years of origination of the Miami International Airport Industrial Portfolio Mortgage Loan. The loan documents also provide for ongoing monthly escrow deposits of $59,501 for real estate taxes, $6,249 for replacement reserves, subject to a cap of $224,995 and $20,833 for tenant improvements and leasing commissions, subject to a cap of $750,000. The loan documents do not require monthly escrows for insurance provided (i) no event of default has occurred and is continuing; (ii) the insurance required to be maintained by the borrower is maintained pursuant to one or more blanket policies; and (iii) the borrower provides the lender with timely proof of payment of insurance premiums.
Lockbox and Cash Management. The Miami International Airport Industrial Portfolio Mortgage Loan requires a lender-controlled lockbox account, which is already in place, and that all rents received by the borrower or the property manager be deposited into the lockbox account within one business day of receipt. Prior to the occurrence of a Cash Trap Event Period (as defined below), all funds on deposit in the lockbox account are swept into the borrower’s operating account on a daily basis. During a Cash Trap Event Period, all excess cash flow is swept on a monthly basis to a cash management account controlled by the lender.
A “Cash Trap Event Period” will commence upon the earlier of (i) the occurrence and continuance of an event of default and (ii) the debt service coverage ratio falling below 1.25x for two consecutive calendar quarters. A Cash Trap Event Period will end, with regard to the circumstances in clause (i), upon the cure of such event of default and with regard to the circumstances in clause (ii), upon the debt service coverage ratio being equal to or greater than 1.30x for two consecutive calendar quarters.
Property Management. The Miami International Airport Industrial Portfolio Properties are managed by Americas Property Management Corp., a subsidiary of Americas Industrial Realty Corporation (collectively, “Americas Industrial”). Americas Industrial exclusively represents 23 business parks for lease with industrial space totaling over 8.0 million square feet in the Miami area. Americas Industrial has been ranked among “Miami’s Top Brokerage Firms” by a third party market research firm, based on sale and leasing transaction volume, and was also recognized by a news publication as one of the “Top 10” industrial real estate firms in Miami.
Assumption. The borrower has a two-time right to transfer the Miami International Airport Industrial Portfolio Properties, provided that no event of default has occurred and is continuing and certain other conditions are satisfied, including (i) the lender’s reasonable determination that the proposed transferee and guarantor satisfy the lender’s credit review and underwriting standards, taking into consideration transferee’s experience, financial strength and general business standing; (ii) execution of a recourse guaranty and an environmental indemnity by an affiliate of the transferee; and (iii) if requested by the lender, rating agency confirmation from DBRS, Fitch and Moody’s that the transfer will not result in a downgrade, withdrawal or qualification of the respective ratings assigned to the Series 2014-LC14 Certificates.
THE INFORMATION IN THIS STRUCTURAL AND COLLATERAL TERM SHEET IS NOT COMPLETE AND MAY BE AMENDED PRIOR TO THE TIME OF SALE. THIS TERM SHEET IS NOT AN OFFER TO SELL THESE SECURITIES AND IT IS NOT A SOLICITATION OF AN OFFER TO BUY THESE SECURITIES IN ANY JURISDICTION WHERE THE OFFER OR SALE IS NOT PERMITTED.
74
| MIAMI INTERNATIONAL AIRPORT INDUSTRIAL PORTFOLIO |
Partial Release. Not permitted.
Real Estate Substitution. Not permitted.
Subordinate and Mezzanine Indebtedness. Not permitted.
Other Indebtedness. The Miami International Airport Industrial Portfolio Borrower has incurred $6,000,000 of unsecured subordinate debt provided by an affiliate of the sponsor. The unsecured subordinate debt accrues interest at an interest rate of 7.000% per annum and is payable from excess cash flow after all property expenses, reserves and debt service payments have been made under the Miami International Airport Industrial Portfolio Mortgage Loan. A subordination and standstill agreement was obtained from the related sponsor.
Ground Lease. None.
Terrorism Insurance. The loan documents require that the “all risk” insurance policy required to be maintained by the borrowers provide coverage for terrorism in an amount equal to the full replacement cost of the Miami International Airport Industrial Portfolio Properties. The loan documents also require business interruption insurance covering no less than the 18-month period following the occurrence of a casualty event, together with a six-month extended period of indemnity.
Windstorm Insurance. The loan documents require windstorm insurance covering the full replacement cost of the Miami International Airport Industrial Portfolio Properties during the loan term. At the time of closing, the Miami International Airport Industrial Portfolio Properties had windstorm insurance coverage in place.
THE INFORMATION IN THIS STRUCTURAL AND COLLATERAL TERM SHEET IS NOT COMPLETE AND MAY BE AMENDED PRIOR TO THE TIME OF SALE. THIS TERM SHEET IS NOT AN OFFER TO SELL THESE SECURITIES AND IT IS NOT A SOLICITATION OF AN OFFER TO BUY THESE SECURITIES IN ANY JURISDICTION WHERE THE OFFER OR SALE IS NOT PERMITTED.
75
(THIS PAGE INTENTIONALLY LEFT BLANK)
76
| WILLIAMS CENTER TOWERS |
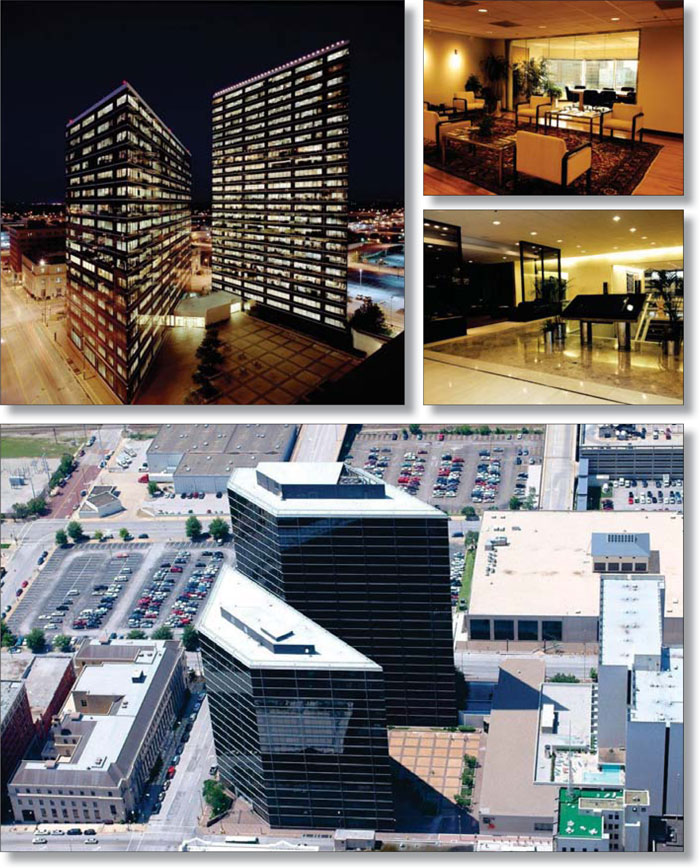
THE INFORMATION IN THIS STRUCTURAL AND COLLATERAL TERM SHEET IS NOT COMPLETE AND MAY BE AMENDED PRIOR TO THE TIME OF SALE. THIS TERM SHEET IS NOT AN OFFER TO SELL THESE SECURITIES AND IT IS NOT A SOLICITATION OF AN OFFER TO BUY THESE SECURITIES IN ANY JURISDICTION WHERE THE OFFER OR SALE IS NOT PERMITTED.
77
| WILLIAMS CENTER TOWERS |
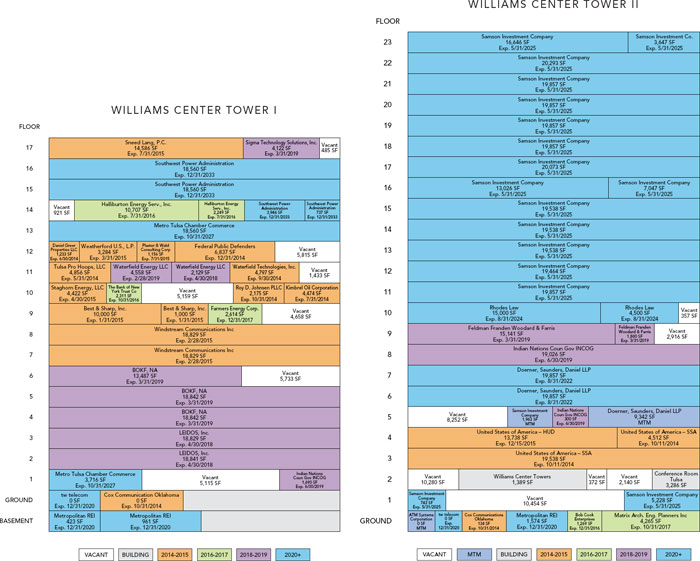
THE INFORMATION IN THIS STRUCTURAL AND COLLATERAL TERM SHEET IS NOT COMPLETE AND MAY BE AMENDED PRIOR TO THE TIME OF SALE. THIS TERM SHEET IS NOT AN OFFER TO SELL THESE SECURITIES AND IT IS NOT A SOLICITATION OF AN OFFER TO BUY THESE SECURITIES IN ANY JURISDICTION WHERE THE OFFER OR SALE IS NOT PERMITTED.
78
| WILLIAMS CENTER TOWERS |
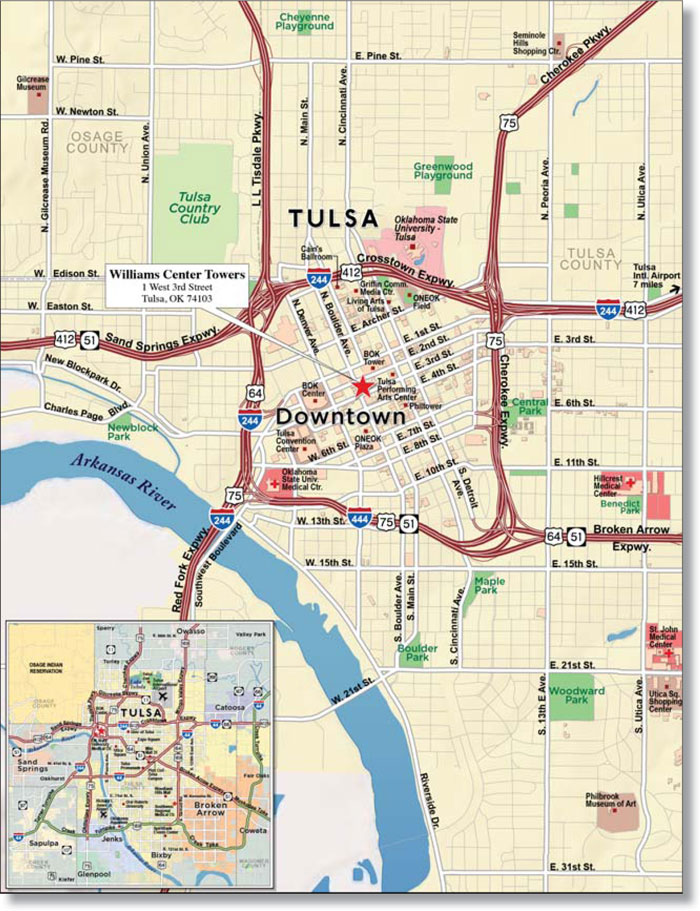
THE INFORMATION IN THIS STRUCTURAL AND COLLATERAL TERM SHEET IS NOT COMPLETE AND MAY BE AMENDED PRIOR TO THE TIME OF SALE. THIS TERM SHEET IS NOT AN OFFER TO SELL THESE SECURITIES AND IT IS NOT A SOLICITATION OF AN OFFER TO BUY THESE SECURITIES IN ANY JURISDICTION WHERE THE OFFER OR SALE IS NOT PERMITTED.
79
Loan Information | Property Information | ||||||
| Mortgage Loan Seller: | Rialto Mortgage Finance, LLC | Single Asset/Portfolio: | Single Asset | ||||
Credit Assessment (DBRS/Fitch/Moody’s): | NR/NR/NR | Property Type: | Office | ||||
| Original Principal Balance: | Specific Property Type: | ||||||
| Cut-off Date Principal Balance: | Location: | ||||||
| % of Initial Pool Balance: | 3.6% | Size: | |||||
| Loan Purpose: | Cut-off Date Principal Balance Per SF: | ||||||
| Borrower Names: | Year Built/Renovated: | ||||||
| Sponsors: | Haim Revah; Isaac Oved; Faraj Srour | Title Vesting: | |||||
| Mortgage Rate: | 5.160% | Property Manager: | |||||
| Note Date: | 3rd Most Recent Occupancy (As of): | ||||||
| Anticipated Repayment Date: | NAP | 2nd Most Recent Occupancy (As of): | |||||
| Maturity Date: | February 6, 2024 | Most Recent Occupancy (As of): | |||||
| IO Period: | Current Occupancy (As of)(3): | ||||||
| Loan Term (Original): | |||||||
| Seasoning: | Underwriting and Financial Information: | ||||||
| Amortization Term (Original): | |||||||
| Loan Amortization Type: | 3rd Most Recent NOI (As of): | ||||||
| Interest Accrual Method: | 2nd Most Recent NOI (As of): | ||||||
| Call Protection: | Most Recent NOI (As of)(4): | ||||||
| Lockbox Type: | |||||||
Additional Debt(1): | Yes | U/W Revenues: | |||||
Additional Debt Type(1): | Future Mezzanine | U/W Expenses: | |||||
U/W NOI(4): | |||||||
U/W NCF(4): | |||||||
Escrows and Reserves(2): | U/W NOI DSCR: | ||||||
| U/W NCF DSCR: | |||||||
Type: | Initial | Monthly | Cap (If Any) | U/W NOI Debt Yield: | |||
| Taxes | $155,683 | $49,423 | NAP | U/W NCF Debt Yield: | |||
| Insurance | $185,452 | $15,454 | NAP | As-Is Appraised Value: | |||
| Replacement Reserves | $0 | $12,763 | NAP | As-Is Appraisal Valuation Date: | |||
| TI/LC Reserve | $7,500,000 | $47,863 | $2,000,000 | Cut-off Date LTV Ratio: | |||
| Rent Abatement Reserve | $822,054 | $0 | NAP | LTV Ratio at Maturity or ARD: | |||
| (1) | See “Subordinate and Mezzanine Indebtedness” section. |
| (2) | See “Escrows” section. |
| (3) | See “Historical Occupancy” section. |
| (4) | See “Cash Flow Analysis” section. |
The Mortgage Loan. The mortgage loan (the “Williams Center Towers Mortgage Loan”) is evidenced by a single promissory note that is secured by a first mortgage encumbering an office building comprised of two towers located in the central business district of Tulsa, Oklahoma (the “Williams Center Towers Property”). The Williams Center Towers Mortgage Loan was originated on January 16, 2014 by Rialto Mortgage Finance, LLC. The Williams Center Towers Mortgage Loan had an original principal balance of $45,500,000, has an outstanding principal balance as of the Cut-off Date of $45,500,000 and accrues interest at an interest rate of 5.160% per annum. The Williams Center Towers Mortgage Loan had an initial term of 120 months, has a remaining term of 120 months as of the Cut-off Date and requires interest-only payments for the first 38 payments following origination and, thereafter, requires payments of principal and interest based on a 30-year amortization schedule. The Williams Center Towers Mortgage Loan matures on February 6, 2024.
Following the lockout period, the borrowers have the right to defease the Williams Center Towers Mortgage Loan in whole, but not in part, on any due date before November 6, 2023. In addition, the Williams Center Towers Mortgage Loan is prepayable without penalty on or after November 6, 2023.
THE INFORMATION IN THIS STRUCTURAL AND COLLATERAL TERM SHEET IS NOT COMPLETE AND MAY BE AMENDED PRIOR TO THE TIME OF SALE. THIS TERM SHEET IS NOT AN OFFER TO SELL THESE SECURITIES AND IT IS NOT A SOLICITATION OF AN OFFER TO BUY THESE SECURITIES IN ANY JURISDICTION WHERE THE OFFER OR SALE IS NOT PERMITTED.
80
| WILLIAMS CENTER TOWERS |
Sources and Uses
| Sources | Uses | ||||||||
| Original loan amount | $45,500,000 | Loan payoff | % | ||||||
| 8,663,189 | 19.0 | ||||||||
| 602,939 | 1.3 | ||||||||
| 1,298,629 | 2.9 | ||||||||
| Total Sources | $45,500,000 | 100.0% | Total Uses | $45,500,000 | 100.0 | % |
The Property. The Williams Center Towers Property is comprised of two interconnected class A office towers totaling approximately 765,809 square feet located on a 1.94 acre site in the central business district of Tulsa, Oklahoma. Built in 1981 and renovated in 2005, the Williams Center Towers Property consists of a 455,328 square foot, 23-story office tower with average rentable floor sizes of 19,797 square feet and a 310,481 square foot, 17-story office tower with average rentable floor sizes of 18,264 square feet. The Williams Center Towers Property occupies the entire eastern blockfront of South Boulder Avenue between West Second Street and West Third Street. Amenities include a 289-space executive subterranean parking garage (resulting in a parking ratio of 0.4 spaces per 1,000 net rentable square feet), 24-hour security, car wash, convenience store, conference facility and underground tunnel access to neighboring buildings. Supplemental parking is provided by a public parking garage located directly across the street with 1,190 spaces. As of November 12, 2013, the Williams Center Towers Property was 91.6% leased to 34 tenants.
The following table presents certain information relating to the tenancy at the Williams Center Towers Property:
Major Tenants
| Tenant Name | Credit Rating(Fitch/Moody’s/ S&P)(1) | Tenant NRSF | % of NRSF | Annual U/W Base Rent PSF(2) | Annual U/W Base Rent(2) | % of Total Annual U/W Base Rent | Lease Expiration Date |
| Major Tenants | |||||||
| Samson Investment Company | NR/B1/B | 266,029 | 34.7% | $14.66 | $3,898,899 | 38.9% | |
| BOKF, NA | A/A2/A- | 51,171 | 6.7% | $15.00 | $767,565(4) | 7.7% | |
| Southwest Power Administration | AAA/Aaa/AA+ | 41,803 | 5.5% | $16.45 | $687,655(5) | 6.9% | |
| Windstream Communications Inc | BB+/Ba3/BB- | 37,658 | 4.9% | $14.50 | $546,041 | 5.4% | |
| Doerner, Saunders, Daniel LLP | NR/NR/NR | 49,056 | 6.4% | $10.69 | $524,451 | 5.2% | 8/31/2022(6) |
| Total Major Tenants | 445,717 | 58.2% | $14.41 | $6,424,612 | 64.1% | ||
| Non-Major Tenants | 256,002 | 33.4% | $14.06 | $3,600,652 | 35.9% | ||
| Occupied Collateral Total | 100.0% | ||||||
| Vacant Space | |||||||
| Collateral Total | 100.0% | ||||||
| (1) | Certain ratings are those of the parent company whether or not the parent guarantees the lease. |
| (3) | Samson Investment Company (“Samson”) currently leases thirteen full floors and three additional suites at one tower of the Williams Center Towers Property. Samson may terminate up to four full floors of its leased area (each floor is approximately 20,000 square feet and 2.6% of the net rentable area) at any time after October 31, 2014, provided: (i) Samson terminates only one floor per termination; (ii) there is at least 12 months between any subsequent or previous termination; and (iii) Samson pays any unamortized construction costs or leasing commissions for the terminated space. |
| (4) | BOKF, NA has five months of rent abatement ending April 2014. $94,210 was reserved at closing for the remaining rent abatement. BOKF, NA may terminate its lease on November 30, 2016 with at least 180 days’ prior written notice and payment of a termination fee equal to the sum of five months’ base rent plus unamortized tenant improvements and leasing commissions. |
| (5) | Southwest Power Administration has the right to terminate its lease on any date after December 31, 2023 with not less than 90 days’ prior written notice. |
| (6) | Doerner, Saunders, Daniel LLP (“Doerner”) receives a rent abatement every six months during its lease term representing 11 months of free rent at the applicable rental rate for its office space. $438,389 was reserved at closing for the ongoing rent abatement. Doerner has a one-time right to terminate its lease on August 31, 2017, provided: (i) Doerner delivers written notice on or before February 28, 2017; (ii) Doerner is not in default under its lease; and (iii) Doerner pays a termination fee equal to the sum of six months of rent payable immediately prior to the termination date plus the unamortized portion of any tenant allowances and leasing commissions. |
| (7) | Current Occupancy includes two tenants (3.1% of the net rentable area and 3.1% of the Annual U/W Base Rent) that have executed leases, but are not in occupancy. One tenant, Rhodes Law (2.5% of the net rentable area and 2.5% of Annual U/W Base Rent), is expected to open during the second quarter of 2014 and the other tenant, Sigma Technology Solutions, Inc. (0.5% of the net rentable area and 0.6% of Annual U/W Base Rent) is expected to open during the second quarter of 2014. See “Escrows” section for reserve detail on tenants not yet in occupancy. Excluding these tenants, Current Occupancy is 88.5%. |
THE INFORMATION IN THIS STRUCTURAL AND COLLATERAL TERM SHEET IS NOT COMPLETE AND MAY BE AMENDED PRIOR TO THE TIME OF SALE. THIS TERM SHEET IS NOT AN OFFER TO SELL THESE SECURITIES AND IT IS NOT A SOLICITATION OF AN OFFER TO BUY THESE SECURITIES IN ANY JURISDICTION WHERE THE OFFER OR SALE IS NOT PERMITTED.
81
| WILLIAMS CENTER TOWERS |
The following table presents certain information relating to the lease rollover schedule at the Williams Center Towers Property:
Lease Expiration Schedule(1)(2)
Year Ending December 31, | No. of Leases Expiring | Expiring NRSF | % of Total NRSF | Cumulative Expiring NRSF | Cumulative % of Total NRSF | Annual U/W Base Rent | Annual U/W Base Rent PSF(3) | |||||
| MTM | ||||||||||||
| 0 | 349,399 | 45.6% | $0 | $0.00 | ||||||||
| 368,899 | ||||||||||||
Thereafter(4) | 332,820 | 43.5% | 701,719 | $14.76 | ||||||||
| Vacant | 0 | $0 | $0.00 | |||||||||
| Total/Weighted Average | 75 | 765,809 | 100.0% | |||||||||
| (1) | Information obtained from the underwritten rent roll. |
| (2) | Certain tenants may have lease termination options that are exercisable prior to the stated expiration date of the subject lease and that are not considered in the Lease Expiration Schedule. |
| (3) | Weighted Average Annual U/W Base Rent PSF excludes vacant space. |
| (4) | Thereafter includes various spaces totaling 4,675 square feet used by building management that has no related rent. |
The following table presents historical occupancy percentages at the Williams Center Towers Property:
Historical Occupancy
| (1) | Information obtained from the borrowers. |
| (2) | The increase in occupancy from December 31, 2012 to as of November 12, 2013 is due to new leases executed, including BOKF, NA (6.7% of net rentable area and 7.7% of total underwritten base rent), Rhodes Law (2.5% of net rentable area and 2.5% of total underwritten base rent), Waterfield Energy LLC (0.9% of net rentable area and 1.0% of total underwritten base rent), Sigma Technology Solutions, Inc. (0.5% of net rentable area and 0.6% of total underwritten base rent), and Daniels Greer Properties LLC (0.2% of net rentable area and 0.1% of total underwritten base rent). In combination these tenants account for a total of 10.8% of net rentable area and 11.9% of total underwritten base rent. |
| (3) | Current Occupancy includes two tenants (3.1% of the net rentable area and 3.1% of the Annual U/W Base Rent) that have executed leases, but are not in occupancy. One tenant, Rhodes Law (2.5% of the net rentable area and 2.5% of Annual U/W Base Rent), is expected to open during the second quarter of 2014 and the other tenant, Sigma Technology Solutions, Inc. (0.5% of the net rentable area and 0.6% of Annual U/W Base Rent) is expected to open during the second quarter of 2014. See “Escrows” section for reserves relating to tenants not in occupancy. Excluding these tenants, Current Occupancy is 88.5%. |
THE INFORMATION IN THIS STRUCTURAL AND COLLATERAL TERM SHEET IS NOT COMPLETE AND MAY BE AMENDED PRIOR TO THE TIME OF SALE. THIS TERM SHEET IS NOT AN OFFER TO SELL THESE SECURITIES AND IT IS NOT A SOLICITATION OF AN OFFER TO BUY THESE SECURITIES IN ANY JURISDICTION WHERE THE OFFER OR SALE IS NOT PERMITTED.
82
| WILLIAMS CENTER TOWERS |
Operating History and Underwritten Net Cash Flow. The following table presents certain information relating to the historical operating performance and Underwritten Net Cash Flow at the Williams Center Towers Property:
Cash Flow Analysis
| TTM 9/30/2013 | U/W(1) | U/W $ per SF | ||||||||
| Base Rent | $8,130,413 | |||||||||
| Rent Steps | 0 | |||||||||
| Grossed Up Vacant Space | 0 | |||||||||
| Total Reimbursables | 496,293 | |||||||||
| Other Income | 246,293 | |||||||||
| Less Vacancy & Credit Loss | 0 | |||||||||
| Effective Gross Income | $8,872,999 | |||||||||
| Total Operating Expenses | $5,709,941 | |||||||||
| Net Operating Income | $3,163,058 | |||||||||
| TI/LC | 0 | 416,084 | ||||||||
| Capital Expenditures | 0 | |||||||||
| Net Cash Flow | $3,163,058 | |||||||||
| NOI DSCR | 1.06x | |||||||||
| NCF DSCR | 1.06x | |||||||||
| NOI DY | 7.0% | |||||||||
| NCF DY | 7.0% |
| (1) | The increase in Net Operating Income from year end 2012 to the TTM 9/30/2013 and U/W is due to new leases executed, including BOKF, NA (6.7% of net rentable area and 7.7% of total underwritten base rent), Rhodes Law (2.5% of net rentable area and 2.5% of total underwritten base rent), Waterfield Energy LLC (0.9% of net rentable area and 1.0% of total underwritten base rent), Sigma Technology Solutions, Inc. (0.5% of net rentable area and 0.6% of total underwritten base rent), and Daniels Greer Properties LLC (0.2% of net rentable area and 0.1% of total underwritten base rent). In combination these tenants account for a total of 10.8% of net rentable area and 11.9% of total underwritten base rent. |
| (2) | The underwritten economic vacancy is 8.6%. The Williams Center Towers Property was 91.6% physically leased as of November 12, 2013. |
Appraisal. As of the appraisal valuation date of December 16, 2013, the Williams Center Towers Property had an “as-is” appraised value of $63,000,000.
Environmental Matters. According to a Phase I environmental assessment dated December 11, 2013, there was no evidence of any recognized environmental conditions and the only recommendation was the implementation of an operations and maintenance plan for asbestos, which is already in place.
Market Overview and Competition. The Williams Center Towers Property is located in downtown Tulsa, Oklahoma, within the Tulsa metropolitan statistical area. According to the appraisal, the Tulsa metropolitan statistical area is the second-largest in Oklahoma with a population of 949,826 as of 2012. Despite the oil industry historically dominating Tulsa’s economy, today Tulsa enjoys a diverse economy with aerospace and finance playing larger roles. According to the appraisal, an American Airlines maintenance base at Tulsa International Airport, located approximately eight miles northeast from the Williams Center Towers Property, is the city’s largest employer, and BOK Financial Corporation, a $28.0 billion regional financial services company, is headquartered in the city. The Williams Center Towers Property is proximate to a number of cultural, business and social amenities in the downtown area, including the Tulsa Performing Arts Center, the Tulsa Convention Center, and the BOK Center. Further, the Williams Center Towers Property is connected with numerous other downtown buildings through a network of tunnels and skybridges, including the Hyatt Regency hotel, BOK Tower, the Tulsa Performing Arts Center, Kennedy Building, Philtower and parking garages. As of year-end 2012, the unemployment rate for the Tulsa metropolitan statistical area was 5.2%, compared to the United States unemployment rate of 8.1%. According to the appraisal, the estimated 2013 population within a one-, three-, and five-mile radius was 7,441, 69,892, and 153,635, respectively. The estimated 2013 average household income within a one-, three-, and five-mile radius was $52,598, $55,503, and $54,082, respectively.
According to the appraisal, the Williams Center Towers Property is located within the central business district office submarket, which as of 2012 contains approximately 12.8 million square feet of office space, approximately 25.8% of the Tulsa office market inventory. According to a market research report, as of the third quarter of 2013, the central business district office submarket contains approximately 4.4 million square feet of class A space and the submarket vacancy was approximately 11.8% with quoted rental rates of $14.66 per square foot (full service gross).
THE INFORMATION IN THIS STRUCTURAL AND COLLATERAL TERM SHEET IS NOT COMPLETE AND MAY BE AMENDED PRIOR TO THE TIME OF SALE. THIS TERM SHEET IS NOT AN OFFER TO SELL THESE SECURITIES AND IT IS NOT A SOLICITATION OF AN OFFER TO BUY THESE SECURITIES IN ANY JURISDICTION WHERE THE OFFER OR SALE IS NOT PERMITTED.
83
| WILLIAMS CENTER TOWERS |
The following table presents certain information relating to comparable office properties for the Williams Center Towers Property:
Competitive Set(1)
Williams Center Towers (Subject) | Bank of America Tower | Exchange National Bank | Kennedy Building | Mid-Continent Tower | |
| Location | Tulsa, OK | Tulsa, OK | Tulsa, OK | Tulsa, OK | Tulsa, OK |
| Distance from Subject | -- | 0.3 miles | 0.1 miles | 0.2 miles | 0.2 miles |
| Property Type | Office | Office | Office | Office | Office |
| Year Built/Renovated | 1981/2005 | 1968/NAV | 1917/NAV | 1918/NAV | 1918/1984 |
| Number of Stories | 17, 23 | NAV | NAV | NAV | NAV |
| Total NRA | 765,809 SF | 453,673 SF | 400,000 SF | 174,473 SF | 331,400 SF |
| Total Occupancy | 92% | 96% | 78% | 81% | 91% |
| (1) | Information obtained from the appraisal.. |
The Borrowers. The borrowers are Metropolitan Tulsa Investments LLC, Mercury Tulsa LLC and Lancaster Tulsa LLC, each a single purpose entity, and each with two independent directors. The borrowers own the Williams Center Towers Property as tenants in common, each owning a 33 1/3% undivided interest in the Williams Center Towers Property. Legal counsel to the borrowers delivered a non-consolidation opinion in connection with the origination of the Williams Center Towers Mortgage Loan. Haim Revah, a 90% indirect owner of Metropolitan Tulsa Investments, LLC, Isaac Oved, a 25% indirect owner of Mercury Tulsa, LLC, and Faraj Srour, a 50% indirect owner of Lancaster Tulsa LLC, are the guarantors of certain nonrecourse carveouts under the Williams Center Towers Mortgage Loan.
The Sponsors. The sponsors are Haim Revah, Isaac Oved and Faraj Srour. Haim Revah is a co-founder of Metropolitan Real Estate. Metropolitan Real Estate focuses on acquiring class A office buildings in select cities. Isaac Oved is the president of the Oved Group, a multi-faceted family operated business with an apparel division and a real estate division known as Oved Realty. Over the past 20 years Oved Realty has acquired, developed and managed a portfolio of properties in New York City and across the United States, and currently owns approximately eight million square feet and manages over one million square feet of commercial real estate. Faraj Srour currently holds interests in a diverse array of real estate assets including over four million square feet of office space in large cities including Chicago, New York City and Dallas, along with twelve retail or mixed-use buildings in New York City and New Jersey. Metropolitan Real Estate Investors (an entity affiliated with Haim Revah) was involved in defaulted loans, workout negotiations and a prepackaged bankruptcy (reorganization plan). See “Description of the Mortgage Pool – Default History, Bankruptcy Issues and Other Proceedings” in the Free Writing Prospectus.
Escrows. The loan documents provide for upfront reserves in the amount of $155,683 for real estate taxes; $185,452 for insurance; $7,500,000 for tenant improvements and leasing commissions; and $822,054 for certain rent abatements due to BOKF, NA, Doerner, Saunders, Daniel, LLP, Waterfield Energy LLC, Sigma Technology Solutions, Inc and Rhodes Law. The loan documents also provide for ongoing monthly reserves in the amount of $49,423 for taxes; $15,454 for insurance; $12,763 for replacement reserves; and $47,863 for tenant improvements and leasing commissions (subject to a cap of $2,000,000).
Lockbox and Cash Management. The Williams Center Towers Mortgage Loan requires a lender-controlled lockbox account, which is already in place, and that the borrowers direct tenants to pay their rents directly to such lockbox account. The loan documents also require that all cash revenues and all other monies received by the borrowers or the property manager relating to the Williams Center Towers Property be deposited into the lockbox account within one business day of receipt. Prior to the occurrence of a Cash Management Trigger Event Period (as defined below), all amounts on deposit in the lockbox account are swept on a daily basis into the borrowers’ operating account. Upon the occurrence of a Cash Management Trigger Event Period, all amounts on deposit in the lockbox account are swept on a daily basis into a lender-controlled cash management account. Upon the occurrence of a Cash Sweep Event Period (as defined below), all excess funds on deposit in the cash management account will be swept into lender controlled accounts and held as additional collateral for the Williams Center Towers Mortgage Loan.
A “Cash Management Trigger Event Period” will commence (i) if an event of default has occurred or is continuing, (ii) upon the occurrence of a bankruptcy action of any of the borrowers, the guarantors or the property manager, (iii) if the debt service coverage ratio is less than 1.20x, (iv) upon the existence of a mezzanine loan or (v) upon the occurrence of a Critical Tenant Trigger Event (as defined below). A Cash Management Trigger Event Period will end, in the case of a trigger under clause (i) above, the cure of such event of default, in the case of a trigger under clause (ii) above, the discharge of such bankruptcy, in the case of a trigger under clause (iii) above, the debt service coverage ratio being at least 1.20x for two consecutive calendar quarters, in the case of a trigger under clause (iv) above, the repayment in full of such mezzanine loan, and in the case of a trigger under clause (v) above, such Critical Tenant Trigger Event having been cured.
A “Cash Sweep Event Period” will commence (i) if an event of default has occurred or is continuing, (ii) upon the occurrence of a bankruptcy action of any of the borrowers, the guarantors or the property manager, (iii) if the debt service coverage ratio is less than 1.10x, (iv) upon the occurrence of a default under any mezzanine loan and (v) upon the occurrence of a Critical Tenant Trigger Event. A Cash Sweep Event Period will end, in the case of a trigger under clause (i) above, the cure of such event of default, in the case of a trigger under clause (ii) above, the discharge of such bankruptcy, in the case of a trigger under clause (iii) above, the debt service coverage ratio being at least 1.10x for two consecutive calendar quarters, in the case of a trigger under clause (iv) above, such mezzanine loan default has been cured, and in the case of a trigger under clause (v) above, such Critical Tenant Trigger Event having been cured.
THE INFORMATION IN THIS STRUCTURAL AND COLLATERAL TERM SHEET IS NOT COMPLETE AND MAY BE AMENDED PRIOR TO THE TIME OF SALE. THIS TERM SHEET IS NOT AN OFFER TO SELL THESE SECURITIES AND IT IS NOT A SOLICITATION OF AN OFFER TO BUY THESE SECURITIES IN ANY JURISDICTION WHERE THE OFFER OR SALE IS NOT PERMITTED.
84
| WILLIAMS CENTER TOWERS |
A “Critical Tenant Trigger Event” is triggered (i) if Samson Investment Company (“Critical Tenant”) gives notice of its intention not to extend or renew its lease, (ii) if Critical Tenant fails to give notice of its election to renew its lease at least 12 months prior to the then-applicable expiration date, (iii) if Critical Tenant fails to notify landlord of its election to renew its lease prior to the date Critical Tenant is required under its lease to give such notice, (iv) upon an event of default under the Critical Tenant lease, (v) upon the occurrence of a bankruptcy action of Critical Tenant, (vi) if Critical Tenant discontinues its normal business operations at its leased premises (other than a temporary cessation of business operations for permitted renovations or necessary repairs) or (vii) if Critical Tenant’s lease (or any material portion demised thereunder) is surrendered, cancelled or terminated prior to its then-current expiration date (provided that, only with respect to the first floor to be surrendered, cancelled or terminated by Critical Tenant, a Critical Tenant Trigger Event will not occur if, at the time of surrender, cancellation or termination, both (x) the annual effective gross income of the Williams Center Towers Property is at least $10,392,174 and (y) the occupancy level of the Williams Center Towers Property is at least 91.6%). A Critical Tenant Trigger Event is cured upon, in the case of a trigger under clause (i), (ii), (iii) or (vii), the date that (1) the Critical Tenant extends its lease and all tenant improvement costs and leasing commissions related thereto have been satisfied, or (2) a replacement lease is entered into for the premises demised to Critical Tenant; in the case of a trigger under clause (iv) above, a cure of such event of default; in the case of a trigger under clause (v) above, the affirmation of Critical Tenant’s lease in the applicable bankruptcy proceeding; or in the case of a trigger under clause (vi) above, Critical Tenant recommences its normal business operations at its leased premises or a replacement lease is executed.
Property Management. The Williams Center Towers Property is managed by T.H. Real Estate Services, LLC, and the leasing agent is Daniels Greer Properties, LLC.
Assumption. The borrowers have the right to transfer the Williams Center Towers Property, provided that no event of default has occurred and is continuing and certain other conditions are satisfied, including, but not limited to: (i) the lender’s reasonable determination that the proposed transferee and guarantor satisfy the lender’s credit review and underwriting standards, taking into consideration transferee’s experience, financial strength and general business standing; (ii) execution of a recourse guaranty and an environmental indemnity by an affiliate of the transferee; and (iii) if requested by the lender, rating agency confirmation from DBRS, Fitch and Moody’s that the transfer will not result in a downgrade, withdrawal or qualification of the respective ratings assigned to the Series 2014-LC14 Certificates.
Partial Release. Not permitted.
Real Estate Substitution. Not permitted.
Subordinate and Mezzanine Indebtedness. The borrowers have the right to incur future mezzanine financing subject to satisfaction of certain conditions, including: (i) no event of default has occurred and is continuing; (ii) the execution of an intercreditor agreement in form and substance reasonably acceptable to the lender; (iii) the loan-to-value ratio including all debt is not greater than 80.0%; (iv) the amortizing debt service coverage ratio including all debt is not less than 1.35x; and (v) rating agency confirmation from DBRS, Fitch and Moody’s that the mezzanine financing will not result in a downgrade, withdrawal or qualification of the respective ratings assigned to the Series 2014-LC14 Certificates.
Ground Lease. None.
Terrorism Insurance. The loan documents require that the “all risk” insurance policy required to be maintained by the borrowers provide coverage for terrorism in an amount equal to the full replacement cost of the Williams Center Towers Property. The loan documents also require business interruption insurance covering no less than the 18-month period following the occurrence of a casualty event, together with a 12-month extended period of indemnity.
THE INFORMATION IN THIS STRUCTURAL AND COLLATERAL TERM SHEET IS NOT COMPLETE AND MAY BE AMENDED PRIOR TO THE TIME OF SALE. THIS TERM SHEET IS NOT AN OFFER TO SELL THESE SECURITIES AND IT IS NOT A SOLICITATION OF AN OFFER TO BUY THESE SECURITIES IN ANY JURISDICTION WHERE THE OFFER OR SALE IS NOT PERMITTED.
85
| FRAPAG PORTFOLIO |
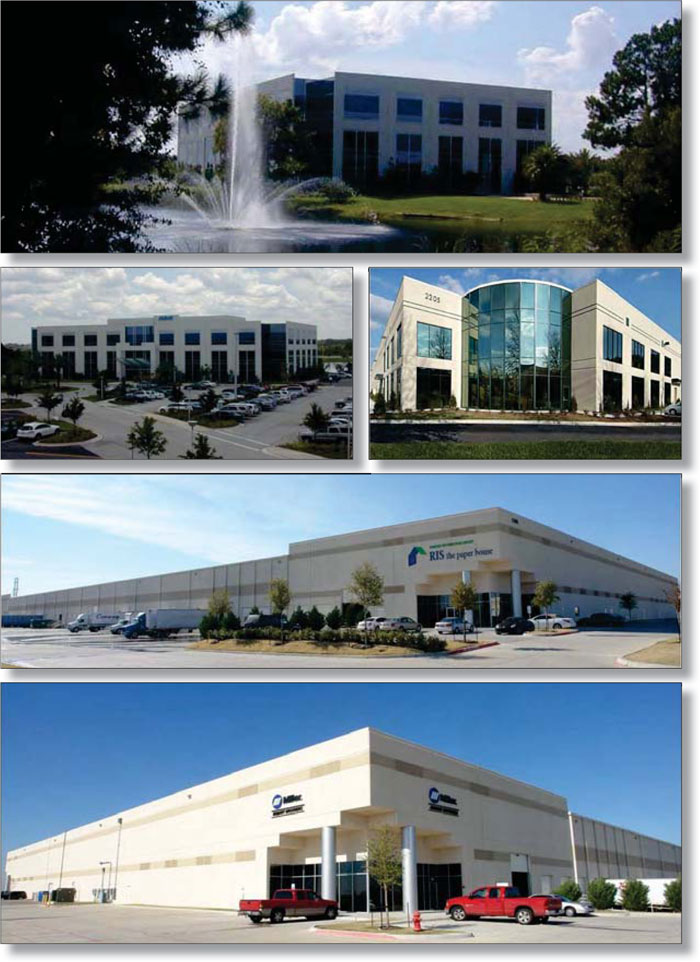
THE INFORMATION IN THIS STRUCTURAL AND COLLATERAL TERM SHEET IS NOT COMPLETE AND MAY BE AMENDED PRIOR TO THE TIME OF SALE. THIS TERM SHEET IS NOT AN OFFER TO SELL THESE SECURITIES AND IT IS NOT A SOLICITATION OF AN OFFER TO BUY THESE SECURITIES IN ANY JURISDICTION WHERE THE OFFER OR SALE IS NOT PERMITTED.
86
| FRAPAG PORTFOLIO |
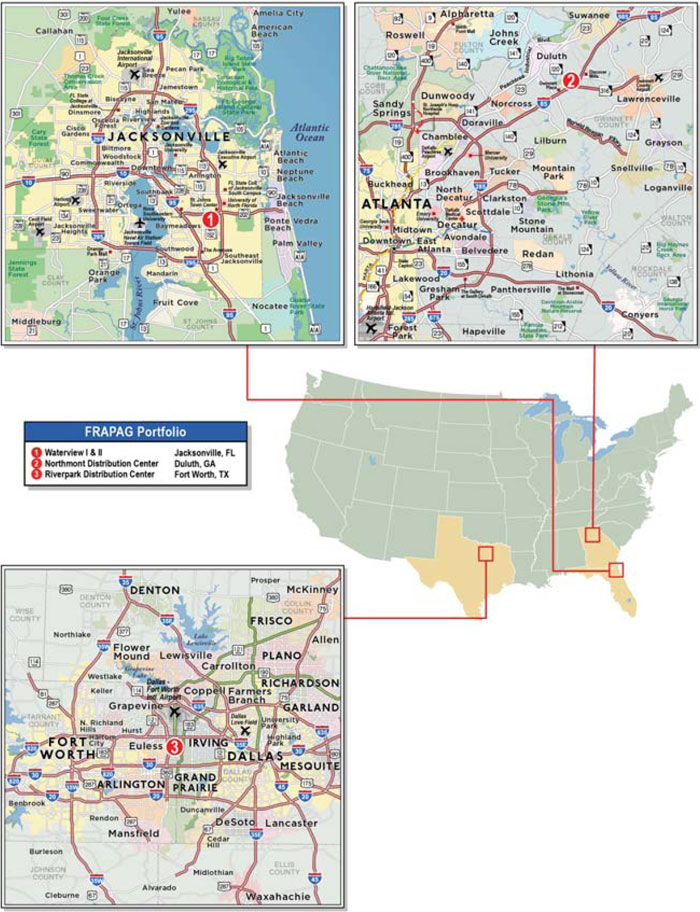
THE INFORMATION IN THIS STRUCTURAL AND COLLATERAL TERM SHEET IS NOT COMPLETE AND MAY BE AMENDED PRIOR TO THE TIME OF SALE. THIS TERM SHEET IS NOT AN OFFER TO SELL THESE SECURITIES AND IT IS NOT A SOLICITATION OF AN OFFER TO BUY THESE SECURITIES IN ANY JURISDICTION WHERE THE OFFER OR SALE IS NOT PERMITTED.
87
| No. 7 – FRAPAG Portfolio | |||||||
| Loan Information | Property Information | ||||||
| Mortgage Loan Seller: | The Royal Bank of Scotland | Single Asset/Portfolio: | Portfolio | ||||
| Credit Assessment (DBRS/Fitch/Moody’s): | NR/NR/NR | Property Type: | Various – See Table | ||||
| Original Principal Balance: | $41,410,000 | Specific Property Type: | Various – See Table | ||||
| Cut-off Date Principal Balance: | $41,410,000 | Location: | Various – See Table | ||||
| % of Initial Pool Balance: | 3.3% | Size: | 699,355 SF | ||||
| Loan Purpose: | Refinance | Cut-off Date Principal Balance Per SF: | $59.21 | ||||
Borrower Names(1): | Various | Year Built/Renovated: | Various – See Table | ||||
| Sponsor: | FRAPAG America, Inc. | Title Vesting: | Fee | ||||
| Mortgage Rate: | 5.012% | Property Manager(3): | Various | ||||
| Note Date: | January 24, 2014 | 3rd Most Recent Occupancy (As of): | 99.0% (12/31/2010) | ||||
| Anticipated Repayment Date: | NAP | 2nd Most Recent Occupancy (As of): | 99.3% (12/31/2011) | ||||
| Maturity Date: | February 1, 2024 | Most Recent Occupancy (As of): | 98.1% (12/31/2012) | ||||
| IO Period: | None | Current Occupancy (As of): | 98.1% (12/31/2013) | ||||
| Loan Term (Original): | 120 months | ||||||
| Seasoning: | 0 months | Underwriting and Financial Information: | |||||
| Amortization Term (Original): | 360 months | ||||||
| Loan Amortization Type: | Amortizing Balloon | 3rd Most Recent NOI (As of): | $3,370,392 (12/31/2011) | ||||
| Interest Accrual Method: | Actual/360 | 2nd Most Recent NOI (As of): | $3,287,100 (12/31/2012) | ||||
| Call Protection: | L(24),D(92),O(4) | Most Recent NOI (As of)(4): | $3,277,006 (Various) | ||||
| Lockbox Type: | Hard/Springing Cash Management | ||||||
| Additional Debt: | None | ||||||
| Additional Debt Type: | NAP | ||||||
| U/W Revenues: | $5,988,723 | ||||||
| U/W Expenses: | $2,098,092 | ||||||
| U/W NOI: | $3,890,631 | ||||||
Escrows and Reserves(2): | U/W NCF: | $3,495,739 | |||||
U/W NOI DSCR : | 1.46x | ||||||
Type: | Initial | Monthly | Cap (If Any) | U/W NCF DSCR: | 1.31x | ||
| Taxes | $196,762 | $57,242 | NAP | U/W NOI Debt Yield: | 9.4% | ||
| Insurance | $64,601 | $12,238 | NAP | U/W NCF Debt Yield: | 8.4% | ||
| Replacement Reserves | $0 | $7,184 | NAP | As-Is Appraised Value: | $57,850,000 | ||
| TI/LC Reserves | $0 | $25,724 | $1,234,732 | As-Is Appraisal Valuation Dates(5): | Various | ||
| Deferred Maintenance | $13,938 | $0 | NAP | Cut-off Date LTV Ratio: | 71.6% | ||
Tenant Reserve | $245,673 | $0 | NAP | LTV Ratio at Maturity or ARD: | 58.9% | ||
| (1) | See “Borrower” section. |
| (2) | See “Escrows” section. |
| (3) | See “Property Management” section. |
| (4) | The Most Recent NOI (As of) dates range from trailing 12 months as of November 30, 2013 to trailing 12 months as of December 31, 2013. |
| (5) | The As-Is Appraisal Valuation Dates range from December 9, 2013 to December 13, 2013. |
The Mortgage Loan. The mortgage loan (the “FRAPAG Portfolio Mortgage Loan”) is evidenced by a single promissory note that is secured by a first mortgage encumbering one office property and two industrial warehouse properties located in Florida, Georgia and Texas (the “FRAPAG Portfolio Properties”). The FRAPAG Portfolio Mortgage Loan was originated on January 24, 2014 by The Royal Bank of Scotland. The FRAPAG Portfolio Mortgage Loan had an original principal balance of $41,410,000, has an outstanding principal balance as of the Cut-off Date of $41,410,000 and accrues interest at an interest rate of 5.012% per annum. The FRAPAG Portfolio Mortgage Loan had an initial term of 120 months, has a remaining term of 120 months as of the Cut-off Date and requires payments of principal and interest based on a 30-year amortization schedule. The FRAPAG Portfolio Mortgage Loan matures on February 1, 2024.
Following the lockout period, the borrower has the right to defease the FRAPAG Portfolio Mortgage Loan in whole, or in part, on any date before November 1, 2023. In addition, the FRAPAG Portfolio Mortgage Loan is prepayable without penalty on or after November 1, 2023.
THE INFORMATION IN THIS STRUCTURAL AND COLLATERAL TERM SHEET IS NOT COMPLETE AND MAY BE AMENDED PRIOR TO THE TIME OF SALE. THIS TERM SHEET IS NOT AN OFFER TO SELL THESE SECURITIES AND IT IS NOT A SOLICITATION OF AN OFFER TO BUY THESE SECURITIES IN ANY JURISDICTION WHERE THE OFFER OR SALE IS NOT PERMITTED.
88
| FRAPAG PORTFOLIO |
Sources and Uses
| Sources | Uses | |||||||
| Original loan amount | $41,410,000 | 100.0% | Loan payoff | $26,351,949 | 63.6% | |||
| Reserves | 520,974 | 1.3 | ||||||
| Closing costs | 644,972 | 1.6 | ||||||
| Return of equity | 13,892,105 | 33.5 | ||||||
| Total Sources | $41,410,000 | 100.0% | Total Uses | $41,410,000 | 100.0% |
The Properties. The FRAPAG Portfolio Mortgage Loan is secured by fee interests in one class A office property located in Florida and two class A industrial warehouse properties located in Georgia and Texas. The FRAPAG Portfolio Properties comprise a total of 699,355 rentable square feet.
The following table presents certain information relating to the FRAPAG Portfolio Properties:
| Property Name – Location | Property Type | Allocated Cut-off Date Principal Balance | % of Portfolio Cut-off Date Principal Balance | Total Occupancy | Year Built/ Renovated | Net Rentable Area (SF) | Appraised Value | ||
| Waterview I & II – Jacksonville, FL | Office | $16,034,300 | 38.7% | 92.0% | 2002/NAP | 162,721 | $22,400,000 | ||
| Northmont Distribution Center – Duluth, GA | Industrial | $15,032,150 | 36.3% | 100.0% | 2006/NAP | 236,070 | $21,000,000 | ||
| Riverpark Distribution Center – Fort Worth, TX | Industrial | $10,343,550 | 25.0% | 100.0% | 2004/NAP | 300,564 | $14,450,000 | ||
| Total/Weighted Average | $41,410,000 | 100.0% | 98.1% | 699,355 | $57,850,000 | ||||
Waterview I & II (38.7% of Portfolio Cut-off Date Principal Balance)
The Waterview I & II property comprises two three-story class A office buildings that contain 162,721 square feet located in Jacksonville, Florida. Waterview I was built in 2002 and Waterview II was built in 2007. The combined buildings are 92.0% occupied by nine tenants and serves as the corporate headquarters for the two largest tenants at the property, Reynolds, Smith & Hills, a facilities and infrastructure consulting firm, and Availity, a healthcare information network company. The Waterview I & II property is located along Deerwood Park Boulevard just east of the Deerwood Park office park. Parking is provided by 772 surface parking spaces, which equates to 4.7 spaces per 1,000 square feet of rentable area.
Northmont Distribution Center (36.3% of Portfolio Cut-off Date Principal Balance)
The Northmont Distribution Center property comprises two single-story class A industrial warehouse buildings that contain 236,070 square feet located in Duluth, Georgia. Northmont 900 was built in 2006 and Northmont 1000 was built in 2007. The combined buildings are 100.0% occupied by three tenants. The largest tenant is Rockwell Collins Satellite, an aerospace and defense company. The Northmont Distribution Center property is located along Northmont Parkway and Evergreen Boulevard within a formal industrial park. Parking is provided by 359 surface parking spaces, which equates to 1.5 spaces per 1,000 square feet of rentable area. The Northmont 900 building has a clear height of approximately 33 feet, and the Northmont 1000 building has a low clear height ranging from 29 feet to 31 feet.
Riverpark Distribution Center (25.0% of Portfolio Cut-off Date Principal Balance)
The Riverpark Distribution Center property comprises a single-story class A industrial warehouse building that contains 300,564 square feet located in Fort Worth, Texas. The Riverpark Distribution Center property was built in 2004 and is 100.0% occupied by four tenants. The largest tenant is Turnkey Project Services, a company that specializes in workplace furnishings and office installations. The Riverpark Distribution Center property is located at the southeast corner of Grand River Road and High River Road within the RiverPark industrial business park. Parking is provided by 286 surface parking spaces, which equates to 1.0 space per 1,000 square feet of rentable area. The clear height throughout the warehouse area is approximately 32 feet.
THE INFORMATION IN THIS STRUCTURAL AND COLLATERAL TERM SHEET IS NOT COMPLETE AND MAY BE AMENDED PRIOR TO THE TIME OF SALE. THIS TERM SHEET IS NOT AN OFFER TO SELL THESE SECURITIES AND IT IS NOT A SOLICITATION OF AN OFFER TO BUY THESE SECURITIES IN ANY JURISDICTION WHERE THE OFFER OR SALE IS NOT PERMITTED.
89
| FRAPAG PORTFOLIO |
The following table presents certain information relating to the tenancies at the FRAPAG Portfolio Properties:
Major Tenants(1)
| Tenant Name | Property(2) | Credit Rating (Fitch/Moody’s/ S&P)(3) | Tenant NRSF | % of NRSF | Annual U/W Base Rent PSF | Annual U/W Base Rent | % of Total Annual U/W Base Rent | Lease Expiration Date | |
| Major Tenant | |||||||||
| Reynolds, Smith & Hills | A | NR/NR/NR | 62,995 | 9.0% | $19.00 | $1,196,905 | 22.6% | 3/31/2019 | |
| Availity | A | NR/NR/NR | 49,308 | 7.1% | $21.00 | $1,035,468 | 19.5% | 8/31/2017(4) | |
| Rockwell Collins Satellite | B | A/A2/A | 157,507 | 22.5% | $5.90 | $929,760 | 17.5% | Various(5) | |
| Regus (Office Suites Plus) | A | NR/NR/NR | 15,135 | 2.2% | $26.09 | $394,872 | 7.4% | 11/30/2018(6) | |
| Turnkey Project Services | C | NR/NR/NR | 95,282 | 13.6% | $3.20 | $304,902 | 5.7% | 9/30/2018 | |
| Freeman Decorating Services | C | NR/NR/NR | 90,141 | 12.9% | $3.10 | $279,438 | 5.3% | 5/31/2021 | |
| Duravit USA Inc. | B | NR/NR/NR | 58,707 | 8.4% | $4.47 | $262,136 | 4.9% | 6/30/2017 | |
| KCI USA, Inc. | C | NR/NR/NR | 60,141 | 8.6% | $3.25 | $195,458 | 3.7% | 4/30/2015 | |
| Miller Electric Mfg. Co. | C | NR/NR/NR | 55,000 | 7.9% | $3.45 | $189,750 | 3.6% | 6/30/2016 | |
| The Systems Depot | B | NR/NR/NR | 19,856 | 2.8% | $6.22 | $123,583 | 2.3% | 5/31/2019 | |
| Total Major Tenants - Collateral | 664,072 | 95.0% | $7.40 | $4,912,272 | 92.6% | ||||
| Non-Major Tenants - Collateral | 22,283 | 3.1% | $17.58 | $391,664 | 7.4% | ||||
| Occupied Collateral Total | 686,355 | 98.1% | $7.73 | $5,303,936 | 100.0% | ||||
| Vacant Space | 13,000 | 1.9% | |||||||
| Collateral Total | 699,355 | 100.0% | |||||||
| (1) | Information obtained from the underwritten rent roll. |
| (2) | (A) denotes tenant is located at the Waterview I & II property; (B) denotes tenant is located at the Northmont Distribution Center property; and (C) denotes tenant is at the Riverview Distribution Center property. |
| (3) | Certain ratings are those of the parent company whether or not the parent guarantees the lease. |
| (4) | Availity has a termination option exercisable upon notice by June 2018. |
| (5) | Rockwell Collins Satellite has two leases: 48,800 square feet (7.0% of total net rentable area) expiring on November 30, 2014, and 108,707 square feet (15.5% of total net rentable area) expiring on October 31, 2019. |
| (6) | Regus (Office Suites Plus) has a termination option exercisable upon notice by August 2015. |
The following table presents certain information relating to the lease rollover schedule at the FRAPAG Portfolio Properties:
Lease Expiration Schedule(1)(2)
Year Ending December 31, | No. of Leases Expiring | Expiring NRSF | % of Total NRSF | Cumulative Expiring NRSF | Cumulative % of Total NRSF | Annual U/W Base Rent | Annual U/W Base Rent PSF(3) | |
| MTM | 0 | 0 | 0.0% | 0 | 0.0% | $0 | $0.00 | |
| 2014 | 3 | 57,605 | 8.2% | 57,605 | 8.2% | $376,790 | $6.54 | |
| 2015 | 2 | 61,913 | 8.9% | 119,518 | 17.1% | $222,038 | $3.59 | |
| 2016 | 2 | 57,875 | 8.3% | 177,393 | 25.4% | $251,562 | $4.35 | |
| 2017 | 3 | 112,636 | 16.1% | 290,029 | 41.5% | $1,392,335 | $12.36 | |
| 2018 | 3 | 114,627 | 16.4% | 404,656 | 57.9% | $781,869 | $6.82 | |
| 2019 | 3 | 191,558 | 27.4% | 596,214 | 85.3% | $1,999,904 | $10.44 | |
| 2020 | 0 | 0 | 0.0% | 596,214 | 85.3% | $0 | $0.00 | |
| 2021 | 1 | 90,141 | 12.9% | 686,355 | 98.1% | $279,438 | $3.10 | |
| 2022 | 0 | 0 | 0.0% | 686,355 | 98.1% | $0 | $0.00 | |
| 2023 | 0 | 0 | 0.0% | 686,355 | 98.1% | $0 | $0.00 | |
| 2024 | 0 | 0 | 0.0% | 686,355 | 98.1% | $0 | $0.00 | |
| Thereafter | 0 | 0 | 0.0% | 686,355 | 98.1% | $0 | $0.00 | |
| Vacant | 0 | 13,000 | 1.9% | 699,355 | 100.0% | $0 | $0.00 | |
| Total/Weighted Average | 17 | 699,355 | 100.0% | 100.0% | $5,303,936 | $7.73 |
| (1) | Information obtained from the underwritten rent roll. |
| (2) | Certain tenants may have lease termination options that are exercisable prior to the originally stated expiration date of the subject lease and that are not considered in the Lease Expiration Schedule. |
| (3) | Weighted Average Annual U/W Base Rent PSF excludes vacant space. |
THE INFORMATION IN THIS STRUCTURAL AND COLLATERAL TERM SHEET IS NOT COMPLETE AND MAY BE AMENDED PRIOR TO THE TIME OF SALE. THIS TERM SHEET IS NOT AN OFFER TO SELL THESE SECURITIES AND IT IS NOT A SOLICITATION OF AN OFFER TO BUY THESE SECURITIES IN ANY JURISDICTION WHERE THE OFFER OR SALE IS NOT PERMITTED.
90
| FRAPAG PORTFOLIO |
The following table presents historical occupancy percentages at the FRAPAG Portfolio Properties:
Historical Occupancy
12/31/2010(1) | 12/31/2011(1) | 12/31/2012(1) | 12/31/2013 | |||
| 99.0% | 99.3% | 98.1% | 98.1% |
| (1) | Information obtained from the borrower. |
Operating History and Underwritten Net Cash Flow. The following table presents certain information relating to the historical operating performance and the Underwritten Net Cash Flow at the FRAPAG Portfolio Properties:
Cash Flow Analysis
| 2011 | 2012 | TTM(1) | U/W | U/W $ per SF | |||||||
| Base Rent | $4,315,587 | $4,639,220 | $4,746,926 | $5,303,936(2) | $7.58 | ||||||
| Grossed Up Vacant Space | 0 | 0 | 0 | 260,000 | 0.37 | ||||||
| Total Reimbursables | 1,205,260 | 1,150,285 | 815,143 | 896,836 | 1.28 | ||||||
| Other Income | (60,183) | (25,964) | 18,187 | 0 | 0.00 | ||||||
| Less Vacancy & Credit Loss | 0 | 0 | 0 | (472,049)(3) | (0.67) | ||||||
| Effective Gross Income | $5,460,664 | $5,763,541 | $5,580,256 | $5,988,723 | $8.56 | ||||||
| Total Operating Expenses | $2,090,272 | $2,476,441 | $2,303,250 | $2,098,092 | $3.00 | ||||||
| Net Operating Income | $3,370,392 | $3,287,100 | $3,277,006 | $3,890,631 | $5.56 | ||||||
| TI/LC | 0 | 0 | 0 | 308,685 | 0.44 | ||||||
| Capital Expenditures | 0 | 0 | 0 | 86,208 | 0.12 | ||||||
| Net Cash Flow | $3,370,392 | $3,287,100 | $3,277,006 | $3,495,739 | $5.00 | ||||||
| NOI DSCR | 1.26x | 1.23x | 1.23x | 1.46x | |||||||
| NCF DSCR | 1.26x | 1.23x | 1.23x | 1.31x | |||||||
| NOI DY | 8.1% | 7.9% | 7.9% | 9.4% | |||||||
| NCF DY | 8.1% | 7.9% | 7.9% | 8.4% |
| (1) | Cash Flow Analysis is based upon trailing twelve months as of November 30, 2013 for the Riverpark Distribution Center and Waterview I & II properties, and is based upon trailing twelve months as of December 31, 2013 for the Northmont Distribution Center property. |
| (2) | The U/W Base Rent and U/W Net Operating Income are higher than the TTM Base Rent and TTM Net Operating Income due to new and renewal leases totaling approximately 248,461 square feet, representing approximately $1,851,761 in U/W Base Rent at the FRAPAG Portfolio Properties. |
| (3) | The underwritten economic vacancy is 7.3%. The FRAPAG Portfolio Properties were 98.1% physically occupied as of December 31, 2013. |
Appraisal. According to the related appraisals performed from December 9, 2013 to December 13, 2013 the FRAPAG Portfolio Properties had an aggregate “as-is” appraised value of $57,850,000.
Environmental Matters. According to the Phase I environmental site assessments dated from December 18, 2013 to December 27, 2013, there was no evidence of any recognized environmental conditions at the FRAPAG Portfolio Properties.
Market Overview. The FRAPAG Portfolio Properties are located in Jacksonville, Florida; Duluth, Georgia; and Fort Worth, Texas, respectively.
Waterview I & II
The Waterview I & II property is located at the intersection of Gate Parkway and Deerwood Park Boulevard in Jacksonville, Florida. The Waterview I & II property is just east of Deerwood Park office park, approximately 10 miles south of the Jacksonville central business district. According to the appraisal, the Waterview I & II property is located within the Jacksonville office market and the Southside submarket. According to a third party market research report, as of the third quarter of 2013, the Jacksonville office market vacancy rate and average asking gross lease rate were 12.5% and $17.35, respectively. As of the third quarter of 2013, the Southside submarket class A vacancy rate and average asking gross lease rate were 4.8% and $19.71, respectively.
Northmont Distribution Center
The Northmont Distribution Center property is located on the east side of the intersection of Northmont Parkway and Evergreen Boulevard in Duluth, Georgia. The Northmont Distribution Center property is within a formal industrial park, approximately 15 miles northeast of the Atlanta central business district and 1.5 miles north of Interstate 85. According to the appraisal, the Northmont Distribution Center property is located within the Atlanta industrial market and the Northeast Atlanta industrial submarket (warehouse). According to a third party market research report, as of the third quarter of 2013, the Atlanta industrial market vacancy rate and average asking gross lease rate were 11.6% and $3.88, respectively. As of the third quarter of 2013, the Northeast Atlanta industrial submarket vacancy rate and average asking gross lease rate were 8.9% and $3.91, respectively.
THE INFORMATION IN THIS STRUCTURAL AND COLLATERAL TERM SHEET IS NOT COMPLETE AND MAY BE AMENDED PRIOR TO THE TIME OF SALE. THIS TERM SHEET IS NOT AN OFFER TO SELL THESE SECURITIES AND IT IS NOT A SOLICITATION OF AN OFFER TO BUY THESE SECURITIES IN ANY JURISDICTION WHERE THE OFFER OR SALE IS NOT PERMITTED.
91
| FRAPAG PORTFOLIO |
Riverpark Distribution Center
The Riverpark Distribution Center property is located at the southeast corner of the intersection of Grand River Road and High River Road in Fort Worth, Texas. The Riverpark Distribution Center property is within the 2.3 million square foot RiverPark industrial business park, approximately 20 miles northeast of the Fort Worth central business district and 20 miles northwest of the Dallas central business district. According to the appraisal, the Riverpark Distribution Center property is located within the Dallas/Fort Worth industrial market and the Great Southwest/Arlington submarket (warehouse). According to a third party market research report, as of the third quarter of 2013, the Dallas/Fort Worth industrial market vacancy rate and average asking gross lease rate were 7.8% and $4.96, respectively. As of the third quarter of 2013, the Great Southwest/Arlington submarket (warehouse) vacancy rate and average asking gross lease rate were 7.7% and $3.59, respectively.
The Borrower. The borrower, collectively, is FS Northmont 1000, LLC, FRAPAG Waterview Jax, LLC, FRAPAG Riverpark DFW, LLC and FRAPAG Northmont ATL, LLC, all of which are Delaware limited liability companies and single purpose entities. Legal counsel to the borrower delivered a non-consolidation opinion in connection with the origination of the FRAPAG Portfolio Mortgage Loan. FRAPAG America, Inc. is the guarantor of certain nonrecourse carveouts under the FRAPAG Portfolio Mortgage Loan.
The Sponsor. The loan sponsor is FRAPAG America, Inc., a United States based owner and developer of commercial real estate properties. FRAPAG America, Inc. is a subsidiary of PNL Investments GmbH, an Austrian holding company indirectly owned by HKW Privatstiftung. John H. Zehmer has served as FRAPAG America, Inc.’s president since 1998 and has overseen FRAPAG America, Inc.’s real estate portfolio since that time. FRAPAG America, Inc. was founded in 1989 under the name Patria America Corporation, and in 1998 changed its name to FRAPAG America, Inc.
Escrows. The loan documents provide for upfront escrows in the amount of $196,762 for real estate taxes and $64,601 for insurance, $13,938 for deferred maintenance and $245,673 for tenant reserve. The loan documents provide for monthly escrows in the amount of $57,242 for real estate taxes, $12,238 for insurance, $7,184 for replacement reserves and $25,724 for tenant improvements and leasing commissions up to a capped amount of $ 1,234,732.
Lockbox and Cash Management. The FRAPAG Portfolio Mortgage Loan requires a lender-controlled lockbox account for each property, each of which are already in place, and that the borrower direct tenants to pay their rents directly to such lockbox accounts. The loan documents also require that all cash revenues and all other monies received by the borrower or the property manager be deposited into the lockbox account within three business days after receipt. Prior to the occurrence of a Cash Management Period (as defined below), all funds on deposit in the lockbox account are swept into the borrower’s operating accounts. During a Cash Management Period, all funds on deposit in the lockbox account are swept to a lender-controlled cash management account.
A “Cash Management Period” will commence: (i) if an event of default has occurred and is continuing; (ii) if the debt service coverage ratio is less than 1.10x as of the end of any calendar quarter; or (iii) upon the commencement of a Lease Sweep Period (as defined below). A Cash Management Period will end, with regard to a Cash Management Period triggered by clause (i) above, with the cure of such event of default; with regard to a Cash Management Period triggered by clause (ii) above, upon the achievement of a debt service coverage ratio of 1.10x or greater for two consecutive calendar quarters; and with regard to a Cash Management Period triggered by clause (iii) above, when such Lease Sweep Period has ended.
A “Lease Sweep Period” will commence on the first payment date under the FRAPAG Portfolio Mortgage Loan following the occurrence of any of the following: (a) the date that is nine months prior to the end of the term of any Major Lease (as defined below); (b) any Major Lease at any of the FRAPAG Portfolio Properties is surrendered, cancelled or terminated prior to its then-current expiration date; (c) the date under a Major Lease by which the applicable tenant is required to give notice of its exercise of a renewal option; (d) the occurrence of a default under any Major Lease or (e) upon the occurrence of an insolvency proceeding by any tenant under a Major Lease. A Lease Sweep Period will end, with regard to a Lease Sweep Period triggered by clauses (a), (b) or (c) above, the date on which the tenant exercises its renewal option or such space has been at least 90.0% leased pursuant to an acceptable replacement tenant and all associated expenses have been paid in full; with regard to a Lease Sweep Period triggered by clause (d) above, if such default has ended; and with regard to a Lease Swap Period triggered by clause (e) above, if the applicable insolvency proceeding regarding the tenant under the applicable Major Lease has terminated and the applicable Major Lease has been affirmed, assumed or assigned in accordance with the applicable bankruptcy code.
A “Major Lease” is defined as the Reynolds, Smith & Hills lease, the Availity lease, the Rockwell Collins Satellite lease (108,707 square feet at the Northmont Distribution Center property), any other lease at the Riverpark Distribution Center property which covers 100,000 or more net rentable square feet, any other lease at the Northmont Distribution Center property which covers 80,000 or more net rentable square feet or any other lease at the Waterview I & II property which covers 40,000 or more net rentable square feet.
Property Management. The Northmont Distribution Center property and the Riverpark Distribution Center property are managed by Seefried Industrial Properties, Inc. The Waterview I & II property is managed by Weaver Realty Group, LLC.
Assumption. The borrower has the right to transfer all, but not less than all, of the FRAPAG Portfolio Properties, subject to customary conditions set forth in the loan documents, including but not limited to: (i) no event of default has occurred and is continuing; (ii) the proposed transferee, the property manager and management agreement are satisfactory to the lender and applicable rating agencies; and (iii) the lender has received confirmation from DBRS, Fitch and Moody’s that such assumption will not result in a downgrade, withdrawal or qualification of the then-current ratings assigned to the Series 2014-LC14 Certificates.
THE INFORMATION IN THIS STRUCTURAL AND COLLATERAL TERM SHEET IS NOT COMPLETE AND MAY BE AMENDED PRIOR TO THE TIME OF SALE. THIS TERM SHEET IS NOT AN OFFER TO SELL THESE SECURITIES AND IT IS NOT A SOLICITATION OF AN OFFER TO BUY THESE SECURITIES IN ANY JURISDICTION WHERE THE OFFER OR SALE IS NOT PERMITTED.
92
| FRAPAG PORTFOLIO |
Partial Release. On any payment date after February 1, 2016, the borrower may obtain the release of an individual property from the lien of the related mortgage (and the related loan documents) in connection with a partial defeasance upon the satisfaction of certain conditions including but not limited to: (i) no event of default has occurred or is continuing at the time that the release occurs; (ii) the borrower has delivered defeasance collateral in an amount equal to 115% of the allocated loan amount for the property to be released (iii) after such release, the debt service coverage ratio of the remaining properties must not be less than the greater of (x) the debt service coverage ratio immediately preceding such release and (y) 1.30x; and (iv) after such release, the loan-to-value ratio of the remaining properties must not be greater than the lesser of (x) the loan-to-value ratio immediately preceding such release and (y) 70.0%.
Real Estate Substitution. Not permitted.
Subordinate and Mezzanine Indebtedness. Not permitted.
Ground Lease. None.
Terrorism Insurance. The loan documents require that the “all risk” insurance policy required to be maintained by the borrower provide coverage for terrorism in an amount equal to the full replacement cost of the FRAPAG Portfolio Properties. The loan documents also require business interruption insurance covering no less than the 18-month period following the occurrence of a casualty event for the Northmont Distribution Center property and the Riverpark Distribution Center property, and the 12-month period following the occurrence of a casualty event at the Waterview I & II property.
Windstorm Insurance. The loan documents require that the “all risk” insurance policy required to be maintained by the borrower provide coverage for windstorm in an amount equal to the full replacement cost of the FRAPAG Portfolio Properties.
THE INFORMATION IN THIS STRUCTURAL AND COLLATERAL TERM SHEET IS NOT COMPLETE AND MAY BE AMENDED PRIOR TO THE TIME OF SALE. THIS TERM SHEET IS NOT AN OFFER TO SELL THESE SECURITIES AND IT IS NOT A SOLICITATION OF AN OFFER TO BUY THESE SECURITIES IN ANY JURISDICTION WHERE THE OFFER OR SALE IS NOT PERMITTED.
93
(THIS PAGE INTENTIONALLY LEFT BLANK)
94
CANADIAN PACIFIC PLAZA |
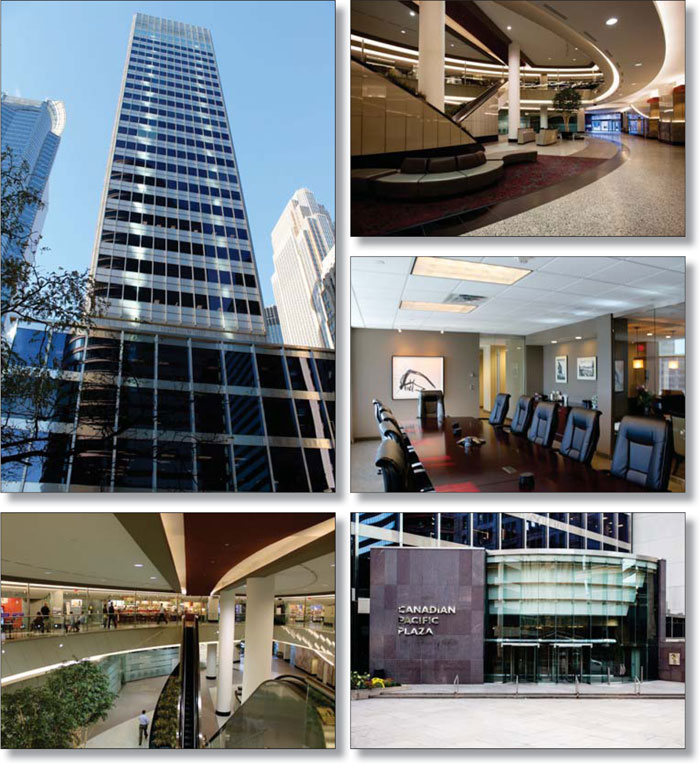
THE INFORMATION IN THIS STRUCTURAL AND COLLATERAL TERM SHEET IS NOT COMPLETE AND MAY BE AMENDED PRIOR TO THE TIME OF SALE. THIS TERM SHEET IS NOT AN OFFER TO SELL THESE SECURITIES AND IT IS NOT A SOLICITATION OF AN OFFER TO BUY THESE SECURITIES IN ANY JURISDICTION WHERE THE OFFER OR SALE IS NOT PERMITTED.
95
CANADIAN PACIFIC PLAZA |

THE INFORMATION IN THIS STRUCTURAL AND COLLATERAL TERM SHEET IS NOT COMPLETE AND MAY BE AMENDED PRIOR TO THE TIME OF SALE. THIS TERM SHEET IS NOT AN OFFER TO SELL THESE SECURITIES AND IT IS NOT A SOLICITATION OF AN OFFER TO BUY THESE SECURITIES IN ANY JURISDICTION WHERE THE OFFER OR SALE IS NOT PERMITTED.
96
CANADIAN PACIFIC PLAZA |
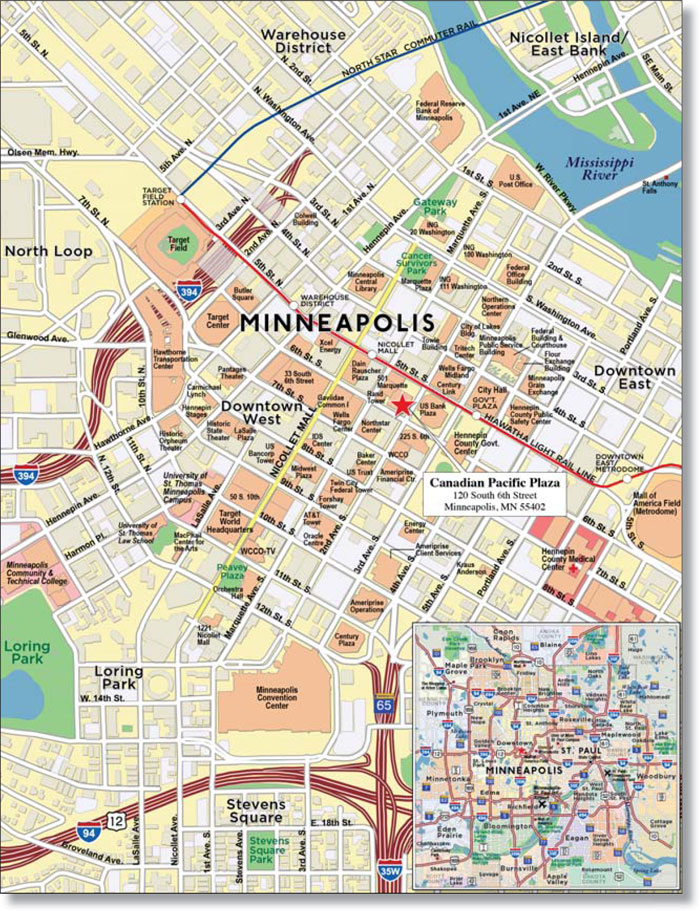
THE INFORMATION IN THIS STRUCTURAL AND COLLATERAL TERM SHEET IS NOT COMPLETE AND MAY BE AMENDED PRIOR TO THE TIME OF SALE. THIS TERM SHEET IS NOT AN OFFER TO SELL THESE SECURITIES AND IT IS NOT A SOLICITATION OF AN OFFER TO BUY THESE SECURITIES IN ANY JURISDICTION WHERE THE OFFER OR SALE IS NOT PERMITTED.
97
| No. 8 – Canadian Pacific Plaza |
| Loan Information | Property Information | |||||||
| Mortgage Loan Seller: | Ladder Capital Finance LLC | Single Asset/Portfolio: | Single Asset | |||||
Credit Assessment (DBRS/Fitch/Moody’s): | NR/NR/NR | Property Type: | Office | |||||
| Original Principal Balance: | $39,750,000 | Specific Property Type: | CBD | |||||
| Cut-off Date Principal Balance: | $39,750,000 | Location: | Minneapolis, MN | |||||
| % of Initial Pool Balance: | 3.2% | Size: | 393,902 SF | |||||
| Loan Purpose: | Acquisition | Cut-off Date Principal Balance Per SF: | $100.91 | |||||
| Borrower Name: | CanPac Owner LLC | Year Built/Renovated: | 1960/1999 | |||||
| Sponsors: | Jon Hempel, Joshua Krsnak and an affiliate of Ladder Capital Finance LLC | Title Vesting: | Fee | |||||
| Mortgage Rate: | 5.180% | Property Manager: | Northstar Equity Services, LLC | |||||
| Note Date: | October 9, 2013 | 3rd Most Recent Occupancy (As of): | NAV | |||||
| Anticipated Repayment Date: | November 6, 2023 | 2nd Most Recent Occupancy (As of): | 50.7% (12/31/2011) | |||||
| Maturity Date: | November 6, 2028 | Most Recent Occupancy (As of)(3): | 56.3% (12/31/2012) | |||||
| IO Period: | 36 months | Current Occupancy (As of)(3): | 84.3% (10/31/2013) | |||||
| Loan Term (Original): | 120 months | |||||||
| Seasoning: | 3 months | Underwriting and Financial Information: | ||||||
| Amortization Term (Original): | 360 months | |||||||
| Loan Amortization Type: | Interest-only, Amortizing ARD | 3rd Most Recent NOI (As of)(4): | $527,750 (12/31/2011) | |||||
| Interest Accrual Method: | Actual/360 | 2nd Most Recent NOI (As of)(4): | $932,644 (12/31/2012) | |||||
| Call Protection: | GRTR 1% or YM(27),GRTR 1% or YM or D(88),O(5) | Most Recent NOI (As of)(4): | $1,508,241 (TTM 10/31/2013) | |||||
| Lockbox Type: | Hard/Springing Cash Management | |||||||
Additional Debt(1): | Yes | |||||||
Additional Debt Type(1): | Future Mezzanine | |||||||
U/W Revenues(4): | $8,959,556 | |||||||
| U/W Expenses: | $4,717,060 | |||||||
U/W NOI(4): | $4,242,496 | |||||||
Escrows and Reserves(2): | U/W NCF(4): | $3,983,407 | ||||||
| U/W NOI DSCR: | 1.62x | |||||||
Type: | Initial | Monthly | Cap (If Any) | U/W NCF DSCR: | 1.52x | |||
| Taxes | $251,920 | $83,973 | NAP | U/W NOI Debt Yield: | 10.7% | |||
| Insurance | $36,057 | $7,211 | NAP | U/W NCF Debt Yield: | 10.0% | |||
| Replacement Reserves | $0 | $8,206 | NAP | As-Is Appraised Value: | $53,500,000 | |||
| TI/LC Reserve | $955,633 | $13,232 | NAP | As-Is Appraisal Valuation Date: | September 5, 2013 | |||
Outstanding TI/LC Reserve | $1,926,589 | $0 | NAP | Cut-off Date LTV Ratio: | 74.3% | |||
| Free Rent Reserve | $653,676 | $0 | NAP | LTV Ratio at Maturity or ARD: | 66.0% | |||
| (1) | See “Subordinate and Mezzanine Indebtedness” section. |
| (2) | See “Escrows” section. |
| (3) | See “Historical Occupancy” section. |
| (4) | See “Cash Flow Analysis” section. |
The Mortgage Loan. The mortgage loan (the “Canadian Pacific Plaza Mortgage Loan”) is evidenced by a single promissory note that is secured by a first mortgage encumbering an office building located in Minneapolis, Minnesota (the “Canadian Pacific Plaza Property”). The Canadian Pacific Plaza Mortgage Loan was originated on October 9, 2013 by Ladder Capital Finance LLC. The Canadian Pacific Plaza Mortgage Loan had an original principal balance of $39,750,000, has an outstanding principal balance as of the Cut-off Date of $39,750,000 and accrues interest at an interest rate of 5.180% per annum. The Canadian Pacific Plaza Mortgage Loan had an initial term of 120 months, has a remaining term of 117 months as of the Cut-off Date and requires interest-only payments for the first 36 payments following origination and, thereafter, requires payments of principal and interest based on a 30-year amortization schedule through the Anticipated Repayment Date (“ARD”). The ARD is November 6, 2023, and the final maturity date is November 6, 2028. In the event the Canadian Pacific Plaza Mortgage Loan is not repaid in full on or before the ARD, the interest rate on the Canadian Pacific Plaza Mortgage Loan will increase to 8.180% per annum and, as of the ARD, will have a remaining term of 60 months. The ARD automatically triggers a full cash flow sweep whereby all excess cash flow will be used to pay down the principal balance of the Canadian Pacific Plaza Mortgage Loan.
The borrower has the right to voluntarily prepay the Canadian Pacific Plaza Mortgage Loan in whole, but not in part, provided that the borrower pays the greater of a yield maintenance premium or a prepayment premium equal to 1.0% of the principal amount being prepaid on any date before July 6, 2023. Furthermore, following the defeasance lockout period, the borrower will have the right to
| THE INFORMATION IN THIS STRUCTURAL AND COLLATERAL TERM SHEET IS NOT COMPLETE AND MAY BE AMENDED PRIOR TO THE TIME OF SALE. THIS TERM SHEET IS NOT AN OFFER TO SELL THESE SECURITIES AND IT IS NOT A SOLICITATION OF AN OFFER TO BUY THESE SECURITIES IN ANY JURISDICTION WHERE THE OFFER OR SALE IS NOT PERMITTED. |
98
| CANADIAN PACIFIC PLAZA |
defease the Canadian Pacific Plaza Mortgage Loan in whole, but not in part, on any date before July 6, 2023. In addition, the Canadian Pacific Plaza Mortgage Loan is prepayable without penalty on or after July 6, 2023.
Sources and Uses
| Sources | Uses | |||||||
| Original loan amount | $39,750,000 | 70.0 | % | Purchase price | $51,520,000 | 90.7% | ||
| Sponsor’s new cash contribution | 14,083,920 | 24.8 | Reserves | 3,823,875 | 6.7 | |||
| Seller credits | 2,986,545 | 5.3 | Closing costs | 1,476,590 | 2.6 | |||
| Total Sources | $56,820,465 | 100.0 | % | Total Uses | $56,820,465 | 100.0% |
The Property. The Canadian Pacific Plaza Property is a 28-story class A/B+ office building containing approximately 393,902 square feet located in the central business district of Minneapolis, Minnesota. The Canadian Pacific Plaza Property was built in 1960 and most recently renovated in 1999. The Canadian Pacific Plaza Property contains 130 garage parking spaces reflecting a parking ratio of 0.3 spaces per 1,000 square feet of net rentable area. Since 1991, the Canadian Pacific Plaza Property has undergone over $40.0 million of renovations and the largest tenant, Canadian Pacific Rail has invested over $10.0 million in its space since 2012. The Canadian Pacific Plaza Property benefits from a number of amenities that differentiate it from its competition. The Canadian Pacific Plaza Property features an atrium between the ground floor lobby and skyway level that provides visibility and light to skyway tenants and those entering the Canadian Pacific Plaza Property via the skyway. Furthermore, the Canadian Pacific Plaza Property has received extensive lobby renovations, including marble facades to the elevator banks, wood paneling in select banks, dedicated elevator banks for certain tenants and other lobby finishes consistent with a class A office building. The Canadian Pacific Plaza Property also offers a fitness center, and a state-of-the-art conference and video conference facility that can seat up to 70 guests. As of October 31, 2013, the Canadian Pacific Plaza Property was 84.3% leased to 52 different tenants.
The following table presents certain information relating to the tenancy at the Canadian Pacific Plaza Property:
Major Tenants
| Tenant Name | Credit Rating (Fitch/ Moody’s/ S&P)(1) | Tenant NRSF | % of NRSF | Annual U/W Base Rent PSF(2) | Annual U/W Base Rent(2) | % of Total Annual U/W Base Rent | Lease Expiration Date | |
| Major Tenants | ||||||||
| Canadian Pacific Rail | NR/Baa3/BBB- | 92,289 | 23.4% | $12.32(2)(3) | $1,136,693(2)(3) | 27.1% | 8/31/2027 | |
| Nilan Johnson Lewis PA | NR/NR/NR | 77,059 | 19.6% | $13.00 | $1,001,767(4) | 23.9% | 2/29/2020 | |
| Clarity Coverdale | NR/NR/NR | 14,363 | 3.6% | $11.50 | $165,175 | 3.9% | 7/31/2019 | |
| Kurt Salmon Associates | NR/NR/NR | 11,051(5) | 2.8% | $13.50 | $149,189 | 3.6% | 1/31/2016 | |
| Gustafson Glueck | NR/NR/NR | 10,743 | 2.7% | $13.50 | $145,031 | 3.5% | 8/31/2020(6) | |
| Total Major Tenants | 205,505 | 52.2% | $12.64 | $2,597,855 | 61.9% | |||
| Non-Major Tenants | 126,687 | 32.2% | $12.60 | $1,596,456 | 38.1% | |||
| Occupied Collateral | 332,192 | 84.3% | $12.63 | $4,194,311 | 100.0% | |||
| Vacant Space | 61,710 | 15.7% | ||||||
| Collateral Total | 393,902 | 100.0% | ||||||
| (1) | Certain ratings are those of the parent company whether or not the parent guarantees the lease. |
| (2) | Annual U/W Base Rent PSF and Annual U/W Base Rent includes straight line rent for Canadian Pacific Rail. |
| (3) | Canadian Pacific Rail has six months of rent abatement ending March 14, 2014. $53,032 was reserved at closing for the remaining rent abatement. |
| (4) | Nilan Johnson Lewis PA has two partial rent abatements ending November 2015. The amounts of the abatements total $139,546 and were reserved at closing. |
| (5) | Kurt Salmon Associates has listed 5,901 square feet of its total 11,051 square feet of space for sublease. Kurt Salmon Associates is reportedly seeking $15.00 per square foot gross to sublease the space. The tenant was underwritten as occupied with in place rent of $13.50 per square foot. |
| (6) | Gustafson Glueck may terminate its lease on August 31, 2017 upon providing 12 months’ written notice and payment of a termination fee of all unamortized transaction costs including concessions, commissions, allowances, and other expenses incurred by the landlord. |
THE INFORMATION IN THIS STRUCTURAL AND COLLATERAL TERM SHEET IS NOT COMPLETE AND MAY BE AMENDED PRIOR TO THE TIME OF SALE. THIS TERM SHEET IS NOT AN OFFER TO SELL THESE SECURITIES AND IT IS NOT A SOLICITATION OF AN OFFER TO BUY THESE SECURITIES IN ANY JURISDICTION WHERE THE OFFER OR SALE IS NOT PERMITTED.
99
| CANADIAN PACIFIC PLAZA |
The following table presents certain information relating to the lease rollover schedule at the Canadian Pacific Plaza Property:
Lease Expiration Schedule(1)(2)
Year Ending December 31, | No. of Leases Expiring | Expiring NRSF | % of Total NRSF | Cumulative of Total NRSF | Cumulative % of Total NRSF | Annual U/W Base Rent | Annual U/W Base Rent PSF(3) |
| MTM | 0 | 0 | 0.0% | 0 | 0.0% | $0 | $0.00 |
| 2014 | 6 | 12,766 | 3.2% | 12,766 | 3.2% | $155,919 | $12.21 |
| 2015 | 3 | 8,176 | 2.1% | 20,942 | 5.3% | $164,796 | $20.16 |
| 2016 | 10 | 25,651 | 6.5% | 46,593 | 11.8% | $334,404 | $13.04 |
| 2017 | 8 | 21,813 | 5.5% | 68,406 | 17.4% | $288,339 | $13.22 |
| 2018 | 7 | 16,954 | 4.3% | 85,360 | 21.7% | $233,325 | $13.76 |
| 2019 | 9 | 35,767 | 9.1% | 121,127 | 30.8% | $480,920 | $13.45 |
| 2020 | 5 | 93,138 | 23.6% | 214,265 | 54.4% | $1,213,504 | $13.03 |
| 2021 | 0 | 0 | 0.0% | 214,265 | 54.4% | $0 | $0.00 |
| 2022 | 0 | 0 | 0.0% | 214,265 | 54.4% | $0 | $0.00 |
| 2023 | 2 | 15,968 | 4.1% | 230,233 | 58.4% | $186,412 | $11.67 |
| 2024 | 0 | 0 | 0.0% | 230,233 | 58.4% | $0 | $0.00 |
| Thereafter | 9 | 101,959 | 25.9% | 332,192 | 84.3% | $1,136,693 | $11.15 |
| Vacant | 0 | 61,710 | 15.7% | 393,902 | 100.0% | $0 | $0.00 |
| Total/Weighted Average | 59 | 393,902 | 100.0% | $4,194,311 | $12.63 |
| (1) | Information obtained from the underwritten rent roll. |
| (2) | Certain tenants may have lease termination options that are exercisable prior to the stated expiration date of the subject lease and that are not considered in the Lease Expiration Schedule. |
| (3) | Weighted Average Annual U/W Base Rent PSF excludes vacant space. |
The following table presents historical occupancy percentages at the Canadian Pacific Plaza Property:
Historical Occupancy
12/31/2010(1) | 12/31/2011(2)(3) | 12/31/2012(2)(3) | 10/31/2013(3) | |||
| NAV | 50.7% | 56.3% | 84.3% |
| (1) | Not available from seller. |
(2) | Information obtained from the borrower. |
| (3) | Since August 2011 leases have been signed for 199,982 square feet of space at the Canadian Pacific Plaza Property, representing 50.8% of the Canadian Pacific Plaza Property square footage and 59.8% of annual underwritten Base Rent. |
Operating History and Underwritten Net Cash Flow. The following table presents certain information relating to the historical operating performance and the Underwritten Net Cash Flow at the Canadian Pacific Plaza Property:
Cash Flow Analysis
| 2011 | 2012 | TTM 10/31/2013 | U/W(1) | U/W $ per SF | ||||||
| Base Rent | $970,636 | $2,348,082 | $2,516,150 | $4,911,099 | $12.47 | |||||
| Grossed Up Vacant Space | 0 | 0 | 0 | 0 | 0 | |||||
| Total Reimbursables | 898,377 | 2,757,951 | 3,262,512 | 5,003,808 | 12.70 | |||||
| Other Income | 69,972 | 237,498 | 319,812 | 550,604(2) | 1.40 | |||||
| Less Vacancy & Credit Loss | 0 | 0 | 0 | (1,505,953)(3) | (3.82) | |||||
| Effective Gross Income | $1,938,985 | $5,343,531 | $6,098,474 | $8,959,556 | $22.75 | |||||
| Total Operating Expenses | $1,411,235 | $4,410,887 | $4,590,233 | $4,717,060 | $11.98 | |||||
| Net Operating Income | $527,750 | $932,644 | $1,508,241 | $4,242,496 | $10.77 | |||||
| TI/LC | 0 | 0 | 0 | 160,614 | 0.41 | |||||
| Capital Expenditures | 0 | 0 | 0 | 98,476 | 0.25 | |||||
| Net Cash Flow | $527,750 | $932,644 | $1,508,241 | $3,983,407 | $10.11 | |||||
| NOI DSCR | 0.20x | 0.36x | 0.58x | 1.62x | ||||||
| NCF DSCR | 0.20x | 0.36x | 0.58x | 1.52x | ||||||
| NOI DY | 1.3% | 2.4% | 3.8% | 10.7% | ||||||
| NCF DY | 1.3% | 2.4% | 3.8% | 10.0% |
| (1) | The increase in underwritten Effective Gross Income and underwritten Net Operating Income from trailing 12 months ended October 31, 2013 is primarily attributed to tenants’ expiring free rent periods, rent bumps through December 2014, the straight-line rent for Canadian Pacific Rail and new leasing activity (93,006 square feet of new leasing activity since the fourth quarter of 2012, accounting for $1,158,726 in underwritten Base Rent). See also “Major Tenants” section. |
| (2) | The underwritten Other Income is higher than the trailing 12 months ended October 31, 2013 primarily due to a new parking operating lease which increased parking revenue from $142,694 to $370,000 per annum. |
| (3) | The underwritten economic vacancy is 15.2%. The Canadian Pacific Plaza Property was 84.3% physically occupied as of October 31, 2013. |
THE INFORMATION IN THIS STRUCTURAL AND COLLATERAL TERM SHEET IS NOT COMPLETE AND MAY BE AMENDED PRIOR TO THE TIME OF SALE. THIS TERM SHEET IS NOT AN OFFER TO SELL THESE SECURITIES AND IT IS NOT A SOLICITATION OF AN OFFER TO BUY THESE SECURITIES IN ANY JURISDICTION WHERE THE OFFER OR SALE IS NOT PERMITTED.
100
| CANADIAN PACIFIC PLAZA |
Appraisal. As of the appraisal valuation date of September 5, 2013, the Canadian Pacific Plaza Property had an “as-is” appraised value of $53,500,000.
Environmental Matters. According to the Phase I environmental site assessment dated September 9, 2013, there was no evidence of any recognized environmental conditions.
Market Overview and Competition. The Canadian Pacific Plaza Property is located in the central business district of Minneapolis, Minnesota. The Canadian Pacific Plaza Property is situated one block south of the Blue Line Light Rail “Nicollet Mall” station, which connects downtown Minneapolis to the Minneapolis-Saint Paul International Airport, and to downtown Saint Paul via connection from the Green Line train station (opening mid-2014). The Canadian Pacific Plaza Property has two skyway access points, connecting it to the largest continuous skyway system in the United States. According to the appraisal, the estimated 2013 population in the Minneapolis-Saint Paul Metro Area is 3,363,277, and the average unemployment rate in the Minneapolis-Saint Paul metro area was 4.7% as of May 2013 compared to the State of Minnesota, which had an unemployment rate of 4.9%.
According to the appraisal, the Minneapolis-Saint Paul metro area office market contains approximately 71.6 million square feet of office space with an overall vacancy rate of 17.5%, as of the second quarter of 2013. The Canadian Pacific Plaza Property is located in the Minneapolis central business district submarket, which contains approximately 26.2 million square feet of office space with an overall vacancy rate of 16.9%, as of the second quarter of 2013. The Minneapolis central business district class A and class B vacancy rates were 10.7% and 24.9%, respectively, as of the second quarter of 2013. The Minneapolis central business district class A and class B market rents were $16.96 per square foot and $10.98 per square foot on a triple net basis, respectively. The appraiser concluded the average rent for the competitive peer submarket set to be $12.00 per square foot, on a triple net basis.
The following table presents certain information relating to comparable office properties for the Canadian Pacific Plaza Property:
Competitive Set(1)
Canadian Pacific Plaza (Subject) | Oracle and International Centre | Fifth Street Towers | 225 South Sixth Street | Young Quinlan Building | |
| Market | Minneapolis CBD | Minneapolis CBD | Minneapolis CBD | Minneapolis CBD | Minneapolis CBD |
| Distance from Subject | -- | 0.3 miles | 0.1 miles | 0.1 miles | 0.3 miles |
| Property Type | Office | Office | Office | Office | Office |
| Stories | 20 | 25 | 53 | 5 | |
| Year Built/Renovated | 1960/1999 | 1984/NAP | 1985/NAP | 1992/NAP | 1925/Various |
| Total GLA | 393,902 SF | 622,173 SF | 436,551 SF | 1,401,233 SF | 146,816 SF |
| Total Occupancy | 84% | 90% | 65% | 84% | 100% |
| (1) | Information obtained from the appraisal dated September 5, 2013. |
The Borrower. The borrower is CanPac Owner LLC, a Delaware limited liability company and a single purpose entity with a managing member that has one independent director. Legal counsel to the borrower delivered a non-consolidation opinion in connection with the origination of the Canadian Pacific Plaza Mortgage Loan. Jon Hempel and Joshua Krsnak are the guarantors of certain nonrecourse carveouts under the Canadian Pacific Plaza Mortgage Loan.
The Sponsors. The sponsors are Jon Hempel, Joshua Krsnak and an affiliate of Ladder Capital Finance LLC (“Ladder”). Such affiliate of Ladder maintains a 90.0% indirect interest in the borrower. Jon Hempel is the president of the Hempel Companies and Joshua Krsnak is an executive vice president at Hempel Companies. Since 2001, Hempel Companies has owned over 1.8 million square feet of office and 340 hospitality and multifamily units in the Minneapolis-Saint Paul metro area. Ladder Capital Finance Holdings LLLP and its consolidated subsidiaries, including Ladder Capital Finance, LLC are a commercial real estate investment company focused on the origination of first mortgage and mezzanine loans, equity investment in commercial real estate and investing in investment graderated securities secured by commercial real estate. See “Risk Factors – Risks Related to the Offered Certificated – Various Other Securitization-Level Conflicts of Interest May Have an Adverse Effect on Your Offered Certificates – Conflicts Between the Trust Fund and the Mortgage Loan Sellers and Their Affiliates” in the Free Writing Prospectus.
Escrows. The loan documents provide for upfront escrows at closing in the amount of $251,920 for real estate taxes, $36,057 for insurance, $653,676 for free rent reserve, $1,926,589 for outstanding tenant improvement and leasing commissions and $955,633 for future tenant improvement and leasing commissions. The loan documents also provide for ongoing monthly escrows in the amount of $83,973 for real estate taxes, $7,211 for insurance, $8,206 for replacement reserves and $13,232 for tenant improvements and leasing commissions.
Lockbox and Cash Management. The Canadian Pacific Plaza Mortgage Loan requires a lender-controlled lockbox account, which is already in place, and that the borrower direct tenants to pay their rents directly to such lockbox account. The loan documents also require that all rents received by the borrower or the property manager be deposited into the lockbox account within two business days after receipt. Prior to the occurrence of a Cash Management Period (as defined below) all funds on deposit in the lockbox account are swept into the borrower’s operating account on a daily basis. During a Cash Management Period, all funds on deposit in the lockbox account are swept on a daily basis to a cash management account under the control of the lender.
A “Cash Management Period” will commence upon either of the following events: (i) the occurrence of an event of default or (ii) the amortizing net cash flow debt service coverage ratio falling below 1.05x. A Cash Management Period will end with respect to the
THE INFORMATION IN THIS STRUCTURAL AND COLLATERAL TERM SHEET IS NOT COMPLETE AND MAY BE AMENDED PRIOR TO THE TIME OF SALE. THIS TERM SHEET IS NOT AN OFFER TO SELL THESE SECURITIES AND IT IS NOT A SOLICITATION OF AN OFFER TO BUY THESE SECURITIES IN ANY JURISDICTION WHERE THE OFFER OR SALE IS NOT PERMITTED.
101
| CANADIAN PACIFIC PLAZA |
matters described in clause (i) above, when such event of default has been cured, and with respect to the matters described in clause (ii) above, when an amortizing debt service coverage ratio of at least 1.05x has been achieved for two consecutive calendar quarters. The borrower has the right to partially prepay the Canadian Pacific Plaza Mortgage Loan without penalty or premium to satisfy the minimum debt service coverage ratio in order to end a Cash Management Period.
Property Management. The Canadian Pacific Plaza Property is managed by NorthStar Equity Services, LLC.
Assumption. The borrower has the right to transfer the Canadian Pacific Plaza Property, provided that no event of default has occurred and is continuing and certain other conditions are satisfied, including that the lender reasonably determines that the proposed transferee and guarantor satisfy the lender’s credit review and underwriting standards, taking into consideration transferee’s experience, financial strength and general business standing.
Partial Release. Not permitted.
Real Estate Substitution. Not Permitted.
Subordinate and Mezzanine Indebtedness. The borrower has the right to incur mezzanine financing subject to the borrower’s satisfaction of certain conditions precedent including, but not limited to: (i) no event of default has occurred or is continuing; (ii) the loan-to-value ratio including all mortgage and mezzanine debt is not greater than 75.0%; (iii) the amortizing net cash flow debt service coverage ratio including all mortgage and mezzanine debt is not less than 1.25x; (iv) no affiliate of Ladder Capital Finance LLC shall own any direct or indirect equity interest in the borrower; and (v) the execution of an intercreditor agreement.
Ground Lease. None.
Terrorism Insurance. The loan documents require that the “all risk” insurance policy required to be maintained by the borrower provide coverage for damage from terrorism in an amount equal to the full replacement cost of Canadian Pacific Plaza Property as well as business interruption insurance covering no less than the 18-month period following the occurrence of a casualty event, together with a six-month extended period of indemnity.
THE INFORMATION IN THIS STRUCTURAL AND COLLATERAL TERM SHEET IS NOT COMPLETE AND MAY BE AMENDED PRIOR TO THE TIME OF SALE. THIS TERM SHEET IS NOT AN OFFER TO SELL THESE SECURITIES AND IT IS NOT A SOLICITATION OF AN OFFER TO BUY THESE SECURITIES IN ANY JURISDICTION WHERE THE OFFER OR SALE IS NOT PERMITTED.
102
(THIS PAGE INTENTIONALLY LEFT BLANK)
103
CALIDUS STUDENT HOUSING PORTFOLIO |

THE INFORMATION IN THIS STRUCTURAL AND COLLATERAL TERM SHEET IS NOT COMPLETE AND MAY BE AMENDED PRIOR TO THE TIME OF SALE. THIS TERM SHEET IS NOT AN OFFER TO SELL THESE SECURITIES AND IT IS NOT A SOLICITATION OF AN OFFER TO BUY THESE SECURITIES IN ANY JURISDICTION WHERE THE OFFER OR SALE IS NOT PERMITTED.
104
CALIDUS STUDENT HOUSING PORTFOLIO |
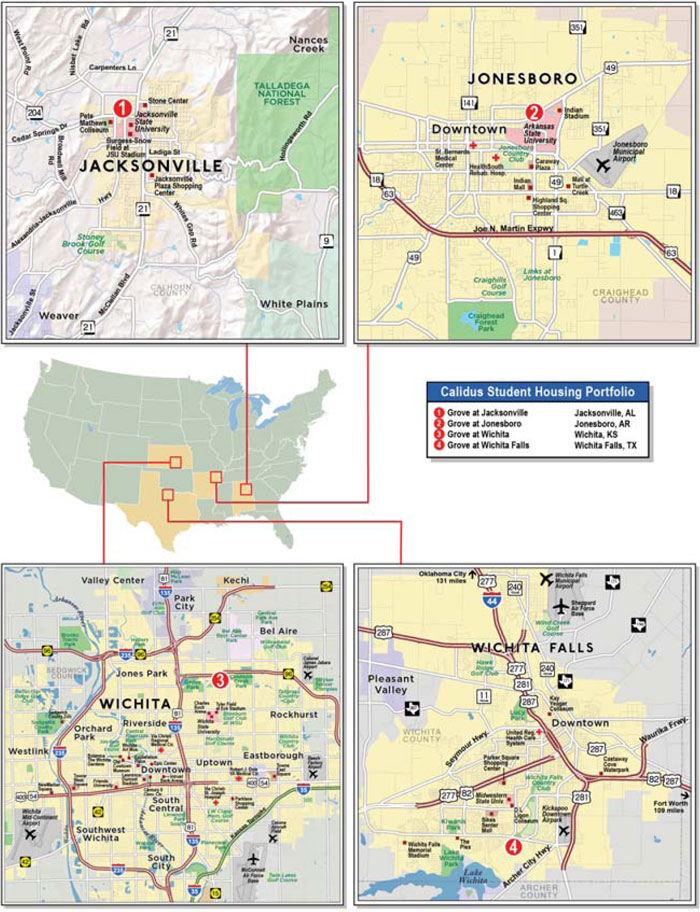
THE INFORMATION IN THIS STRUCTURAL AND COLLATERAL TERM SHEET IS NOT COMPLETE AND MAY BE AMENDED PRIOR TO THE TIME OF SALE. THIS TERM SHEET IS NOT AN OFFER TO SELL THESE SECURITIES AND IT IS NOT A SOLICITATION OF AN OFFER TO BUY THESE SECURITIES IN ANY JURISDICTION WHERE THE OFFER OR SALE IS NOT PERMITTED.
105
| No. 9 – Calidus Student Housing Portfolio |
| Loan Information | Property Information | ||||||
| Mortgage Loan Seller: | Ladder Capital Finance LLC | Single Asset/Portfolio: | Portfolio | ||||
| Credit Assessment (DBRS/Fitch/Moody’s): | NR/NR/NR | Property Type: | Multifamily | ||||
| Original Principal Balance: | $38,814,000 | Specific Property Type: | Student Housing | ||||
| Cut-off Date Principal Balance: | $38,814,000 | Location: | Various – See Table | ||||
| % of Initial Pool Balance: | 3.1% | Size: | 2,016 beds | ||||
| Loan Purpose: | Acquisition | Cut-off Date Principal Balance Per Bed(2): | $19,253 | ||||
Borrower Names(1): | Various | Year Built/Renovated: | Various – See Table | ||||
| Sponsors: | Jonathan Cameron-Hayes; Benjamin Shibe Macfarland III; William J. Levy; ZAIS Group | Title Vesting: | Fee | ||||
| Mortgage Rate: | 5.350% | Property Manager: | BMOC, Inc. | ||||
| Note Date: | December 27, 2013 | 3rd Most Recent Occupancy: | 77.4% (12/31/2010) | ||||
| Anticipated Repayment Date: | NAP | 2nd Most Recent Occupancy (As of): | 79.3% (12/31/2011) | ||||
| Maturity Date: | January 6, 2024 | Most Recent Occupancy (As of): | 83.0% (12/31/2012) | ||||
| IO Period: | 24 months | Current Occupancy (As of): | 94.6% (12/12/2013) | ||||
| Loan Term (Original): | 120 months | ||||||
| Seasoning: | 1 month | Underwriting and Financial Information: | |||||
| Amortization Term (Original): | 360 months | ||||||
| Loan Amortization Type: | Interest-only, Amortizing Balloon | 3rd Most Recent NOI (As of): | $3,516,773 (12/31/2011) | ||||
| Interest Accrual Method: | Actual/360 | 2nd Most Recent NOI (As of): | $3,664,248 (12/31/2012) | ||||
| Call Protection: | L(25),D(91),O(4) | Most Recent NOI (As of): | $4,026,741 (TTM 9/30/2013) | ||||
| Lockbox Type: | Soft/Upfront Cash Management | ||||||
Additional Debt(2): | Yes | U/W Revenues: | $9,006,166 | ||||
Additional Debt Type(2): | Mezzanine | U/W Expenses: | $5,002,816 | ||||
| U/W NOI: | $4,003,350 | ||||||
Escrows and Reserves(3): | U/W NCF: | $3,700,950 | |||||
U/W NOI DSCR(2): | 1.54x | ||||||
Type: | Initial | Monthly | Cap (If Any) | U/W NCF DSCR(2): | 1.42x | ||
| Taxes | $186,609 | $46,652 | NAP | U/W NOI Debt Yield(2): | 10.3% | ||
| Insurance | $48,689 | $24,344 | NAP | U/W NCF Debt Yield(2): | 9.5% | ||
| Replacement Reserve | $108,070 | $25,200 | NAP | As-Is Appraised Value: | $57,500,000 | ||
| Financial Aid Reserve | $250,000 | $25,000 | $250,000 | As-Is Appraisal Valuation Date(4): | Various | ||
| Rebranding Reserve | $40,000 | $0 | NAP | Cut-off Date LTV Ratio(2): | 67.5% | ||
| Deferred Maintenance | $12,063 | $0 | NAP | LTV Ratio at Maturity or ARD(2): | 58.9% | ||
| (1) | The borrowers are: ASHP Jacksonville, LLC, ASHP Jonesboro, LLC, ASHP Wichita, LLC and ASHP Wichita Falls, LLC. |
| (2) | See “Subordinate and Mezzanine Indebtedness” section. The equity interests in the Calidus Student Housing Portfolio Mortgage Loan borrowers have been pledged to secure mezzanine indebtedness with a principal balance of $4,000,000. All LTV, DSCR, debt yield and Cut-off Date Principal Balance per bed numbers shown in the chart above are based solely on the $38,814,000 mortgage loan financing. As of the Cut-off Date, the combined LTV ratio is 74.5%, the combined underwritten NCF DSCR is 1.20x, and the combined underwritten NCF Debt Yield is 8.6%. |
| (3) | See “Escrows” section. |
| (4) | See “Appraisal” section. |
The Mortgage Loan. The mortgage loan (the “Calidus Student Housing Portfolio Mortgage Loan”) is evidenced by a single promissory note that is secured by a first mortgage encumbering four student housing properties located in Texas, Arkansas, Alabama and Kansas (the “Calidus Student Housing Portfolio Properties”). The Calidus Student Housing Portfolio Mortgage Loan was originated on December 27, 2013 by Ladder Capital Finance LLC. The Calidus Student Housing Portfolio Mortgage Loan had an original principal balance of $38,814,000, has an outstanding principal balance as of the Cut-off Date of $38,814,000 and accrues interest at an interest rate of 5.350% per annum. The Calidus Student Housing Portfolio Mortgage Loan had an initial term of 120 months, has a remaining term of 119 months as of the Cut-off Date and requires interest-only payments for the first 24 payments following origination and, thereafter, requires payments of principal and interest based on a 30-year amortization schedule. The Calidus Student Housing Portfolio Mortgage Loan matures on January 6, 2024.
Following the lockout period, the borrower has the right to defease the Calidus Student Housing Portfolio Mortgage Loan in whole, but not in part, on any day before October 6, 2023. In addition, the Calidus Student Housing Portfolio Mortgage Loan is prepayable without penalty on or after October 6, 2023.
THE INFORMATION IN THIS STRUCTURAL AND COLLATERAL TERM SHEET IS NOT COMPLETE AND MAY BE AMENDED PRIOR TO THE TIME OF SALE. THIS TERM SHEET IS NOT AN OFFER TO SELL THESE SECURITIES AND IT IS NOT A SOLICITATION OF AN OFFER TO BUY THESE SECURITIES IN ANY JURISDICTION WHERE THE OFFER OR SALE IS NOT PERMITTED.
106
| CALIDUS STUDENT HOUSING PORTFOLIO |
Sources and Uses
| Sources | Uses | |||||||
| Original loan amount | $38,814,000 | 74.5% | Purchase price | $50,370,133 | 96.7% | |||
Mezzanine loan amount Sponsor’s new cash contribution | 4,000,000 9,279,548 | 7.7 17.8 | Reserves Closing costs | 645,431 1,077,984 | 1.2 2.1 | |||
| Total Sources | $52,093,548 | 100.0% | Total Uses | $52,093,548 | 100.0% |
The Properties. The Calidus Student Housing Portfolio Mortgage Loan is secured by the fee interest in four student housing properties totaling 2,016 beds located in Texas, Arkansas, Alabama and Kansas. Universities served include Arkansas State University, Wichita State University, Midwestern State University, and Jacksonville State University. The Calidus Student Housing Portfolio Properties include a range of amenities including playgrounds, basketball courts, laundry rooms, swimming pools, picnic/grilling areas and clubhouses. The Calidus Student Housing Portfolio Properties were developed between 2007 and 2008. As of December 12, 2013, the Calidus Student Housing Portfolio Properties were 94.6% occupied.
The following table presents certain information relating to the Calidus Student Housing Portfolio Properties:
Property Name – Location | Allocated Cut-off Date Principal Balance | % of Portfolio Cut-off Date Principal Balance | Occupancy | Year Built/ Renovated | Beds | Appraised Value | |
| Grove at Jacksonville – Jacksonville, AL | $11,156,499 | 28.7% | 100.0% | 2007/NAP | 504 | $15,150,000 | |
| Grove at Jonesboro – Jonesboro, AR | $11,113,054 | 28.6% | 89.9% | 2008/NAP | 504 | $15,650,000 | |
| Grove at Wichita – Wichita, KS | $9,643,069 | 24.8% | 93.5% | 2008/NAP | 504 | $12,850,000 | |
| Grove at Wichita Falls – Wichita Falls, TX | $6,901,378 | 17.8% | 94.9% | 2008/NAP | 504 | $13,850,000 | |
| Total/Weighted Average | $38,814,000 | 100.0% | 94.6% | 2,016 | $57,500,000 | ||
The following table presents certain information relating to the unit mix of the Calidus Student Housing Portfolio Properties:
Unit Mix Summary(1)
| Unit Type | No. of Units | No. of Beds | % of Total Units | Average Unit Size (SF) | Average Monthly Rent per bed |
| 2 Bedroom | 288 | 576 | 37.5% | 817 | $471 |
| 3 Bedroom | 480 | 1,440 | 62.5% | 1,199 | $435 |
| Total/ Weighted Average | 768 | 2,016 | 100.0% | 1,056 | $445 |
| (1) | Information obtained from the appraisals. |
The following table presents historical occupancy percentages at the Calidus Student Housing Portfolio Properties:
Historical Occupancy
12/31/2010(1) | 12/31/2011(1) | 12/31/2012(1) | 12/12/2013(2) | |||
| 77.4% | 79.3% | 83.0% | 94.6% |
| (1) | Information obtained from the borrower. |
(2) | 70 units at the Grove at Wichita Falls are leased to Midwestern State University under a master lease that expired on December 20, 2013. Each of the master leased beds was underwritten as vacant in the mortgage loan seller’s underwritten NCF. |
THE INFORMATION IN THIS STRUCTURAL AND COLLATERAL TERM SHEET IS NOT COMPLETE AND MAY BE AMENDED PRIOR TO THE TIME OF SALE. THIS TERM SHEET IS NOT AN OFFER TO SELL THESE SECURITIES AND IT IS NOT A SOLICITATION OF AN OFFER TO BUY THESE SECURITIES IN ANY JURISDICTION WHERE THE OFFER OR SALE IS NOT PERMITTED.
107
| CALIDUS STUDENT HOUSING PORTFOLIO |
Operating History and Underwritten Net Cash Flow. The following table presents certain information relating to the historical operating performance and the Underwritten Net Cash Flow at the Calidus Student Housing Portfolio Properties:
Cash Flow Analysis
2011 | 2012 | TTM 9/30/2013 | U/W | U/W $ per Bed | |||||||
| Base Rent | $11,061,673 | $10,816,092 | $10,763,885 | $10,583,004 | $5,250 | ||||||
| Less Concessions | (998,795) | (852,072) | (959,523) | (959,523) | (476) | ||||||
| Other Income | 403,527 | 337,317 | 379,225 | 379,225 | 188 | ||||||
| Less Vacancy & Credit Loss | (2,331,801) | (1,765,039) | (1,313,799) | (996,540)(1) | (494) | ||||||
| Effective Gross Income | $8,134,604 | $8,536,298 | $8,869,788 | $9,006,166 | $4,467 | ||||||
| �� | |||||||||||
| Total Operating Expenses | $4,617,831 | $4,872,050 | $4,843,047 | $5,002,816 | $2,481 | ||||||
| Net Operating Income | $3,516,773 | $3,664,248 | $4,026,741 | $4,003,350 | $1,986 | ||||||
| Replacement Reserves | 0 | 0 | 0 | 302,400 | 150 | ||||||
| Net Cash Flow | $3,516,773 | $3,664,248 | $4,026,741 | $3,700,950 | $1,836 | ||||||
| NOI DSCR | 1.35x | 1.41x | 1.55x | 1.54x | |||||||
| NCF DSCR | 1.35x | 1.41x | 1.55x | 1.42x | |||||||
| NOI DY | 9.1% | 9.4% | 10.4% | 10.3% | |||||||
| NCF DY | 9.1% | 9.4% | 10.4% | 9.5% | |||||||
(1) The underwritten economic vacancy is 10.8%. The Calidus Student Housing Portfolio Properties were 94.6% physically occupied as of December 12, 2013. | |||||||||||
Appraisal. As of the appraisal valuation dates ranging from November 23, 2013 to November 26 2013, the Calidus Student Housing Portfolio Properties had an aggregate “as-is” appraised value of $57,500,000.
Environmental Matters. According to the Phase I environmental site assessments, there was no evidence of any recognized environmental conditions at the Calidus Student Housing Portfolio Properties.
Market Overview and Competition. The Calidus Student Housing Portfolio Properties are located in Jacksonville, Alabama; Jonesboro, Arkansas; Wichita, Kansas; and Wichita Falls, Texas.
Grove at Jacksonville
The Grove at Jacksonville property is located in the city of Jacksonville, Calhoun County, Alabama. Jacksonville is located along Highway 21, approximately 16 miles north of Interstate 20, between Birmingham, Alabama and Atlanta, Georgia. The Grove at Jacksonville property is located on the north side of Nisbet Street, approximately one half mile north of the Jacksonville State University. The appraisal identified a competitive set of five student housing properties, which exhibit a range of year of completion from 1965 to 2012, a range of occupancy rates from 76% to 98% and a range of average asking monthly rents from $263 to $622 per bed.
The following table presents certain information relating to some comparable student housing properties for the Grove at Jacksonville property:
Competitive Set(1) – Grove at Jacksonville
Grove at Jacksonville (Subject) | The Reserve at Jacksonville | Park Place | University House | Pointe at Troy | Edge at Troy | |
| Location | Jacksonville, AL | Jacksonville, AL | Jacksonville, AL | Birmingham, AL | Troy, AL | Troy, AL |
| Distance to Subject | -- | 0.1 mile | 0.2 mile | 79.7 miles | 167.0 miles | 168.0 miles |
| Year Built/Renovated | 2007/NAP | 2000/NAP | 1965-1970/NAP | 2007/NAP | 2002/NAP | 2012/NAP |
| Number of Beds | 504 | 504 | 246 | 521 | 418 | 400 |
| Average Rent (per bed) | $429 | $390 | $263 | $622 | $445 | $498 |
| Total Occupancy | 100% | 76% | 98% | 97% | 92% | 95% |
| (1) | Information obtained from the appraisal. |
THE INFORMATION IN THIS STRUCTURAL AND COLLATERAL TERM SHEET IS NOT COMPLETE AND MAY BE AMENDED PRIOR TO THE TIME OF SALE. THIS TERM SHEET IS NOT AN OFFER TO SELL THESE SECURITIES AND IT IS NOT A SOLICITATION OF AN OFFER TO BUY THESE SECURITIES IN ANY JURISDICTION WHERE THE OFFER OR SALE IS NOT PERMITTED.
108
| CALIDUS STUDENT HOUSING PORTFOLIO |
Grove at Jonesboro
The Grove at Jonesboro property is a student housing property built in 2008 and located in Jonesboro, Arkansas. Jonesboro is located approximately 40 miles northwest of Interstate 55, which provides access to Memphis, approximately 60 miles to the southeast. Jonesboro is approximately 130 miles northeast of Little Rock, via Highway 67 and Highway 49. The Grove at Jonesboro property’s neighborhood is the Arkansas State University campus (also known as ASU or ASTATE). The Grove at Jonesboro property is 0.1 miles from the ASU Jonesboro campus. Arkansas State University (also known as ASU or ASTATE) is a public university and is the flagship campus of the Arkansas State University System, the state’s second largest college system and third largest university by enrollment with an enrollment of 13,553 students.
The appraisal identified a competitive set of five student housing properties, which exhibit a range of year completion from 1996 to 2009, a range of occupancy rates from 90% to 99% and a range of average asking monthly rents from $363 to $488 per bed.
The following table presents certain information relating to some comparable student housing properties for the Grove at Jonesboro property:
Competitive Set(1) – Grove at Jonesboro
Grove at Jonesboro (Subject) | Collegiate Park | Northpark Quads | Red Wolf Den | The Village | The Links | |
| Location | Jonesboro, AR | Jonesboro, AR | Jonesboro, AR | Jonesboro, AR | Jonesboro, AR | Jonesboro, AR |
| Distance to Subject | -- | 0.1 mile | 0.3 mile | 0.7 mile | 1.1 miles | 4.8 miles |
| Year Built/Renovated | 2008/NAP | 1999/NAP | 2006/NAP | 2009/NAP | 2003-2005/NAP | 1996/NAP |
| Number of Beds | 504 | 334 | 836 | 189 | 378 | 700 |
| Average Rent (per bed) | $452 | $479 | $454 | $488 | $363 | $387 |
| Total Occupancy | 90% | 95% | 95% | 99% | 90% | 95% |
| (1) | Information obtained from the appraisal. |
Grove at Wichita
The Grove at Wichita property is a student housing property located in Wichita, Kansas. The Kansas Turnpike (Interstate 35), Interstates 135 and 235, and U.S. Route 54/400, run through and near Wichita. The Grove at Wichita property serves as a housing option for the Wichita State University Campus (“Wichita State”). Wichita State is a four-year university with over 14,800 students enrolled each semester. The influence of Wichita State is positive for the Grove at Wichita property and retail properties in the Grove at Wichita neighborhood. The neighborhood also has several large shopping centers in the area along North Rock Road, which is the main commercial corridor. These shopping centers include a Wal-Mart Supercenter, numerous full-service and fast food restaurants and a community shopping center.
The appraisal identified a competitive set of five student housing properties, which exhibit a range of year of completion from 1973 to 2008, a range of occupancy rates from 90% to 97% and a range of average asking monthly rents from $322 to $507 per bed. The Grove at Wichita property is located approximately one mile north of Wichita State University and approximately five miles northeast of the Wichita central business district.
The following table presents certain information relating to some comparable student housing properties for the Grove at Wichita property:
Competitive Set(1) – Grove at Wichita
Grove at Wichita (Subject) | Tall Oaks | Village Park at Woodgate | Wheatshocker | Inwood Crossing | Olde English Manor | |
| Location | Wichita, KS | Wichita, KS | Wichita, KS | Wichita, KS | Wichita, KS | Wichita, KS |
| Distance to Subject | -- | 0.8 mile | 1.3 miles | 1.9 miles | 2.4 miles | 2.9 miles |
| Year Built/Renovated | 2008/NAP | 1975/NAP | 1973/NAP | 1985/NAP | 2008/NAP | 1989/NAP |
| Number of Beds | 504 | 516 | 395 | 388 | 616 | 460 |
| Average Rent (per bed) | $431 | $333 | $331 | $507 | $336 | $322 |
| Total Occupancy | 94% | 97% | 94% | 95% | 95% | 90% |
| (1) | Information obtained from the appraisal. |
THE INFORMATION IN THIS STRUCTURAL AND COLLATERAL TERM SHEET IS NOT COMPLETE AND MAY BE AMENDED PRIOR TO THE TIME OF SALE. THIS TERM SHEET IS NOT AN OFFER TO SELL THESE SECURITIES AND IT IS NOT A SOLICITATION OF AN OFFER TO BUY THESE SECURITIES IN ANY JURISDICTION WHERE THE OFFER OR SALE IS NOT PERMITTED.
109
| CALIDUS STUDENT HOUSING PORTFOLIO |
Grove at Wichita Falls
The Grove at Wichita Falls property is a student housing property located in Wichita Falls, Texas. Wichita Falls is 138 miles northwest of Fort Worth, Texas, 150 miles northwest of Dallas, and 145 miles southwest of Oklahoma City, Oklahoma. The Grove at Wichita Falls property serves as a housing option for Midwestern State University (“Midwestern”). Midwestern is a four-year university with over 6,000 students enrolled each semester. Highway access from Wichita Falls to the north and to Interstate 40 is by Interstate 44.
The appraisal identified a competitive set of five student housing properties, which exhibit a range of year of completion from 1970 to 2009, a range of occupancy rates from 89% to 100% and a range of average asking monthly rents from $353 to $594 per bed. The Grove at Wichita Falls property is located approximately one mile south of the Midwestern State University campus and four miles south of the Wichita Falls central business district.
The following table presents certain information relating to some comparable student housing properties for the Grove at Wichita Falls property:
Competitive Set(1) – Grove at Wichita Falls
Grove at Wichita Falls (Subject) | French Quarter | Sunwatcher Village | McCullough- Trigg | Sundance Court | Bridwell Courts | |
| Location | Wichita Falls, TX | Wichita Falls, TX | Wichita Falls, TX | Wichita Falls, TX | Wichita Falls, TX | Wichita Falls, TX |
| Distance to Subject | -- | 1.4 miles | 1.9 miles | 1.9 miles | 1.9 miles | 2.1 miles |
| Year Built / Renovated | 2008/NAP | 1972-1978/2009 | 2003/NAP | 1993/NAP | 2009/NAP | 1970/NAP |
| Number of Beds | 504 | 636 | 330 | 156 | 274 | 78 |
| Average Rent (per bed) | $469 | $353 | $533 | $477 | $577 | $594 |
| Total Occupancy | 95% | 89% | 100% | 95% | 100% | 100% |
| (1) | Information obtained from the appraisal. |
The Borrowers. The borrowers are ASHP Jacksonville, LLC, ASHP Jonesboro, LLC, ASHP Wichita, LLC and ASHP Wichita Falls, LLC, all single purpose entities and collectively with two independent directors. Legal counsel to the borrower delivered a non-consolidation opinion in connection with the origination of the Calidus Student Housing Portfolio Mortgage Loan. William J. Levy, Jonathan Cameron-Hayes and Benjamin Shibe MacFarland III are guarantors of certain nonrecourse carveouts under the Calidus Student Housing Portfolio Mortgage Loan.
The Sponsors. The sponsors are William J. Levy, Jonathan Cameron-Hayes, Benjamin Shibe MacFarland III and the ZAIS Group. William J. Levy is the CEO of BMOC, Inc., the property manager for the Calidus Student Housing Portfolio Properties. Mr. Levy has been involved in property management for more than 30 years. Mr. Levy’s management portfolios have included as many as 100,000 leases and 75,000 beds in student housing communities all across the United States. BMOC, Inc. currently serves a wide variety of clients, including Fortune 500 Companies and regional developers. Specifically, BMOC, Inc.’s client list includes Harris Bank, Principal Financial, MetLife, Trammell Crow, Berkshire Hathaway and Capmark.
Mr. Cameron-Hayes and Mr. MacFarland are managing members of Calidus Holdings (“Calidus”) which was founded in early 2012 as an investor and operator of commercial real estate assets in the United States. Calidus and its principals have been operating in the real estate market since 1983 and have owned and previously managed a portfolio in excess of 2.5 million square feet of commercial real estate throughout the Southeast.
The ZAIS Group (“ZAIS”) funded 90% of the equity in the transaction on behalf of the San Bernardino County Employees’ Retirement Association (“SBCERA”). ZAIS is an approximately $4.6 billion global asset management firm based in Red Bank, New Jersey. SBCERA manages the retirement and related benefits of employees of San Bernardino County.
Escrows. The loan documents provide for upfront escrows in the amount of $186,609 for real estate taxes, $48,689 for insurance, $40,000 for rebranding, $108,070 for replacement reserves, $12,063 for deferred maintenance and $250,000 for the financial aid reserve (which the borrowers will be able to draw on to cover shortfalls caused by financial aid tenants paying rents late during the first two months of each school year). The loan documents provide for ongoing monthly reserves in the amount of $46,652 for real estate taxes, $24,344 for insurance and $25,200 for replacement reserves. To the extent the financial aid reserve is drawn upon, $25,000 will be escrowed monthly from cashflow to replenish the reserve until a balance of $250,000 is achieved.
Lockbox and Cash Management. The Calidus Student Housing Portfolio Mortgage Loan requires a lender-controlled lockbox account, which is already in place. The loan documents require that all revenues received by the property managers be deposited into the lockbox account within one business day of receipt. Prior to the occurrence of a Cash Trap Event Period (as defined below) all excess funds on deposit will be swept into a borrower controlled account.
Upon the occurrence of a Cash Trap Event Period all excess funds on deposit in the lockbox account will be swept to certain lender controlled restricted accounts.
A “Cash Trap Event Period” will commence upon the earlier of (i) the occurrence and continuance of an event of default and (ii) the amortizing debt service coverage ratio on the total debt for the trailing 12-month period falling below 1.05x (assuming the mezzanine debt service is in-place at closing) at the end of any two consecutive calendar quarters during the trailing 12-month
THE INFORMATION IN THIS STRUCTURAL AND COLLATERAL TERM SHEET IS NOT COMPLETE AND MAY BE AMENDED PRIOR TO THE TIME OF SALE. THIS TERM SHEET IS NOT AN OFFER TO SELL THESE SECURITIES AND IT IS NOT A SOLICITATION OF AN OFFER TO BUY THESE SECURITIES IN ANY JURISDICTION WHERE THE OFFER OR SALE IS NOT PERMITTED.
110
| CALIDUS STUDENT HOUSING PORTFOLIO |
period. A Cash Trap Event Period will expire, with regard to the circumstances in clause (i), upon the cure of such event of default, and with regard to the circumstances in clause (ii), when the amortizing debt service coverage ratio is equal to or greater than 1.15x for the two most recent calendar quarters on a trailing 12-month basis.
Property Management. The Calidus Student Housing Portfolio Properties are managed by an affiliate of the borrowers.
Assumption. The borrower has a one-time right to transfer the Calidus Student Housing Portfolio Properties, provided that no event of default has occurred and is continuing and certain other conditions are satisfied, including (i) the lender’s reasonable determination that the proposed transferee and guarantor satisfy the lender’s credit review and underwriting standards, taking into consideration the transferee’s experience, financial strength and general business standing; (ii) execution of a recourse guaranty and an environmental indemnity by an affiliate of the transferee; and (iii) if requested by the lender, rating agency confirmation from DBRS, Fitch, and Moody’s that the transfer will not result in a downgrade, withdrawal or qualification of the respective ratings assigned to the Series 2014-LC14 certificates.
Partial Release. Not permitted.
Real Estate Substitution. Not permitted.
Subordinate and Mezzanine Indebtedness. ARC Realty Finance Operating Partnership, L.P. (the “Calidus Student Housing Portfolio Mezzanine Lender”) has made a $4,000,000 mezzanine loan (the “Calidus Student Housing Portfolio Mezzanine Loan”) to ASHP Mezz Borrower, LLC, a limited liability company that owns 100% of the borrower under the Calidus Student Housing Portfolio Mortgage Loan. The Calidus Student Housing Portfolio Mezzanine Loan accrues interest at an interest rate of 12.000% per annum and is interest-only. The Calidus Student Housing Portfolio Mezzanine Loan matures on January 6, 2024. The rights of the Calidus Student Housing Portfolio Mezzanine Lender are further described under “Description of the Mortgage Pool–Subordinate and/or Other Financing–Existing (Secured Financing and Mezzanine and Similar Financing)” in the Free Writing Prospectus.
Ground Lease. None.
Terrorism Insurance. The loan documents require that the “all risk” insurance policy required to be maintained by the borrowers provide coverage for terrorism in an amount equal to the full replacement cost of the Calidus Student Housing Portfolio Properties. The loan documents also require business interruption insurance covering no less than the 18-month period following the occurrence of a casualty event, together with a six-month extended period of indemnity.
THE INFORMATION IN THIS STRUCTURAL AND COLLATERAL TERM SHEET IS NOT COMPLETE AND MAY BE AMENDED PRIOR TO THE TIME OF SALE. THIS TERM SHEET IS NOT AN OFFER TO SELL THESE SECURITIES AND IT IS NOT A SOLICITATION OF AN OFFER TO BUY THESE SECURITIES IN ANY JURISDICTION WHERE THE OFFER OR SALE IS NOT PERMITTED.
111
(THIS PAGE INTENTIONALLY LEFT BLANK)
112
| CARUTH PLAZA |
THE INFORMATION IN THIS STRUCTURAL AND COLLATERAL TERM SHEET IS NOT COMPLETE AND MAY BE AMENDED PRIOR TO THE TIME OF SALE. THIS TERM SHEET IS NOT AN OFFER TO SELL THESE SECURITIES AND IT IS NOT A SOLICITATION OF AN OFFER TO BUY THESE SECURITIES IN ANY JURISDICTION WHERE THE OFFER OR SALE IS NOT PERMITTED.
113
| CARUTH PLAZA |
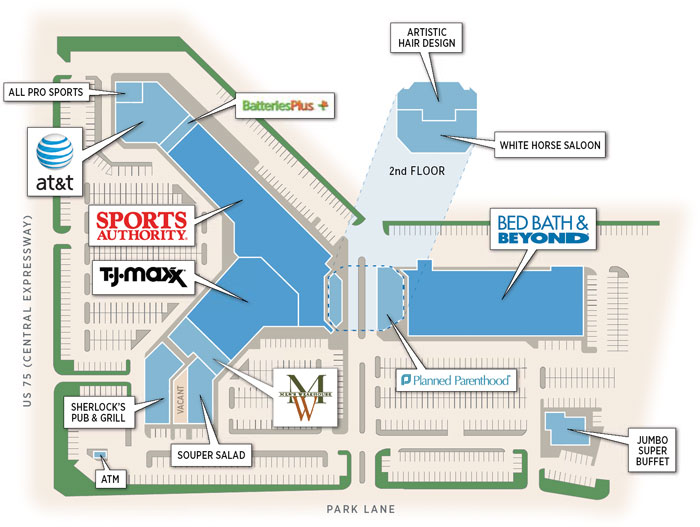
THE INFORMATION IN THIS STRUCTURAL AND COLLATERAL TERM SHEET IS NOT COMPLETE AND MAY BE AMENDED PRIOR TO THE TIME OF SALE. THIS TERM SHEET IS NOT AN OFFER TO SELL THESE SECURITIES AND IT IS NOT A SOLICITATION OF AN OFFER TO BUY THESE SECURITIES IN ANY JURISDICTION WHERE THE OFFER OR SALE IS NOT PERMITTED.
114
| CARUTH PLAZA |

THE INFORMATION IN THIS STRUCTURAL AND COLLATERAL TERM SHEET IS NOT COMPLETE AND MAY BE AMENDED PRIOR TO THE TIME OF SALE. THIS TERM SHEET IS NOT AN OFFER TO SELL THESE SECURITIES AND IT IS NOT A SOLICITATION OF AN OFFER TO BUY THESE SECURITIES IN ANY JURISDICTION WHERE THE OFFER OR SALE IS NOT PERMITTED.
115
| No. 10 – Caruth Plaza | ||||||||
| Loan Information | Property Information | |||||||
| Mortgage Loan Seller: | Wells Fargo Bank, National Association | Single Asset/Portfolio: | Single Asset | |||||
| Credit Assessment (DBRS/Fitch/Moody’s): | NR/NR/NR | Property Type: | Retail | |||||
| Original Principal Balance: | $32,200,000 | Specific Property Type: | Anchored | |||||
| Cut-off Date Principal Balance: | $32,200,000 | Location: | Dallas, TX | |||||
| % of Initial Pool Balance: | 2.6% | Size: | 206,192 SF | |||||
| Loan Purpose: | Refinance | Cut-off Date Principal Balance Per SF: | $156.17 | |||||
| Borrower Name: | Caruth Acquisition, LP | Year Built/Renovated: | 1979/NAP | |||||
| Sponsors: | NADG (US) LLLP; North American Property Group; Susan Reese | Title Vesting: | Fee | |||||
| Mortgage Rate: | 4.970% | Property Manager: | Self-managed | |||||
| Note Date: | January 22, 2014 | 3rd Most Recent Occupancy: | 95.6% (12/31/2010) | |||||
| Anticipated Repayment Date: | NAP | 2nd Most Recent Occupancy (As of): | 96.1% (12/31/2011) | |||||
| Maturity Date: | February 1, 2024 | Most Recent Occupancy (As of)(2): | 90.1% (12/31/2012) | |||||
| IO Period: | 60 months | Current Occupancy (As of)(2): | 98.4% (1/1/2014) | |||||
| Loan Term (Original): | 120 months | |||||||
| Seasoning: | 0 months | Underwriting and Financial Information: | ||||||
| Amortization Term (Original): | 360 months | |||||||
| Loan Amortization Type: | Interest-only, Amortizing Balloon | 3rd Most Recent NOI (As of): | $3,004,435 (12/31/2011) | |||||
| Interest Accrual Method: | Actual/360 | 2nd Most Recent NOI (As of): | $2,745,684 (12/31/2012) | |||||
| Call Protection: | L(24),D(92),O(4) | Most Recent NOI (As of): | $2,829,095 (TTM 10/31/2013) | |||||
| Lockbox Type: | Soft/Springing Cash Management | |||||||
| Additional Debt: | None | |||||||
| Additional Debt Type: | NAP | U/W Revenues: | $4,332,232 | |||||
| U/W Expenses: | $1,360,299 | |||||||
| U/W NOI: | $2,971,932 | |||||||
| U/W NCF: | $2,889,455 | |||||||
Escrows and Reserves(1): | U/W NOI DSCR: | 1.44x | ||||||
| U/W NCF DSCR: | 1.40x | |||||||
Type: | Initial | Monthly | Cap (If Any) | U/W NOI Debt Yield: | 9.2% | |||
| Taxes | $52,766 | $26,383 | NAP | U/W NCF Debt Yield: | 9.0% | |||
| Insurance | $0 | Springing | NAP | As-Is Appraised Value: | $47,900,000 | |||
| Replacement Reserves | $0 | $2,577 | NAP | As-Is Appraisal Valuation Date: | December 5, 2013 | |||
| TI/LC Reserve | $200,000 | $4,296 | $200,000 | Cut-off Date LTV Ratio: | 67.2% | |||
| Outstanding TI Reserve | $26,000 | $0 | NAP | LTV Ratio at Maturity or ARD: | 62.0% | |||
| (1) | See “Escrows” section. |
| (2) | See “Cash Flow Analysis” table. |
The Mortgage Loan. The mortgage loan (the “Caruth Plaza Mortgage Loan”) is evidenced by a single promissory note that is secured by a first mortgage encumbering an anchored retail center located in Dallas, Texas (the “Caruth Plaza Property”). The Caruth Plaza Mortgage Loan was originated on January 22, 2014 by Wells Fargo Bank, National Association. The Caruth Plaza Mortgage Loan had an original principal balance of $32,200,000, has an outstanding principal balance as of the Cut-off Date of $32,200,000 and accrues interest at an interest rate of 4.970% per annum. The Caruth Plaza Mortgage Loan had an initial term of 120 months, has a remaining term of 120 months as of the Cut-off Date and requires interest-only payments for the first 60 payments following origination, and, thereafter requires payments of principal and interest based on a 30-year amortization schedule. The Caruth Plaza Mortgage Loan matures on February 1, 2024.
Following the lockout period, the borrower has the right to defease the Caruth Plaza Mortgage Loan in whole or in part in connection with the Jumbo Super Buffet Outparcel (see “Partial Release” section), on any date before November 1, 2023. In addition, the Caruth Plaza Mortgage Loan is prepayable without penalty on or after November 1, 2023.
THE INFORMATION IN THIS STRUCTURAL AND COLLATERAL TERM SHEET IS NOT COMPLETE AND MAY BE AMENDED PRIOR TO THE TIME OF SALE. THIS TERM SHEET IS NOT AN OFFER TO SELL THESE SECURITIES AND IT IS NOT A SOLICITATION OF AN OFFER TO BUY THESE SECURITIES IN ANY JURISDICTION WHERE THE OFFER OR SALE IS NOT PERMITTED.
116
| CARUTH PLAZA |
Sources and Uses
| Sources | Uses | |||||||
| Original loan amount | $32,200,000 | 100.0% | Loan payoff(1) | $19,811,063 | 61.4% | |||
| Reserves | 278,766 | 0.9 | ||||||
| Closing costs | 580,282 | 1.8 | ||||||
| Return of equity | 11,529,889 | 36.6 | ||||||
| Total Sources | $32,200,000 | 100.0% | Total Uses | $32,200,000 | 100.0% |
| (1) | The Caruth Plaza Property was previously securitized in BSCMS 2004-PWR6. |
The Property. The Caruth Plaza Property is an anchored retail center containing approximately 206,192 square feet located in Dallas, Texas. Built in 1979, the Caruth Plaza Property comprises two retail buildings and one outparcel restaurant and is anchored by Sports Authority, Bed Bath and Beyond and TJ Maxx. The Caruth Plaza Property is situated on a 16.7-acre parcel and provides approximately 1,299 surface parking spaces, resulting in a parking ratio of 6.3 spaces per 1,000 square feet of rentable area. The Caruth Plaza Property had an average occupancy of 95.7% over the past five years and, as of January 1, 2014, the Caruth Plaza Property was 98.4% leased to 15 tenants.
The following table presents certain information relating to the tenancy at the Caruth Plaza Property:
Major Tenants
| Tenant Name | Credit Rating (Fitch/ Moody’s/ S&P)(1) | Tenant NRSF | % of NRSF | Annual U/W Base Rent PSF | Annual U/W Base Rent | % of Total Annual U/W Base Rent | Sales PSF(2) | Occupancy Cost(2) | Lease Expiration Date | |
| Anchor Tenants | ||||||||||
| Sports Authority | NR/NR/NR | 58,100 | 28.2% | $14.00 | $813,400 | 26.9% | $118 | 16.7% | 1/31/2019 | |
| Bed Bath and Beyond | NR/NR/BBB+ | 53,500 | 25.9% | $9.75 | $521,625 | 17.2% | $431 | 4.5% | 1/31/2026 | |
| TJ Maxx | NR/A3/A+ | 25,000 | 12.1% | $15.00 | $375,000 | 12.4% | $460 | 4.6% | 1/31/2021 | |
| Total Anchor Tenants | 136,600 | 66.2% | $12.52 | $1,710,025 | 56.5% | |||||
| Major Tenants | ||||||||||
| AT&T Mobility | A/A3/A- | 10,750 | 5.2% | $33.00 | $354,750 | 11.7% | NAV | NAV | 12/31/2017 | |
| Sherlock’s Pub | NR/NR/NR | 9,440 | 4.6% | $20.00 | $188,800 | 6.2% | $269(3) | 9.9%(3) | 1/31/2016 | |
| Men’s Wearhouse | NR/NR/NR | 5,220 | 2.5% | $30.00 | $156,600 | 5.2% | NAV | NAV | 7/31/2023(4) | |
| Total Major Tenants | 25,410 | 12.3% | $27.55 | $700,150 | 23.1% | |||||
| Non-Major Tenants | 40,939 | 19.9% | $15.11 | $618,490 | 20.4% | |||||
| Occupied Collateral Total | 202,949 | 98.4% | $14.92 | $3,028,665 | 100.0% | |||||
| Vacant Space | 3,243 | 1.6% | ||||||||
| Collateral Total | 206,192 | 100.0% | ||||||||
| (1) | Certain ratings are those of the parent company whether or not the parent guarantees the lease. |
| (2) | Sales PSF and Occupancy Cost represent the trailing 12-month period ending December 31,2012, unless otherwise noted. |
| (3) | Sales PSF and Occupancy Cost represent the trailing 12-month period ending October 31, 2013. |
| (4) | Men’s Wearhouse has the right to terminate its lease if sales from September 2017 through August 2018 do not exceed $2,000,000 ($383 per square foot). The tenant must provide at least three months’ notice and any such notice must be given no later than November 30, 2018. Men’s Wearhouse took occupancy in September 2013 and annual sales are not available. |
The following table presents certain information relating to the historical sales at the Caruth Plaza Property:
Historical Sales (PSF)(1)
| Tenant Name | 2010 | 2011 | 2012 |
| Sports Authority | $130 | $126 | $118 |
| Bed Bath and Beyond | $377 | $413 | $431 |
| TJ Maxx | $397 | $429 | $460 |
(1) | Historical Sales (PSF) are based on historical statements provided by the borrower. |
THE INFORMATION IN THIS STRUCTURAL AND COLLATERAL TERM SHEET IS NOT COMPLETE AND MAY BE AMENDED PRIOR TO THE TIME OF SALE. THIS TERM SHEET IS NOT AN OFFER TO SELL THESE SECURITIES AND IT IS NOT A SOLICITATION OF AN OFFER TO BUY THESE SECURITIES IN ANY JURISDICTION WHERE THE OFFER OR SALE IS NOT PERMITTED.
117
| CARUTH PLAZA |
The following table presents certain information relating to the lease rollover schedule at the Caruth Plaza Property:
Lease Expiration Schedule(1)(2)
Year Ending December 31, | No. of Leases Expiring | Expiring NRSF | % of Total NRSF | Cumulative Expiring NRSF | Cumulative % of Total NRSF | Annual U/W Base Rent | Annual U/W Base Rent PSF(3) |
| MTM | 0 | 0 | 0.0% | 0 | 0.0% | $0 | $0.00 |
| 2014 | 0 | 0 | 0.0% | 0 | 0.0% | $0 | $0.00 |
| 2015 | 2 | 8,450 | 4.1% | 8,450 | 4.1% | $157,280 | $18.61 |
| 2016 | 2 | 15,418 | 7.5% | 23,868 | 11.6% | $320,316 | $20.78 |
| 2017 | 2 | 13,350 | 6.5% | 37,218 | 18.1% | $400,900 | $30.03 |
| 2018 | 3 | 19,961 | 9.7% | 57,179 | 27.7% | $250,500 | $12.55 |
| 2019 | 2 | 61,104 | 29.6% | 118,283 | 57.4% | $846,444 | $13.85 |
| 2020 | 0 | 0 | 0.0% | 118,283 | 57.4% | $0 | $0.00 |
2021(4) | 2 | 25,946 | 12.6% | 144,229 | 69.9% | $375,000 | $15.00(5) |
| 2022 | 0 | 0 | 0.0% | 144,229 | 69.9% | $0 | $0.00 |
| 2023 | 1 | 5,220 | 2.5% | 149,449 | 72.5% | $156,600 | $30.00 |
| 2024 | 0 | 0 | 0.0% | 149,449 | 72.5% | $0 | $0.00 |
| Thereafter | 1 | 53,500 | 25.9% | 202,949 | 98.4% | $521,625 | $9.75 |
| Vacant | 0 | 3,243 | 1.6% | 206,192 | 100.0% | $0 | $0.00 |
| Total/Weighted Average | 15 | 206,192 | 100.0% | $3,028,665 | $14.92 |
| (1) | Information obtained from the underwritten rent roll. | ||
| (2) | Certain tenants may have lease termination options that are exercisable prior to the originally stated expiration date of the subject lease and that are not considered in the Lease Expiration Schedule. | ||
| (3) | Weighted Average Annual U/W Base Rent PSF excludes vacant space. | ||
| (4) | Includes 946 square feet of TJ Maxx storage space which was attributed no rent. | ||
| (5) | Annual U/W Base Rent PSF calculation excludes 946 square feet of TJ Maxx storage space. |
The following table presents historical occupancy percentages at the Caruth Plaza Property:
Historical Occupancy
12/31/2010(1) | 12/31/2011(1)(2) | 12/31/2012(1)(2) | 1/1/2014 | |||
| 95.6% | 96.1% | 90.1% | 98.4% |
| (1) | Information obtained from the borrower. |
| (2) | See “Cash Flow Analysis” table. |
Operating History and Underwritten Net Cash Flow. The following table presents certain information relating to the historical operating performance and Underwritten Net Cash Flow at the Caruth Plaza Property:
Cash Flow Analysis
| 2011 | 2012 | TTM 10/31/2013 | U/W | U/W $ per SF | ||||||
| Base Rent | $3,076,296 | $2,832,592 | $2,836,683 | $3,028,665 | $14.69 | |||||
| Grossed Up Vacant Space | 0 | 0 | 0 | 97,290 | 0.47 | |||||
| Percentage Rent | 129,316 | 186,587 | 260,028 | 245,769 | 1.19 | |||||
| Total Reimbursables | 977,420 | 1,041,017 | 1,063,514 | 1,145,665 | 5.56 | |||||
| Other Income | 4,920 | 2,400 | 2,400 | 2,400 | 0.01 | |||||
| Less Vacancy & Credit Loss | 0 | 0 | 0 | (187,557)(1) | (0.91) | |||||
| Effective Gross Income | $4,187,951 | $4,062,595 | $4,162,625 | $4,332,232 | $21.01 | |||||
| Total Operating Expenses | $1,183,516 | $1,316,910 | $1,333,530 | $1,360,299 | $6.60 | |||||
| Net Operating Income | $3,004,435 | $2,745,684(2) | $2,829,095 | $2,971,932 | $14.41 | |||||
| TI/LC | 0 | 0 | 0 | 51,548 | 0.25 | |||||
| Capital Expenditures | 0 | 0 | 0 | 30,929 | 0.15 | |||||
| Net Cash Flow | $3,004,435 | $2,745,684 | $2,829,095 | $2,889,455 | $14.01 | |||||
| NOI DSCR | 1.45x | 1.33x | 1.37x | 1.44x | ||||||
| NCF DSCR | 1.45x | 1.33x | 1.37x | 1.40x | ||||||
| NOI DY | 9.3% | 8.5% | 8.8% | 9.2% | ||||||
| NCF DY | 9.3% | 8.5% | 8.8% | 9.0% |
| (1) | The underwritten economic vacancy is 6.0%. The Caruth Plaza Property was 98.4% physically occupied as of January 1, 2014. |
| (2) | The 2012 decline in Net Operating Income was due to two tenants representing 9.5% of net rentable square feet vacating. The spaces have been re-leased to White Horse Saloon (6.0% of net rentable square feet and 4.6% of underwritten base rent) and All Pro Classics (3.5% of net rentable square feet and 3.0% of underwritten base rent). |
THE INFORMATION IN THIS STRUCTURAL AND COLLATERAL TERM SHEET IS NOT COMPLETE AND MAY BE AMENDED PRIOR TO THE TIME OF SALE. THIS TERM SHEET IS NOT AN OFFER TO SELL THESE SECURITIES AND IT IS NOT A SOLICITATION OF AN OFFER TO BUY THESE SECURITIES IN ANY JURISDICTION WHERE THE OFFER OR SALE IS NOT PERMITTED.
118
| CARUTH PLAZA |
Appraisal. As of the appraisal valuation date of December 5, 2013, the Caruth Plaza Property had an “as-is” appraised value of $47,900,000.
Environmental Matters. According to the Phase I environmental site assessment dated December 23, 2013, there was no evidence of any recognized environmental conditions at the Caruth Plaza Property.
Market Overview and Competition. The Caruth Plaza Property is located in Dallas, Texas, approximately seven miles north of the Dallas central business district. The Caruth Plaza Property is located at the heavily trafficked intersection of North Central Expressway and Park Lane; traffic count along North Central Expressway is reported to be approximately 292,027 vehicles per day and along Park Lane traffic count is reported at approximately 36,278 vehicles per day. The Caruth Plaza Property is proximate to the high income demographic neighborhoods of North Dallas, University Park, Highland Park and the Preston Hollow areas. According to the appraisal, as of 2013, the estimated population within a three- and five-mile radius of the Caruth Plaza Property was 144,893 and 392,012, respectively. The estimated household income within the same three- and five-mile radius was $103,968 and $95,605, respectively. The Caruth Plaza Property is located adjacent to complementary retail properties including NorthPark Mall, which is anchored by Nordstrom, Nieman Marcus, Macy’s and Dillard’s and the Park Lane Shopping Center, which is anchored by Whole Foods Market, Old Navy, Home Goods, Dick’s Sporting Goods, Bloomingdale’s and Saks Off Fifth.
According to a third party market research report, the Caruth Plaza Property is located within the Near North Dallas submarket. As of the third quarter of 2013, the submarket reports an estimated inventory of 1,350 retail properties totaling approximately 25.2 million square feet with a 6.0% vacancy rate and average asking rents of $15.44 per square foot, on a triple net basis.
The following table presents certain information relating to comparable retail properties for the Caruth Plaza Property:
Competitive Set(1)
Caruth Plaza (Subject) | Central Forest Shopping Center | Lincoln Park Retail | The Shops at Park Lane Mixed Use | Royal Crossing II | Best Buy Plaza | |
| Location | Dallas, TX | Dallas, TX | Dallas, TX | Dallas, TX | Dallas, TX | Dallas, TX |
| Distance from Subject | -- | 2.6 miles | 2.3 miles | 0.1 miles | 1.9 miles | 0.2 miles |
| Property Type | Anchored Retail | Neighborhood Center | Neighborhood Center | Lifestyle Center | Neighborhood Center | Neighborhood Center |
| Year Built/Renovated | 1979/NAP | 1978/NAV | 1998/NAV | 2008/NAV | 2006/NAV | 1995/NAV |
| Anchors | Sports Authority, Bed Bath and Beyond, TJ Maxx | Office Depot | Tom Thumb Grocery, The Container Store, Barnes & Noble | Whole Foods, Old Navy, Home Goods, Dick’s Sporting Goods | Sleep Experts | Toys R Us, Best Buy, Office Max |
| Total GLA | 206,192 SF | 96,952 SF | 148,806 SF | 740,278 SF | 22,579 SF | 177,424 SF |
| Total Occupancy | 98% | 95% | 100% | 75% | 93% | 100% |
| (1) | Information obtained from the appraisal. |
The Borrower. The borrower is Caruth Acquisition, LP, a single purpose entity with an independent director. Legal counsel to the borrower delivered a non-consolidation opinion in connection with the origination of the Caruth Plaza Mortgage Loan. NADG (US) LLLP, North American Property Group and Susan Reese are the guarantors of certain nonrecourse carveouts under the Caruth Plaza Mortgage Loan.
The Sponsor. The loan sponsors are NADG (US) LLLP, North American Property Group and Susan Reese, the CEO of Madison Partners. NADG (US) LLLP and North American Property Group are affiliates of North American Development Group (“NADG”), a real estate and development company that owns over 14 million gross leasable square feet of shopping center space in the U.S. and Canada. Headquartered in Dallas, Texas, Madison Partners is a diversified investment and management company that has property management responsibilities, asset management and/or ownership in approximately one million square feet of retail property. Between 2009 and 2012, Susan Reese had ownership interests in entities that were either the subject of foreclosure, default or bankruptcy. See “Description of the Mortgage Pool – Default History, Bankruptcy Issues and Other Proceedings” in the Free Writing Prospectus.
Escrows. The loan documents provide for upfront escrows in the amount of $52,766 for real estate taxes, $200,000 for future tenant improvements and leasing commissions and $26,000 for outstanding tenant improvements in connection with the Planned Parenthood tenant (2,600 square feet and 1.3% of net rentable square feet). The loan documents also provide for ongoing monthly escrow deposits of $26,383 for real estate taxes, $2,577 for replacement reserves and $4,296 for ongoing tenant improvements and leasing commissions. The tenant improvements and leasing commissions reserve is capped at $200,000 provided (i) no event of default has occurred and is continuing; (ii) the amortizing debt service coverage ratio is equal to or greater than 1.20x for any calendar month; and (iii) the net cash flow debt yield is equal to or greater than 8.0% for any calendar month. The loan documents do not require monthly escrows for insurance provided (i) no event of default has occurred and is continuing; (ii) insurance is maintained pursuant to one or more blanket policies; and (iii) the borrower provides the lender with timely proof of payment of insurance premiums.
Lockbox and Cash Management. The Caruth Plaza Mortgage Loan requires a lender-controlled lockbox account, which is already in place, and that all rents received by the borrower or the property manager be deposited into the lockbox account within three business days of receipt. Prior to the occurrence of a Cash Trap Event Period, all funds on deposit in the lockbox account are swept
THE INFORMATION IN THIS STRUCTURAL AND COLLATERAL TERM SHEET IS NOT COMPLETE AND MAY BE AMENDED PRIOR TO THE TIME OF SALE. THIS TERM SHEET IS NOT AN OFFER TO SELL THESE SECURITIES AND IT IS NOT A SOLICITATION OF AN OFFER TO BUY THESE SECURITIES IN ANY JURISDICTION WHERE THE OFFER OR SALE IS NOT PERMITTED.
119
| CARUTH PLAZA |
into the borrower’s operating account on a daily basis. During a Cash Trap Event Period, all excess cash flow is swept on a monthly basis to a cash management account controlled by the lender.
A “Cash Trap Event Period” will commence upon the earlier of (i) the occurrence and continuance of an event of default; (ii) the amortizing debt service coverage ratio falling below 1.20x at the end of any calendar month; (iii) the net cash flow debt yield falling below 8.0% for any calendar month; or (iv) the commencement of a Sports Authority Trigger Period (as defined below). A Cash Trap Event Period will end, with regard to the circumstances in clause (i), upon the cure of such event of default; with regard to the circumstances in clause (ii), upon the date that the amortizing debt service coverage ratio is equal to or greater than 1.20x for two consecutive calendar quarters; with regard to the circumstances in clause (iii), the net cash flow debt yield is equal to or greater than 8.0% for two consecutive calendar quarters; and with regard to the circumstances in clause (iv), upon the termination of such Sports Authority Trigger Period.
A “Sports Authority Trigger Period” will commence if Sports Authority (i) does not extend or renew its lease at least six months prior to the lease expiration date or (ii) goes dark, fails to occupy or vacates its space at the Caruth Plaza Property. A Sports Authority Trigger Period will terminate with regard to the circumstances in clause (i), either (a) upon the renewal or extension of the Sports Authority lease or (b) on the date on which one or more satisfactory replacement tenants are in occupancy, paying full, unabated rent and open for business in at least 60% of the space currently leased to Sports Authority; and with regard to the circumstances in clause (ii), either (x) upon Sports Authority resuming normal business operations in its space for two consecutive calendar quarters or (y) clause (b) above.
Property Management. The Caruth Plaza Property is managed by an affiliate of the borrower.
Assumption. The borrower has a two-time right to transfer the Caruth Plaza Property, provided that no event of default has occurred and is continuing and certain other conditions are satisfied, including, but not limited to the following: (i) the lender’s reasonable determination that the proposed transferee and guarantor satisfy the lender’s credit review and underwriting standards, taking into consideration transferee’s experience, financial strength and general business standing; (ii) execution of a recourse guaranty and an environmental indemnity by an affiliate of the transferee; and (iii) if requested by the lender, rating agency confirmation from DBRS, Fitch and Moody’s that the transfer will not result in a downgrade, withdrawal or qualification of the respective ratings assigned to the Series 2014-LC14 Certificates.
Partial Release. Following the second anniversary of the issuance of the Series 2014-LC14 Certificates, the borrower is permitted to partially release a certain outparcel which contains the Jumbo Super Buffet pad site and as further described in the loan documents (the “Jumbo Super Buffet Outparcel”) in connection with a partial defeasance, subject to certain conditions including (i) reducing the principal balance by the greater of (a) 95% of the net proceeds of the sale of the released parcel or (b) 115% of the Jumbo Super Buffet Outparcel allocated loan balance; (ii) the loan-to-value ratio immediately after the release being equal to or less than the lesser of (a) 70.0% or (b) the loan-to-value ratio immediately prior to the release; (iii) the net cash flow debt yield being equal to or greater than the greater of (a) 9.2% and (b) the net cash flow debt yield immediately prior to the release of the Jumbo Super Buffet Outparcel; (iv) the delivery of a legal opinion to the lender to demonstrate that the release of the Jumbo Super Buffet Outparcel will satisfy REMIC requirements; and (v) the lender receives rating agency confirmation from DBRS, Fitch and Moody’s that the release will not result in a downgrade, withdrawal or qualification of the respective ratings assigned to the Series 2014-LC14 Certificates.
Real Estate Substitution. Not permitted.
Subordinate and Mezzanine Indebtedness. Not permitted.
Ground Lease. None.
Terrorism Insurance. The loan documents require that the “all risk” insurance policy required to be maintained by the borrower provide coverage for terrorism in an amount equal to the full replacement cost of the Caruth Plaza Property. The loan documents also require business interruption insurance covering no less than the 18-month period following the occurrence of a casualty event, together with a six-month extended period of indemnity.
THE INFORMATION IN THIS STRUCTURAL AND COLLATERAL TERM SHEET IS NOT COMPLETE AND MAY BE AMENDED PRIOR TO THE TIME OF SALE. THIS TERM SHEET IS NOT AN OFFER TO SELL THESE SECURITIES AND IT IS NOT A SOLICITATION OF AN OFFER TO BUY THESE SECURITIES IN ANY JURISDICTION WHERE THE OFFER OR SALE IS NOT PERMITTED.
120
(THIS PAGE INTENTIONALLY LEFT BLANK)
121
| No. 11 Marriott Courtyard - Maui | |||||||||
| Loan Information | Property Information | ||||||||
| Mortgage Loan Seller: | The Royal Bank of Scotland | Single Asset/Portfolio: | Single Asset | ||||||
| Credit Assessment (DBRS/Fitch/Moody’s): | NR/NR/NR | Property Type: | Hospitality | ||||||
| Original Principal Balance: | $28,555,000 | Specific Property Type: | Limited Service | ||||||
| Cut-off Date Principal Balance: | $28,555,000 | Location: | Kahului, HI | ||||||
| % of Initial Pool Balance: | 2.3% | Size: | 138 rooms | ||||||
| Loan Purpose: | Refinance | Cut-off Date Principal Balance Per Room: | $206,920 | ||||||
| Borrower Name: | Keolani SPE, LLC | Year Built/Renovated: | 2012/NAP | ||||||
| Sponsor: | Robert D. Olson | Title Vesting: | Fee | ||||||
| Mortgage Rate: | 5.131% | Property Manager: | Self-managed | ||||||
| Note Date: | January 17, 2014 | 3rd Most Recent Occupancy (As of): | NAP | ||||||
| Anticipated Repayment Date: | NAP | 2nd Most Recent Occupancy (As of): | NAP | ||||||
| Maturity Date: | February 1, 2024 | Most Recent Occupancy (As of)(4): | 64.0% (12/31/2012) | ||||||
| IO Period: | None | Current Occupancy (As of): | 81.3% (11/30/2013) | ||||||
| Loan Term (Original): | 120 months | ||||||||
| Seasoning: | 0 months | Underwriting and Financial Information: | |||||||
| Amortization Term (Original): | 360 months | ||||||||
| Loan Amortization Type: | Amortizing Balloon | 3rd Most Recent NOI (As of): | NAP | ||||||
| Interest Accrual Method: | Actual/360 | 2nd Most Recent NOI (As of): | NAP | ||||||
| Call Protection: | L(24),D(92),O(4) | Most Recent NOI (As of): | $3,372,151 (TTM 11/30/2013) | ||||||
| Lockbox Type: | Springing (With Established Account) | ||||||||
| Additional Debt: | None | U/W Revenues: | $8,606,674 | ||||||
| Additional Debt Type: | NAP | U/W Expenses: | $5,360,839 | ||||||
| U/W NOI: | $3,245,835 | ||||||||
| U/W NCF: | $2,858,535 | ||||||||
| U/W NOI DSCR: | 1.74x | ||||||||
| U/W NCF DSCR: | 1.53x | ||||||||
Escrows and Reserves: | U/W NOI Debt Yield: | 11.4% | |||||||
| U/W NCF Debt Yield: | 10.0% | ||||||||
Type: | Initial | Monthly | Cap (If Any) | As-Is Appraised Value: | $41,500,000 | ||||
Taxes(1) | $0 | Springing | NAP | As-Is Appraisal Valuation Date: | October 18, 2013 | ||||
Insurance(2) | $0 | Springing | NAP | Cut-off Date LTV Ratio: | 68.8% | ||||
Replacement Reserve(3) | $0 | Springing | NAP | LTV Ratio at Maturity or ARD: | 56.8% | ||||
| (1) | Springing reserves if borrower fails to comply with obligations under management agreement or if borrower fails to provide lender with evidence of payment. |
| (2) | Springing reserves if acceptable blanket policy is not in effect or if borrower fails to provide lender with evidence of payment. |
| (3) | Springing reserves if borrower fails to comply with obligations under management agreement. |
| (4) | Most Recent Occupancy is only for a partial year since the Marriott Courtyard - Maui Property opened in July, 2012. |
The Marriott Courtyard - Maui mortgage loan is evidenced by a single promissory note that is secured by a first mortgage encumbering a four-story, limited-service hotel containing a total of 138 rooms (the “Marriott Courtyard - Maui Property”). The Marriot Courtyard - Maui Property is located in Kahului, Hawaii and is situated on 3.3 acres of land. The Marriot Courtyard - Maui Property is located less than one mile east of Kahului Airport, the island’s main airport, through which over 7,000 passengers pass through each day. The lobby is larger than a standard Courtyard by Marriott, offers higher ceilings, and provides access to GoBoard™, a touch‐screen information system providing up‐to‐date weather information, local events and headlines, restaurant recommendations, and mapping capabilities. In-room amenities include a 42‐inch flat‐panel television, high‐speed wireless internet access, telephone with voicemail and data port and an iPod docking station. The deluxe rooms offer a slightly larger living space as well as additional amenities such as microwaves and small refrigerators. The Marriot Courtyard - Maui Property offers one restaurant, three meeting rooms, outdoor pool and whirlpool, exercise room and an outdoor courtyard area that is equipped with a canopy.
Sources and Uses
| Sources | Uses | |||||||
| Original loan amount | $28,555,000 | 100.0% | Loan Payoff | $19,887,557 | 69.6% | |||
| Closing Costs | 146,608 | 0.5 | ||||||
| Return of equity | 8,520,835 | 29.8 | ||||||
| Total Sources | $28,555,000 | 100.0% | Total Uses | $28,555,000 | 100.0% |
THE INFORMATION IN THIS STRUCTURAL AND COLLATERAL TERM SHEET IS NOT COMPLETE AND MAY BE AMENDED PRIOR TO THE TIME OF SALE. THIS TERM SHEET IS NOT AN OFFER TO SELL THESE SECURITIES AND IT IS NOT A SOLICITATION OF AN OFFER TO BUY THESE SECURITIES IN ANY JURISDICTION WHERE THE OFFER OR SALE IS NOT PERMITTED.
122
| MARRIOTT COURTYARD - MAUI |
The following table presents certain information relating to the historical occupancy, average daily rate, and revenue per available room at the Marriot Courtyard - Maui Property and comparable hotels:
Property and Market Historical Occupancy, ADR and RevPAR(1)
Competitive Set | Marriott Courtyard - Maui | Penetration Factor | |||||||||||||||
Year | Occupancy | ADR | RevPAR | Occupancy | ADR | RevPAR | Occupancy | ADR | RevPAR | ||||||||
| 10/30/2013 TTM | 69.0% | $135.61 | $93.51 | 81.1% | $174.32 | $141.36 | 117.6% | 128.5% | 151.2% | ||||||||
| 10/30/2012 TTM | NAP | NAP | NAP | NAP | NAP | NAP | NAP | NAP | NAP | ||||||||
| 10/30/2011 TTM | NAP | NAP | NAP | NAP | NAP | NAP | NAP | NAP | NAP | ||||||||
| (1) | Data provided by a third party hospitality market research report dated November 19, 2013. According to such third party hospitality report, the competitive set includes the following hotels: Kamaole Sands, Aston Hotel @ The Maui Banyan, Aston Hotel Maui Lu and Maui Coast Hotel. |
Operating History and Underwritten Net Cash Flow. The following table presents certain information relating to the historical operating performance and Underwritten Net Cash Flow at the Marriott Courtyard - Maui Property.
Cash Flow Analysis(1)
| TTM 11/30/2013 | U/W | U/W $ per Room | ||||
| Occupancy | 81.3% | 81.3% | ||||
| ADR | $189.85 | $189.85 | ||||
| RevPAR | $154.35 | $154.35 | ||||
| Number of Days Open | 365 | 365 | ||||
| Total Revenue | $8,602,374 | $8,606,674 | $62,367 | |||
| Total Department Expenses | 2,377,452 | 2,377,449 | 17,228 | |||
| Gross Operating Profit | $6,224,922 | $6,229,225 | $45,139 | |||
| Total Undistributed Expenses | 2,606,910 | 2,666,829 | 19,325 | |||
| Profit Before Fixed Charges | $3,618,012 | $3,562,396 | $25,814 | |||
| Total Fixed Charges | 245,861 | 316,561 | 2,294 | |||
| Net Operating Income | $3,372,151 | $3,245,835 | $23,521 | |||
| FF&E | 0 | 387,300 | 2,807 | |||
| Net Cash Flow | $3,372,151 | $2,858,535 | $20,714 | |||
| NOI DSCR | 1.81x | 1.74x | ||||
| NCF DSCR | 1.81x | 1.53x | ||||
| NOI DY | 11.8% | 11.4% | ||||
| NCF DY | 11.8% | 10.0% | ||||
| (1) | No additional historical financial information is available as the Marriot Courtyard - Maui Property opened in July 2012. |
THE INFORMATION IN THIS STRUCTURAL AND COLLATERAL TERM SHEET IS NOT COMPLETE AND MAY BE AMENDED PRIOR TO THE TIME OF SALE. THIS TERM SHEET IS NOT AN OFFER TO SELL THESE SECURITIES AND IT IS NOT A SOLICITATION OF AN OFFER TO BUY THESE SECURITIES IN ANY JURISDICTION WHERE THE OFFER OR SALE IS NOT PERMITTED.
123
| No. 12 – Lantana Cascade | |||||||
| Loan Information | Property Information | ||||||
| Mortgage Loan Seller: | Ladder Capital Finance LLC | Single Asset/Portfolio: | Single Asset | ||||
| Credit Assessment (DBRS/Fitch/Moody’s): | NR/NR/NR | Property Type: | Manufactured Housing Community | ||||
| Original Principal Balance: | $27,500,000 | Specific Property Type: | Manufactured Housing Community | ||||
| Cut-off Date Principal Balance: | $27,500,000 | Location: | Lantana, FL | ||||
| % of Initial Pool Balance: | 2.2% | Size: | 462 pads | ||||
| Loan Purpose: | Refinance | Cut-off Date Principal Balance Per Pad: | $59,524 | ||||
| Borrower Name: | Lantana Cascade MHC Limited Partnership | Year Built/Renovated: | 1971/NAP | ||||
| Sponsor: | RHP Properties | Title Vesting: | Fee | ||||
| Mortgage Rate: | 4.950% | Property Manager: | Newbury Management Services | ||||
| Note Date: | October 31, 2013 | 3rd Most Recent Occupancy: | NAV | ||||
| Anticipated Repayment Date: | NAP | 2nd Most Recent Occupancy (As of): | 93.6% (12/31/2011) | ||||
| Maturity Date: | November 6, 2023 | Most Recent Occupancy (As of): | 92.3% (12/31/2012) | ||||
| IO Period: | 36 months | Current Occupancy (As of): | 91.6% (9/30/2013) | ||||
| Loan Term (Original): | 120 months | ||||||
| Seasoning: | 3 months | Underwriting and Financial Information: | |||||
| Amortization Term (Original): | 360 months | ||||||
| Loan Amortization Type: | Interest-only, Amortizing Balloon | 3rd Most Recent NOI (As of): | $1,989,384 (12/31/2011) | ||||
| Interest Accrual Method: | Actual/360 | 2nd Most Recent NOI (As of): | $2,223,342 (12/31/2012) | ||||
| Call Protection: | L(27),D(89),O(4) | Most Recent NOI (As of): | $2,265,872 (TTM 8/31/2013) | ||||
| Lockbox Type: | Springing (Without Established Account) | ||||||
| Additional Debt: | None | U/W Revenues: | $3,847,541 | ||||
| Additional Debt Type: | NAP | U/W Expenses: | $1,485,912 | ||||
| U/W NOI: | $2,361,629 | ||||||
| U/W NCF: | $2,338,529 | ||||||
| U/W NOI DSCR: | 1.34x | ||||||
| U/W NCF DSCR: | 1.33x | ||||||
Escrows and Reserves: | U/W NOI Debt Yield: | 8.6% | |||||
| U/W NCF Debt Yield: | 8.5% | ||||||
Type: | Initial | Monthly | Cap (If Any) | As-Is Appraised Value: | $37,620,000 | ||
| Taxes | $148,819 | $29,764 | NAP | As-Is Appraisal Valuation Date: | September 30, 2013 | ||
| Insurance | $12,754 | $6,377 | NAP | Cut-off Date LTV Ratio: | 73.1% | ||
| Replacement Reserves | $0 | $1,925 | NAP | LTV Ratio at Maturity or ARD: | 64.6% | ||
The Lantana Cascade mortgage loan is evidenced by a single promissory note that is secured by a first mortgage encumbering a 462-pad manufactured housing community located in Lantana, Florida (the “Lantana Cascade Property”). The Lantana Cascade Property is situated on a 66.8-acre site located within Palm Beach County, 61.3 miles from Miami. Within three miles of the Lantana Cascade Property, the 2013 population was 125,862 with an average household income of $59,557 as of year-end 2012. Amenities at the Lantana Cascade Property include two swimming pools, playground area, shuffle board courts and a basketball court. As of September 30, 2013, the Lantana Cascade Property was 91.6% occupied.
Sources and Uses
| Sources | Uses | |||||||
| Original loan amount | $27,500,000 | 100.0% | Loan payoff | $18,619,087 | 67.7% | |||
| Closing costs | 413,359 | 1.5 | ||||||
| Reserves | 161,573 | 0.6 | ||||||
| Return of equity | 8,305,981 | 30.2 | ||||||
| Total Sources | $27,500,000 | 100.0% | Total Uses | $27,500,000 | 100.0% |
THE INFORMATION IN THIS STRUCTURAL AND COLLATERAL TERM SHEET IS NOT COMPLETE AND MAY BE AMENDED PRIOR TO THE TIME OF SALE. THIS TERM SHEET IS NOT AN OFFER TO SELL THESE SECURITIES AND IT IS NOT A SOLICITATION OF AN OFFER TO BUY THESE SECURITIES IN ANY JURISDICTION WHERE THE OFFER OR SALE IS NOT PERMITTED.
124
| LANTANA CASCADE |
The following table presents historical occupancy percentages at the Lantana Cascade Property:
Historical Occupancy
12/31/2010(1) | 12/31/2011(2) | 12/31/2012(2) | 9/30/2013 | |||
| NAV | 93.6% | 92.3% | 91.6% |
| (1) | Information not available from the borrower. |
| (2) | Information obtained from the borrower. |
Operating History and Underwritten Net Cash Flow. The following table presents certain information relating to the historical operating performance and the Underwritten Net Cash Flow at the Lantana Cascade Property:
Cash Flow Analysis
2011 | 2012 | TTM 8/31/2013 | U/W | U/W $ per Unit | ||||||
| Base Rent | $3,163,103 | $3,309,345 | $3,368,146 | $3,076,826 | $6,660 | |||||
| Grossed Up Vacant Space | 0 | 0 | 0 | 389,232 | 842 | |||||
| Less Concessions | 0 | 0 | 0 | 0 | 0 | |||||
| Other Income | 653,981 | 738,722 | 770,715 | 770,715 | 1,668 | |||||
| Less Vacancy & Credit Loss | (390,986) | (387,214) | (429,704) | (389,232)(1) | (842) | |||||
| Effective Gross Income | $3,426,098 | $3,660,853 | $3,709,157 | $3,847,541 | $8,328 | |||||
| Total Operating Expenses | $1,436,714 | $1,437,511 | $1,443,285 | $1,485,912 | $3,216 | |||||
| Net Operating Income | $1,989,384 | $2,223,342 | $2,265,872 | $2,361,629 | $5,112 | |||||
| Replacement Reserves | 0 | 0 | 0 | 23,100 | 50 | |||||
| Net Cash Flow | $1,989,384 | $2,223,342 | $2,265,872 | $2,338,529 | $5,062 | |||||
| NOI DSCR | 1.13x | 1.26x | 1.29x | 1.34x | ||||||
| NCF DSCR | 1.13x | 1.26x | 1.29x | 1.33x | ||||||
| NOI DY | 7.2% | 8.1% | 8.2% | 8.6% | ||||||
| NCF DY | 7.2% | 8.1% | 8.2% | 8.5% | ||||||
| (1) | The underwritten economic vacancy is 11.2%. The Lantana Cascade Property was 91.6% physically occupied as of September 30, 2013. |
THE INFORMATION IN THIS STRUCTURAL AND COLLATERAL TERM SHEET IS NOT COMPLETE AND MAY BE AMENDED PRIOR TO THE TIME OF SALE. THIS TERM SHEET IS NOT AN OFFER TO SELL THESE SECURITIES AND IT IS NOT A SOLICITATION OF AN OFFER TO BUY THESE SECURITIES IN ANY JURISDICTION WHERE THE OFFER OR SALE IS NOT PERMITTED.
125
| No. 13 – Museo Apartments | |||||||
| Loan Information | Property Information | ||||||
| Mortgage Loan Seller: | Rialto Mortgage Finance, LLC | Single Asset/Portfolio: | Single Asset | ||||
| Credit Assessment (DBRS/Fitch/Moody’s): | NR/NR/NR | Property Type: | Multifamily | ||||
| Original Principal Balance: | $25,750,000 | Specific Property Type: | Garden | ||||
| Cut-off Date Principal Balance: | $25,750,000 | Location: | Austin, TX | ||||
| % of Initial Pool Balance: | 2.1% | Size: | 276 units | ||||
| Loan Purpose: | Acquisition | Cut-off Date Principal Balance Per Unit(1): | $93,297 | ||||
| Borrower Name: | Northland Museo, LLC | Year Built/Renovated: | 1993/2011 | ||||
| Sponsor: | Northland Portfolio, L.P. | Title Vesting: | Fee | ||||
| Mortgage Rate: | 4.430% | Property Manager: | Northland Investment Corporation | ||||
| Note Date: | November 22, 2013 | 3rd Most Recent Occupancy (As of): | NAV | ||||
| Anticipated Repayment Date: | NAP | 2nd Most Recent Occupancy (As of): | NAV | ||||
| Maturity Date: | December 6, 2018 | Most Recent Occupancy (As of): | 93.5% (12/31/2012) | ||||
| IO Period: | 60 months | Current Occupancy (As of): | 95.7% (10/9/2013) | ||||
| Loan Term (Original): | 60 months | ||||||
| Seasoning: | 2 months | Underwriting and Financial Information: | |||||
| Amortization Term (Original): | NAP | ||||||
| Loan Amortization Type: | Interest-only, Balloon | 3rd Most Recent NOI (As of): | $1,724,021 (12/31/2011) | ||||
| Interest Accrual Method: | Actual/360 | 2nd Most Recent NOI (As of): | $1,918,112 (12/31/2012) | ||||
| Call Protection: | L(26),D(30),O(4) | Most Recent NOI (As of): | $1,969,384 (TTM 9/30/2013) | ||||
| Lockbox Type: | Springing (Without Established Account) | ||||||
Additional Debt(1): | Yes | U/W Revenues: | $3,846,294 | ||||
Additional Debt Type(1): | Mezzanine | U/W Expenses: | $1,603,888 | ||||
U/W NOI(3): | $2,242,405 | ||||||
U/W NCF(3): | $2,166,505 | ||||||
U/W NOI DSCR(1): | 1.94x | ||||||
U/W NCF DSCR(1): | 1.87x | ||||||
Escrows and Reserves: | U/W NOI Debt Yield(1): | 8.7% | |||||
U/W NCF Debt Yield(1): | 8.4% | ||||||
Type: | Initial | Monthly | Cap (If Any) | As-Is Appraised Value: | $35,650,000 | ||
| Taxes | $0 | $55,135 | NAP | As-Is Appraisal Valuation Date: | October 29, 2013 | ||
Insurance(2) | $81,462 | Springing | NAP | Cut-off Date LTV Ratio(1): | 72.2% | ||
| Replacement Reserves | $0 | $6,325 | NAP | LTV Ratio at Maturity or ARD(1): | 72.2% | ||
| (1) | The equity interests in the borrower have been pledged to secure non-pooled subordinate mezzanine indebtedness with a balance as of the Cut-off Date of $4,000,000. All LTV, DSCR, debt yield and Cut-off Date Principal Balance per unit numbers shown in the chart above are based solely on the $25,750,000 mortgage loan financing. As of the Cut-off Date, the combined U/W NCF DSCR is 1.32x, the combined Cut-off Date LTV ratio is 83.5%, and the combined U/W NCF debt yield is 7.3%. |
| (2) | Monthly insurance escrows are not required provided the following conditions are satisfied: (i) no event of default has occurred and is continuing; (ii) the Museo Apartments property is covered under a blanket insurance policy acceptable to the lender; (iii) the borrower provides evidence of renewal of the policy and timely proof of payment of insurance premiums; and (iv) no portion of the initial insurance escrow has been applied to payments of insurance premiums and the borrower deposits with the lender additional funds into the insurance escrow as requested by the lender in a timely manner. |
| (3) | See “Cash Flow Analysis” section. |
The Museo Apartments mortgage loan is evidenced by a single promissory note that is secured by a first mortgage encumbering a 276 unit, class A, garden-style multifamily property located in Austin, Texas (the “Museo Apartments Property”). The Museo Apartments Property is situated on a 25.7-acre site and is located approximately 15 miles northwest of the Austin central business district near the intersection of MoPac (Loop 1) Expressway with Highway 183 and Loop 360, which are all major highways that serve northwest Austin. The Museo Apartments Property is also located less than four miles from the Domain and Arboretum mixed-use developments. The Museo Apartments Property was built in 1993 and 1994 and a $3.2 million ($11,594 per unit) renovation of the Museo Apartments Property was completed in 2011. The Museo Apartments Property consists of 180 one-bedroom/one-bathroom units and 96 two-bedroom/two-bathroom units. Unit amenities include a washer/dryer, patio or balcony, walk-in closets and faux wood flooring. Approximately 125 units have been upgraded and feature granite counter tops, glass and travertine backsplashes, upgraded fixtures and maple cabinetry and generate a rent premium of $100 to $175 per unit per month. Amenities include a leasing office and clubhouse with business center, a 24-hour fitness studio, a cabana, controlled access gates, two swimming pools and an outdoor grilling station. The Museo Apartments Property contains 462 parking spaces, resulting in a parking ratio of 1.7 spaces per unit. As of October 9, 2013, the Museo Apartments Property was 95.7% occupied.
THE INFORMATION IN THIS STRUCTURAL AND COLLATERAL TERM SHEET IS NOT COMPLETE AND MAY BE AMENDED PRIOR TO THE TIME OF SALE. THIS TERM SHEET IS NOT AN OFFER TO SELL THESE SECURITIES AND IT IS NOT A SOLICITATION OF AN OFFER TO BUY THESE SECURITIES IN ANY JURISDICTION WHERE THE OFFER OR SALE IS NOT PERMITTED.
126
| MUSEO APARTMENTS |
Sources and Uses
| Sources | Uses | |||||||
| Original loan amount | 71.4% | $35,000,000 | 97.1% | |||||
| Mezzanine debt | 11.1 | Upfront reserves | ||||||
| Sponsor’s new cash contribution | 6,301,428 | 17.5 | Closing costs | |||||
| Real estate tax due | ||||||||
| Total Sources | 100.0% | Total Uses | 100.0% |
The following table presents historical occupancy percentages at the Museo Apartments Property:
Unit Mix Summary(1)
| Unit Type | No. of Units | % of Total Units | Average Unit Size (SF) | Average Monthly U/W Base Rent |
| 1 Bedroom/1 Bathroom | 180 | 65.2% | 725 | $1,050 |
| 2 Bedroom/2 Bathroom | 96 | 34.8 | 1,025 | $1,305 |
| Total/Weighted Average | 100.0% |
| (1) | Information obtained from the underwritten rent roll. |
The following table presents historical occupancy percentages at the Museo Apartments Property:
Historical Occupancy
12/31/2010 | 12/31/2011 | 12/31/2012(1) | ||||
| NAV | NAV | 93.5% | 95.7% |
(1) | Information obtained from the borrower. |
Operating History and Underwritten Net Cash Flow. The following table presents certain information relating to the historical operating performance and Underwritten Net Cash Flow at the Museo Apartments Property:
Cash Flow Analysis
| 2011 | 2012 | TTM 9/30/2013 | U/W(1)(2) | U/W $ per Unit | ||||||
| Base Rent | $3,074,735 | $3,358,218 | $3,470,951 | $3,603,684 | $13,057 | |||||
| Grossed Up Vacant Space | 0 | 0 | 0 | 155,592 | 564 | |||||
| Less Concessions | (13,554) | (6,229) | (1,531) | 0 | 0 | |||||
| Other Income | 335,993 | 309,193 | 324,577 | 324,577 | 1,176 | |||||
| Less Vacancy & Credit Loss | (244,036) | (225,764) | (206,445) | (237,559) | (861) | |||||
| Effective Gross Income | $3,153,138 | $3,435,418 | $3,587,552 | $3,846,294 | $13,936 | |||||
| Total Operating Expenses | $1,429,117 | $1,517,306 | $1,618,168 | $1,603,888 | $5,811 | |||||
| Net Operating Income | $1,724,021 | $1,918,112 | $1,969,384 | $2,242,405 | $8,125 | |||||
| Capital Expenditures | 0 | 0 | 0 | 75,900 | 275 | |||||
| Net Cash Flow | $1,724,021 | $1,918,112 | $1,969,384 | $2,166,505 | $7,850 | |||||
| NOI DSCR | 1.49x | 1.66x | 1.70x | 1.94x | ||||||
| NCF DSCR | 1.49x | 1.66x | 1.70x | 1.87x | ||||||
| NOI DY | 6.7% | 7.4% | 7.6% | 8.7% | ||||||
| NCF DY | 6.7% | 7.4% | 7.6% | 8.4% | ||||||
| (1) | The underwritten economic vacancy is 6.3%. The Museo Apartments Property was 95.7% physically occupied as of October 9, 2013. |
| (2) | The increase in Net Operating Income from year end 2012 to the TTM 9/30/2013 and U/W is a result of the prior owner’s investment of $3.2 million ($11,594 per unit) to substantially upgrade units. 125 units now have granite counter tops, glass and travertine backsplashes, upgraded fixtures and custom maple cabinetry. Upgraded units have a waiting list and command higher rents. Additionally, the Museo Apartments Property is expected to benefit from operational efficiencies with new ownership and management. Following acquisition of the Museo Apartments Property, the sponsor owns and manages 18 properties totaling 6,144 units in Austin. |
THE INFORMATION IN THIS STRUCTURAL AND COLLATERAL TERM SHEET IS NOT COMPLETE AND MAY BE AMENDED PRIOR TO THE TIME OF SALE. THIS TERM SHEET IS NOT AN OFFER TO SELL THESE SECURITIES AND IT IS NOT A SOLICITATION OF AN OFFER TO BUY THESE SECURITIES IN ANY JURISDICTION WHERE THE OFFER OR SALE IS NOT PERMITTED.
127
| No. 14 – West Side Mall | ||||||
| Loan Information | Property Information | |||||
| Mortgage Loan Seller: | Ladder Capital Finance LLC | Single Asset/Portfolio: | Single Asset | |||
| Credit Assessment (DBRS/Fitch/Moody’s): | NR/NR/NR | Property Type: | Retail | |||
| Original Principal Balance: | $25,600,000 | Specific Property Type: | Anchored | |||
| Cut-off Date Principal Balance: | $25,600,000 | Location: | Edwardsville, PA | |||
| % of Initial Pool Balance: | 2.0% | Size(2): | 420,434 SF | |||
| Loan Purpose: | Acquisition | Cut-off Date Principal Balance Per SF(1): | $60.89 | |||
| Borrower Name: | Edwardsville Mall LP | Year Built/Renovated: | 1960/2005 | |||
| Sponsor: | Abraham Brach | Title Vesting: | Fee | |||
| Mortgage Rate: | 5.294% | Property Manager: | Madison Properties, LLC | |||
| Note Date: | October 28, 2013 | 3rd Most Recent Occupancy(3): | NAV | |||
| Anticipated Repayment Date: | NAP | 2nd Most Recent Occupancy (As of)(3): | NAV | |||
| Maturity Date: | November 6, 2023 | Most Recent Occupancy (As of)(3): | NAV | |||
| IO Period: | 36 months | Current Occupancy (As of): | 85.0% (9/30/2013) | |||
| Loan Term (Original): | 120 months | |||||
| Seasoning: | 3 months | Underwriting and Financial Information: | ||||
| Amortization Term (Original): | 360 months | |||||
| Loan Amortization Type: | Interest-only, Amortizing Balloon | 3rd Most Recent NOI (As of): | $2,421,632 (12/31/2011) | |||
| Interest Accrual Method: | Actual/360 | 2nd Most Recent NOI (As of): | $2,478,387 (12/31/2012) | |||
| Call Protection: | L(27),D(91),O(2) | Most Recent NOI (As of): | $2,391,875 (TTM 8/31/2013) | |||
| Lockbox Type: | Hard/Upfront Cash Management | |||||
Additional Debt(1): | Yes | |||||
Additional Debt Type(1): | Mezzanine | |||||
| U/W Revenues: | $3,804,596 | |||||
| U/W Expenses: | $1,371,569 | |||||
Escrows and Reserves: | U/W NOI(1): | $2,433,027 | ||||
U/W NCF(1): | $2,161,014 | |||||
Type: | Initial | Monthly | Cap (If Any) | U/W NOI DSCR(1): | 1.43x | |
| Taxes | $311,259 | $62,252 | NAP | U/W NCF DSCR(1): | 1.27x | |
| Insurance | $20,063 | $6,688 | NAP | U/W NOI Debt Yield(1): | 9.5% | |
| Replacement Reserve | $150,000 | $8,759 | $150,000 | U/W NCF Debt Yield(1): | 8.4% | |
| TI/LC Reserve | $350,000 | $13,909 | $450,000 | As-Is Appraised Value: | $34,400,000 | |
| Outstanding TI Reserve | $60,000 | $0 | NAP | As-Is Appraisal Valuation Date: | August 2, 2013 | |
| Deferred Maintenance Reserve | $109,201 | $0 | NAP | Cut-off Date LTV Ratio(1): | 74.4% | |
| CAM Credit Reserve | $282,633 | $0 | NAP | LTV Ratio at Maturity or ARD(1): | 66.3% | |
| (1) | The equity interests in the borrower have been pledged to secure mezzanine indebtedness with a balance as of the Cut-off Date of $2,000,000. All LTV, DSCR, debt yield and Cut-off Date Principal Balance per square foot numbers shown in the chart above are based solely on the $25,600,000 mortgage loan financing. As of the Cut-off Date, the combined U/W NCF DSCR is 1.11x, the combined Cut-off Date LTV ratio is 80.2% and the total debt U/W NCF Debt Yield is 7.8%. |
| (2) | The total net rentable square footage includes a Lowe’s store which is on a ground leased parcel. The size of the improvements on the parcel are 137,933 square feet. |
| (3) | Historical occupancy was not available from the seller. |
The West Side Mall mortgage loan is evidenced by a single promissory note that is secured by a first mortgage encumbering a 420,434 square foot community shopping center located in Edwardsville, Pennsylvania (the “West Side Mall Property”). The West Side Mall Property is anchored by a 137,933 square foot Lowe’s Home Improvement Store and a 69,925 square foot Price Chopper. The West Side Mall Property is a shopping center in the Edwardsville/Wyoming/Kingston residential areas of the Scranton/Wilkes-Barre market. The West Side Mall Property was 85.0% occupied as of September 30, 2013 by a mix of anchors and national junior anchors including Jo-Anne’s Fabrics, Petco, Dollar Tree and Rite Aid. The total net rentable area consists of 409,095 square feet of retail space and 11,339 square feet of office space. The rentable area includes the 137,933 square foot Lowe’s Home Improvement Store which is ground leased by the tenant. Recent repairs and upgrades to the West Side Mall Property include a full roof replacement above Rite Aid and Petco, paving repairs, and pylon sign upgrades.
THE INFORMATION IN THIS STRUCTURAL AND COLLATERAL TERM SHEET IS NOT COMPLETE AND MAY BE AMENDED PRIOR TO THE TIME OF SALE. THIS TERM SHEET IS NOT AN OFFER TO SELL THESE SECURITIES AND IT IS NOT A SOLICITATION OF AN OFFER TO BUY THESE SECURITIES IN ANY JURISDICTION WHERE THE OFFER OR SALE IS NOT PERMITTED.
128
| WEST SIDE MALL |
Sources and Uses
| Sources | Uses | |||||||
| Original loan amount | $25,600,000 | 76.1% | Purchase Price | $32,000,000 | 95.2% | |||
| Mezzanine loan | 2,000,000 | 5.9 | Reserves | 1,283,157 | 3.8 | |||
| Sponsor’s new cash contribution | 5,687,025 | 16.9 | Closing costs | 346,502 | 1.0 | |||
| Seller’s credit | 342,634 | 1.0 | ||||||
| Total Sources | $33,629,659 | 100.0% | Total Uses | $33,629,659 | 100.0% |
The following table presents certain information relating to the tenancy at the West Side Mall Property:
Major Tenants
| Tenant Name | Credit Rating (Fitch/Moody’s/ S&P)(1) | Tenant NRSF | % of NRSF | Annual U/W Base Rent PSF | Annual U/W Base Rent | % of Total Annual U/W Base Rent | Sales PSF | Occupancy Cost | Lease Expiration Date | ||
| Major Tenants | |||||||||||
| Price Chopper | NR/NR/NR | 69,925 | 16.6% | $12.00 | $839,100 | 29.6% | $517 | 2.8% | 8/31/2024 | ||
Lowe’s(2) | NR/A3/A- | 137,933 | 32.8% | $3.26 | $450,000 | 15.9% | NAV | NAV | 1/12/2027 | ||
| Jo-Ann Fabrics | NR/NR/NR | 24,000 | 5.7% | $9.40 | $225,600 | 8.0% | $113 | 10.7% | 1/31/2018 | ||
AJ Wright(3) | NR/A3/A+ | 25,000 | 5.9% | $8.60 | $215,000 | 7.6% | NAV | NAV | 4/30/2015 | ||
| Petco | NR/NR/NR | 12,450 | 3.0% | $10.75 | $133,838 | 4.7% | NAV | NAV | 12/31/2017 | ||
| Total Major Tenants | 269,308 | 64.1% | $6.92 | $1,863,538 | 65.8% | ||||||
| Non-Major Tenants | 87,902 | 20.9% | $11.03 | $970,205 | 34.2% | ||||||
| Occupied Collateral Total | 357,210 | 85.0% | $7.93 | $2,833,742 | 100.0% | ||||||
| Vacant Space | 63,224 | 15.0% | |||||||||
| Collateral Total | 420,434 | 100.0% | |||||||||
| (1) | Certain ratings are those of the parent company whether or not the parent guarantees the lease. |
| (2) | The Lowe’s store is on a ground leased parcel. The size of the building is 137,933 square feet. |
| (3) | The AJ Wright lease, guaranteed by TJX, is currently subleased to a furniture store. |
The following table presents certain information relating to the historical sales and occupancy costs at the West Side Mall Property:
Historical Sales (PSF) and Occupancy Costs(1)
| Tenant Name | 2010 | 2011 | 2012 | TTM 8/31/2013 | TTM 8/31/2013(2) |
| Price Chopper | $419 | $450 | $517 | NAV | 2.8% |
| Jo-Ann Fabrics | $105 | $109 | $113 | $113 | 10.7% |
| (1) | Historical Sales (PSF) and Occupancy Costs are based on historical statements provided by the borrower. |
| (2) | Price Chopper trailing 12-month occupancy cost is as of December 31, 2012. |
THE INFORMATION IN THIS STRUCTURAL AND COLLATERAL TERM SHEET IS NOT COMPLETE AND MAY BE AMENDED PRIOR TO THE TIME OF SALE. THIS TERM SHEET IS NOT AN OFFER TO SELL THESE SECURITIES AND IT IS NOT A SOLICITATION OF AN OFFER TO BUY THESE SECURITIES IN ANY JURISDICTION WHERE THE OFFER OR SALE IS NOT PERMITTED.
129
| WEST SIDE MALL |
The following table presents certain information relating to the lease rollover schedule at the West Side Mall Property:
Lease Expiration Schedule(1)
Year Ending December 31, | No. of Leases Expiring | Expiring NRSF | % of Total NRSF | Cumulative Expiring NRSF | Cumulative % of Total NRSF | Annual U/W Base Rent | Annual U/W Base Rent PSF(2) |
| MTM | 1 | 4,425 | 1.1% | 4,425 | 1.1% | $24,000 | $5.42 |
| 2014 | 3 | 6,658 | 1.6% | 11,083 | 2.6% | $87,530 | $13.15 |
| 2015 | 11 | 58,467 | 13.9% | 69,550 | 16.5% | $593,237 | $10.15 |
| 2016 | 3 | 4,432 | 1.1% | 73,982 | 17.6% | $56,465 | $12.74 |
| 2017 | 4 | 26,145 | 6.2% | 100,127 | 23.8% | $284,016 | $10.86 |
| 2018 | 2 | 34,500 | 8.2% | 134,627 | 32.0% | $341,100 | $9.89 |
| 2019 | 2 | 13,000 | 3.1% | 147,627 | 35.1% | $135,870 | $10.45 |
| 2020 | 0 | 0 | 0.0% | 147,627 | 35.1% | $0 | $0.00 |
| 2021 | 0 | 0 | 0.0% | 147,627 | 35.1% | $0 | $0.00 |
| 2022 | 0 | 0 | 0.0% | 147,627 | 35.1% | $0 | $0.00 |
| 2023 | 1 | 1,725 | 0.4% | 149,352 | 35.5% | $22,425 | $13.00 |
| 2024 | 1 | 69,925 | 16.6% | 219,277 | 52.2% | $839,100 | $12.00 |
| Thereafter | 2 | 137,933 | 32.8% | 357,210 | 85.0% | $450,000 | $3.26 |
| Vacant | 0 | 63,224 | 15.0% | 420,434 | 100.0% | $0 | $0.00 |
| Total/Weighted Average | 30 | 420,434 | 100.0% | $2,833,742 | $7.93 |
| (1) | Information obtained from the underwritten rent roll. |
| (2) | Weighted average Annual U/W Base Rent PSF excludes vacant space. |
The following table presents historical occupancy percentages at the West Side Mall Property:
Historical Occupancy
12/31/2010(1) | 12/31/2011(1) | 12/31/2012(1) | 9/30/2013 | |||
| NAV | NAV | NAV | 85.0% |
| (1) | Historical occupancy was not available from the seller. |
Operating History and Underwritten Net Cash Flow. The following table presents certain information relating to the historical operating performance and the Underwritten Net Cash Flow at the West Side Mall Property:
Cash Flow Analysis
2011 | 2012 | TTM 8/31/2013 | U/W | U/W $ per Unit | ||||||
| Base Rent | $2,775,288 | $2,764,438 | $2,807,078 | $2,833,742 | $6.74 | |||||
| Grossed Up Vacant Space | 0 | 0 | 0 | 653,984 | 1.56 | |||||
| Percentage Rent | 25,729 | 33,243 | 12,858 | 12,858 | 0.03 | |||||
| Total Reimbursables | 951,747 | 971,760 | 931,554 | 1,134,351 | 2.70 | |||||
| Other Income | 0 | 0 | 0 | 0 | 0.00 | |||||
| Less Vacancy & Credit Loss | 0 | 0 | 0 | (830,339)(1) | (1.97) | |||||
| Effective Gross Income | $3,752,764 | $3,769,441 | $3,751,490 | $3,804,596 | $9.05 | |||||
| Total Operating Expenses | $1,331,132 | $1,291,054 | $1,359,615 | $1,371,569 | $3.26 | |||||
| Net Operating Income | $2,421,632 | $2,478,387 | $2,391,875 | $2,433,027 | $5.79 | |||||
| TI/LC | 0 | 0 | 0 | 166,904 | 0.40 | |||||
| Replacement Reserves | 0 | 0 | 0 | 105,109 | 0.25 | |||||
| Net Cash Flow | $2,421,632 | $2,478,387 | $2,391,875 | $2,161,014 | $5.14 | |||||
| NOI DSCR | 1.42x | 1.45x | 1.40x | 1.43x | ||||||
| NCF DSCR | 1.42x | 1.45x | 1.40x | 1.27x | ||||||
| NOI DY | 9.5% | 9.7% | 9.3% | 9.5% | ||||||
| NCF DY | 9.5% | 9.7% | 9.3% | 8.4% | ||||||
| (1) | The underwritten economic vacancy is 17.9%. The West Side Mall Property was 85.0% physically occupied as of September 30, 2013. |
THE INFORMATION IN THIS STRUCTURAL AND COLLATERAL TERM SHEET IS NOT COMPLETE AND MAY BE AMENDED PRIOR TO THE TIME OF SALE. THIS TERM SHEET IS NOT AN OFFER TO SELL THESE SECURITIES AND IT IS NOT A SOLICITATION OF AN OFFER TO BUY THESE SECURITIES IN ANY JURISDICTION WHERE THE OFFER OR SALE IS NOT PERMITTED.
130
(THIS PAGE INTENTIONALLY LEFT BLANK)
131
| No. 15 – The Pointe at Wellington Green | ||||||||||
| Loan Information | Property Information | |||||||||
| Mortgage Loan Seller: | Wells Fargo Bank, National Association | Single Asset/Portfolio: | Single Asset | |||||||
Credit Assessment (DBRS/Fitch/Moody’s): | NR/NR/NR | Property Type: | Retail | |||||||
| Original Principal Balance: | $25,000,000 | Specific Property Type: | Anchored | |||||||
| Cut-off Date Principal Balance: | $25,000,000 | Location: | Wellington, FL | |||||||
| % of Initial Pool Balance: | 2.0% | Size: | 118,797 SF | |||||||
| Loan Purpose: | Refinance | Cut-off Date Principal Balance Per SF: | $210.44 | |||||||
| Borrower Name: | The Centre At Wellington Green LLLP | Year Built/Renovated: | 2003/NAP | |||||||
Sponsor(1): | Richard Gertz, Sr. | Title Vesting: | Fee | |||||||
| Mortgage Rate: | 5.300% | Property Manager: | Merin Hunter Codman, Inc. | |||||||
| Note Date: | December 11, 2013 | 3rd Most Recent Occupancy (As of): | 95.4% (12/31/2010) | |||||||
| Anticipated Repayment Date: | NAP | 2nd Most Recent Occupancy (As of): | 87.0% (12/31/2011) | |||||||
| Maturity Date: | January 1, 2024 | Most Recent Occupancy (As of): | 94.0% (12/31/2012) | |||||||
| IO Period: | 24 months | Current Occupancy (As of)(7): | 86.8% (9/10/2013) | |||||||
| Loan Term (Original): | 120 months | |||||||||
| Seasoning: | 1 month | Underwriting and Financial Information: | ||||||||
| Amortization Term (Original): | 360 months | |||||||||
| Loan Amortization Type: | Interest-only, Amortizing Balloon | 3rd Most Recent NOI (As of): | $2,496,968 (12/31/2011) | |||||||
| Interest Accrual Method: | Actual/360 | 2nd Most Recent NOI (As of): | $2,410,183 (12/31/2012) | |||||||
| Call Protection: | L(25),D(91),O(4) | Most Recent NOI (As of): | $2,426,527 (TTM 9/30/2013) | |||||||
| Lockbox Type: | Springing (Without Established Account) | |||||||||
Additional Debt(2): | Yes | |||||||||
Additional Debt Type(2): | Unsecured | U/W Revenues: | $3,459,369 | |||||||
| U/W Expenses: | $1,322,417 | |||||||||
| U/W NOI: | $2,136,952 | |||||||||
| U/W NCF: | $2,072,863 | |||||||||
Escrows and Reserves: | U/W NOI DSCR: | 1.28x | ||||||||
| U/W NCF DSCR: | 1.24x | |||||||||
Type: | Initial | Monthly | Cap (If Any) | U/W NOI Debt Yield: | 8.5% | |||||
| Taxes | $96,798 | $48,399 | NAP | U/W NCF Debt Yield: | 8.3% | |||||
Insurance(3) | $0 | Springing | NAP | As-Is Appraised Value(8): | $35,500,000 | |||||
| Replacement Reserves | $500,000 | $3,465 | NAP | As-Is Appraisal Valuation Date(8): | October 2, 2013 | |||||
| TI/LC Reserve | $1,500,000 | $10,000 | $1,500,000(4) | Cut-off Date LTV Ratio(8): | 70.4% | |||||
Tenant Specific TILC Reserve(5) | $160,000 | $0 | NAP | LTV Ratio at Maturity or ARD(8): | 61.4% | |||||
Rent Concession Reserve(6) | $327,000 | $0 | NAP | |||||||
| (1) | The sponsor has three CMBS loans currently in special servicing and another loan which was involved in a deed in lieu. See “Description of the Mortgage Pool – Default History, Bankruptcy Issues and Other Proceedings” in the Free Writing Prospectus. |
| (2) | The borrower has incurred unsecured subordinate debt with an outstanding principal balance of $6,972,000, provided by the sponsor and six limited partners in the borrowing entity. The unsecured subordinate debt accrues interest at a variable interest rate equal to the Wall Street Journal Prime rate plus 0.75% and is payable from excess cash flow from operations and capital transactions. Subordination and standstill agreements were obtained from the related sponsor and six limited partners. |
| (3) | Monthly insurance escrows are not required provided the following conditions are satisfied: (i) no event of default exists and is continuing; (ii) The Pointe at Wellington Green Property is covered under a blanket insurance policy acceptable to the lender; and (iii) the borrower provides evidence of renewal of the policy and proof of timely payment of insurance premiums. |
| (4) | If LA Fitness, or an acceptable replacement tenant, enters into a lease acceptable to the lender expiring no earlier than five years beyond the maturity date, the TI/LC Reserve Cap will be reduced to $360,000. If LA Fitness, or an acceptable replacement tenant, does not meet the aforementioned conditions by November 2018, the borrower is required to deposit an amount to bring the TI/LC Reserve account to $1,500,000. |
| (5) | The Tenant Specific TI/LC Reserve includes outstanding tenant improvements for Saito’s Japanese ($100,000) and KeKe’s ($60,000). |
| (6) | The Rent Concession Reserve includes outstanding free rent and rent abatements for KeKe’s ($150,000), Saito’s Japanese ($85,000), Sweet Banana’s Grill ($66,000) and Sport Clips ($26,000). |
| (7) | Current Occupancy includes three tenants (7.3% of the net rentable area and 6.7% of the U/W Base Rent) that have executed leases, but are not in occupancy. KeKe’s (3.7% of the net rentable area and 3.0% of the U/W Base Rent) is expected to open by the second quarter of 2014, Saito’s Japanese expansion space (2.5% of the net rentable area and 2.5% of the U/W Base Rent) is expected to open by the third quarter of 2014 and Sport Clips (1.1% of the net rentable area and 1.2% of the U/W Base Rent) is expected to open by the first quarter of 2014. Excluding these tenants, Current Occupancy is 79.5%. Current Occupancy includes three tenants underwritten as vacant (4.4% of the net rentable area). Current Occupancy, including tenants that have executed leases but are not in occupancy and excluding tenants that have been underwritten as vacant, is 82.4%. Current Occupancy, excluding tenants that have executed leases but are not in occupancy and tenants that have been underwritten as vacant, is 75.1%. |
| (8) | The As-Is Appraised Value assumes SunTrust Banks (2.5% of the net rentable area and 4.9% of the U/W Base Rent) renews its lease, which is set to expire on July 31, 2014. The borrower has signed a lease to create a pad site for JPMorgan Chase on the space currently occupied by SunTrust Banks and Thomasville (10.1% of the net rentable area) in the event that SunTrust Banks and Thomasville do not renew their leases. The as-is appraised value assuming SunTrust Banks and Thomasville, which has been underwritten as vacant, both do not renew their leases and the borrower completes the JPMorgan Chase pad site, is $33,650,000. The Cut-off Date LTV Ratio and LTV Ratio at Maturity or ARD based on the $33,650,000 appraised value are 74.3% and 64.8%, respectively. The as-stabilized appraised value, assuming SunTrust Banks and Thomasville both do not renew their leases, the borrower completes the JPMorgan Chase pad site and JPMorgan Chase begins paying rent in 2015, is $34,600,000. The Cut-off Date LTV Ratio and LTV Ratio at Maturity or ARD based on the $34,600,000 appraised value are 72.3% and 63.0%, respectively. |
The Pointe at Wellington Green mortgage loan is evidenced by a single promissory note that is secured by a first mortgage encumbering a 118,797 square foot, anchored retail property located in Wellington, Florida (“The Pointe at Wellington Green Property”), approximately 16 miles west of West Palm Beach, 47 miles north of Fort Lauderdale and 69 miles north of Miami, Florida. The Pointe at Wellington Green Property was built in 2003 and is adjacent to the Mall at Wellington Green, an approximately 1.3 million square foot regional mall anchored by Macy’s, Nordstrom, JC Penney and Dillard’s. Parking at The Pointe at Wellington Green Property is provided by 850 surface
THE INFORMATION IN THIS STRUCTURAL AND COLLATERAL TERM SHEET IS NOT COMPLETE AND MAY BE AMENDED PRIOR TO THE TIME OF SALE. THIS TERM SHEET IS NOT AN OFFER TO SELL THESE SECURITIES AND IT IS NOT A SOLICITATION OF AN OFFER TO BUY THESE SECURITIES IN ANY JURISDICTION WHERE THE OFFER OR SALE IS NOT PERMITTED.
132
| THE POINTE AT WELLINGTON GREEN |
spaces, resulting in a parking ratio of 7.2 spaces per 1,000 square feet of rentable area. As of September 10, 2013, The Pointe at Wellington Green Property was 86.8% leased to 30 tenants.
Sources and Uses
| Sources | Uses | ||||||||
| Original loan amount | $25,000,000 | 100.0% | Loan payoff(1) | $19,785,769 | 79.1 | % | |||
| Reserves | 2,583,798 | 10.3 | |||||||
| Paydown of unsecured debt | 1,517,676 | 6.1 | |||||||
| Closing costs | 612,757 | 2.5 | |||||||
| Return of equity | 500,000 | 2.0 | |||||||
| Total Sources | $25,000,000 | 100.0% | Total Uses | $25,000,000 | 100.0 | % |
| (1) | The Pointe at Wellington Green Property was previously securitized in WBCMT 2004-C12. |
The following table presents certain information relating to the tenancy at The Pointe at Wellington Green Property:
Major Tenants
Tenant Name | Credit Rating (Fitch/ Moody’s/S&P)(1) | Tenant NRSF | % of NRSF | Annual U/W Base Rent PSF | Annual U/W Base Rent | % of Total Annual U/W Base Rent | Sales PSF(2) | Occupancy Cost(2) | Lease Expiration Date |
| Major Tenants | |||||||||
| LA Fitness | NR/NR/NR | 41,000 | 34.5% | $21.00 | $861,000 | 34.8% | NAV | NAV | 11/30/2018 |
| Olive Garden – Ground Lease | BBB-/Baa3/BBB- | 0 | 0.0% | NAP | $151,250 | 6.1% | NAV | NAV | 10/31/2018 |
Saito’s Japanese(3) | NR/NR/NR | 7,156 | 6.0% | $21.00 | $150,276 | 6.1% | NAV | NAV | 11/30/2023 |
| Stonewood Wellington | NR/NR/NR | 5,760 | 4.8% | $25.00 | $144,000 | 5.8% | $439 | 8.0% | 10/31/2018 |
| Smokey Bones – Ground Lease | NR/NR/NR | 0 | 0.0% | NAP | $121,000 | 4.9% | $420(4) | 4.2% | 10/31/2018 |
| SunTrust Banks | BBB+/Baa1/BBB | 3,000 | 2.5% | $40.00 | $120,000 | 4.9% | NAV | NAV | 7/31/2014 |
| Total Major Tenants | 56,916 | 47.9% | $22.41(5) | $1,547,526 | 62.5% | ||||
| Non-Major Tenants | 40,971 | 34.5% | $22.61 | $926,542 | 37.5% | ||||
| Occupied Collateral Total | 97,887 | 82.4%(6) | $22.49(5) | $2,474,068 | 100.0% | ||||
| Vacant Space | 20,910 | 17.6% | |||||||
| Collateral Total | 118,797 | 100.0% | |||||||
| (1) | Certain ratings are those of the parent company whether or not the parent guarantees the lease. |
| (2) | Sales PSF and Occupancy Cost are for the trailing 12-month period ending December 31, 2012. |
| (3) | Saito’s Japanese signed a lease for 7,156 square feet but is not in occupancy or paying rent on 2,957 square feet. Reserves of $85,000 and $100,000 were collected at closing to account for the outstanding rent abatement and tenant improvements, respectively. Saito’s Japanese is expected to be in occupancy and paying rent on its expansion space by the third quarter of 2014. |
| (4) | Sales PSF for Smokey Bones are based on 6,887 square feet in building improvements. |
| (5) | Annual U/W Base Rent for ground lease tenants is excluded from the Annual U/W Base Rent PSF calculations. |
| (6) | Current Occupancy includes three tenants (7.3% of the net rentable area and 6.7% of the U/W Base Rent) that have executed leases, but are not in occupancy. KeKe’s (3.7% of the net rentable area and 3.0% of the U/W Base Rent) is expected to open by the second quarter of 2014, Saito’s Japanese expansion space (2.5% of the net rentable area and 2.5% of the U/W Base Rent) is expected to open by the third quarter of 2014 and Sport Clips (1.1% of the net rentable area and 1.2% of the U/W Base Rent) is expected to open by the first quarter of 2014. Excluding these tenants, Current Occupancy is 79.5%. Current Occupancy includes three tenants underwritten as vacant (4.4% of the net rentable area) including Thomasville (10.1% of the net rentable area), whose parent company filed for bankruptcy in September 2013 and recently vacated The Pointe at Wellington Green Property. Current Occupancy, including tenants that have executed leases but are not in occupancy and excluding tenants that have been underwritten as vacant, is 82.4%. Current Occupancy, excluding tenants that have executed leases but are not in occupancy and tenants that have been underwritten as vacant, is 75.1%. |
THE INFORMATION IN THIS STRUCTURAL AND COLLATERAL TERM SHEET IS NOT COMPLETE AND MAY BE AMENDED PRIOR TO THE TIME OF SALE. THIS TERM SHEET IS NOT AN OFFER TO SELL THESE SECURITIES AND IT IS NOT A SOLICITATION OF AN OFFER TO BUY THESE SECURITIES IN ANY JURISDICTION WHERE THE OFFER OR SALE IS NOT PERMITTED.
133
| THE POINTE AT WELLINGTON GREEN |
The following table presents certain information relating to the lease rollover schedule at The Pointe at Wellington Green Property:
Lease Expiration Schedule(1)(2)
Year Ending December 31, | No. of Leases Expiring | Expiring NRSF | % of Total NRSF | Cumulative Expiring NRSF | Cumulative % of Total NRSF | Annual U/W Base Rent | Annual U/W Base Rent PSF(3) | |||||||
| MTM | 0 | 0 | 0.0% | 0 | 0.0% | $0 | $0.00 | |||||||
| 2014 | 1 | 3,000 | 2.5% | 3,000 | 2.5% | $120,000 | $40.00 | |||||||
| 2015 | 3 | 4,937 | 4.2% | 7,937 | 6.7% | $112,169 | $22.72 | |||||||
| 2016 | 0 | 0 | 0.0% | 7,937 | 6.7% | $0 | $0.00 | |||||||
| 2017 | 3 | 7,346 | 6.2% | 15,283 | 12.9% | $175,858 | $23.94 | |||||||
| 2018 | 8 | 55,302 | 46.6% | 70,585 | 59.4% | $1,479,230 | $21.83(4) | |||||||
| 2019 | 2 | 3,297 | 2.8% | 73,882 | 62.2% | $79,783 | $24.20 | |||||||
| 2020 | 0 | 0 | 0.0% | 73,882 | 62.2% | $0 | $0.00 | |||||||
| 2021 | 1 | 2,289 | 1.9% | 76,171 | 64.1% | $54,936 | $24.00 | |||||||
| 2022 | 2 | 2,886 | 2.4% | 79,057 | 66.5% | $65,658 | $22.75 | |||||||
| 2023 | 5 | 11,744 | 9.9% | 90,801 | 76.4% | $252,342 | $21.49 | |||||||
| 2024 | 2 | 7,086 | 6.0% | 97,887 | 82.4% | $134,092 | $18.92 | |||||||
| Thereafter | 0 | 0 | 0.0% | 97,887 | 82.4% | $0 | $0.00 | |||||||
| Vacant | 0 | 20,910 | 17.6% | 118,797 | 100.0% | $0 | $0.00 | |||||||
| Total/Weighted Average | 27 | 118,797 | 100.0% | $2,474,068 | $22.49 |
| (1) | Information was obtained from the underwritten rent roll. |
| (2) | Certain tenants may have lease termination options that are exercisable prior to the originally stated expiration date of the subject lease and that are not considered in the Lease Expiration Schedule. |
| (3) | Weighted Average Annual U/W Base Rent PSF excludes vacant space. |
| (4) | Annual U/W Base Rent for ground lease tenants is excluded from the Annual U/W Base Rent PSF calculations. |
The following table presents historical occupancy percentages at The Pointe at Wellington Green Property:
Historical Occupancy
12/31/2010(1) | 12/31/2011(1) | 12/31/2012(1) | 9/10/2013 | |||
| 95.4% | 87.0% | 94.0% | 86.8% |
| (1) | Information obtained from the borrower. |
Operating History and Underwritten Net Cash Flow. The following table presents certain information relating to the historical operating performance and the Underwritten Net Cash Flow at The Pointe at Wellington Green Property:
Cash Flow Analysis
| 2011 | 2012 | TTM 9/30/2013 | U/W | U/W $ per SF | ||||||
| Base Rent | $2,800,740 | $2,872,032 | $2,735,343 | $2,474,068 | $20.83 | |||||
| Grossed Up Vacant Space | 0 | 0 | 0 | 450,524 | 3.79 | |||||
| Total Reimbursables | 920,455 | 849,396 | 1,094,650 | 976,875 | 8.22 | |||||
| Other Income | 55,505 | 8,426 | 17,553 | 8,426 | 0.07 | |||||
| Less Vacancy & Credit Loss | (16,441) | 0 | (79,286) | (450,524)(1) | (3.79) | |||||
| Effective Gross Income | $3,760,259 | $3,729,854 | $3,768,258 | $3,459,369 | $29.12 | |||||
| Total Operating Expenses | $1,263,291 | $1,319,671 | $1,341,732 | $1,322,417 | $11.13 | |||||
| Net Operating Income | $2,496,968 | $2,410,183 | $2,426,527 | $2,136,952 | $17.99 | |||||
| TI/LC | 0 | 0 | 0 | 22,510 | 0.19 | |||||
| Capital Expenditures | 0 | 0 | 0 | 41,579 | 0.35 | |||||
| Net Cash Flow | $2,496,968 | $2,410,183 | $2,426,527 | $2,072,863 | $17.45 | |||||
| NOI DSCR | 1.50x | 1.45x | 1.46x | 1.28x | ||||||
| NCF DSCR | 1.50x | 1.45x | 1.46x | 1.24x | ||||||
| NOI DY | 10.0% | 9.6% | 9.7% | 8.5% | ||||||
| NCF DY | 10.0% | 9.6% | 9.7% | 8.3% | ||||||
(1) | The underwritten economic vacancy is 15.4%. The Pointe at Wellington Green Property was 86.8% leased as of September 10, 2013. |
THE INFORMATION IN THIS STRUCTURAL AND COLLATERAL TERM SHEET IS NOT COMPLETE AND MAY BE AMENDED PRIOR TO THE TIME OF SALE. THIS TERM SHEET IS NOT AN OFFER TO SELL THESE SECURITIES AND IT IS NOT A SOLICITATION OF AN OFFER TO BUY THESE SECURITIES IN ANY JURISDICTION WHERE THE OFFER OR SALE IS NOT PERMITTED.
134
| WFRBS Commercial Mortgage Trust 2014-LC14 | Transaction Contact Information |
VI. Transaction Contact Information
Questions regarding this Structural and Collateral Term Sheet may be directed to any of the following individuals:
| Wells Fargo Securities, LLC | RBS Securities Inc. | ||
| Brigid Mattingly | Tel. (312) 269-3062 | Todd Jaeger - Trading | Tel. (203) 897-2900 |
| Fax (312) 658-0140 | |||
| A.J. Sfarra | Tel. (212) 214-5613 | Adam Ansaldi | Tel. (203) 897-0881 |
| Fax (212) 214-8970 | Fax (203) 873-3542 | ||
| Alex Wong | Tel. (212) 214-5615 | Jim Barnard | Tel. (203) 897-4417 |
| Fax (212) 214-8970 | Fax (203) 873-4310 | ||
THE INFORMATION IN THIS STRUCTURAL AND COLLATERAL TERM SHEET IS NOT COMPLETE AND MAY BE AMENDED PRIOR TO THE TIME OF SALE. THIS TERM SHEET IS NOT AN OFFER TO SELL THESE SECURITIES AND IT IS NOT A SOLICITATION OF AN OFFER TO BUY THESE SECURITIES IN ANY JURISDICTION WHERE THE OFFER OR SALE IS NOT PERMITTED.
135