Exhibit (c)(2)

Hailiang Education Group Inc. Private and Confidential The information contained herein is of a confidential nature and is intended for the exclusive use of the persons or firm to whom it is furnished by us. Reproduction, publication, or dissemination of portions hereof may not be made without prior approval of Kroll, LLC. Prepared by: Duff & Phelps Opinions Practice May 7, 2022 Fairness Analysis Presented to the Special Committee of Independent Directors

2 Duff & Phelps Disclaimer • The following pages contain materials that are being provided by Kroll, LLC (“ Duff & Phelps ”), operating through its Duff & Phelps Opinions Practice, to the special committee of independent directors (the “ Special Committee ”) of the board of directors (the “ Board of Directors ”) (solely in their capacity as members of the Special Committee) of Hailiang Education Group Inc . (the “ Company ”) in the context of a meeting of the Special Committee held to consider the Proposed Transaction (as defined herein) . • The accompanying materials are, and any Opinion (as defined herein) will be, compiled and presented on a confidential basis, solely for the use and benefit of the Special Committee in connection with its evaluation of the Proposed Transaction and may not be, in whole or in part, distributed to any other party, publicly disclosed, or relied upon for any other purpose without the prior written consent of Duff & Phelps or as otherwise provided in the engagement letter dated January 21 , 2022 and the amendment thereto dated April 11 , 2022 among Duff & Phelps, the Company, and the Special Committee . • Because these materials were prepared for use in the context of an oral presentation to the Special Committee, whose members are familiar with the business and affairs of the Company, neither Duff & Phelps nor any of its respective legal or financial advisors or accountants, take any responsibility for the accuracy or completeness of any of the accompanying materials if used by persons other than the Special Committee . • These materials are not intended to represent an Opinion and shall not be treated, construed, used or relied upon in any way as an Opinion . These materials are intended to serve as discussion materials for the Special Committee and as a summary of the basis upon which Duff & Phelps may render an Opinion, and are incomplete without reference to, and should be viewed solely in conjunction with, the discussion between Duff & Phelps and the Special Committee . • The accompanying material does not, and any Opinion provided by Duff & Phelps would not : (i) address the merits of the underlying business decision to enter into the Proposed Transaction versus any alternative strategy or transaction ; (ii) constitute a recommendation as to how the Special Committee, the Board of Directors or any other person (including security holders of the Company) should vote or act with respect to any matters relating to the Proposed Transaction, or whether to proceed with the Proposed Transaction or any related transaction ; or (iii) create any fiduciary duty on the part of Duff & Phelps to any party . • The information utilized in preparing this presentation was obtained from the Company and from public sources under the assumption that they are complete and accurate as of the date of provision . Duff & Phelps did not independently verify such information . Any estimates and forecasts contained herein have been prepared by or are based on discussions with the senior management of the Company and involve numerous and significant subjective determinations, which may or may not prove to be correct . No representation or warranty, expressed or implied, is made as to the accuracy or completeness of such information and nothing contained herein is, or shall be relied upon as, a representation or warranty, whether as to the past or the future . • No selected company or selected transaction used in our analysis is directly comparable to the Company or the Proposed Transaction .
Table of Contents 3 1. Introduction and Transaction Overview 2. Valuation Analysis • Discounted Cash Flow Analysis • Implied Multiples Analysis

1. Introduction and Transaction Overview

5 Introduction and Transaction Overview The Engagement • Duff & Phelps was engaged by the Company to serve as an independent financial advisor to the Special Committee (solely in its capacity as such) . • Specifically, Duff & Phelps has been asked to provide an opinion (the “ Opinion ”) as to the fairness, from a financial point of view, to (i) the holders of ordinary shares, par value US $ 0 . 0001 per share, of the Company (each, a “ Share ” or, collectively, the “ Shares ”), other than the Excluded Shares (as defined below), and (ii) the holders of American Depositary Shares of the Company, each representing sixteen ( 16 ) Shares (each, an “ ADS ” and collectively, “ ADSs ”), other than ADSs representing the Excluded Shares, of the Merger Consideration (as defined below) to be received by such holders in the Proposed Transaction (as defined below) (without giving effect to any impact of the Proposed Transaction on any particular holder of Shares or ADSs other than in its capacity as a holder of Shares or ADSs) . Proposed Transaction • It is Duff & Phelps’ understanding that the Company, Hailiang Education International Limited, an exempted company incorporated with limited liability under the Laws of the Cayman Islands (“ Parent ”), and HE Merger Sub Limited, an exempted company incorporated with limited liability under the Laws of the Cayman Islands (“ Merger Sub ”), propose to enter into an Agreement and Plan of Merger (the “ Merger Agreement ”), dated as of the date hereof, the latest draft of which Duff & Phelps has reviewed is dated as of May 6 , 2022 . Pursuant to the Merger Agreement, among other things, Merger Sub will be merged with and into the Company and cease to exist, with the Company surviving the merger and becoming a wholly owned subsidiary of Parent as a result of the merger . In connection with such merger, (i) each Share (including Shares represented by ADSs) that is issued and outstanding immediately prior to the Effective Time (other than Excluded Shares) shall be canceled and cease to exist in exchange for the right to receive $ 0 . 894375 in cash without interest (the “ Per Share Merger Consideration ”), and (ii) for the avoidance of doubt, because each ADS represents sixteen ( 16 ) Shares, each ADS that is issued and outstanding immediately prior to the Effective Time (other than ADSs that represent Excluded Shares) shall represent the right to surrender the ADS in exchange for $ 14 . 31 in cash without interest (the “ Per ADS Merger Consideration ”, and together with the Per Share Merger Consideration, the “ Merger Consideration ”) (collectively, the “ Proposed Transaction ”) . • The terms and conditions of the Proposed Transaction are more fully set forth in the Merger Agreement . • For purposes of the Opinion, (i) “ Excluded Shares ” shall mean, collectively, (a) Shares (including Shares represented by ADSs) owned by Parent, Merger Sub or the Company (as treasury shares, if any) or by any direct or indirect Subsidiary of Parent, Merger Sub or the Company, in each case immediately prior to the Effective Time and (b) Dissenting Shares (if any), and (c) Rollover Securities ; and (ii) “ Subsidiary ”, “ Effective Time ”, “ Dissenting Shares ”, “ Rollover Securities ” shall have the meanings set forth in the Merger Agreement .
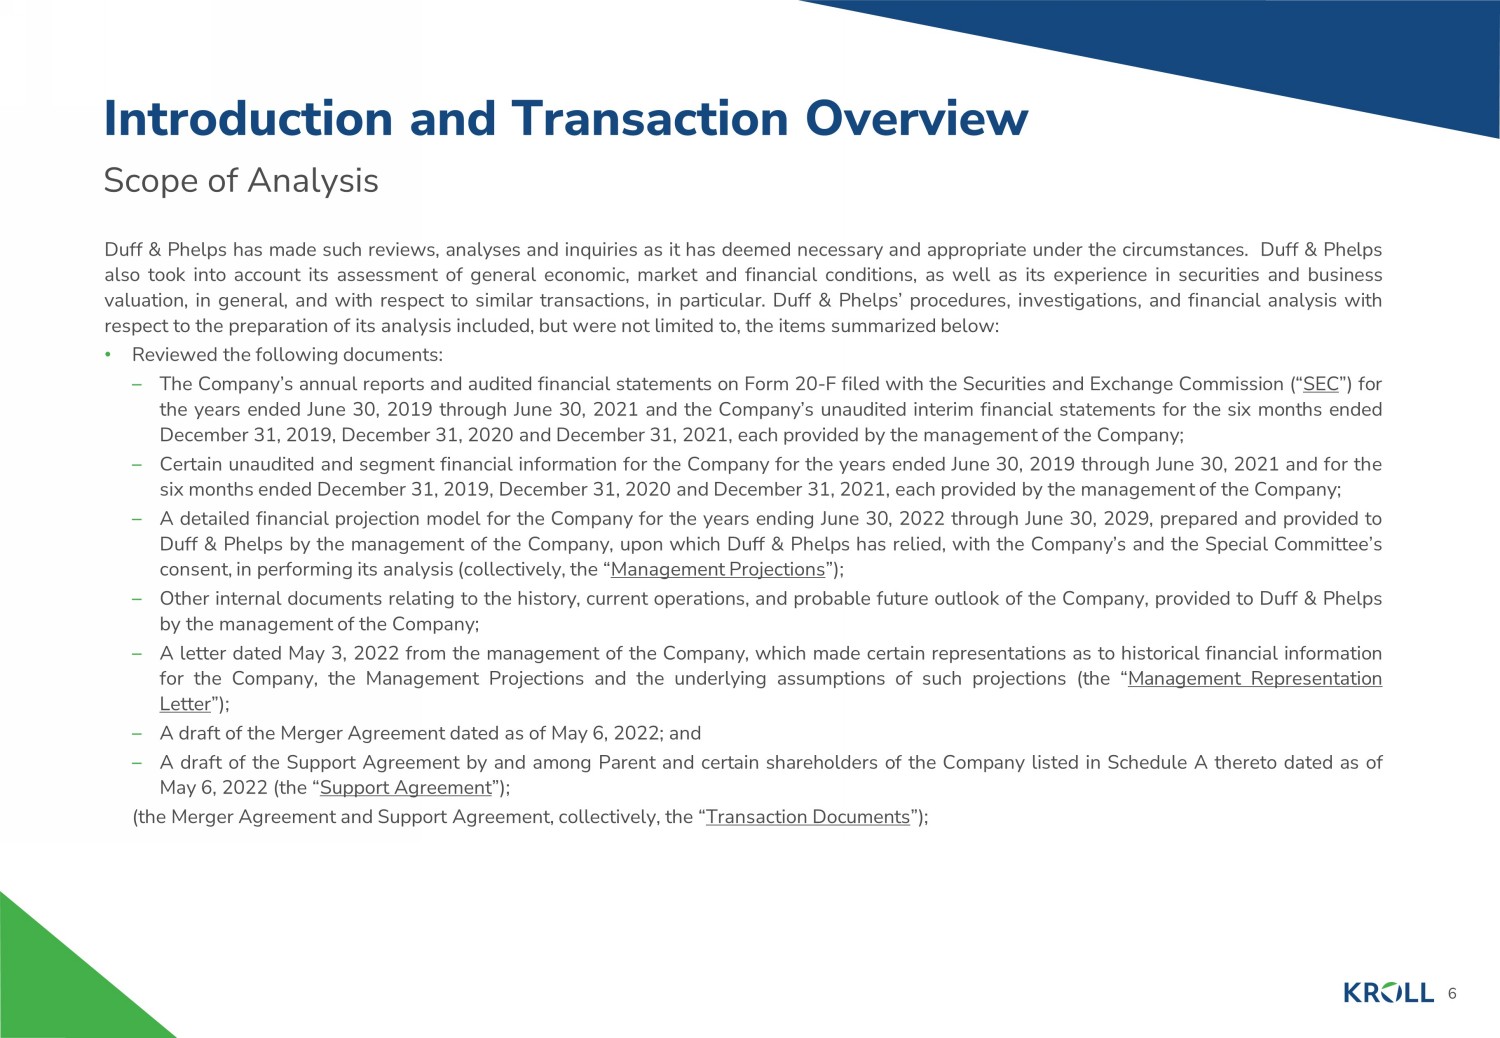
6 Scope of Analysis Introduction and Transaction Overview Duff & Phelps has made such reviews, analyses and inquiries as it has deemed necessary and appropriate under the circumstances . Duff & Phelps also took into account its assessment of general economic, market and financial conditions, as well as its experience in securities and business valuation, in general, and with respect to similar transactions, in particular . Duff & Phelps’ procedures, investigations, and financial analysis with respect to the preparation of its analysis included, but were not limited to, the items summarized below : • Reviewed the following documents : – The Company’s annual reports and audited financial statements on Form 20 - F filed with the Securities and Exchange Commission (“ SEC ”) for the years ended June 30 , 2019 through June 30 , 2021 and the Company’s unaudited interim financial statements for the six months ended December 31 , 2019 , December 31 , 2020 and December 31 , 2021 , each provided by the management of the Company ; – Certain unaudited and segment financial information for the Company for the years ended June 30 , 2019 through June 30 , 2021 and for the six months ended December 31 , 2019 , December 31 , 2020 and December 31 , 2021 , each provided by the management of the Company ; – A detailed financial projection model for the Company for the years ending June 30 , 2022 through June 30 , 2029 , prepared and provided to Duff & Phelps by the management of the Company, upon which Duff & Phelps has relied, with the Company’s and the Special Committee’s consent, in performing its analysis (collectively, the “ Management Projections ”) ; – Other internal documents relating to the history, current operations, and probable future outlook of the Company, provided to Duff & Phelps by the management of the Company ; – A letter dated May 3 , 2022 from the management of the Company, which made certain representations as to historical financial information for the Company, the Management Projections and the underlying assumptions of such projections (the “ Management Representation Letter ”) ; – A draft of the Merger Agreement dated as of May 6 , 2022 ; and – A draft of the Support Agreement by and among Parent and certain shareholders of the Company listed in Schedule A thereto dated as of May 6 , 2022 (the “ Support Agreement ”) ; (the Merger Agreement and Support Agreement, collectively, the “ Transaction Documents ”) ;

7 Scope of Analysis Introduction and Transaction Overview • Discussed the information referred to on the previous page and the background and other elements of the Proposed Transaction with the management of the Company ; • Discussed with the management of the Company its plans and intentions with respect to the management and operation of the Company’s business ; • Reviewed the historical trading price and trading volume of the ADSs and the publicly traded securities of certain other companies that Duff & Phelps deemed relevant ; • Performed certain valuation and comparative analyses using generally accepted valuation and analytical techniques including a discounted cash flow analysis, an analysis of selected public companies that Duff & Phelps deemed relevant, and an analysis of selected transactions that Duff & Phelps deemed relevant ; and • Conducted such other analyses and considered such other factors as Duff & Phelps deemed appropriate .
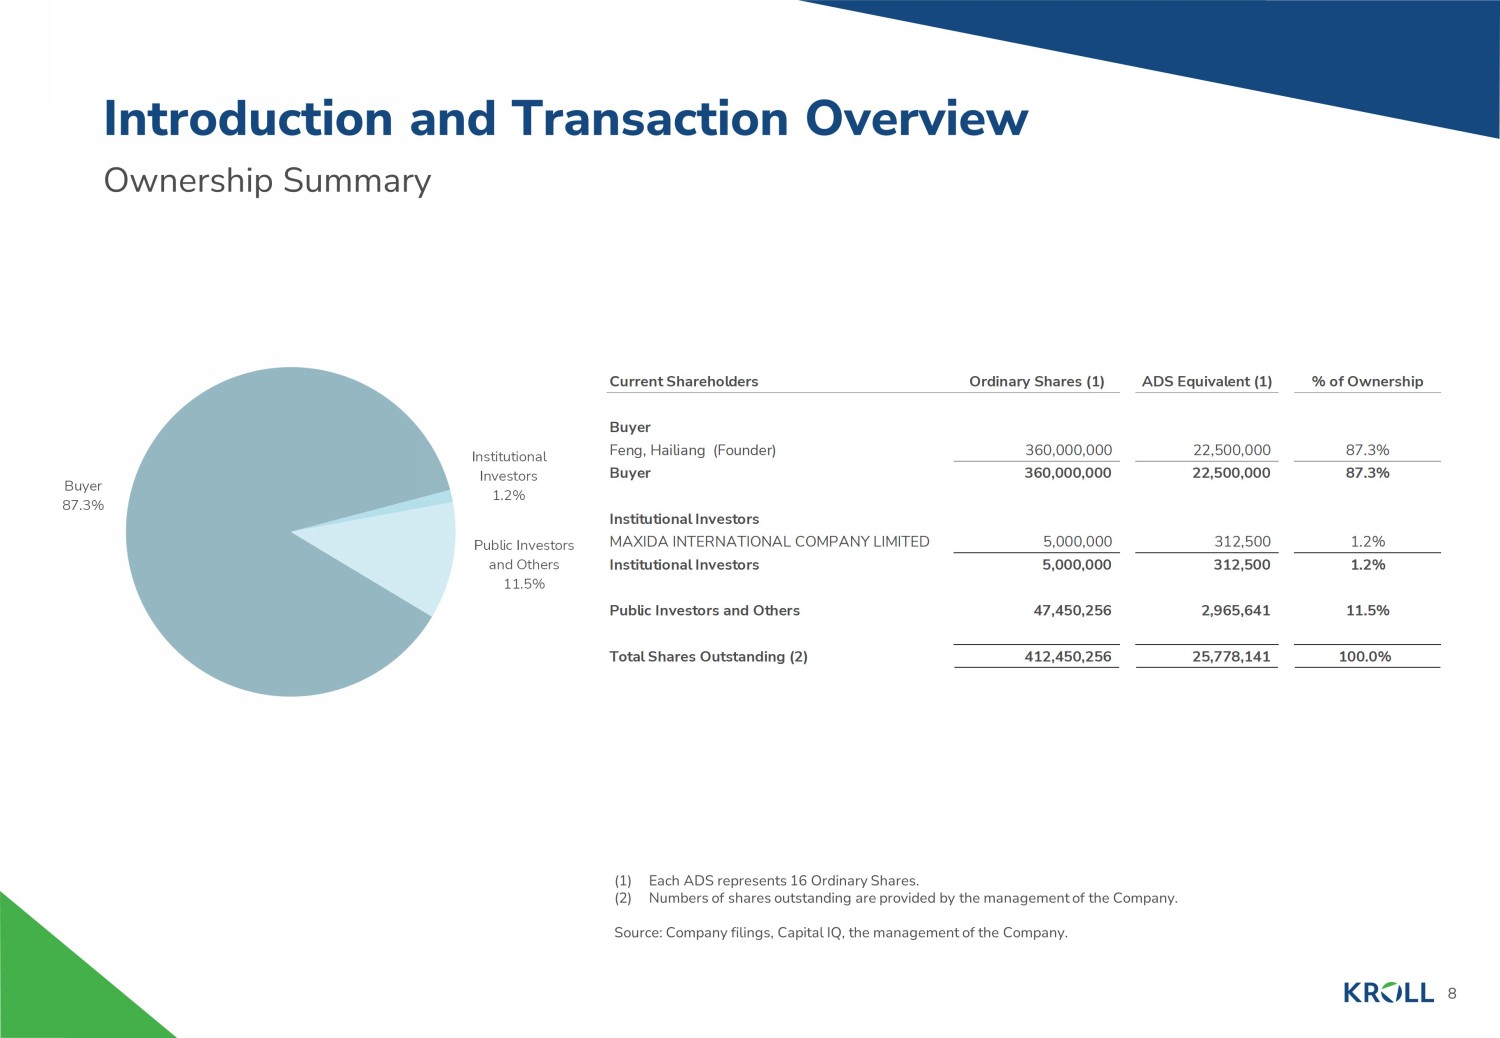
8 Ownership Summary Introduction and Transaction Overview (1) Each ADS represents 16 Ordinary Shares. (2) Numbers of shares outstanding are provided by the management of the Company. Source: Company filings, Capital IQ, the management of the Company. Buyer 87.3% Institutional Investors 1.2% Public Investors and Others 11.5% Current Shareholders Ordinary Shares (1) ADS Equivalent (1) % of Ownership Buyer Feng, Hailiang (Founder) 360,000,000 22,500,000 87.3% Buyer 360,000,000 22,500,000 87.3% Institutional Investors MAXIDA INTERNATIONAL COMPANY LIMITED 5,000,000 312,500 1.2% Institutional Investors 5,000,000 312,500 1.2% Public Investors and Others 47,450,256 2,965,641 11.5% Total Shares Outstanding (2) 412,450,256 25,778,141 100.0%
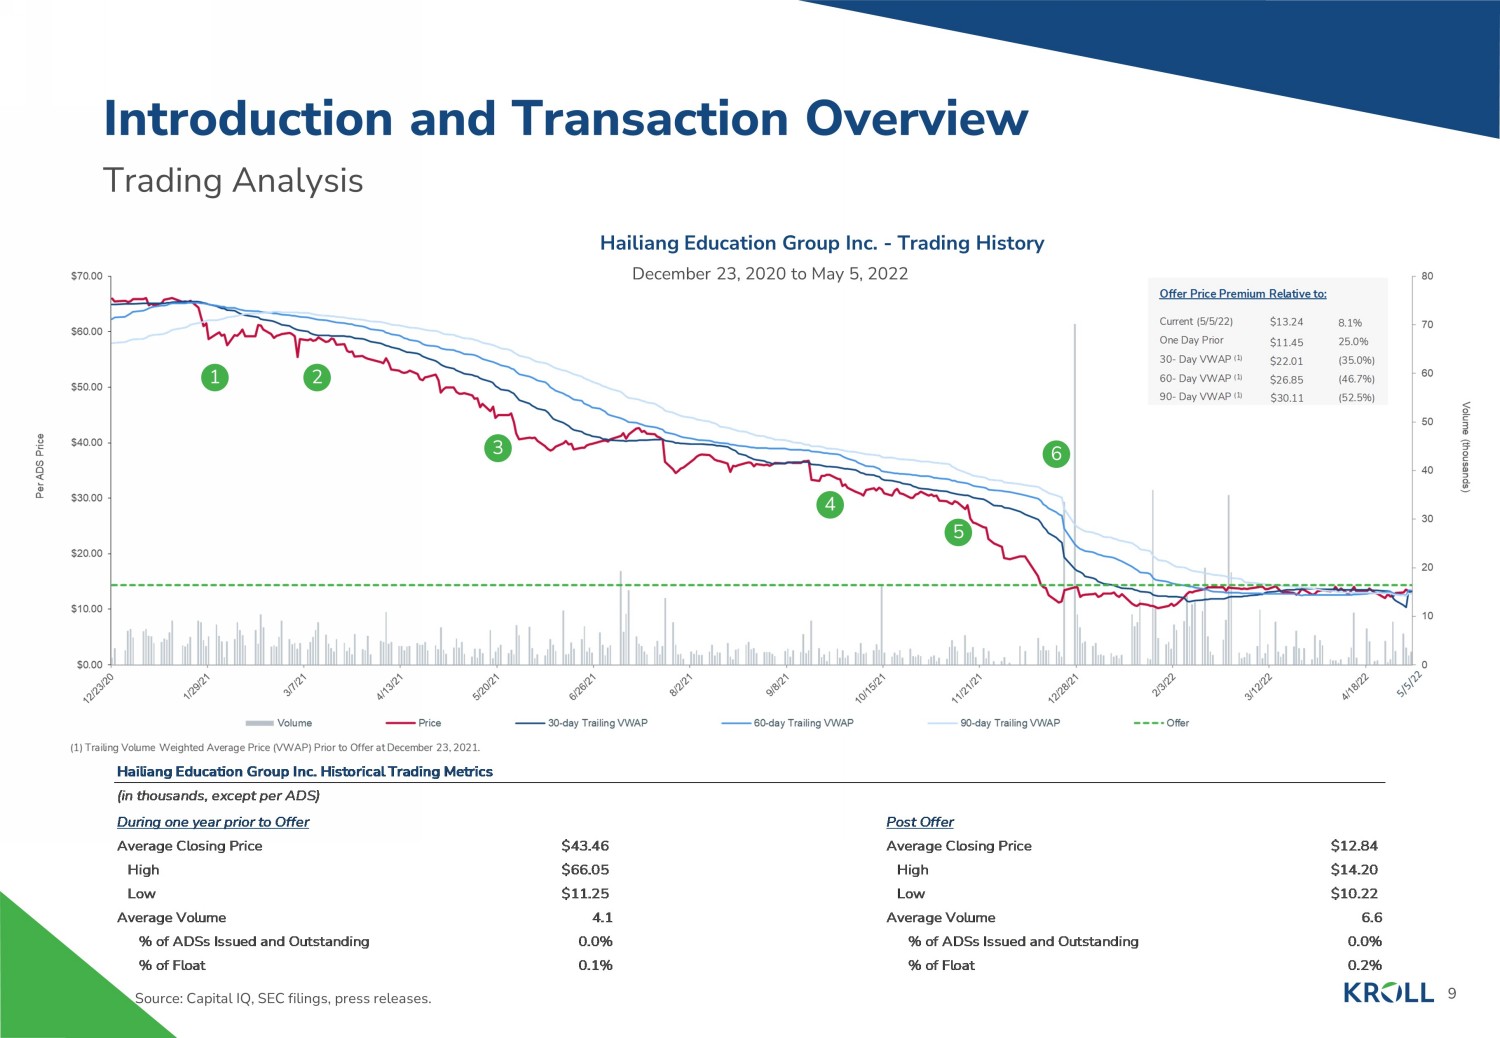
0 10 20 30 40 50 60 70 80 $0.00 $10.00 $20.00 $30.00 $40.00 $50.00 $60.00 $70.00 Volume (thousands) Per ADS Price Volume Price 30-day Trailing VWAP 60-day Trailing VWAP 90-day Trailing VWAP Offer (1) Trailing Volume Weighted Average Price (VWAP) Prior to Offer at December 23, 2021. Current (5/5/22) Offer Price Premium Relative to: 8.1% 30 - Day VWAP (1) (35.0%) (46.7%) (52.5%) 60 - Day VWAP (1) 90 - Day VWAP (1) One Day Prior 25.0% $13.24 $22.01 $26.85 $30.11 $11.45 9 Trading Analysis Introduction and Transaction Overview Source: Capital IQ, SEC filings, press releases. Hailiang Education Group Inc. - Trading History December 23, 2020 to May 5, 2022 1 2 3 4 5 6 Hailiang Education Group Inc. Historical Trading Metrics (in thousands, except per ADS) During one year prior to Offer Post Offer Average Closing Price $43.46 Average Closing Price $12.84 High $66.05 High $14.20 Low $11.25 Low $10.22 Average Volume 4.1 Average Volume 6.6 % of ADSs Issued and Outstanding 0.0% % of ADSs Issued and Outstanding 0.0% % of Float 0.1% % of Float 0.2%

10 Trading Analysis (Continued) – Notes for Press Release Introduction and Transaction Overview 1. On February 2 , 2021 , Hailiang Education Group Inc . announced that Ms . Weixin Xie (aka Deborah Lee) has been appointed as the Company's Chief Financial Officer, succeeding Mr . Jianguo Yu, effective March 1 , 2021 . 2. On March 9 , 2021 , Hailiang Education Group Inc . reported Q 2 ' 21 financial results . The Company reported total revenue of RMB 638 . 5 million and net income of RMB 245 . 6 million for the three months ended December 31 , 2020 . 3. On May 26 , 2021 , Hailiang Education Group Inc . reported Q 3 ' 21 financial results . The Company reported total revenue of RMB 434 . 8 million and net income of RMB 100 . 8 million for the three months ended March 31 , 2021 . 4. On September 23 , 2021 , Hailiang Education Group Inc . announced that on September 6 , 2021 , the Company entered into a cooperation agreement with Shandong Longkou Education and Sports Bureau, and on August 28 , 2021 , the Company entered into a management agreement with Yunnan Pu'er Jingdong Yi Autonomous County Education and Sports Bureau respectively . Pursuant to the Agreements, Hailiang Education agrees, beginning from September 2021 to provide education and management services to the two public schools, Chongshi Department of Longkou No . 1 Middle School and No . 1 Middle School of Jingdong Yi Autonomous County . 5. On November 12 , 2021 , Hailiang Education Group Inc . announced its financial results for the fiscal year ended June 30 , 2021 . The Company reported total revenue of RMB 1 , 375 . 8 million and net profit of RMB 482 . 1 million for the fiscal year 2021 . On May 14 , 2021 , the People's Republic of China's State Council announced the issuance of the 2021 Implementation Rules for Private Education Laws which became effective on September 1 , 2021 . According to IFRS 10 - Consolidated Financial Statements, the Company concluded that it lost control of the affiliated entities providing compulsory education services on September 1 , 2021 . The Company has determined that it has ceased all revenue - generating activities related to the compulsory education business as of June 30 , 2021 and classified the historical financial results of compulsory education business as discontinued operations in the Company's Consolidated Statements of Profit or Loss and Other Comprehensive Income for all periods presented . 6. On December 23 , 2021 , Hailiang Education Group Inc . received a preliminary non - binding proposal letter from Mr . Hailiang Feng, the founder of the Company, to acquire all of the outstanding ordinary shares (the “ Shares ”) of the Company, including Shares represented by the ADSs, each ADS representing sixteen ordinary shares), that are not already owned by Mr . Hailiang Feng and his affiliates for a purchase price of US $ 14 . 31 per ADS in cash . Source: Capital IQ, SEC filings, press releases.

11 Proposed Transaction Introduction and Transaction Overview Note: Balance sheet data and latest twelve months (“ LTM ”) as of December 31, 2021. Financial performance metrics presented are adjusted to exclude public company costs and discontinued business. (1) After deduction of cash needed for operations in fiscal year (“ FY ”) 2022 H2, with a 10% withholding tax discount on the onshore balance. (2) Includes payables for property, plant and equipment (“ PP&E ”). (3) Includes loans due to related parties. (4) Includes the book value of 49 % noncontrolling interest of Zhenjiang Jianghe High School of Art Co . , Ltd . , 45 % noncontrolling interest of Zhejiang Hailiang Kangming Logistic Management Company, and 10 % noncontrolling interest of Xiantao Hailiang Education Logistics Management Co . , Ltd . Hailiang Education Group Inc. - Offer Price Premium Relative To ADS Implied Price Premium ADS price as of 5/5/22 $13.24 8.1% One-day prior (12/22/21) $11.45 25.0% One-week prior (12/16/21) $13.81 3.6% 30-days trailing VWAP prior to December 23, 2021 $22.01 (35.0%) 60-days trailing VWAP prior to December 23, 2021 $26.85 (46.7%) 90-days trailing VWAP prior to December 23, 2021 $30.11 (52.5%) Offer Price $14.31 Source: Capital IQ and SEC filings Hailiang Education Group Inc. - Implied Multiples (USD in millions, except per ADS data) Offer $14.31 Fully Diluted ADSs Issued and Outstanding (millions) 25.8 1.00 Implied Equity Value $368.9 Less: Cash and Cash Equivalents (1) (1,732.45) (260.3) Plus: Other Payables for PP&E (2) 7.92 1.2 Plus: Loan Due to Related Parties (3) 6.28 0.9 Plus: Non-controlling Interests (4) 16.32 2.5 Implied Enterprise Value $113.2 Implied Offer Multiples: EV / LTM EBITDA $92 1.2x EV / 2022 EBITDA $88 1.3x EV / 2023 EBITDA $36 3.2x EV / 2024 EBITDA $25 4.6x EV / LTM Revenue $221 0.51x EV / 2022 Revenue $245 0.48x EV / 2023 Revenue $132 0.88x EV / 2024 Revenue $104 1.11x

12 Valuation Summary Introduction and Transaction Overview Note: Balance sheet data and LTM as of December 31, 2021. Financial performance metrics presented are adjusted to exclude pub lic company costs and discontinued business. (1) After deduction of cash needed for operations in FY2022 H2, with a 10% withholding tax discount on the onshore balance. (2) Includes payables for PP&E. (3) Includes loans due to related parties. (4) Includes the book value of 49 % noncontrolling interest of Zhenjiang Jianghe High School of Art Co . , Ltd . , 45 % noncontrolling interest of Zhejiang Hailiang Kangming Logistic Management Company, and 10 % noncontrolling interest of Xiantao Hailiang Education Logistics Management Co . , Ltd . Valuation Range Conclusions (RMB in thousands, except per ADS values or otherwise noted) Low High Enterprise Value Enterprise Value Range ¥500,000 - ¥590,000 Plus: Cash and Cash Equivalents (1) 1,732,452 - 1,732,452 Less: Other Payables for PP&E (2) (7,919) - (7,919) Less: Loan Due to Related Parties (3) (6,283) - (6,283) Less: Non-controlling Interests (4) (16,318) - (16,318) Equity Value Range ¥2,201,932 - ¥2,291,932 Fully Diluted ADSs Issued and Outstanding 25,778,141 - 25,778,141 Value Per ADS Range (RMB) ¥85.42 - ¥88.91 RMB to USD FX rate (as of 5/5/2022) 6.66 - 6.66 Offer Price Value Per ADS Range (USD) $12.83 - $13.36 $14.31 Implied Valuation Multiples EV / LTM EBITDA 0.8x - 1.0x 1.2x EV / 2022 EBITDA 0.9x - 1.0x 1.3x EV / 2023 EBITDA 2.1x - 2.5x 3.2x EV / 2024 EBITDA 3.1x - 3.6x 4.6x EV / LTM Revenue 0.34x - 0.40x 0.51x EV / 2022 Revenue 0.32x - 0.37x 0.48x EV / 2023 Revenue 0.58x - 0.69x 0.88x EV / 2024 Revenue 0.73x - 0.87x 1.11x

2. Valuation Analysis

14 Impact of Regulatory Changes Valuation Analysis 1) On May 14 , 2021 , the PRC State Council announced the issuance of the 2021 Implementation Rules for Private Education Laws (the “ 2021 Implementation Rules for Private Education Laws ”), which became effective on September 1 , 2021 . The 2021 Implementation Rules for Private Education Laws prohibit social organizations and individuals from controlling a private school that provides compulsory education by means of merger, acquisition, contractual arrangements, etc . , and a private school providing compulsory education is prohibited from conducting transactions with its related party . In view of the significant uncertainties and restrictions the 2021 Implementation Rules for Private Education Laws impose on the Company’s ability to direct the range of ongoing activities, the Company has classified the historical financial results of compulsory education business as discontinued operations . 2) On August 23 , 2021 , the Zhejiang Provincial Department of Education issued the Implementation Opinions of the Zhejiang Provincial Department of Education and Other Nine Departments on Further Improving the After - school Services for Schools in the Compulsory Education Stage (the “ Department of Education Opinion ”) . The Department of Education Opinion stipulates that private boarding schools may charge after - school service fees for summer day - care schools, while no charge is allowed for other after - school services . The Department of Education Opinion stipulates that tutoring in the name of after - school curriculum is strictly prohibited, and it is strictly forbidden for schools to charge illegal fees . 3) On J anuary 30 , 2022 , the Beijing Municipal People's Government issued 2022 Municipal Government Work Report Key Task List (the “ January Notice ”) . The January Notice stipulates that to improve the education quality, the number of compulsory education students in private schools should account for less than 5 % of the total students, and the number of compulsory education students in private schools in each district should account for less than 15 % of the total student in that district . 4) On March 14 , 2022 , the Zhejiang Provincial Department of Education issued the Notice of 2022 General High School Admission Management Work (the “ March Notice ”) . The March Notice stipulates in that in principle, public and private high schools implement a “territorial enrollment” policy . The enrollment of private high school students is under the management of the local education administrative department . Public high schools located in counties shall enroll students in the county ; public high schools located in urban areas shall enroll students in urban areas . The specific enrollment scope can be determined by the Department of Education . No cross - regional enrolment is allowed for public high schools . The March Notice stipulates that for private high schools with sufficient local students, cross regional enrollment should not be allowed in principle . It is encouraged to build/rebuild local high schools, expand high school education resources, and expand space for high - quality high schools . S ource: (1) The Company’s Form 20 - F filed with the SEC for the year ended June 30, 2021. (2) http://www.zj.gov.cn/art/2021/8/26/art_1229400468_59127697.html (3) http://www.beijing.gov.cn/zhengce/zhengcefagui/202201/t20220130_2604669.html (4) http://www.zj.gov.cn/art/2022/3/14/art_1229400468_59681577.html

15 Historical and Projected Financial Performance Valuation Analysis Note: Financial performance metrics presented are adjusted to exclude public company costs and discontinued business. Source: Company filings, the management of the Company. Historical and Projected Financial Performance (RMB in thousands) LTM Management Projections 2019A 2020A 2021A 12/31/2021 2022P 2023P 2024P 2025P 2026P 2027P 2028P 2029P K-12 student management services and high school curriculum education services ¥754,493 ¥861,923 ¥1,111,585 ¥1,158,897 ¥1,319,163 ¥687,732 ¥504,421 ¥274,880 ¥292,357 ¥315,308 ¥346,210 ¥355,813 Growth NA 14.2% 29.0% 13.4% 18.7% (47.9%) (26.7%) (45.5%) 6.4% 7.9% 9.8% 2.8% Ancillary educational services ¥230,510 ¥121,611 ¥204,221 ¥258,415 ¥195,122 ¥106,823 ¥98,897 ¥89,401 ¥91,597 ¥94,010 ¥96,736 ¥98,660 Growth NA (47.2%) 67.9% 128.6% (4.5%) (45.3%) (7.4%) (9.6%) 2.5% 2.6% 2.9% 2.0% Operation and management services ¥37,792 ¥43,839 ¥59,984 ¥56,916 ¥62,743 ¥62,082 ¥77,177 ¥84,441 ¥99,535 ¥114,630 ¥129,724 ¥144,818 Growth NA 16.0% 36.8% (3.7%) 4.6% (1.1%) 24.3% 9.4% 17.9% 15.2% 13.2% 11.6% Net Revenue ¥1,022,795 ¥1,027,373 ¥1,375,790 ¥1,474,228 ¥1,577,027 ¥856,637 ¥680,494 ¥448,722 ¥483,490 ¥523,947 ¥572,670 ¥599,291 Growth NA 0.4% 33.9% 23.4% 14.6% (45.7%) (20.6%) (34.1%) 7.7% 8.4% 9.3% 4.6% Adjusted EBITDA ¥428,807 ¥507,917 ¥669,323 ¥615,397 ¥568,546 ¥236,259 ¥163,754 ¥84,342 ¥98,516 ¥107,232 ¥118,143 ¥122,742 Margin % 41.9% 49.4% 48.7% 41.7% 36.1% 27.6% 24.1% 18.8% 20.4% 20.5% 20.6% 20.5% Growth NA 18.4% 31.8% (2.5%) (15.1%) (58.4%) (30.7%) (48.5%) 16.8% 8.8% 10.2% 3.9% Purchase of Fixed Assets ¥43,284 ¥40,522 ¥40,638 ¥52,933 ¥63,081 ¥34,265 ¥27,220 ¥17,949 ¥19,340 ¥20,958 ¥22,907 ¥23,972 % of Net Revenue 4.2% 3.9% 3.0% 3.6% 4.0% 4.0% 4.0% 4.0% 4.0% 4.0% 4.0% 4.0% % of EBITDA 10.1% 8.0% 6.1% 8.6% 11.1% 14.5% 16.6% 21.3% 19.6% 19.5% 19.4% 19.5% Purchase of Intangible Assets ¥22,273 ¥974 ¥1,386 ¥664 ¥6,756 ¥11,483 ¥11,562 ¥6,564 ¥7,697 ¥8,860 ¥10,063 ¥11,156 % of Net Revenue 2.2% 0.1% 0.1% 0.0% 0.4% 1.3% 1.7% 1.5% 1.6% 1.7% 1.8% 1.9% % of EBITDA 5.2% 0.2% 0.2% 0.1% 1.2% 4.9% 7.1% 7.8% 7.8% 8.3% 8.5% 9.1% Net Working Capital ¥147 ¥150,685 (¥106,194) (¥751,832) (¥153,787) (¥97,873) (¥78,685) (¥53,616) (¥57,885) (¥62,771) (¥68,689) (¥71,964) % of Net Revenue 0.0% 14.7% (7.7%) (51.0%) (9.8%) (11.4%) (11.6%) (11.9%) (12.0%) (12.0%) (12.0%) (12.0%)

16 Discounted Cash Flow Analysis – Methodology and Key Assumptions Valuation Analysis Discounted Cash Flow Methodology • Duff & Phelps performed a discounted cash flow analysis of the projected unlevered free cash flows . • Unlevered free cash flow is defined as cash generated by the business that is available to either reinvest or to distribute to security holders . • Projected free cash flows are discounted to the present using a discount rate which reflects their relative risk . • The discount rate is equivalent to the rate of return that security holders could expect to realize on alternative investment opportunities with similar risk profiles . Discounted Cash Flow Key Assumptions • Duff & Phelps utilized and relied upon the Management Projections for the fiscal years ending June 30 , 2022 through 2029 (excluding public company costs and discontinued business, as provided by the management of the Company), discussions with the management of the Company, and a review of the Company’s historical performance and other factors to develop the discounted cash flow (“ DCF ”) analysis . • Beyond the projection period, Duff & Phelps estimated the “terminal value” using a perpetuity formula . • Duff & Phelps discounted the resulting free cash flows and terminal value using a weighted average cost of capital range of 12 . 5 % to 14 . 5 % , derived from the Capital Asset Pricing Model . • The following is a summary of the Management Projections utilized in the discounted cash flow analysis : – Net revenue decreases at a compound annual growth rate (“ CAGR ”) of - 12 . 9 % from FY 2022 to FY 2029 . – Adjusted EBITDA decreases at a CAGR of - 19 . 7 % from FY 2022 to FY 2029 . – Adjusted EBITDA margin averages 23 . 6 % from FY 2022 to FY 2029 , declining from 41 . 7 % in the LTM period to 18 . 8 % in FY 2025 and recovering slightly to 20 . 5 % by FY 2029 . – Total purchases of fixed assets and intangible assets average 5 . 5 % of net revenue from FY 2022 to FY 2029 . – Net working capital averages - 11 . 6 % of net revenue from FY 2022 to FY 2029 .
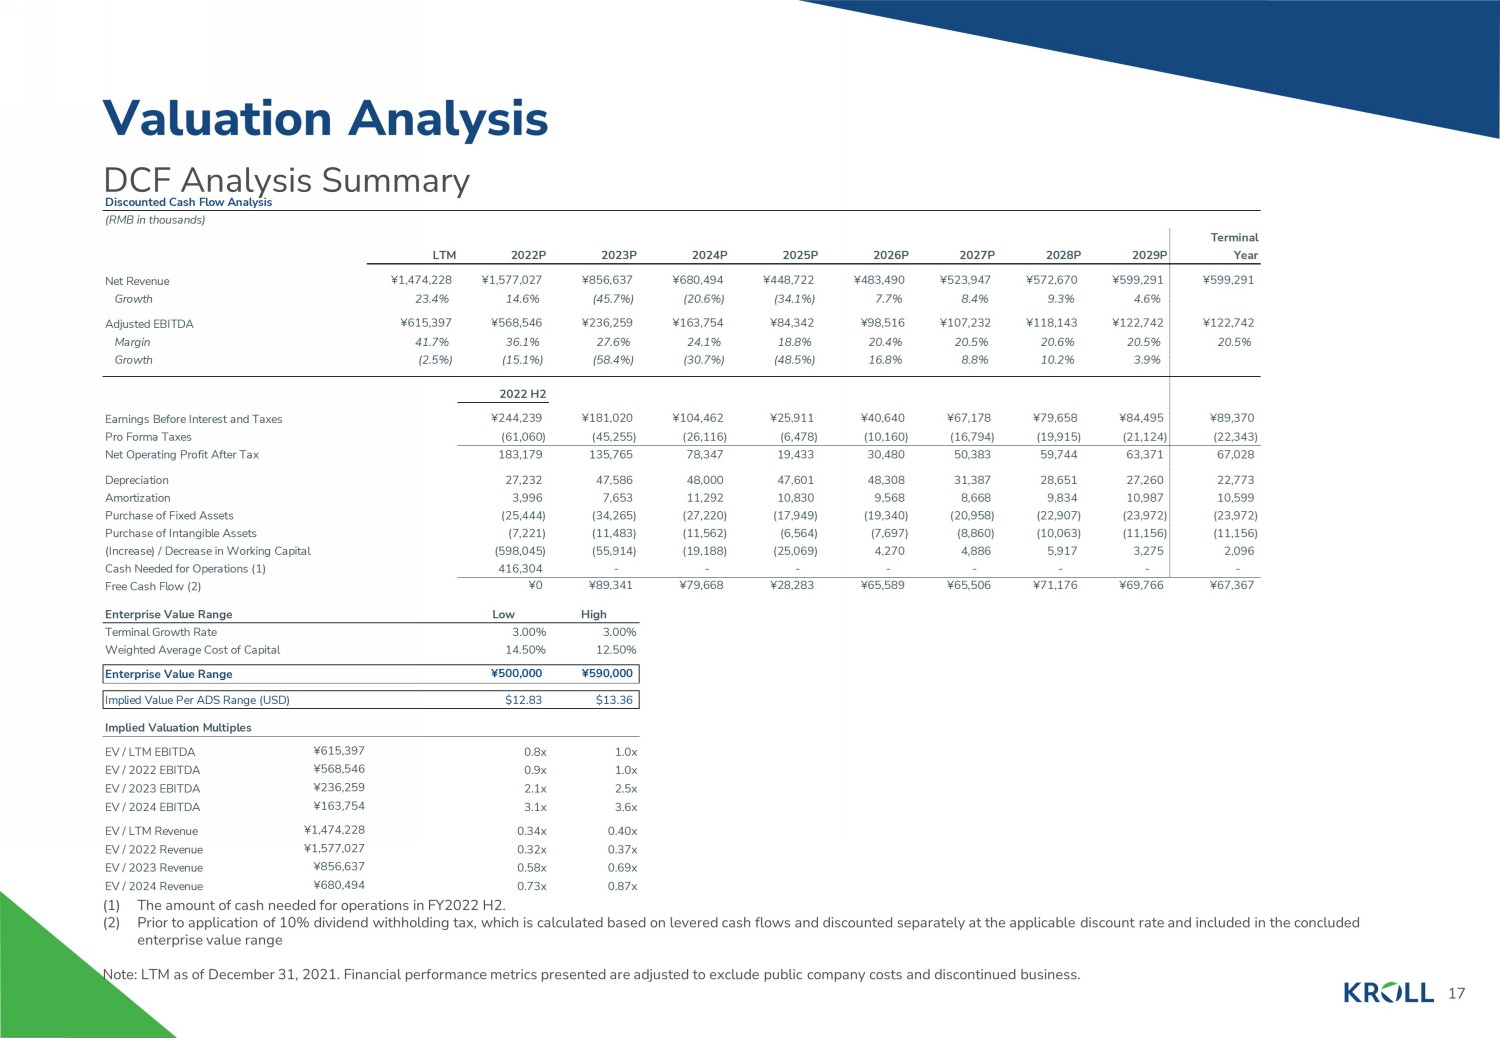
17 DCF Analysis Summary Valuation Analysis (1) The amount of cash needed for operations in FY2022 H2. (2) Prior to application of 10% dividend withholding tax, which is calculated based on levered cash flows and discounted separate ly at the applicable discount rate and included in the concluded enterprise value range Note: LTM as of December 31, 2021. Financial performance metrics presented are adjusted to exclude public company costs and d isc ontinued business. Discounted Cash Flow Analysis (RMB in thousands) Terminal LTM 2022P 2023P 2024P 2025P 2026P 2027P 2028P 2029P Year Net Revenue ¥1,474,228 ¥1,577,027 ¥856,637 ¥680,494 ¥448,722 ¥483,490 ¥523,947 ¥572,670 ¥599,291 ¥599,291 Growth 23.4% 14.6% (45.7%) (20.6%) (34.1%) 7.7% 8.4% 9.3% 4.6% Adjusted EBITDA ¥615,397 ¥568,546 ¥236,259 ¥163,754 ¥84,342 ¥98,516 ¥107,232 ¥118,143 ¥122,742 ¥122,742 Margin 41.7% 36.1% 27.6% 24.1% 18.8% 20.4% 20.5% 20.6% 20.5% 20.5% Growth (2.5%) (15.1%) (58.4%) (30.7%) (48.5%) 16.8% 8.8% 10.2% 3.9% 2022 H2 Earnings Before Interest and Taxes ¥244,239 ¥181,020 ¥104,462 ¥25,911 ¥40,640 ¥67,178 ¥79,658 ¥84,495 ¥89,370 Pro Forma Taxes (61,060) (45,255) (26,116) (6,478) (10,160) (16,794) (19,915) (21,124) (22,343) Net Operating Profit After Tax 183,179 135,765 78,347 19,433 30,480 50,383 59,744 63,371 67,028 Depreciation 27,232 47,586 48,000 47,601 48,308 31,387 28,651 27,260 22,773 Amortization 3,996 7,653 11,292 10,830 9,568 8,668 9,834 10,987 10,599 Purchase of Fixed Assets (25,444) (34,265) (27,220) (17,949) (19,340) (20,958) (22,907) (23,972) (23,972) Purchase of Intangible Assets (7,221) (11,483) (11,562) (6,564) (7,697) (8,860) (10,063) (11,156) (11,156) (Increase) / Decrease in Working Capital (598,045) (55,914) (19,188) (25,069) 4,270 4,886 5,917 3,275 2,096 Cash Needed for Operations (1) 416,304 - - - - - - - - Free Cash Flow (2) ¥0 ¥89,341 ¥79,668 ¥28,283 ¥65,589 ¥65,506 ¥71,176 ¥69,766 ¥67,367 Enterprise Value Range Low High Terminal Growth Rate 3.00% 3.00% Weighted Average Cost of Capital 14.50% 12.50% Enterprise Value Range ¥500,000 ¥590,000 Implied Value Per ADS Range (USD) $12.83 $13.36 Implied Valuation Multiples EV / LTM EBITDA ¥615,397 0.8x 1.0x EV / 2022 EBITDA ¥568,546 0.9x 1.0x EV / 2023 EBITDA ¥236,259 2.1x 2.5x EV / 2024 EBITDA ¥163,754 3.1x 3.6x EV / LTM Revenue ¥1,474,228 0.34x 0.40x EV / 2022 Revenue ¥1,577,027 0.32x 0.37x EV / 2023 Revenue ¥856,637 0.58x 0.69x EV / 2024 Revenue ¥680,494 0.73x 0.87x

18 Selected Public Companies / M&A Transactions Analysis Methodology Valuation Analysis Selected Public Companies Analysis • Duff & Phelps selected seven publicly traded companies that were deemed relevant to its analysis . • Duff & Phelps analyzed the financial performance of each of the publicly traded companies . Duff & Phelps then analyzed the selected public companies’ trading multiples, including enterprise value to revenue and EBITDA . Selected M&A Transactions Analysis • Duff & Phelps also reviewed certain merger and acquisition transactions involving target companies that were deemed relevant to its analysis and computed the implied valuation multiples for such transactions . Due to the limited comparability of the financial metrics of the selected public companies and the targets in the selected M&A transactions relative to those of the Company, rather than applying a range of selected multiples from a review of the public companies and M&A transactions, Duff & Phelps reviewed various valuation multiples for the Company implied by the valuation range determined from the DCF analysis in the context of the Company’s relative size, forecasted growth in revenue and profits, profit margins, capital spending, revenue mix, and other characteristics that we deemed relevant . None of the companies utilized for comparative purposes in the following analysis are directly comparable to the Company, and none of the transactions utilized for comparative purposes in the following analysis are directly comparable to the Proposed Transaction . Duff & Phelps does not have access to non - public information of any of the companies used for comparative purposes . Accordingly, a complete valuation analysis of the Company and the Proposed Transaction cannot rely solely upon a quantitative review of the selected companies and selected transactions, and involves complex considerations and judgments concerning differences in financial and operating characteristics of such companies and targets, as well as other factors that could affect their value relative to that of the Company . Therefore, the Selected Public Companies / Selected M&A Transactions Analysis is subject to certain limitations .

19 Selected Public Companies Analysis – Financial Metrics Valuation Analysis LTM = Latest Twelve Months CAGR = Compounded Annual Growth Rate EBITDA = Earnings Before Interest, Taxes, Depreciation and Amortization Note: The Company’s EBITDA is adjusted to exclude public company costs and discontinued business as provided by the managemen t o f Company. Source: Capital IQ, Bloomberg, SEC Filings, Annual and Interim Reports. Selected Public Companies Analysis As of May 5, 2022 For Rank Charts (% of Revenue) COMPANY INFORMATION REVENUE GROWTH EBITDA GROWTH EBITDA MARGIN Company Name 2-YR CAGR LTM 2022 2023 2024 2-YR CAGR LTM 2022 2023 2024 2-YR AVG LTM 2022 2023 2024 China Education Group Holdings Limited 37.2% 37.5% 27.9% 13.4% 11.3% 41.8% 40.6% 36.7% 15.1% 9.0% 50.5% 51.1% 54.6% 55.4% 54.3% Hope Education Group Co., Ltd. 32.1 77.7 28.8 15.1 15.3 24.0 79.4 31.9 16.6 12.5 41.6 41.8 42.8 43.3 42.3 China YuHua Education Corporation Limited NA -41.6 8.8 12.5 12.2 NA -22.5 11.6 12.4 11.4 62.2 65.5 67.1 67.1 66.6 China Kepei Education Group Limited 18.7 3.3 54.6 24.5 15.7 12.4 -12.3 93.2 15.6 14.0 61.2 56.0 70.0 65.0 64.0 China Maple Leaf Educational Systems Limited NA 143.9 NA NA NA NA NM NA NA NA 22.3 31.9 NA NA NA Wisdom Education International Holdings Company Limited NA 22.4 NA NA NA NA 12.4 NA NA NA 117.7 112.7 NA NA NA Bright Scholar Education Holdings Limited 45.0 -5.1 NA NA NA NA NA NA NA NA -0.9 -5.9 NA NA NA Mean 33.3% 34.0% 30.0% 16.4% 13.6% 26.1% 19.5% 43.3% 14.9% 11.7% 50.7% 50.4% 58.6% 57.7% 56.8% Median 34.7% 22.4% 28.3% 14.2% 13.7% 24.0% 12.4% 34.3% 15.3% 12.0% 50.5% 51.1% 60.9% 60.2% 59.1% Hailiang Education Group Inc. 16.0% 23.4% 14.6% -45.7% -20.6% 24.9% -2.5% -15.1% -58.4% -30.7% 46.7% 41.7% 36.1% 27.6% 24.1%

20 Selected Public Companies Analysis – Valuation Multiples Valuation Analysis LTM = Latest Twelve Months EBITDA = Earnings Before Interest, Taxes, Depreciation and Amortization Enterprise Value = [Market Capitalization + Management Equity + Debt + Finance Leases + Operating Leases (for IFRS/non - US GAAP c ompanies only) + Preferred Stock + Non - Controlling Interest] - [Cash & Equivalents + Long - Term Investments + Net Non - Operating Assets] Source: Capital IQ, Bloomberg, SEC Filings, Annual and Interim Reports. Selected Public Companies Analysis As of May 5, 2022 (US$ in millions, except per share data) COMPANY INFORMATION MARKET DATA ENTERPRISE VALUE AS MULTIPLE OF Company Name Common Stock Price (Primary) on 5/5/2022 % of 52- Week High Market Capitalization Enterprise Value LTM EBITDA 2022 EBITDA 2023 EBITDA 2024 EBITDA LTM Revenue 2022 Revenue 2023 Revenue 2024 Revenue China Education Group Holdings Limited $0.84 31.7% $1,908 $2,539 8.7x 6.4x 5.6x 5.1x 4.59x 3.59x 3.16x 2.84x Hope Education Group Co., Ltd. 0.06 18.0 506 400 2.6 1.9 1.7 1.5 1.14 0.89 0.77 0.67 China YuHua Education Corporation Limited 0.15 13.8 504 659 2.9 2.6 2.3 2.0 1.94 1.78 1.59 1.41 China Kepei Education Group Limited 0.27 33.4 539 603 7.0 3.6 3.1 2.8 3.99 2.58 2.07 1.79 China Maple Leaf Educational Systems Limited 0.05 16.8 135 528 11.3 NA NA NA 3.73 NA NA NA Wisdom Education International Holdings Company Limited 0.04 7.8 87 27 0.6 NA NA NA 0.83 NA NA NA Bright Scholar Education Holdings Limited 0.70 12.0 83 371 NM NA NA NA 1.76 NA NA NA Mean 19.1% $538 $733 5.5x 3.6x 3.2x 2.8x 2.57x 2.21x 1.90x 1.68x Median 16.8% $504 $528 4.9x 3.1x 2.7x 2.4x 1.94x 2.18x 1.83x 1.60x
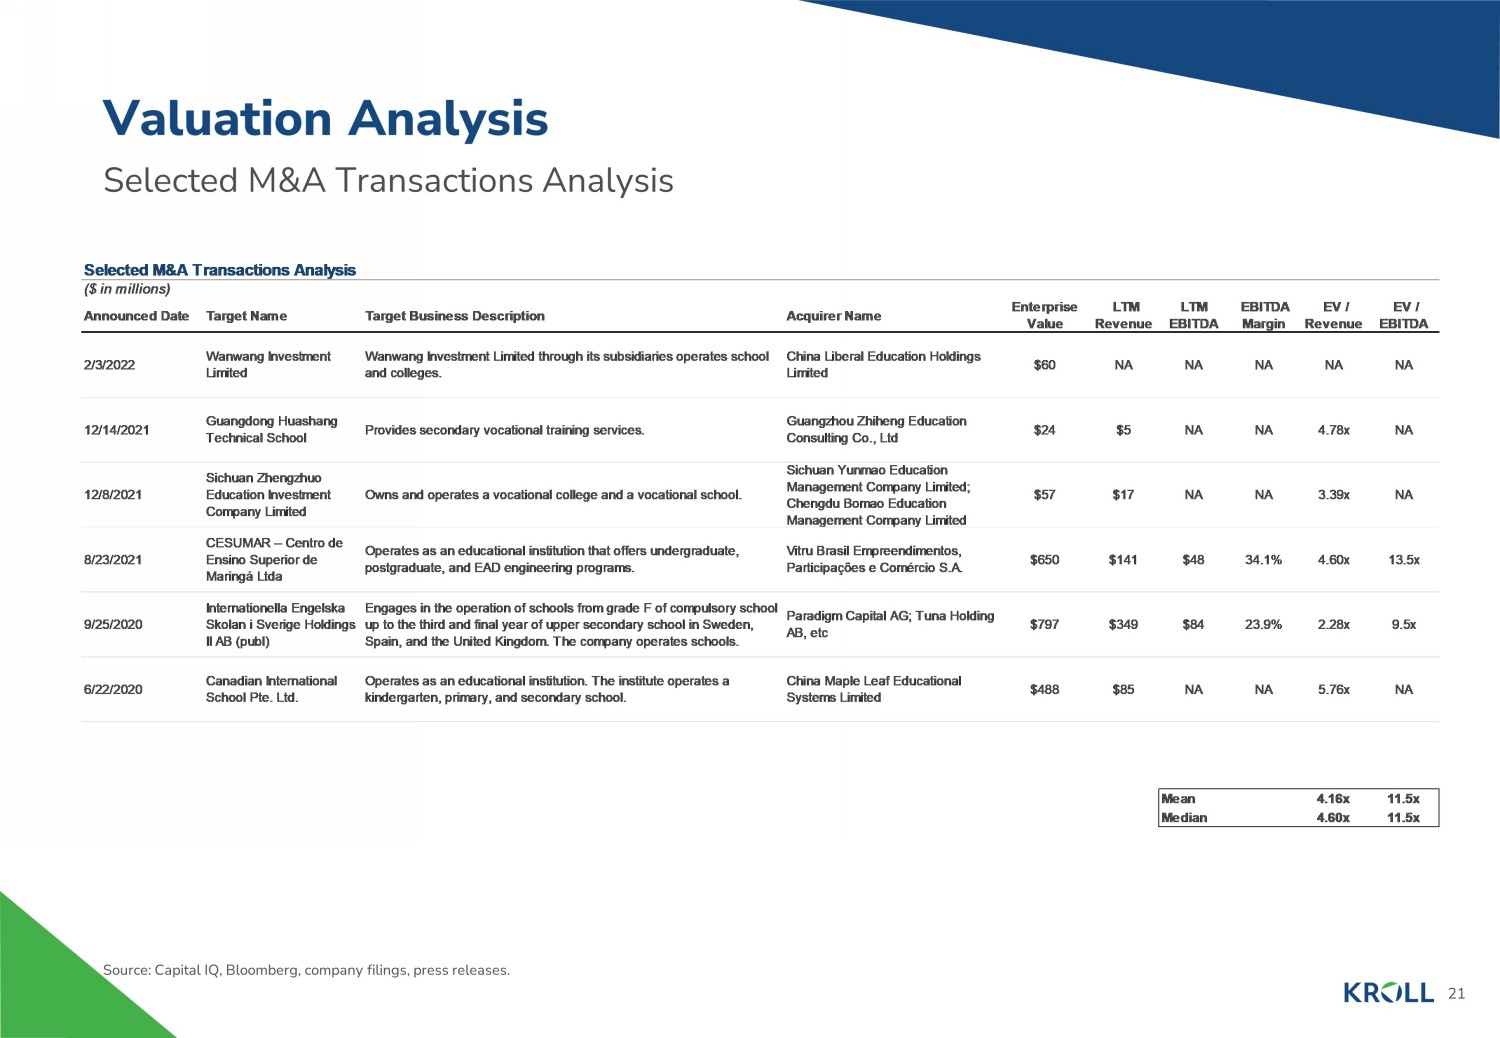
21 Selected M&A Transactions Analysis Valuation Analysis Source: Capital IQ, Bloomberg, company filings, press releases. Selected M&A Transactions Analysis ($ in millions) Announced Date Target Name Target Business Description Acquirer Name Enterprise Value LTM Revenue LTM EBITDA EBITDA Margin EV / Revenue EV / EBITDA 2/3/2022 Wanwang Investment Limited Wanwang Investment Limited through its subsidiaries operates school and colleges. China Liberal Education Holdings Limited $60 NA NA NA NA NA 12/14/2021 Guangdong Huashang Technical School Provides secondary vocational training services. Guangzhou Zhiheng Education Consulting Co., Ltd $24 $5 NA NA 4.78x NA 12/8/2021 Sichuan Zhengzhuo Education Investment Company Limited Owns and operates a vocational college and a vocational school. Sichuan Yunmao Education Management Company Limited; Chengdu Bomao Education Management Company Limited $57 $17 NA NA 3.39x NA 8/23/2021 CESUMAR – Centro de Ensino Superior de Maringá Ltda Operates as an educational institution that offers undergraduate, postgraduate, and EAD engineering programs. Vitru Brasil Empreendimentos, Participações e Comércio S.A. $650 $141 $48 34.1% 4.60x 13.5x 9/25/2020 Internationella Engelska Skolan i Sverige Holdings II AB (publ) Engages in the operation of schools from grade F of compulsory school up to the third and final year of upper secondary school in Sweden, Spain, and the United Kingdom. The company operates schools. Paradigm Capital AG; Tuna Holding AB, etc $797 $349 $84 23.9% 2.28x 9.5x 6/22/2020 Canadian International School Pte. Ltd. Operates as an educational institution. The institute operates a kindergarten, primary, and secondary school. China Maple Leaf Educational Systems Limited $488 $85 NA NA 5.76x NA Mean 4.16x 11.5x Median 4.60x 11.5x
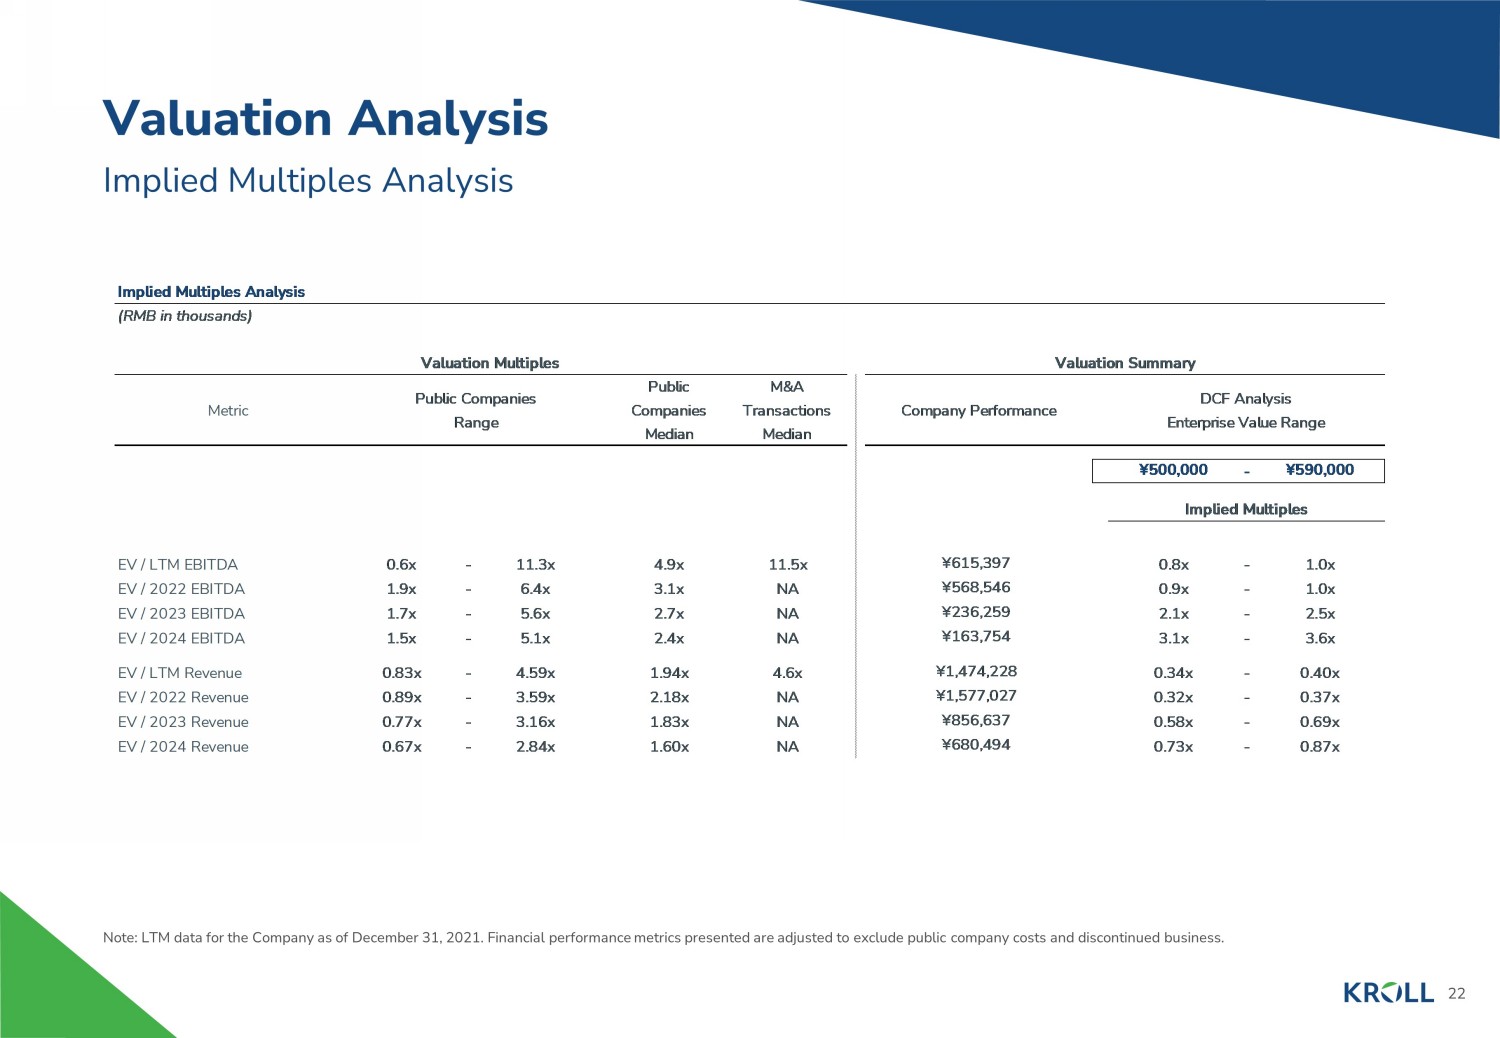
22 Implied Multiples Analysis Valuation Analysis Note: LTM data for the Company as of December 31, 2021. Financial performance metrics presented are adjusted to exclude publi c c ompany costs and discontinued business. Implied Multiples Analysis (RMB in thousands) Valuation Multiples Valuation Summary Metric Public Companies Range Public Companies Median M&A Transactions Median Company Performance DCF Analysis Enterprise Value Range ¥500,000 - ¥590,000 Implied Multiples EV / LTM EBITDA 0.6x - 11.3x 4.9x 11.5x ¥615,397 0.8x - 1.0x EV / 2022 EBITDA 1.9x - 6.4x 3.1x NA ¥568,546 0.9x - 1.0x EV / 2023 EBITDA 1.7x - 5.6x 2.7x NA ¥236,259 2.1x - 2.5x EV / 2024 EBITDA 1.5x - 5.1x 2.4x NA ¥163,754 3.1x - 3.6x EV / LTM Revenue 0.83x - 4.59x 1.94x 4.6x ¥1,474,228 0.34x - 0.40x EV / 2022 Revenue 0.89x - 3.59x 2.18x NA ¥1,577,027 0.32x - 0.37x EV / 2023 Revenue 0.77x - 3.16x 1.83x NA ¥856,637 0.58x - 0.69x EV / 2024 Revenue 0.67x - 2.84x 1.60x NA ¥680,494 0.73x - 0.87x

About Kroll Kroll provides proprietary data, technology and insights to help our clients stay ahead of complex demands related to risk, g ove rnance and growth. Our solutions deliver a powerful competitive advantage, enabling faster, smarter and more sustainable decisions. With 5,000 experts around the world, we create value and imp act for our clients and communities. To learn more, visit www.kroll.com . M&A advisory, capital raising and secondary market advisory services in the United States are provided by Kroll Securities, L LC (member FINRA/SIPC). M&A advisory, capital raising and secondary market advisory services in the United Kingdom are provided by Kroll Securities Ltd., which is authorized and regulated by the Finan cia l Conduct Authority (FCA). Valuation Advisory Services in India are provided by Duff & Phelps India Private Limited under a category 1 merchant banker license issued by the Securities and Exchange Board of India. © 2022 Kroll, LLC. All rights reserved.