 |  |
| |
Forecast of Production
and Reserves |
|
| |
| in and related to |
| |
| Shuck Field, Etzold Unit |
| |
located in
Seward County, Kansas |
|
| |
| for |
| |
| Glori Holdings Inc. |
| |
| January 1, 2013 |
| |
| Collarini Associates |
 | Collarini Associates |
| 3100 Wilcrest Drive, Suite 140 |
| Houston, Texas 77042 |
| Tel. (832) 251-0160 |
| www.collarini.com |
April 25, 2013
Mr. Victor Perez
Glori Holdings Inc.
4315 South Drive
Houston, Texas 77053
Dear Mr. Perez:
In accordance with your request, Collarini Associates (Collarini) has estimated the proved reserves and future revenue, as of January 1, 2013, to the interest of Glori Holdings Inc. (Glori) in and related to the Shuck Field, Etzold Unit, located in Seward County, Kansas. This report is based on SEC guideline pricing and unescalated costs as set forth herein. The estimate of proved reserves and the future revenue therefrom conform to all standards and definitions promulgated in Section 210.4-10 of Regulation S - X issued by the Securities and Exchange Commission in November 1988 and amended in December 2008. Estimates of probable and possible reserves and the future revenue therefrom are optional by Regulation S - X, and are not included herein at your request. It is estimated these volumes represent 100% of Glori’s total proved reserves.
As presented in the accompanying detailed projections by reservoir and by reserve category, we estimate the net reserves and future net income to Glori's interest, as of January 1, 2013, to be:
| | | Net Remaining Reserves | | | Future Net Income (M$) | |
| Reserve | | Oil | | | Gas | | | | | | Present | |
| Category | | (MBO) | | | (MMCF) | | | Undiscounted | | | Worth at 10% | |
| | | | | | | | | | | | | |
| Proved | | | | | | | | | | | | | | | | |
| Producing | | | 28 | | | | 0 | | | | 462 | | | | 394 | |
| Behind Pipe | | | 75 | | | | 0 | | | | 2,700 | | | | 1,479 | |
| Total Proved | | | 103 | | | | 0 | | | | 3,162 | | | | 1,873 | |
Oil volumes are generally expressed in thousands of stock tank barrels (MBO), where one barrel is equivalent to 42 United States gallons.
The reserves and future income shown in this report are related to reservoirs which were identified by Glori Holdings Inc. The estimates do not include any value which might be attributable to additional reservoirs or untested acreage in which Glori Holdings Inc. may also hold an interest.
Net sales, as defined in this report, are before deducting production taxes. Net income is after deducting these taxes, and after deducting future capital costs and operating expenses, but before consideration of federal income taxes. The future net income has also been shown discounted at ten percent to determine its present worth. This present worth is included to indicate a time value of money. This should not be construed as representing the market value of the property. Our estimates of future cash flows do not include abandonment costs, but do include estimates of all costs required to recover reserves including drilling and recompletions.
Glori Holdings Inc.
April 25, 2013
Page Two
Reserves in this report were estimated using all applicable engineering and geological data available such as, but not limited to, historic production volumes, initial flow test information, flowing tubing pressures, shut-in tubing pressures, bottom hole pressures, repeat formation test data, pressure-volume-temperature fluid analysis, geological well logs, sidewall core analysis, and whole core analysis at the time the report was conducted.
The reserve volumes and their respective classifications and categorizations were estimated by performance methods, volumetric methods, analogy, or combination of methods. Performance methods generally included decline curve analysis and material balance analysis where representative data was available. Volumetric estimated generally included a combination of geological and engineering interpretations, while analogy methods included reserve estimates from historical performance of similar wells and reservoirs in the field or nearby fields.
Proved reserve classifications were determined based on the “reasonable certainty” of recovering the estimated volumes or more. The proved reserve categorizations were based on the stage of maturity and development of the respective proved reserves.
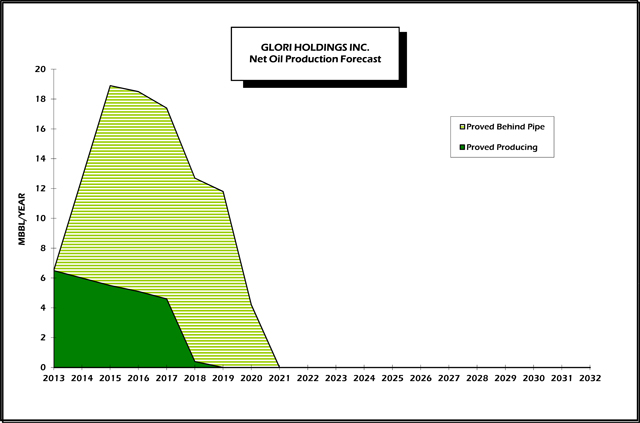
Based on gross oil equivalent barrels, approximately 100 percent of Glori’s proved reserves are located in the Shuck Field, Seward County, Kansas, USA. Glori’s reserves are 100 percent developed.
Glori’s proved reserves are 27% proved producing, and 73% non-producing. All of the proved producing reserves were estimated by volumetric methods, supported by performance methods. The proved non-producing reserves were estimated by a combination of performance and volumetric methods. These estimates are based on gross oil equivalent barrels that Glori holds an interest in.
For the proved producing reserves, each well’s current production was compared to historical production and a decline curve was established in addition to support from the volumetric analysis. For the non-producing reserves, a volumetric estimate was determined and compared with existing production trends to establish reserves for each well.
Hydrocarbon prices used in this report are based on SEC price parameters using the average prices received on the first of each month during the 12-month period prior to the ending date of the period covered in this report, determined as an unweighed arithmetic average of the first-day-of-the-month price for each month within such period. The product prices used to determine future gross revenue for each field were determined by applying benchmark pricing as described above then adjusted by “differentials” only to the extent provided by SEC guidelines. These “differentials” generally adjust the benchmark prices on a field by field basis to account for product quality, transportation, and marketing. The “differentials” were calculated by Glori. Collarini accepted the “differentials” as factual data and did not confirm the accuracy of these adjustments.
Pricing used in this report represent an SEC guideline price of $94.71 for WTI at Cushing, Oklahoma. These prices were then adjusted for light oil gravity and transportation differentials of minus $6.21.
Glori Holdings Inc.
April 25, 2013
Page Three
Operating costs were provided by Glori Holdings Inc. Collarini could not audit or confirm the accuracy of these expenses. These current expenses are held constant through the life of the property. These costs include processing fees where applicable.
Collarini Associates utilized all data, appropriate methods and procedures deemed necessary to conduct and finalize this report to conform to all standards and definitions promulgated in Section 210.4-10 of Regulation S – X issued by the Securities and Exchange Commission in November 1988 and amended in December 2008.
The reserves presented in this report are estimates only and should not be construed as being exact quantities. They may or may not be recovered, and if recovered, the revenues, costs, and expenses therefrom may be more or less than the estimated amounts. Because of governmental policies, uncertainties of supply and demand, and international politics, the actual sales rates and the prices actually received for the reserves, as well as the costs of recovery, may vary from those assumptions included in this report. Also, estimates of reserves may increase or decrease as a result of future operational decisions, mechanical problems, and the price of oil and gas.
All reserve estimates have been performed in accordance with sound engineering principles and generally accepted industry practice. As in all aspects of oil and gas evaluation, there are uncertainties inherent in the interpretation of engineering data, and all conclusions represent only informed professional judgments.
A visual inspection of the properties themselves was not considered necessary for the purpose of this report. No assessment of compliance with environmental regulations or future liability for site remediation was made. We are independent consultants; we do not own any interest in this property and are not employed contingent upon the value of this property. All engineering calculations and basic data used in the analysis are maintained on file in our office and are available for review.
Mr. Mitchell C. Reece was the technical person primarily responsible for overseeing the reserves audit. Mr. Reece attended Texas A&M University, and graduated in 1979 with a Bachelor of Science Degree in Petroleum Engineering. He is a Registered Professional Engineer in the State of Texas, United States of America, and has in excess of 30 years experience in petroleum engineering studies and evaluations.
Very truly yours,
COLLARINI ASSOCIATES
/s/Mitch Reece
Mitch Reece, P.E.
President
MCR/tlp
Collarini Engineering Inc.
Texas Board of Professional Engineers Registration F-5660
RESERVE DEFINITIONS
SEC PARAMETERS1
RESERVES
Reserves are estimated remaining quantities of oil and gas and related substances anticipated to be economically producible, as of a given date, by application of development projects to known accumulations. In addition, there must exist, or there must be a reasonable expectation that there will exist, the legal right to produce or a revenue interest in the production, installed means of delivering oil and gas or related substances to market, and all permits and financing required to implement the project.
Note to paragraph above: Reserves should not be assigned to adjacent reservoirs isolated by major, potentially sealing, faults until those reservoirs are penetrated and evaluated as economically producible. Reserves should not be assigned to areas that are clearly separated from a known accumulation by a non-productive reservoir (i.e., absence of reservoir, structurally low reservoir, or negative test results). Such areas may contain prospective resources (i.e., potentially recoverable resources from undiscovered accumulations).
DEVELOPED OIL AND GAS RESERVES are reserves of any category that can be expected tobe recovered:
(i) Through existing wells with existing equipment and operating methods or in which the cost of the required equipment is relatively minor compared to the cost of a new well; and
(ii) Through installed extraction equipment and infrastructure operational at the time of the reserves estimate if the extraction is by means not involving a well.
UNDEVELOPED OIL AND GAS RESERVES are reserves of any category that are expected to be recovered from new wells on undrilled acreage, or from existing wells where a relatively major expenditure is required for recompletion.
(i) Reserves on undrilled acreage shall be limited to those directly offsetting development spacing areas that are reasonably certain of production when drilled, unless evidence using reliable technology exists that establishes reasonable certainty of economic producibility at greater distances.
(ii) Undrilled locations can be classified as having undeveloped reserves only if a development plan has been adopted indicating that they are scheduled to be drilled within five years, unless the specific circumstances, justify a longer time.
(iii) Under no circumstances shall estimates for undeveloped reserves be attributable to any acreage for which an application of fluid injection or other improved recovery technique is contemplated, unless such techniques have been proved effective by actual projects in the same reservoir or an analogous reservoir, as defined in Analogus Reservoirs below, or by other evidence using reliable technology establishing reasonable certainty.
1As per Section 210.4-10 of SEC Regulation S-X dated November 1988 and as amended December 29, 2008.
RESERVE DEFINITIONS
SEC PARAMETERS (Cont.)1
PROVED OIL AND GAS RESERVES
Proved Reservesare those quantities of oil and gas, which, by analysis of geoscience andengineering data, can be estimated with reasonable certainty to be economically producible—from a given date forward, from known reservoirs, and under existing economic conditions, operating methods, and government regulations—prior to the time at which contracts providing the right to operate expire, unless evidence indicates that renewal is reasonably certain, regardless of whether deterministic or probabilistic methods are used for the estimation. The project to extract the hydrocarbons must have commenced or the operator must be reasonably certain that it will commence the project within a reasonable time.
(i) The area of the reservoir considered as proved includes:
(a) The area identified by drilling and limited by fluid contacts, if any, and
(b) Adjacent undrilled portions of the reservoir that can, with reasonable certainty, be judged to be continuous with it and to contain economically producible oil or gas on the basis of available geoscience and engineering data.
(ii) In the absence of data on fluid contacts, proved quantities in a reservoir are limited by the lowest known hydrocarbons (LKH) as seen in a well penetration unless geoscience, engineering, or performance data and reliable technology establishes a lower contact with reasonable certainty.
(iii) Where direct observation from well penetrations has defined a highest-known oil (HKO) elevation and the potential exists for an associated gas cap, proved oil reserves may be assigned in the structurally higher portions of the reservoir only if geoscience, engineering, or performance data and reliable technology establish the higher contact with reasonable certainty.
(iv) Reserves which can be produced economically through application of improved recovery techniques (including, but not limited to, fluid injection) are included in the proved classification when:
(a) Successful testing by a pilot project in an area of the reservoir with properties no more favorable than in the reservoir as a whole, the operation of an installed program in the reservoir or an analogous reservoir, or other evidence using reliable technology establishes the reasonable certainty of the engineering analysis on which the project or program was based; and
(b) The project has been approved for development by all necessary parties and entities, including governmental entities.
(v) Existing economic conditions include prices and costs at which economic producibility from a reservoir is to be determined. The price shall be the average price during the 12-month period prior to the ending date of the period covered by the report, determined as an unweighted arithmetic average of the first-day-of-the-month price for each month within such period, unless prices are defined by contractual arrangements, excluding escalations based upon future conditions.
1As per Section 210.4-10 of SEC Regulation S-X dated November 1988 and as amended December 29, 2008.
RESERVE DEFINITIONS
SEC PARAMETERS (Cont.)1
Reasonable certainty If deterministic methods are used, reasonable certainty means a high degree of confidence that the quantities will be recovered. If probabilistic methods are used, there should be at least a 90% probability that the quantities actually recovered will equal or exceed the estimate. A high degree of confidence exists if the quantity is much more likely to be achieved than not, and, as changes due to increased availability of geoscience (geological, geophysical, and geochemical), engineering, and economic data are made to estimated ultimate recovery (EUR) with time, reasonably certain EUR is much more likely to increase or remain constant than to decrease.
Reliable technology Reliable technology is a grouping of one or more technologies (including computational methods) that have been field tested and have been demonstrated to provide reasonably certain results with consistency and repeatability in the formation being evaluated or in an analogous formation.
Deterministic estimate The method of estimating reserves or resources is called deterministic when a single value for each parameter (from the geoscience, engineering, or economic data) in the reserves calculation is used in the reserves estimation procedure.
Probabilistic estimate The method of estimation of reserves or resources is called probabilistic when the full range of values that could reasonably occur for each unknown parameter (from the geoscience and engineering data) is used to generate a full range of possible outcomes and their associated probabilities of occurrence.
Analogous Reservoir Analogous reservoirs, as used in resources assessments, have similar rock and fluid properties, reservoir conditions (depth, temperature, and pressure) and drive mechanisms, but are typically at a more advanced stage of development than the reservoir of interest and thus may provide concepts to assist in the interpretation of more limited data and estimation of recovery. When used to support proved reserves, an “analogous reservoir” refers to a reservoir that shares the following characteristics with the reservoir of interest:
(i) Same geological formation (but not necessarily in pressure communication with the reservoir of interest);
(ii) Same environment of deposition;
(iii) Similar geological structure; and
(iv) Same drive mechanism.
Instruction to Analogous reservoir: Reservoir properties must, in the aggregate, be no more favorable inthe analog than in the reservoir of interest.
Proved Producing Reserves are those reserves which are expected to be recovered fromexisting completion intervals open at the time of the estimate and producing in existing wells.
Proved Nonproducing Shut-In Reserves are those reserves which are expected to be recovered from existing completion intervals open at the time of the estimate, but which had not started producing, or were shut in for market conditions or minor pipeline connection.
Proved Nonproducing Behind Pipe Reserves are those reserves which are expected to be recovered from zones behind casing in existing wells, which will require additional completion work or a future recompletion prior to the start of production.
1As per Section 210.4-10 of SEC Regulation S-X dated November 1988 and as amended December 29, 2008.
SHUCK FIELD, ETZOLD UNIT
Seward County, Kansas
BACKGROUND
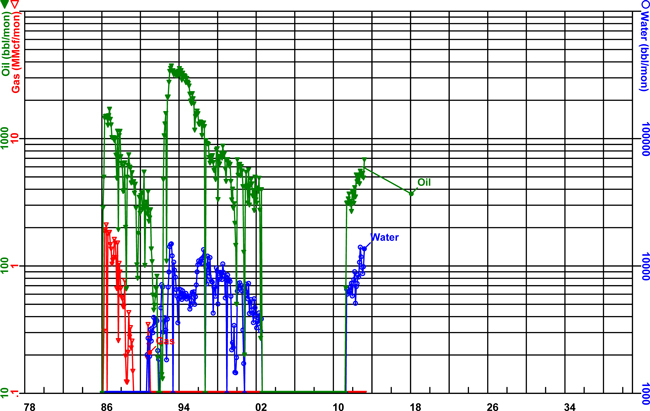
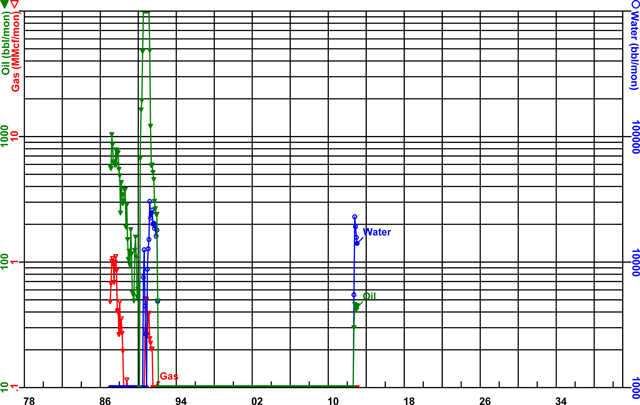
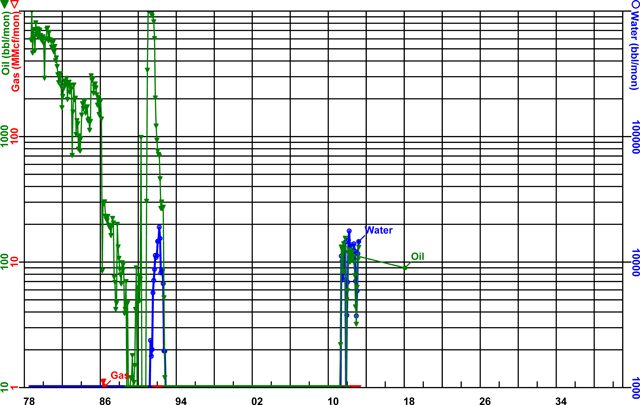
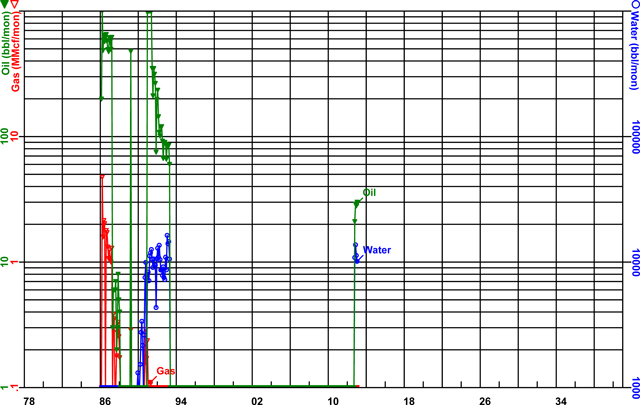
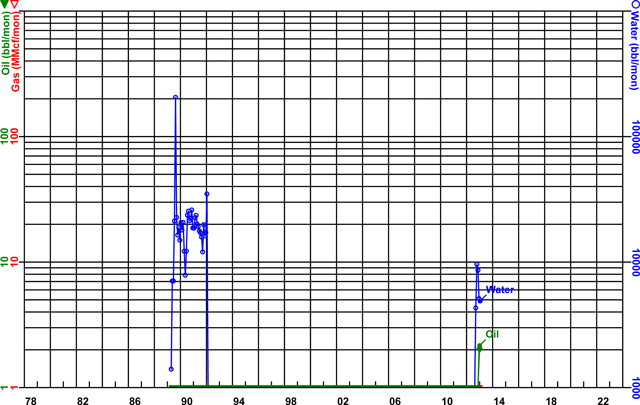
The Shuck Field, Etzold Unit, is located in the southwest portion of Kansas in Seward County. Anadarko originally developed the field and initiated a waterflood from 1989 to 2002. Merit was assigned the field in 2005. Merit then offered Glori Holdings Inc. the opportunity to acquire Merit's interest in the northern portion of the field in return for assuming field liability and a 7.5% royalty interest. Surface equipment has been replaced due to deterioration or prior removal. There are currently six wells producing and six injection wells. In December oil production was 611 BOPM and 61,419 BWPM from six wells. In 2012, Glori Holdings Inc. purchased the south portion of the Etzold Unit and plans to initiate production from two wells with one or two injection wells. Glori Holdings Inc. has a 100% gross working interest and 80.0% net revenue interest in the unit, including the royalty reduction
Redevelopment of the field is divided into three phases. Phase 1 has been completed with two producing wells and three injection wells. With the success of Phase 1, Phase 2 was started in 2012 and has four wells producing and three injection wells. At this time, there is in excess of 4,500 MBW of unproduced injection water in the reservoir. The reservoir has recovered 2 MMBO under primary and secondary recovery.
GEOSCIENCE
The Shuck Field, Etzold Unit consists of the Lower Chester Sand and several stray sands. The Lower Chester Sand is of Mississippian Age and equivalent to the Morrow formation. The field is located on a north-south channel axis. Several large fields are also along this axis. Permeability varies vertically, indicating that there could be significant by-passed reserves.
ENGINEERING
Gross proved reserves of 128 MBO are estimated to remain as of January 1, 2013, for Phases 1, 2, and 3. Of these, 35 MBO are in the producing category and 93 MBO are behind pipe. These reserves were determined by pore-volume analysis and performance. The Phase 1 and Phase 2 wells are being carefully monitored due to unknown water levels and the dispersion of the water across the reservoir.
Operating expenses for Phase 1 wells are $29,855 per month, Phase 2 wells are $41,040 per month, and Phase 3 expenses are estimated to be $29,855 per month. All of these expenses were provided by Glori Holdings Inc. These operating expenses include the operating costs of the facilities and injection wells. The oil price was based on 2012 actuals, .and was decreased by $6.21 compared to WTI crude at Cushing, Oklahoma SEC calculated price of $94.71. Transportation costs are also included in this differential, which was based on 2012 actuals. Capital expenses for Phase 3 of $720,000 are included for all necessary workovers, facilities, and flowlines. Abandonment costs were assumed to be equal to salvage value.
Effective January 1, 2013
GLORI HOLDINGS INC.
Total Field Reserves
Ranked by 1/1/13 Reserve Category and NPW at 10 %
| | | | | Production | | | Net | | | Prod. | | | Oper. | | | Exp & Cap | | | Net | | | NPW | | | Cum | |
| | Res. | | 8/8ths | | | 8/8ths | | | Net | | | Net | | | Sales | | | Tax | | | Exp. | | | Invest | | | Income | | | @10% | | | NPW | |
| Field | | Cat. | | (Mbbl) | | | (MMcf) | | | (Mbbl) | | | (MMcf) | | | M$ | | | M$ | | | M$ | | | M$ | | | M$ | | | (M$) | | | (M$) | |
| | | | | | | | | | | | | | | | | | | | | | | | | | | | | | | | | | | | |
| SHUCK FIELD | | PDP | | | 35 | | | | 0 | | | | 28 | | | | 0 | | | | 2,481 | | | | 199 | | | | 1,821 | | | | 0 | | | | 462 | | | | 394 | | | | 394 | |
| Total Proved Producing | | | | | 35 | | | | 0 | | | | 28 | | | | 0 | | | | 2,481 | | | | 199 | | | | 1,821 | | | | 0 | | | | 462 | | | | 394 | | | | | |
| | | | | | | | | | | | | | | | | | | | | | | | | | | | | | | | | | | | | | | | | | | | | | | |
| SHUCK FIELD | | PDBP | | | 93 | | | | 0 | | | | 75 | | | | 0 | | | | 6,605 | | | | 528 | | | | 2,655 | | | | 721 | | | | 2,700 | | | | 1,479 | | | | 1,873 | |
| Total Proved Behind Pipe | | | | | 93 | | | | 0 | | | | 75 | | | | 0 | | | | 6,605 | | | | 528 | | | | 2,655 | | | | 721 | | | | 2,700 | | | | 1,479 | | | | | |
| Total Proved | | | | | 128 | | | | 0 | | | | 103 | | | | 0 | | | | 9,086 | | | | 727 | | | | 4,476 | | | | 721 | | | | 3,162 | | | | 1,873 | | | | | |
| Collarini Associates | 4/25/2013 |
GLORI HOLDINGS INC.
SHUCK FIELD
Total Reserves
Ranked by 1/1/13 Reserve Category and NPW at 10 %
| | | | | | | | | Production | | Net | | Prod. | | Oper. | | Exp & Cap | | Net | | NPW | | Cum | |
| | | | | | | Res. | | 8/8ths | | 8/8ths | | Net | | Net | | Sales | | Tax | | Exp. | | Invest | | Income | | @10% | | NPW | |
| | | Well | | Reservoir | | Cat. | | (Mbbl) | | (MMcf) | | (Mbbl) | | (MMcf) | | M$ | | M$ | | M$ | | M$ | | M$ | | (M$) | | (M$) | |
| | | | | | | | | | | | | | | | | | | | | | | | | | | | | | |
| 1 | | Etzold Unit North Well #2-1(Phase 1) | | Lower Chester Sand | | PDP | | 29 | | 0 | | 23 | | 0 | | 2,050 | | 164 | | 0 | | 0 | | 1,886 | | 1,509 | | 1,509 | |
| 2 | | Etzold Unit North Well #1-1(Phase 1) | | Lower Chester Sand | | PDP | | 6 | | 0 | | 5 | | 0 | | 432 | | 35 | | 0 | | 0 | | 397 | | 314 | | 1,823 | |
| 3 | | Etzold Unit North Well #2-3(Phase 2) | | Lower Chester Sand | | PDP | | 0 | | 0 | | 0 | | 0 | | 0 | | 0 | | 0 | | 0 | | 0 | | 0 | | 1,823 | |
| 4 | | Etzold Unit North Well #3-5(Phase 2) | | Lower Chester Sand | | PDP | | 0 | | 0 | | 0 | | 0 | | 0 | | 0 | | 0 | | 0 | | 0 | | 0 | | 1,823 | |
| 5 | | Etzold Unit North Well #3-2(Phase 2) | | Lower Chester Sand | | PDP | | 0 | | 0 | | 0 | | 0 | | 0 | | 0 | | 0 | | 0 | | 0 | | 0 | | 1,823 | |
| 6 | | Etzold Unit Well #1-6 (Phase 2) | | Lower Chester Sand | | PDP | | 0 | | 0 | | 0 | | 0 | | 0 | | 0 | | 0 | | 0 | | 0 | | 0 | | 1,823 | |
| 7 | | Etzold Unit North Phase 2 LOE | | Lower Chester Sand | | PDP | | 0 | | 0 | | 0 | | 0 | | 0 | | 0 | | 0 | | 0 | | 0 | | 0 | | 1,823 | |
| 8 | | Etzold Unit North Phase 1 LOE | | Lower Chester Sand | | PDP | | 0 | | 0 | | 0 | | 0 | | 0 | | 0 | | 1,821 | | 0 | | -1,821 | | -1,429 | | 394 | |
| | | Total Proved Producing | | | | | | 35 | | 0 | | 28 | | 0 | | 2,481 | | 199 | | 1,821 | | 0 | | 462 | | 394 | | | |
| | | | | | | | | | | | | | | | | | | | | | | | | | | | | | |
| 1 | | Etzold Unit South Well #4-1(Phase 3) | | Lower Chester Sand | | PDBP | | 54 | | 0 | | 44 | | 0 | | 3,852 | | 308 | | 0 | | 215 | | 3,328 | | 2,128 | | 2,522 | |
| 2 | | Etzold Unit South Well #4-2(Phase 3) | | Lower Chester Sand | | PDBP | | 39 | | 0 | | 31 | | 0 | | 2,753 | | 220 | | 0 | | 215 | | 2,317 | | 1,490 | | 4,011 | |
| 3 | | Etzold Unit South Phase 3 LOE | | Lower Chester Sand | | PDBP | | 0 | | 0 | | 0 | | 0 | | 0 | | 0 | | 2,655 | | 290 | | -2,945 | | -2,138 | | 1,873 | |
| | | Total Proved Behind Pipe | | | | | | 93 | | 0 | | 75 | | 0 | | 6,605 | | 528 | | 2,655 | | 721 | | 2,700 | | 1,479 | | | |
| | | Total Proved | | | | | | 128 | | 0 | | 103 | | 0 | | 9,086 | | 727 | | 4,476 | | 721 | | 3,162 | | 1,873 | | | |
| Collarini Associates | 4/25/2013 |
| Collarini Associates | 1/1/2012 |
GLORI HOLDINGS INC.
SHUCK FIELD, ETZOLD UNIT
Reserve Summary
| | | | | | | Gross Reserves | | Net Reserves | | | | | |
| | | | Reserve | | Remaining 1/1/13 | | Remaining 1/1/13 | | * | | Comments | |
| Reservoir | | Well # | | Category | | MBO | | MMCF | | MBO | | MMCF | | | | | |
| | | | | | | | | | | | | | | | | | |
| Lower Chester Sand | | Etzold Unit North Well #1-1(Phase 1) | | PDP | | 6 | | 0 | | 5 | | 0 | | V | | 96 ac-ft drainage | |
| Lower Chester Sand | | Etzold Unit North Well #2-1(Phase 1) | | PDP | | 29 | | 0 | | 23 | | 0 | | V | | 173 ac-ft drainage | |
| Lower Chester Sand | | Etzold Unit North Well #1-6(Phase 2) | | PDP | | 0 | | 0 | | 0 | | 0 | | V | | Noncommercial | |
| Lower Chester Sand | | Etzold Unit North Well #2-3(Phase 2) | | PDP | | 0 | | 0 | | 0 | | 0 | | V | | Noncommercial | |
| Lower Chester Sand | | Etzold Unit North Well #3-2(Phase 2) | | PDP | | 0 | | 0 | | 0 | | 0 | | V | | Noncommercial | |
| Lower Chester Sand | | Etzold Unit North Well #3-5(Phase 2) | | PDP | | 0 | | 0 | | 0 | | 0 | | V | | Noncommercial | |
| | | | | | | | | | | | | | | | | | |
| Total Proved Producing | | | | 35 | | 0 | | 28 | | 0 | | | | | |
| | | | | | | | | | | | | | | | | | |
| Lower Chester Sand | | Etzold Unit South Well #4-1(Phase 3) | | PDBP | | 54 | | 0 | | 44 | | 0 | | V | | 200 ac-ft drainage | |
| Lower Chester Sand | | Etzold Unit South Well #4-2(Phase 3) | | PDBP | | 39 | | 0 | | 31 | | 0 | | V | | 200 ac-ft drainage | |
| Total Proved Behind Pipe | | | | 93 | | 0 | | 75 | | 0 | | | | | |
| | | | | | | | | | | | | | | | | | |
| TOTAL PROVED RESERVES | | | | 128 | | 0 | | 103 | | 0 | | | | | |
* Reserve Methodology:
| V = Volumetrics | P = Performance |
| Collarini Associates | Page 1 of 1 | 4/25/2013 |
GLORI HOLDINGS INC.
SHUCK FIELD, ETZOLD UNIT
Forecast of Expenditures
| | | | | | | Gross | | | |
| | | | | | Amount | | | |
| Well # | | Reservoir | | Date | | 2013 M$ | | Work Description | |
| | | | | | | | | | |
| Etzold Unit South (Phase 3) | | Lower Chester Sand | | Feb-2014 | | 207 | | Facilities and flowlines | |
| Etzold Unit South Well #4-1 (Phase 3) | | Lower Chester Sand | | Feb-2014 | | 215 | | Workover as producer | |
| Etzold Unit South Well #4-2 (Phase 3) | | Lower Chester Sand | | Feb-2014 | | 215 | | Workover as producer | |
| Etzold Unit South Well #5-4 (Phase 3) | | Lower Chester Sand | | Feb-2014 | | 83 | | Workover as injector | |
| | | | | | | | | | |
| | | Total | | | | 720 | | | |
| | Collarini Associates | 4/23/2013 |
PROJECTION OF ESTIMATED PRODUCTION AND REVENUE
GLORI HOLDINGS INC.
AS OF January 01, 2013
| SEC Pricing | | | | | | | | | |
| | | | | | Present Worth Profile | | | | |
| SHUCK FIELD | | | | | Mid-Year Discounting | | | | |
| Total | | | 8.00 | % | | | 2,081.3 | | | | 25.00 | % | | | 818.6 | |
| | | | 10.00 | % | | | 1,872.8 | | | | 30.00 | % | | | 604.6 | |
| Proved | | | 12.00 | % | | | 1,684.1 | | | | 35.00 | % | | | 434.7 | |
| | | | 15.00 | % | | | 1,433.7 | | | | 40.00 | % | | | 299.6 | |
| | | | 20.00 | % | | | 1,089.5 | | | | 50.00 | % | | | 105.7 | |
| Year | | | | | GROSS PRODUCTION | | | NET PRODUCTION | | | Oil | | | Gas | | | NGL | |
| Ending | | Gross | | | | | | | | | | | | | | | | | | | | | Price | | | Price | | | Price | |
| 12-31 | | Wells | | | Oil,(Mbbl) | | | Gas,(MMcf) | | | NGL,(Mgal) | | | Oil,(Mbbl) | | | Gas,(MMcf) | | | NGL,(Mgal) | | | ($/bbl) | | | ($/Mcf) | | | ($/gal) | |
| 2013 | | | 4 | | | | 8.1 | | | | 0.0 | | | | 0.00 | | | | 6.5 | | | | 0.0 | | | | 0.00 | | | | 88.50 | | | | 2.76 | | | | 0.00 | |
| 2014 | | | 4 | | | | 15.9 | | | | 0.0 | | | | 0.00 | | | | 12.7 | | | | 0.0 | | | | 0.00 | | | | 88.50 | | | | 0.00 | | | | 0.00 | |
| 2015 | | | 4 | | | | 23.7 | | | | 0.0 | | | | 0.00 | | | | 18.9 | | | | 0.0 | | | | 0.00 | | | | 88.50 | | | | 0.00 | | | | 0.00 | |
| 2016 | | | 4 | | | | 23.1 | | | | 0.0 | | | | 0.00 | | | | 18.5 | | | | 0.0 | | | | 0.00 | | | | 88.50 | | | | 0.00 | | | | 0.00 | |
| 2017 | | | 4 | | | | 21.8 | | | | 0.0 | | | | 0.00 | | | | 17.4 | | | | 0.0 | | | | 0.00 | | | | 88.50 | | | | 0.00 | | | | 0.00 | |
| 2018 | | | 4 | | | | 15.8 | | | | 0.0 | | | | 0.00 | | | | 12.7 | | | | 0.0 | | | | 0.00 | | | | 88.50 | | | | 0.00 | | | | 0.00 | |
| 2019 | | | 2 | | | | 14.7 | | | | 0.0 | | | | 0.00 | | | | 11.8 | | | | 0.0 | | | | 0.00 | | | | 88.50 | | | | 0.00 | | | | 0.00 | |
| 2020 | | | 1 | | | | 5.2 | | | | 0.0 | | | | 0.00 | | | | 4.2 | | | | 0.0 | | | | 0.00 | | | | 88.50 | | | | 0.00 | | | | 0.00 | |
| After | | | 0.0 | | | | 0.0 | | | | 0.00 | | | | 0.0 | | | | 0.0 | | | | 0.00 | | | | 0.00 | | | | 0.00 | | | | 0.00 | |
| Remaining | | | 128.3 | | | | 0.0 | | | | 0.00 | | | | 102.7 | | | | 0.0 | | | | 0.00 | | | | 88.50 | | | | 2.76 | | | | 0.00 | |
| Cumulative | | | 1,423.3 | | | | 304.3 | | | | 0.0 | | | | | | | | | | | | | | | | | | | | | | | | | |
| Ultimate | | | 1,551.7 | | | | 304.3 | | | | 0.0 | | | | | | | | | | | | | | | | | | | | | | | | | |
| Year | | Net | | | Other | | | Production | | | Operating | | | Exp/Cap | | | Net | | | Cumulative | | | Pres. Worth | |
| Ending | | Sales | | | Revenue | | | Taxes | | | Expense | | | Invest | | | Income | | | Net Income | | | @10.00% | |
| 12-31 | | (M$) | | | (M$) | | | (M$) | | | (M$) | | | (M$) | | | (M$) | | | (M$) | | | (M$) | |
| | | | | | | | | | | | | | | | | | | | | | | | | |
| 2013 | | | 574.0 | | | | 0.0 | | | | 45.9 | | | | 716.5 | | | | 0.0 | | | | -188.5 | | | | -188.5 | | | | -179.5 | |
| 2014 | | | 1,127.6 | | | | 0.0 | | | | 90.2 | | | | 716.5 | | | | 720.7 | | | | -399.9 | | | | -588.4 | | | | -556.0 | |
| 2015 | | | 1,674.6 | | | | 0.0 | | | | 134.0 | | | | 716.5 | | | | 0.0 | | | | 824.1 | | | | 235.8 | | | | 86.0 | |
| 2016 | | | 1,633.6 | | | | 0.0 | | | | 130.7 | | | | 716.5 | | | | 0.0 | | | | 786.4 | | | | 1,022.1 | | | | 641.6 | |
| 2017 | | | 1,543.5 | | | | 0.0 | | | | 123.5 | | | | 716.5 | | | | 0.0 | | | | 703.5 | | | | 1,725.6 | | | | 1,091.5 | |
| 2018 | | | 1,121.2 | | | | 0.0 | | | | 89.7 | | | | 388.1 | | | | 0.0 | | | | 643.4 | | | | 2,369.0 | | | | 1,463.8 | |
| 2019 | | | 1,044.0 | | | | 0.0 | | | | 83.5 | | | | 358.3 | | | | 0.0 | | | | 602.2 | | | | 2,971.1 | | | | 1,779.3 | |
| 2020 | | | 367.6 | | | | 0.0 | | | | 29.4 | | | | 147.4 | | | | 0.0 | | | | 190.8 | | | | 3,161.9 | | | | 1,872.8 | |
| After | | | 0.0 | | | | 0.0 | | | | 0.0 | | | | 0.0 | | | | 0.0 | | | | 0.0 | | | | 0.0 | | | | 0.0 | |
| | | | | | | | | | | | | | | | | | | | | | | | | | | | | | | | | |
| Total | | | 9,086.0 | | | | 0.0 | | | | 726.9 | | | | 4,476.4 | | | | 720.7 | | | | 3,161.9 | | | | 3,161.9 | | | | 1,872.8 | |
| 4/25/13 | This forecast accompanies the COLLARINI ASSOCIATES report and is subject to its specific conditions. | |
PROJECTION OF ESTIMATED PRODUCTION AND REVENUE
GLORI HOLDINGS INC.
AS OF January 01, 2013
| SEC Pricing | | | | | | | | | |
| | | | | | Present Worth Profile | | | | |
| SHUCK FIELD | | | | | Mid-Year Discounting | | | | |
| Total | | | 8.00 | % | | | 406.3 | | | | 25.00 | % | | | 318.7 | |
| Proved Producing | | | 10.00 | % | | | 394.1 | | | | 30.00 | % | | | 298.8 | |
| | | | 12.00 | % | | | 382.5 | | | | 35.00 | % | | | 280.9 | |
| | | | 15.00 | % | | | 366.0 | | | | 40.00 | % | | | 264.7 | |
| | | | 20.00 | % | | | 341.0 | | | | 50.00 | % | | | 236.9 | |
| Year | | | | | GROSS PRODUCTION | | | NET PRODUCTION | | | Oil | | | Gas | | | NGL | |
| Ending | | Gross | | | | | | | | | Price | | | Price | | | Price | |
| 12-31 | | Wells | | | Oil,(Mbbl) | | | Gas,(MMcf) | | | NGL,(Mgal) | | | Oil,(Mbbl) | | | Gas,(MMcf) | | | NGL,(Mgal) | | | ($/bbl) | | | ($/Mcf) | | | ($/gal) | |
| 2013 | | | 2 | | | | 8.1 | | | | 0.0 | | | | 0.00 | | | | 6.5 | | | | 0.0 | | | | 0.00 | | | | 88.50 | | | | 2.76 | | | | 0.00 | |
| 2014 | | | 2 | | | | 7.5 | | | | 0.0 | | | | 0.00 | | | | 6.0 | | | | 0.0 | | | | 0.00 | | | | 88.50 | | | | 0.00 | | | | 0.00 | |
| 2015 | | | 2 | | | | 6.9 | | | | 0.0 | | | | 0.00 | | | | 5.5 | | | | 0.0 | | | | 0.00 | | | | 88.50 | | | | 0.00 | | | | 0.00 | |
| 2016 | | | 2 | | | | 6.3 | | | | 0.0 | | | | 0.00 | | | | 5.1 | | | | 0.0 | | | | 0.00 | | | | 88.50 | | | | 0.00 | | | | 0.00 | |
| 2017 | | | 2 | | | | 5.8 | | | | 0.0 | | | | 0.00 | | | | 4.6 | | | | 0.0 | | | | 0.00 | | | | 88.50 | | | | 0.00 | | | | 0.00 | |
| 2018 | | | 2 | | | | 0.5 | | | | 0.0 | | | | 0.00 | | | | 0.4 | | | | 0.0 | | | | 0.00 | | | | 88.50 | | | | 0.00 | | | | 0.00 | |
| After | | | 0.0 | | | | 0.0 | | | | 0.00 | | | | 0.0 | | | | 0.0 | | | | 0.00 | | | | 0.00 | | | | 0.00 | | | | 0.00 | |
| Remaining | | | 35.0 | | | | 0.0 | | | | 0.00 | | | | 28.0 | | | | 0.0 | | | | 0.00 | | | | 88.50 | | | | 2.76 | | | | 0.00 | |
| Cumulative | | | 1,056.9 | | | | 117.0 | | | | 0.0 | | | | | | | | | | | | | | | | | | | | | | | | | |
| Ultimate | | | 1,092.0 | | | | 117.0 | | | | 0.0 | | | | | | | | | | | | | | | | | | | | | | | | | |
| Year | | Net | | | Other | | | Production | | | Operating | | | Exp/Cap | | | Net | | | Cumulative | | | Pres. Worth | |
| Ending | | Sales | | | Revenue | | | Taxes | | | Expense | | | Invest | | | Income | | | Net Income | | | @10.00% | |
| 12-31 | | (M$) | | | (M$) | | | (M$) | | | (M$) | | | (M$) | | | (M$) | | | (M$) | | | (M$) | |
| | | | | | | | | | | | | | | | | | | | | | | | | |
| 2013 | | | 574.0 | | | | 0.0 | | | | 45.9 | | | | 358.3 | | | | 0.0 | | | | 169.8 | | | | 169.8 | | | | 161.6 | |
| 2014 | | | 531.1 | | | | 0.0 | | | | 42.5 | | | | 358.3 | | | | 0.0 | | | | 130.4 | | | | 300.2 | | | | 274.2 | |
| 2015 | | | 486.7 | | | | 0.0 | | | | 38.9 | | | | 358.3 | | | | 0.0 | | | | 89.5 | | | | 389.7 | | | | 344.2 | |
| 2016 | | | 447.4 | | | | 0.0 | | | | 35.8 | | | | 358.3 | | | | 0.0 | | | | 53.3 | | | | 443.0 | | | | 382.0 | |
| 2017 | | | 409.1 | | | | 0.0 | | | | 32.7 | | | | 358.3 | | | | 0.0 | | | | 18.1 | | | | 461.2 | | | | 393.7 | |
| 2018 | | | 33.2 | | | | 0.0 | | | | 2.7 | | | | 29.9 | | | | 0.0 | | | | 0.6 | | | | 461.8 | | | | 394.1 | |
| After | | | 0.0 | | | | 0.0 | | | | 0.0 | | | | 0.0 | | | | 0.0 | | | | 0.0 | | | | 0.0 | | | | 0.0 | |
| | | | | | | | | | | | | | | | | | | | | | | | | | | | | | | | | |
| Total | | | 2,481.5 | | | | 0.0 | | | | 198.5 | | | | 1,821.2 | | | | 0.0 | | | | 461.8 | | | | 461.8 | | | | 394.1 | |
| 4/25/13 | This forecast accompanies the COLLARINI ASSOCIATES report and is subject to its specific conditions. | |
| GLORI HOLDINGS INC. | Etzold Unit North Well #2-1 (Phase 1) |
| SHUCK FIELD | Lower Chester Sand |
| | Proved Producing |
| Proj Oil Cum: 204.39 Mbbl | Oil EUR: 233.35 Mbbl |
| Proj Gas Cum: 33.36 MMcf | Gas EUR: 33.36 MMcf |
| Proj Wtr Cum: 1,015.19 Mbbl | |
PROJECTION OF ESTIMATED PRODUCTION AND REVENUE
SHUCK FIELD GLORI HOLDINGS INC.
AS OF January 01, 2013
Etzold Unit North Well #2-1 (Phase 1)
Proved Producing
Lower Chester Sand
| | | | | | | | | | | | Present Worth Profile | | | | |
| | | | | | | | | | | | Mid-Year Discounting | | | | |
| SEC Pricing | | | | | | | | | | | 8.00 | % | | | 1,575.3 | | | | 25.00 | % | | | 1,125.4 | |
| | | | | | | | | | | | 10.00 | % | | | 1,509.4 | | | | 30.00 | % | | | 1,030.7 | |
| | | | Initial | | | | Final | | | | 12.00 | % | | | 1,447.5 | | | | 35.00 | % | | | 948.3 | |
| Gross Working Interest | | | 1.000000 | | | | 1.000000 | | | | 15.00 | % | | | 1,361.6 | | | | 40.00 | % | | | 876.2 | |
| Net Revenue Interest | | | 0.800000 | | | | 0.800000 | | | | 20.00 | % | | | 1,234.8 | | | | 50.00 | % | | | 757.2 | |
| Year | | | | | GROSS PRODUCTION | | | NET PRODUCTION | | | Oil | | | Gas | | | NGL | |
| Ending | | Gross | | | | | | | | | Price | | | Price | | | Price | |
| 12-31 | | Wells | | | Oil,(Mbbl) | | | Gas,(MMcf) | | | NGL,(Mgal) | | | Oil,(Mbbl) | | | Gas,(MMcf) | | | NGL,(Mgal) | | | ($/bbl) | | | ($/Mcf) | | | ($/gal) | |
| 2013 | | | 1 | | | | 6.8 | | | | 0.0 | | | | 0.00 | | | | 5.5 | | | | 0.0 | | | | 0.00 | | | | 88.50 | | | | 0.00 | | | | 0.00 | |
| 2014 | | | 1 | | | | 6.2 | | | | 0.0 | | | | 0.00 | | | | 5.0 | | | | 0.0 | | | | 0.00 | | | | 88.50 | | | | 0.00 | | | | 0.00 | |
| 2015 | | | 1 | | | | 5.7 | | | | 0.0 | | | | 0.00 | | | | 4.5 | | | | 0.0 | | | | 0.00 | | | | 88.50 | | | | 0.00 | | | | 0.00 | |
| 2016 | | | 1 | | | | 5.2 | | | | 0.0 | | | | 0.00 | | | | 4.1 | | | | 0.0 | | | | 0.00 | | | | 88.50 | | | | 0.00 | | | | 0.00 | |
| 2017 | | | 1 | | | | 4.7 | | | | 0.0 | | | | 0.00 | | | | 3.7 | | | | 0.0 | | | | 0.00 | | | | 88.50 | | | | 0.00 | | | | 0.00 | |
| 2018 | | | 1 | | | | 0.4 | | | | 0.0 | | | | 0.00 | | | | 0.3 | | | | 0.0 | | | | 0.00 | | | | 88.50 | | | | 0.00 | | | | 0.00 | |
| After | | | 0.0 | | | | 0.0 | | | | 0.00 | | | | 0.0 | | | | 0.0 | | | | 0.00 | | | | 0.00 | | | | 0.00 | | | | 0.00 | |
| Remaining | | | 29.0 | | | | 0.0 | | | | 0.00 | | | | 23.2 | | | | 0.0 | | | | 0.00 | | | | 88.50 | | | | 0.00 | | | | 0.00 | |
| Cumulative | | | 204.4 | | | | 33.4 | | | | 0.0 | | | | | | | | | | | | | | | | | | | | | | | | | |
| Ultimate | | | 233.3 | | | | 33.4 | | | | 0.0 | | | | | | | | | | | | | | | | | | | | | | | | | |
| Year | | Net | | | Other | | | Production | | | Operating | | | Exp/Cap | | | Net | | | Cumulative | | | Pres. Worth | |
| Ending | | Sales | | | Revenue | | | Taxes | | | Expense | | | Invest | | | Income | | | Net Income | | | @10.00% | |
| 12-31 | | (M$) | | | (M$) | | | (M$) | | | (M$) | | | (M$) | | | (M$) | | | (M$) | | | (M$) | |
| 2013 | | | 483.2 | | | | 0.0 | | | | 38.7 | | | | 0.0 | | | | 0.0 | | | | 444.5 | | | | 444.5 | | | | 423.2 | |
| 2014 | | | 442.1 | | | | 0.0 | | | | 35.4 | | | | 0.0 | | | | 0.0 | | | | 406.7 | | | | 851.3 | | | | 774.0 | |
| 2015 | | | 401.4 | | | | 0.0 | | | | 32.1 | | | | 0.0 | | | | 0.0 | | | | 369.3 | | | | 1,220.6 | | | | 1,062.3 | |
| 2016 | | | 365.5 | | | | 0.0 | | | | 29.2 | | | | 0.0 | | | | 0.0 | | | | 336.2 | | | | 1,556.8 | | | | 1,299.8 | |
| 2017 | | | 330.9 | | | | 0.0 | | | | 26.5 | | | | 0.0 | | | | 0.0 | | | | 304.4 | | | | 1,861.2 | | | | 1,494.5 | |
| 2018 | | | 26.7 | | | | 0.0 | | | | 2.1 | | | | 0.0 | | | | 0.0 | | | | 24.5 | | | | 1,885.8 | | | | 1,509.4 | |
| After | | | 0.0 | | | | 0.0 | | | | 0.0 | | | | 0.0 | | | | 0.0 | | | | 0.0 | | | | 0.0 | | | | 0.0 | |
| | | | | | | | | | | | | | | | | | | | | | | | | | | | | | | | | |
| Total | | | 2,049.8 | | | | 0.0 | | | | 164.0 | | | | 0.0 | | | | 0.0 | | | | 1,885.8 | | | | 1,885.8 | | | | 1,509.4 | |
| 4/27/13 | This forecast accompanies the COLLARINI ASSOCIATES report and is subject to its specific conditions. | |
| GLORI HOLDINGS INC. | Etzold Unit North Well #2-3 (Phase 2) |
| SHUCK FIELD | Lower Chester Sand |
| | Proved Producing |

| Proj Oil Cum: 175.50 Mbbl | Oil EUR: 175.50 Mbbl |
| Proj Gas Cum: 29.55 MMcf | Gas EUR: 29.55 MMcf |
| Proj Wtr Cum: 425.08 Mbbl | |
PROJECTION OF ESTIMATED PRODUCTION AND REVENUE
SHUCK FIELD GLORI HOLDINGS INC.
AS OF January 01, 2013
Etzold Unit North Well #2-3 (Phase 2)
Proved Producing
Lower Chester Sand
| | | | | | | | | | | | Present Worth Profile | | | | |
| | | | | | | | | | | | Mid-Year Discounting | | | | |
| SEC Pricing | | | | | | | | | | | 8.00 | % | | | 0.0 | | | | 25.00 | % | | | 0.0 | |
| | | | | | | | | | | | 10.00 | % | | | 0.0 | | | | 30.00 | % | | | 0.0 | |
| | | Initial | | | Final | | | | 12.00 | % | | | 0.0 | | | | 35.00 | % | | | 0.0 | |
| Gross Working Interest | | | 1.000000 | | | | 0.000000 | | | | 15.00 | % | | | 0.0 | | | | 40.00 | % | | | 0.0 | |
| Net Revenue Interest | | | 0.800000 | | | | 0.000000 | | | | 20.00 | % | | | 0.0 | | | | 50.00 | % | | | 0.0 | |
| Year | | | | | | | | | | | | | | | | | | | | | | | | Oil | | | Gas | | | NGL | |
| Ending | | | Gross | | | GROSS PRODUCTION | | | NET PRODUCTION | | | Price | | | Price | | | Price | |
| 12-31 | | | Wells | | | Oil,(Mbbl) | | | Gas,(MMcf) | | | NGL,(Mgal) | | | Oil,(Mbbl) | | | Gas,(MMcf) | | | NGL,(Mgal) | | | ($/bbl) | | | ($/Mcf) | | | ($/gal) | |
| | | | | | | | | | | | | | | | | | | | | | | | | | | | | | | | | | | | | | | | | | | |
| 2013 | | | | 0 | | | | 0.0 | | | | 0.0 | | | | 0.00 | | | | 0.0 | | | | 0.0 | | | | 0.00 | | | | 0.00 | | | | 0.00 | | | | 0.00 | |
| After | | | | | | | | | 0.0 | | | | 0.0 | | | | 0.00 | | | | 0.0 | | | | 0.0 | | | | 0.00 | | | | 0.00 | | | | 0.00 | | | | 0.00 | |
| Remaining | | | | | | | | | 0.0 | | | | 0.0 | | | | 0.00 | | | | 0.0 | | | | 0.0 | | | | 0.00 | | | | 0.00 | | | | 0.00 | | | | 0.00 | |
| Cumulative | | | | | | | | | 175.5 | | | | 29.6 | | | | 0.0 | | | | | | | | | | | | | | | | | | | | | | | | | |
| Ultimate | | | | | | | | | 175.5 | | | | 29.6 | | | | 0.0 | | | | | | | | | | | | | | | | | | | | | | | | | |
| Year | | | Net | | | Other | | | Production | | | Operating | | | Exp/Cap | | | Net | | | Cumulative | | | Pres. Worth | |
| Ending | | | Sales | | | Revenue | | | Taxes | | | Expense | | | Invest | | | Income | | | Net Income | | | @10.00% | |
| 12-31 | | | (M$) | | | (M$) | | | (M$) | | | (M$) | | | (M$) | | | (M$) | | | (M$) | | | (M$) | |
| | | | | | | | | | | | | | | | | | | | | | | | | | | | | | | | | | | |
| 2013 | | | | 0.0 | | | | 0.0 | | | | 0.0 | | | | 0.0 | | | | 0.0 | | | | 0.0 | | | | 0.0 | | | | 0.0 | |
| After | | | 0.0 | | | | 0.0 | | | | 0.0 | | | | 0.0 | | | | 0.0 | | | | 0.0 | | | | 0.0 | | | | 0.0 | |
| Total | | | 0.0 | | | | 0.0 | | | | 0.0 | | | | 0.0 | | | | 0.0 | | | | 0.0 | | | | 0.0 | | | | 0.0 | |
| 4/25/13 | This forecast accompanies the COLLARINI ASSOCIATES report and is subject to its specific conditions. | |
| GLORI HOLDINGS INC. | Etzold Unit North Well #3-5 (Phase 2) |
| SHUCK FIELD | Lower Chester Sand |
| | Proved Producing |
| Proj Oil Cum: 192.18 Mbbl | Oil EUR: 192.18 Mbbl |
| Proj Gas Cum: 14.82 MMcf | Gas EUR: 14.82 MMcf |
| Proj Wtr Cum: 350.92 Mbbl | |
PROJECTION OF ESTIMATED PRODUCTION AND REVENUE
SHUCK FIELD GLORI HOLDINGS INC.
AS OF January 01, 2013
Etzold Unit North Well #3-5 (Phase 2)
Proved Producing
Lower Chester Sand
| | | | | | | | | | | | Present Worth Profile | | | | |
| | | | | | | | | | | | Mid-Year Discounting | | | | |
| SEC Pricing | | | | | | | | | | | 8.00 | % | | | 0.0 | | | | 25.00 | % | | | 0.0 | |
| | | | | | | | | | | | 10.00 | % | | | 0.0 | | | | 30.00 | % | | | 0.0 | |
| | | | Initial | | | | Final | | | | 12.00 | % | | | 0.0 | | | | 35.00 | % | | | 0.0 | |
| Gross Working Interest | | | 1.000000 | | | | 1.000000 | | | | 15.00 | % | | | 0.0 | | | | 40.00 | % | | | 0.0 | |
| Net Revenue Interest | | | 0.800000 | | | | 0.800000 | | | | 20.00 | % | | | 0.0 | | | | 50.00 | % | | | 0.0 | |
| Year | | | | | | | | | | | | | | | | | | | | | | | | Oil | | | Gas | | | NGL | |
| Ending | | | Gross | | | GROSS PRODUCTION | | | NET PRODUCTION | | | Price | | | Price | | | Price | |
| 12-31 | | | Wells | | | Oil,(Mbbl) | | | Gas,(MMcf) | | | NGL,(Mgal) | | | Oil,(Mbbl) | | | Gas,(MMcf) | | | NGL,(Mgal) | | | ($/bbl) | | | ($/Mcf) | | | ($/gal) | |
| | | | | | | | | | | | | | | | | | | | | | | | | | | | | | | | | | | | | | | | | | | |
| 2013 | | | | 0 | | | | 0.0 | | | | 0.0 | | | | 0.00 | | | | 0.0 | | | | 0.0 | | | | 0.00 | | | | 0.00 | | | | 0.00 | | | | 0.00 | |
| After | | | | | | | | | 0.0 | | | | 0.0 | | | | 0.00 | | | | 0.0 | | | | 0.0 | | | | 0.00 | | | | 0.00 | | | | 0.00 | | | | 0.00 | |
| Remaining | | | | | | | | 0.0 | | | | 0.0 | | | | 0.00 | | | | 0.0 | | | | 0.0 | | | | 0.00 | | | | 0.00 | | | | 0.00 | | | | 0.00 | |
| Cumulative | | | | | | | | 192.2 | | | | 14.8 | | | | 0.0 | | | | | | | | | | | | | | | | | | | | | | | | | |
| Ultimate | | | | | | | | 192.2 | | | | 14.8 | | | | 0.0 | | | | | | | | | | | | | | | | | | | | | | | | | |
| Year | | Net | | | Other | | | Production | | | Operating | | | Exp/Cap | | | Net | | | Cumulative | | | Pres. Worth | |
| Ending | | Sales | | | Revenue | | | Taxes | | | Expense | | | Invest | | | Income | | | Net Income | | | @10.00% | |
| 12-31 | | (M$) | | | (M$) | | | (M$) | | | (M$) | | | (M$) | | | (M$) | | | (M$) | | | (M$) | |
| | | | | | | | | | | | | | | | | | | | | | | | | | | | | | | | | |
| 2013 | | | 0.0 | | | | 0.0 | | | | 0.0 | | | | 0.0 | | | | 0.0 | | | | 0.0 | | | | 0.0 | | | | 0.0 | |
| After | | | 0.0 | | | | 0.0 | | | | 0.0 | | | | 0.0 | | | | 0.0 | | | | 0.0 | | | | 0.0 | | | | 0.0 | |
| Total | | | 0.0 | | | | 0.0 | | | | 0.0 | | | | 0.0 | | | | 0.0 | | | | 0.0 | | | | 0.0 | | | | 0.0 | |
| 4/25/13 | This forecast accompanies the COLLARINI ASSOCIATES report and is subject to its specific conditions. | |
| GLORI HOLDINGS INC. | Etzold Unit North Well #1-1 (Phase 1) |
| SHUCK FIELD | Lower Chester Sand |
| | Proved Producing |
| Proj Oil Cum: 459.05 Mbbl | Oil EUR: 465.15 Mbbl |
| Proj Gas Cum: 14.75 MMcf | Gas EUR: 14.75 MMcf |
| Proj Wtr Cum: 367.66 Mbbl | |
PROJECTION OF ESTIMATED PRODUCTION AND REVENUE
SHUCK FIELD GLORI HOLDINGS INC.
AS OF January 01, 2013
Etzold Unit North Well #1-1 (Phase 1)
Proved Producing
Lower Chester Sand
| | | | | | | | | | | | Present Worth Profile | | | | |
| | | | | | | | | | | | Mid-Year Discounting | | | | |
SEC Pricing
| | | | | | | | | | | 8.00 | % | | | 328.6 | | | | 25.00 | % | | | 230.1 | |
| | | | | | | | | | | | 10.00 | % | | | 314.1 | | | | 30.00 | % | | | 209.6 | |
| | | | Initial | | | | Final | | | | 12.00 | % | | | 300.5 | | | | 35.00 | % | | | 191.9 | |
| Gross Working Interest | | | 1.000000 | | | | 1.000000 | | | | 15.00 | % | | | 281.6 | | | | 40.00 | % | | | 176.4 | |
| Net Revenue Interest | | | 0.800000 | | | | 0.800000 | | | | 20.00 | % | | | 253.9 | | | | 50.00 | % | | | 151.0 | |
| Year | | | | | | | | | | | Oil | | | Gas | | | NGL | |
| Ending | | Gross | | | GROSS PRODUCTION | | | NET PRODUCTION | | | Price | | | Price | | | Price | |
| 12-31 | | Wells | | | Oil,(Mbbl) | | | Gas,(MMcf) | | | NGL,(Mgal) | | | Oil,(Mbbl) | | | Gas,(MMcf) | | | NGL,(Mgal) | | | ($/bbl) | | | ($/Mcf) | | | ($/gal) | |
| 2013 | | | 1 | | | | 1.3 | | | | 0.0 | | | | 0.00 | | | | 1.0 | | | | 0.0 | | | | 0.00 | | | | 88.50 | | | | 2.76 | | | | 0.00 | |
| 2014 | | | 1 | | | | 1.3 | | | | 0.0 | | | | 0.00 | | | | 1.0 | | | | 0.0 | | | | 0.00 | | | | 88.50 | | | | 0.00 | | | | 0.00 | |
| 2015 | | | 1 | | | | 1.2 | | | | 0.0 | | | | 0.00 | | | | 1.0 | | | | 0.0 | | | | 0.00 | | | | 88.50 | | | | 0.00 | | | | 0.00 | |
| 2016 | | | 1 | | | | 1.2 | | | | 0.0 | | | | 0.00 | | | | 0.9 | | | | 0.0 | | | | 0.00 | | | | 88.50 | | | | 0.00 | | | | 0.00 | |
| 2017 | | | 1 | | | | 1.1 | | | | 0.0 | | | | 0.00 | | | | 0.9 | | | | 0.0 | | | | 0.00 | | | | 88.50 | | | | 0.00 | | | | 0.00 | |
| 2018 | | | 1 | | | | 0.1 | | | | 0.0 | | | | 0.00 | | | | 0.1 | | | | 0.0 | | | | 0.00 | | | | 88.50 | | | | 0.00 | | | | 0.00 | |
| After | | | | | | | 0.0 | | | | 0.0 | | | | 0.00 | | | | 0.0 | | | | 0.0 | | | | 0.00 | | | | 0.00 | | | | 0.00 | | | | 0.00 | |
| Remaining | | | | | | | 6.1 | | | | 0.0 | | | | 0.00 | | | | 4.9 | | | | 0.0 | | | | 0.00 | | | | 88.50 | | | | 2.76 | | | | 0.00 | |
| Cumulative | | | | | | | 459.0 | | | | 14.8 | | | | 0.0 | | | | | | | | | | | | | | | | | | | | | | | | | |
| Ultimate | | | | | | | 465.1 | | | | 14.8 | | | | 0.0 | | | | | | | | | | | | | | | | | | | | | | | | | |
| Year | | Net | | | Other | | | Production | | | Operating | | | Exp/Cap | | | Net | | | Cumulative | | | Pres. Worth | |
| Ending | | Sales | | | Revenue | | | Taxes | | | Expense | | | Invest | | | Income | | | Net Income | | | @10.00% | |
| 12-31 | | (M$) | | | (M$) | | | (M$) | | | (M$) | | | (M$) | | | (M$) | | | (M$) | | | (M$) | |
| 2013 | | | 90.8 | | | | 0.0 | | | | 7.3 | | | | 0.0 | | | | 0.0 | | | | 83.5 | | | | 83.5 | | | | 79.4 | |
| 2014 | | | 89.0 | | | | 0.0 | | | | 7.1 | | | | 0.0 | | | | 0.0 | | | | 81.9 | | | | 165.4 | | | | 150.0 | |
| 2015 | | | 85.3 | | | | 0.0 | | | | 6.8 | | | | 0.0 | | | | 0.0 | | | | 78.5 | | | | 243.9 | | | | 211.2 | |
| 2016 | | | 81.9 | | | | 0.0 | | | | 6.6 | | | | 0.0 | | | | 0.0 | | | | 75.4 | | | | 319.2 | | | | 264.4 | |
| 2017 | | | 78.2 | | | | 0.0 | | | | 6.3 | | | | 0.0 | | | | 0.0 | | | | 72.0 | | | | 391.2 | | | | 310.5 | |
| 2018 | | | 6.5 | | | | 0.0 | | | | 0.5 | | | | 0.0 | | | | 0.0 | | | | 6.0 | | | | 397.2 | | | | 314.1 | |
| After | | | 0.0 | | | | 0.0 | | | | 0.0 | | | | 0.0 | | | | 0.0 | | | | 0.0 | | | | 0.0 | | | | 0.0 | |
| Total | | | 431.7 | | | | 0.0 | | | | 34.5 | | | | 0.0 | | | | 0.0 | | | | 397.2 | | | | 397.2 | | | | 314.1 | |
| 4/25/13 | This forecast accompanies the COLLARINI ASSOCIATES report and is subject to its specific conditions. | |
| GLORI HOLDINGS INC. | Etzold Unit North Well #3-2 (Phase 2) |
| SHUCK FIELD | Lower Chester Sand |
| | Proved Producing |
| Proj Oil Cum: 25.80 Mbbl | Oil EUR: 25.80 Mbbl |
| Proj Gas Cum: 24.51 MMcf | Gas EUR: 24.51 MMcf |
| Proj Wtr Cum: 374.48 Mbbl | |
PROJECTION OF ESTIMATED PRODUCTION AND REVENUE
SHUCK FIELD GLORI HOLDINGS INC.
AS OF January 01, 2013
Etzold Unit North Well #3-2 (Phase 2)
Proved Producing
Lower Chester Sand
| | | | | | | | | | | | Present Worth Profile | | | | |
| | | | | | | | | | | | Mid-Year Discounting | | | | |
SEC Pricing
| | | | | | | | | | | 8.00 | % | | | 0.0 | | | | 25.00 | % | | | 0.0 | |
| | | | | | | | | | | | 10.00 | % | | | 0.0 | | | | 30.00 | % | | | 0.0 | |
| | | | Initial | | | | Final | | | | 12.00 | % | | | 0.0 | | | | 35.00 | % | | | 0.0 | |
| Gross Working Interest | | | 1.000000 | | | | 1.000000 | | | | 15.00 | % | | | 0.0 | | | | 40.00 | % | | | 0.0 | |
| Net Revenue Interest | | | 0.800000 | | | | 0.800000 | | | | 20.00 | % | | | 0.0 | | | | 50.00 | % | | | 0.0 | |
| Year | | | | | | | | | | | Oil | | | Gas | | | NGL | |
| Ending | | Gross | | | GROSS PRODUCTION | | | NET PRODUCTION | | | Price | | | Price | | | Price | |
| 12-31 | | Wells | | | Oil,(Mbbl) | | | Gas,(MMcf) | | | NGL,(Mgal) | | | Oil,(Mbbl) | | | Gas,(MMcf) | | | NGL,(Mgal) | | | ($/bbl) | | | ($/Mcf) | | | ($/gal) | |
| 2013 | | | 0 | | | | 0.0 | | | | 0.0 | | | | 0.00 | | | | 0.0 | | | | 0.0 | | | | 0.00 | | | | 0.00 | | | | 0.00 | | | | 0.00 | |
| After | | | | | | | 0.0 | | | | 0.0 | | | | 0.00 | | | | 0.0 | | | | 0.0 | | | | 0.00 | | | | 0.00 | | | | 0.00 | | | | 0.00 | |
| Remaining | | | | | | | 0.0 | | | | 0.0 | | | | 0.00 | | | | 0.0 | | | | 0.0 | | | | 0.00 | | | | 0.00 | | | | 0.00 | | | | 0.00 | |
| Cumulative | | | | | | | 25.8 | | | | 24.5 | | | | 0.0 | | | | | | | | | | | | | | | | | | | | | | | | | |
| Ultimate | | | | | | | 25.8 | | | | 24.5 | | | | 0.0 | | | | | | | | | | | | | | | | | | | | | | | | | |
| Year | | Net | | | Other | | | Production | | | Operating | | | Exp/Cap | | | Net | | | Cumulative | | | Pres. Worth | |
| Ending | | Sales | | | Revenue | | | Taxes | | | Expense | | | Invest | | | Income | | | Net Income | | | @10.00% | |
| 12-31 | | (M$) | | | (M$) | | | (M$) | | | (M$) | | | (M$) | | | (M$) | | | (M$) | | | (M$) | |
| | | | | | | | | | | | | | | | | | | | | | | | | | | | | | | | | |
| 2013 | | | 0.0 | | | | 0.0 | | | | 0.0 | | | | 0.0 | | | | 0.0 | | | | 0.0 | | | | 0.0 | | | | 0.0 | |
| After | | | 0.0 | | | | 0.0 | | | | 0.0 | | | | 0.0 | | | | 0.0 | | | | 0.0 | | | | 0.0 | | | | 0.0 | |
| Total | | | 0.0 | | | | 0.0 | | | | 0.0 | | | | 0.0 | | | | 0.0 | | | | 0.0 | | | | 0.0 | | | | 0.0 | |
| 4/25/13 | This forecast accompanies the COLLARINI ASSOCIATES report and is subject to its specific conditions. | |
| GLORI HOLDINGS INC. | Etzold Unit Well #1-6 (Phase 2) |
| SHUCK FIELD | Lower Chester Sand |
| | Proved Producing |
| Proj Oil Cum: 0.00 Mbbl | Oil EUR: 0.00 Mbbl |
| Proj Gas Cum: 0.00 MMcf | Gas EUR: 0.00 MMcf |
| Proj Wtr Cum: 825.99 Mbbl | |
PROJECTION OF ESTIMATED PRODUCTION AND REVENUE
SHUCK FIELD GLORI HOLDINGS INC.
AS OF January 01, 2013
Etzold Unit Well #1-6 (Phase 2)
Proved Producing
Lower Chester Sand
| | | | | | | | | | | | Present Worth Profile | | | | |
| | | | | | | | | | | | Mid-Year Discounting | | | | |
| SEC Pricing | | | | | | | | | | | 8.00 | % | | | 0.0 | | | | 25.00 | % | | | 0.0 | |
| | | | | | | | | | | | 10.00 | % | | | 0.0 | | | | 30.00 | % | | | 0.0 | |
| | | | Initial | | | | Final | | | | 12.00 | % | | | 0.0 | | | | 35.00 | % | | | 0.0 | |
| Gross Working Interest | | | 1.000000 | | | | 0.000000 | | | | 15.00 | % | | | 0.0 | | | | 40.00 | % | | | 0.0 | |
| Net Revenue Interest | | | 0.800000 | | | | 0.000000 | | | | 20.00 | % | | | 0.0 | | | | 50.00 | % | | | 0.0 | |
| Year | | | | | | | | | | | Oil | | | Gas | | | NGL | |
| Ending | | Gross | | | GROSS PRODUCTION | | | NET PRODUCTION | | | Price | | | Price | | | Price | |
| 12-31 | | Wells | | | Oil,(Mbbl) | | | Gas,(MMcf) | | | NGL,(Mgal) | | | Oil,(Mbbl) | | | Gas,(MMcf) | | | NGL,(Mgal) | | | ($/bbl) | | | ($/Mcf) | | | ($/gal) | |
| 2013 | | | 0 | | | | 0.0 | | | | 0.0 | | | | 0.00 | | | | 0.0 | | | | 0.0 | | | | 0.00 | | | | 0.00 | | | | 0.00 | | | | 0.00 | |
| After | | | | | | | 0.0 | | | | 0.0 | | | | 0.00 | | | | 0.0 | | | | 0.0 | | | | 0.00 | | | | 0.00 | | | | 0.00 | | | | 0.00 | |
| Remaining | | | | | | | 0.0 | | | | 0.0 | | | | 0.00 | | | | 0.0 | | | | 0.0 | | | | 0.00 | | | | 0.00 | | | | 0.00 | | | | 0.00 | |
| Cumulative | | | | | | | 0.0 | | | | 0.0 | | | | 0.0 | | | | | | | | | | | | | | | | | | | | | | | | | |
| Ultimate | | | | | | | 0.0 | | | | 0.0 | | | | 0.0 | | | | | | | | | | | | | | | | | | | | | | | | | |
| Year | | Net | | | Other | | | Production | | | Operating | | | Exp/Cap | | | Net | | | Cumulative | | | Pres. Worth | |
| Ending | | Sales | | | Revenue | | | Taxes | | | Expense | | | Invest | | | Income | | | Net Income | | | @10.00% | |
| 12-31 | | (M$) | | | (M$) | | | (M$) | | | (M$) | | | (M$) | | | (M$) | | | (M$) | | | (M$) | |
| | | | | | | | | | | | | | | | | | | | | | | | | | | | | | | | | |
| 2013 | | | 0.0 | | | | 0.0 | | | | 0.0 | | | | 0.0 | | | | 0.0 | | | | 0.0 | | | | 0.0 | | | | 0.0 | |
| After | | | 0.0 | | | | 0.0 | | | | 0.0 | | | | 0.0 | | | | 0.0 | | | | 0.0 | | | | 0.0 | | | | 0.0 | |
| Total | | | 0.0 | | | | 0.0 | | | | 0.0 | | | | 0.0 | | | | 0.0 | | | | 0.0 | | | | 0.0 | | | | 0.0 | |
| 4/25/13 | This forecast accompanies the COLLARINI ASSOCIATES report and is subject to its specific conditions. | |
PROJECTION OF ESTIMATED PRODUCTION AND REVENUE
SHUCK FIELD GLORI HOLDINGS INC.
AS OF January 01, 2013
Etzold Unit North Phase 1 LOE
Proved Producing
Lower Chester Sand
SEC Pricing
| | | | | | | | | | | | Present Worth Profile | | | | |
| | | | | | | | | | | | Mid-Year Discounting | | | | |
| | | | | | | | | | | | 8.00 | % | | | -1,497.5 | | | | 25.00 | % | | | -1,036.8 | |
| | | | | | | | | | | | 10.00 | % | | | -1,429.3 | | | | 30.00 | % | | | -941.5 | |
| | | | Initial | | | | Final | | | | 12.00 | % | | | -1,365.5 | | | | 35.00 | % | | | -859.3 | |
| Gross Working Interest | | | 1.000000 | | | | 1.000000 | | | | 15.00 | % | | | -1,277.2 | | | | 40.00 | % | | | -787.9 | |
| Net Revenue Interest | | | 0.800000 | | | | 0.800000 | | | | 20.00 | % | | | -1,147.7 | | | | 50.00 | % | | | -671.4 | |
| Year | | | | | | | | | | | Oil | | | Gas | | | NGL | |
| Ending | | Gross | | | GROSS PRODUCTION | | | NET PRODUCTION | | | Price | | | Price | | | Price | |
| 12-31 | | Wells | | | Oil,(Mbbl) | | | Gas,(MMcf) | | | NGL,(Mgal) | | | Oil,(Mbbl) | | | Gas,(MMcf) | | | NGL,(Mgal) | | | ($/bbl) | | | ($/Mcf) | | | ($/gal) | |
| | | | | | | | | | | | | | | | | | | | | | | | | | | | | | | |
| 2013 | | | 0 | | | | 0.0 | | | | 0.0 | | | | 0.00 | | | | 0.0 | | | | 0.0 | | | | 0.00 | | | | 0.00 | | | | 0.00 | | | | 0.00 | |
| 2014 | | | 0 | | | | 0.0 | | | | 0.0 | | | | 0.00 | | | | 0.0 | | | | 0.0 | | | | 0.00 | | | | 0.00 | | | | 0.00 | | | | 0.00 | |
| 2015 | | | 0 | | | | 0.0 | | | | 0.0 | | | | 0.00 | | | | 0.0 | | | | 0.0 | | | | 0.00 | | | | 0.00 | | | | 0.00 | | | | 0.00 | |
| 2016 | | | 0 | | | | 0.0 | | | | 0.0 | | | | 0.00 | | | | 0.0 | | | | 0.0 | | | | 0.00 | | | | 0.00 | | | | 0.00 | | | | 0.00 | |
| 2017 | | | 0 | | | | 0.0 | | | | 0.0 | | | | 0.00 | | | | 0.0 | | | | 0.0 | | | | 0.00 | | | | 0.00 | | | | 0.00 | | | | 0.00 | |
| 2018 | | | 0 | | | | 0.0 | | | | 0.0 | | | | 0.00 | | | | 0.0 | | | | 0.0 | | | | 0.00 | | | | 0.00 | | | | 0.00 | | | | 0.00 | |
| After | | | 0.0 | | | | 0.0 | | | | 0.00 | | | | 0.0 | | | | 0.0 | | | | 0.00 | | | | 0.00 | | | | 0.00 | | | | 0.00 | |
| Remaining | | | 0.0 | | | | 0.0 | | | | 0.00 | | | | 0.0 | | | | 0.0 | | | | 0.00 | | | | 0.00 | | | | 0.00 | | | | 0.00 | |
| Cumulative | | | 0.0 | | | | 0.0 | | | | 0.0 | | | | | | | | | | | | | | | | | | | | | | | | | |
| Ultimate | | | 0.0 | | | | 0.0 | | | | 0.0 | | | | | | | | | | | | | | | | | | | | | | | | | |
| Year | | Net | | | Other | | | Production | | | Operating | | | Exp/Cap | | | Net | | | Cumulative | | | Pres. Worth | |
| Ending | | Sales | | | Revenue | | | Taxes | | | Expense | | | Invest | | | Income | | | Net Income | | | @10.00% | |
| 12-31 | | (M$) | | | (M$) | | | (M$) | | | (M$) | | | (M$) | | | (M$) | | | (M$) | | | (M$) | |
| | | | | | | | | | | | | | | | | | | | | | | | | | | | | | | | | |
| 2013 | | | 0.0 | | | | 0.0 | | | | 0.0 | | | | 358.3 | | | | 0.0 | | | | -358.3 | | | | -358.3 | | | | -341.1 | |
| 2014 | | | 0.0 | | | | 0.0 | | | | 0.0 | | | | 358.3 | | | | 0.0 | | | | -358.3 | | | | -716.5 | | | | -649.8 | |
| 2015 | | | 0.0 | | | | 0.0 | | | | 0.0 | | | | 358.3 | | | | 0.0 | | | | -358.3 | | | | -1,074.8 | | | | -929.3 | |
| 2016 | | | 0.0 | | | | 0.0 | | | | 0.0 | | | | 358.3 | | | | 0.0 | | | | -358.3 | | | | -1,433.0 | | | | -1,182.3 | |
| 2017 | | | 0.0 | | | | 0.0 | | | | 0.0 | | | | 358.3 | | | | 0.0 | | | | -358.3 | | | | -1,791.3 | | | | -1,411.3 | |
| 2018 | | | 0.0 | | | | 0.0 | | | | 0.0 | | | | 29.9 | | | | 0.0 | | | | -29.9 | | | | -1,821.2 | | | | -1,429.3 | |
| After | | | 0.0 | | | | 0.0 | | | | 0.0 | | | | 0.0 | | | | 0.0 | | | | 0.0 | | | | 0.0 | | | | 0.0 | |
| | | | | | | | | | | | | | | | | | | | | | | | | | | | | | | | | |
| Total | | | 0.0 | | | | 0.0 | | | | 0.0 | | | | 1,821.2 | | | | 0.0 | | | | -1,821.2 | | | | -1,821.2 | | | | -1,429.3 | |
| 4/25/13 | This forecast accompanies the COLLARINI ASSOCIATES report and is subject to its specific conditions. | |
PROJECTION OF ESTIMATED PRODUCTION AND REVENUE
SHUCK FIELD GLORI HOLDINGS INC.
AS OF January 01, 2013
Etzold Unit North Phase 2 LOE
Proved Producing
Lower Chester Sand
| | | | | | | | | | | | Present Worth Profile | | | | |
| SEC Pricing | | | | | | | | | | | Mid-Year Discounting | | | | |
| | | | | | | | | | | | 8.00 | % | | | 0.0 | | | | 25.00 | % | | | 0.0 | |
| | | | | | | | | | | | 10.00 | % | | | 0.0 | | | | 30.00 | % | | | 0.0 | |
| | | | Initial | | | | Final | | | | 12.00 | % | | | 0.0 | | | | 35.00 | % | | | 0.0 | |
| Gross Working Interest | | | 1.000000 | | | | 1.000000 | | | | 15.00 | % | | | 0.0 | | | | 40.00 | % | | | 0.0 | |
| Net Revenue Interest | | | 0.800000 | | | | 0.800000 | | | | 20.00 | % | | | 0.0 | | | | 50.00 | % | | | 0.0 | |
| Year | | | | | | | | | | | Oil | | | Gas | | | NGL | |
| Ending | | Gross | | | GROSS PRODUCTION | | | NET PRODUCTION | | | Price | | | Price | | | Price | |
| 12-31 | | Wells | | | Oil,(Mbbl) | | | Gas,(MMcf) | | | NGL,(Mgal) | | | Oil,(Mbbl) | | | Gas,(MMcf) | | | NGL,(Mgal) | | | ($/bbl) | | | ($/Mcf) | | | ($/gal) | |
| | | | | | | | | | | | | | | | | | | | | | | | | | | | | | | | | | | | | | | | | |
| 2013 | | | 0 | | | | 0.0 | | | | 0.0 | | | | 0.00 | | | | 0.0 | | | | 0.0 | | | | 0.00 | | | | 0.00 | | | | 0.00 | | | | 0.00 | |
| After | | | 0.0 | | | | 0.0 | | | | 0.00 | | | | 0.0 | | | | 0.0 | | | | 0.00 | | | | 0.00 | | | | 0.00 | | | | 0.00 | |
| Remaining | | | 0.0 | | | | 0.0 | | | | 0.00 | | | | 0.0 | | | | 0.0 | | | | 0.00 | | | | 0.00 | | | | 0.00 | | | | 0.00 | |
| Cumulative | | | 0.0 | | | | 0.0 | | | | 0.0 | | | | | | | | | | | | | | | | | | | | | | | | | |
| Ultimate | | | 0.0 | | | | 0.0 | | | | 0.0 | | | | | | | | | | | | | | | | | | | | | | | | | |
| Year | | Net | | | Other | | | Production | | | Operating | | | Exp/Cap | | | Net | | | Cumulative | | | Pres. Worth | |
| Ending | | Sales | | | Revenue | | | Taxes | | | Expense | | | Invest | | | Income | | | Net Income | | | @10.00% | |
| 12-31 | | (M$) | | | (M$) | | | (M$) | | | (M$) | | | (M$) | | | (M$) | | | (M$) | | | (M$) | |
| | | | | | | | | | | | | | | | | | | | | | | | | | | | | | | | | |
| 2013 | | | 0.0 | | | | 0.0 | | | | 0.0 | | | | 0.0 | | | | 0.0 | | | | 0.0 | | | | 0.0 | | | | 0.0 | |
| After | | | 0.0 | | | | 0.0 | | | | 0.0 | | | | 0.0 | | | | 0.0 | | | | 0.0 | | | | 0.0 | | | | 0.0 | |
| | | | | | | | | | | | | | | | | | | | | | | | | | | | | | | | | |
| Total | | | 0.0 | | | | 0.0 | | | | 0.0 | | | | 0.0 | | | | 0.0 | | | | 0.0 | | | | 0.0 | | | | 0.0 | |
| 4/25/13 | This forecast accompanies the COLLARINI ASSOCIATES report and is subject to its specific conditions. | |
PROJECTION OF ESTIMATED PRODUCTION AND REVENUE
GLORI HOLDINGS INC.
AS OF January 01, 2013
| SEC Pricing | | | | | | | | | |
| | | | | | | | | | |
| SHUCK FIELD | | | | | Present Worth Profile | | | | |
| Total | | | | | Mid-Year Discounting | | | | |
| Proved Behind Pipe | | | 8.00 | % | | | 1,675.0 | | | | 25.00 | % | | | 499.9 | |
| | | | 10.00 | % | | | 1,478.7 | | | | 30.00 | % | | | 305.8 | |
| | | | 12.00 | % | | | 1,301.6 | | | | 35.00 | % | | | 153.9 | |
| | | | 15.00 | % | | | 1,067.7 | | | | 40.00 | % | | | 34.9 | |
| | | | 20.00 | % | | | 748.5 | | | | 50.00 | % | | | -131.1 | |
| Year | | | | | | | | | | | Oil | | | Gas | | | NGL | |
| Ending | | Gross | | | GROSS PRODUCTION | | | NET PRODUCTION | | | Price | | | Price | | | Price | |
| 12-31 | | Wells | | | Oil,(Mbbl) | | | Gas,(MMcf) | | | NGL,(Mgal) | | | Oil,(Mbbl) | | | Gas,(MMcf) | | | NGL,(Mgal) | | | ($/bbl) | | | ($/Mcf) | | | ($/gal) | |
| | | | | | | | | | | | | | | | | | | | | | | | | | | | | | | |
| 2013 | | | 2 | | | | 0.0 | | | | 0.0 | | | | 0.00 | | | | 0.0 | | | | 0.0 | | | | 0.00 | | | | 0.00 | | | | 0.00 | | | | 0.00 | |
| 2014 | | | 2 | | | | 8.4 | | | | 0.0 | | | | 0.00 | | | | 6.7 | | | | 0.0 | | | | 0.00 | | | | 88.50 | | | | 0.00 | | | | 0.00 | |
| 2015 | | | 2 | | | | 16.8 | | | | 0.0 | | | | 0.00 | | | | 13.4 | | | | 0.0 | | | | 0.00 | | | | 88.50 | | | | 0.00 | | | | 0.00 | |
| 2016 | | | 2 | | | | 16.8 | | | | 0.0 | | | | 0.00 | | | | 13.4 | | | | 0.0 | | | | 0.00 | | | | 88.50 | | | | 0.00 | | | | 0.00 | |
| 2017 | | | 2 | | | | 16.0 | | | | 0.0 | | | | 0.00 | | | | 12.8 | | | | 0.0 | | | | 0.00 | | | | 88.50 | | | | 0.00 | | | | 0.00 | |
| 2018 | | | 2 | | | | 15.4 | | | | 0.0 | | | | 0.00 | | | | 12.3 | | | | 0.0 | | | | 0.00 | | | | 88.50 | | | | 0.00 | | | | 0.00 | |
| 2019 | | | 2 | | | | 14.7 | | | | 0.0 | | | | 0.00 | | | | 11.8 | | | | 0.0 | | | | 0.00 | | | | 88.50 | | | | 0.00 | | | | 0.00 | |
| 2020 | | | 1 | | | | 5.2 | | | | 0.0 | | | | 0.00 | | | | 4.2 | | | | 0.0 | | | | 0.00 | | | | 88.50 | | | | 0.00 | | | | 0.00 | |
| After | | | 0.0 | | | | 0.0 | | | | 0.00 | | | | 0.0 | | | | 0.0 | | | | 0.00 | | | | 0.00 | | | | 0.00 | | | | 0.00 | |
| Remaining | | | 93.3 | | | | 0.0 | | | | 0.00 | | | | 74.6 | | | | 0.0 | | | | 0.00 | | | | 88.50 | | | | 0.00 | | | | 0.00 | |
| Cumulative | | | 366.4 | | | | 187.3 | | | | 0.0 | | | | | | | | | | | | | | | | | | | | | | | | | |
| Ultimate | | | 459.7 | | | | 187.3 | | | | 0.0 | | | | | | | | | | | | | | | | | | | | | | | | | |
| Year | | Net | | | Other | | | Production | | | Operating | | | Exp/Cap | | | Net | | | Cumulative | | | Pres. Worth | |
| Ending | | Sales | | | Revenue | | | Taxes | | | Expense | | | Invest | | | Income | | | Net Income | | | @10.00% | |
| 12-31 | | (M$) | | | (M$) | | | (M$) | | | (M$) | | | (M$) | | | (M$) | | | (M$) | | | (M$) | |
| | | | | | | | | | | | | | | | | | | | | | | | | |
| 2013 | | | 0.0 | | | | 0.0 | | | | 0.0 | | | | 358.3 | | | | 0.0 | | | | -358.3 | | | | -358.3 | | | | -341.1 | |
| 2014 | | | 596.4 | | | | 0.0 | | | | 47.7 | | | | 358.3 | | | | 720.7 | | | | -530.3 | | | | -888.6 | | | | -830.2 | |
| 2015 | | | 1,187.9 | | | | 0.0 | | | | 95.0 | | | | 358.3 | | | | 0.0 | | | | 734.6 | | | | -153.9 | | | | -258.2 | |
| 2016 | | | 1,186.2 | | | | 0.0 | | | | 94.9 | | | | 358.3 | | | | 0.0 | | | | 733.0 | | | | 579.1 | | | | 259.6 | |
| 2017 | | | 1,134.3 | | | | 0.0 | | | | 90.7 | | | | 358.3 | | | | 0.0 | | | | 685.3 | | | | 1,264.4 | | | | 697.7 | |
| 2018 | | | 1,088.1 | | | | 0.0 | | | | 87.0 | | | | 358.3 | | | | 0.0 | | | | 642.8 | | | | 1,907.2 | | | | 1,069.7 | |
| 2019 | | | 1,044.0 | | | | 0.0 | | | | 83.5 | | | | 358.3 | | | | 0.0 | | | | 602.2 | | | | 2,509.3 | | | | 1,385.2 | |
| 2020 | | | 367.6 | | | | 0.0 | | | | 29.4 | | | | 147.4 | | | | 0.0 | | | | 190.8 | | | | 2,700.1 | | | | 1,478.7 | |
| After | | | 0.0 | | | | 0.0 | | | | 0.0 | | | | 0.0 | | | | 0.0 | | | | 0.0 | | | | 0.0 | | | | 0.0 | |
| Total | | | 6,604.5 | | | | 0.0 | | | | 528.4 | | | | 2,655.3 | | | | 720.7 | | | | 2,700.1 | | | | 2,700.1 | | | | 1,478.7 | |
| 4/25/13 | This forecast accompanies the COLLARINI ASSOCIATES report and is subject to its specific conditions. | |
PROJECTION OF ESTIMATED PRODUCTION AND REVENUE
SHUCK FIELD GLORI HOLDINGS INC.
AS OF January 01, 2013
| Etzold Unit South Well #4-1 (Phase 3) |
| Proved Behind Pipe |
| Lower Chester Sand |
| | | | | | | | | | | | Present Worth Profile | | | | |
| SEC Pricing | | | | | | | | | | | Mid-Year Discounting | | | | |
| | | | | | | | | | | | 8.00 | % | | | 2,322.0 | | | | 25.00 | % | | | 1,136.9 | |
| | | | | | | | | | | | 10.00 | % | | | 2,127.5 | | | | 30.00 | % | | | 932.4 | |
| | | | Initial | | | | Final | | | | 12.00 | % | | | 1,951.2 | | | | 35.00 | % | | | 768.3 | |
| Gross Working Interest | | | 1.000000 | | | | 1.000000 | | | | 15.00 | % | | | 1,716.8 | | | | 40.00 | % | | | 635.7 | |
| Net Revenue Interest | | | 0.800000 | | | | 0.800000 | | | | 20.00 | % | | | 1,393.3 | | | | 50.00 | % | | | 440.2 | |
| Year | | | | | | | | | | | Oil | | | Gas | | | NGL | |
| Ending | | Gross | | | GROSS PRODUCTION | | | NET PRODUCTION | | | Price | | | Price | | | Price | |
| 12-31 | | Wells | | | Oil,(Mbbl) | | | Gas,(MMcf) | | | NGL,(Mgal) | | | Oil,(Mbbl) | | | Gas,(MMcf) | | | NGL,(Mgal) | | | ($/bbl) | | | ($/Mcf) | | | ($/gal) | |
| 2013 | | | 1 | | | | 0.0 | | | | 0.0 | | | | 0.00 | | | | 0.0 | | | | 0.0 | | | | 0.00 | | | | 0.00 | | | | 0.00 | | | | 0.00 | |
| 2014 | | | 1 | | | | 4.3 | | | | 0.0 | | | | 0.00 | | | | 3.5 | | | | 0.0 | | | | 0.00 | | | | 88.50 | | | | 0.00 | | | | 0.00 | |
| 2015 | | | 1 | | | | 9.5 | | | | 0.0 | | | | 0.00 | | | | 7.6 | | | | 0.0 | | | | 0.00 | | | | 88.50 | | | | 0.00 | | | | 0.00 | |
| 2016 | | | 1 | | | | 9.8 | | | | 0.0 | | | | 0.00 | | | | 7.9 | | | | 0.0 | | | | 0.00 | | | | 88.50 | | | | 0.00 | | | | 0.00 | |
| 2017 | | | 1 | | | | 9.5 | | | | 0.0 | | | | 0.00 | | | | 7.6 | | | | 0.0 | | | | 0.00 | | | | 88.50 | | | | 0.00 | | | | 0.00 | |
| 2018 | | | 1 | | | | 9.3 | | | | 0.0 | | | | 0.00 | | | | 7.4 | | | | 0.0 | | | | 0.00 | | | | 88.50 | | | | 0.00 | | | | 0.00 | |
| 2019 | | | 1 | | | | 9.0 | | | | 0.0 | | | | 0.00 | | | | 7.2 | | | | 0.0 | | | | 0.00 | | | | 88.50 | | | | 0.00 | | | | 0.00 | |
| 2020 | | | 0 | | | | 2.9 | | | | 0.0 | | | | 0.00 | | | | 2.3 | | | | 0.0 | | | | 0.00 | | | | 88.50 | | | | 0.00 | | | | 0.00 | |
| After | | | 0.0 | | | | 0.0 | | | | 0.00 | | | | 0.0 | | | | 0.0 | | | | 0.00 | | | | 0.00 | | | | 0.00 | | | | 0.00 | |
| Remaining | | | 54.4 | | | | 0.0 | | | | 0.00 | | | | 43.5 | | | | 0.0 | | | | 0.00 | | | | 88.50 | | | | 0.00 | | | | 0.00 | |
| Cumulative | | | 187.6 | | | | 78.6 | | | | 0.0 | | | | | | | | | | | | | | | | | | | | | | | | | |
| Ultimate | | | 242.0 | | | | 78.6 | | | | 0.0 | | | | | | | | | | | | | | | | | | | | | | | | | |
| Year | | Net | | | Other | | | Production | | | Operating | | | Exp/Cap | | | Net | | | Cumulative | | | Pres. Worth | |
| Ending | | Sales | | | Revenue | | | Taxes | | | Expense | | | Invest | | | Income | | | Net Income | | | @10.00% | |
| 12-31 | | (M$) | | | (M$) | | | (M$) | | | (M$) | | | (M$) | | | (M$) | | | (M$) | | | (M$) | |
| | | | | | | | | | | | | | | | | | | | | | | | | |
| 2013 | | | 0.0 | | | | 0.0 | | | | 0.0 | | | | 0.0 | | | | 0.0 | | | | 0.0 | | | | 0.0 | | | | 0.0 | |
| 2014 | | | 305.7 | | | | 0.0 | | | | 24.5 | | | | 0.0 | | | | 215.4 | | | | 65.9 | | | | 65.9 | | | | 45.8 | |
| 2015 | | | 673.4 | | | | 0.0 | | | | 53.9 | | | | 0.0 | | | | 0.0 | | | | 619.5 | | | | 685.4 | | | | 528.1 | |
| 2016 | | | 696.5 | | | | 0.0 | | | | 55.7 | | | | 0.0 | | | | 0.0 | | | | 640.8 | | | | 1,326.2 | | | | 980.6 | |
| 2017 | | | 675.3 | | | | 0.0 | | | | 54.0 | | | | 0.0 | | | | 0.0 | | | | 621.2 | | | | 1,947.5 | | | | 1,377.7 | |
| 2018 | | | 656.5 | | | | 0.0 | | | | 52.5 | | | | 0.0 | | | | 0.0 | | | | 604.0 | | | | 2,551.4 | | | | 1,727.1 | |
| 2019 | | | 638.2 | | | | 0.0 | | | | 51.1 | | | | 0.0 | | | | 0.0 | | | | 587.1 | | | | 3,138.6 | | | | 2,034.7 | |
| 2020 | | | 205.9 | | | | 0.0 | | | | 16.5 | | | | 0.0 | | | | 0.0 | | | | 189.4 | | | | 3,328.0 | | | | 2,127.5 | |
| After | | | 0.0 | | | | 0.0 | | | | 0.0 | | | | 0.0 | | | | 0.0 | | | | 0.0 | | | | 0.0 | | | | 0.0 | |
| Total | | | 3,851.5 | | | | 0.0 | | | | 308.1 | | | | 0.0 | | | | 215.4 | | | | 3,328.0 | | | | 3,328.0 | | | | 2,127.5 | |
| 4/25/13 | This forecast accompanies the COLLARINI ASSOCIATES report and is subject to its specific conditions. | |
PROJECTION OF ESTIMATED PRODUCTION AND REVENUE
SHUCK FIELD GLORI HOLDINGS INC.
AS OF January 01, 2013
| Etzold Unit South Well #4-1 (Phase 3) |
| Proved Behind Pipe |
| Lower Chester Sand |
| | | | | | | | | | | | Present Worth Profile | | | | |
| SEC Pricing | | | | | | | | | | | Mid-Year Discounting | | | | |
| | | | | | | | | | | | 8.00 | % | | | 1,624.1 | | | | 25.00 | % | | | 801.9 | |
| | | | | | | | | | | | 10.00 | % | | | 1,489.7 | | | | 30.00 | % | | | 658.9 | |
| | | | Initial | | | | Final | | | | 12.00 | % | | | 1,367.7 | | | | 35.00 | % | | | 543.7 | |
| Gross Working Interest | | | 1.000000 | | | | 1.000000 | | | | 15.00 | % | | | 1,205.3 | | | | 40.00 | % | | | 450.3 | |
| Net Revenue Interest | | | 0.800000 | | | | 0.800000 | | | | 20.00 | % | | | 980.6 | | | | 50.00 | % | | | 311.8 | |
| Year | | | | | | | | | | | Oil | | | Gas | | | NGL | |
| Ending | | Gross | | | GROSS PRODUCTION | | | NET PRODUCTION | | | Price | | | Price | | | Price | |
| 12-31 | | Wells | | | Oil,(Mbbl) | | | Gas,(MMcf) | | | NGL,(Mgal) | | | Oil,(Mbbl) | | | Gas,(MMcf) | | | NGL,(Mgal) | | | ($/bbl) | | | ($/Mcf) | | | ($/gal) | |
| | | | | | | | | | | | | | | | | | | | | | | | | | | | | | | |
| 2013 | | | 1 | | | | 0.0 | | | | 0.0 | | | | 0.00 | | | | 0.0 | | | | 0.0 | | | | 0.00 | | | | 0.00 | | | | 0.00 | | | | 0.00 | |
| 2014 | | | 1 | | | | 4.1 | | | | 0.0 | | | | 0.00 | | | | 3.3 | | | | 0.0 | | | | 0.00 | | | | 88.50 | | | | 0.00 | | | | 0.00 | |
| 2015 | | | 1 | | | | 7.3 | | | | 0.0 | | | | 0.00 | | | | 5.8 | | | | 0.0 | | | | 0.00 | | | | 88.50 | | | | 0.00 | | | | 0.00 | |
| 2016 | | | 1 | | | | 6.9 | | | | 0.0 | | | | 0.00 | | | | 5.5 | | | | 0.0 | | | | 0.00 | | | | 88.50 | | | | 0.00 | | | | 0.00 | |
| 2017 | | | 1 | | | | 6.5 | | | | 0.0 | | | | 0.00 | | | | 5.2 | | | | 0.0 | | | | 0.00 | | | | 88.50 | | | | 0.00 | | | | 0.00 | |
| 2018 | | | 1 | | | | 6.1 | | | | 0.0 | | | | 0.00 | | | | 4.9 | | | | 0.0 | | | | 0.00 | | | | 88.50 | | | | 0.00 | | | | 0.00 | |
| 2019 | | | 1 | | | | 5.7 | | | | 0.0 | | | | 0.00 | | | | 4.6 | | | | 0.0 | | | | 0.00 | | | | 88.50 | | | | 0.00 | | | | 0.00 | |
| 2020 | | | 1 | | | | 2.3 | | | | 0.0 | | | | 0.00 | | | | 1.8 | | | | 0.0 | | | | 0.00 | | | | 88.50 | | | | 0.00 | | | | 0.00 | |
| After | | | 0.0 | | | | 0.0 | | | | 0.00 | | | | 0.0 | | | | 0.0 | | | | 0.00 | | | | 0.00 | | | | 0.00 | | | | 0.00 | |
| Remaining | | | 38.9 | | | | 0.0 | | | | 0.00 | | | | 31.1 | | | | 0.0 | | | | 0.00 | | | | 88.50 | | | | 0.00 | | | | 0.00 | |
| Cumulative | | | 178.8 | | | | 108.7 | | | | 0.0 | | | | | | | | | | | | | | | | | | | | | | | | | |
| Ultimate | | | 217.7 | | | | 108.7 | | | | 0.0 | | | | | | | | | | | | | | | | | | | | | | | | | |
| Year | | Net | | | Other | | | Production | | | Operating | | | Exp/Cap | | | Net | | | Cumulative | | | Pres. Worth | |
| Ending | | Sales | | | Revenue | | | Taxes | | | Expense | | | Invest | | | Income | | | Net Income | | | @10.00% | |
| 12-31 | | (M$) | | | (M$) | | | (M$) | | | (M$) | | | (M$) | | | (M$) | | | (M$) | | | (M$) | |
| | | | | | | | | | | | | | | | | | | | | | | | | |
| 2013 | | | 0.0 | | | | 0.0 | | | | 0.0 | | | | 0.0 | | | | 0.0 | | | | 0.0 | | | | 0.0 | | | | 0.0 | |
| 2014 | | | 290.7 | | | | 0.0 | | | | 23.3 | | | | 0.0 | | | | 215.4 | | | | 52.1 | | | | 52.1 | | | | 34.2 | |
| 2015 | | | 514.5 | | | | 0.0 | | | | 41.2 | | | | 0.0 | | | | 0.0 | | | | 473.3 | | | | 525.4 | | | | 403.4 | |
| 2016 | | | 489.7 | | | | 0.0 | | | | 39.2 | | | | 0.0 | | | | 0.0 | | | | 450.5 | | | | 975.9 | | | | 721.6 | |
| 2017 | | | 459.1 | | | | 0.0 | | | | 36.7 | | | | 0.0 | | | | 0.0 | | | | 422.3 | | | | 1,398.3 | | | | 991.7 | |
| 2018 | | | 431.6 | | | | 0.0 | | | | 34.5 | | | | 0.0 | | | | 0.0 | | | | 397.1 | | | | 1,795.3 | | | | 1,221.5 | |
| 2019 | | | 405.8 | | | | 0.0 | | | | 32.5 | | | | 0.0 | | | | 0.0 | | | | 373.3 | | | | 2,168.6 | | | | 1,417.1 | |
| 2020 | | | 161.7 | | | | 0.0 | | | | 12.9 | | | | 0.0 | | | | 0.0 | | | | 148.8 | | | | 2,317.4 | | | | 1,489.7 | |
| After | | | 0.0 | | | | 0.0 | | | | 0.0 | | | | 0.0 | | | | 0.0 | | | | 0.0 | | | | 0.0 | | | | 0.0 | |
| | | | | | | | | | | | | | | | | | | | | | | | | | | | | | | | | |
| Total | | | 2,753.0 | | | | 0.0 | | | | 220.2 | | | | 0.0 | | | | 215.4 | | | | 2,317.4 | | | | 2,317.4 | | | | 1,489.7 | |
| 4/25/13 | This forecast accompanies the COLLARINI ASSOCIATES report and is subject to its specific conditions. | |
PROJECTION OF ESTIMATED PRODUCTION AND REVENUE
SHUCK FIELD GLORI HOLDINGS INC.
AS OF January 01, 2013
Etzold Unit South Phase 3 LOE
Proved Behind Pipe
Lower Chester Sand
| | | | | | | | | | | Present Worth Profile | | | | |
| SEC Pricing | | | | | | | | | | | Mid-Year Discounting | | | | |
| | | | | | | | | | | 8.00 | % | | | -2,271.2 | | | | 25.00 | % | | | -1,438.9 | |
| | | | | | | | | | | | 10.00 | % | | | -2,138.5 | | | | 30.00 | % | | | -1,285.5 | |
| | | | Initial | | | | Final | | | | 12.00 | % | | | -2,017.3 | | | | 35.00 | % | | | -1,158.1 | |
| Gross Working Interest | | | 1.000000 | | | | 1.000000 | | | | 15.00 | % | | | -1,854.4 | | | | 40.00 | % | | | -1,051.2 | |
| Net Revenue Interest | | | 0.800000 | | | | 0.800000 | | | | 20.00 | % | | | -1,625.4 | | | | 50.00 | % | | | -883.2 | |
| Year | | | | | | | | | | | Oil | | | Gas | | | NGL | |
| Ending | | Gross | | | GROSS PRODUCTION | | | NET PRODUCTION | | | Price | | | Price | | | Price | |
| 12-31 | | Wells | | | Oil,(Mbbl) | | | Gas,(MMcf) | | | NGL,(Mgal) | | | Oil,(Mbbl) | | | Gas,(MMcf) | | | NGL,(Mgal) | | | ($/bbl) | | | ($/Mcf) | | | ($/gal) | |
| | | | | | | | | | | | | | | | | | | | | | | | | | | | | | | |
| 2013 | | | 0 | | | | 0.0 | | | | 0.0 | | | | 0.00 | | | | 0.0 | | | | 0.0 | | | | 0.00 | | | | 0.00 | | | | 0.00 | | | | 0.00 | |
| 2014 | | | 0 | | | | 0.0 | | | | 0.0 | | | | 0.00 | | | | 0.0 | | | | 0.0 | | | | 0.00 | | | | 0.00 | | | | 0.00 | | | | 0.00 | |
| 2015 | | | 0 | | | | 0.0 | | | | 0.0 | | | | 0.00 | | | | 0.0 | | | | 0.0 | | | | 0.00 | | | | 0.00 | | | | 0.00 | | | | 0.00 | |
| 2016 | | | 0 | | | | 0.0 | | | | 0.0 | | | | 0.00 | | | | 0.0 | | | | 0.0 | | | | 0.00 | | | | 0.00 | | | | 0.00 | | | | 0.00 | |
| 2017 | | | 0 | | | | 0.0 | | | | 0.0 | | | | 0.00 | | | | 0.0 | | | | 0.0 | | | | 0.00 | | | | 0.00 | | | | 0.00 | | | | 0.00 | |
| 2018 | | | 0 | | | | 0.0 | | | | 0.0 | | | | 0.00 | | | | 0.0 | | | | 0.0 | | | | 0.00 | | | | 0.00 | | | | 0.00 | | | | 0.00 | |
| 2019 | | | 0 | | | | 0.0 | | | | 0.0 | | | | 0.00 | | | | 0.0 | | | | 0.0 | | | | 0.00 | | | | 0.00 | | | | 0.00 | | | | 0.00 | |
| 2020 | | | 0 | | | | 0.0 | | | | 0.0 | | | | 0.00 | | | | 0.0 | | | | 0.0 | | | | 0.00 | | | | 0.00 | | | | 0.00 | | | | 0.00 | |
| After | | | 0.0 | | | | 0.0 | | | | 0.00 | | | | 0.0 | | | | 0.0 | | | | 0.00 | | | | 0.00 | | | | 0.00 | | | | 0.00 | |
| Remaining | | | 0.0 | | | | 0.0 | | | | 0.00 | | | | 0.0 | | | | 0.0 | | | | 0.00 | | | | 0.00 | | | | 0.00 | | | | 0.00 | |
| Cumulative | | | 0.0 | | | | 0.0 | | | | 0.0 | | | | | | | | | | | | | | | | | | | | | | | | | |
| Ultimate | | | 0.0 | | | | 0.0 | | | | 0.0 | | | | | | | | | | | | | | | | | | | | | | | | | |
| Year | | Net | | | Other | | | Production | | | Operating | | | Exp/Cap | | | Net | | | Cumulative | | | Pres. Worth | |
| Ending | | Sales | | | Revenue | | | Taxes | | | Expense | | | Invest | | | Income | | | Net Income | | | @10.00% | |
| 12-31 | | (M$) | | | (M$) | | | (M$) | | | (M$) | | | (M$) | | | (M$) | | | (M$) | | | (M$) | |
| | | | | | | | | | | | | | | | | | | | | | | | | |
| 2013 | | | 0.0 | | | | 0.0 | | | | 0.0 | | | | 358.3 | | | | 0.0 | | | | -358.3 | | | | -358.3 | | | | -341.1 | |
| 2014 | | | 0.0 | | | | 0.0 | | | | 0.0 | | | | 358.3 | | | | 290.0 | | | | -648.3 | | | | -1,006.5 | | | | -910.1 | |
| 2015 | | | 0.0 | | | | 0.0 | | | | 0.0 | | | | 358.3 | | | | 0.0 | | | | -358.3 | | | | -1,364.8 | | | | -1,189.6 | |
| 2016 | | | 0.0 | | | | 0.0 | | | | 0.0 | | | | 358.3 | | | | 0.0 | | | | -358.3 | | | | -1,723.0 | | | | -1,442.6 | |
| 2017 | | | 0.0 | | | | 0.0 | | | | 0.0 | | | | 358.3 | | | | 0.0 | | | | -358.3 | | | | -2,081.3 | | | | -1,671.6 | |
| 2018 | | | 0.0 | | | | 0.0 | | | | 0.0 | | | | 358.3 | | | | 0.0 | | | | -358.3 | | | | -2,439.6 | | | | -1,878.9 | |
| 2019 | | | 0.0 | | | | 0.0 | | | | 0.0 | | | | 358.3 | | | | 0.0 | | | | -358.3 | | | | -2,797.8 | | | | -2,066.6 | |
| 2020 | | | 0.0 | | | | 0.0 | | | | 0.0 | | | | 147.4 | | | | 0.0 | | | | -147.4 | | | | -2,945.3 | | | | -2,138.5 | |
| After | | | 0.0 | | | | 0.0 | | | | 0.0 | | | | 0.0 | | | | 0.0 | | | | 0.0 | | | | 0.0 | | | | 0.0 | |
| | | | | | | | | | | | | | | | | | | | | | | | | | | | | | | | | |
| Total | | | 0.0 | | | | 0.0 | | | | 0.0 | | | | 2,655.3 | | | | 290.0 | | | | -2,945.3 | | | | -2,945.3 | | | | -2,138.5 | |
| 4/25/13 | This forecast accompanies the COLLARINI ASSOCIATES report and is subject to its specific conditions. | |