UNITED STATES
SECURITIES AND EXCHANGE COMMISSION
Washington, DC 20549
FORM N-CSR
CERTIFIED SHAREHOLDER REPORT OF REGISTERED
MANAGEMENT INVESTMENT COMPANY
Investment Company Act file number 811-22942
PMF TEI Fund, L.P.
(Exact name of registrant as specified in charter)
4265 SAN FELIPE, 8TH FLOOR, HOUSTON, TX 77027
(Address of principal executive offices) (Zip code)
| | |
| | With a copy to: |
| John A. Blaisdell | | George J. Zornada |
| The Endowment TEI Fund, L.P. | | K & L Gates LLP |
| 4265 San Felipe, 8th Floor | | State Street Financial Center |
| Houston, TX 77027 | | One Lincoln St. |
| (Name and address of agent for service) | | Boston, MA 02111-2950 |
| | (617) 261-3231 |
Registrant’s telephone number, including area code: 800-725-9456
Date of fiscal year end: 12/31/14
Date of reporting period: 12/31/14
Item 1. Reports to Stockholders.
TABLE OF CONTENTS
PMF Fund, L.P.
Dear PMF Partners:
It has been an eventful year for The PMF Fund, L.P. (the “Fund”)1 and for the core alternative strategies it accesses on behalf of investors. We hope to achieve three objectives with this letter: We will provide a review of the Fund’s private equity performance for the year, recap the restructuring that was put into place last March, and lastly, provide a status on liquidation.
Private Equity Portfolio Performance since Inception
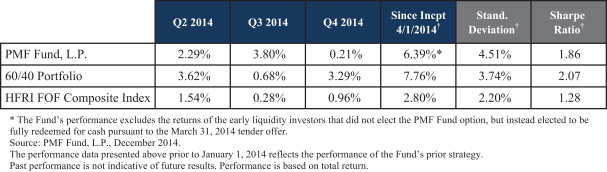
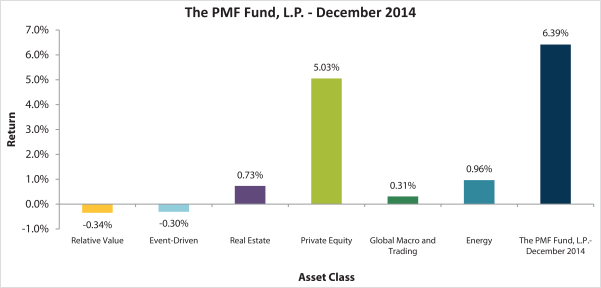
The Fund returned 6.39% in 2014 since inception, which outpaced the HFRI FOF Composite Index by 3.59%. The year’s performance was driven by the second and third quarters with marks of 2.29% and 3.80%, respectively. The mid-year performance was appreciated given the December slow-down surrounding oil’s drop in price and the subsequent market volatility.
The mid-year success is attributed to the Energy and Private Equity asset classes that did well during the summer months surrounding a few successful oil and gas exploration and production IPOs and corresponding asset write-ups. The Private Equity and Energy asset classes added 5.03% and 0.96%, respectively, to the overall portfolio since inception (as a reminder, performance contribution is calculated by multiplying the return of the asset class by its allocation within the portfolio). The Energy asset class drew down 0.97% in December with the increased commodity volatility.
1 The assets represented above were previously held by The Endowment Fund and were allocated to the PMF Fund on its inception date of April 1, 2014.
1
|
|
Source: Endowment Advisers, L.P., December 2014. Past performance is not indicative of future results. Performance is based on total return. |
Fund Split and Liquidation Update
As you may recall, we successfully completed the Investor Choice Plan (the “Plan”) in May of last year, moving your interest in The Endowment Fund to the PMF Fund effective as of April 1, 2014. This process was a long and complex one, and we appreciate your patience as we worked to successfully execute the Plan. As of the effective date of the split, the PMF Fund had over 6,000 investors and a total Net Asset Value of approximately $1.72 billion. We are pleased to report that, as of year-end, the Fund has returned nearly 36% of the 3/31/14 NAV to PMF Fund investors with distributions in excess of $600 million.
The Fund will work to generate cash for distribution to investors in 2015 under the terms of the Plan. The remainder of the liquid hedge fund portfolio is expected to be liquidated over the course of the year, subject to the agreements of the underlying funds, which we believe will help boost distributions in the near term. In addition, we are happy to report that the Fund’s illiquid portfolio has been cash flow positive since the execution of the Plan, meaning it generated distributions in excess of capital calls. We appreciate your patience as the Fund continues to implement the Plan and passes liquidity through to investors from the hedge fund and illiquid portfolios in 2015.
We thank you for your continued support. If you have any questions, please do not hesitate to call our service desk at 1-800-725-9456.
Kindest Regards,
Endowment Advisers, L.P.2
2 This letter is provided solely for informational purposes and is exclusively intended for use by existing Fund investors and/or pre-qualified prospective Fund investors with whom the Fund or an authorized intermediary acting on behalf of the Fund has a pre-existing substantive relationship. No other distribution or use of this newsletter has been authorized. Neither this letter nor the information contained therein constitutes an offer to sell or a solicitation of any offer to buy any securities. Any offering or solicitation will be made only to eligible investors and pursuant to the current version of the applicable Private Placement Memorandum and other governing documents, all of which must be read in their entirety.
2
Report of Independent Registered Public Accounting Firm
The Partners and Board of Directors
PMF TEI Fund, L.P.:
We have audited the accompanying statement of assets, liabilities and partners’ capital of PMF TEI Fund, L.P. (the “TEI Fund”) as of December 31, 2014, and the related statements of operations, changes in partners’ capital and cash flows and the financial highlights for the period March 31, 2014 through December 31, 2014. These financial statements and financial highlights are the responsibility of the TEI Fund’s management. Our responsibility is to express an opinion on these financial statements and financial highlights based on our audit.
We conducted our audit in accordance with the standards of the Public Company Accounting Oversight Board (United States). Those standards require that we plan and perform the audit to obtain reasonable assurance about whether the financial statements and financial highlights are free of material misstatement. An audit includes examining, on a test basis, evidence supporting the amounts and disclosures in the financial statements. An audit also includes assessing the accounting principles used and significant estimates made by management, as well as evaluating the overall financial statement presentation. We believe that our audit provides a reasonable basis for our opinion.
In our opinion, the financial statements and financial highlights referred to above present fairly, in all material respects, the financial position of the TEI Fund as of December 31, 2014, and the results of its operations, changes in its partners’ capital, its cash flows, and the financial highlights for the period March 31, 2014 through December 31, 2014 in conformity with U.S. generally accepted accounting principles.
/s/ KPMG LLP
Columbus, Ohio
March 2, 2015
3
PMF TEI FUND, L.P.
(A Limited Partnership)
Statement of Assets, Liabilities and Partners’ Capital
December 31, 2014
| | | | |
Assets | | | | |
Investment in the Offshore Fund, at fair value | | $ | 376,598,911 | |
Receivable from the Offshore Fund | | | 16,434,211 | |
| | | | |
Total assets | | | 393,033,122 | |
| | | | |
Liabilities and Partners’ Capital | | | | |
Withdrawals payable | | | 16,434,211 | |
Servicing Fees payable | | | 496,141 | |
Accounts payable and accrued expenses | | | 366,344 | |
| | | | |
Total liabilities | | | 17,296,696 | |
| | | | |
Partners’ capital | | | 375,736,426 | |
| | | | |
Total liabilities and partners’ capital | | $ | 393,033,122 | |
| | | | |
See accompanying notes to financial statements.
4
PMF TEI FUND, L.P.
(A Limited Partnership)
Statement of Operations
For the period from March 31, 2014 through December 31, 20141
| | | | |
Net investment loss allocated from the Offshore Fund: | | | | |
Dividend income | | $ | 2,224,643 | |
Interest income | | | 536,110 | |
Dividend income from affiliated investments | | | 848,877 | |
Expenses | | | (9,099,648 | ) |
| | | | |
Net investment loss allocated from the Offshore Fund | | | (5,490,018 | ) |
| | | | |
Expenses of the TEI Fund: | | | | |
Servicing Fees | | | 1,709,270 | |
Professional fees | | | 343,142 | |
Other expenses | | | 80,608 | |
| | | | |
Total expenses of the TEI Fund | | | 2,133,020 | |
| | | | |
Net investment loss of the TEI Fund | | | (7,623,038 | ) |
| | | | |
Net realized and unrealized gain (loss) from investments | | | | |
Net realized gain from investments allocated from the Offshore Fund | | | 45,461,499 | |
Change in unrealized appreciation/depreciation from investments allocated from the Offshore Fund | | | (11,735,300 | ) |
Realized loss from early liquidity offer | | | (65,781,745 | ) |
| | | | |
Net realized and unrealized loss from investments | | | (32,055,546 | ) |
| | | | |
Net decrease in partners’ capital resulting from operations | | $ | (39,678,584 | ) |
| | | | |
| 1 | PMF TEI Fund, L.P. commenced operations on March 31, 2014. |
See accompanying notes to financial statements.
5
PMF TEI FUND, L.P.
(A Limited Partnership)
Statement of Changes in Partners’ Capital
For the period from March 31, 2014 through December 31, 20141
| | | | |
Partners’ capital at March 31, 2014 | | $ | — | |
Transfer of Interests from The Endowment Master Fund, L.P. (Note 1) | | | 882,298,855 | |
Withdrawals | | | (466,883,845 | ) |
Net increase in partners’ capital resulting from operations: | | | | |
Net investment loss | | | (7,623,038 | ) |
Net realized gain from investments allocated from the Master Fund | | | 45,461,499 | |
Change in unrealized appreciation/depreciation from investments allocated from the Master Fund | | | (11,735,300 | ) |
Realized loss from early liquidity offer | | | (65,781,745 | ) |
| | | | |
Net decrease in partners’ capital resulting from operations | | | (39,678,584 | ) |
| | | | |
Partners’ capital at December 31, 2014 | | $ | 375,736,426 | |
| | | | |
| 1 | PMF TEI Fund, L.P. commenced operations on March 31, 2014. |
See accompanying notes to financial statements.
6
PMF TEI FUND, L.P.
(A Limited Partnership)
Statement of Cash Flows
For the period from March 31, 2014 through December 31, 20141
| | | | |
Cash flows from operating activities: | | | | |
Net decrease in partners’ capital resulting from operations | | $ | (39,678,584 | ) |
Adjustments to reconcile net decrease in partners’ capital resulting from operations to net cash provided by operating activities: | | | | |
Net realized and unrealized gain from investments allocated from the Offshore Fund | | | (33,726,199 | ) |
Net investment loss allocated from the Offshore Fund | | | 5,490,018 | |
Realized loss from early liquidity offer | | | 65,781,745 | |
Redemptions from the Offshore Fund | | | 468,154,380 | |
Change in operating assets and liabilities: | | | | |
Receivable from the Offshore Fund | | | (16,434,211 | ) |
Servicing Fees payable | | | 496,141 | |
Accounts payable and accrued expenses | | | 366,344 | |
| | | | |
Net cash provided by operating activities | | | 450,449,634 | |
| | | | |
Cash flows from financing activities: | | | | |
Withdrawals | | | (450,449,634 | ) |
| | | | |
Net cash used in financing activities | | | (450,449,634 | ) |
| | | | |
Net change in cash and cash equivalents | | | — | |
Cash and cash equivalents at beginning of period | | | — | |
| | | | |
Cash and cash equivalents at end of period | | $ | — | |
| | | | |
Supplemental schedule of noncash activity: | | | | |
Transfer of Interests from The Endowment Master Fund, L.P. (Note 1) | | $ | 882,298,855 | |
| 1 | PMF TEI Fund, L.P. commenced operations on March 31, 2014. |
See accompanying notes to financial statements.
7
PMF TEI FUND, L.P.
(A Limited Partnership)
Notes to Financial Statements
December 31, 2014
(1) ORGANIZATION
PMF TEI Fund, L.P. (the “TEI Fund”), a Delaware limited partnership registered under the Investment Company Act of 1940, as amended (the “1940 Act”), commenced operations on March 31, 2014, as a non-diversified, closed-end management investment company. The TEI Fund was created to serve as a feeder fund for PMF TEI Offshore Fund, Ltd. (the “Offshore Fund”), which in turn is a feeder fund for The Endowment PMF Master Fund, L.P. (the “Master Fund”). There are currently three feeder funds (the “Feeder Funds”). For convenience, reference to the TEI Fund may include the Offshore Fund and Master Fund, as the context requires.
The TEI Fund’s investment objective is to manage a portfolio of investment funds including, but not limited to, limited partnerships, limited liability companies, offshore corporations, other foreign investment vehicles (collectively, the “Investment Funds”), and cash to preserve value while prioritizing liquidity to investors over active management, until such time as the Master Fund’s portfolio has been liquidated. The Master Fund holds a portfolio of Investment Funds, reflecting an approximate pro rata division of the portfolio of The Endowment Master Fund, L.P. (the “Legacy Master Fund”), managed in a broad range of investment strategies and asset categories. The Adviser, as hereinafter defined, manages the Master Fund portfolio primarily in a passive manner whereby the Master Fund holds to self-liquidating private equity and other similar illiquid interests in Investment Funds and oversees the liquidation of other Investment Funds that provide for redemption while managing the Master Fund’s cash to ensure the Master Fund has the ability to satisfy outstanding capital commitments relating to such portfolio holdings. The Master Fund’s financial statements, included elsewhere in this report, should be read in conjunction with this report. The Offshore Fund serves solely as an intermediary for the TEI Fund’s investment in the Master Fund. The percentage of the Master Fund’s partnership interests indirectly owned by the TEI Fund on December 31, 2014, was 31.15%.
The Endowment Fund GP, L.P., a Delaware limited partnership, serves as the general partner of the TEI Fund, the Master Fund and the Legacy Master Fund (the “General Partner”). To the fullest extent permitted by applicable law, the General Partner has irrevocably delegated to a board of directors (the “Board” and each member a “Director”) its rights and powers to monitor and oversee the business affairs of the TEI Fund, including the complete and exclusive authority to oversee and establish policies regarding the management, conduct, and operation of the TEI Fund’s business. A majority of the members of the Board are independent of the General Partner and its management. To the extent permitted by applicable law, the Board may delegate any of its rights, powers and authority to, among others, the officers of the TEI Fund, the Adviser, or any committee of the Board.
The Board is authorized to engage an investment adviser and it has selected Endowment Advisers, L.P. (the “Adviser”), to manage the TEI Fund’s portfolio and operations, pursuant to an investment management agreement (the “Investment Management Agreement”). The Adviser is a Delaware limited partnership that is registered as an investment adviser under the Investment Advisers Act of 1940, as amended. Under the Investment Management Agreement, the Adviser is responsible for the establishment of an investment committee, which is responsible for developing, implementing, and supervising the TEI Fund’s investment program subject to the ultimate supervision of the Board. In addition to investment advisory services, the Adviser also functions as the servicing agent of the TEI Fund (the “Servicing Agent”) and as such provides or procures investor services and administrative assistance for the TEI Fund. The Adviser can delegate all or a portion of its duties as Servicing Agent to other parties, who would in turn act as sub-servicing agents.
Under the TEI Fund’s organizational documents, the TEI Fund’s officers and Directors are indemnified against certain liabilities arising out of the performance of their duties to the TEI Fund. In the normal course of
8
PMF TEI FUND, L.P.
(A Limited Partnership)
Notes to Financial Statements, continued
December 31, 2014
business, the TEI Fund enters into contracts with service providers, which also provide for indemnifications by the TEI Fund. The TEI Fund’s maximum exposure under these arrangements is unknown, as this would involve any future potential claims that may be made against the TEI Fund. However, based on experience, the General Partner expects that risk of loss to be remote.
On March 31, 2014 the Master Fund received in an in-kind transfer a portfolio of Investment Funds from the Legacy Master Fund, in exchange for limited partnership interests (the “Interests”) of the Master Fund totaling $1,723,272,229. The transfer was accounted for as a tax-free transaction resulting in Investment Funds transferring to the Master Fund with a total market value of $1,490,836,309, consisting of total cost and accumulated appreciation of $1,317,376,887 and $173,459,422, respectively, and cash and other assets of $232,135,920. Partners in four feeder funds to the Legacy Master Fund elected to transfer $882,298,855 of Interests to the TEI Fund.
(2) SUMMARY OF SIGNIFICANT ACCOUNTING POLICIES AND PRACTICES
(a) BASIS OF ACCOUNTING
The accounting and reporting policies of the TEI Fund conform with U.S. generally accepted accounting principles (“U.S. GAAP”). The accompanying financial statements reflect the financial position of the TEI Fund and the results of its operations. The TEI Fund is an investment company and follows the investment company accounting and reporting guidance under Financial Accounting Standards Board (“FASB”) Accounting Standards Codification (“ASC”) Topic 946, “Financial Services-Investment Companies”.
(b) CASH EQUIVALENTS
The TEI Fund considers all unpledged temporary cash investments with a maturity date at the time of purchase of three months or less to be cash equivalents.
(c) INVESTMENT SECURITIES TRANSACTIONS
The TEI Fund records monthly, its pro-rata share of income, expenses, changes in unrealized appreciation and depreciation, and realized gains and losses derived from the Offshore Fund.
The TEI Fund records investment transactions on a trade-date basis.
Investments that are held by the TEI Fund are marked to fair value at the date of the financial statements, and the corresponding change in unrealized appreciation/depreciation is included in the Statement of Operations.
(d) INVESTMENT VALUATION
The valuation of the TEI Fund’s investments is determined as of the close of business at the end of each reporting period, generally monthly. The valuation of the TEI Fund’s investments is calculated by Citi Fund Services Ohio, Inc., the TEI Fund’s independent administrator (the “Administrator”).
The Board has formed a valuation committee (the “Board Valuation Committee”) that is responsible for overseeing the TEI Fund’s valuation policies, making recommendations to the Board on valuation-related matters, and overseeing implementation by the Adviser of such valuation policies.
The Board has authorized the Adviser to establish a valuation committee of the Adviser (the “Adviser Valuation Committee”). The Adviser Valuation Committee’s function, subject to the oversight of the Board
9
PMF TEI FUND, L.P.
(A Limited Partnership)
Notes to Financial Statements, continued
December 31, 2014
Valuation Committee and the Board, is generally to review valuation methodologies, valuation determinations, and any information provided to the Adviser Valuation Committee by the Adviser or the Administrator.
The TEI Fund invests substantially all of its assets in the Offshore Fund, which in turn invests substantially all of its assets in the Master Fund. Investments in the Master Fund are recorded at fair value based on the TEI Fund’s proportional share of the Master Fund’s partners’ capital, through the Offshore Fund. Valuation of the investments held by the Master Fund is discussed in the Master Fund’s notes to financial statements, included elsewhere in this report.
(e) INVESTMENT INCOME
For investments in securities, dividend income is recorded on the ex-dividend date, net of withholding taxes. Interest income is recorded as earned on the accrual basis and includes amortization of premiums or accretion of discounts.
(f) FUND EXPENSES
Unless otherwise voluntarily or contractually assumed by the Adviser or another party, the TEI Fund bears all expenses incurred in its business, directly or indirectly through its investment in the Master Fund (through the Offshore Fund), including but not limited to, the following: all costs and expenses related to investment transactions and positions for the TEI Fund’s account; legal fees; accounting, auditing and tax preparation fees; recordkeeping and custodial fees; costs of computing the TEI Fund’s net asset value; fees for data and software providers; research expenses; costs of insurance; registration expenses; expenses of meetings of the partners; directors fees; all costs with respect to communications to partners; offshore withholding taxes; and other types of expenses as may be approved from time to time by the Board.
(g) INCOME TAXES
The TEI Fund is organized and operates as a limited partnership and is not subject to income taxes as a separate entity. Such taxes are the responsibility of the individual partners. Accordingly, no provision for income taxes has been made in the TEI Fund’s financial statements. Investments in foreign securities may result in foreign taxes being withheld by the issuer of such securities.
For the current open tax year ended December 31, 2014, and for all major jurisdictions, management of the TEI Fund has evaluated the tax positions taken or expected to be taken in the course of preparing the TEI Fund’s tax returns to determine whether the tax positions will “more-likely-than-not” be sustained by the TEI Fund upon challenge by the applicable tax authority. Tax positions not deemed to meet the more-likely-than-not threshold and that would result in a tax benefit or expense to the TEI Fund would be recorded as a tax benefit or expense in the current period. For the period March 31, 2014 (commencement of operations) through December 31, 2014, the TEI Fund did not recognize any amounts for unrecognized tax benefit/expense. A reconciliation of unrecognized tax benefit/expense is not provided herein, as the beginning and ending amounts of unrecognized tax benefit/expense are zero, with no interim additions, reductions or settlements. Tax positions taken in the current tax year ended December 31, 2014 which remains open under the statute of limitations (generally three years for federal income tax purposes) are subject to examination by federal and state tax jurisdictions.
(h) USE OF ESTIMATES
The financial statements have been prepared in conformity with U.S. GAAP, which requires management to make estimates and assumptions relating to the reported amounts of assets and liabilities and the disclosure of
10
PMF TEI FUND, L.P.
(A Limited Partnership)
Notes to Financial Statements, continued
December 31, 2014
contingent assets and liabilities at the date of the financial statements and the reported amounts of income and expenses during the reporting period. Actual results may differ from those estimates and such differences may be significant.
(3) FAIR VALUE MEASUREMENTS
The TEI Fund records its investment in the Offshore Fund, which in turn invests substantially all of its assets in the Master Fund, at fair value. Investments of the Master Fund are recorded at fair value as more fully discussed in the Master Fund’s notes to financial statements, included elsewhere in this report.
(4) PARTNERS’ CAPITAL ACCOUNTS
(a) ISSUANCE OF INTERESTS
Interests of the TEI Fund are generally available only to those investors who received Interests as in-kind repurchase proceeds for their tendered interests in one of the feeder funds to the Legacy Master Fund. Interests of the TEI Fund will generally not otherwise be offered or sold.
(b) ALLOCATION OF PROFITS AND LOSSES
For each fiscal period, generally monthly, net profits or net losses of the TEI Fund, including allocations from the Master Fund, are allocated among and credited to or debited against the capital accounts of all members as of the last day of each fiscal period in accordance with the members’ respective capital account ownership percentage for the fiscal period. Net profits or net losses are measured as the net change in the value of the net assets of the TEI Fund, including any change in unrealized appreciation or depreciation of investments and income, net of expenses, and realized gains or losses during a fiscal period.
(c) REPURCHASE OF INTERESTS
A partner will not be eligible to have the TEI Fund repurchase all or any portion of an Interest at the partner’s discretion at any time. Interests are not redeemable nor are they exchangeable for Interests or shares of any other fund.
The Master Fund anticipates making quarterly distributions pro rata to all investors in an amount equal to the Master Fund’s excess cash (“Excess Cash”). Excess Cash is defined as the amount of cash on hand over and above the amount necessary or prudent for operational and regulatory purposes (“Required Cash”). The amount of Required Cash is determined by the Adviser with oversight by the Board. Excess Cash is generally distributed in the subsequent quarter or quarters where the aggregate of Excess Cash from such subsequent quarter(s) and prior quarters exceeds a threshold of $10 million. Intra-quarter distributions may also be made if Excess Cash exceeds a threshold of $25 million as of the forty fifth day after the end of any quarter. The Master Fund may make in-kind distributions of portfolio securities as deemed necessary.
(5) INVESTMENTS IN PORTFOLIO SECURITIES
As of December 31, 2014, all of the investments made by the TEI Fund were in the Master Fund (through the Offshore Fund).
11
PMF TEI FUND, L.P.
(A Limited Partnership)
Notes to Financial Statements, continued
December 31, 2014
(6) FINANCIAL INSTRUMENTS WITH OFF-BALANCE SHEET RISK
In the normal course of business, the Investment Funds in which the TEI Fund may invest either directly or through the Offshore Fund and Master Fund may trade various derivative securities and other financial instruments, and enter into various investment activities with off-balance sheet risk both as an investor and as a principal. The TEI Fund’s risk of loss in these Investment Funds is limited to the TEI Fund’s pro rata share of the value of its investment in or commitment to such Investment Funds as held directly or through the Offshore Fund and Master Fund.
(7) ADMINISTRATION AGREEMENT
In consideration for administrative, accounting, and recordkeeping services, the Master Fund pays the Administrator a monthly administration fee based on the month-end partners’ capital of the Master Fund. The Administrator also provides the TEI Fund, the Offshore Fund and the Master Fund with legal, compliance, transfer agency, and other investor related services at an additional cost.
The fees for TEI Fund administration are paid out of the Master Fund’s assets, which decreases the net profits or increases the net losses of the partners in the TEI Fund.
(8) RELATED PARTY TRANSACTIONS
(a) INVESTMENT MANAGEMENT FEE
In consideration of the advisory and other services provided by the Adviser to the Master Fund and the TEI Fund, the Master Fund pays the Adviser an investment management fee (the “Investment Management Fee”) equal to 0.70% on an annualized basis of the Master Fund’s partners’ capital at the end of each month, payable monthly in arrears, for the six quarters following March 31, 2014, and 0.40% on an annualized basis for periods thereafter until the period ending March 31, 2024, when the Adviser will no longer receive the Investment Management Fee.
The TEI Fund’s partners bear an indirect portion of the Investment Management Fee paid by the Master Fund. The Investment Management Fee decreases the net profits or increases the net losses of the Master Fund and indirectly the TEI Fund as the fees reduce the capital accounts of the Master Fund’s partners.
(b) SERVICING FEE
In consideration for providing or procuring investor services and administrative assistance to the TEI Fund, the Adviser receives a servicing fee (the “Servicing Fee”) equal to 0.50% (on an annualized basis) of each partner’s capital account balance, calculated at the end of each month, payable quarterly in arrears, for the six quarters following March 31, 2014, and 0.40% (on an annualized basis) for periods thereafter until the period ending March 31, 2024, when the Adviser will no longer receive a Servicing Fee.
The Adviser may engage one or more sub-servicing agents to provide some or all of the services. Compensation to any sub-servicing agent is paid by the Adviser. The Adviser or its affiliates also may pay a fee out of their own resources to sub-servicing agents.
For the period March 31, 2014 (commencement of operations) through December 31, 2014, $1,709,270 was incurred for Servicing Fees.
12
PMF TEI FUND, L.P.
(A Limited Partnership)
Notes to Financial Statements, continued
December 31, 2014
(9) FINANCIAL HIGHLIGHTS
| | | | |
| | | For the period from
March 31, 2014 through
December 31, 20141 | |
Net investment loss to average partners’ capital2 | | | (2.11 | )% |
Expenses to average partners’ capital2 | | | 3.10 | % |
Portfolio turnover3 | | | 5.28 | % |
Internal rate of return since inception4 | | | (9.73 | )% |
Partners’ capital, end of period (000s) | | $ | 375,736 | |
An investor’s return (and operating ratios) may vary from those reflected based on the timing of capital transactions.
| 1 | The PMF TEI Fund, L.P. commenced operations on March 31, 2014. |
| 2 | Ratios are calculated by dividing the indicated amount by average partners’ capital measured at the end of each month during the period. Ratios include allocations of net investment loss and expenses from the Offshore Fund and the Master Fund. These ratios have been annualized for periods less than twelve months. |
| 3 | The TEI Fund is invested exclusively in the Offshore Fund which in turn is invested solely in the Master Fund, therefore this ratio reflects the portfolio turnover of the Master Fund, which is for the period indicated. |
| 4 | The internal rate of return since inception (“IRR”) of the limited partners is net of all fees and profit allocations to the Adviser. The IRR was computed based on the actual dates of the cash inflows (capital contributions), cash outflows (cash distributions), and the ending partners’ capital as of December 31, 2014 (the residual value). The IRR reported is for the PMF TEI Fund as a whole, which includes the early liquidity discount that was specifically allocated only to those investors that did not elect the PMF TEI Fund option but instead elected to be fully redeemed for cash pursuant to the March 31, 2014 tender offer. The IRR for investors who remained invested in the PMF TEI Fund is 8.91%. The IRR reported for the Master Fund is 8.89%. |
The total return of the TEI Fund for the period March 31, 2014 through December 31, 2014 is (2.43)% and is calculated as geometrically linked monthly returns for each month in the period. Total return is not annualized for periods less than twelve months.
(10) SUBSEQUENT EVENTS
Management of the TEI Fund has evaluated the need for additional disclosures and/or adjustments resulting from subsequent events through the date the financial statements were issued. Based on this evaluation, no adjustments were required to the financial statements as of December 31, 2014.
13
PMF TEI FUND, L.P.
(A Limited Partnership)
Supplemental Information
December 31, 2014
(Unaudited)
Directors and Officers
The TEI Fund’s operations are managed under the direction and oversight of the Board. Each Director serves for an indefinite term or until he or she reaches mandatory retirement, if any, as established by the Board. The Board appoints the officers of the TEI Fund who are responsible for the TEI Fund’s day-to-day business decisions based on policies set by the Board. The officers serve at the pleasure of the Board.
Compensation for Directors
The Endowment PMF Master Fund, L.P., PMF Fund, L.P., and PMF TEI Fund, L.P., together pay each of the Directors who is not an “interested person” of the Adviser, as defined in the 1940 Act (the “Independent Directors”) an annual retainer of $12,500 paid quarterly, an annual Board meeting fee of $4,500, a fee of $1,500 for each informal Board meeting or telephonic Board meeting, annual fees of $625, $625, and $833 for membership on the Audit, Valuation and Compliance Committees, respectively paid quarterly, annual fees of $3,000, $4,000 and $3,000 for the Audit, Valuation and Compliance Committee chair positions, respectively paid quarterly, and an annual fee of $5,000 to the Lead Independent Director, paid quarterly. There are currently four Independent Directors. In the interest of retaining Independent Directors of the highest quality, the Board intends to periodically review such compensation and may modify it as the Board deems appropriate.
Interested Directors
| | | | | | | | |
| Name, Address and Age | | Position(s)
Held | | Principal
Occupation(s) During
the Past 5 Years | | Number of
Portfolios
in Fund
Complex
Overseen by Director | | Other
Directorships
Held by
Director |
John A. Blaisdell1 Age: 54 Address: c/o The Endowment PMF Fund 4265 San Felipe, Suite 800,
Houston, TX 77027 | | Director,
Principal
Executive
Officer
(Since
2004) | | Member,
Investment
Committee
of the
Adviser,
since 2002;
Managing
Director of
Salient,
since 2002. | | The Endowment PMF Funds (3); The Endowment Funds (5) | | Salient Alternative Strategies Funds (investment companies) (two funds) since 2010; Salient MF Trust (investment company) (seven funds) since 2012; Salient Midstream & MLP Fund (investment company) since 2012. |
| 1 | This person’s status as an “interested” director arises from his affiliation with Salient Partners, L.P., which itself is an affiliate of the Master Fund, PMF Fund, L.P., PMF TEI Fund, L.P., and the Adviser. |
14
PMF TEI FUND, L.P.
(A Limited Partnership)
Supplemental Information, continued
December 31, 2014
(Unaudited)
Independent Directors
| | | | | | | | |
| Name, Address and Age | | Position(s)
Held | | Principal
Occupation(s) During
the Past 5 Years | | Number of
Portfolios
in Fund
Complex
Overseen
by Director | | Other
Directorships
Held by
Director |
Jonathan P. Carroll Age: 53 Address: c/o The Endowment PMF Fund 4265 San Felipe, Suite 800,
Houston, TX 77027 | | Director
(Since
2004) | | President of
Lazarus
Financial LLC
(holding
company)
since 2006;
private
investor for the
past six years. | | The Endowment PMF Funds (3); The Endowment Funds (5) | | Salient Alternative
Strategies Funds
(investment
companies)
(two funds)
since 2010;
Salient MF Trust
(investment
company) (seven
funds) since 2012;Salient Midstream
& MLP Fund
(investment
company)
since 2012; LRR
Energy, L.P.
(energy company)
since 2014; |
Richard C. Johnson Age: 77 Address: c/o The Endowment PMF Fund 4265 San Felipe, Suite 800, Houston, TX 77027 | | Director
(Since
2004) | | Senior Counsel
(retired) for
Baker Botts LLP
(law firm)
since 2002;
Managing
Partner,
Baker Botts,
1998 to 2002;
practiced law
at Baker Botts,
1966 to 2002
(1972 to 2002
as a partner). | | The Endowment PMF Funds (3); The Endowment Funds (5) | | Salient Alternative
Strategies Funds
(investment
companies) (two
funds) since 2010;
Salient MF Trust
(investment
company) (seven
funds) since 2012;Salient Midstream
& MLP Fund
(investment
company)
since 2012. |
15
PMF TEI FUND, L.P.
(A Limited Partnership)
Supplemental Information, continued
December 31, 2014
(Unaudited)
| | | | | | | | |
| Name, Address and Age | | Position(s)
Held | | Principal
Occupation(s) During
the Past 5 Years | | Number of
Portfolios
in Fund
Complex
Overseen
by Director | | Other
Directorships
Held by
Director |
G. Edward Powell Age: 78 Address: c/o The Endowment PMF Fund 4265 San Felipe, Suite 800, Houston, TX 77027 | | Director
(Since
2004) | | Principal of
Mills & Stowell
(private equity)
since 2002.
Principal,
Innovation
Growth Partners
(consulting),
since 2002;
Consultant to
emerging and
middle market
businesses,
1994-2002;
Managing Partner,
PriceWaterhouse
& Co.
(Houston Office,
1982 to 1994). | | The Endowment PMF Funds (3); The Endowment Funds (5) | | Salient Alternative
Strategies Funds
(investment
companies) (two
funds) since 2010;
Salient MF Trust
(investment
company)
(seven funds)
since 2012;Salient Midstream
& MLP Fund
(investment
company)
since 2012;
Energy Services
International, Inc.,
since 2004;
Therapy Track,
LLC, since 2009;
Global Water
Technologies,
Inc.; Datavox
Holdings, Inc.;
Energy Services
International, Inc.,
2004 to 2013. |
16
PMF TEI FUND, L.P.
(A Limited Partnership)
Supplemental Information, continued
December 31, 2014
(Unaudited)
| | | | | | | | |
| Name, Address and Age | | Position(s)
Held | | Principal
Occupation(s) During
the Past 5 Years | | Number of
Portfolios
in Fund
Complex
Overseen
by Director | | Other
Directorships
Held by
Director |
Scott E. Schwinger Age: 49 Address: c/o The Endowment PMF Fund 4265 San Felipe, Suite 800, Houston, TX 77027 | | Director
(Since
2004) | | President,
The McNair
Group
(management),
since 2006;
Senior Vice
President and
Chief Financial
Officer,
the Houston
Texans
(professional
football team)
(1999). | | The Endowment PMF Funds (3); The Endowment Funds (5) | | Salient Alternative
Strategies Funds
(investment
companies)
(two funds)
since 2010;
Salient MF Trust
(investment
company)
(seven funds)
since 2012;
Salient Midstream
& MLP Fund
(investment
company)
since 2012;
The Make-A-Wish
Foundation,
since 2008; YES
Prep Public
Schools,
since 2001. |
17
PMF TEI FUND, L.P.
(A Limited Partnership)
Supplemental Information, continued
December 31, 2014
(Unaudited)
Officers of the Fund Who Are Not Directors
| | | | |
| Name, Address and Age | | Position(s) Held with the Fund | | Principal Occupation(s) During the
Past 5 Years |
Paul Bachtold Age: 41 Address: c/o The Endowment PMF Fund
4265 San Felipe, Suite 800,
Houston, TX 77027 | | Chief Compliance Officer (“CCO”) (Since 2010) | | CCO, Salient (since 2010); Consultant, Chicago Investment Group (compliance consulting), 2009-2010; US Compliance Manager, Barclays Global Investors, 2005-2008; Consultant, Wells Fargo Bank, 2000-2005. |
John E. Price Age: 47 Address: c/o The Endowment PMF Fund
4265 San Felipe, Suite 800,
Houston, TX 77027 | | Treasurer; Principal Financial Officer (Since 2004) | | Partner, Managing Director and Chief Financial Officer of Salient since 2003. |
Jeremy Radcliffe Age: 40 Address: c/o The Endowment PMF Fund
4265 San Felipe, Suite 800,
Houston, TX 77027 | | Secretary (Since 2013) | | Managing Director of Salient, since 2002. |
18
PMF TEI FUND, L.P.
(A Limited Partnership)
Supplemental Information, continued
December 31, 2014
(Unaudited)
Allocation of Investments
The following chart indicates the allocation of investments among the asset classes in the Master Fund as of December 31, 2014.
| | | | | | | | |
Asset Class1 | | Fair Value | | | % | |
Consumer Products | | $ | 812,919 | | | | 0.07 | |
Energy | | | 190,662,879 | | | | 17.14 | |
Event-Driven | | | 52,475,970 | | | | 4.72 | |
Global Macro and Trading | | | 31,361,345 | | | | 2.82 | |
Healthcare | | | 60,672 | | | | 0.01 | |
Private Equity | | | 629,657,570 | | | | 56.58 | |
Real Estate | | | 135,139,954 | | | | 12.15 | |
Relative Value | | | 70,709,845 | | | | 6.36 | |
Technology | | | 1,626,395 | | | | 0.15 | |
| | | | | | | | |
Total Investments | | $ | 1,112,507,549 | | | | 100.00 | |
| | | | | | | | |
| 1 | The complete list of investments is included in the Schedule of Investments of the Master Fund, which is included elsewhere in this report. |
Form N-Q Filings
The TEI Fund files a complete schedule of portfolio holdings with the Securities and Exchange Commission for the first and third quarters of each fiscal year on Form N-Q. The TEI Fund’s Form N-Q is available on the Securities and Exchange Commission website at http://www.sec.gov. The TEI Fund’s Form N-Q may be reviewed and copied at the Securities and Exchange Commission Public Reference Room in Washington, DC and information regarding operation of the Public Reference Room may be obtained by calling 1-800-SEC-0330.
Proxy Voting Policies
A description of the policies and procedures that the TEI Fund uses to determine how to vote proxies relating to portfolio securities is available (i) without charge, upon request, by calling 1-800-725-9456; and (ii) on the Securities and Exchange Commission website at http://www.sec.gov.
Information regarding how the TEI Fund voted proxies relating to portfolio securities during the period ended June 30, 2014 is available (i) without charge, upon request, by calling 1-800-725-9456; and (ii) on the Securities and Exchange Commission website at http://www.sec.gov.
Additional Information
The TEI Fund’s private placement memorandum (the “PPM”) includes additional information about Directors of the TEI Fund. The PPM is available, without charge, upon request by calling 1-800-725-9456.
19
PMF TEI FUND, L.P.
(A Limited Partnership)
Privacy Policy (Unaudited)
The TEI Fund recognizes the importance of securing personal financial information. It is our policy to safeguard any personal and financial information that may be entrusted to us. The following is a description of the TEI Fund’s policy regarding disclosure of nonpublic personal information.
We collect nonpublic personal information as follows:
We collect information about our investors, including, but not limited to, the investor’s name, address, telephone number, e-mail address, social security number and date of birth. We collect that information from subscription agreements, other forms of correspondence that we receive from investors, from personal conversations and from affiliated entities as permitted by law.
We receive information about investor transactions with us, including, but not limited to, account number, account balance, investment amounts, withdrawal amounts and other financial information.
We are permitted by law to disclose nonpublic information we collect, as described above, to the TEI Fund’s service providers, including the TEI Fund’s investment adviser, sub-advisers, servicing agent, independent administrator, custodian, legal counsel, accountant and auditor. We do not disclose any nonpublic information about our current or former investors to nonaffiliated third parties, except as required or permitted by law. We restrict access to investor nonpublic personal information to those persons who require such information to provide products or services to investors. We maintain physical, electronic and procedural safeguards that comply with federal standards to guard investors’ nonpublic personal information.
If an investor’s investment relationship with the TEI Fund involves a financial intermediary, including, but not limited to, a broker-dealer, bank or trust company, the privacy policy of such investor’s financial intermediary would govern how any nonpublic personal information would be shared by them with nonaffiliated third parties.
20
the
ENDOWMENT FUND
The Endowment PMF Master Fund, L.P.
Shareholder Report
December 31, 2014
Report of Independent Registered Public Accounting Firm
The Partners and Board of Directors
The Endowment PMF Master Fund, L.P.:
We have audited the accompanying statement of assets, liabilities and partners’ capital of The Endowment PMF Master Fund, L.P. (the “PMF Master Fund”), including the schedule of investments, as of December 31, 2014, and the related statements of operations, changes in partners’ capital and cash flows and the financial highlights for the period March 31, 2014 through December 31, 2014. These financial statements and financial highlights are the responsibility of the PMF Master Fund’s management. Our responsibility is to express an opinion on these financial statements and financial highlights based on our audit.
We conducted our audit in accordance with the standards of the Public Company Accounting Oversight Board (United States). Those standards require that we plan and perform the audit to obtain reasonable assurance about whether the financial statements and financial highlights are free of material misstatement. An audit includes examining, on a test basis, evidence supporting the amounts and disclosures in the financial statements. Our procedures included confirmation of securities owned as of December 31, 2014, by correspondence with custodians and investees; or other appropriate auditing procedures. An audit also includes assessing the accounting principles used and significant estimates made by management, as well as evaluating the overall financial statement presentation. We believe that our audit provides a reasonable basis for our opinion.
In our opinion, the financial statements and financial highlights referred to above present fairly, in all material respects, the financial position of the PMF Master Fund as of December 31, 2014, and the results of its operations, changes in its partners’ capital, its cash flows, and the financial highlights for the period March 31, 2014 through December 31, 2014 in conformity with U.S. generally accepted accounting principles.
/s/ KPMG LLP
Columbus, Ohio
March 2, 2015
22
THE ENDOWMENT PMF MASTER FUND, L.P.
(A Limited Partnership)
Statement of Assets, Liabilities and Partners’ Capital
December 31, 2014
| | | | |
Assets | | | | |
Investments in Investment Funds, at fair value (Cost $564,251,121) | | $ | 676,934,615 | |
Investments in affiliated Investment Funds, at fair value (Cost $408,805,169) | | | 433,072,948 | |
Investments in securities, at fair value (Cost $3,452,069) | | | 2,499,986 | |
| | | | |
Total investments | | | 1,112,507,549 | |
Cash and cash equivalents | | | 112,149,537 | |
Foreign currency, at value (Cost $3,725,213) | | | 3,449,077 | |
Receivable from affiliate | | | 458,791 | |
Receivable from investments sold | | | 36,557,663 | |
Receivable from affiliated investments sold | | | 36,602 | |
Prepaids and other assets | | | 84,926 | |
| | | | |
Total assets | | | 1,265,244,145 | |
| | | | |
Liabilities and Partners’ Capital | | | | |
Withdrawals payable | | | 52,664,805 | |
Investment Management Fees payable | | | 2,234,666 | |
Offshore withholding tax payable | | | 347,732 | |
Administration fees payable | | | 126,270 | |
Payable to Adviser | | | 11,570 | |
Accounts payable and accrued expenses | | | 931,450 | |
| | | | |
Total liabilities | | | 56,316,493 | |
| | | | |
Partners’ capital | | | 1,208,927,652 | |
| | | | |
Total liabilities and partners’ capital | | $ | 1,265,244,145 | |
| | | | |
See accompanying notes to financial statements.
23
THE ENDOWMENT PMF MASTER FUND, L.P.
(A Limited Partnership)
Schedule of Investments
December 31, 2014
| | | | | | | | | | |
| | | Shares | | | Fair
Value | | | % of
Partners’
Capital |
| | | | | | | | | | |
Investments in Investment Funds |
Limited Partnerships, Exempted Limited Partnerships and Limited Liability Companies | | | | | | | | | | |
Cayman Islands | | | | | | | | | | |
Energy (2.16% of Partners’ Capital) | | | | | | | | | | |
Sentient Global Resources Fund III, L.P. | | | | | | $ | 18,206,301 | | | |
Sentient Global Resources Fund IV, L.P. | | | | | | | 7,904,655 | | | |
Private Equity (22.88% of Partners’ Capital) | | | | | | | | | | |
ABRY Advanced Securities Fund, L.P. | | | | | | | 478,424 | | | |
CX Partners Fund Ltd(1)(2) | | | | | | | 21,562,954 | | | |
Gavea Investment Fund II A, L.P. | | | | | | | 1,279,963 | | | |
Gavea Investment Fund III A, L.P. | | | | | | | 18,734,401 | | | |
Hillcrest Fund, L.P.(2) | | | | | | | 10,268,306 | | | |
India Asset Recovery Fund L.P. | | | | | | | 216,211 | | | |
J.C. Flowers III LP(1) | | | | | | | 12,419,643 | | | |
LC Fund IV, L.P.(1)(2) | | | | | | | 19,930,273 | | | |
New Horizon Capital III, L.P.(1) | | | | | | | 25,852,471 | | | |
Northstar Equity Partners III | | | | | | | 6,419,030 | | | |
Orchid Asia IV, L.P.(1) | | | | | | | 7,368,402 | | | |
Reservoir Capital Partners (Cayman), L.P. | | | | | | | 12,009,684 | | | |
Tiger Global Private Investment Partners IV, L.P. | | | | | | | 10,503,255 | | | |
Tiger Global Private Investment Partners V, L.P.(1) | | | | | | | 47,085,214 | | | |
Tiger Global Private Investment Partners VI, L.P. | | | | | | | 12,308,534 | | | |
Trustbridge Partners II, L.P.(1) | | | | | | | 17,000,000 | | | |
Trustbridge Partners III, L.P.(2) | | | | | | | 38,448,676 | | | |
Trustbridge Partners IV, L.P.(1) | | | | | | | 14,756,415 | | | |
Real Estate (1.63% of Partners’ Capital) | | | | | | | | | | |
Forum European Realty Income III, L.P.(1) | | | | | | | 9,859,606 | | | |
Phoenix Asia Real Estate Investments II, L.P. | | | | | | | 8,449,221 | | | |
Phoenix Real Estate Fund (T) L.P.(2) | | | | | | | 1,383,806 | | | |
Relative Value (0.00% of Partners’ Capital) | | | | | | | | | | |
Montrica Global Opportunities Fund | | | 1,092 | | | | 12,585 | | | |
| | | | | | | | | | |
Total Cayman Islands | | | | | | | 322,458,030 | | | |
| | | | | | | | | | |
Guernsey | | | | | | | | | | |
Private Equity (0.45% of Partners’ Capital) | | | | | | | | | | |
Mid Europa Fund III LP(1) | | | | | | | 5,490,963 | | | |
| | | | | | | | | | |
Total Guernsey | | | | | | | 5,490,963 | | | |
| | | | | | | | | | |
United Kingdom | | | | | | | | | | |
Private Equity (0.39% of Partners’ Capital) | | | | | | | | | | |
Darwin Private Equity I L.P.(1) | | | | | | | 4,670,208 | | | |
See accompanying notes to financial statements.
24
THE ENDOWMENT PMF MASTER FUND, L.P.
(A Limited Partnership)
Schedule of Investments, continued
December 31, 2014
| | | | | | | | | | |
| | | Shares | | | Fair
Value | | | % of
Partners’
Capital |
| | | | | | | | | | |
Limited Partnerships, Exempted Limited Partnerships and Limited Liability Companies (continued) | | | | | | | | | | |
United Kingdom (continued) | | | | | | | | | | |
Real Estate (0.44% of Partners’ Capital) | | | | | | | | | | |
Benson Elliott Real Estate Partners II, L.P.(1) | | | | | | $ | 1,064,718 | | | |
Patron Capital, L.P. II(1) | | | | | | | 304,624 | | | |
Patron Capital, L.P. III | | | | | | | 3,973,485 | | | |
| | | | | | | | | | |
Total United Kingdom | | | | | | | 10,013,035 | | | |
| | | | | | | | | | |
United States | | | | | | | | | | |
Energy (13.52% of Partners’ Capital) | | | | | | | | | | |
ArcLight Energy Partners Fund IV, L.P(1) | | | | | | | 3,091,633 | | | |
ArcLight Energy Partners Fund V, L.P.(1) | | | | | | | 5,232,280 | | | |
CamCap Resources, L.P. | | | | | | | 102,281 | | | |
EnCap Energy Capital Fund VII-B LP(1) | | | | | | | 3,175,286 | | | |
EnCap Energy Infrastructure TE Feeder, L.P.(1)(2) | | | | | | | 3,765,890 | | | |
Energy & Minerals Group Fund II, L.P.(1) | | | | | | | 14,907,690 | | | |
Intervale Capital Fund, L.P.(1) | | | | | | | 5,186,444 | | | |
Merit Energy Partners G, L.P. | | | | | | | 15,244,062 | | | |
Midstream & Resources Follow-On Fund, L.P.(1)(2) | | | | | | | 31,689,803 | | | |
NGP Energy Technology Partners II, L.P. | | | | | | | 5,770,125 | | | |
NGP IX Offshore Fund, L.P.(1) | | | | | | | 13,176,429 | | | |
NGP Midstream & Resources, L.P.(1) | | | | | | | 18,082,959 | | | |
Quantum Parallel Partners V, L.P.(2) | | | | | | | 35,665,667 | | | |
Tenaska Power Fund II-A, L.P.(1)(2) | | | | | | | 8,319,874 | | | |
Event-Driven (4.34% of Partners’ Capital) | | | | | | | | | | |
BDCM Partners I, L.P. | | | | | | | 22,100,410 | | | |
Credit Distressed Blue Line Fund, L.P.(3) | | | | | | | 8,864,067 | | | |
Fortelus Special Situations Fund LP(2) | | | | | | | 2,954,885 | | | |
Halcyon European Structured Opportunities Fund L.P.(3) | | | | | | | 54,726 | | | |
Harbinger Capital Partners Fund I, L.P.(3) | | | | | | | 14,495,648 | | | |
Harbinger Capital Partners Fund II, L.P. | | | | | | | 994,976 | | | |
Harbinger Capital Partners Special Situations Fund, L.P. | | | | | | | 753,627 | | | |
Harbinger Class L Holdings (U.S.), LLC | | | | | | | 93,578 | | | |
Harbinger Class LS Holdings (U.S.) Trust | | | 3,225 | | | | — | | | |
Harbinger Class PE Holdings (U.S.) Trust | | | 6 | | | | 1,075,004 | | | |
Prospect Harbor Credit Partners LP | | | | | | | 1,089,049 | | | |
Global Macro and Trading (2.59% of Partners’ Capital) | | | | | | | | | | |
Blueshift Energy Fund, LP(3) | | | | | | | 31,172,637 | | | |
Passport Global Strategies III Ltd.(2) | | | 1,896 | | | | 188,708 | | | |
See accompanying notes to financial statements.
25
THE ENDOWMENT PMF MASTER FUND, L.P.
(A Limited Partnership)
Schedule of Investments, continued
December 31, 2014
| | | | | | | | | | |
| | | Shares | | | Fair
Value | | | % of
Partners’
Capital |
| | | | | | | | | | |
Limited Partnerships, Exempted Limited Partnerships and Limited Liability Companies (continued) | | | | | | | | | | |
United States (continued) | | | | | | | | | | |
Private Equity (28.32% of Partners’ Capital) | | | | | | | | | | |
Advent Latin American Private Equity Fund IV-F L.P. | | | | | | $ | 3,487,646 | | | |
Advent Latin American Private Equity Fund V-F L.P. | | | | | | | 9,580,960 | | | |
BDCM Opportunity Fund II, L.P.(1) | | | | | | | 9,564,501 | | | |
Black River Commodity Multi-Strategy Fund LLC | | | | | | | 485,727 | | | |
Capital Royalty Partners LP(1) | | | | | | | 805,192 | | | |
Catterton Growth Partners, L.P. | | | | | | | 14,547,613 | | | |
CCM Small Cap Value Qualified Fund, L.P.(3) | | | | | | | 1,597,648 | | | |
Chrysalis Ventures III, L.P. | | | | | | | 1,982,290 | | | |
Crosslink Crossover Fund IV, L.P.(2) | | | | | | | 673,237 | | | |
Crosslink Crossover Fund V, L.P. | | | | | | | 3,984,018 | | | |
Crosslink Crossover Fund VI, L.P. | | | | | | | 16,127,216 | | | |
Dace Ventures I, LP(2) | | | | | | | 1,191,236 | | | |
Fairhaven Capital Partners, L.P. | | | | | | | 7,339,872 | | | |
Founders Fund III, LP | | | | | | | 19,745,163 | | | |
Founders Fund IV, LP | | | | | | | 17,490,162 | | | |
Garrison Opportunity Fund II A LLC | | | | | | | 11,529,201 | | | |
Garrison Opportunity Fund LLC(2) | | | | | | | 12,618,494 | | | |
HealthCor Partners Fund, L.P.(2) | | | | | | | 8,050,383 | | | |
Highland Credit Strategies Liquidation Vehicle Onshore | | | | | | | 1,674,178 | | | |
Ithan Creek Partners, L.P. | | | | | | | 9,630,510 | | | |
Kior Shares Liquidating Capital Account | | | | | | | — | | | |
L-R Global Partners, L.P. | | | | | | | 342,018 | | | |
MatlinPatterson Global Opportunities Partners III L.P.(1) | | | | | | | 8,296,362 | | | |
Middle East North Africa Opportunities Fund, L.P.(1)(3) | | | 3,969 | | | | 675,206 | | | |
Monomoy Capital Partners II, L.P. | | | | | | | 5,486,625 | | | |
Monomoy Capital Partners, L.P. | | | | | | | 1,941,554 | | | |
Monsoon India Select Equity Fund 2, L.P.(2) | | | | | | | 252,387 | | | |
Monsoon India Select Equity Fund, L.P.(2) | | | | | | | 140,654 | | | |
Penta Asia Domestic Partners, L.P. | | | | | | | 1,591,851 | | | |
Pine Brook Capital Partners, L.P.(1) | | | | | | | 16,252,992 | | | |
Pinto America Growth Fund, L.P. | | | | | | | 2,158,448 | | | |
Private Equity Investment Fund IV, L.P.(1)(2) | | | | | | | 5,309,069 | | | |
Private Equity Investment Fund V. L.P.(1)(2) | | | | | | | 41,200,445 | | | |
Saints Capital VI, L.P.(2) | | | | | | | 10,811,345 | | | |
Samlyn Onshore Fund, LP | | | | | | | 333,780 | | | |
Sanderling Venture Partners VI Co-Investment Fund, L.P. | | | | | | | 1,449,094 | | | |
Sanderling Venture Partners VI, L.P. | | | | | | | 1,079,656 | | | |
Sterling Capital Partners II, L.P.(1) | | | | | | | 1,119,514 | | | |
See accompanying notes to financial statements.
26
THE ENDOWMENT PMF MASTER FUND, L.P.
(A Limited Partnership)
Schedule of Investments, continued
December 31, 2014
| | | | | | | | | | |
| | | Shares | | | Fair
Value | | | % of
Partners’
Capital |
| | | | | | | | | | |
Limited Partnerships, Exempted Limited Partnerships and Limited Liability Companies (continued) | | | | | | | | | | |
United States (continued) | | | | | | | | | | |
Private Equity (28.32% of Partners’ Capital) (continued) | | | | | | | | | | |
Sterling Group Partners II, L.P. | | | | | | $ | 824,131 | | | |
Sterling Group Partners III, L.P. | | | | | | | 11,908,660 | | | |
Strategic Value Global Opportunities Fund I-A, L.P. | | | | | | | 1,137,285 | | | |
TAEF Fund, LLC | | | | | | | 2,830,878 | | | |
Tenaya Capital V, LP | | | | | | | 4,832,041 | | | |
Tenaya Capital VI, LP | | | | | | | 5,468,327 | | | |
The Column Group, L.P. | | | | | | | 12,752,000 | | | |
The Raptor Global Fund L.P. | | | 1,209 | | | | 593,618 | | | |
Trivest Fund IV, L.P.(1)(2) | | | | | | | 14,497,369 | | | |
Tuckerbrook SB Global Distressed Fund I, L.P.(2) | | | | | | | 4,022,438 | | | |
Valiant Capital Partners LP | | | | | | | 4,040,123 | | | |
VCFA Private Equity Partners IV, L.P.(1) | | | | | | | 727,002 | | | |
VCFA Venture Partners V, L.P. | | | | | | | 3,508,251 | | | |
Voyager Capital Fund III, L.P. | | | | | | | 3,609,205 | | | |
WestView Capital Partners II, L.P.(1)(2) | | | | | | | 21,047,452 | | | |
Real Estate (8.34% of Partners’ Capital) | | | | | | | | | | |
Aslan Realty Partners III, L.L.C.(1) | | | | | | | 361,267 | | | |
Cypress Realty VI Limited Partnership | | | | | | | 4,062,150 | | | |
Florida Real Estate Value Fund, L.P.(2) | | | | | | | 8,047,739 | | | |
GTIS Brazil Real Estate Fund (Brazilian Real) LP(1)(2) | | | | | | | 16,718,472 | | | |
Lone Star Real Estate Fund II (U.S.), L.P. | | | | | | | 2,724,268 | | | |
Monsoon Infrastructure & Realty Co-Invest, L.P.(1) | | | | | | | 14,464,134 | | | |
Northwood Real Estate Co-Investors LP(1) | | | | | | | 6,444,544 | | | |
Northwood Real Estate Partners LP(1) | | | | | | | 9,729,025 | | | |
Parmenter Realty Fund III, L.P.(1) | | | | | | | 2,454,995 | | | |
Parmenter Realty Fund IV, L.P.(1) | | | | | | | 5,830,313 | | | |
Pearlmark Mezzanine Realty Partners III, L.L.C.(1) | | | | | | | 8,942,000 | | | |
Pennybacker II, LP(1)(2) | | | | | | | 5,150,000 | | | |
SBC Latin America Housing US Fund, LP(2) | | | | | | | 9,181,351 | | | |
Square Mile Partners III LP(1) | | | | | | | 6,699,781 | | | |
Relative Value (4.86% of Partners’ Capital) | | | | | | | | | | |
Blue Mountain Credit Alternatives Fund L.P. | | | | | | | 17,176,539 | | | |
Eton Park Fund, L.P. | | | | | | | 2,035,568 | | | |
Kenmont Onshore Fund, L.P.(2) | | | | | | | 15,787 | | | |
King Street Capital, L.P. | | | | | | | 951,619 | | | |
Magnetar Capital Fund LP(2) | | | | | | | 3,094,731 | | | |
Magnetar SPV LLC(2) | | | | | | | 1,447,232 | | | |
Millennium USA LP | | | | | | | 7,335,269 | | | |
See accompanying notes to financial statements.
27
THE ENDOWMENT PMF MASTER FUND, L.P.
(A Limited Partnership)
Schedule of Investments, continued
December 31, 2014
| | | | | | | | | | | | |
| | | Shares | | | Fair
Value | | | % of
Partners’
Capital | |
| | | | | | | | | | | | |
Limited Partnerships, Exempted Limited Partnerships and Limited Liability Companies (continued) | | | | | | | | | | | | |
United States (continued) | | | | | | | | | | | | |
Relative Value (4.86% of Partners’ Capital) (continued) | | | | | | | | | | | | |
OZ Asia Domestic Partners, LP(1) | | | | | | $ | 1,554,509 | | | | | |
PIPE Equity Partners LLC(3) | | | | | | | 7,272,700 | | | | | |
PIPE Select Fund LLC(3) | | | | | | | 16,968,173 | | | | | |
Stark Investments Ltd Partnership(1) | | | | | | | 55,940 | | | | | |
Stark Select Asset Fund, LLC | | | | | | | 843,809 | | | | | |
| | | | | | | | | | | | |
Total United States | | | | | | | 749,154,680 | | | | | |
| | | | | | | | | | | | |
Total Limited Partnerships, Exempted Limited Partnerships and Limited Liability Companies | | | | | | | 1,087,116,708 | | | | 89.92% | |
| | | | | | | | | | | | |
Passive Foreign Investment Companies | | | | | | | | | | | | |
Cayman Companies Limited by Shares, Exempted Companies and Limited Liability Companies | | | | | | | | | | | | |
Energy (0.09% of Partners’ Capital) | | | | | | | | | | | | |
Ospraie Special Opportunities (Offshore) Ltd. | | | | | | | 1,141,500 | | | | | |
Private Equity (0.04% of Partners’ Capital) | | | | | | | | | | | | |
Quorum Fund Ltd | | | 8,762 | | | | 509,516 | | | | | |
Relative Value (0.99% of Partners’ Capital) | | | | | | | | | | | | |
CRC Credit Fund Ltd. | | | 52,234 | | | | 11,307,007 | | | | | |
Overseas CAP Partners, Inc. | | | 78 | | | | 638,377 | | | | | |
| | | | | | | | | | | | |
Total Cayman Companies Limited by Shares, Exempted Companies and Limited Liability Companies | | | | | | | 13,596,400 | | | | | |
| | | | | | | | | | | | |
Total Passive Foreign Investment Companies | | | | | | | 13,596,400 | | | | 1.12% | |
| | | | | | | | | | | | |
Private Corporations | | | | | | | | | | | | |
United States | | | | | | | | | | | | |
Real Estate (0.77% of Partners’ Capital) | | | | | | | | | | | | |
Legacy Partners Realty Fund II, Inc. | | | | | | | 1,325,770 | | | | | |
Legacy Partners Realty Fund III, Inc. | | | | | | | 6,559,219 | | | | | |
Net Lease Private REIT V, Inc. | | | | | | | 12,901 | | | | | |
Net Lease Private REIT VI, Inc. | | | | | | | 360,791 | | | | | |
Net Lease Private REIT VII, Inc. | | | | | | | 517,887 | | | | | |
Net Lease Private REIT VII-A, Inc. | | | | | | | 517,887 | | | | | |
| | | | | | | | | | | | |
Total Private Corporations | | | | | | | 9,294,455 | | | | 0.77% | |
| | | | | | | | | | | | |
Total Investments in Investment Funds
(Cost $973,056,290) | | | | | | | 1,110,007,563 | | | | 91.81% | |
| | | | | | | | | | | | |
See accompanying notes to financial statements.
28
THE ENDOWMENT PMF MASTER FUND, L.P.
(A Limited Partnership)
Schedule of Investments, continued
December 31, 2014
| | | | | | | | | | | | |
| | | Shares | | | Fair
Value | | | % of
Partners’
Capital | |
| | | | | | | | | | | | |
Investments in Securities | | | | | | | | | | | | |
Common Stocks | | | | | | | | | | | | |
China | | | | | | | | | | | | |
Technology (0.13% of Partners’ Capital) | | | | | | | | | | | | |
JD.com, Inc. | | | 70,285 | | | $ | 1,626,395 | | | | | |
Japan | | | | | | | | | | | | |
Consumer Products (0.07% of Partners’ Capital) | | | | | | | | | | | | |
Aderans Co., Ltd. | | | 85,700 | | | | 812,919 | | | | | |
United States | | | | | | | | | | | | |
Healthcare (0.01% of Partners’ Capital) | | | | | | | | | | | | |
Chimerix, Inc. | | | 1,507 | | | | 60,672 | | | | | |
| | | | | | | | | | | | |
Total Common Stocks | | | | | | | 2,499,986 | | | | 0.21% | |
| | | | | | | | | | | | |
Total Investments in Securities
(Cost $3,452,069) | | | | | | | 2,499,986 | | | | 0.21% | |
| | | | | | | | | | | | |
Total Investments (Cost $976,508,359) | | | | | | $ | 1,112,507,549 | | | | 92.02% | |
| | | | | | | | | | | | |
The Master Fund’s total outstanding capital commitments to Investment Funds as of December 31, 2014 were $161,674,808. For certain Investment Funds for which the Master Fund has a capital commitment, the Master Fund may be allocated its pro-rata share of expenses prior to having to fund a capital call for such expenses.
All Investment Funds and securities are non-income producing unless noted otherwise.
| (1) | Income producing investment |
| (2) | Affiliated investments (See Note 5b) |
| (3) | Affiliated investments for which ownership exceeds 25% of Partners’ Capital |
See accompanying notes to financial statements.
29
THE ENDOWMENT PMF MASTER FUND, L.P.
(A Limited Partnership)
Statement of Operations
For the Period March 31, 2014 through December 31, 20141
| | | | |
Investment income: | | | | |
Dividend income | | $ | 7,141,403 | |
Interest income | | | 1,721,494 | |
Dividend income from affiliated investments | | | 2,724,018 | |
| | | | |
Total investment income | | | 11,586,915 | |
| | | | |
Expenses: | | | | |
Investment Management Fees | | | 7,701,347 | |
Broker fees | | | 6,402,551 | |
Administration fees | | | 770,577 | |
Professional fees | | | 1,064,749 | |
Custodian fees | | | 44,045 | |
Commitment fees | | | 617,361 | |
Directors fees | | | 67,878 | |
Offshore withholding tax expense | | | 5,947,042 | |
Other expenses | | | 246,960 | |
| | | | |
Total expenses | | | 22,862,510 | |
| | | | |
Net investment loss | | | (11,275,595 | ) |
| | | | |
Net realized and unrealized gain (loss): | | | | |
Net realized gain from investments and foreign currency translations | | | 120,508,262 | |
Net realized gain from redemptions in-kind | | | 1,544,898 | |
Net realized gain from affiliated investments | | | 24,127,574 | |
Change in unrealized appreciation/depreciation | | | (37,736,366 | ) |
| | | | |
Net realized and unrealized gain | | | 108,444,368 | |
| | | | |
Net increase in partners’ capital resulting from operations | | $ | 97,168,773 | |
| | | | |
| 1 | The Endowment PMF Master Fund, L.P. commenced operations on March 31, 2014. |
See accompanying notes to financial statements.
30
THE ENDOWMENT PMF MASTER FUND, L.P.
(A Limited Partnership)
Statement of Changes in Partners’ Capital
For the Period March 31, 2014 through December 31, 20141
| | | | |
Partners’ capital at March 31, 2014 | | $ | — | |
Contributions | | | 539,387,194 | |
Transfer of Interests from The Endowment Master Fund, L.P. (Note 1) | | | 1,723,272,229 | |
Withdrawals | | | (1,150,900,544 | ) |
Net increase in partners’ capital resulting from operations: | | | | |
Net investment loss | | | (11,275,595 | ) |
Net realized gain from investments and foreign currency translations | | | 120,508,262 | |
Net realized gain from redemptions in-kind | | | 1,544,898 | |
Net realized gain from affiliated investments | | | 24,127,574 | |
Change in unrealized appreciation/depreciation | | | (37,736,366 | ) |
| | | | |
Net increase in partners’ capital resulting from operations | | | 97,168,773 | |
| | | | |
Partners’ capital at December 31, 2014 | | $ | 1,208,927,652 | |
| | | | |
| 1 | The Endowment PMF Master Fund, L.P. commenced operations on March 31, 2014. |
See accompanying notes to financial statements.
31
THE ENDOWMENT PMF MASTER FUND, L.P.
(A Limited Partnership)
Statement of Cash Flows
For the Period March 31, 2014 through December 31, 20141
| | | | |
Cash flows from operating activities: | | | | |
Net increase in partners’ capital resulting from operations | | $ | 97,168,773 | |
Adjustments to reconcile net increase in partners’ capital resulting from operations to net cash provided by operating activities: | | | | |
Purchases of investments | | | (71,990,975 | ) |
Proceeds from disposition of investments | | | 559,316,312 | |
Net realized gain from investments | | | (120,784,337 | ) |
Net realized gain from redemptions in-kind | | | (1,544,898 | ) |
Net realized gain from affiliated investments | | | (24,127,574 | ) |
Change in unrealized appreciation/depreciation from investments | | | 37,460,232 | |
Cash and other assets received in transfer (Note 1) | | | 232,435,920 | |
Change in operating assets and liabilities: | | | | |
Foreign currency, at value | | | (3,449,077 | ) |
Receivable from affiliate | | | (458,791 | ) |
Receivable from investments sold | | | (36,557,663 | ) |
Receivable from affiliated investments sold | | | (36,602 | ) |
Prepaids and other assets | | | (84,926 | ) |
Investment Management Fees payable | | | 2,234,666 | |
Offshore withholding tax payable | | | 347,732 | |
Administration fees payable | | | 126,270 | |
Payable to Adviser | | | 11,570 | |
Accounts payable and accrued expenses | | | 931,450 | |
| | | | |
Net cash provided by operating activities | | | 670,998,082 | |
| | | | |
Cash flows from financing activities: | | | | |
Contributions | | | 539,387,194 | |
Withdrawals | | | (1,098,235,739 | ) |
| | | | |
Net cash used in financing activities | | | (558,848,545 | ) |
| | | | |
Net change in cash and cash equivalents | | | 112,149,537 | |
Cash and cash equivalents at beginning of period | | | — | |
| | | | |
Cash and cash equivalents at end of period | | $ | 112,149,537 | |
| | | | |
Supplemental schedule of cash activity: | | | | |
Cash paid for offshore withholding taxes | | $ | 5,599,310 | |
Supplemental schedule of noncash activity: | | | | |
Transfer of Interests from The Endowment Master Fund, L.P. (Note 1) | | $ | 1,490,836,309 | |
Redemptions in-kind (Cost $1,907,171) | | | 2,509,261 | |
| 1 | The Endowment PMF Master Fund, L.P. commenced operations on March 31, 2014. |
See accompanying notes to financial statements.
32
THE ENDOWMENT PMF MASTER FUND, L.P.
(A Limited Partnership)
Notes to Financial Statements
December 31, 2014
(1) ORGANIZATION
The Endowment PMF Master Fund, L.P. (the “Master Fund”), a Delaware limited partnership, commenced operations on March 31, 2014. The Master Fund is registered as a non-diversified, closed-end management investment company under the Investment Company Act of 1940, as amended (the “1940 Act”). The Master Fund is the master fund in a master-feeder structure in which there are currently three feeder funds.
The Master Fund’s investment objective is to manage a portfolio of investment funds including, but not limited to, limited partnerships, limited liability companies, offshore corporations, other foreign investment vehicles (collectively, the “Investment Funds”), and cash to preserve value while prioritizing liquidity to investors over active management, until such time as the Master Fund’s portfolio has been liquidated. The Master Fund holds a portfolio of Investment Funds, reflecting an approximate pro rata division of the portfolio of The Endowment Master Fund, L.P. (the “Legacy Master Fund”), managed in a broad range of investment strategies and asset categories. The Adviser, as hereinafter defined, manages the Master Fund portfolio primarily in a passive manner whereby the Master Fund holds to self-liquidating private equity and other similar illiquid interests in Investment Funds and oversees the liquidation of other Investment Funds that provide for redemption while managing the Master Fund’s cash to ensure the Master Fund has the ability to satisfy outstanding capital commitments relating to such portfolio holdings.
The Endowment Fund GP, L.P., a Delaware limited partnership, serves as the general partner of the Master Fund and the Legacy Master Fund (the “General Partner”). To the fullest extent permitted by applicable law, the General Partner has irrevocably delegated to a board of directors (the “Board” and each member a “Director”) its rights and powers to monitor and oversee the business affairs of the Master Fund, including the complete and exclusive authority to oversee and establish policies regarding the management, conduct, and operation of the Master Fund’s business. A majority of the members of the Board are independent of the General Partner and its management. To the extent permitted by applicable law, the Board may delegate any of its rights, powers and authority to, among others, the officers of the Master Fund, the Adviser, or any committee of the Board.
The Board is authorized to engage an investment adviser, and pursuant to an investment management agreement, (the “Investment Management Agreement”), it has selected Endowment Advisers, L.P. (the “Adviser”), to manage the Master Fund’s portfolio and operations. The Adviser is a Delaware limited partnership that is registered as an investment adviser under the Investment Advisers Act of 1940, as amended. Under the Investment Management Agreement, the Adviser is responsible for the establishment of an investment committee (the “Investment Committee”), which is responsible for developing, implementing, and supervising the Master Fund’s investment program subject to the ultimate supervision of the Board.
Under the Master Fund’s organizational documents, the Master Fund’s Directors and officers are indemnified against certain liabilities arising out of the performance of their duties to the Master Fund. In the normal course of business, the Master Fund enters into contracts with service providers, which also provide for indemnifications by the Master Fund. The Master Fund’s maximum exposure under these arrangements is unknown, as this would involve any future potential claims that may be made against the Master Fund. However, based on experience, the General Partner expects that risk of loss to be remote.
On March 31, 2014 the Master Fund received in an in-kind transfer a portfolio of Investment Funds from the Legacy Master Fund, in exchange for limited partnership interests (the “Interests”) of the Master Fund totaling $1,723,272,229. The transfer was accounted for as a tax-free transaction resulting in Investment Funds transferring to the Master Fund with a total market value of $1,490,836,309, consisting of total cost and accumulated appreciation of $1,317,376,887 and $173,459,422, respectively, and cash and other assets of $232,435,920.
33
THE ENDOWMENT PMF MASTER FUND, L.P.
(A Limited Partnership)
Notes to Financial Statements, continued
December 31, 2014
(2) SUMMARY OF SIGNIFICANT ACCOUNTING POLICIES AND PRACTICES
(a) BASIS OF ACCOUNTING
The accounting and reporting policies of the Master Fund conform with U.S. generally accepted accounting principles (“U.S. GAAP”). The accompanying financial statements reflect the financial position of the Master Fund and the results of its operations. The Master Fund is an investment company and follows the investment company accounting and reporting guidance under Financial Accounting Standards Board (“FASB”) Accounting Standards Codification (“ASC”) Topic 946, “Financial Services-Investment Companies”.
(b) CASH EQUIVALENTS
The Master Fund considers all unpledged temporary cash investments with a maturity date at the time of purchase of three months or less to be cash equivalents.
(c) INVESTMENT SECURITIES TRANSACTIONS
The Master Fund records investment transactions on a trade-date basis.
Investments that are held by the Master Fund, including those that have been sold short, are marked to fair value at the date of the financial statements, and the corresponding change in unrealized appreciation/depreciation is included in the Statement of Operations.
Dividend income is recorded on the ex-dividend date. Other investment fund distributions are recorded based on the detail provided with the distribution notice, as applicable. Realized gains or losses on the disposition of investments are accounted for based on the first in first out method.
(d) INVESTMENT VALUATION
The valuation of the Master Fund’s investments is determined as of the close of business at the end of each reporting period, generally monthly. The valuation of the Master Fund’s investments is calculated by Citi Fund Services Ohio, Inc., the Master Fund’s independent administrator (the “Administrator”).
The Board has formed a valuation committee (the “Board Valuation Committee”) that is responsible for overseeing the Master Fund’s valuation policies, making recommendations to the Board on valuation-related matters, and overseeing implementation by the Adviser of such valuation policies.
The Board has authorized the Adviser to establish a valuation committee of the Adviser (the “Adviser Valuation Committee”). The Adviser Valuation Committee’s function, subject to the oversight of the Board Valuation Committee and the Board, is generally to review valuation methodologies, valuation determinations, and any information provided to the Adviser Valuation Committee by the Adviser or the Administrator.
The Master Fund is not able to obtain complete underlying investment holding details on each of the Investment Funds in order to determine if the Master Fund’s proportional, aggregated, indirect share of any investments held by the Investment Funds exceeds 5% of partners’ capital of the Master Fund as of December 31, 2014.
34
THE ENDOWMENT PMF MASTER FUND, L.P.
(A Limited Partnership)
Notes to Financial Statements, continued
December 31, 2014
Investments held by the Master Fund are valued as follows:
| | • | | INVESTMENT FUNDS—Investments in Investment Funds are carried at fair value, using the net asset value (the “NAV”) as a practical expedient, as provided to the Administrator by the investment managers of such Investment Funds or the administrators of such Investment Funds. These Investment Funds value their underlying investments in accordance with policies established by such Investment Funds. Prior to investing in any Investment Fund, the Adviser Valuation Committee, as part of the due diligence process, conducts a review of the valuation methodologies employed by the Investment Fund to determine whether such methods are appropriate for the asset types. All of the Master Fund’s valuations utilize financial information supplied by each Investment Fund and are net of management and estimated performance incentive fees or allocations payable to the Investment Funds’ managers pursuant to the Investment Funds’ agreements. Generally, Investment Funds in which the Master Fund invests will use market value when available, and otherwise will use principles of fair value applied in good faith. The Adviser Valuation Committee will consider whether it is appropriate, in light of the relevant circumstances, to value shares at NAV as reported by an Investment Fund for valuation purposes, or whether to adjust such reported value to reflect an adjusted fair value. Because of the inherent uncertainty of valuation, fair value may differ significantly from the value that would have been used had readily available markets for the investments in Investment Funds existed. The Master Fund’s investments in Investment Funds are subject to the terms and conditions of the respective operating agreements and offering memoranda of such Investment Funds. Investment Funds are typically categorized as Level 2 or Level 3 in the fair value hierarchy based upon liquidity. |
| | • | | OTHER—Investments in open-end registered investment companies (“RICs”) that do not trade on an exchange are valued at the end of day NAV per share and are categorized as Level 1 in the fair value hierarchy. Where no value is readily available from a RIC or other security, or where a value supplied by a RIC is deemed not to be indicative of the RIC’s value, the Adviser Valuation Committee and/or the Board Valuation Committee, in consultation with the Administrator or the Adviser, will determine, in good faith, the fair value of the RIC or other security. Such fair valued investments are typically categorized as Level 1 or Level 2 in the fair value hierarchy, based upon the inputs used to value the investments. |
| | • | | SECURITIES NOT ACTIVELY TRADED—The value of securities, derivatives or synthetic securities that are not actively traded on an exchange shall be determined by obtaining quotes from brokers that normally deal in such securities or by an unaffiliated pricing service that may use actual trade data or procedures using market indices, matrices, yield curves, specific trading characteristics of certain groups of securities, pricing models or a combination of these procedures pursuant to the valuation procedures approved by the Board. In each of these situations, valuations are typically categorized as Level 2 or Level 3 in the fair value hierarchy, based upon the inputs used to value the investments. |
(e) FOREIGN CURRENCY
The accounting records of the Master Fund are maintained in U.S. dollars. Foreign currency amounts and investments denominated in a foreign currency, if any, are translated into U.S. dollar amounts at current exchange rates on the valuation date. Purchases and sales of investments denominated in foreign currencies are translated into U.S. dollar amounts at the exchange rate on the respective dates of such transactions. The Master Fund does not isolate the portion of the results of operations resulting from changes in foreign exchange rates on investments from fluctuations arising from changes in market prices of securities held. Such fluctuations are included with the net realized and unrealized gain or loss from investments and foreign currency translations.
35
THE ENDOWMENT PMF MASTER FUND, L.P.
(A Limited Partnership)
Notes to Financial Statements, continued
December 31, 2014
(f) CFTC REGULATION
The Master Fund is deemed to be a commodity pool under the Commodity Exchange Act, as amended (the “CEA”). In 2013, the CFTC adopted final regulations designed to harmonize the obligations of registered commodity pool operators (“CPOs”) for commodity pools that are also registered as investment companies under the 1940 Act (the “Harmonization Rules”). Under the Harmonization Rules, the CFTC generally will accept the SEC’s disclosure, reporting, and recordkeeping regime as “substituted compliance” for substantially all of the CFTC’s regulations long as the CPO complies with applicable requirements under the SEC’s statutory and regulatory compliance regime to which it or the pool is already subject. The Adviser intends to operate the Master Fund in compliance with the CFTC’s Harmonization Rules.
(g) INVESTMENT INCOME
For investments in securities, dividend income is recorded on the ex-dividend date, net of withholding taxes. Interest income is recorded as earned on the accrual basis and includes amortization of premiums or accretion of discounts.
(h) FUND EXPENSES
Unless otherwise voluntarily or contractually assumed by the Adviser or another party, the Master Fund bears all expenses incurred in its business including, but not limited to, the following: all costs and expenses related to investment transactions and positions for the Master Fund’s account; legal fees; accounting, auditing and tax preparation fees; recordkeeping and custodial fees; costs of computing the Master Fund’s net asset value; fees for data and software providers; research expenses; costs of insurance; registration expenses; expenses of meetings of partners; directors fees; all costs with respect to communications to partners; transfer taxes; offshore withholding taxes; and other types of expenses as may be approved from time to time by the Board.
(i) INCOME TAXES
The Master Fund is organized and operates as a limited partnership and is not subject to income taxes as a separate entity. Such taxes are the responsibility of the individual partners. Accordingly, no provision for income taxes has been made in the Master Fund’s financial statements. Investments in foreign securities may result in foreign taxes being withheld by the issuer of such securities. For U.S. offshore withholding tax, the Master Fund may serve as withholding agent for its offshore feeder funds.
For the current tax year ended December 31, 2014, and for all major jurisdictions, management of the Master Fund has evaluated the tax positions taken or expected to be taken in the course of preparing the Master Fund’s tax returns to determine whether the tax positions will “more-likely-than-not” be sustained by the Master Fund upon challenge by the applicable tax authority. Tax positions not deemed to meet the more-likely-than-not threshold and that would result in a tax benefit or expense to the Master Fund would be recorded as a tax benefit or expense in the current period. For the period March 31, 2014 (commencement of operations) through December 31, 2014, the Master Fund did not recognize any amounts for unrecognized tax benefit/expense. A reconciliation of unrecognized tax benefit/expense is not provided herein, as the beginning and ending amounts of unrecognized tax benefit/expense are zero, with no interim additions, reductions or settlements. Tax positions taken in the current tax year ended December 31, 2014 which remains open under the statute of limitations (generally three years for federal income tax purposes) are subject to examination by federal and state tax jurisdictions.
36
THE ENDOWMENT PMF MASTER FUND, L.P.
(A Limited Partnership)
Notes to Financial Statements, continued
December 31, 2014
(j) USE OF ESTIMATES
The financial statements have been prepared in conformity with U.S. GAAP, which requires management to make estimates and assumptions relating to the reported amounts of assets and liabilities and the disclosure of contingent assets and liabilities at the date of the financial statements and the reported amounts of income and expenses during the reporting period. Actual results may differ from those estimates and such differences may be significant.
(3) FAIR VALUE MEASUREMENTS
The Master Fund defines fair value as the price that would be received to sell an asset or paid to transfer a liability in an orderly transaction between market participants at the measurement date under current market conditions.
The inputs used to determine the fair value of the Master Fund’s investments are summarized in the three broad levels listed below:
| | • | | Level 1—unadjusted quoted prices in active markets for identical investments and registered investment companies where the value per share (unit) is determined and published and is the basis for current transactions for identical assets or liabilities at the valuation date |
| | • | | Level 2—investments with other significant observable inputs or investments that can be fully redeemed at the NAV in the “near term” |
| | • | | Level 3—investments with significant unobservable inputs (which may include the Master Fund’s own assumptions in determining the fair value of investments) or investments that cannot be fully redeemed at the NAV in the “near term”; these are investments that generally have one or more of the following characteristics: gated redemptions, suspended redemptions, or lock-up periods greater than quarterly |
Changes in valuation techniques may result in transfers in or out of an assigned level within the disclosure hierarchy. The Master Fund discloses transfers between levels based on valuations at the end of the reporting period. The inputs or methodology used for valuing investments are not necessarily an indication of the risk associated with investing in those investments.
The Master Fund establishes valuation processes and procedures to ensure that the valuation techniques for investments categorized within Level 3 of the fair value hierarchy are fair, consistent, and appropriate. The Adviser is responsible for developing the Master Fund’s written valuation processes and procedures, conducting periodic reviews of the valuation policies, and evaluating the overall fairness and consistent application of the valuation policies. The Board Valuation Committee has authorized the Adviser to oversee the implementation of the Board approved valuation procedures by the Administrator. The Adviser Valuation Committee is comprised of various Master Fund personnel, which include members from the Master Fund’s portfolio management and operations groups. The Adviser Valuation Committee meets monthly or as needed, to determine the valuations of the Master Fund’s Level 3 investments. The valuations are supported by methodologies employed by the Investment Funds’ market data, industry accepted third party valuation models, or other methods the Adviser Valuation Committee deems to be appropriate, including the use of internal proprietary valuation models.
37
THE ENDOWMENT PMF MASTER FUND, L.P.
(A Limited Partnership)
Notes to Financial Statements, continued
December 31, 2014
The following is a summary categorization of the Master Fund’s investments based on the level of inputs utilized in determining the value of such investments as of December 31, 2014:
| | | | | | | | | | | | | | | | |
| | | LEVEL 1 | | | LEVEL 2 | | | LEVEL 3 | | | Total | |
| | | Investments | | | Investments | | | Investments | | | Investments | |
Investment Funds | | | | | | | | | | | | | | | | |
Limited Partnerships, Exempted Limited | | | | | | | | | | | | | | | | |
Partnerships and Limited Liability Companies | | | | | | | | | | | | | | | | |
Energy | | $ | — | | | $ | — | | | $ | 189,521,379 | | | $ | 189,521,379 | |
Event-Driven | | | — | | | | — | | | | 52,475,970 | | | | 52,475,970 | |
Global Macro and Trading | | | — | | | | — | | | | 31,361,345 | | | | 31,361,345 | |
Private Equity | | | — | | | | — | | | | 629,148,054 | | | | 629,148,054 | |
Real Estate | | | — | | | | — | | | | 125,845,499 | | | | 125,845,499 | |
Relative Value | | | — | | | | — | | | | 58,764,461 | | | | 58,764,461 | |
Passive Foreign Investment Companies | | | | | | | | | | | | | | | | |
Energy | | | — | | | | — | | | | 1,141,500 | | | | 1,141,500 | |
Private Equity | | | — | | | | — | | | | 509,516 | | | | 509,516 | |
Relative Value | | | — | | | | — | | | | 11,945,384 | | | | 11,945,384 | |
Private Corporations | | | | | | | | | | | | | | | | |
Real Estate | | | — | | | | — | | | | 9,294,455 | | | | 9,294,455 | |
Investment Securities | | | | | | | | | | | | | | | | |
Common Stocks | | | | | | | | | | | | | | | | |
Consumer Products | | | 812,919 | | | | — | | | | — | | | | 812,919 | |
Healthcare | | | 60,672 | | | | — | | | | — | | | | 60,672 | |
Technology | | | 1,626,395 | | | | — | | | | — | | | | 1,626,395 | |
| | | | | | | | | | | | | | | | |
Total | | $ | 2,499,986 | | | $ | — | | | $ | 1,110,007,563 | | | $ | 1,112,507,549 | |
| | | | | | | | | | | | | | | | |
The categorization of investments amongst Levels 1 through 3 does not reflect the fact that many of the underlying investments held by the Investment Funds included in Level 3, if owned directly by the Master Fund, may be classified as Level 1 or Level 2 investments.
The following table is a summary of quantitative information about significant unobservable valuation inputs approved by the Adviser Valuation Committee for Level 3 fair value measurements for investments held as of December 31, 2014:
| | | | | | | | | | |
| | | Fair Value as of
December 31, 2014 | | | Valuation Technique | | Liquidity of
Investments | | Adjustments
To NAV** |
Investments | | | | | | | | | | |
Limited Partnerships, Exempted Limited Partnerships and Limited Liability Companies | | | | | | | | | | |
Energy | | $ | 189,521,379 | | | NAV as Practical Expedient* | | Non-redeemable | | None |
Event-Driven | | | 52,475,970 | | | NAV as Practical Expedient* | | Quarterly or Greater | | None |
Global Macro and Trading | | | 31,361,345 | | | NAV as Practical Expedient* | | Monthly or Greater | | None |
Private Equity | | | 629,148,054 | | | NAV as Practical Expedient* | | Non-redeemable | | None |
Real Estate | | | 125,845,499 | | | NAV as Practical Expedient* | | Non-redeemable | | None |
Relative Value | | | 58,764,461 | | | NAV as Practical Expedient* | | Quarterly or Greater | | None |
38
THE ENDOWMENT PMF MASTER FUND, L.P.
(A Limited Partnership)
Notes to Financial Statements, continued
December 31, 2014
| | | | | | | | | | |
| | | Fair Value as of
December 31, 2014 | | | Valuation Technique | | Liquidity of
Investments | | Adjustments
To NAV** |
Passive Foreign Investment Companies | | | | | | | | | | |
Energy | | $ | 1,141,500 | | | NAV as Practical Expedient* | | Non-redeemable | | None |
Private Equity | | | 509,516 | | | NAV as Practical Expedient* | | Non-redeemable | | None |
Relative Value | | | 11,945,384 | | | NAV as Practical Expedient* | | Non-redeemable | | None |
Private Corporations | | | | | | | | | | |
Real Estate | | | 9,294,455 | | | NAV as Practical Expedient* | | Non-redeemable | | None |
| | | | | | | | | | |
Total Investments | | $ | 1,110,007,563 | | | | | | | |
| | | | | | | | | | |
| * | Unobservable valuation input. |
| ** | Amounts represent adjustments, if any, made to NAV provided by the investment manager or administrator of the Investment Funds. Adjustments to the practical expedient NAV may be made under certain circumstances including, but not limited to, the following: the practical expedient NAV received is not as of the Master Fund’s measurement date; it is probable that the Investment Fund will be sold at a value significantly different than the reported expedient NAV; it is determined by the Board Valuation Committee that the Investment Fund is not being valued at fair value by the Investment Fund manager. |
Transfers that occurred between Levels 2 and 3 during the period March 31, 2014 (commencement of operations) through December 31, 2014, based on levels assigned to Investments on March 31, 2014, are included in the table below. The following is a reconciliation of Level 3 investments based on the inputs used to determine fair value:
| | | | | | | | | | | | | | | | | | | | | | | | | | | | |
| | | Investments | |
| | | Beginning
Balance as of
March 31, 2014 | | | Transfers
In-Kind^ | | | Gross
Purchases | | | Gross
Sales* | | | Net
Realized
Gain (Loss) | | | Change in
Unrealized
Appreciation/
Depreciation | | | Ending
Balance as of
December 31, 2014 | |
Investments | | | | | | | | | | | | | | | | | | | | | | | | | | | | |
Limited Partnerships, Exempted Limited | | | | | | | | | | | | | | | | | | | | | | | | | | | | |
Partnerships and Limited Liability Companies | | | | | | | | | | | | | | | | | | | | | | | | | | | | |
Energy | | $ | — | | | $ | 192,104,381 | | | $ | 24,161,330 | | | $ | (48,373,346 | ) $ | | | 23,316,422 | | | $ | (1,687,408 | ) | | $ | 189,521,379 | |
Event-Driven | | | — | | | | 69,150,029 | | | | 9,550,335 | | | | (17,763,685 | ) | | | 856,128 | | | | (9,316,837 | ) | | | 52,475,970 | |
Global Macro and Trading | | | — | | | | 29,725,654 | | | | — | | | | (10,988 | ) | | | 10,988 | | | | 1,635,691 | | | | 31,361,345 | |
Private Equity | | | — | | | | 626,822,061 | | | | 48,271,980 | | | | (131,415,941 | ) | | | 43,118,351 | | | | 42,351,603 | | | | 629,148,054 | |
Real Estate | | | — | | | | 149,145,780 | | | | 6,403,606 | | | | (36,335,697 | ) | | | 8,433,859 | | | | (1,802,049 | ) | | | 125,845,499 | |
Relative Value | | | — | | | | 198,401,024 | | | | 8,228 | | | | (139,949,546 | ) | | | 41,335,915 | | | | (41,031,160 | ) | | | 58,764,461 | |
39
THE ENDOWMENT PMF MASTER FUND, L.P.
(A Limited Partnership)
Notes to Financial Statements, continued
December 31, 2014
| | | | | | | | | | | | | | | | | | | | | | | | | | | | |
| | | Investments | |
| | | Beginning
Balance as of
March 31, 2014 | | | Transfers
In-Kind^ | | | Gross
Purchases | | | Gross
Sales* | | | Net
Realized
Gain (Loss) | | | Change in
Unrealized
Appreciation/
Depreciation | | | Ending
Balance as of
December 31, 2014 | |
Passive Foreign Investment Companies | | | | | | | | | | | | | | | | | | | | | | | | | | | | |
Energy | | $ | — | | | $ | 1,455,515 | | | $ | — | | | $ | (330,574 | ) | | $ | 86,022 | | | $ | (69,463 | ) | | $ | 1,141,500 | |
Private Equity | | | — | | | | 517,238 | | | | — | | | | — | | | | — | | | | (7,722 | ) | | | 509,516 | |
Relative Value | | | — | | | | 18,379,864 | | | | 53,781 | | | | (7,293,614 | ) | | | 2,361,457 | | | | (1,556,104 | ) | | | 11,945,384 | |
Private Corporations | | | | | | | | | | | | | | | | | | | | | | | | | | | | |
Real Estate | | | — | | | | 10,202,859 | | | | — | | | | (739,866 | ) | | | — | | | | (168,538 | ) | | | 9,294,455 | |
| | | | | | | | | | | | | | | | | | | | | | | | | | | | |
Total Investments | | $ | — | | | $ | 1,295,904,405 | | | $ | 88,449,260 | | | $ | (382,213,257 | ) | | $ | 119,519,142 | | | $ | (11,651,987 | ) | | $ | 1,110,007,563 | |
| | | | | | | | | | | | | | | | | | | | | | | | | | | | |
| ^ | Transfers In-Kind resulted from a tender offer of the Legacy Master Fund effective March 31, 2014 in a tax free transfer. Investment Funds were received by the Master Fund at market value at the time of transfer, accounted for by transferring the original cost and accumulated unrealized appreciation/depreciation of each of the Investment Funds. |
| * | Includes Return of Capital and Capital Gain Distributions. |
The net realized gain (loss) and change in unrealized appreciation/depreciation in the table above are reflected in the accompanying Statement of Operations. The change in unrealized appreciation/depreciation from Level 3 investments held at December 31, 2014 is $24,567,710.
The Master Fund is permitted to invest in alternative investments that may not have a readily determinable fair value. For an investment that does not have a readily determinable fair value, the Master Fund uses the NAV reported by the Investment Fund as a practical expedient, without further adjustment, unless it is probable that the investment will be sold at a value significantly different than the reported NAV. If the practical expedient NAV is not as of the reporting entity’s measurement date, then the NAV is adjusted to reflect any significant events that would materially affect the value of the investment and the NAV of the Master Fund as of the valuation date.
Certain Investment Funds in which the Master Fund invests have limitations on liquidity which may result in limitations on redemptions including, but not limited to, early redemption fees. Other than Investment Funds that are self-liquidating, such as Private Equity and some Energy, Natural Resources and Real Estate Funds, the Investment Funds in which the Master Fund invests have withdrawal rights ranging from monthly to annually, after a notice period, usually for a period of up to two years from the date of the initial investment or an additional investment. A listing of the investments held by the Master Fund and their attributes as of December 31, 2014, that qualify for this valuation approach is shown in the table below.
| | | | | | | | | | | | | | | | |
| Investment Category | | Investment Strategy | | Fair
Value (in
000s) | | | Unfunded
Commitments
(in 000s) | | Remaining
Life* | | Redemption
Frequency* | | Notice
Period
(in Days)* | | Redemption
Restrictions and Terms * |
| Energy(a) | | Private investments in securities issued by companies in the energy and natural resources sectors. | | $ | 190,663 | | | $36,157 | | up to
15
years | | N/A | | N/A | | 0-15 years |
| Event-Driven(b) | | Strategies designed to profit from changes in the prices of securities of companies facing a major corporate event. | | | 52,476 | | | N/A | | N/A | | Quarterly | | 45-90 | | 0-5 years;
up to 2.5%
early withdrawal fee; possible 25% investor level gate; illiquid side pocket capital |
40
THE ENDOWMENT PMF MASTER FUND, L.P.
(A Limited Partnership)
Notes to Financial Statements, continued
December 31, 2014
| | | | | | | | | | | | | | | | | | |
| Investment Category | | Investment Strategy | | Fair Value
(in 000s) | | | Unfunded
Commitments
(in 000s) | | | Remaining
Life* | | Redemption
Frequency* | | Notice
Period
(in Days)* | | Redemption
Restrictions and Terms * |
| Global Macro and Trading(c) | | Investments across global markets and security types seeking to profit from macroeconomic opportunities. Strategies can be discretionary or systematic. Includes CTAs. | | $ | 31,361 | | | | N/A | | | N/A | | Quarterly | | 30-90 | | 0-5 years;
up to 6%
early redemption fee; possible hard lock within first 12 months; illiquid side pocket capital |
| Private Equity(d) | | Investments in nonpublic companies. | | | 629,658 | | | $ | 99,434 | | | up to 10 years | | N/A | | N/A | | 0-10 years |
| Real Estate(e) | | Investments in REITs, private partnerships, and various real estate related mortgage securities. | | | 135,140 | | | | 26,084 | | | up to 10 years | | N/A | | N/A | | 0-10 years |
| Relative Value(f) | | Strategies seeking to profit from inefficiencies existing within capital structures, within markets, and across markets. | | | 70,710 | | | | N/A | | | N/A | | Quarterly | | 30-120 | | 0-5 years;
up to 7%
early redemption fee; possible 5% fund level gate; illiquid side pocket capital |
| | | | $ | 1,110,008 | | | $ | 161,675 | | | | | | | | | |
| | | | | | | | | | | | | | | | | | |
| * | The information summarized in the table above represents the general terms for the specified asset class. Individual Investment Funds may have terms that are more or less restrictive than those terms indicated for the asset class as a whole. In addition, most Investment Funds have the flexibility, as provided for in their constituent documents, to modify and waive such terms. |
| (a) | This category includes Investment Funds that invest primarily in privately issued securities by companies in the energy and natural resources sectors and private investments in energy-related assets or companies. The Investment Funds include private funds and private partnerships with private investments in their portfolios. |
| (b) | This category includes Investment Funds that invest primarily in the following securities: common stock, preferred stock, and many types of debt. Events include mergers, acquisitions, restructurings, spin-offs, and litigation. |
| (c) | This category includes Investment Funds that invest in global markets and across all security types including equities, fixed income, derivatives, commodities, currencies, futures, and exchange-traded funds. Investment Funds in this category are typically private funds and may include global macro funds, and commodity trading advisors. |
| (d) | This category includes private equity funds that invest primarily in non-publicly traded companies in need of capital. These Investment Funds may vary widely as to sector, size, stage, duration, and liquidity. Certain of these Investment Funds may also focus on the secondary market, buying interests in existing private equity funds, often at a discount. |
| (e) | This category includes Investment Funds that invest in registered investment companies or managers that invest in real estate trusts (commonly known as “REITs”) and private partnerships that make investments in income producing properties, raw land held for development or appreciation, and various types of mortgage loans and common or preferred stock whose operations involve real estate. |
41
THE ENDOWMENT PMF MASTER FUND, L.P.
(A Limited Partnership)
Notes to Financial Statements, continued
December 31, 2014
| (f) | This category includes Investment Funds with low net exposure to most financial markets. Underlying strategies include Equity Market Neutral or Statistical Arbitrage, Capital Structure Arbitrage, Convertible Arbitrage, Volatility Arbitrage, and Credit Arbitrage. |
(4) PARTNERS’ CAPITAL ACCOUNTS
(a) ISSUANCE OF INTERESTS
Interests of the Master Fund are generally available only to those investors who received Interests as in-kind repurchase proceeds for their tendered interests in one of the feeder funds to the Legacy Master Fund. Interests of the Master Fund will generally not otherwise be offered or sold.
(b) ALLOCATION OF PROFITS AND LOSSES
For each fiscal period, generally monthly, net profits or net losses of the Master Fund are allocated among and credited to or debited against the capital accounts of all partners as of the last day of each fiscal period in accordance with the partners’ respective capital account ownership percentage for the fiscal period. Net profits or net losses are measured as the net change in the value of the partners’ capital of the Master Fund, including any change in unrealized appreciation or depreciation of investments and income, net of expenses, and realized gains or losses during a fiscal period.
(c) REPURCHASE OF INTERESTS
A partner will not be eligible to have the Master Fund repurchase all or any portion of an Interest at the partner’s discretion at any time. Interests are not redeemable nor are they exchangeable for Interests or shares of any other fund.
The Master Fund anticipates making quarterly distributions pro rata to all investors in an amount equal to the Master Fund’s excess cash (“Excess Cash”). Excess Cash is defined as the amount of cash on hand over and above the amount necessary or prudent for operational and regulatory purposes (“Required Cash”). The amount of Required Cash is determined by the Adviser with oversight by the Board. Excess Cash is generally distributed in the subsequent quarter or quarters where the aggregate of Excess Cash from such subsequent quarter(s) and prior quarters exceeds a threshold of $10 million. Intra-quarter distributions may also be made if Excess Cash exceeds a threshold of $25 million as of the forty fifth day after the end of any quarter. The Master Fund may make in-kind distributions of portfolio securities as deemed necessary.
(5) INVESTMENTS IN PORTFOLIO SECURITIES
(a) INVESTMENT ACTIVITY
As of December 31, 2014 the Master Fund held investments in Investment Funds and securities. The agreements related to investments in Investment Funds provide for compensation to the Investment Funds’ managers/general partners or advisers in the form of management fees of up to 2.0% annually of monthly average net assets. In addition, many Investment Funds also provide for performance incentive fees/ allocations of up to 20% of an Investment Fund’s net profits, although it is possible that such ranges may be exceeded for certain investment managers. These management fees and incentive fees are in addition to the management fees charged by the Master Fund.
42
THE ENDOWMENT PMF MASTER FUND, L.P.
(A Limited Partnership)
Notes to Financial Statements, continued
December 31, 2014
For the period ended December 31, 2014, the aggregate cost of purchases and proceeds from sales of investments (excluding short-term investments) were $68,949,850 and $435,202,717, respectively.
The cost of the Master Fund’s underlying investments for Federal income tax purposes is adjusted for items of taxable income allocated to the Master Fund from such investments. The allocated taxable income is generally reported to the Master Fund by its underlying investments on Schedules K-1, Forms 1099 or PFIC statements, or a combination thereof.
The underlying investments generally do not provide the Master Fund with tax reporting information until well after year end, and as a result, the Master Fund is unable to calculate the year end tax cost of its investments until such time. The Master Fund’s book cost as of December 31, 2014, was $976,508,359, resulting in accumulated net unrealized appreciation of $135,999,190 consisting of $290,618,663 in gross unrealized appreciation and $154,619,473 in gross unrealized depreciation.
During the period March 31, 2014 (commencement of operations) through December 31, 2014, certain investments were received through a transfer-in-kind in connection with the redemption of certain investments. The fair value of these investments transferred-in-kind and related cost were as follows:
| | | | | | | | | | | | | | | | | | |
Investments Redeemed | | Fair Value | | | Cost | | | Realized
Gain (Loss) on
Transfers In-
Kind | | | Unrealized
Gain
(Loss) on
Transfers
In-Kind | | | Investments
Received |
Sanderling Ventury Partners VI Co-Investment Fund, L.P. | | $ | 41,874 | | | $ | 10,941 | | | $ | — | | | $ | 30,933 | | | Chimerix, Inc. |
Steel Partners Japan Strategic Fund, L.P. | | | 832,558 | | | | 1,806,299 | | | | — | | | | (973,741 | ) | | Aderans Co., Ltd. |
Tiger Global Private Investment Partners V, L.P. | | | 1,634,829 | | | | 89,931 | | | | 1,544,898 | | | | — | | | JD.com, Inc. |
| | | | | | | | | | | | | | | | | | |
| | $ | 2,509,261 | | | $ | 1,907,171 | | | $ | 1,544,898 | | | $ | (942,808 | ) | | |
| | | | | | | | | | | | | | | | | | |
(b) AFFILIATED INVESTMENT FUNDS
At December 31, 2014, the Master Fund’s investments in certain Investment Funds were deemed to be investments in affiliated issuers under the 1940 Act, primarily because the Master Fund owns 5% or more of the Investment Funds’ total net assets. A listing of these affiliated Investment Funds (including activity during the period ended December 31, 2014) is shown below:
| | | | | | | | | | | | | | | | | | | | | | | | | | | | | | | | | | | | | | | | |
Investment Funds | | Shares
3/31/2014 | | Shares
12/31/2014 | | Beginning
Fair
Value
3/31/2014 | | | Redemptions
In-Kind | | | Transfers
In-Kind | | | Cost of
Purchases | | | Cost of
Sales* | | | Realized
Gain (Loss)
on
Investments | | | Change in
Unrealized
Appreciation/
Depreciation | | | Ending
Fair Value
12/31/2014 | | | Interest/
Dividend
Income | |
Blueshift Energy Fund, LP | | | | | | $ | — | | | $ | — | | | $ | 29,055,673 | | | $ | — | | | $ | (10,988 | ) | | $ | 10,988 | | | $ | 2,116,964 | | | $ | 31,172,637 | | | $ | — | |
CCM Small Cap Value Qualified Fund, L.P. | | | | | | | — | | | | — | | | | 3,364,576 | | | | 3,876,164 | | | | (5,424,768 | ) | | | (86,429 | ) | | | (131,895 | ) | | | 1,597,648 | | | | — | |
Credit Distressed Blue Line Fund, L.P. | | | | | | | — | | | | — | | | | 10,477,931 | | | | — | | | | — | | | | — | | | | (1,613,864 | ) | | | 8,864,067 | | | | — | |
Crosslink Crossover Fund IV, L.P. | | | | | | | — | | | | — | | | | 673,663 | | | | — | | | | (73,776 | ) | | | 43,179 | | | | 30,171 | | | | 673,237 | | | | — | |
CX Partners Fund Ltd | | | | | | | — | | | | — | | | | 15,554,767 | | | | 3,128,362 | | | | (270,024 | ) | | | (317,019 | ) | | | 3,466,868 | | | | 21,562,954 | | | | 7,144 | |
Dace Ventures I, L.P. | | | | | | | — | | | | — | | | | 1,264,582 | | | | 68,157 | | | | (452,460 | ) | | | 359,883 | | | | (48,926 | ) | | | 1,191,236 | | | | — | |
EnCap Energy Infrastructure TE Feeder, L.P. | | | | | | | — | | | | — | | | | 5,488,590 | | | | 1,876,727 | | | | (5,941,640 | ) | | | 4,674,208 | | | | (2,331,995 | ) | | | 3,765,890 | | | | 81,998 | |
Florida Real Estate Value Fund, L.P. | | | | | | | — | | | | — | | | | 6,844,132 | | | | — | | | | — | | | | — | | | | 1,203,607 | | | | 8,047,739 | | | | — | |
Fortelus Special Situations Fund LP | | | | | | | — | | | | — | | | | 4,309,086 | | | | 4,350,980 | | | | (6,696,021 | ) | | | 39,149 | | | | 951,691 | | | | 2,954,885 | | | | — | |
Garrison Opportunity Fund LLC | | | | | | | — | | | | — | | | | 17,620,138 | | | | — | | | | (7,207,675 | ) | | | — | | | | 2,206,031 | | | | 12,618,494 | | | | — | |
GTIS Brazil Real Estate Fund (Brazilian Real) LP | | | | | | | — | | | | — | | | | 20,094,808 | | | | 4,701 | | | | (1,312,651 | ) | | | (10,680 | ) | | | (2,057,706 | ) | | | 16,718,472 | | | | 807,233 | |
43
THE ENDOWMENT PMF MASTER FUND, L.P.
(A Limited Partnership)
Notes to Financial Statements, continued
December 31, 2014
| | | | | | | | | | | | | | | | | | | | | | | | | | | | | | | | | | | | | | | | | | |
Investment Funds | | Shares
3/31/2014 | | Shares
12/31/2014 | | | Beginning
Fair
Value
3/31/2014 | | | Redemptions
In-Kind | | | Transfers
In-Kind | | | Cost of
Purchases | | | Cost of
Sales* | | | Realized
Gain (Loss)
on
Investments | | | Change in
Unrealized
Appreciation/
Depreciation | | | Ending
Fair Value
12/31/2014 | | | Interest/
Dividend
Income | |
Halcyon European Structured Opportunities Fund L.P. | | | | | | | | $ | — | | | $ | — | | | $ | 56,154 | | | $ | — | | | $ | — | | | $ | — | | | $ | (1,428 | ) | | $ | 54,726 | | | $ | — | |
Harbinger Capital Partners Fund I, L.P. | | | | | | | | | — | | | | — | | | | 20,191,722 | | | | — | | | | — | | | | — | | | | (5,696,074 | ) | | | 14,495,648 | | | | — | |
HealthCor Partners Fund, L.P. | | | | | | | | | — | | | | — | | | | 7,742,635 | | | | 137,467 | | | | (1,127,260 | ) | | | 497,165 | | | | 800,376 | | | | 8,050,383 | | | | — | |
Hillcrest Fund, L.P. | | | | | | | | | — | | | | — | | | | 10,675,680 | | | | 551,299 | | | | (1,676,572 | ) | | | 632,778 | | | | 85,121 | | | | 10,268,306 | | | | — | |
Kenmont Onshore Fund, L.P. | | | | | | | | | — | | | | — | | | | 15,787 | | | | — | | | | — | | | | — | | | | — | | | | 15,787 | | | | — | |
LC Fund IV, L.P. | | | | | | | | | — | | | | — | | | | 20,139,863 | | | | 554,979 | | | | (4,609,918 | ) | | | 3,202,363 | | | | 642,986 | | | | 19,930,273 | | | | 570,223 | |
Magnetar Capital Fund LP | | | | | | | | | — | | | | — | | | | 3,896,051 | | | | — | | | | (2,414,768 | ) | | | 1,180,000 | | | | 433,448 | | | | 3,094,731 | | | | — | |
Magnetar SPV LLC | | | | | | | | | — | | | | — | | | | 1,711,346 | | | | — | | | | (92,160 | ) | | | (7,119 | ) | | | (164,835 | ) | | | 1,447,232 | | | | — | |
Middle East North Africa Opportunities Fund, L.P. | | | | | 3,969 | | | | — | | | | — | | | | 1,323,478 | | | | — | | | | (36,602 | ) | | | (294,075 | ) | | | (317,595 | ) | | | 675,206 | | | | 38,797 | |
Midstream & Resources Follow-On Fund, L.P. | | | | | | | | | — | | | | — | | | | 26,595,655 | | | | 58,461 | | | | (910,777 | ) | | | 792,142 | | | | 5,154,322 | | | | 31,689,803 | | | | 196,465 | |
Monsoon India Select Equity Fund 2, L.P. | | | | | | | | | — | | | | — | | | | 210,778 | | | | — | | | | — | | | | — | | | | 41,609 | | | | 252,387 | | | | — | |
Monsoon Infrastructure & Realty Co-Invest, L.P. | | | | | | | | | — | | | | — | | | | 13,082,919 | | | | 569,395 | | | | (403,208 | ) | | | — | | | | 1,215,028 | | | | 14,464,134 | | | | — | |
Passport Global Strategies III Ltd. | | | | | 1,896 | | | | — | | | | — | | | | 669,981 | | | | — | | | | — | | | | — | | | | (481,273 | ) | | | 188,708 | | | | — | |
Pennybacker II, LP | | | | | | | | | — | | | | — | | | | 6,589,622 | | | | 169,476 | | | | (3,205,981 | ) | | | 1,437,045 | | | | 159,838 | | | | 5,150,000 | | | | 241,681 | |
Phoenix Real Estate Fund (T) L.P. | | | | | | | | | — | | | | — | | | | 5,693,717 | | | | — | | | | (5,415,634 | ) | | | — | | | | 1,105,723 | | | | 1,383,806 | | | | — | |
PIPE Equity Partners, LLC | | | | | | | | | — | | | | — | | | | 8,854,351 | | | | — | | | | — | | | | — | | | | (1,581,651 | ) | | | 7,272,700 | | | | — | |
PIPE Select Fund LLC | | | | | | | | | — | | | | — | | | | 21,397,958 | | | | — | | | | (1,845,494 | ) | | | (47,249 | ) | | | (2,537,042 | ) | | | 16,968,173 | | | | — | |
Private Equity Investment Fund IV, L.P. | | | | | | | | | — | | | | — | | | | 5,365,481 | | | | 98,176 | | | | (737,002 | ) | | | 502,752 | | | | 79,662 | | | | 5,309,069 | | | | 6,052 | |
Private Equity Investment Fund V, L.P.** | | | | | | | | | — | | | | — | | | | 36,014,529 | | | | 5,344,650 | | | | (2,576,539 | ) | | | 1,427,328 | | | | 990,477 | | | | 41,200,445 | | | | 91,114 | |
Quantum Parallel Partners V, L.P. | | | | | | | | | — | | | | — | | | | 26,419,851 | | | | 6,690,745 | | | | (2,750,792 | ) | | | 1,028,582 | | | | 4,277,281 | | | | 35,665,667 | | | | — | |
Saints Capital VI, L.P. | | | | | | | | | — | | | | — | | | | 13,233,023 | | | | 113,830 | | | | (3,557,210 | ) | | | 2,699,043 | | | | (1,677,341 | ) | | | 10,811,345 | | | | — | |
SBC Latin America Housing US Fund, LP | | | | | | | | | — | | | | — | | | | 7,232,432 | | | | 1,833,551 | | | | (378,033 | ) | | | 46,810 | | | | 446,591 | | | | 9,181,351 | | | | — | |
Tenaska Power Fund II-A, L.P. | | | | | | | | | — | | | | — | | | | 15,466,088 | | | | 175,306 | | | | (6,771,420 | ) | | | (244,357 | ) | | | (305,743 | ) | | | 8,319,874 | | | | 245,555 | |
Trivest Fund IV, L.P. | | | | | | | | | — | | | | — | | | | 14,941,488 | | | | 24,934 | | | | (1,264,832 | ) | | | 38,212 | | | | 757,567 | | | | 14,497,369 | | | | 227,575 | |
Trustbridge Partners III, L.P. | | | | | | | | | — | | | | — | | | | 33,216,294 | | | | 321,928 | | | | (3,852,086 | ) | | | 3,554,478 | | | | 5,208,062 | | | | 38,448,676 | | | | — | |
Tuckerbrook SB Global Distressed Fund I, L.P. | | | | | | | | | — | | | | — | | | | 4,463,823 | | | | — | | | | (549,219 | ) | | | — | | | | 107,834 | | | | 4,022,438 | | | | — | |
Westview Capital Partners II, L.P. | | | | | | | | | — | | | | — | | | | 24,839,550 | | | | 1,358,022 | | | | (4,524,082 | ) | | | 2,968,397 | | | | (3,594,435 | ) | | | 21,047,452 | | | | 210,181 | |
| | | | | | | | | | | | | | | | | | | | | | | | | | | | | | | | | | | | | | | | | | |
| | | | | | | | $ | — | | | $ | — | | | $ | 444,788,202 | | | $ | 31,307,310 | | | $ | (76,089,592 | ) | | $ | 24,127,574 | | | $ | 8,939,454 | | | $ | 433,072,948 | | | $ | 2,724,018 | |
| | | | | | | | | | | | | | | | | | | | | | | | | | | | | | | | | | | | | | | | | | |
| * | Sales include return of capital. |
| ** | Voting rights have been waived for this investment. |
(6) FINANCIAL INSTRUMENTS WITH OFF-BALANCE SHEET RISK
In the normal course of business, the Investment Funds in which the Master Fund invests may trade various derivative securities and other financial instruments, and may enter into various investment activities with off-balance sheet risk both as an investor and as a principal. The Master Fund’s risk of loss in these Investment Funds is limited to the value of its investment in such Investment Funds.
(7) ADMINISTRATION AGREEMENT
In consideration for administrative, accounting, and recordkeeping services, the Master Fund pays the Administrator a monthly administration fee based on the month-end partners’ capital of the Master Fund. The Master Fund is charged, on an annual basis, 6 basis points on partners’ capital of up to $2 billion, 5 basis points on partners’ capital between the amounts of $2 billion and $5 billion, 2 basis points on partners’ capital between the amounts of $5 billion and $15 billion, and 1.25 basis points for amounts over $15 billion. The administration fee is payable monthly in arrears. The Administrator also provides the Master Fund with legal, compliance, transfer agency, and other investor related services at an additional cost.
The administration fees are paid out of the Master Fund’s assets, which decreases the net profits or increases the net losses of the partners in the Master Fund. As of December 31, 2014, the Master Fund had $1,208,927,652
44
THE ENDOWMENT PMF MASTER FUND, L.P.
(A Limited Partnership)
Notes to Financial Statements, continued
December 31, 2014
in partners’ capital. The total administration fees incurred for the period March 31, 2014 (commencement of operations) through December 31, 2014, was $770,577.
(8) RELATED PARTY TRANSACTIONS
(a) INVESTMENT MANAGEMENT FEE
In consideration of the advisory and other services provided by the Adviser to the Master Fund, the Master Fund pays the Adviser an investment management fee (the “Investment Management Fee”) equal to 0.70% on an annualized basis of the Master Fund’s partners’ capital at the end of each month, payable monthly in arrears, for the six quarters following March 31, 2014, and 0.40% on an annualized basis for periods thereafter until the period ending March 31, 2024, when the Adviser will no longer receive the Investment Management Fee.
The Master Fund’s partners bear an indirect portion of the Investment Management Fee paid by the Master Fund. The Investment Management Fee decreases the net profits or increases the net losses of the Master Fund that are credited to or debited against the capital accounts of its partners. For the period March 31, 2014 (commencement of operations) through December 31, 2014, $7,701,347 as incurred for Investment Management Fees.
(b) EXPENSE LIMITATION AGREEMENT
Through an expense limitation agreement (the “Expense Limitation Agreement”), the Adviser contractually agreed to limit total annualized expenses of the Master Fund, for the period April 1, 2014 through January 31, 2016, to the amount of 1.25%, exclusive of fees and expenses of underlying investment funds, borrowing and other investment-related costs and fees, taxes, litigation and other extraordinary expenses not incurred in the ordinary course of the Master Fund’s business.
Under the Expense Limitation Agreement, the Adviser is permitted to recover in later periods expenses it has borne to the extent that the Master Fund’s expenses fall below the rate in effect at the time of the waiver. The Master Fund, however, is not obligated to pay any such amounts beyond three years after the end of the fiscal year in which the Adviser reimbursed such expense. Any such recoupment by the Adviser shall not cause the Master Fund to exceed the annual expense limitation rate that was in effect at the time of such waiver or reimbursement. For the period April 1, 2014 through December 31, 2014, no such expense waiver has been incurred by the Master Fund.
(9) CREDIT FACILITY
The Master Fund entered into a line of credit agreement (the “Credit Agreement”) with Credit Suisse AG on July 17, 2014. The terms of the Credit Agreement provide a $50,000,000 credit facility. Borrowings under the Credit Agreement are secured by the Master Fund’s investments. The Credit Agreement provides for a commitment fee of 0.50% per annum plus interest accruing on any borrowed amounts at the three month London Interbank Offered Rate (LIBOR) plus a spread of 2.5% per annum during the commitment period and 3.00% per annum during the wind down period as defined in the Credit Agreement. There were no borrowings during the period ended December 31, 2014. The Credit Agreement expires on July 18, 2016.
45
THE ENDOWMENT PMF MASTER FUND, L.P.
(A Limited Partnership)
Notes to Financial Statements, continued
December 31, 2014
(10) FINANCIAL HIGHLIGHTS
| | | | |
| | | For the Period
March 31, 2014 Through
December 31, 20141 | |
Net investment loss to average partners’ capital2 | | | (1.04 | )% |
Expenses to average partners’ capital2,3 | | | 2.11 | % |
Portfolio turnover4 | | | 5.28 | % |
Internal rate of return since inception5 | | | 8.89 | % |
Partners’ capital, end of period (000’s) | | $ | 1,208,928 | |
An investor’s return (and operating ratios) may vary from those reflected based on the timing of capital transactions.
| 1 | The Endowment PMF Master Fund, L.P. commenced operations on March 31, 2014. |
| 2 | Ratios are calculated by dividing the indicated amount by average partners’ capital measured at the end of each month during the period. These ratios have been annualized for periods less than twelve months. |
| 3 | Expense ratios do not include expenses of acquired funds that are paid indirectly by the Master Fund as a result of its ownership in the underlying funds. Expenses include U.S. offshore withholding tax, which is only allocable to investors investing through the offshore feeder funds. |
| 4 | Not annualized for periods less than twelve months. |
| 5 | The internal rate of return since inception (“IRR”) of the limited partners is net of all fees and profit allocations to the Adviser. The IRR reported is for the Master Fund as a whole. The IRR was computed based on the actual dates of the cash inflows (capital contributions), cash outflows (cash distributions) and the ending partners’ capital as of December 31, 2014 (the residual value). |
The total return of the Master Fund for the period March 31, 2014 through December 31, 2014 is 6.17% and is calculated as geometrically linked monthly returns for each month in the period. Total return is not annualized for periods less than twelve months.
(11) SUBSEQUENT EVENTS
Management of the Master Fund has evaluated the need for additional disclosures and/or adjustments resulting from subsequent events through the date the financial statements were issued. Based on this evaluation, no adjustments were required to the financial statements as of December 31, 2014.
46
THE ENDOWMENT PMF MASTER FUND, L.P.
(A Limited Partnership)
Supplemental Information
December 31, 2014
(Unaudited)
Directors and Officers
The Master Fund’s operations are managed under the direction and oversight of the Board. Each Director serves for an indefinite term or until he or she reaches mandatory retirement, if any, as established by the Board. The Board appoints the officers of the Master Fund who are responsible for the Master Fund’s day-to-day business decisions based on policies set by the Board. The officers serve at the pleasure of the Board.
Compensation for Directors
The Master Fund, pays each of the Directors who is not an “interested person” of the Adviser, as defined in the 1940 Act (the “Independent Directors”) an annual retainer of $12,500, paid quarterly, an annual Board meeting fee of $4,500, a fee of $1,500 per informal Board meeting, a fee of $1,500 per telephonic Board meeting, an annual fee of $833 for each Compliance committee member and $625 for each Audit and Valuation committee member, an annual fee of $4,000 for the valuation committee chairman and $3,000 for each other committee chair, each of which is paid quarterly, and an annual fee of $5,000, paid quarterly, to the Lead Independent Director. There are currently six Independent Directors. In the interest of retaining Independent Directors of the highest quality, the Board intends to periodically review such compensation and may modify it as the Board deems appropriate.
Interested Directors
| | | | | | | | |
| Name, Address and Age | | Position(s) Held | | Principal Occupation(s) During the Past 5 Years | | Number of Portfolios in Fund Complex Overseen by Director | | Other Directorships Held by Director |
John A. Blaisdell1 Age: 54 Address: c/o The Endowment PMF Fund 4265 San Felipe, Suite 800, Houston, TX 77027 | | Director,
Principal
Executive Officer
(Since 2004) | | Member, Investment
Committee of the
Adviser, since 2002;
Managing Director of
Salient, since 2002. | | The Endowment PMF Funds (3); The Endowment Funds (5) | | Salient Alternative
Strategies Funds
(investment
companies) (two
funds) since 2010;
Salient MF Trust
(investment
company) (seven
funds) since 2012;
Salient Midstream
& MLP Fund
(investment
company) since
2012. |
Jeffrey R. Keay1 Age: 40 Address: c/o HarbourVest Partners, LLC One Financial Center, 44th Floor Boston, MA 0211 | | Director,
(Since 2014) | | Managing Director,
HarbourVest Partners,
LLC (private equity) | | The Endowment PMF Master Fund (1) | | None |
47
THE ENDOWMENT PMF MASTER FUND, L.P.
(A Limited Partnership)
Supplemental Information, continued
December 31, 2014
(Unaudited)
| | | | | | | | |
| Name, Address and Age | | Position(s) Held | | Principal Occupation(s) During the Past 5 Years | | Number of Portfolios in Fund Complex Overseen by Director | | Other Directorships Held by Director |
Jeffrey D. Young1 Age: 47 Address: c/o Origami Capital Partners, LLC 191 North Wacker Drive Suite 2350
Chicago, IL 60606 | | Director,
(Since 2014) | | Partner, Origami
Capital Partners, LLC
(investment adviser) | | The Endowment PMF Master Fund (1) | | None |
| 1 | This person’s status as an “interested” director arises from his affiliation with Salient Partners, L.P., which itself is an affiliate of the Master Fund, PMF Fund, L.P., PMF TEI Fund, L.P., and the Adviser. |
Independent Directors
| | | | | | | | |
| Name, Address and Age | | Position(s) Held | | Principal Occupation(s) During the Past 5 Years | | Number of Portfolios in Fund Complex Overseen by Director | | Other Directorships Held by Director |
Jonathan P. Carroll Age: 53 Address: c/o The Endowment PMF Fund 4265 San Felipe, Suite 800, Houston, TX 77027 | | Director
(Since2004) | | President of Lazarus Financial LLC (holding company) since 2006; private investor for the past six years. | | The Endowment PMF Funds (3); The Endowment Funds (5) | | Salient Alternative Strategies Funds (investment companies) (two funds) since 2010; Salient MF Trust (investment company) (seven funds) since 2012; Salient Midstream & MLP Fund (investment company) since 2012; LRR Energy, L.P. (energy company) since 2014; |
Richard C. Johnson Age: 77 Address: c/o The Endowment PMF Fund 4265 San Felipe, Suite 800, Houston, TX 77027 | | Director
(Since2004) | | Senior Counsel (retired) for Baker Botts LLP (law firm) since 2002; Managing Partner, Baker Botts, 1998 to 2002; practiced law at Baker Botts, 1966 to 2002 (1972 to 2002 as a partner). | | The Endowment PMF Funds (3); The Endowment Funds (5) | | Salient Alternative Strategies Funds (investment companies) (two funds) since 2010; Salient MF Trust (investment company) (seven funds) since 2012; Salient Midstream & MLP Fund (investment company) since 2012. |
48
THE ENDOWMENT PMF MASTER FUND, L.P.
(A Limited Partnership)
Supplemental Information, continued
December 31, 2014
(Unaudited)
| | | | | | | | |
| Name, Address and Age | | Position(s) Held | | Principal Occupation(s) During the Past 5 Years | | Number of Portfolios in Fund Complex Overseen by Director | | Other Directorships Held by Director |
G. Edward Powell Age: 78 Address: c/o The Endowment PMF Fund 4265 San Felipe, Suite 800, Houston, TX 77027 | | Director
(Since
2004) | | Principal of Mills & Stowell (private equity) since 2002. Principal, Innovation Growth Partners (consulting), since 2002; Consultant to emerging and middle market businesses, 1994-2002; Managing Partner, PriceWaterhouse & Co. (Houston Office, 1982 to 1994). | | The Endowment PMF Funds (3); The Endowment Funds (5) | | Salient Alternative Strategies Funds (investment companies) (two funds) since 2010; Salient MF Trust (investment company) (seven funds) since 2012; Salient Midstream & MLP Fund (investment company) since 2012; Energy Services International, Inc., since 2004; Therapy Track, LLC, since 2009;
Global Water Technologies, Inc.; Datavox Holdings, Inc.; Energy Services International, Inc., 2004 to 2013. |
Scott E. Schwinger Age: 49 Address: c/o The Endowment PMF Fund 4265 San Felipe, Suite 800, Houston, TX 77027 | | Director
(Since
2004) | | President, The McNair Group (management), since 2006; Senior Vice President and Chief Financial Officer, the Houston Texans (professional football team) (1999). | | The Endowment PMF Funds (3); The Endowment Funds (5) | | Salient Alternative Strategies Funds (investment companies) (two funds) since 2010; Salient MF Trust (investment company) (seven funds) since 2012; Salient Midstream & MLP Fund (investment company) since 2012;
The Make-A-Wish Foundation, since 2008; YES Prep Public Schools, since 2001. |
49
THE ENDOWMENT PMF MASTER FUND, L.P.
(A Limited Partnership)
Supplemental Information, continued
December 31, 2014
(Unaudited)
Officers of the Fund Who Are Not Directors
| | | | |
| Name, Address and Age | | Position(s) Held with the Fund | | Principal Occupation(s) During the Past 5 Years |
Paul Bachtold Age: 41 Address: c/o The Endowment PMF Fund 4265 San Felipe, Suite 800, Houston, TX 77027 | | Chief Compliance Officer (“CCO”) (Since 2010) | | CCO, Salient (since 2010); Consultant, Chicago Investment Group (compliance consulting), 2009-2010; US Compliance Manager, Barclays Global Investors, 2005-2008; Consultant, Wells Fargo Bank, 2000-2005. |
John E. Price Age: 47 Address: c/o The Endowment PMF Fund 4265 San Felipe, Suite 800, Houston, TX 77027 | | Treasurer; Principal Financial Officer (Since 2004) | | Partner, Managing Director and Chief Financial Officer of Salient since 2003. |
Jeremy Radcliffe Age: 40 Address: c/o The Endowment PMF Fund 4265 San Felipe, Suite 800, Houston, TX 77027 | | Secretary (Since 2013) | | Managing Director of Salient, since 2002. |
50
THE ENDOWMENT PMF MASTER FUND, L.P.
(A Limited Partnership)
Supplemental Information, continued
December 31, 2014
(Unaudited)
Allocation of Investments
The following chart indicates the allocation of investments among the asset classes in the Master Fund as of December 31, 2014.
| | | | | | | | |
Asset Class1 | | Fair Value | | | % | |
Consumer Products | | $ | 812,919 | | | | 0.07 | |
Energy | | | 190,662,879 | | | | 17.14 | |
Event-Driven | | | 52,475,970 | | | | 4.72 | |
Global Macro and Trading | | | 31,361,345 | | | | 2.82 | |
Healthcare | | | 60,672 | | | | 0.01 | |
Private Equity | | | 629,657,570 | | | | 56.58 | |
Real Estate | | | 135,139,954 | | | | 12.15 | |
Relative Value | | | 70,709,845 | | | | 6.36 | |
Technology | | | 1,626,395 | | | | 0.15 | |
| | | | | | | | |
Total Investments | | $ | 1,112,507,549 | | | | 100.00 | |
| | | | | | | | |
| 1 | The complete list of investments included in the following asset class categories is included in the Schedule of Investments of the Master Fund. |
Form N-Q Filings
The Master Fund files a complete schedule of portfolio holdings with the Securities and Exchange Commission for the first and third quarters of each fiscal year on Form N-Q. The Master Fund’s Form N-Q is available on the Securities and Exchange Commission website at http://www.sec.gov. The Master Fund’s Form N-Q may be reviewed and copied at the Securities and Exchange Commission Public Reference Room in Washington, DC and information regarding operation of the Public Reference Room may be obtained by calling 1-800-SEC-0330.
Proxy Voting Policies
A description of the policies and procedures that the Master Fund uses to determine how to vote proxies relating to portfolio securities is available (i) without charge, upon request, by calling 1-800-725-9456; and (ii) on the Securities and Exchange Commission website at http://www.sec.gov.
Information regarding how the Master Fund voted proxies relating to portfolio securities during the most recent 12-month period ended June 30 is available (i) without charge, upon request, by calling 1-800-725-9456; and (ii) on the Securities and Exchange Commission website at http://www.sec.gov.
Additional Information
The Master Fund’s private placement memorandum (the “PPM”) includes additional information about Directors of the Master Fund. The PPM is available, without charge, upon request by calling 1-800-725-9456.
51
THE ENDOWMENT PMF MASTER FUND, L.P.
(A Limited Partnership)
Privacy Policy (Unaudited)
The Master Fund recognizes the importance of securing personal financial information. It is our policy to safeguard any personal and financial information that may be entrusted to us. The following is a description of the Master Fund’s policy regarding disclosure of nonpublic personal information.
We collect nonpublic personal information as follows:
We collect information about our investors, including, but not limited to, the investor’s name, address, telephone number, e-mail address, social security number and date of birth. We collect that information from subscription agreements, other forms of correspondence that we receive from investors, from personal conversations and from affiliated entities as permitted by law.
We receive information about investor transactions with us, including, but not limited to, account number, account balance, investment amounts, withdrawal amounts and other financial information.
We are permitted by law to disclose nonpublic information we collect, as described above, to the Master Fund’s service providers, including the Master Fund’s investment adviser, sub-advisers, servicing agent, independent administrator, custodian, legal counsel, accountant and auditor. We do not disclose any nonpublic information about our current or former investors to nonaffiliated third parties, except as required or permitted by law. We restrict access to investor nonpublic personal information to those persons who require such information to provide products or services to investors. We maintain physical, electronic and procedural safeguards that comply with federal standards to guard investors’ nonpublic personal information.
If an investor’s investment relationship with the Master Fund involves a financial intermediary, including, but not limited to, a broker-dealer, bank or trust company, the privacy policy of such investor’s financial intermediary would govern how any nonpublic personal information would be shared by them with nonaffiliated third parties.
52
Independent Directors
Jonathan P. Carroll
Richard C. Johnson
G. Edward Powell
Scott E. Schwinger
Interested Directors and Officers
John A. Blaisdell, Director and Principal Executive Officer
John E. Price, Treasurer and Principal Financial Officer
Jeremy Radcliffe, Secretary
Paul A. Bachtold, Chief Compliance Officer
Investment Adviser
Endowment Advisers, L.P.
Houston, TX
Fund Administrator and Transfer Agent
Citi Fund Services Ohio, Inc.
Columbus, OH
Custodian
Citibank, N.A.
New York, NY
Independent Registered Public Accounting Firm
KPMG LLP
Columbus, OH
Legal Counsel
K&L Gates LLP
Boston, MA

Item 2. Code of Ethics.
(a) The registrant has adopted a code of ethics that applies to the registrant’s principal executive officer, principal financial officer, principal accounting officer or controller, or persons performing similar functions. This code of ethics is included as Exhibit 12(a)(1).
(b) During the period covered by the report, with respect to the registrant’s code of ethics that applies to its principal executive officer, principal financial officer, principal accounting officer or controller, or persons performing similar functions; there have been no amendments to, nor any waivers granted from, a provision that relates to any element of the code of ethics definition enumerated in paragraph (b) of this Item 2.
Item 3. Audit Committee Financial Expert.
3(a)(1) The registrant’s board of directors has determined that the registrant has at least one audit committee financial expert serving on its audit committee.
3(a)(2) The audit committee financial expert is G. Edward Powell, who is “independent” for purposes of this Item 3 of Form N-CSR.
Item 4. Principal Accountant Fees and Services.
| | | | |
| | | Current Year | |
Audit Fees | | $ | 12,500 | |
Audit-Related Fees | | $ | 0 | |
Tax Fees | | $ | 0 | |
All Other Fees | | $ | 0 | |
(e)(1) Disclose the audit committee’s pre-approval policies and procedures described in paragraph (c)(7) of Rule 2-01 of Regulation S-X.
The audit committee may delegate its authority to pre-approve audit and permissible non-audit services to one or more members of the committee. Any decision of such members to pre-approve services shall be presented to the full audit committee at its next regularly scheduled meeting.
(2) Disclose the percentage of services described in each of paragraphs (b) through (d) of this item that were approved by the audit committee pursuant to paragraph (c) (7)(i)(c) of Rule 2-01 of Regulation S-X.
(f) Not applicable.
(g) Disclose the aggregate non-audit fees billed by the registrant’s accountant for services rendered to registrant, and rendered to the registrant’s investment adviser (not including any sub-adviser whose role is primarily portfolio management and is subcontracted with or overseen by another investment adviser), and any entity controlling, controlled by, or under common control with the adviser that provides ongoing services to the registrant for each of the last two fiscal years of the registrant.
(h) Not applicable.
Item 5. Audit Committee of Listed Registrants.
Not applicable.
Item 6. Investments.
(a) Schedule of Investments as of the close of the reporting period is included in the report to the shareholders filed under item 1 of this form.
(b) Not applicable.
Item 7. Disclosure of Proxy Voting Policies and Procedures for Closed-End Management Investment Companies.
A closed-end management investment company that is filing an annual report on this Form N-CSR must, unless it invests exclusively in non-voting securities, describe the policies and procedures that it uses to determine how to vote proxies relating to portfolio securities, including the procedures that the company uses when a vote presents a conflict between the interests of its shareholders, on the one hand, and those of the company’s investment adviser; principal underwriter; or any affiliated person (as defined in section 2(a)(3) of the Investment Company Act of 1940 (15 U.S.C. 80a-2(a)(3)) and the rules thereunder) of the company, its investment adviser, or its principal underwriter, on the other. Include any policies and procedures of the company’s investment adviser, or any other third party, that the company uses, or that are used on the company’s behalf, to determine how to vote proxies relating to portfolio securities.
These policies are included as Exhibit 12(a)(4).
Item 8. Portfolio Managers of Closed-End Management Investment Companies.
The Adviser’s Investment Committee Members
As of the date of the filing, the Investment Committee is responsible for the day-to-day management of the Fund’s portfolio. The Endowment PMF Master Fund, L.P. (the “Master Fund”), PMF Fund, L.P. (the “PMF Fund”), and PMF TEI Fund, L.P. (the “TEI Fund”) are registered investment companies (collectively, the “Fund Complex” and each individually the “Fund”). The members of the Investment Committee (each an “Investment Committee Member”) are: Messrs. Lee G. Partridge, Jeremy L. Radcliffe, William K. Enszer, William B. Hunt and William R. Guinn.
Mr. Partridge has served as an Investment Committee Member since January 15, 2013, and has served as Chief Investment Officer of Salient Partners, L.P. (“Salient”), which owns Salient Trust Co., LTA, a trust company chartered under the laws of the State of Texas, since January 15, 2013. Mr. Radcliffe has served as an Investment Committee Member since 2014 and Managing Director of Salient since 2002. Previously, he held the position of Partner of The Redstone Companies, L.P. and certain affiliates thereof (from 1998-2002 (collectively, “Redstone”)). Mr. Enszer has served as an Investment Committee Member since 2014 and Director of Salient since 2010. Previously, he held the position of Vice President of Redstone Asset Management (from 2005-2010). Mr. Hunt has served as an Investment Committee Member since 2014 and as Chief Risk Officer of Salient since 2014. He previously held positions as a Senior Analyst and Portfolio Manager of Iridian Asset Management (from 1996-2011) and Professor at Southern Methodist University (from 1991-2000). Mr. Guinn has served as an Investment Committee Member since 2014 and Director of Salient since 2013. Previously, he held the position of Director of Strategic Partnerships and Opportunistic Investments at the Teacher Retirement System of Texas (2009-2013). Each member of the Investment Committee reviews asset allocation recommendations made by the Adviser’s representatives, manager due diligence and recommendations and, by a majority vote of the Investment Committee, determines asset allocation and manager selection.
The Adviser and certain other entities controlled by the Principals manage investment programs which are similar to that of the Fund, and the Adviser and/or the Principals may in the future serve as an investment adviser or otherwise manage or direct the investment activities of other registered and/or private investment vehicles with investment programs similar to the Funds.
Other Accounts Managed by the Investment Adviser
Certain Investment Committee Members, who are primarily responsible for the day-to-day management of the Fund, also manage other registered investment companies, other pooled investment vehicles and other accounts, as indicated below. The following tables identify, as of December 31, 2014: (i) the number of other registered investment companies, other pooled investment vehicles and other accounts managed by the Investment Committee Member and the total assets of such companies, vehicles and accounts; and (ii) the number and total assets of such companies, vehicles and accounts with respect to which the advisory fee is based on performance.
| | | | | | | | | | | | | | | | |
Name | | Number of Other
Accounts | | | Total Assets of Other
Accounts | | | Number of Other Accounts
Subject to a Performance
Fee | | | Total Assets of Other
Accounts Subject to
a Performance Fee | |
Jeremy Radcliffe | | | | | | | | | | | | | | | | |
Registered investment companies (1) | | | 15 | | | $ | 2.84 billion | | | | 0 | | | $ | — | |
Other pooled investment companies (1) | | | 20 | | | $ | 1.79 billion | | | | 3 | | | $ | 477.55 million | |
Other accounts | | | 4301 | | | $ | 16.40 billion | | | | 3 | | | $ | 10.59 billion | |
Lee Partridge | | | | | | | | | | | | | | | | |
Registered investment companies (1) | | | 13 | | | $ | 3.73 billion | | | | 0 | | | $ | — | |
Other pooled investment companies (1) | | | 16 | | | $ | 1.43 billion | | | | 3 | | | $ | 477.55 million | |
Other accounts | | | 4301 | | | $ | 15.13 billion | | | | 3 | | | $ | 10.59 billion | |
William K. Enszer | | | | | | | | | | | | | | | | |
Registered investment companies (1) | | | 5 | | | $ | 363.81 million | | | | 0 | | | $ | — | |
Other pooled investment companies (1) | | | 4 | | | $ | — | | | | 0 | | | $ | — | |
Other accounts | | | 0 | | | $ | — | | | | 0 | | | $ | — | |
William B. Hunt | | | | | | | | | | | | | | | | |
Registered investment companies (1) | | | 5 | | | $ | 363.81 million | | | | 0 | | | $ | — | |
Other pooled investment companies (1) | | | 4 | | | $ | — | | | | 0 | | | $ | — | |
Other accounts | | | 0 | | | $ | — | | | | 0 | | | $ | — | |
William R. Guinn | | | | | | | | | | | | | | | | |
Registered investment companies (1) | | | 8 | | | $ | 2.55 billion | | | | 0 | | | $ | — | |
Other pooled investment companies (1) | | | 7 | | | $ | 1.06 billion | | | | 2 | | | $ | 426.78 million | |
Other accounts | | | 4300 | | | $ | 5.90 billion | | | | 2 | | | $ | 87.82 million | |
| (1) | For registered investment companies and pooled investment vehicles managed, the number of vehicles reported for master feeder structures includes both the master fund and feeder funds while the corresponding total assets reported reflect the assets of the master fund only. |
Conflicts of Interest of the Adviser
From time to time, potential conflicts of interest may arise between an Investment Committee Member’s management of the investments of the Fund, on the one hand, and the management of other registered investment companies, pooled investment vehicles and other accounts (collectively, “other accounts”), on the other. The other accounts might have similar investment objectives or strategies as the Fund, track the same index the Fund tracks or otherwise hold, purchase, or sell securities that are eligible to be held, purchased or sold by the Fund. The other accounts might also have different investment objectives or strategies than the Fund.
Knowledge and Timing of Fund Trades. A potential conflict of interest may arise as a result of the Investment Committee Member’s day-to-day management of a Fund. Because of their positions with the Fund, the Investment Committee Members know the size, timing and possible market impact of the Fund’s trades. It is theoretically possible that the Investment Committee Members could use this information to the advantage of other accounts they manage and to the possible detriment of the Fund.
Investment Opportunities. A potential conflict of interest may arise as a result of the Investment Committee Member’s management of a number of accounts with varying investment guidelines. Often, an investment opportunity may be suitable for both the Fund and other accounts managed by the Investment Committee Member, but may not be available in sufficient quantities for both the Fund and the other accounts to participate fully. Similarly, there may be limited opportunity to sell an investment held by the Fund and other accounts. The Adviser has adopted policies and procedures reasonably designed to allocate investment opportunities on a fair and equitable basis over time.
Performance Fees. An Investment Committee Member may advise certain accounts with respect to which the advisory fee is based entirely or partially on performance. Performance fee arrangements may create a conflict of interest for the Investment Committee Member in that the Member may have an incentive to allocate the investment opportunities that he or she believes might be the most profitable to such other accounts instead of allocating them to the Fund.
Compensation to Investment Committee Members
Messrs. Partridge and Radcliffe indirectly own equity interests in the Adviser. Messrs. Enszer, Hunt and Guinn receive all of their compensation based on objective and subjective performance assessments of their work, which may take into account the size of the Master Fund and the other funds within the Fund Complex and the management and servicing fees charged thereon, as well as other funds managed by Salient affiliates for which they has significant involvement. Messrs. Partridge and Radcliffe also own, directly or indirectly, equity in the general partner of another fund, and are compensated directly on performance (based on an incentive allocation) and the size of the fund’s asset base. In addition, Messrs. Partridge and Radcliffe are partners and principal executive officers of Salient and related affiliates and subsidiaries (collectively, the “Salient Group”), which pays them a base salary and potential bonus. These individuals are responsible for the investment processes and management of the Salient Group. Messrs. Partridge and Radcliffe believe that to the extent that they are successful in their investment endeavors, the greater the number of assets over time and the more significant their compensation and equity value will be from the Salient Group.
Securities Ownership of Investment Committee Members
The table below shows the dollar range of the interests of each Fund beneficially owned as of December 31, 2014 by each Investment Committee Member.
| | | | | | | | | | | | |
Investment Committee Member | | Master Fund | | | PMF Fund | | | TEI Fund | |
Jeremy L. Radcliffe | | | None | | | | None | | | | None | |
Lee G. Partridge | | | None | | | | None | | | | None | |
William K. Enszer | | | None | | | | None | | | | None | |
William B. Hunt | | | None | | | | None | | | | None | |
William R. Guinn | | | None | | | | None | | | | None | |
Item 9. Purchases of Equity Securities by Closed-End Management Investment Company and Affiliated Purchasers.
Not applicable.
Item 10. Submission of Matters to a Vote of Security Holders.
Not applicable.
Item 11. Controls and Procedures.
The registrant’s principal executive officer and principal financial officer have concluded, based on their evaluation of the registrant’s disclosure controls and procedures as conducted within 90 days of the filing date of this report, that these disclosure controls and procedures are adequately designed and are operating effectively to ensure that information required to be disclosed by the registrant on Form N-CSR is (i) accumulated and communicated to the investment company’s management, including its certifying officers, to allow timely decisions regarding required disclosure; and (ii) recorded, processed, summarized and reported within the time periods specified in the Securities and Exchange Commission’s rules and forms.
There were no changes in the registrant’s internal control over financial reporting (as defined in Rule 30a-3(d) under the Act (17 CFR 270.30a-3(d)) that occurred during the fourth fiscal quarter of the period covered by this report that have materially affected or are reasonably likely to materially affect, the registrant’s internal control over financial reporting.
Item 12. Exhibits.
(a)(1) Code of ethics that is subject to Item 2 is attached hereto.
(a)(2) Certifications pursuant to Rule 30a-2(a) are attached hereto.
(a)(3) Not applicable.
(a)(4) Proxy voting policies and procedures pursuant to Item 7 are attached hereto.
(b) Certifications pursuant to Rule 30a-2(b) are furnished herewith.
SIGNATURES
Pursuant to the requirements of the Securities Exchange Act of 1934 and the Investment Company Act of 1940, the registrant has duly caused this report to be signed on its behalf by the undersigned, thereunto duly authorized.
| | |
| (Registrant) PMF TEI Fund, L.P. |
| |
| By (Signature and Title) | | /s/ John A. Blaisdell |
| | John A. Blaisdell |
| | Principal Executive Officer |
Pursuant to the requirements of the Securities Exchange Act of 1934 and the Investment Company Act of 1940, this report has been signed below by the following persons on behalf of the registrant and in the capacities and on the dates indicated.
| | |
| By (Signature and Title) | | /s/ John A. Blaisdell |
| | John A. Blaisdell |
| | Principal Executive Officer |
| | |
| |
| By (Signature and Title) | | /s/ John E. Price |
| | John E. Price |
| | Principal Financial Officer |