Exhibit 99.1
Granite Considerations---Granite Overview
Safe Harbor Certain statements in this document regarding anticipated financial, business, legal or other outcomes including business and market conditions, outlook and other similar statements relating to Rayonier Advanced Materials’ future events, developments, or financial or operational performance or results, are “forward-looking statements” made pursuant to the safe harbor provisions of the Private Securities Litigation Reform Act of 1995 and other federal securities laws. These forward-looking statements are identified by the use of words such as “may,” “will,” “should,” “expect,” “estimate,” “believe,” “intend,” “forecast,” “anticipate,” “guidance,” and other similar language. However, the absence of these or similar words or expressions does not mean a statement is not forward-looking. While we believe these forward-looking statements are reasonable when made, forward-looking statements are not guarantees of future performance or events and undue reliance should not be placed on these statements. Although we believe the expectations reflected in any forward-looking statements are based on reasonable assumptions, we can give no assurance these expectations will be attained and it is possible actual results may differ materially from those indicated by these forward-looking statements due to a variety of risks and uncertainties. Our operations are subject to a number of risks and uncertainties including, but not limited to, those listed below. When considering an investment in our securities, you should carefully read and consider these risks, together with all other information in our Annual Report on Form 10-K and our other filings and submissions to the SEC, which provide much more information and detail on the risks described below. If any of the events described in the following risk factors actually occur, our business, financial condition or operating results, as well as the market price of our securities, could be materially adversely affected. These risks and events include, without limitation: Our businesses we operate are highly competitive and many of them are cyclical, especially in commodity markets, which may result in fluctuations in pricing and volume that can adversely impact our business, financial condition and results of operations; Our ten largest customers represent approximately 35% of our 2018 revenue, and the loss of all or a substantial portion of our revenue from these large customers could have a material adverse effect on us; A material disruption at one of our major manufacturing facilities could prevent us from meeting customer demand, reduce our sales and profitability, increase our cost of production and capital needs, or otherwise adversely affect our business, financial condition and results of operation; Changes in raw material and energy availability and prices could affect our results of operations and financial condition; The availability of, and prices for, wood fiber may significantly impact our business, results of operations and financial condition; We are subject to risks associated with manufacturing and selling products and otherwise doing business outside of the United States; Our operations require substantial capital for ongoing maintenance, repair and replacement of existing facilities and equipment; Currency fluctuations may have a negative impact on our business, financial condition and results of operations; Restrictions on trade through tariffs, countervailing and anti-dumping duties, quotas and other trade barriers, in the United States and internationally, especially with respect to China, Canada and as a result of “Brexit”, could adversely affect our ability to access certain markets and otherwise impact our results of operations; We depend on third parties for transportation services and increases in costs and the availability of transportation could adversely affect our business; Our business is subject to extensive environmental laws, regulations and permits that may restrict or adversely affect our ability to conduct our business; The impacts of climate-related initiatives remain uncertain at this time; Our failure to maintain satisfactory labor relations could have a material adverse effect on our business; We are dependent upon attracting and retaining key personnel, the loss of whom could adversely affect our business; Failure to develop new products or discover new applications for our existing products, or our inability to protect the intellectual property underlying such new products or applications, could have a negative impact on our business; Risk of loss of the Company’s intellectual property and sensitive business information, or disruption of its manufacturing operations, in each case due to cyberattacks or cyber security breaches, could adversely impact the Company; We may need to make significant additional cash contributions to our retirement benefit plans if investment returns on pension assets are lower than expected or interest rates decline, and/or due to changes to regulatory, accounting and actuarial requirements; We have significant debt obligations that could adversely affect our business and our ability to meet our obligations; The phase-out of LIBOR as an interest rate benchmark could result in an increase to our borrowing costs; Challenges in the commercial and credit environments may materially adversely affect our future access to capital; We may need additional financing in the future to meet our capital needs or to make acquisitions, and such financing may not be available on favorable terms, if at all, and may be dilutive to existing stockholders; and the inability to effectively integrate the Tembec acquisition and meet our financial objectives therefrom, and any future acquisitions we may make, may affect our results. Other important factors that could cause actual results or events to differ materially from those expressed in forward-looking statements that may have been made in this document are described or will be described in our filings with the U.S. Securities and Exchange Commission, including our Annual Report on Form 10-K and Quarterly Reports on Form 10-Q. Rayonier Advanced Materials assumes no obligation to update these statements except as is required by law. 2
Non-GAAP Financial Measures These presentation materials contain certain non-GAAP financial measures, including EBITDA, adjusted EBITDA, adjusted EBITDA margin, adjusted free cash flows, adjusted operating income, adjusted net income, adjusted net income per share, adjusted diluted earnings per share and adjusted net debt. These non-GAAP measures are reconciled to each of their respective most directly comparable GAAP financial measures in the appendix of these presentation materials.We believe these non-GAAP measures provide useful information to our board of directors, management and investors regarding certain trends relating to our financial condition and results of operations. Our management uses these non-GAAP measures to compare our performance to that of prior periods for trend analyses, purposes of determining management incentive compensation and budgeting, forecasting and planning purposes. We do not consider these non-GAAP measures an alternative to financial measures determined in accordance with GAAP. The principal limitations of these non-GAAP financial measures are that they may exclude significant expenses and income items that are required by GAAP to be recognized in our consolidated financial statements. In addition, they reflect the exercise of management’s judgment about which expenses and income items are excluded or included in determining these non-GAAP financial measures. In order to compensate for these limitations, management provides reconciliations of the non-GAAP financial measures we use to their most directly comparable GAAP measures. Non-GAAP financial measures should not be relied upon, in whole or part, in evaluating the financial condition, results of operations or future prospects of the Company. 3
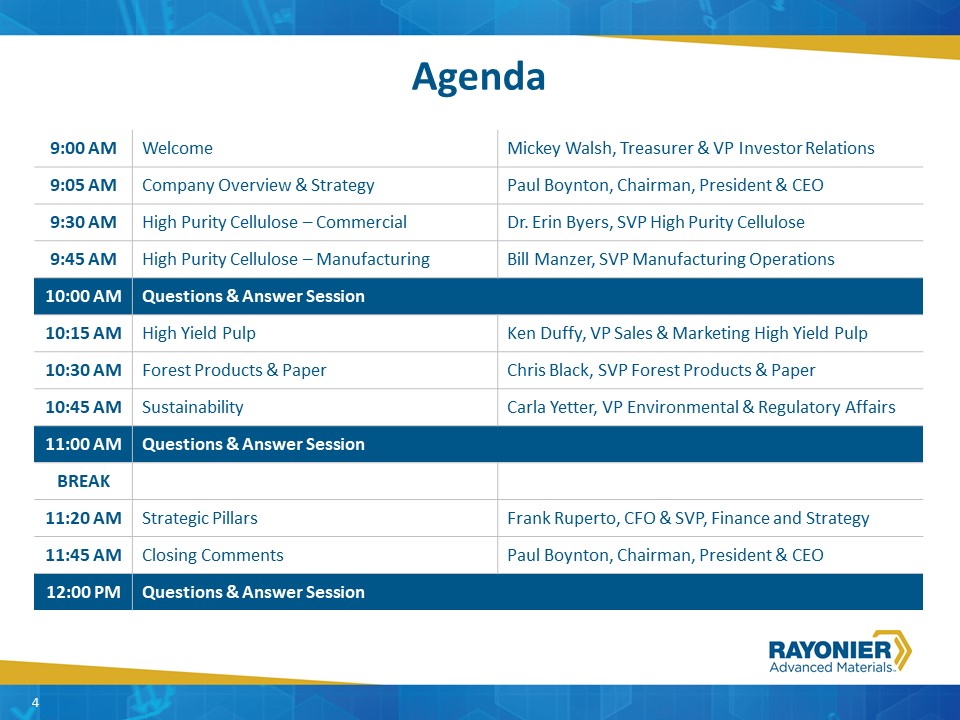
Granite Considerations---Granite Overview Agenda 9:00 AM Welcome Mickey Walsh, Treasurer & VP Investor Relations 9:05 AM Company Overview & Strategy Paul Boynton, Chairman, President & CEO 9:30 AM High Purity Cellulose – Commercial Dr. Erin Byers, SVP High Purity Cellulose 9:45 AM High Purity Cellulose – Manufacturing Bill Manzer, SVP Manufacturing Operations 10:00 AM Questions & Answer Session 10:15 AM High Yield Pulp Ken Duffy, VP Sales & Marketing High Yield Pulp 10:30 AM Forest Products & Paper Chris Black, SVP Forest Products & Paper 10:45 AM Sustainability Carla Yetter, VP Environmental & Regulatory Affairs 11:00 AM Questions & Answer Session BREAK 11:20 AM Strategic Pillars Frank Ruperto, CFO & SVP, Finance and Strategy 11:45 AM Closing Comments Paul Boynton, Chairman, President & CEO 12:00 PM Questions & Answer Session 4

Investor Day – 2019 Paul Boynton Chairman, President & Chief Executive Officer
Values and visionYou know us better than you thinkOver 90 years of continuous improvement and innovationRYAM today…Strategy to drive growth and valueGo-to-Market strategyPillars of growthPortfolio evaluationDisciplined capital allocation Rayonier Advanced MaterialsNYSE Investor Day 6
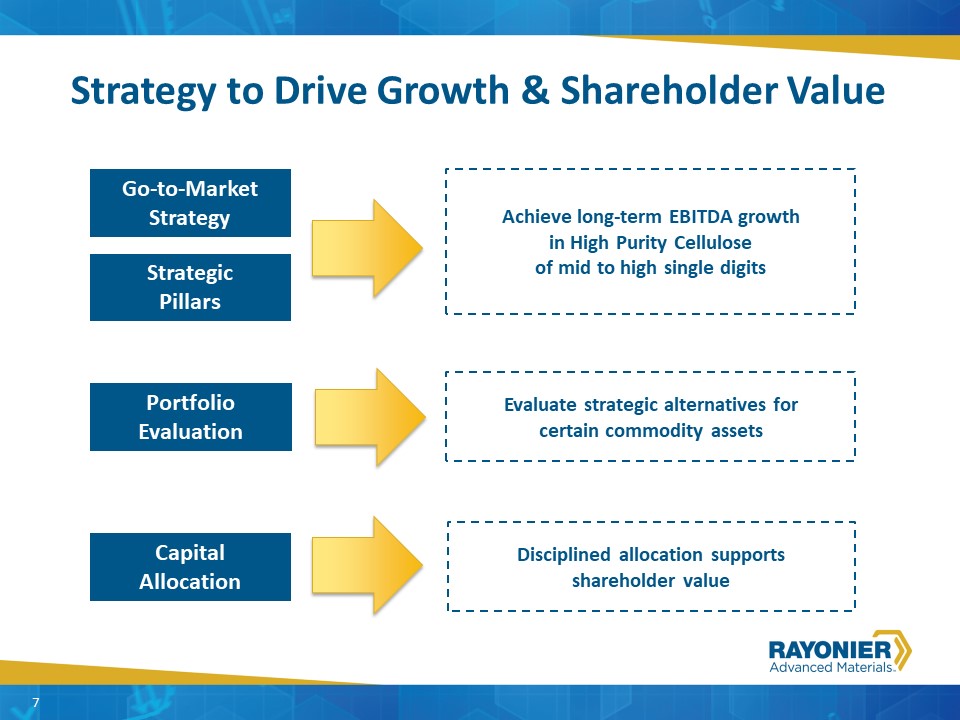
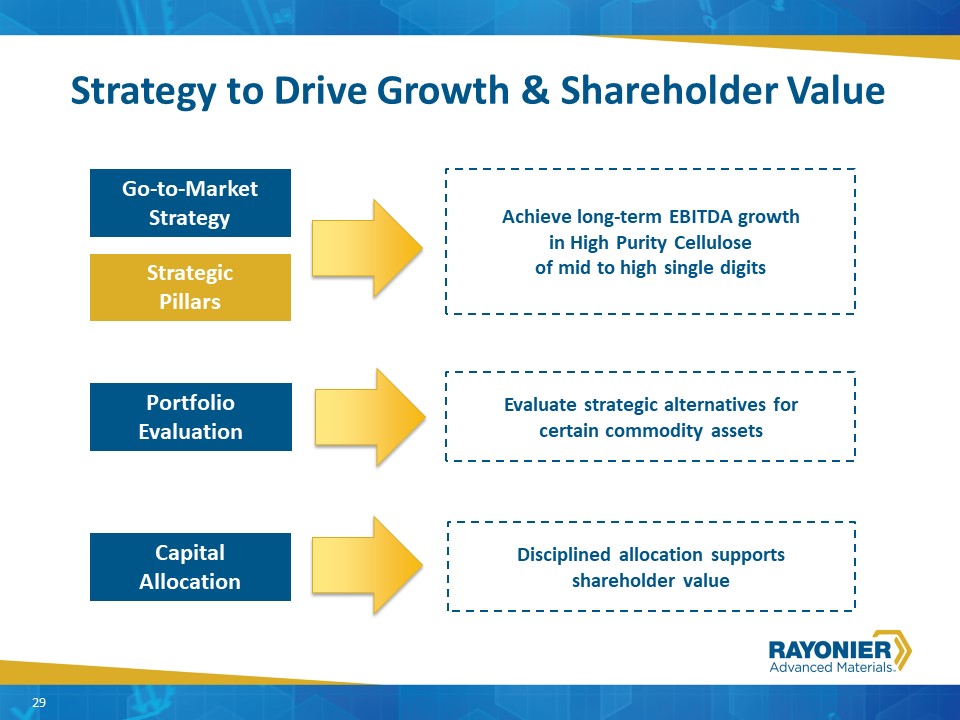
Granite Considerations---Granite Overview Strategy to Drive Growth & Shareholder Value Go-to-Market Strategy Strategic Pillars Capital Allocation Portfolio Evaluation Achieve long-term EBITDA growth in High Purity Cellulose of mid to high single digits Evaluate strategic alternatives for certain commodity assets Disciplined allocation supports shareholder value 7
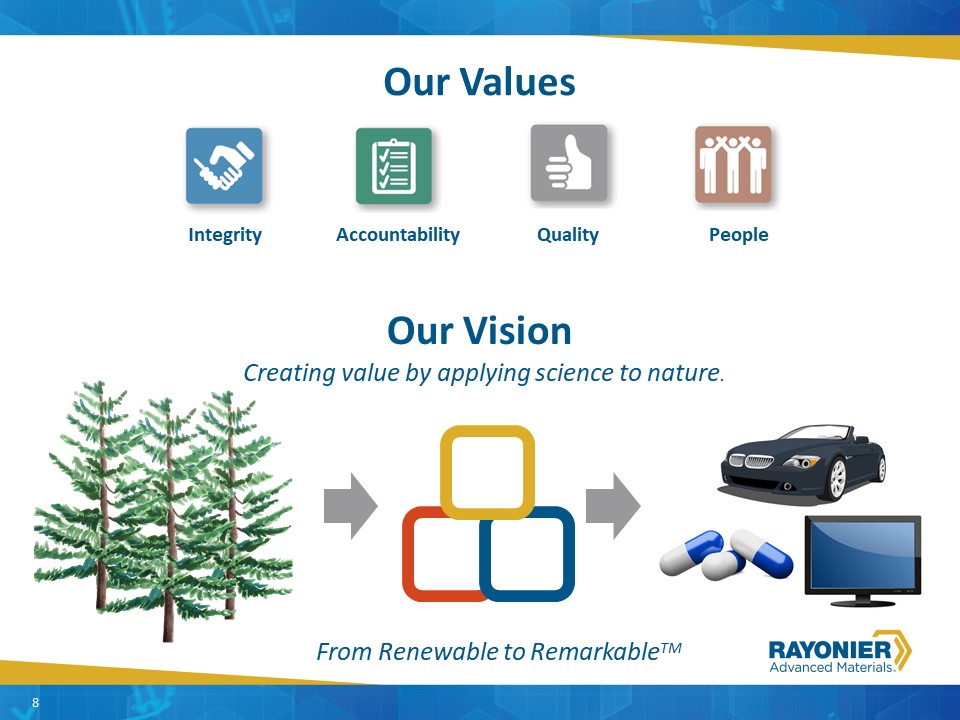
Creating value by applying science to nature. Our Values Integrity Accountability Quality People Our Vision z z z 8 From Renewable to RemarkableTM
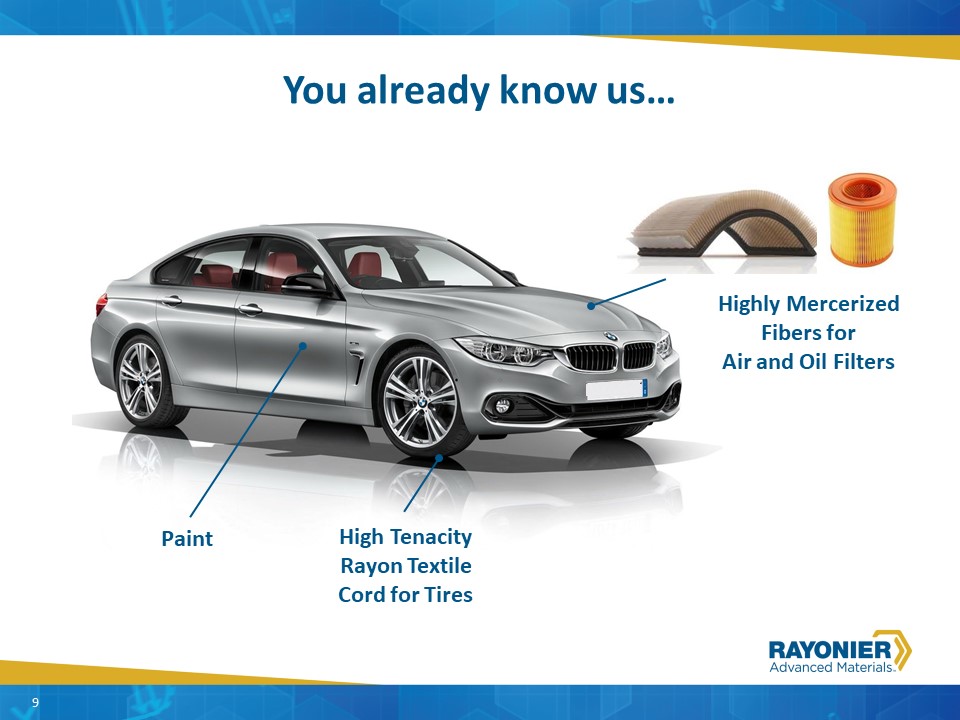
9 You already know us… Paint High Tenacity Rayon Textile Cord for Tires Highly Mercerized Fibers for Air and Oil Filters 9

10 You already know us… Protective Polarizing Film for LCD Screens 10

You already know us… Time Release CoatingSpacing Agent in Pharmaceuticals Thickening Agents 11
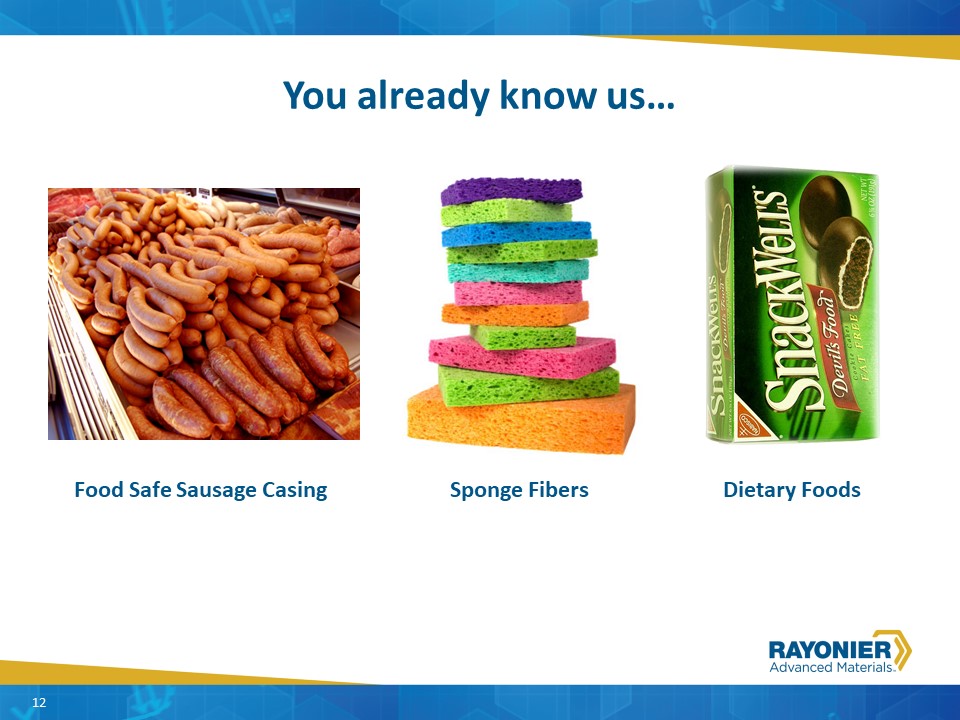
You already know us… Food Safe Sausage Casing Sponge Fibers Dietary Foods 12

Over 90 Years of Creating Value 13
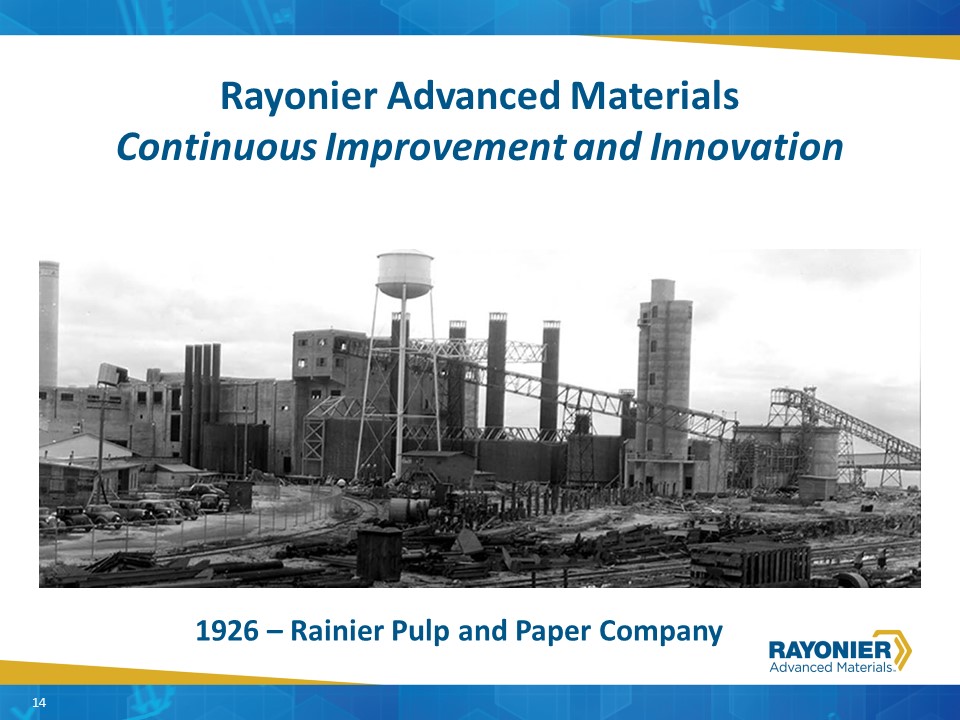
Rayonier Advanced MaterialsContinuous Improvement and Innovation 1926 – Rainier Pulp and Paper Company 14
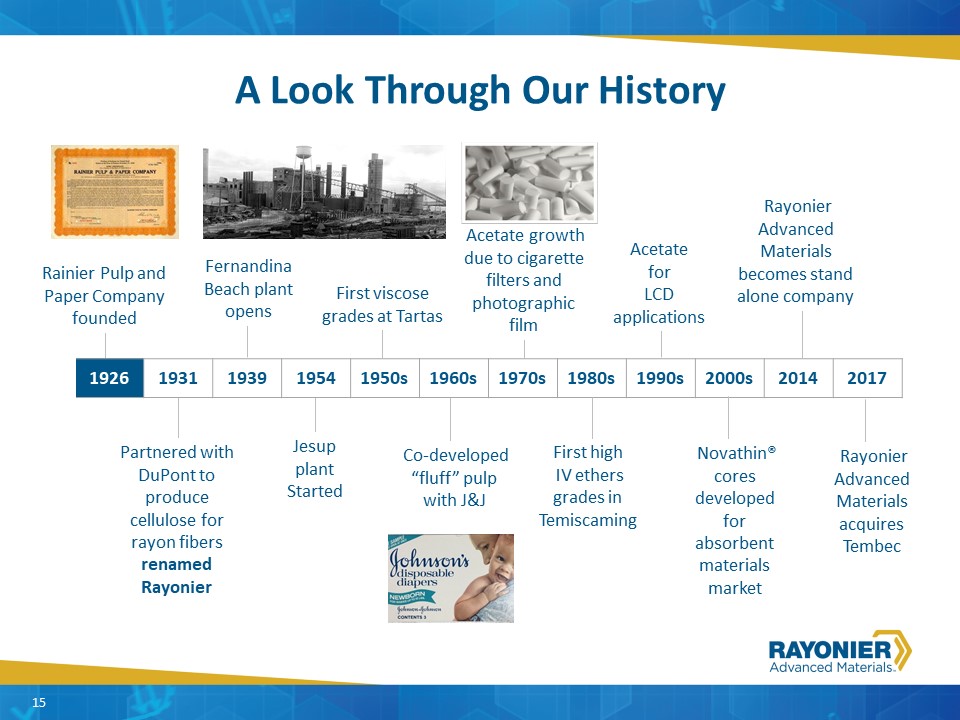
Fernandina Beach plant opens A Look Through Our History 1926 1931 1939 1954 1950s 1960s 1970s 1980s 1990s 2000s 2014 2017 Rainier Pulp and Paper Company founded Partnered with DuPont to produce cellulose for rayon fibers renamed Rayonier Jesup plant Started First viscose grades at Tartas Co-developed “fluff” pulpwith J&J Acetate growth due to cigarette filters and photographic film First high IV ethers grades in Temiscaming Rayonier Advanced Materials becomes stand alone company Novathin® cores developed for absorbent materials market Rayonier Advanced Materials acquires Tembec Acetate for LCD applications 15
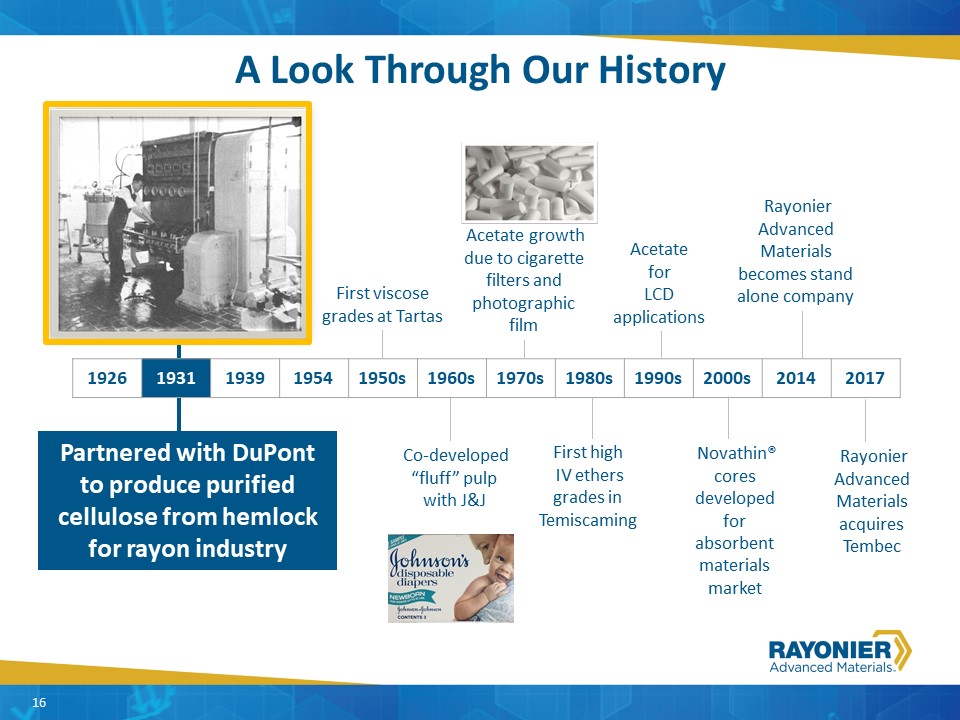
A Look Through Our History 1926 1931 1939 1954 1950s 1960s 1970s 1980s 1990s 2000s 2014 2017 First viscose grades at Tartas Co-developed “fluff” pulpwith J&J Acetate growth due to cigarette filters and photographic film First high IV ethers grades in Temiscaming Rayonier Advanced Materials becomes stand alone company Novathin® cores developed for absorbent materials market Rayonier Advanced Materials acquires Tembec Acetate for LCD applications Partnered with DuPont to produce purified cellulose from hemlock for rayon industry 16
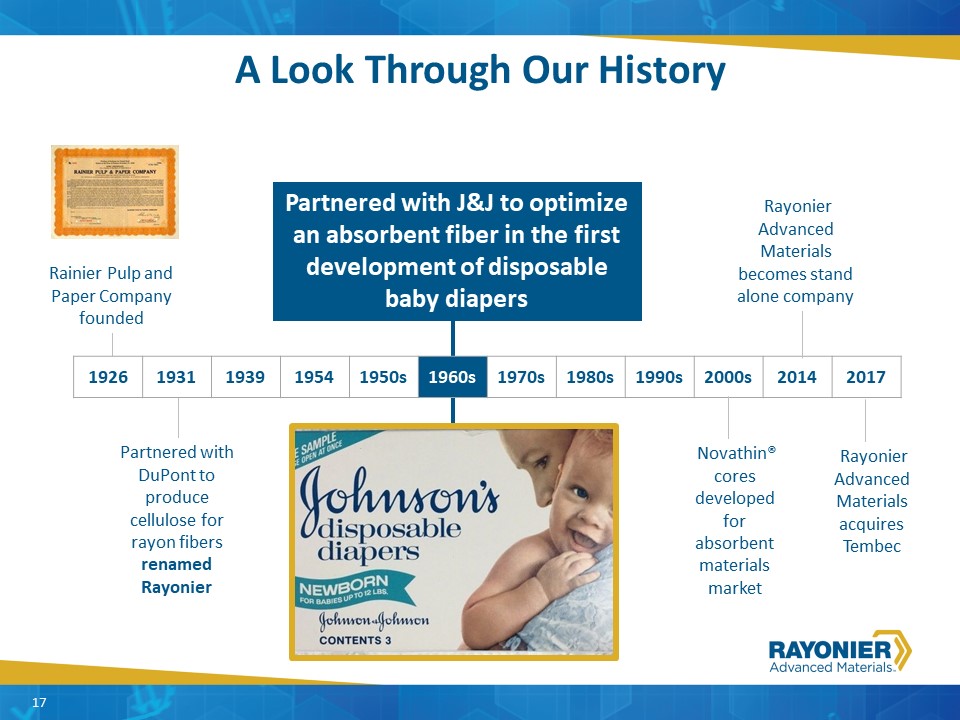
Rainier Pulp and Paper Company founded 1926 1931 1939 1954 1950s 1960s 1970s 1980s 1990s 2000s 2014 2017 Partnered with DuPont to produce cellulose for rayon fibers renamed Rayonier Improved Fluff with J&J Rayonier Advanced Materials becomes stand alone company Novathin® cores developed for absorbent materials market Rayonier Advanced Materials acquires Tembec Partnered with J&J to optimize an absorbent fiber in the first development of disposable baby diapers 17 A Look Through Our History

Rainier Pulp and Paper Company founded Fernandina Beach plant opens 1926 1931 1939 1954 1950s 1960s 1970s 1980s 1990s 2000s 2014 2017 Partnered with DuPont to produce cellulose for rayon fibers renamed Rayonier First viscose grades at Tartas Acetate growth due to cigarette filters and photographic film Rayonier Advanced Materials becomes stand alone company Novathin® cores developed for absorbent materials market Acetate for LCD applications NovaThin® patented absorbent cores 18 A Look Through Our History
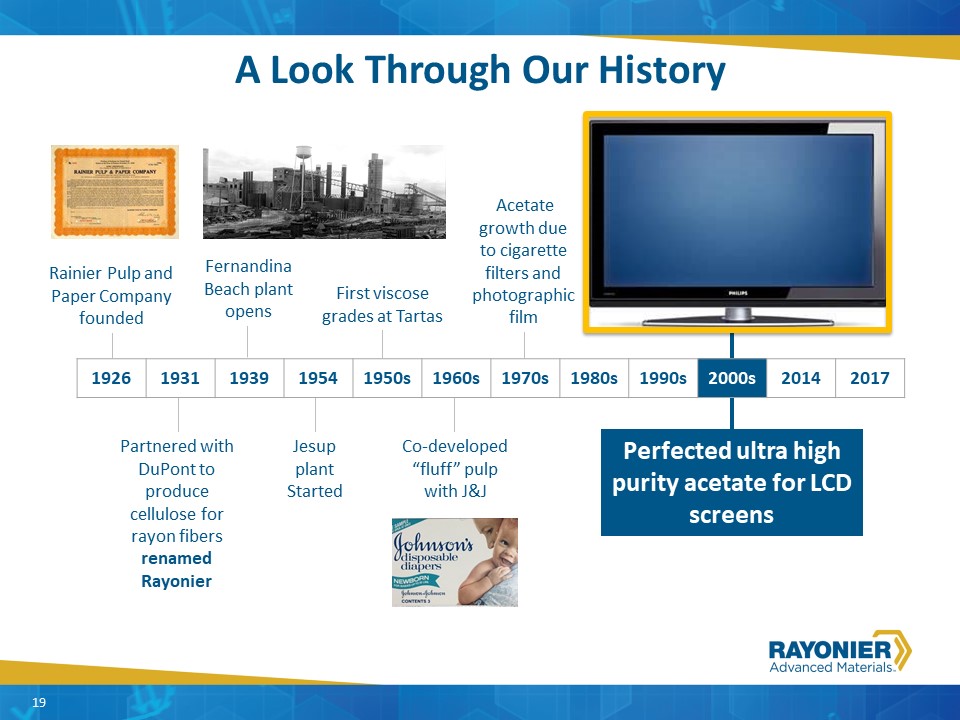
Fernandina Beach plant opens Rainier Pulp and Paper Company founded Partnered with DuPont to produce cellulose for rayon fibers renamed Rayonier Jesup plant Started First viscose grades at Tartas Co-developed “fluff” pulpwith J&J Acetate growth due to cigarette filters and photographic film Perfected ultra high purity acetate for LCD screens 19 1926 1931 1939 1954 1950s 1960s 1970s 1980s 1990s 2000s 2014 2017 A Look Through Our History
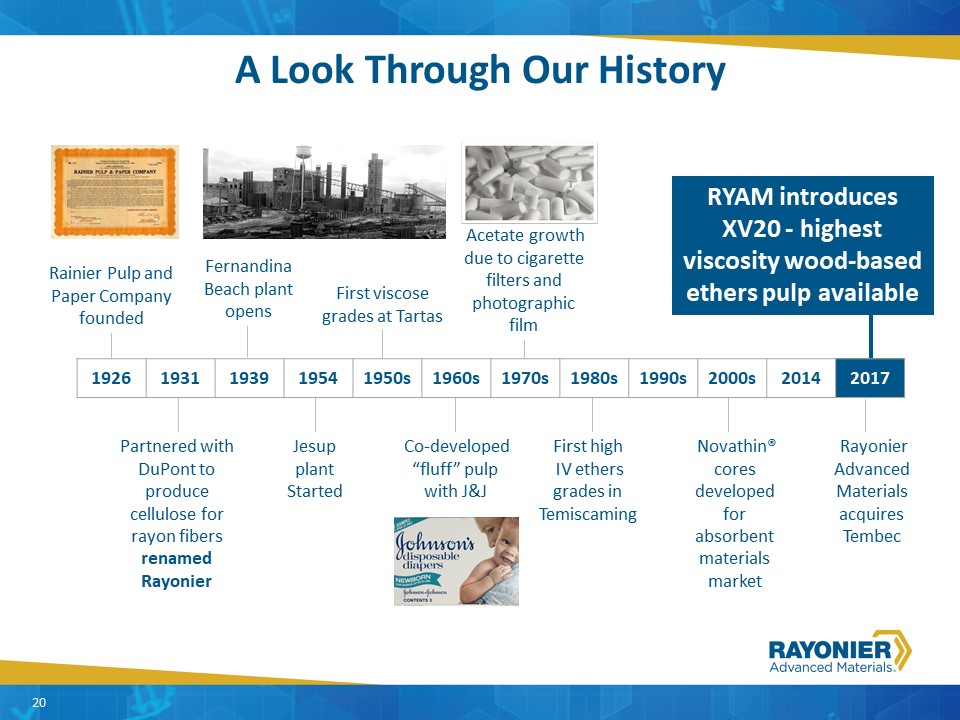
Fernandina Beach plant opens Partnered with DuPont to produce cellulose for rayon fibers renamed Rayonier Jesup plant Started First viscose grades at Tartas Co-developed “fluff” pulpwith J&J Acetate growth due to cigarette filters and photographic film First high IV ethers grades in Temiscaming Novathin® cores developed for absorbent materials market Rayonier Advanced Materials acquires Tembec RYAM introduces XV20 - highest viscosity wood-based ethers pulp available 20 A Look Through Our History 1926 1931 1939 1954 1950s 1960s 1970s 1980s 1990s 2000s 2014 2017 Rainier Pulp and Paper Company founded
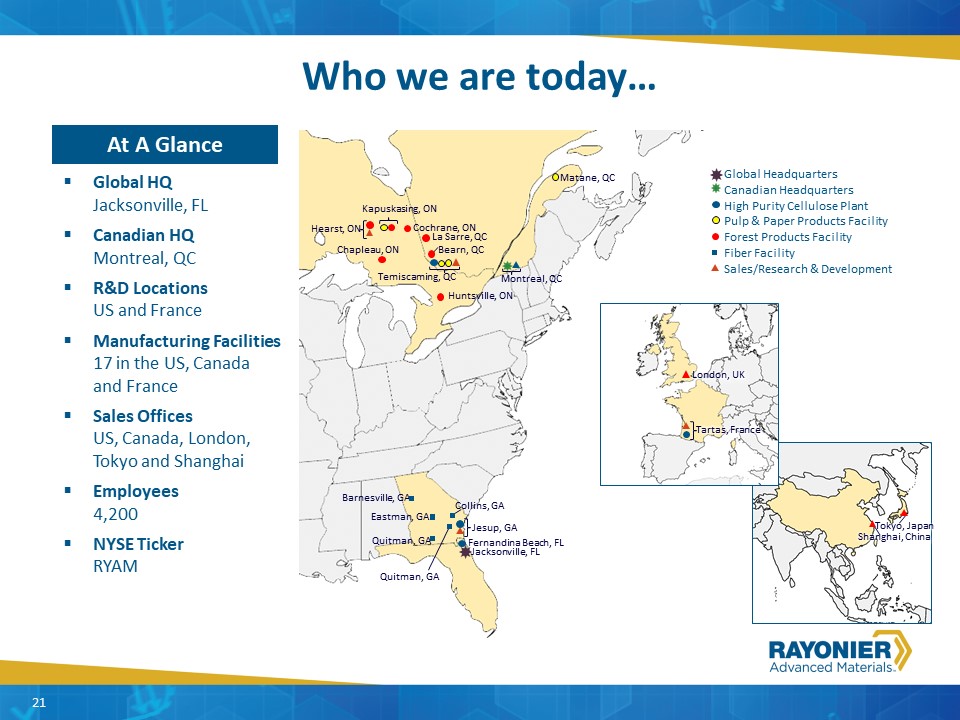
Global Headquarters Barnesville, GA Eastman, GA Quitman, GA Quitman, GA Collins, GA Jacksonville, FL Jesup, GA Fernandina Beach, FL Temiscaming, QC Matane, QC Kapuskasing, ON Bearn, QC Chapleau, ON Cochrane, ON Hearst, ON Huntsville, ON La Sarre, QC Fiber Facility Sales/Research & Development Montreal, QC Forest Products Facility Pulp & Paper Products Facility High Purity Cellulose Plant Tartas, France London, UK Canadian Headquarters Shanghai, China Tokyo, Japan Global HQ Jacksonville, FLCanadian HQ Montreal, QC R&D Locations US and FranceManufacturing Facilities 17 in the US, Canada and FranceSales Offices US, Canada, London, Tokyo and ShanghaiEmployees4,200NYSE TickerRYAM Who we are today… At A Glance 21
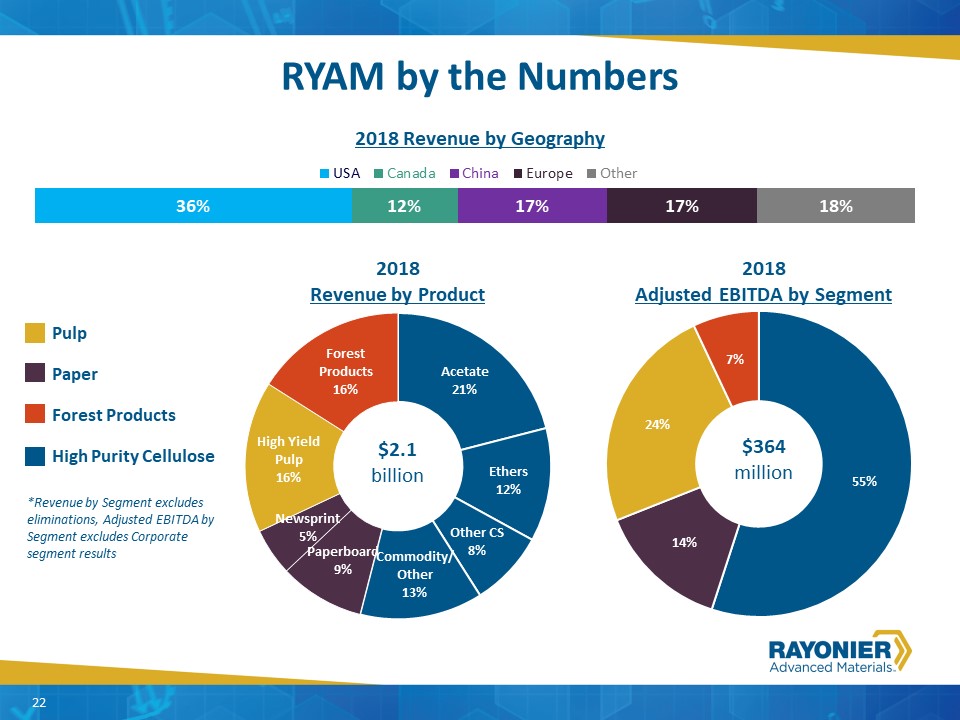
RYAM by the Numbers 2018 Revenue by Geography 2018Adjusted EBITDA by Segment 2018Revenue by Product High Purity Cellulose Pulp Forest Products Paper *Revenue by Segment excludes eliminations, Adjusted EBITDA by Segment excludes Corporate segment results $2.1 billion $364 million 22
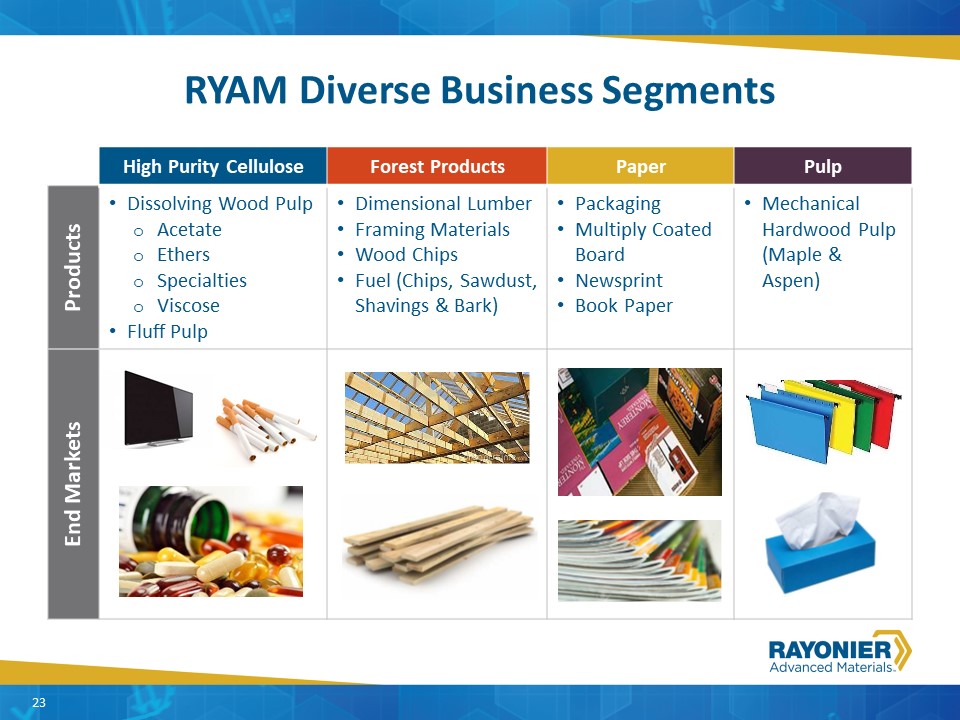
Granite Considerations---Granite Overview RYAM Diverse Business Segments High Purity Cellulose Forest Products Paper Pulp Products Dissolving Wood PulpAcetateEthersSpecialtiesViscoseFluff Pulp Dimensional LumberFraming Materials Wood ChipsFuel (Chips, Sawdust, Shavings & Bark) PackagingMultiply Coated BoardNewsprintBook Paper Mechanical Hardwood Pulp (Maple & Aspen) End Markets 23
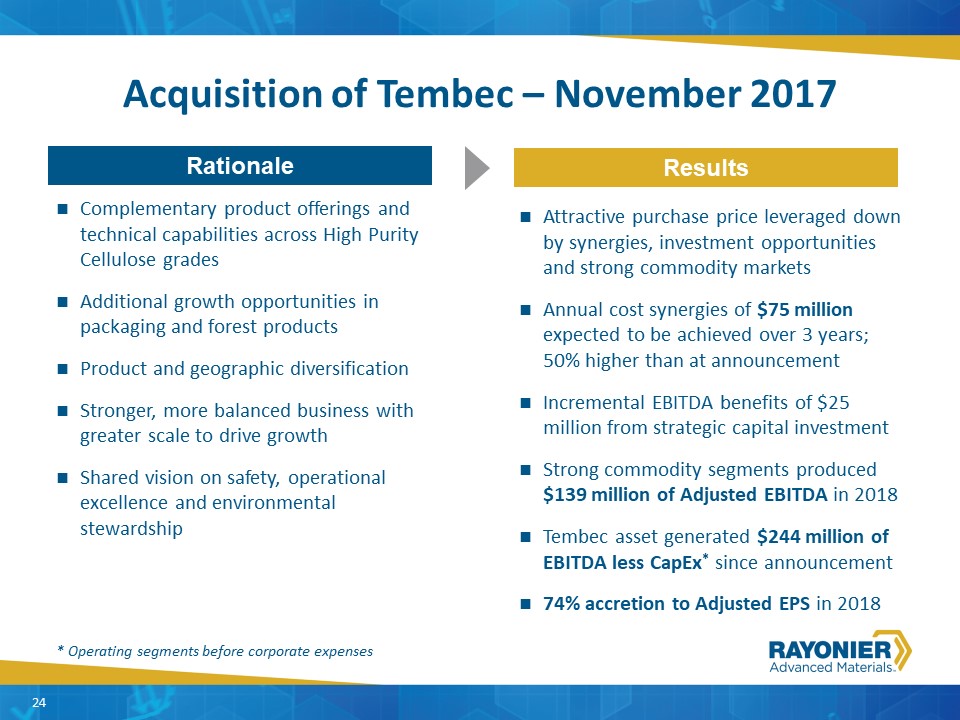
Granite Considerations---Granite Overview Acquisition of Tembec – November 2017 Complementary product offerings and technical capabilities across High Purity Cellulose gradesAdditional growth opportunities in packaging and forest productsProduct and geographic diversificationStronger, more balanced business with greater scale to drive growthShared vision on safety, operational excellence and environmental stewardship Attractive purchase price leveraged down by synergies, investment opportunities and strong commodity marketsAnnual cost synergies of $75 million expected to be achieved over 3 years; 50% higher than at announcementIncremental EBITDA benefits of $25 million from strategic capital investmentStrong commodity segments produced $139 million of Adjusted EBITDA in 2018Tembec asset generated $244 million of EBITDA less CapEx* since announcement74% accretion to Adjusted EPS in 2018 Rationale Results 24 * Operating segments before corporate expenses
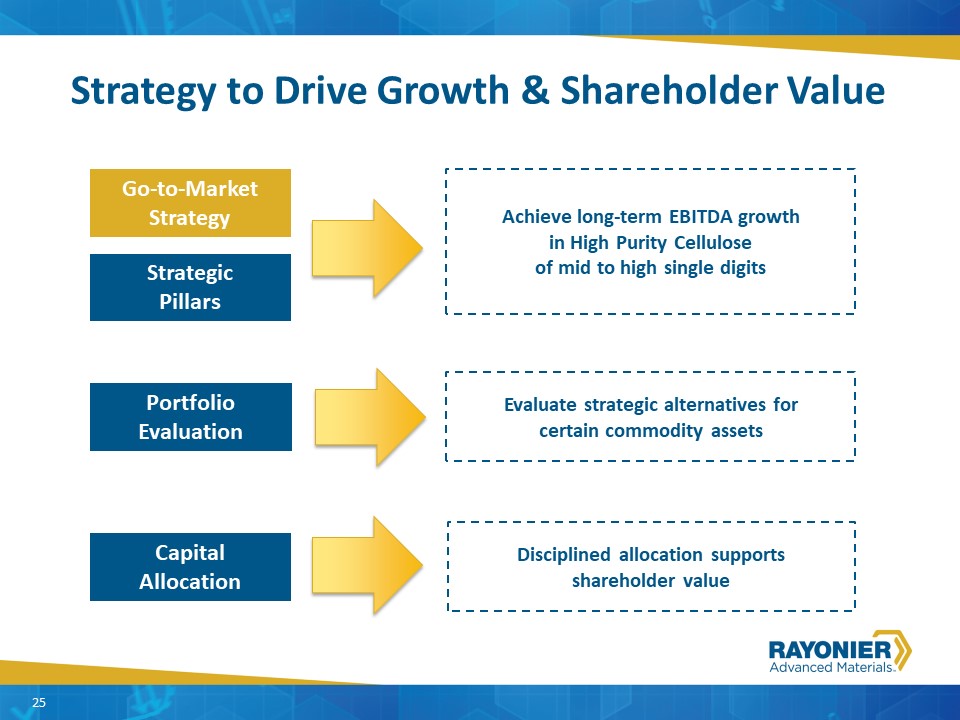
Granite Considerations---Granite Overview Strategy to Drive Growth & Shareholder Value Go-to-Market Strategy Strategic Pillars Capital Allocation Portfolio Evaluation Achieve long-term EBITDA growth in High Purity Cellulose of mid to high single digits Evaluate strategic alternatives for certain commodity assets Disciplined allocation supports shareholder value 25
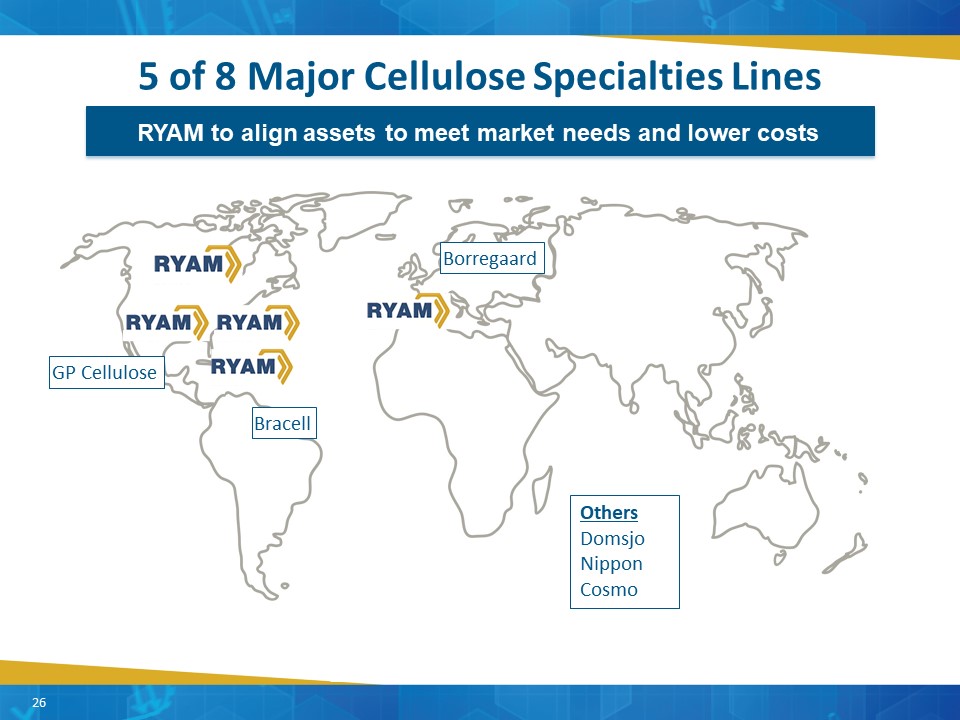
5 of 8 Major Cellulose Specialties Lines RYAM to align assets to meet market needs and lower costs 26 Bracell GP Cellulose Borregaard Others DomsjoNipponCosmo
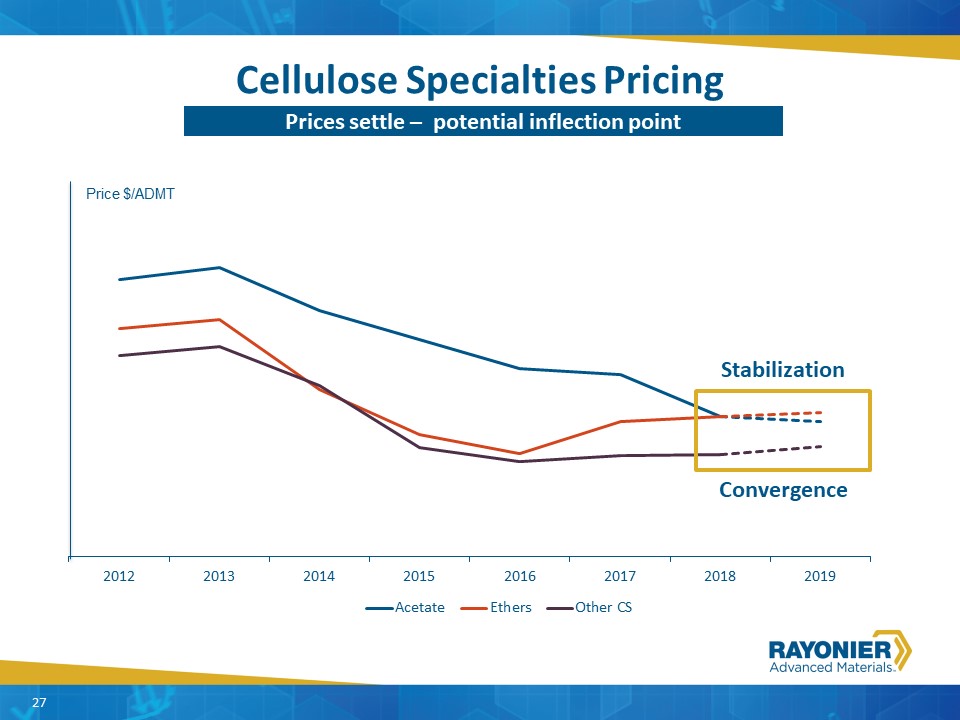
Cellulose Specialties Pricing 27 Prices settle – potential inflection point Price $/ADMT Stabilization Convergence 27

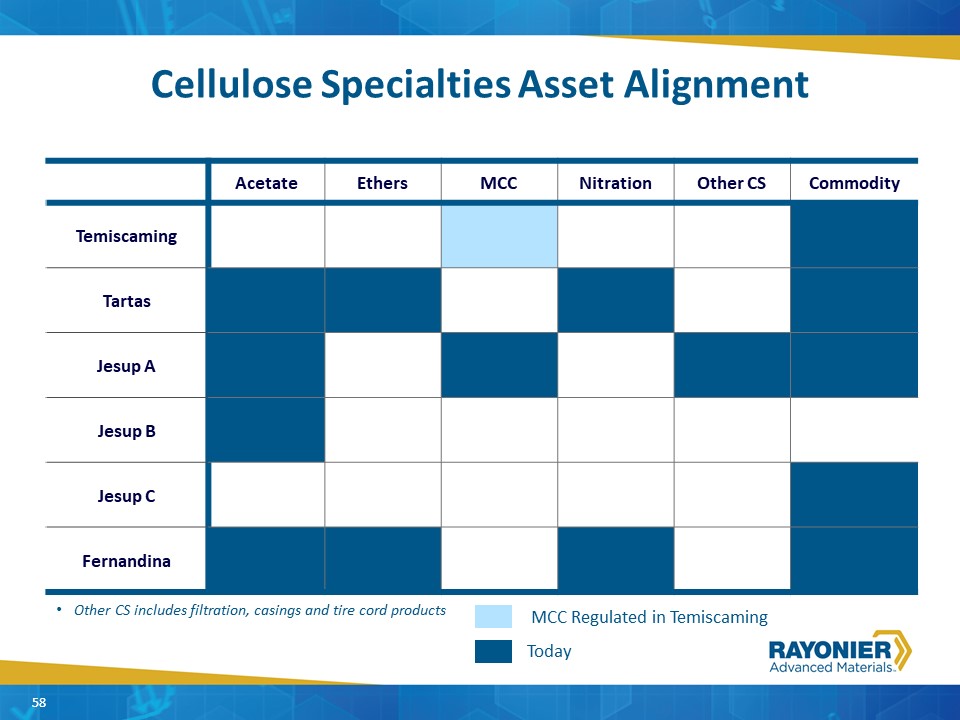
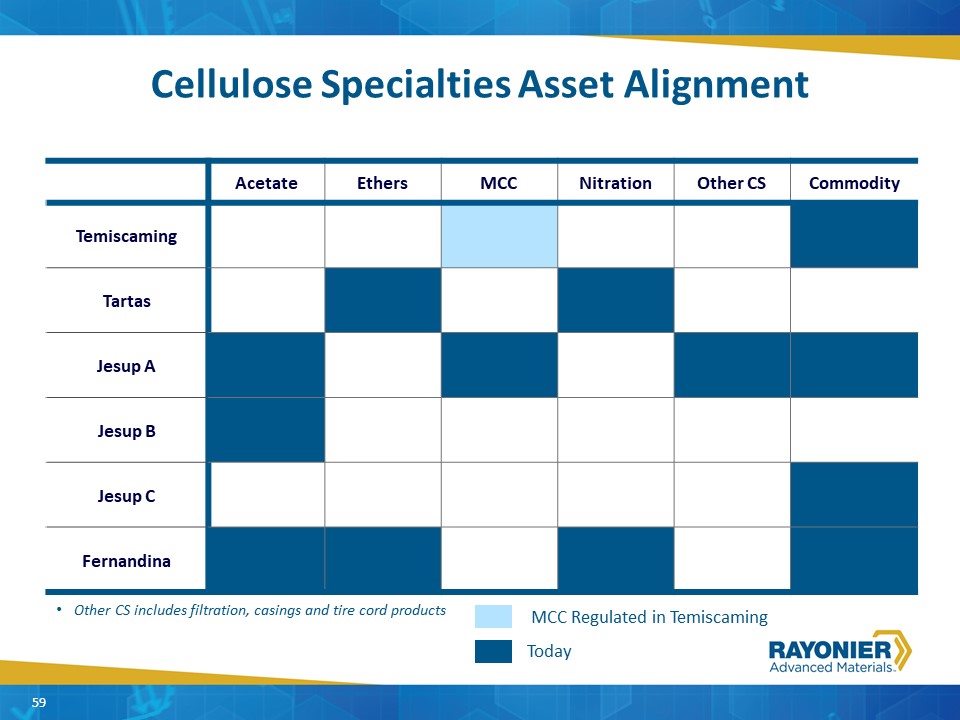
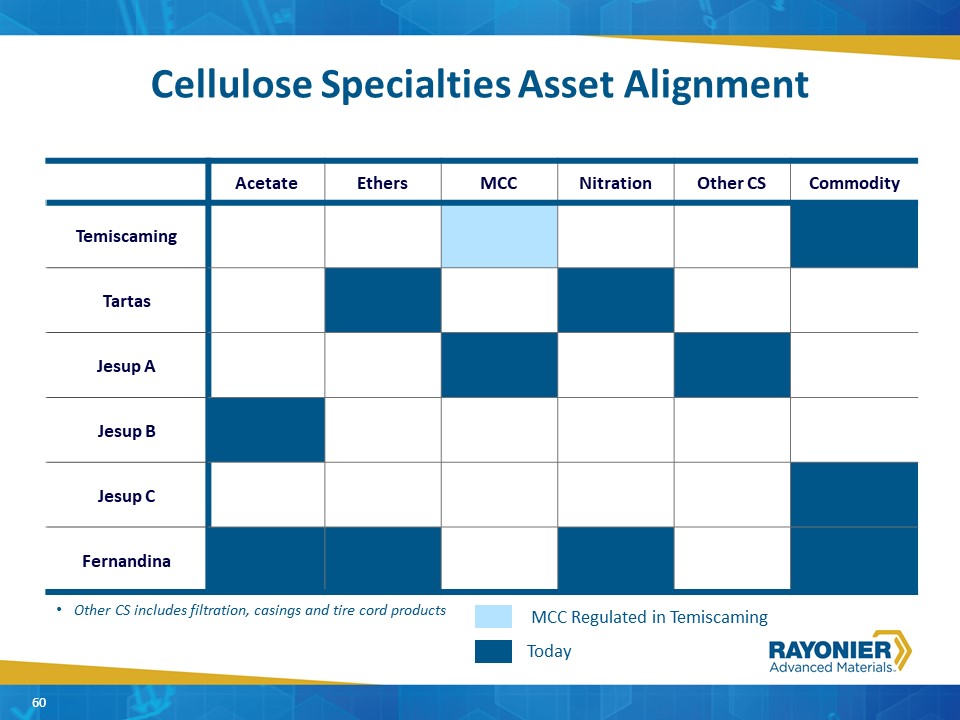
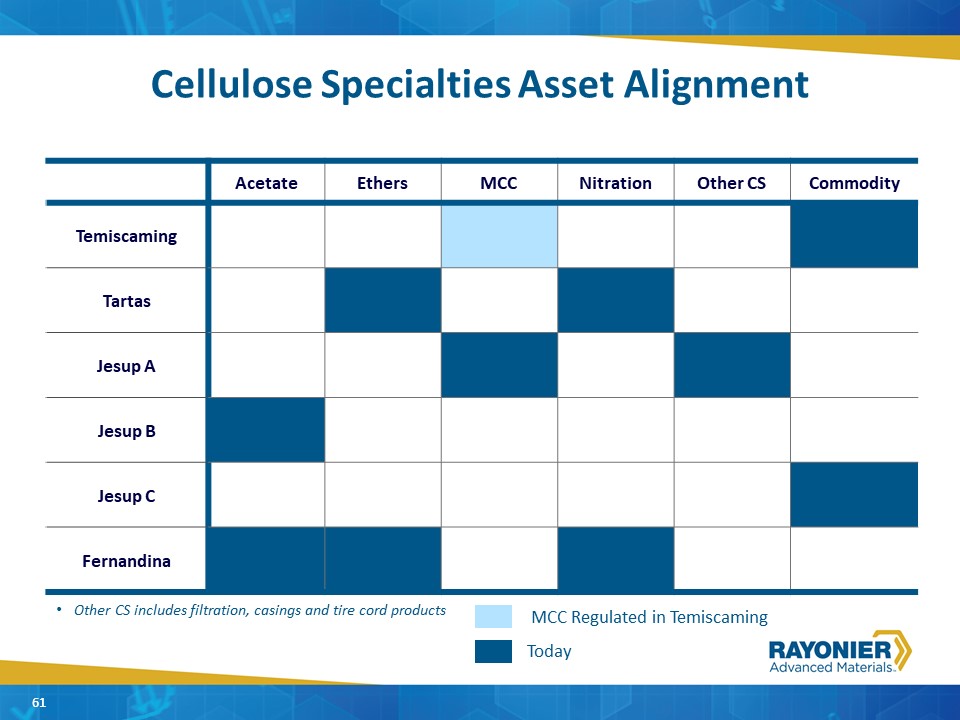
Granite Considerations---Granite Overview Go-to-Market Strategy Market conditions have changedCS prices have stabilizedAcetate prices at parity with other CS productsGrowth in Cellulose SpecialtiesImprove price and marginsDeliver long-term EBITDA growthReduce exposure to acetate and grow with the market in ethers and other CSExit lowest margin business Five CS lines to optimize grades and geographies to better serve customers and reduce costsAlign assets toward most productive useConvert Temiscaming plant to commodity products only (except regulated MCC); no acetate or ethersKeep Jesup A focused on Other CS and Tartas on ethers and nitration; cease acetate production on both Commercial Actions Asset Realignment 28
Granite Considerations---Granite Overview Strategy to Drive Growth & Shareholder Value Go-to-Market Strategy Strategic Pillars Capital Allocation Portfolio Evaluation Achieve long-term EBITDA growth in High Purity Cellulose of mid to high single digits Evaluate strategic alternatives for certain commodity assets Disciplined allocation supports shareholder value 29

Granite Considerations---Granite Overview Strategic Pillars of Growth $61 million* generated in 2018;On track to deliver $155* million from 2018-2020 *Includes $25 million from Legacy Cost Transformation initiative Cost Transformation Reduced costs by $53 million$25 million from legacy plan$28 million from synergiesEstablished Global Improvement Team (GIT) to capture remaining $47 million of costs New Products 2 commercialized products brought to marketOptisilk – lower cost viscoseXV20 – ultra-high viscose ethers$6 million of incremental EBITDA Market Optimization Integrated businesses to make right product in right locationEstablished centers of excellence for sales and manufacturing to drive future value Investments $37 million of strategic capital$45 million of debt reduction$72 million of capital returned$29 million of dividends$43 million from buybacks 30
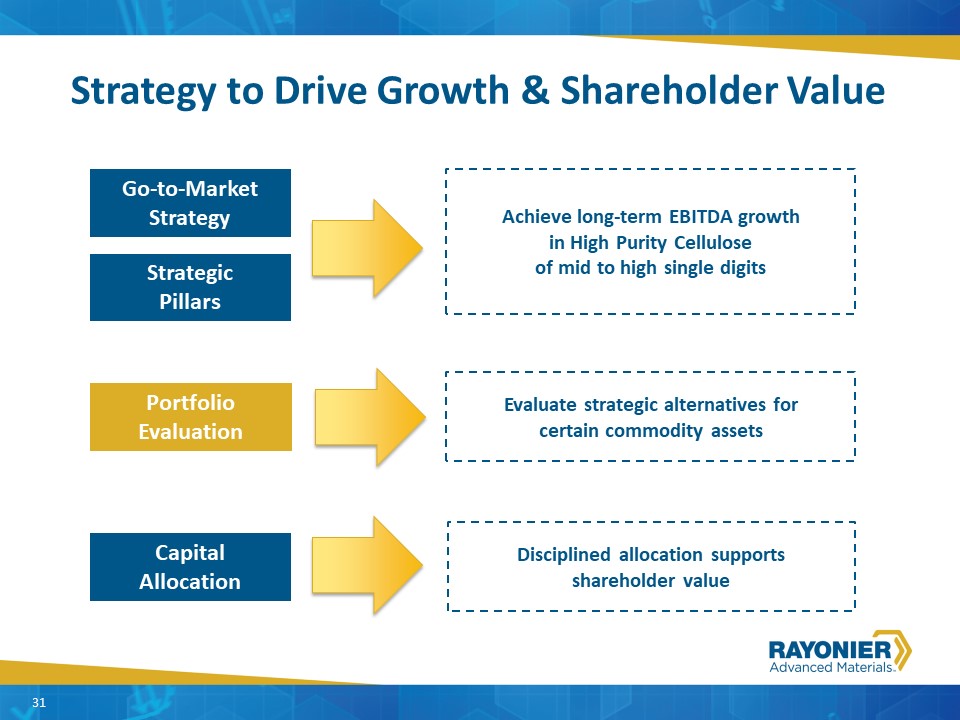
Granite Considerations---Granite Overview Strategy to Drive Growth & Shareholder Value Go-to-Market Strategy Strategic Pillars Capital Allocation Portfolio Evaluation Achieve long-term EBITDA growth in High Purity Cellulose of mid to high single digits Evaluate strategic alternatives for certain commodity assets Disciplined allocation supports shareholder value 31

Portfolio Evaluation Portfolio became more diverse with Tembec acquisitionSome assets are integrated with the core High Purity Cellulose businessFormal asset reviewEvaluating highest value owner for certain commodity assets (RYAM or Other)RYAM is prepared to operate and invest in all assets in its current portfolio 32 Evaluating strategic alternatives for certain commodity assets 32
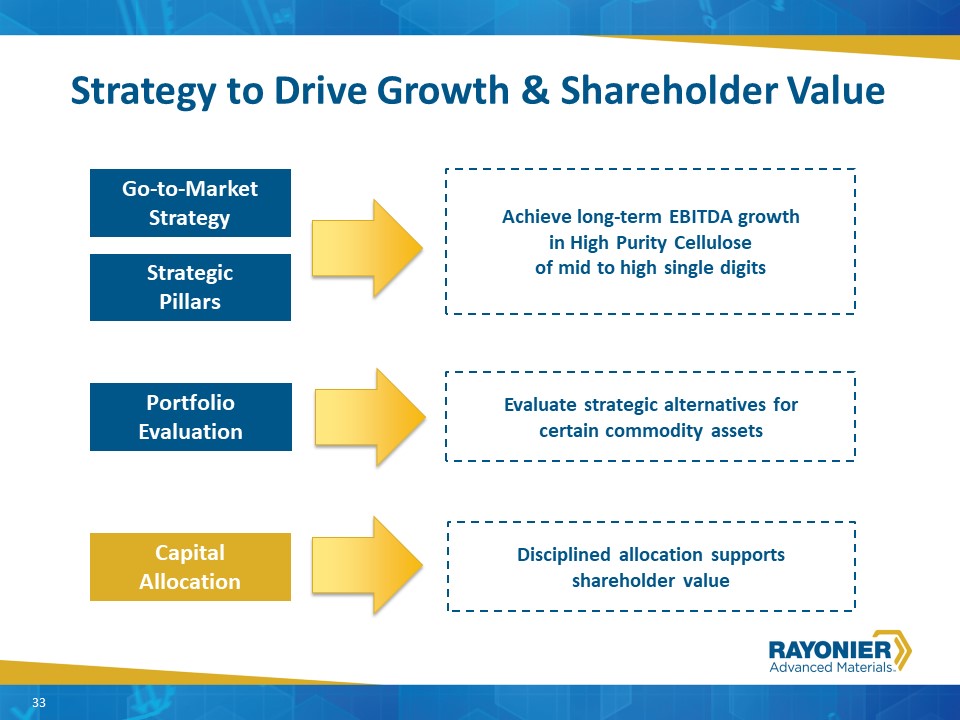
Granite Considerations---Granite Overview Strategy to Drive Growth & Shareholder Value Go-to-Market Strategy Strategic Pillars Capital Allocation Portfolio Evaluation Achieve long-term EBITDA growth in High Purity Cellulose of mid to high single digits Evaluate strategic alternatives for certain commodity assets Disciplined allocation supports shareholder value 33
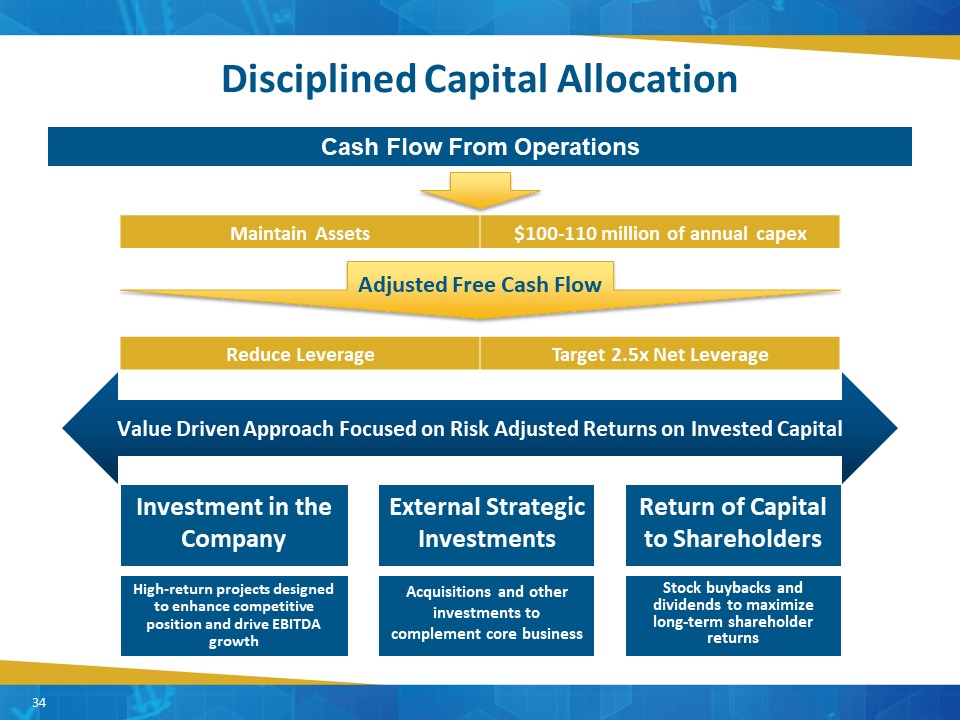
Disciplined Capital Allocation Maintain Assets $100-110 million of annual capex Adjusted Free Cash Flow Return of Capital to Shareholders Stock buybacks and dividends to maximize long-term shareholder returns External Strategic Investments Acquisitions and other investments to complement core business Investment in the Company High-return projects designed to enhance competitive position and drive EBITDA growth Reduce Leverage Target 2.5x Net Leverage Value Driven Approach Focused on Risk Adjusted Returns on Invested Capital Cash Flow From Operations 34

Granite Considerations---Granite Overview Strategy to Drive Growth & Shareholder Value Go-to-Market Strategy Strategic Pillars Capital Allocation Portfolio Evaluation Launch new “Go-to-Market” strategy designed to:Improved Cellulose Specialties price and marginRealign assets to market needs and sales mixDrive long-term High Purity EBITDA growth Improve the competitive positioning through the Four Strategic Pillars- Cost transformation - Market optimization- New products - Prudent investments To include:Formal asset reviewDetermine market value of business segmentsCapture highest value for shareholders Employ a disciplined and balanced capital allocation strategy focused on:Debt paydownRe-investment Return of capital to shareholders Achieve long-term EBITDA growth in High Purity Cellulose of mid to high single digits Evaluate strategic alternatives for certain commodity assets Disciplined allocation supports shareholder value 35
High Purity Cellulose Commercial Erin ByersSVP, High Purity Cellulose
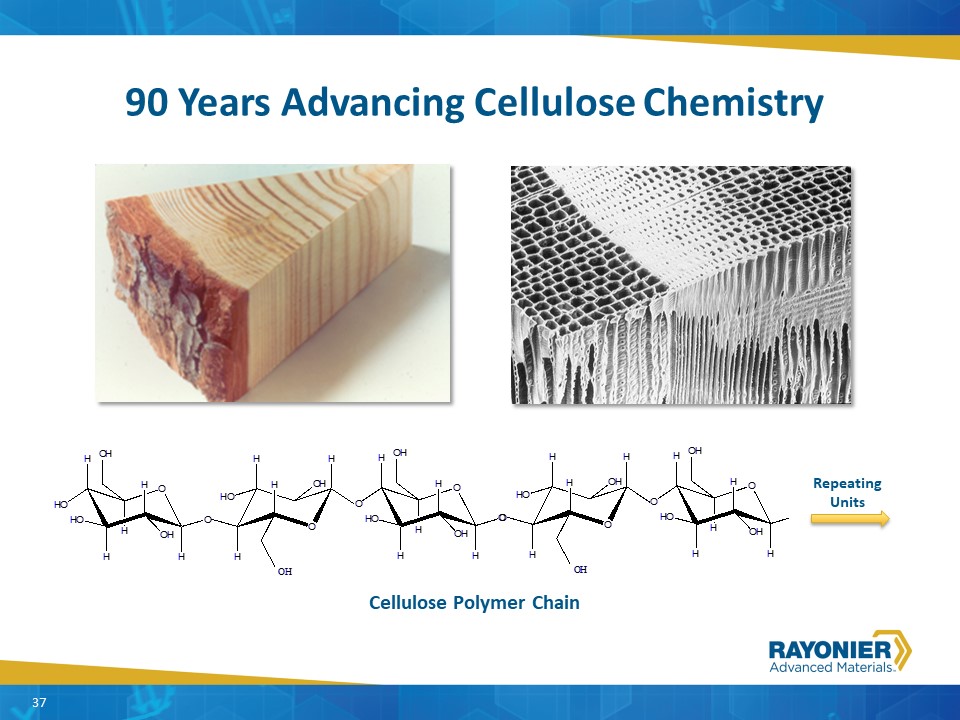
90 Years Advancing Cellulose Chemistry Cellulose Polymer Chain RepeatingUnits 37
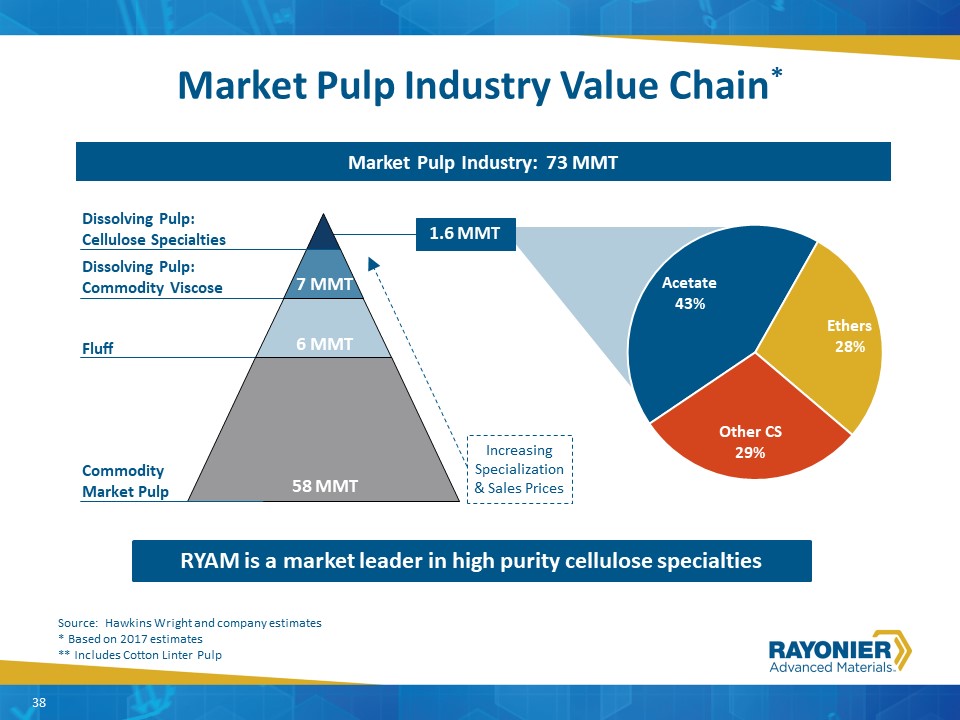
Market Pulp Industry Value Chain* Dissolving Pulp: Commodity Viscose 6 MMT 58 MMT 7 MMT Market Pulp Industry: 73 MMT IncreasingSpecialization& Sales Prices Source: Hawkins Wright and company estimates* Based on 2017 estimates** Includes Cotton Linter Pulp RYAM is a market leader in high purity cellulose specialties CommodityMarket Pulp Fluff Dissolving Pulp: Cellulose Specialties 1.6 MMT 38
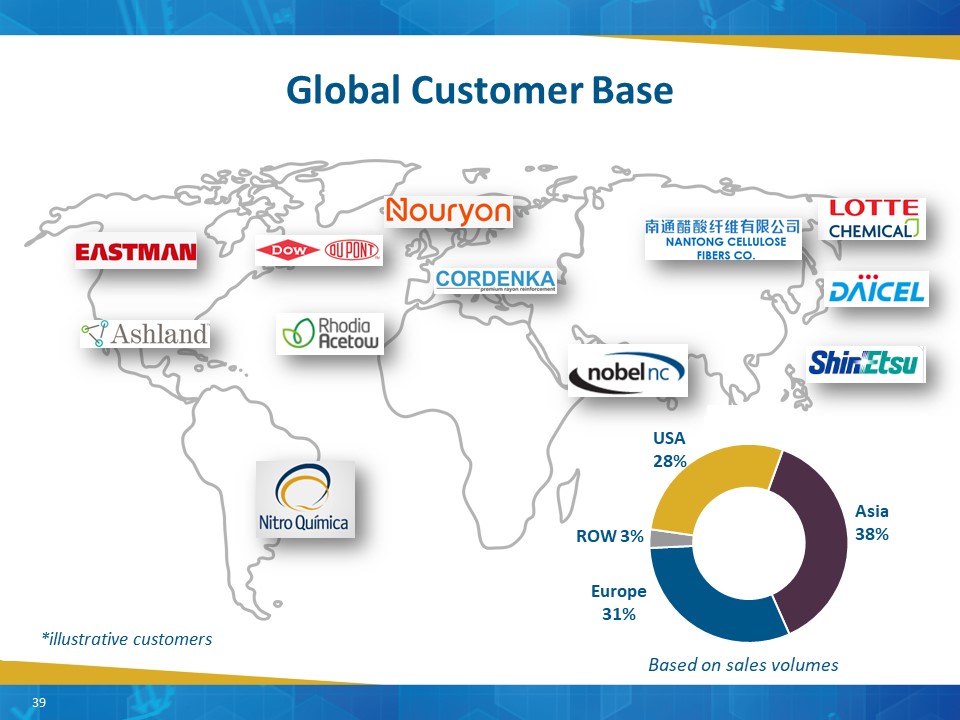
*illustrative customers Global Customer Base 39 Based on sales volumes
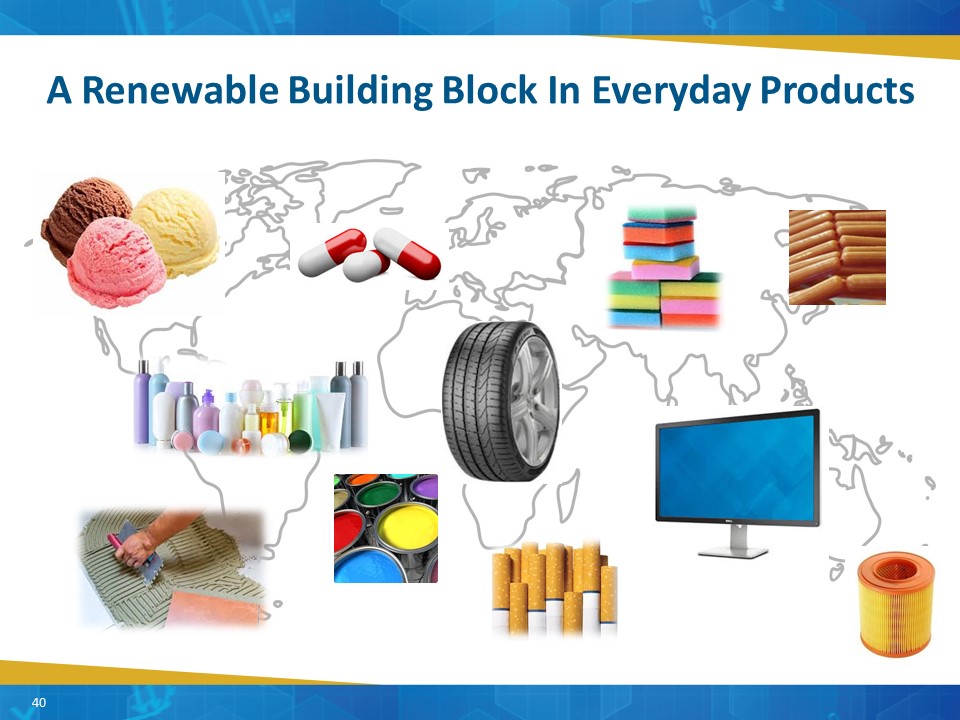
A Renewable Building Block In Everyday Products 40
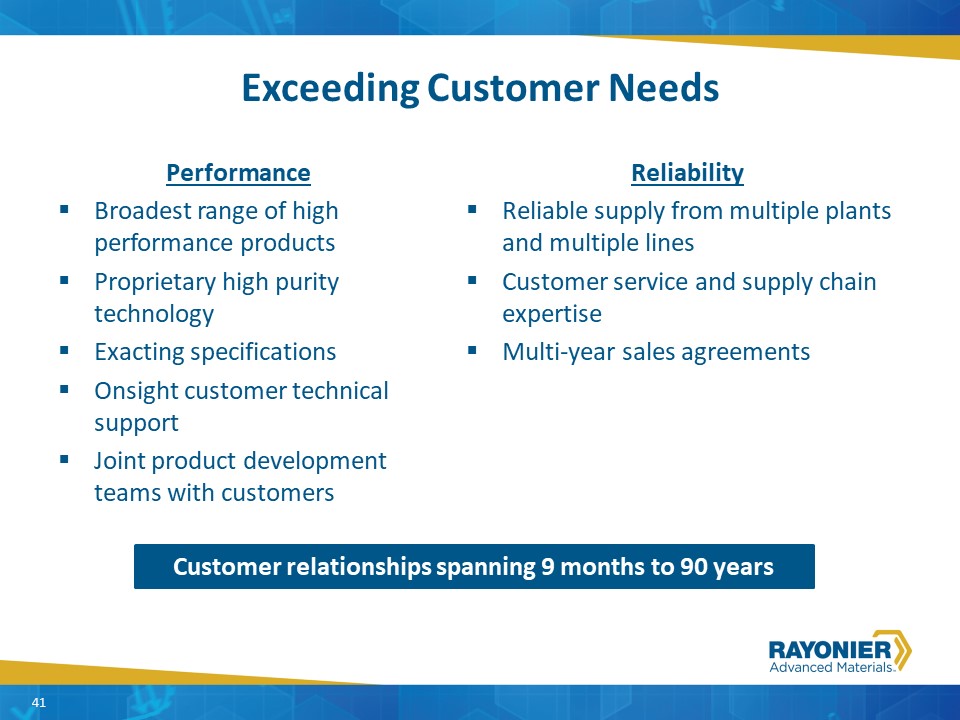
Exceeding Customer Needs PerformanceBroadest range of high performance productsProprietary high purity technologyExacting specificationsOnsight customer technical supportJoint product development teams with customers 41 Customer relationships spanning 9 months to 90 years ReliabilityReliable supply from multiple plants and multiple linesCustomer service and supply chain expertiseMulti-year sales agreements
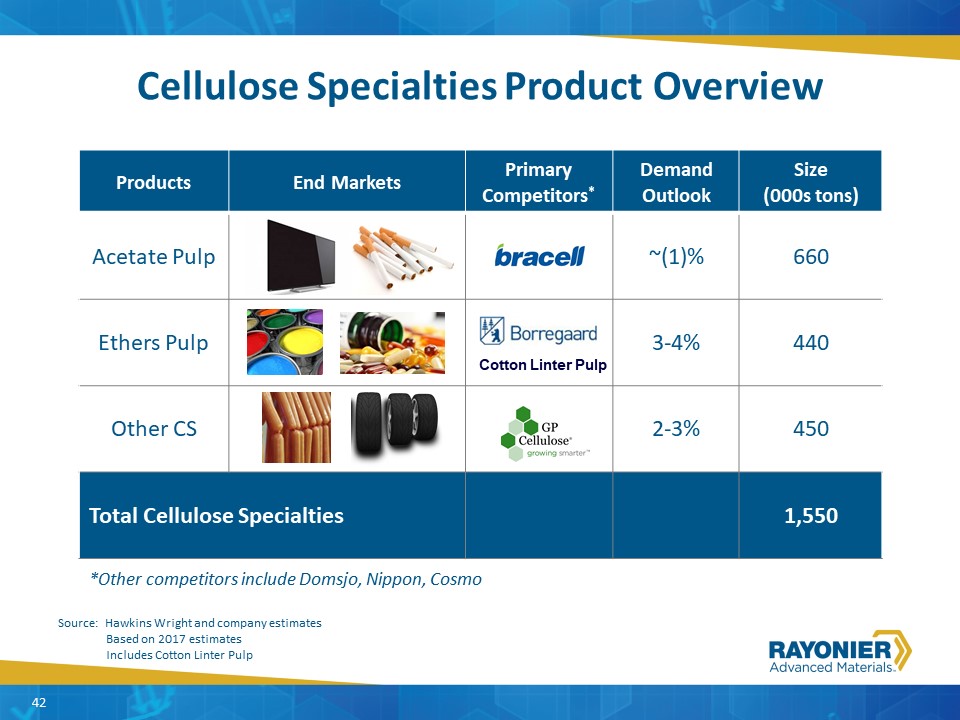
Cellulose Specialties Product Overview Products End Markets Primary Competitors* Demand Outlook Size (000s tons) Acetate Pulp ~(1)% 660 Ethers Pulp 3-4% 440 Other CS 2-3% 450 Total Cellulose Specialties 1,550 Cotton Linter Pulp 42 *Other competitors include Domsjo, Nippon, Cosmo Source: Hawkins Wright and company estimates Based on 2017 estimates Includes Cotton Linter Pulp
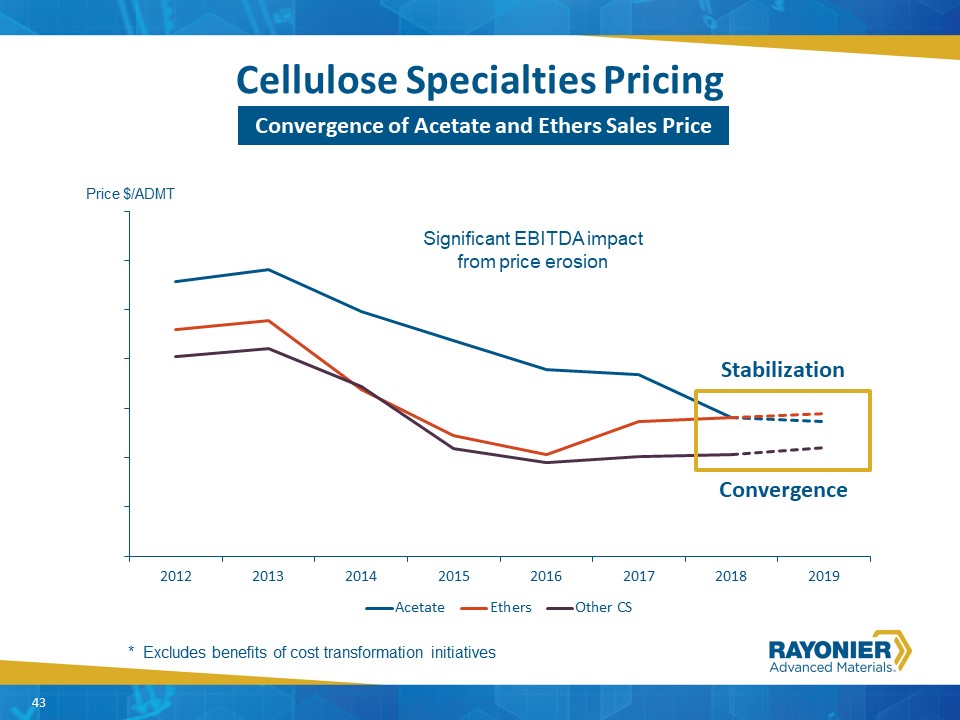
Cellulose Specialties Pricing 43 Convergence of Acetate and Ethers Sales Price Price $/ADMT Significant EBITDA impact from price erosion * Excludes benefits of cost transformation initiatives 43 Stabilization Convergence
Committed to all Cellulose Specialties products Reduce exposure to declining acetate marketGrow with ethers and other CS markets Displace cotton linter pulp to expand ethers volumesImprove price and margins Exit underperforming businessAlign assets to new Go-to-Market Strategy Cellulose Specialties Go-to-Market Strategy 44 Drive long-term EBITDA growth
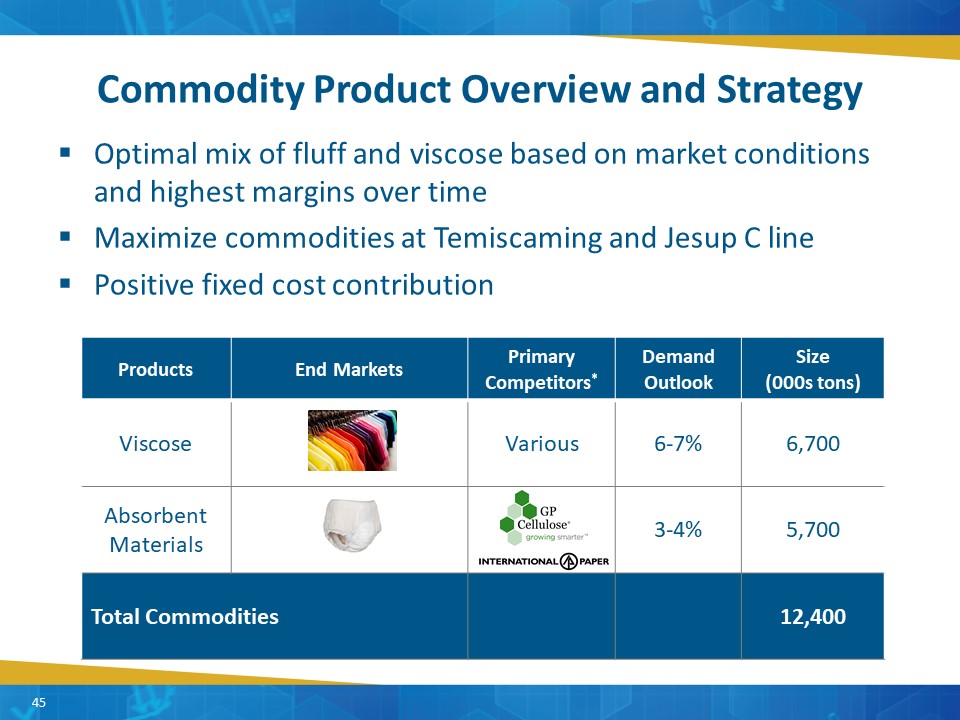
Commodity Product Overview and Strategy 45 Optimal mix of fluff and viscose based on market conditions and highest margins over timeMaximize commodities at Temiscaming and Jesup C linePositive fixed cost contribution 45 Products End Markets Primary Competitors* Demand Outlook Size (000s tons) Viscose Various 6-7% 6,700 Absorbent Materials 3-4% 5,700 Total Commodities 12,400
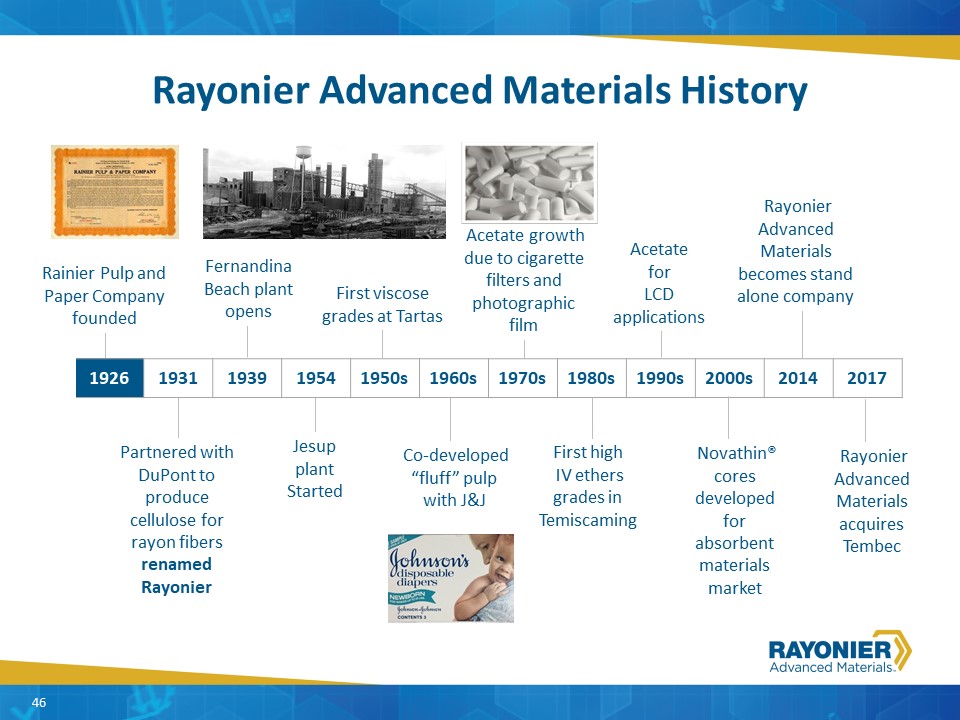
Fernandina Beach plant opens Rayonier Advanced Materials History 1926 1931 1939 1954 1950s 1960s 1970s 1980s 1990s 2000s 2014 2017 Rainier Pulp and Paper Company founded Partnered with DuPont to produce cellulose for rayon fibers renamed Rayonier Jesup plant Started First viscose grades at Tartas Co-developed “fluff” pulpwith J&J Acetate growth due to cigarette filters and photographic film First high IV ethers grades in Temiscaming Rayonier Advanced Materials becomes stand alone company Novathin® cores developed for absorbent materials market Rayonier Advanced Materials acquires Tembec Acetate for LCD applications 46
History of Innovation 47 47
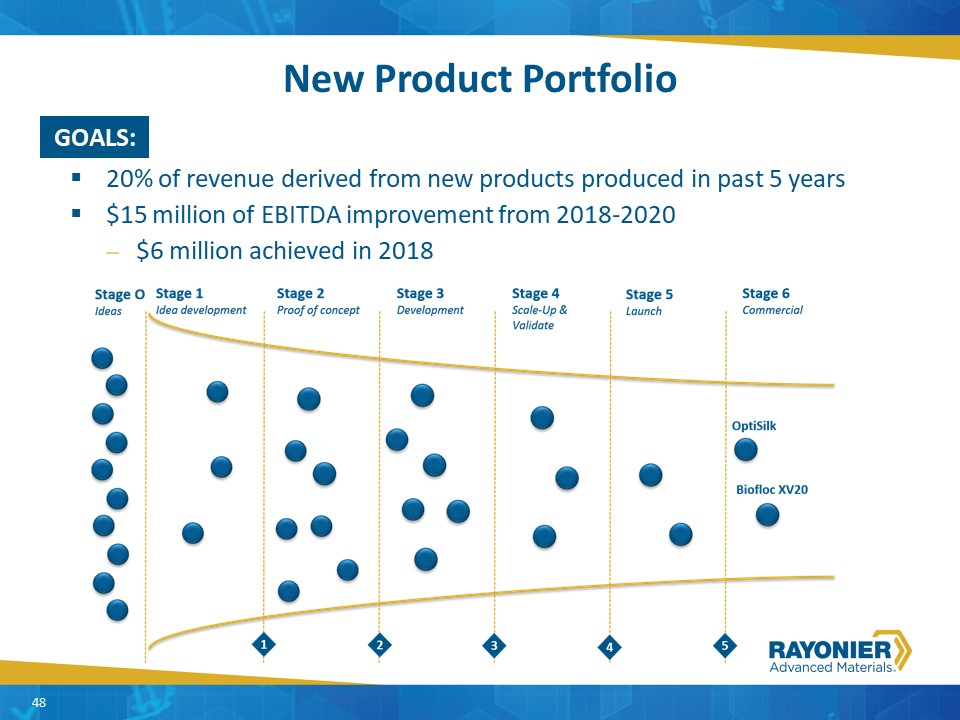
New Product Portfolio 48 20% of revenue derived from new products produced in past 5 years$15 million of EBITDA improvement from 2018-2020$6 million achieved in 2018 GOALS: 48
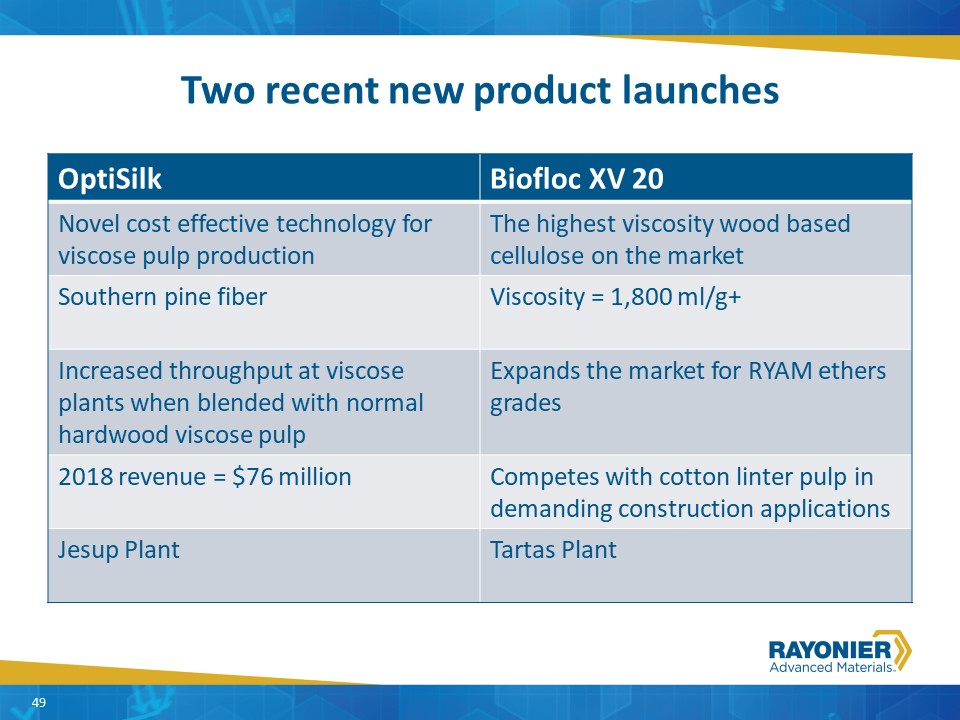
Two recent new product launches 49 Optisilk: Novel cost effective technology for viscose pulp productionSouthern pine fiberIncreased through put at viscose plants when blended with normal hardwood viscose pulpJesup Plant OptiSilk Biofloc XV 20 Novel cost effective technology for viscose pulp production The highest viscosity wood based cellulose on the market Southern pine fiber Viscosity = 1,800 ml/g+ Increased throughput at viscose plants when blended with normal hardwood viscose pulp Expands the market for RYAM ethers grades 2018 revenue = $76 million Competes with cotton linter pulp in demanding construction applications Jesup Plant Tartas Plant 49
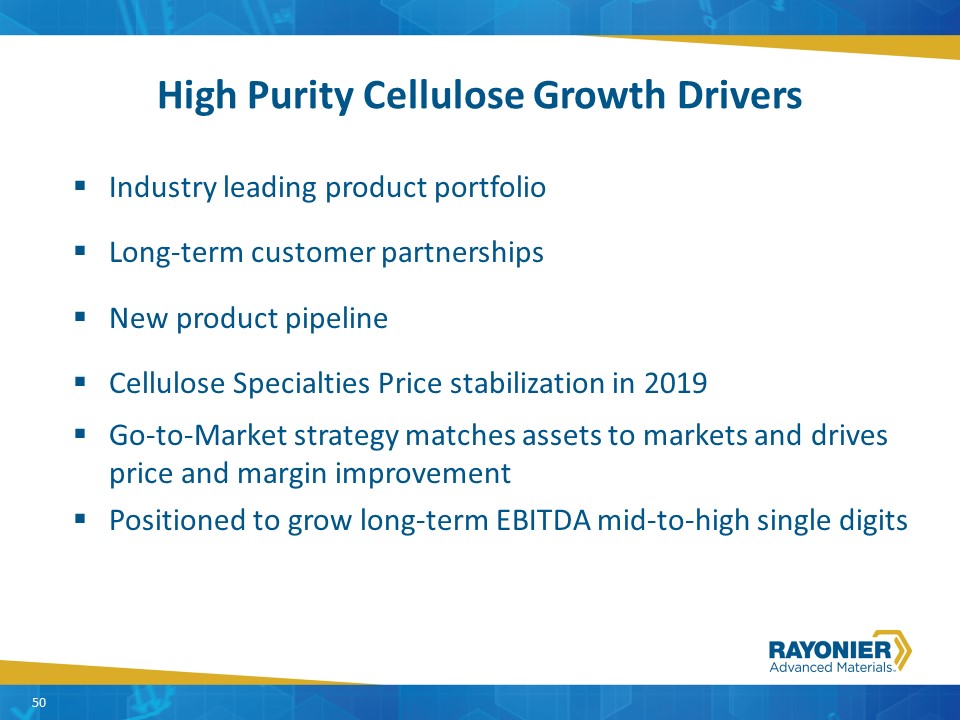
High Purity Cellulose Growth Drivers 50 Industry leading product portfolioLong-term customer partnershipsNew product pipelineCellulose Specialties Price stabilization in 2019Go-to-Market strategy matches assets to markets and drives price and margin improvementPositioned to grow long-term EBITDA mid-to-high single digits 50

High Purity Cellulose Manufacturing Bill ManzerSVP, Manufacturing Operations
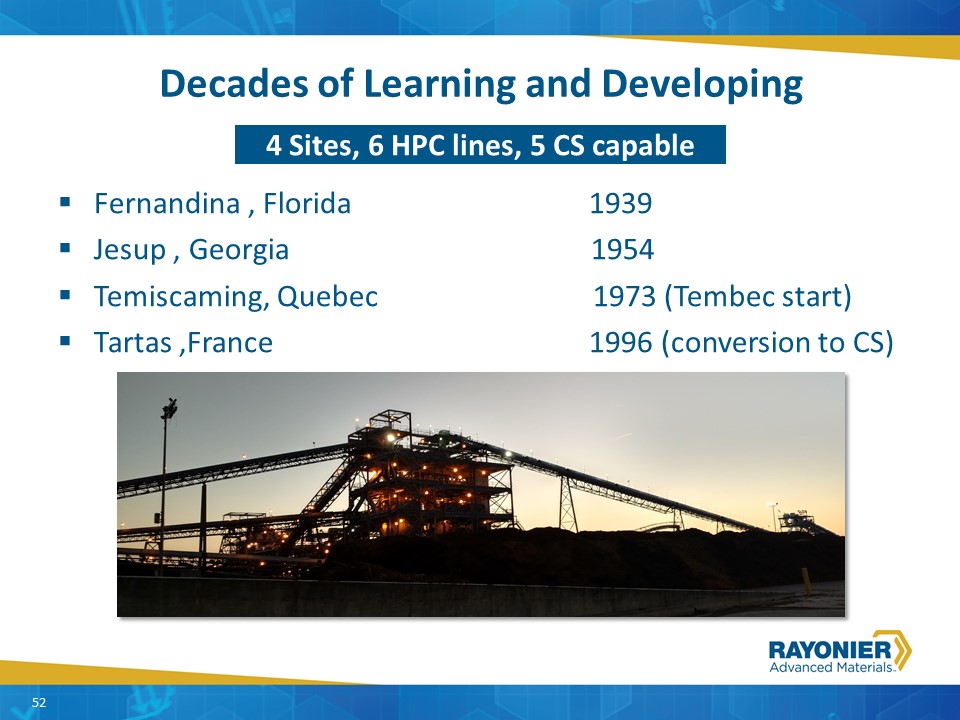
Fernandina , Florida 1939Jesup , Georgia 1954Temiscaming, Quebec 1973 (Tembec start)Tartas ,France 1996 (conversion to CS) Decades of Learning and Developing 52 4 Sites, 6 HPC lines, 5 CS capable 52
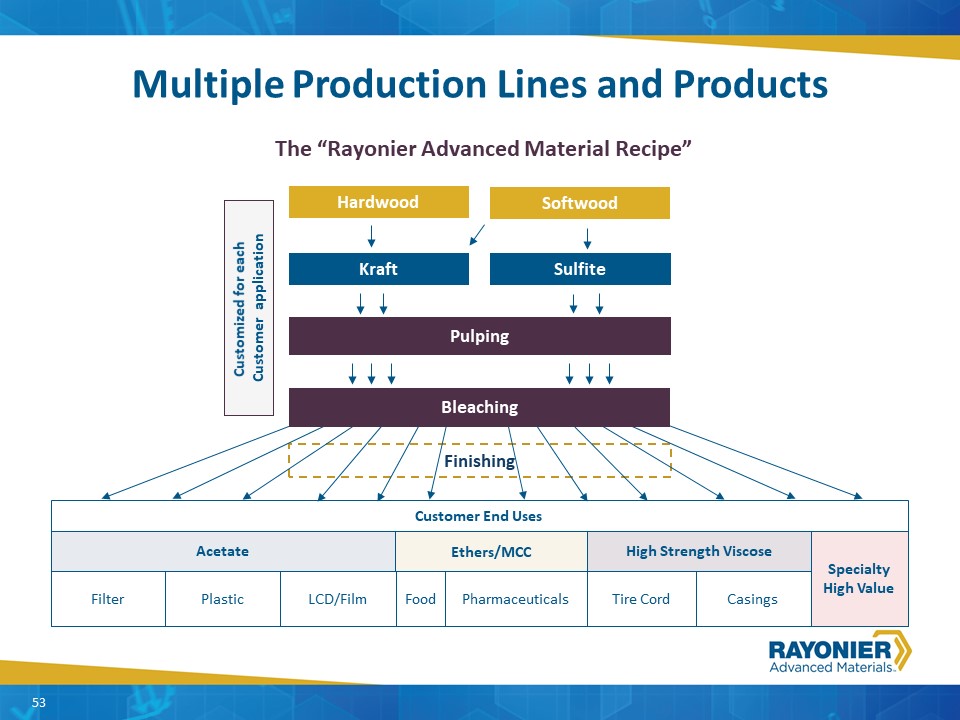
Multiple Production Lines and Products Customized for each Customer application Filter Plastic LCD/Film Tire Cord Casings Acetate Ethers/MCC SpecialtyHigh Value High Strength Viscose Customer End Uses Finishing Pulping Hardwood Softwood Kraft Sulfite �� Bleaching Food Pharmaceuticals The “Rayonier Advanced Material Recipe” 53
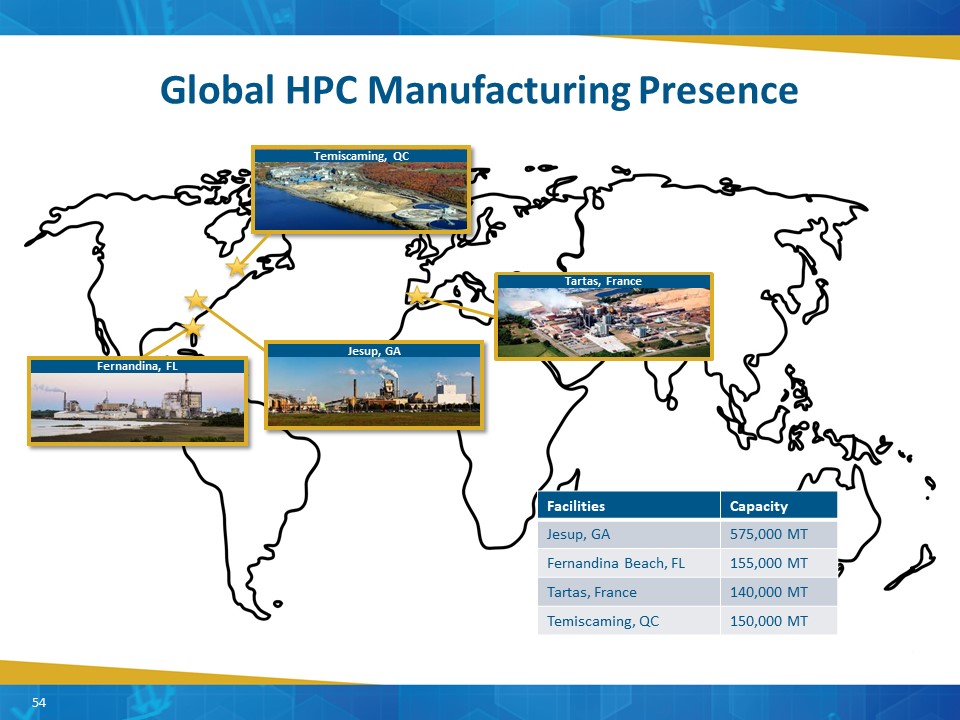
Global HPC Manufacturing Presence Jesup, GA Fernandina, FL Temiscaming, QC Tartas, France Facilities Capacity Jesup, GA 575,000 MT Fernandina Beach, FL 155,000 MT Tartas, France 140,000 MT Temiscaming, QC 150,000 MT 54
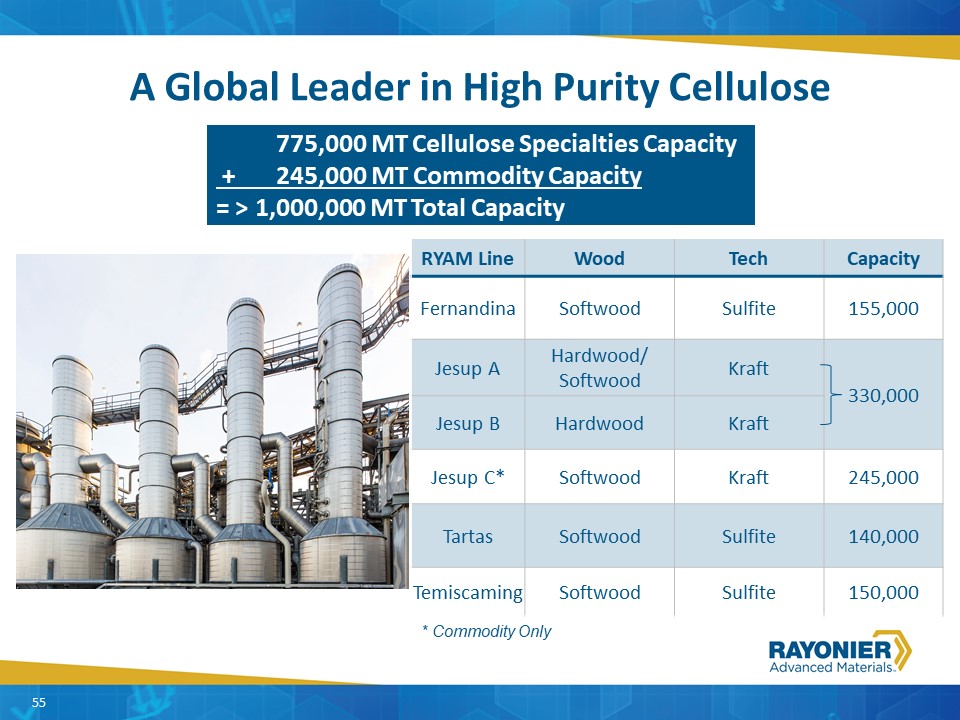
RYAM Line Wood Tech Capacity Fernandina Softwood Sulfite 155,000 Jesup A Hardwood/ Softwood Kraft 330,000 Jesup B Hardwood Kraft Jesup C* Softwood Kraft 245,000 Tartas Softwood Sulfite 140,000 Temiscaming Softwood Sulfite 150,000 A Global Leader in High Purity Cellulose * Commodity Only 55 775,000 MT Cellulose Specialties Capacity + 245,000 MT Commodity Capacity= > 1,000,000 MT Total Capacity

Cost to Produce Wood FiberU.S. Southern PineU.S. Southern HardwoodFrance Maritime PineCanada Spruce, Pine and Fir from lumber chipsChemicalsCausticSulfurEnergyBiofuelNatural Gas Average Cost* across High Purity Cellulose Segment * Varies by location 56
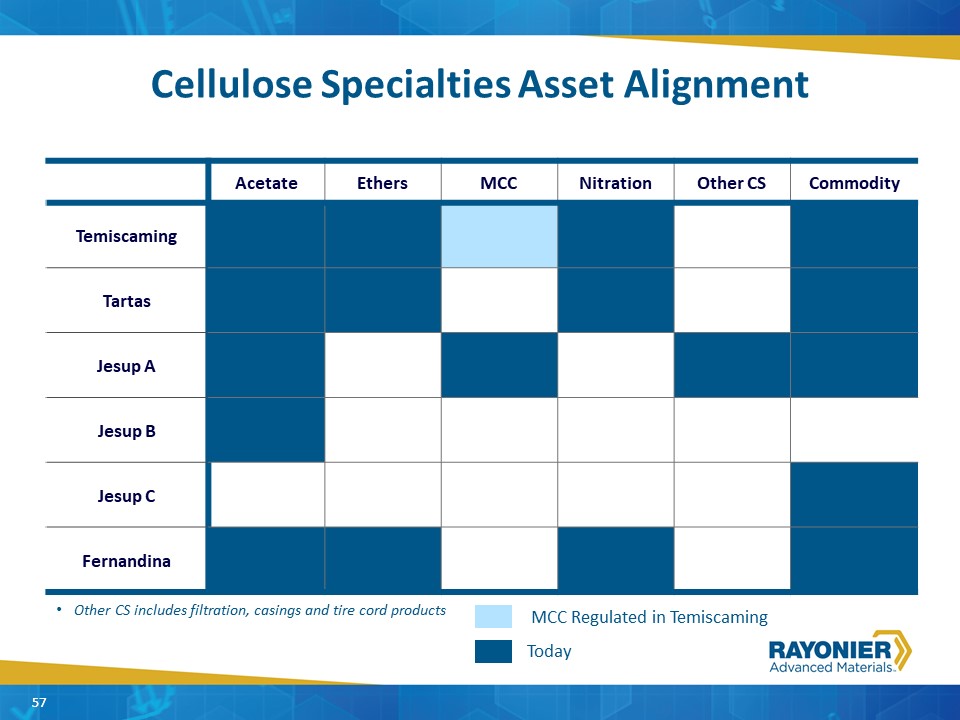
Cellulose Specialties Asset Alignment Acetate Ethers MCC Nitration Other CS Commodity Temiscaming Tartas Jesup A Jesup B Jesup C Fernandina 57 57 Other CS includes filtration, casings and tire cord products Today MCC Regulated in Temiscaming
Cellulose Specialties Asset Alignment Acetate Ethers MCC Nitration Other CS Commodity Temiscaming Tartas Jesup A Jesup B Jesup C Fernandina 58 58 Other CS includes filtration, casings and tire cord products Today MCC Regulated in Temiscaming
Cellulose Specialties Asset Alignment Acetate Ethers MCC Nitration Other CS Commodity Temiscaming Tartas Jesup A Jesup B Jesup C Fernandina 59 59 Other CS includes filtration, casings and tire cord products Today MCC Regulated in Temiscaming
Cellulose Specialties Asset Alignment Acetate Ethers MCC Nitration Other CS Commodity Temiscaming Tartas Jesup A Jesup B Jesup C Fernandina 60 60 Other CS includes filtration, casings and tire cord products Today MCC Regulated in Temiscaming
Cellulose Specialties Asset Alignment Acetate Ethers MCC Nitration Other CS Commodity Temiscaming Tartas Jesup A Jesup B Jesup C Fernandina 61 61 Other CS includes filtration, casings and tire cord products Today MCC Regulated in Temiscaming
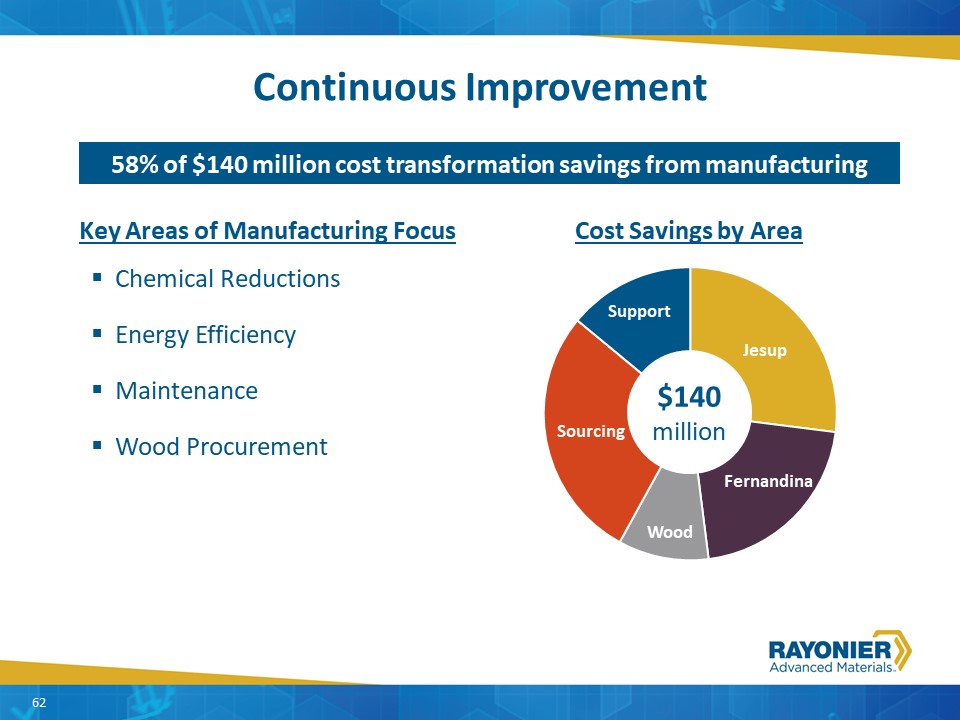
Continuous Improvement Cost Savings by Area $140 million 58% of $140 million cost transformation savings from manufacturing Key Areas of Manufacturing FocusChemical ReductionsEnergy EfficiencyMaintenanceWood Procurement 62
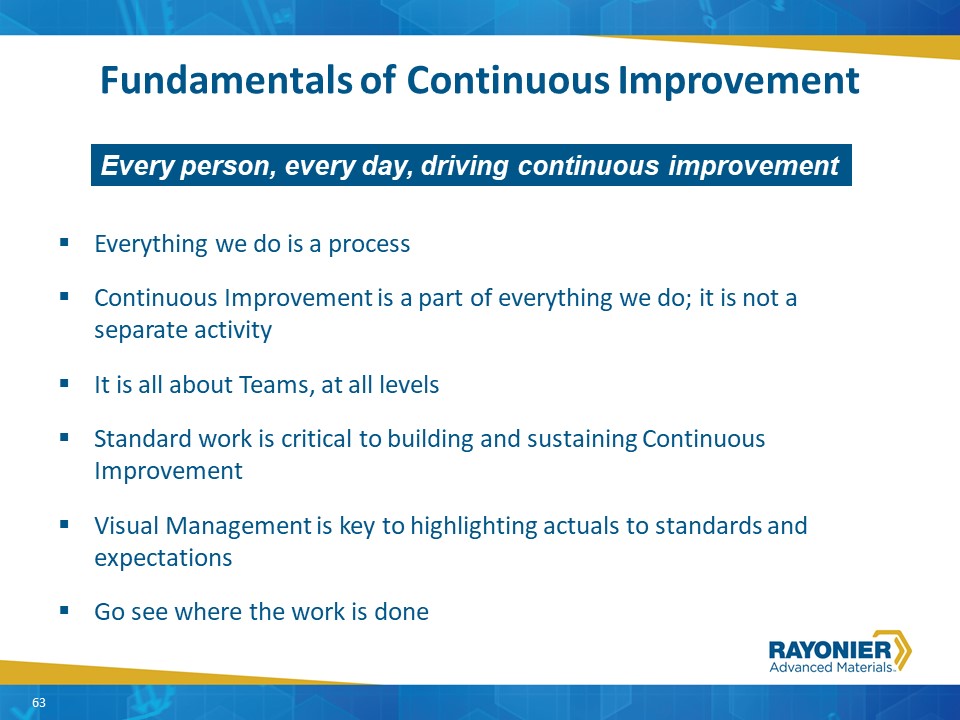
Fundamentals of Continuous Improvement Everything we do is a processContinuous Improvement is a part of everything we do; it is not a separate activityIt is all about Teams, at all levelsStandard work is critical to building and sustaining Continuous ImprovementVisual Management is key to highlighting actuals to standards and expectationsGo see where the work is done 63 Every person, every day, driving continuous improvement
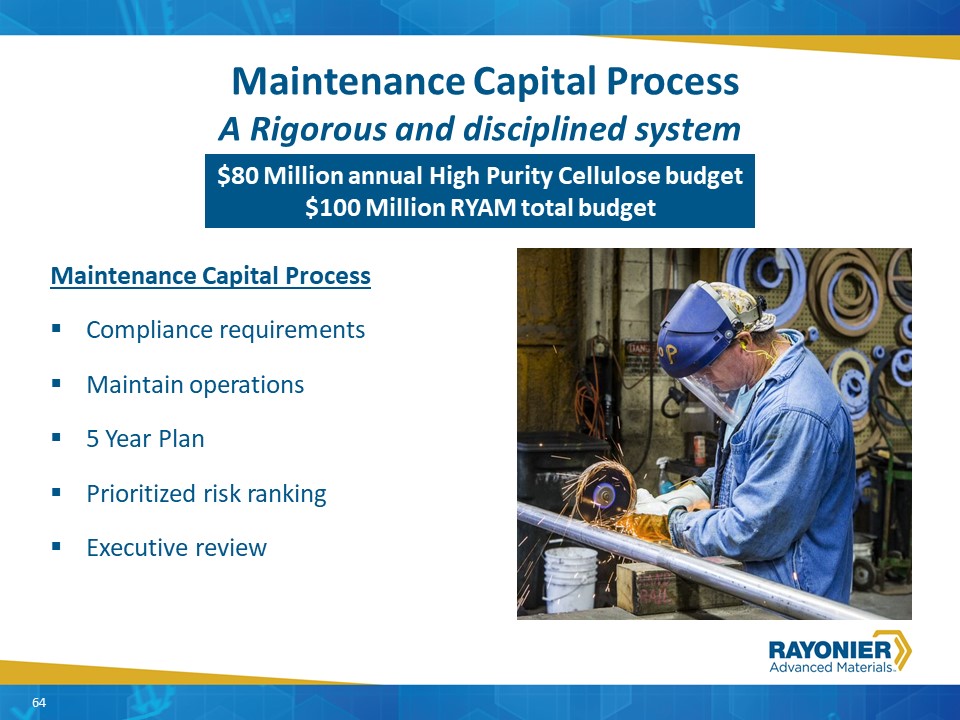
Maintenance Capital Process A Rigorous and disciplined system Maintenance Capital ProcessCompliance requirementsMaintain operations5 Year PlanPrioritized risk rankingExecutive review 64 $80 Million annual High Purity Cellulose budget$100 Million RYAM total budget
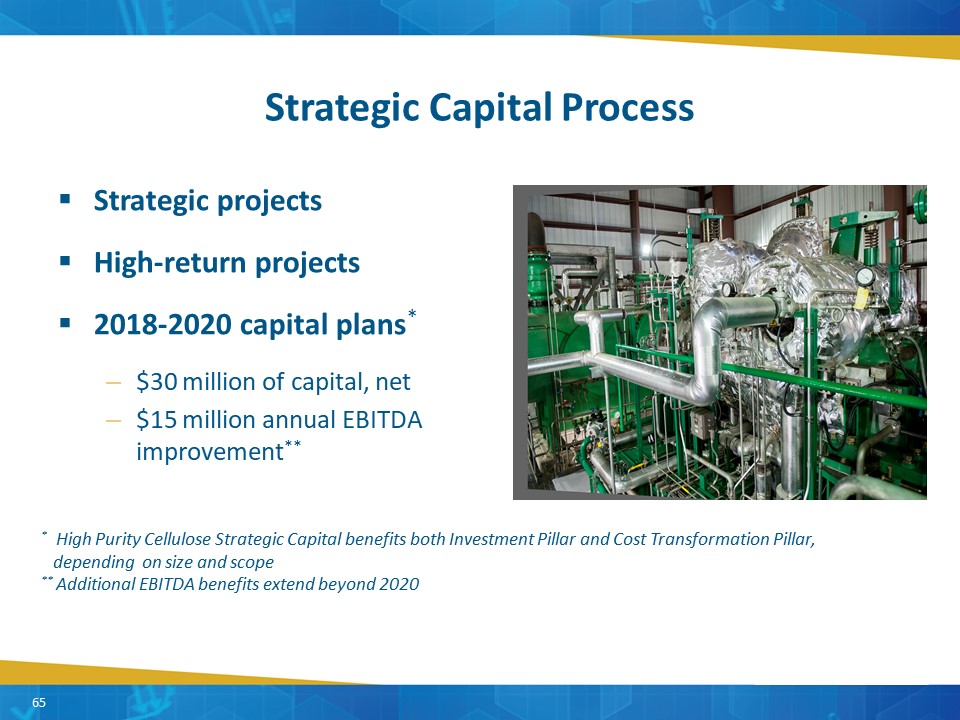
Strategic Capital Process Strategic projectsHigh-return projects2018-2020 capital plans*$30 million of capital, net$15 million annual EBITDA improvement** * High Purity Cellulose Strategic Capital benefits both Investment Pillar and Cost Transformation Pillar, depending on size and scope** Additional EBITDA benefits extend beyond 2020 65
High Purity Cellulose – Key Highlights Core-business contributes greater than 50% of Company EBITDALong successful history in this market with global customer relationships dating back over 90 yearsMost capable assets base in the industryEfficient operations built on continuous improvement processes successfully reduced significant cost with additional opportunities aheadIdentified opportunities for high-return capital investments over the next several yearsHistory of innovation with New Products expected to generate over 20% of revenues in next 5 yearsOur Go-to-Market strategy will increase profit margins 66
QUESTIONS? 67

High Yield Pulp Ken DuffyVP, Sales & Marketing, High Yield Pulp
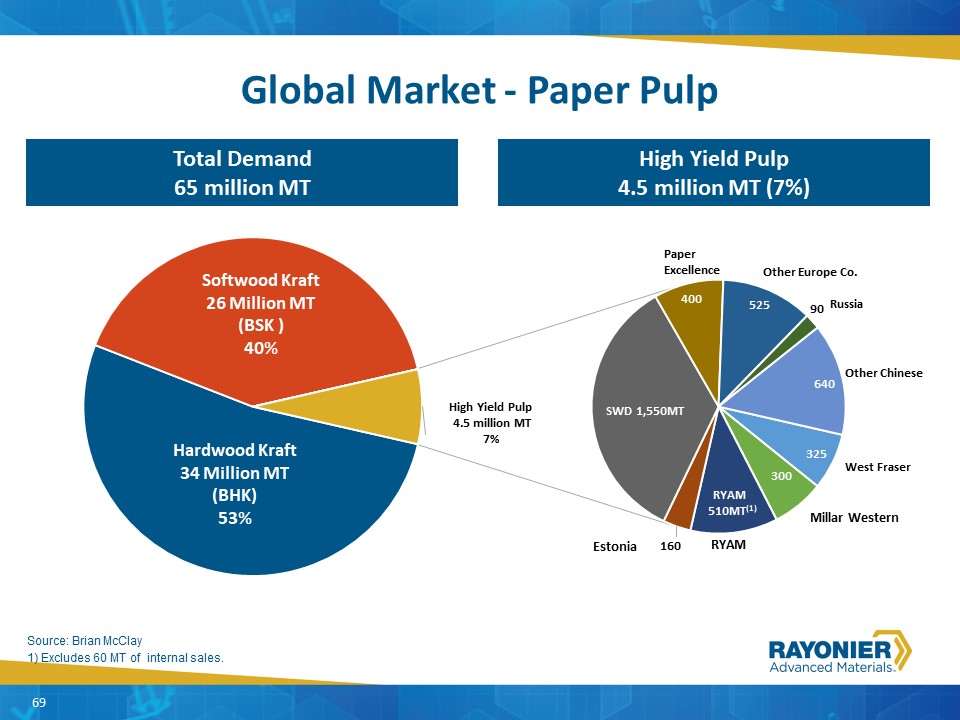
Global Market - Paper Pulp 69 High Yield Pulp4.5 million MT (7%) Total Demand 65 million MT 1) Excludes 60 MT of internal sales. Source: Brian McClay 69
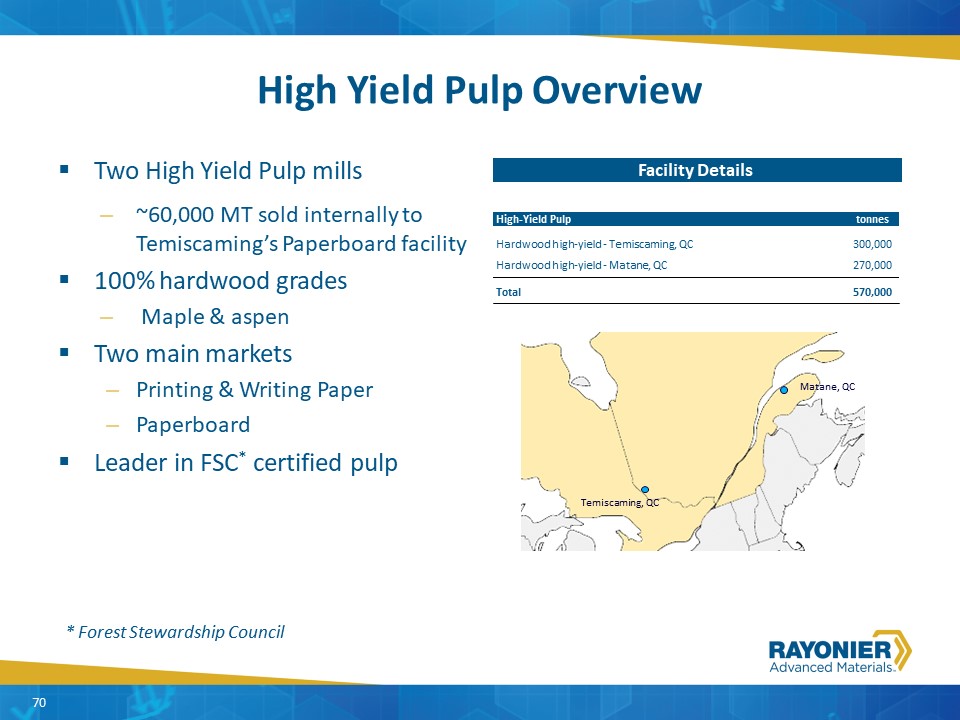
High Yield Pulp Overview Two High Yield Pulp mills~60,000 MT sold internally to Temiscaming’s Paperboard facility100% hardwood grades Maple & aspenTwo main marketsPrinting & Writing PaperPaperboard Leader in FSC* certified pulp 70 Facility Details High-Yield Pulp tonnes Hardwood high-yield - Temiscaming, QC 300,000 Hardwood high-yield - Matane, QC 270,000 Total 570,000 70 * Forest Stewardship Council Temiscaming, QC Matane, QC
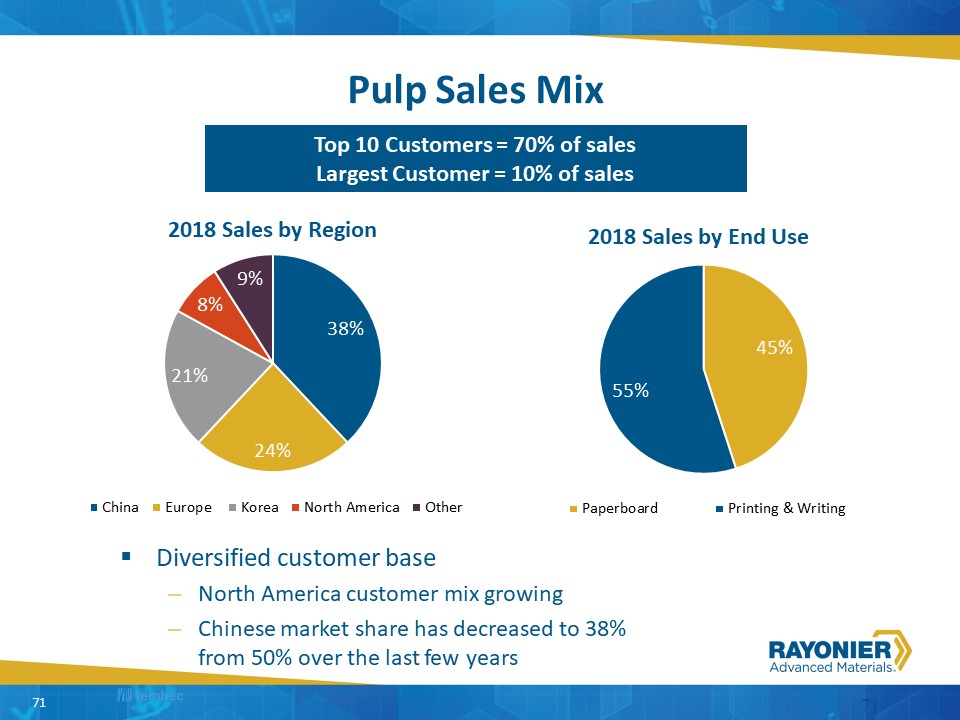
Pulp Sales Mix 71 Diversified customer baseNorth America customer mix growingChinese market share has decreased to 38% from 50% over the last few years 2018 Sales by Region 2018 Sales by End Use 71 Top 10 Customers = 70% of salesLargest Customer = 10% of sales

Major Paper-Grade Market Pulp Capacity Changes 72 Source: Hawkins Wright. Announced capacity changes only, not committed. 65 MT Global Market Pulp No significant announced capacity expansions expected until 2021 (000) MT’s 72 2% Demand Growth = 1.3 Million MT per year
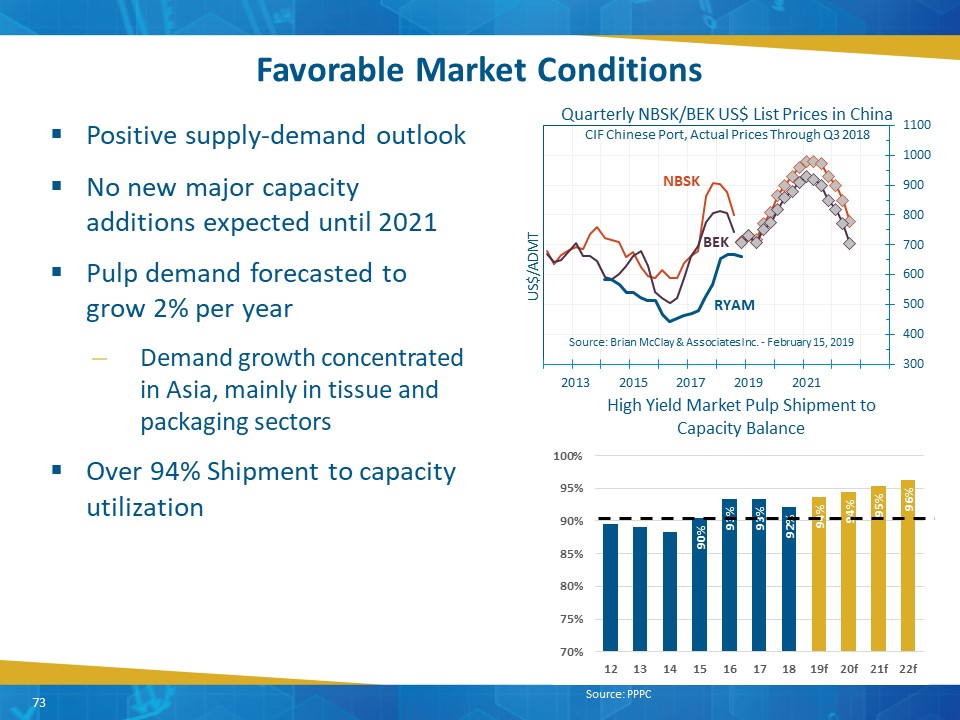
73 Source: Brian McClay & Associates Inc. - February 15, 2019 Favorable Market Conditions 73 Quarterly NBSK/BEK US$ List Prices in ChinaCIF Chinese Port, Actual Prices Through Q3 2018 Positive supply-demand outlook No new major capacity additions expected until 2021Pulp demand forecasted to grow 2% per yearDemand growth concentrated in Asia, mainly in tissue and packaging sectorsOver 94% Shipment to capacity utilization Source: PPPC

Attractive Mill Profiles Low cost millsBoth mills in second quartileDelivered Costs < $475/tonne (CIF China) Geographically located to deliver to key marketLow capital requirementsTotal CapEx of $3.5 million average per yearHigh cash flow conversion 74 74
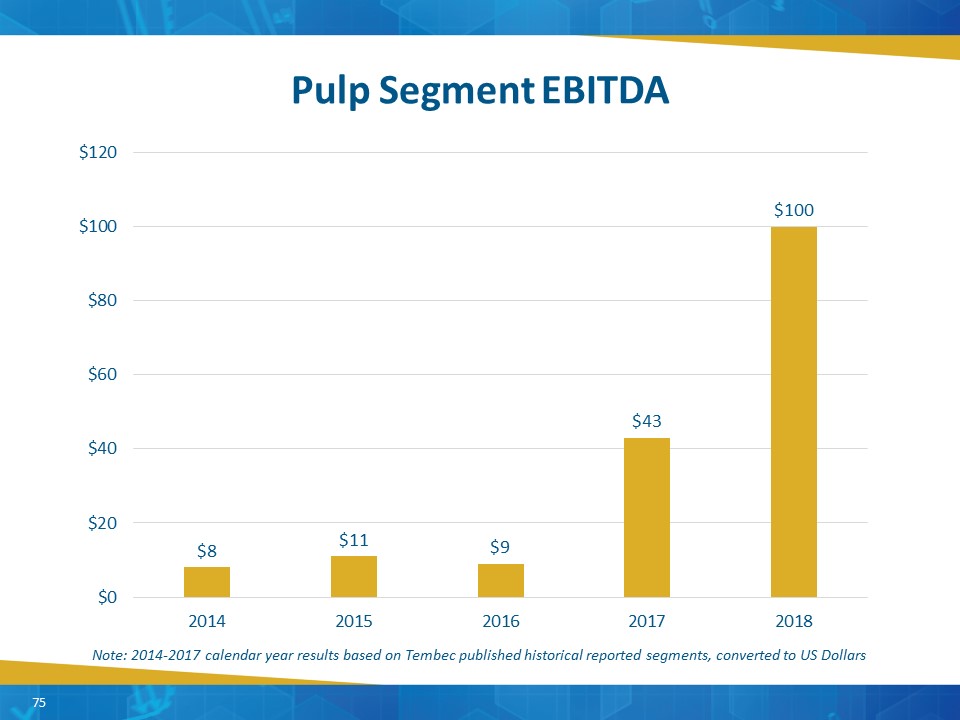
Pulp Segment EBITDA 75 Note: 2014-2017 calendar year results based on Tembec published historical reported segments, converted to US Dollars
Versatile high yield pulp millsHigh-bulk maple and aspen desired fiber for paperboard and printing and writing marketsLeading producer of FSC Certified High Yield PulpLow cost producer2nd Quartile on the cost curveFavorable transportation optionsPricing strength forecasted for several yearsPositive supply-demand dynamics with minimal new announced capacity until at least 2021 Pulp – Key Highlights 76
Forest Products Chris BlackSVP, Forest Products & Paper
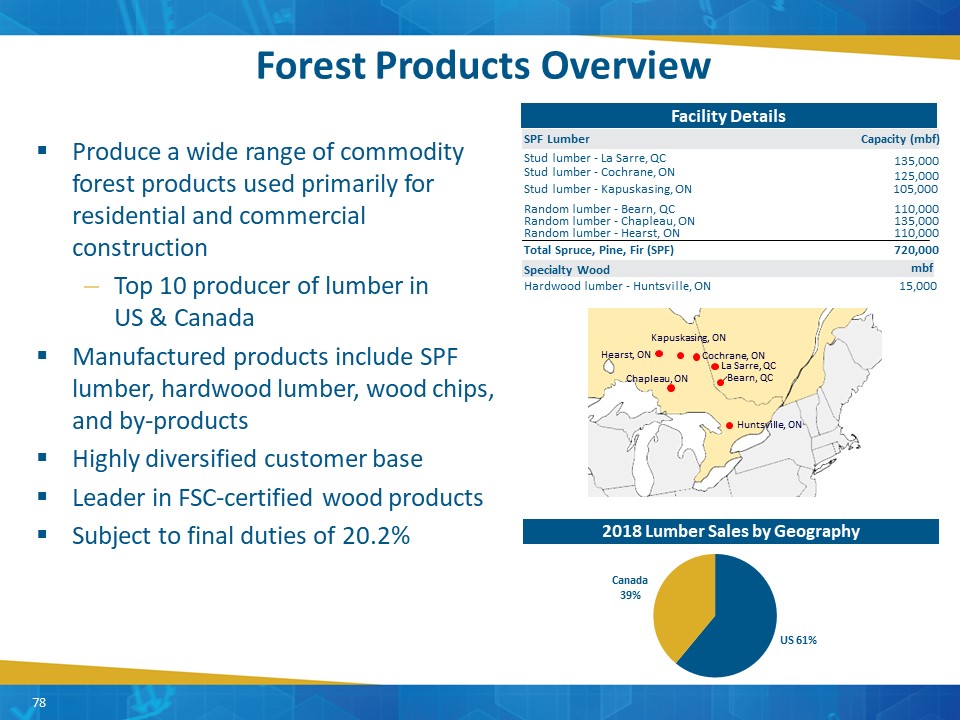
Kapuskasing, ON Bearn, QC Chapleau, ON Cochrane, ON Huntsville, ON La Sarre, QC Hearst, ON Forest Products Overview Produce a wide range of commodity forest products used primarily for residential and commercial construction Top 10 producer of lumber in US & CanadaManufactured products include SPF lumber, hardwood lumber, wood chips, and by-productsHighly diversified customer baseLeader in FSC-certified wood productsSubject to final duties of 20.2% Facility Details SPF Lumber (mbf) Stud lumber - La Sarre, QC 135,000 Stud lumber - Cochrane, ON 125,000 Stud lumber - Kapuskasing, ON 105,000 Random lumber - Bearn, QC 110,000 Random lumber - Chapleau, ON 135,000 Random lumber - Hearst, ON 110,000 Total Spruce, Pine, Fir (SPF) 720,000 Specialty Wood Hardwood lumber - Huntsville, ON 15,000 mbf 2018 Lumber Sales by Geography Capacity 78
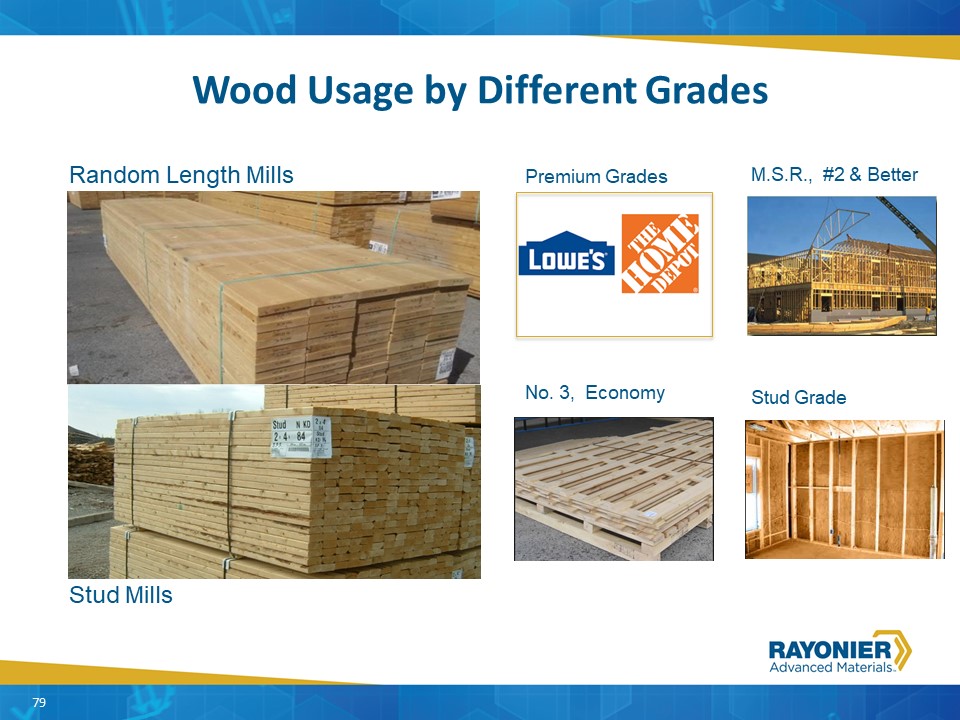
M.S.R., #2 & Better Stud Grade No. 3, Economy Premium Grades Wood Usage by Different Grades Random Length Mills Stud Mills 79
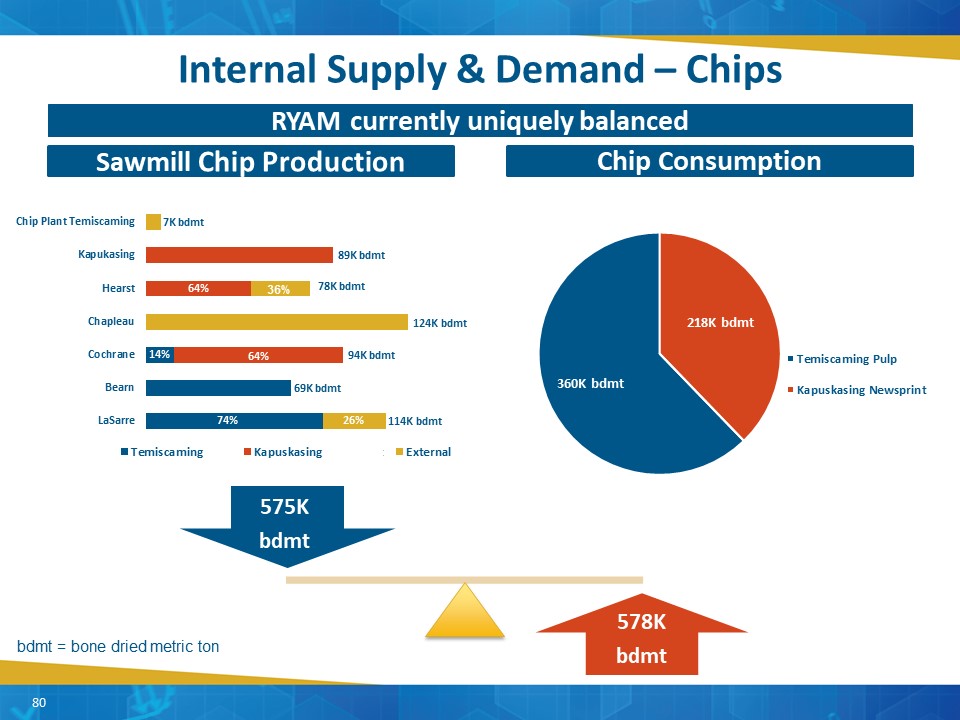
Internal Supply & Demand – Chips Sawmill Chip Production Chip Consumption RYAM currently uniquely balanced 36% bdmt = bone dried metric ton 80
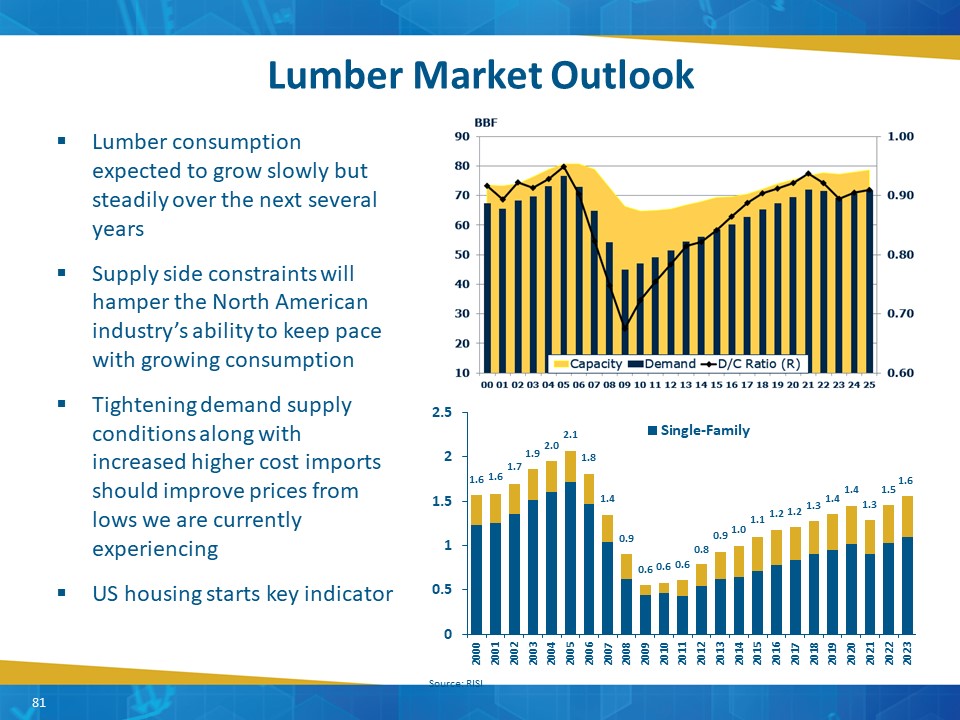
Lumber Market Outlook Lumber consumption expected to grow slowly but steadily over the next several yearsSupply side constraints will hamper the North American industry’s ability to keep pace with growing consumptionTightening demand supply conditions along with increased higher cost imports should improve prices from lows we are currently experiencingUS housing starts key indicator Source: RISI 81
U.S./Canada Softwood Lumber Dispute 2018 Canadian exports to the U.S. fell 1,800 BBF to 13,500 BBFRepresents 28% U.S. market share (down from 30% in 2017)AD & CVD rates at 20.2%RYAM current deposits to December 31st total US$37 million.No ongoing negotiations and no agreement anticipated over the next 12 months. In the meantime, Canadian government continues to work on litigation through both USMCA and WTO. 82
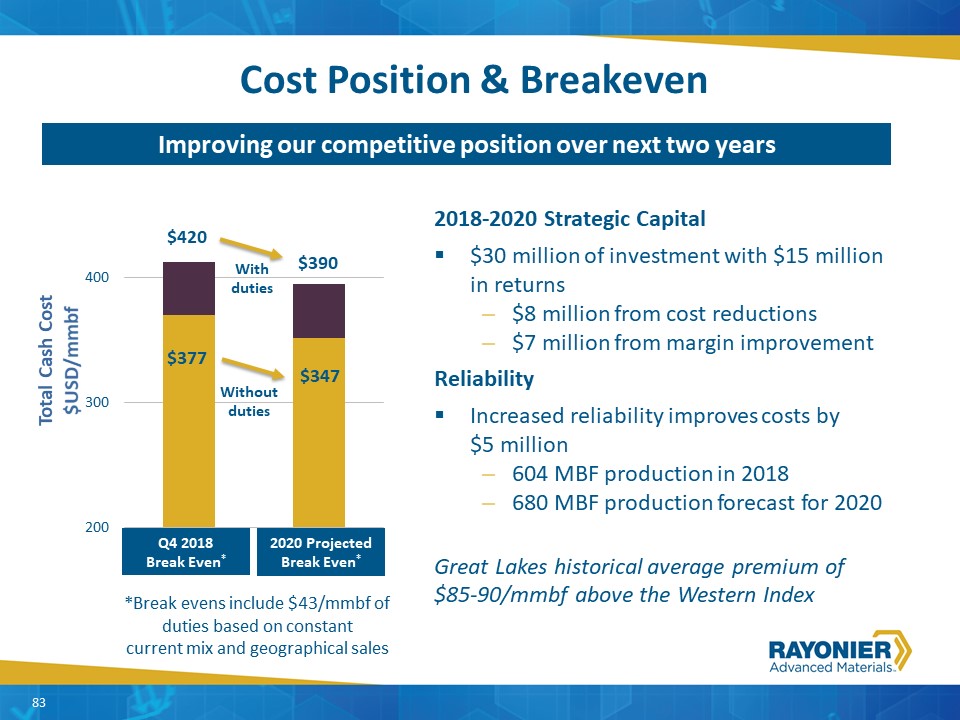
Cost Position & Breakeven 2018-2020 Strategic Capital $30 million of investment with $15 million in returns$8 million from cost reductions$7 million from margin improvementReliability Increased reliability improves costs by $5 million604 MBF production in 2018 680 MBF production forecast for 2020Great Lakes historical average premium of $85-90/mmbf above the Western Index Total Cash Cost $USD/mmbf $420 Improving our competitive position over next two years Q4 2018 Break Even* *Break evens include $43/mmbf of duties based on constant current mix and geographical sales $43 $377 $390 $347 2020 Projected Break Even* Without duties With duties 83
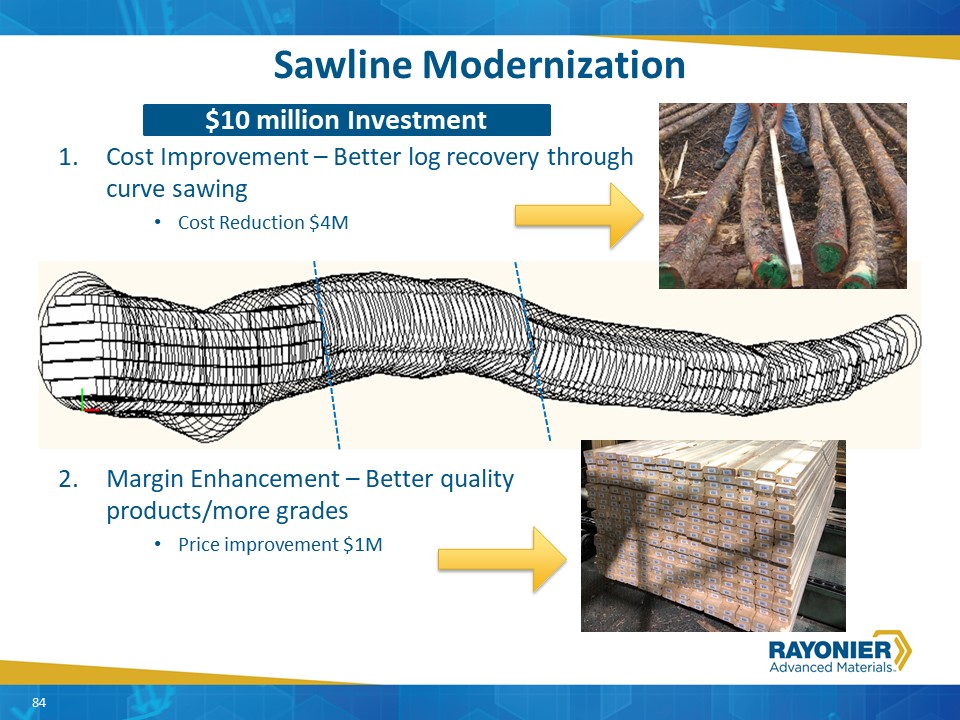
Sawline Modernization $10M InvestmentCost Improvement – Better log recovery through curve sawingCost Reduction $4MMargin Enhancement – Better quality products/more gradesPrice improvement $1M 84 $10 million Investment
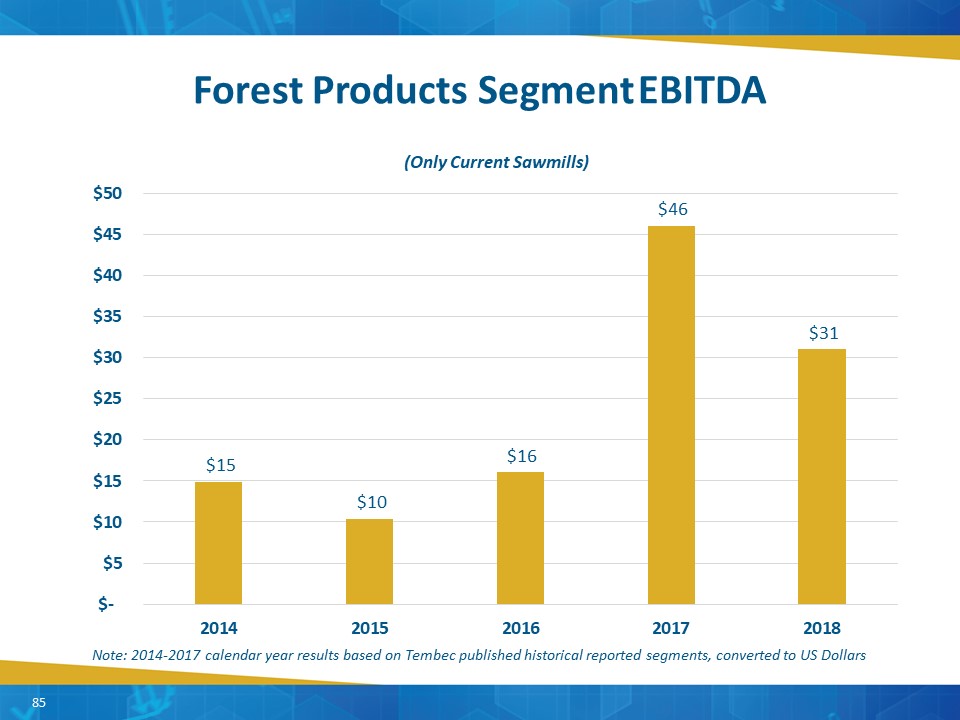
Forest Products Segment EBITDA 85 Note: 2014-2017 calendar year results based on Tembec published historical reported segments, converted to US Dollars
Forest Products – Key Highlights Well-managed and maintained FSC Certified wood basketOpportunity to lower our costs through investments and synergies at all sawmillsDemand/Capacity ratio of over 90% forecasts favorable conditions for sawmills 86
Paper Chris BlackSVP, Forest Products & Paper
88 Video
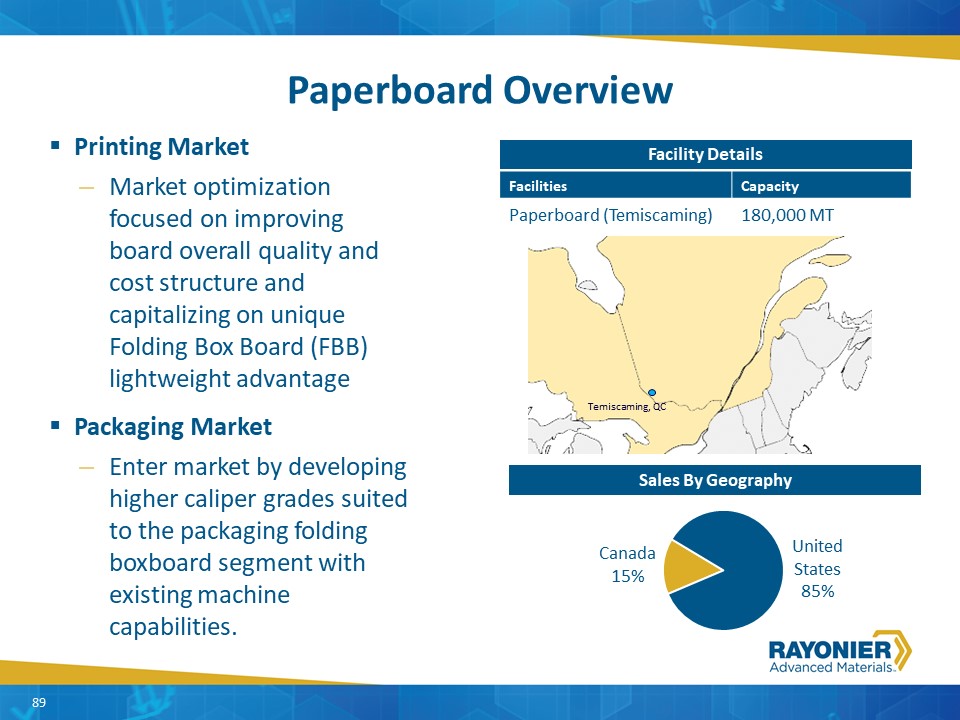
Facilities Capacity Paperboard (Temiscaming) 180,000 MT Paperboard Overview Printing MarketMarket optimization focused on improving board overall quality and cost structure and capitalizing on unique Folding Box Board (FBB) lightweight advantagePackaging MarketEnter market by developing higher caliper grades suited to the packaging folding boxboard segment with existing machine capabilities. Facility Details Sales By Geography 89 Temiscaming, QC
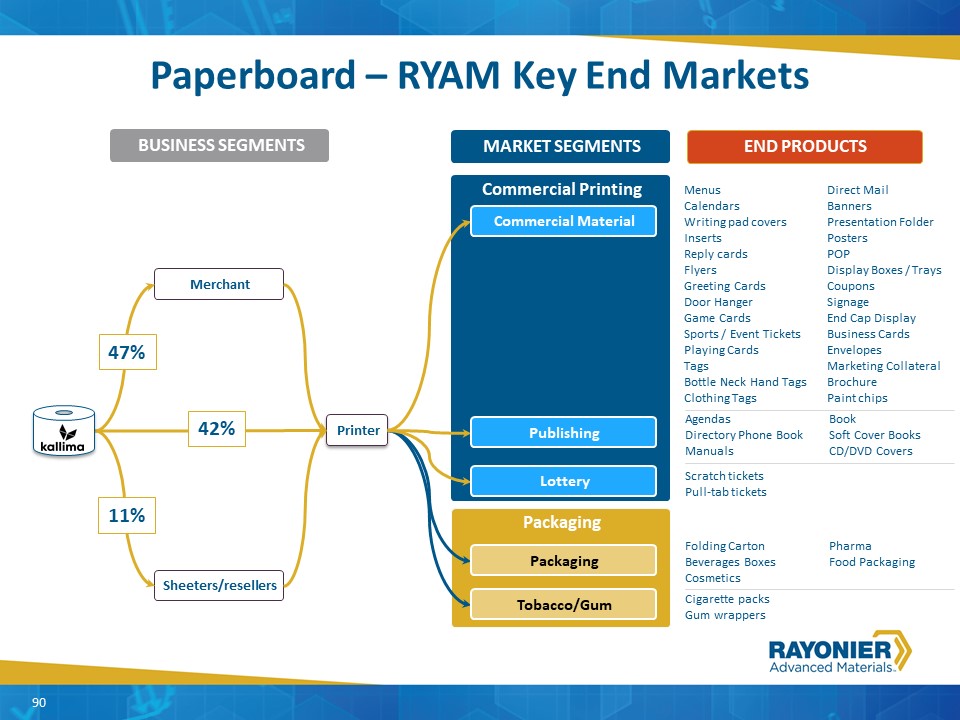
Paperboard – RYAM Key End Markets Packaging Commercial Printing Sheeters/resellers Merchant Printer Publishing BUSINESS SEGMENTS MARKET SEGMENTS Packaging Tobacco/Gum Lottery Commercial Material 47% 42% 11% Agendas BookDirectory Phone Book Soft Cover BooksManuals CD/DVD Covers Folding Carton PharmaBeverages Boxes Food PackagingCosmetics Cigarette packsGum wrappers Scratch ticketsPull-tab tickets MenusCalendarsWriting pad coversInsertsReply cardsFlyersGreeting CardsDoor HangerGame CardsSports / Event TicketsPlaying Cards Tags Bottle Neck Hand TagsClothing Tags Direct MailBannersPresentation FolderPostersPOPDisplay Boxes / TraysCouponsSignageEnd Cap DisplayBusiness CardsEnvelopesMarketing CollateralBrochurePaint chips END PRODUCTS 90
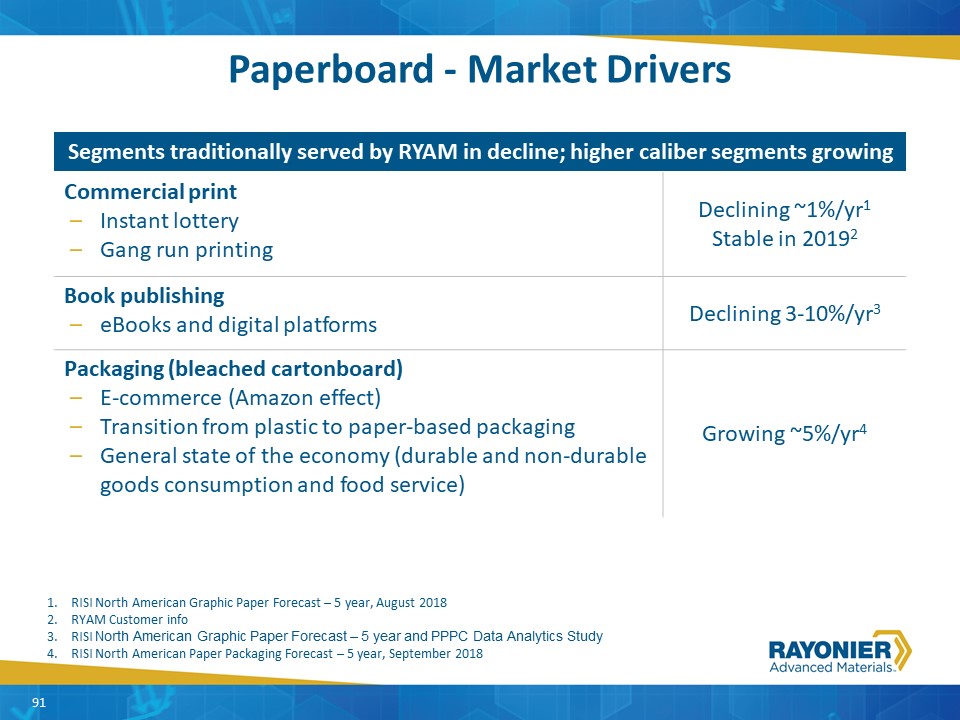
Paperboard - Market Drivers RISI North American Graphic Paper Forecast – 5 year, August 2018RYAM Customer infoRISI North American Graphic Paper Forecast – 5 year and PPPC Data Analytics StudyRISI North American Paper Packaging Forecast – 5 year, September 2018 Segments traditionally served by RYAM in decline; higher caliber segments growing Commercial print Instant lotteryGang run printing Declining ~1%/yr1Stable in 20192 Book publishingeBooks and digital platforms Declining 3-10%/yr3 Packaging (bleached cartonboard)E-commerce (Amazon effect)Transition from plastic to paper-based packagingGeneral state of the economy (durable and non-durable goods consumption and food service) Growing ~5%/yr4 91
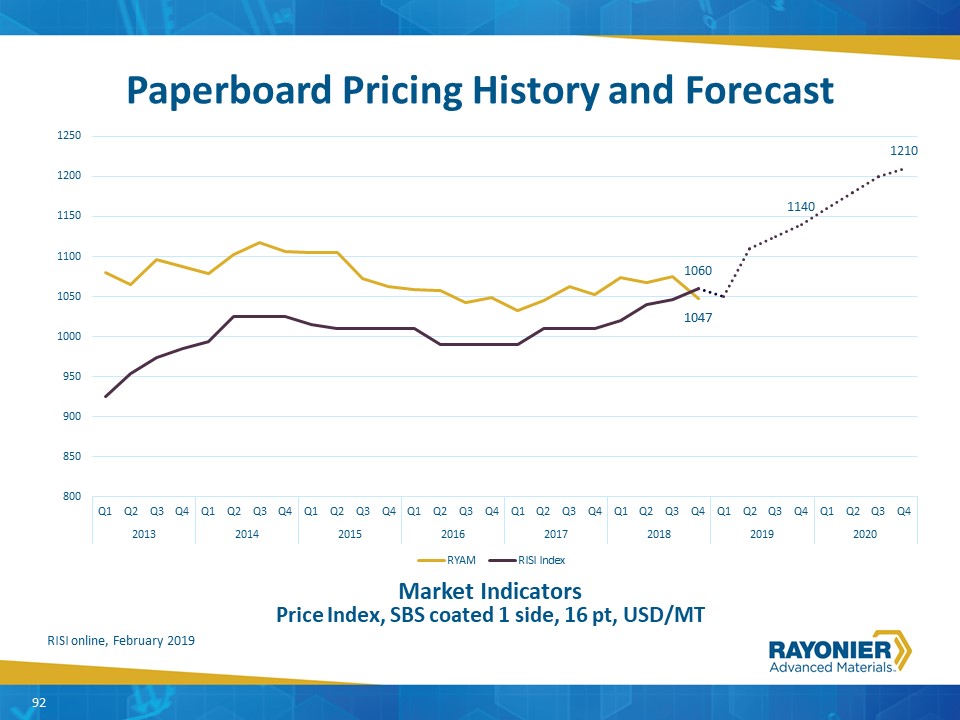
Paperboard Pricing History and Forecast 92 RISI online, February 2019 92 Market IndicatorsPrice Index, SBS coated 1 side, 16 pt, USD/MT
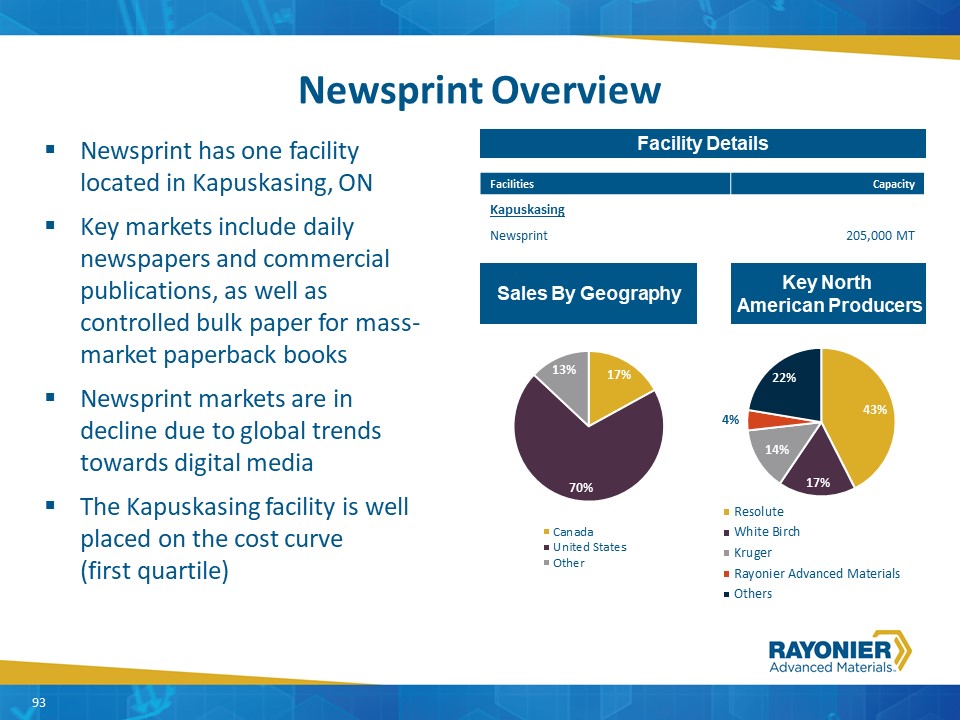
Newsprint Overview Newsprint has one facility located in Kapuskasing, ON Key markets include daily newspapers and commercial publications, as well as controlled bulk paper for mass-market paperback booksNewsprint markets are in decline due to global trends towards digital mediaThe Kapuskasing facility is well placed on the cost curve (first quartile) Facility Details Sales By Geography Facilities Capacity Kapuskasing Newsprint 205,000 MT Key North American Producers 93

Newsprint Market Commentary Newsprint demand declining 10% year over yearSimilar trend in Bulky Book grades in book publishing marketseBooksDigital publishingCommercial print continues to declineAdvertising spend shifting to digital platformsReduction in supply from high-cost producers exiting the market is tied to market pricesOne mill closure every 12-18 months needed to maintain supply/demand equilibrium 94
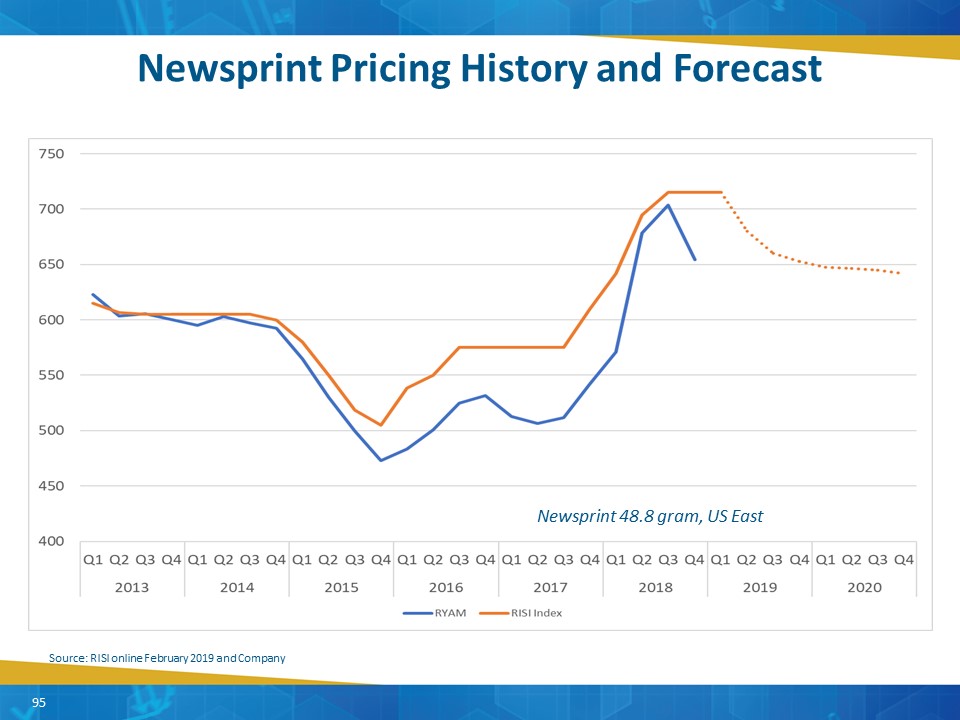
Newsprint Pricing History and Forecast Source: RISI online February 2019 and Company Newsprint 48.8 gram, US East 95
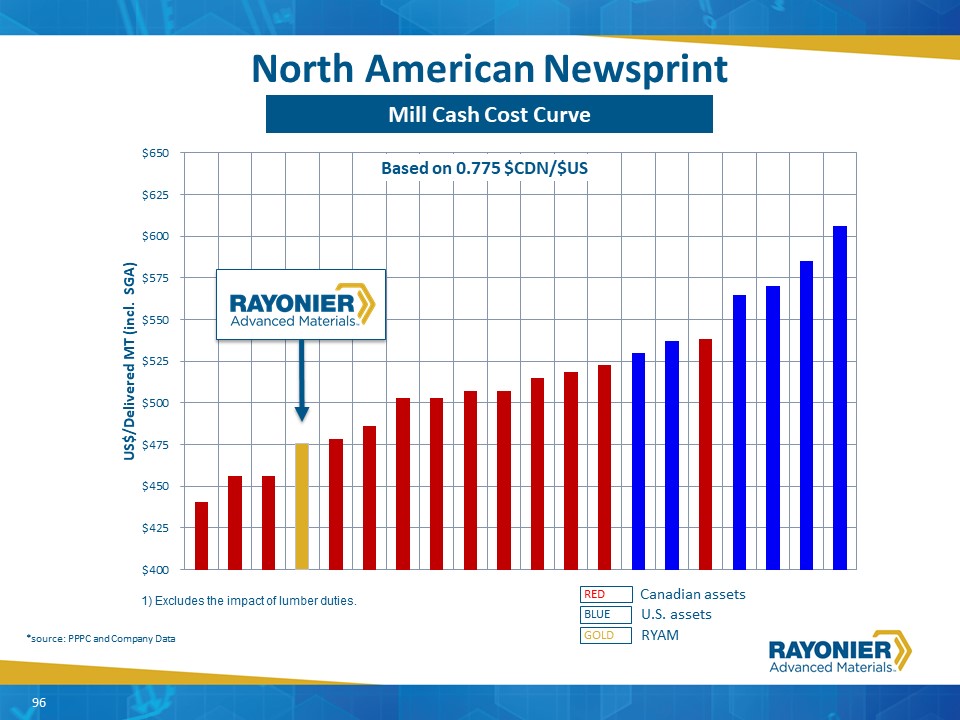
North American Newsprint Mill Cash Cost Curve Canadian assets U.S. assets RED BLUE RYAM GOLD *source: PPPC and Company Data 1) Excludes the impact of lumber duties. 96 RYAM Mill Cash Cost Curve
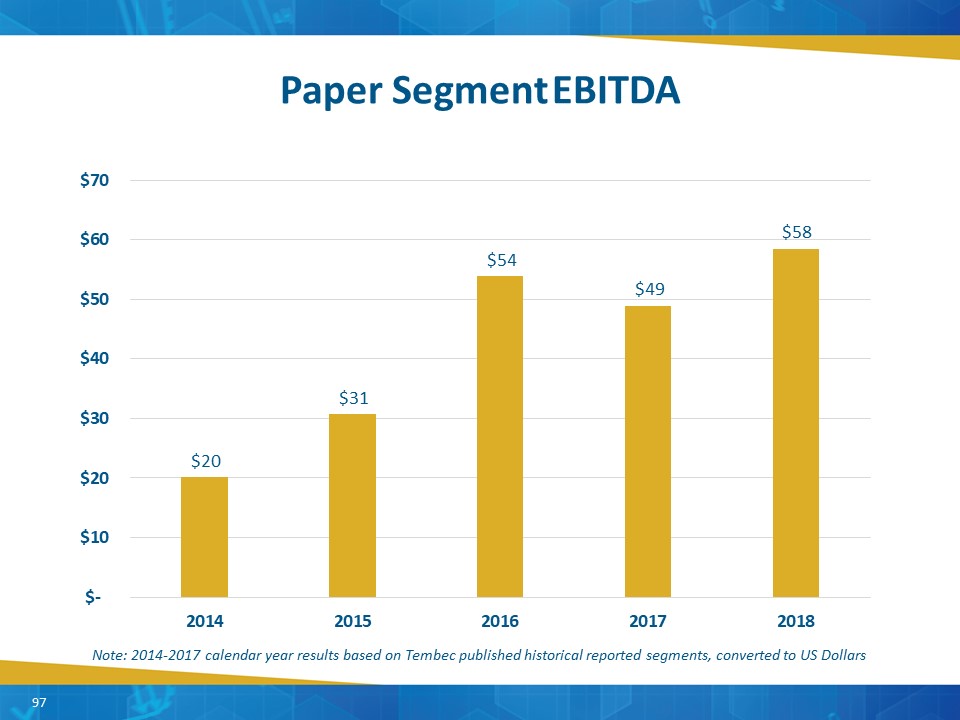
Paper Segment EBITDA 97 Note: 2014-2017 calendar year results based on Tembec published historical reported segments, converted to US Dollars
Paper – Key Highlights PaperboardWell-established and highly-regarded Kallima brandStrong share in the large lottery ticket marketOpportunity to produce more products for the high growth packaging sectorNewsprintLow cost producer Diversifying into more stable commercial print and book markets Exploring low cost opportunities to produce other grades including packaging products In Newsprint, evaluating higher value products with no low or little capital investmentTotal Paper Segment, reduce costs from Cost Transformation/Synergies and strategic Investments 98

Sustainability Carla YetterVP, Environmental & Regulatory Affairs
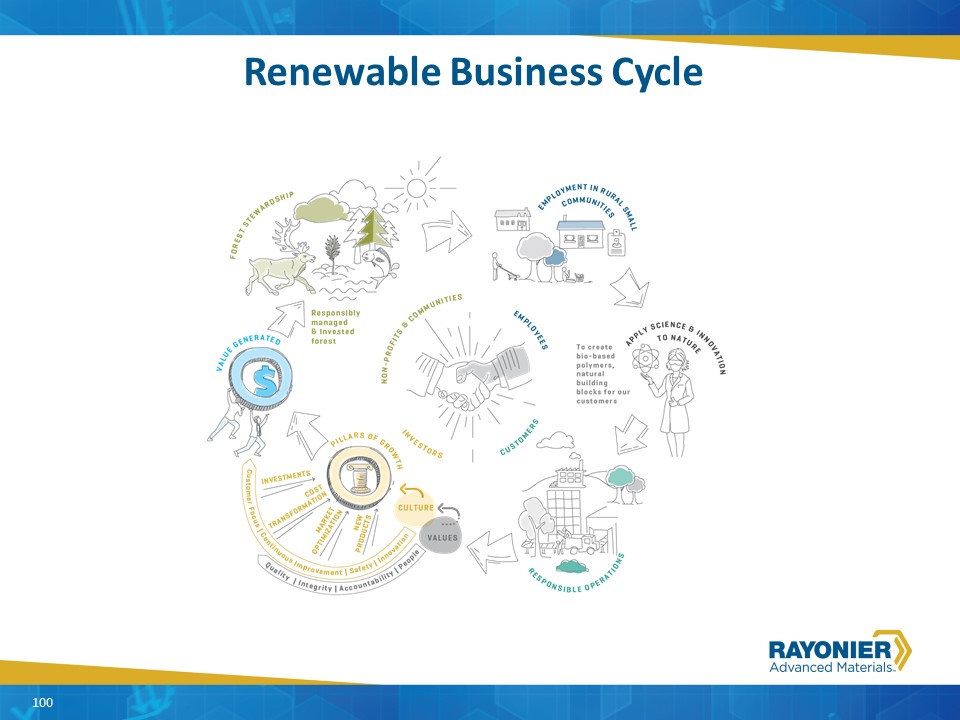
Renewable Business Cycle 100
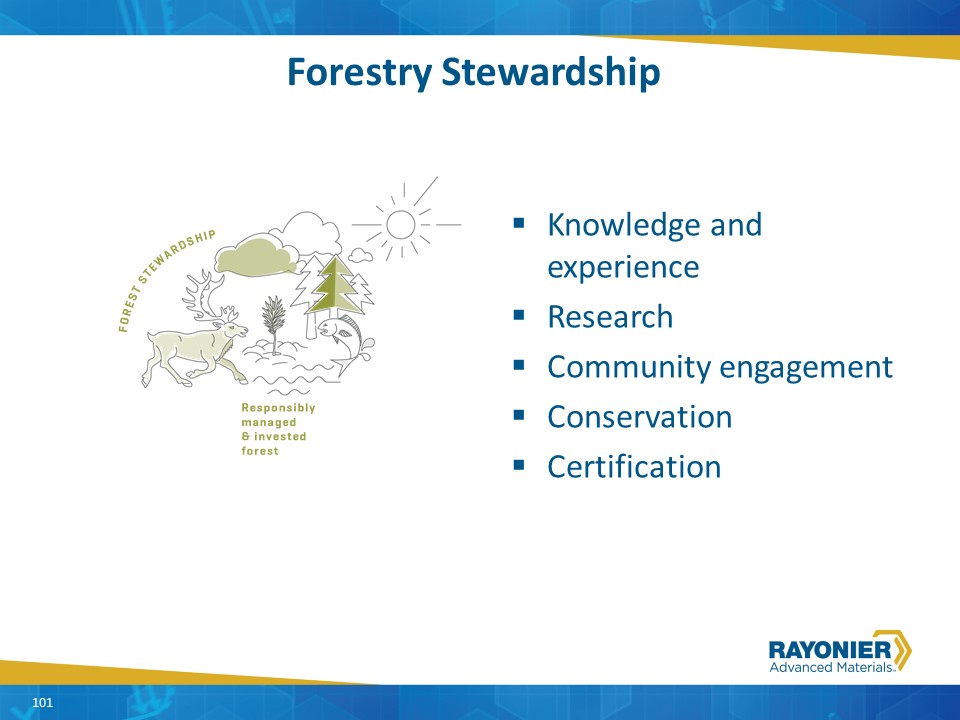
Forestry Stewardship Knowledge and experienceResearch Community engagementConservationCertification 101
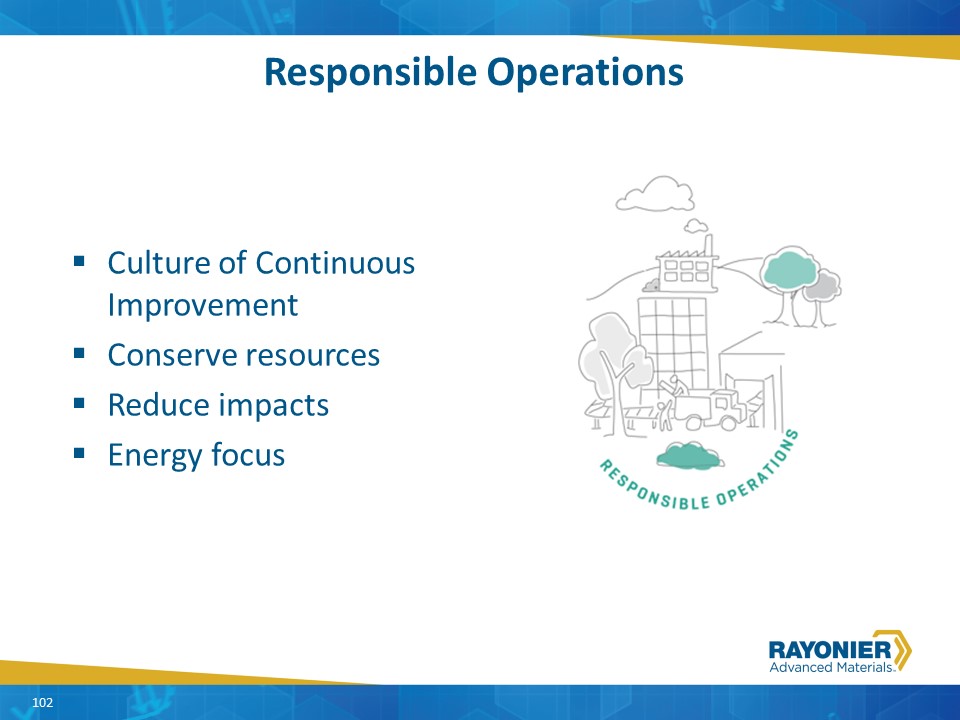
Responsible Operations Culture of Continuous ImprovementConserve resourcesReduce impactsEnergy focus 102
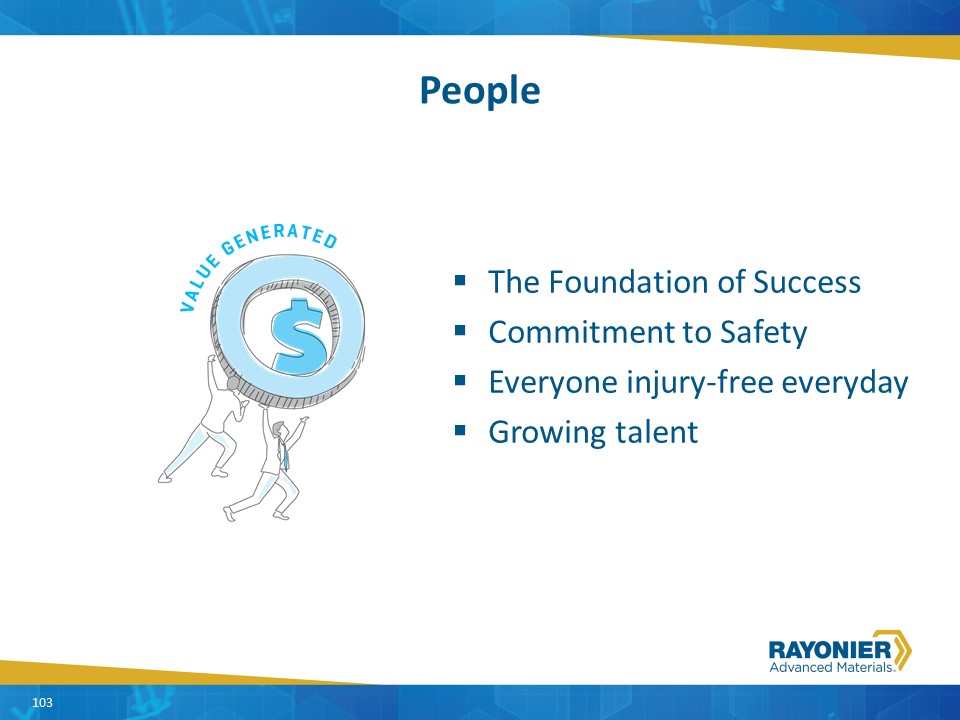
People The Foundation of SuccessCommitment to Safety Everyone injury-free everydayGrowing talent 103 103
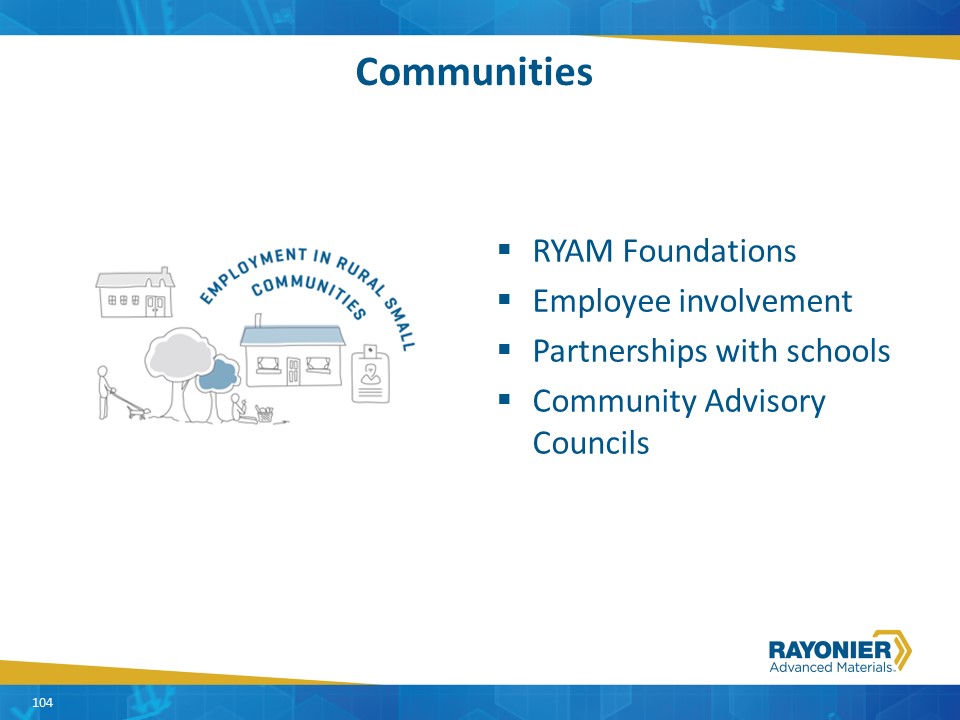
Communities RYAM FoundationsEmployee involvementPartnerships with schoolsCommunity Advisory Councils 104
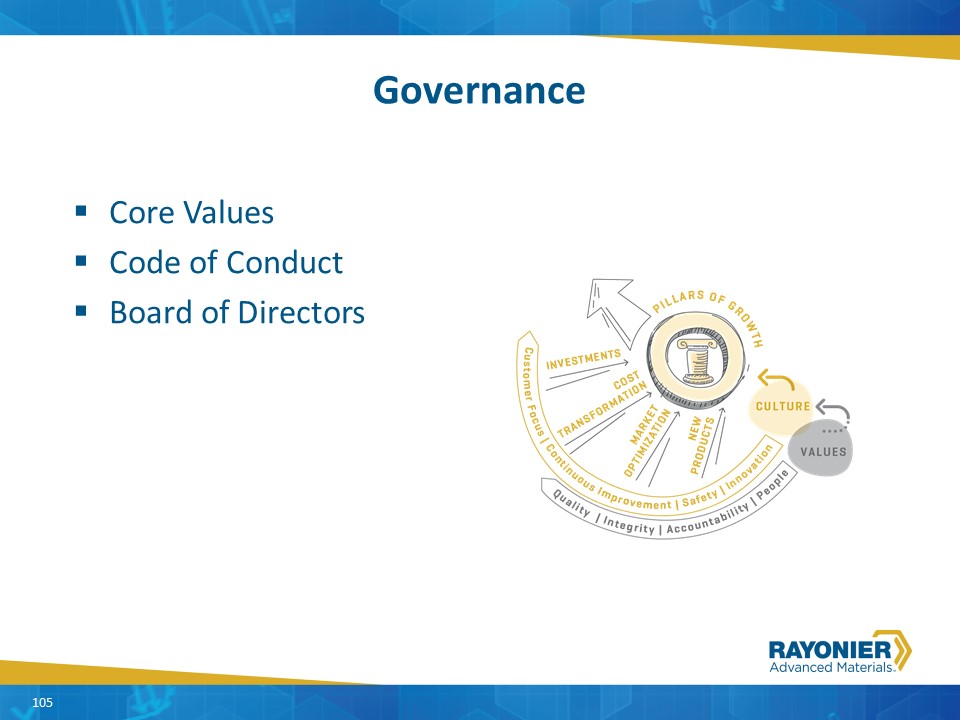
Governance Core ValuesCode of ConductBoard of Directors 105 105
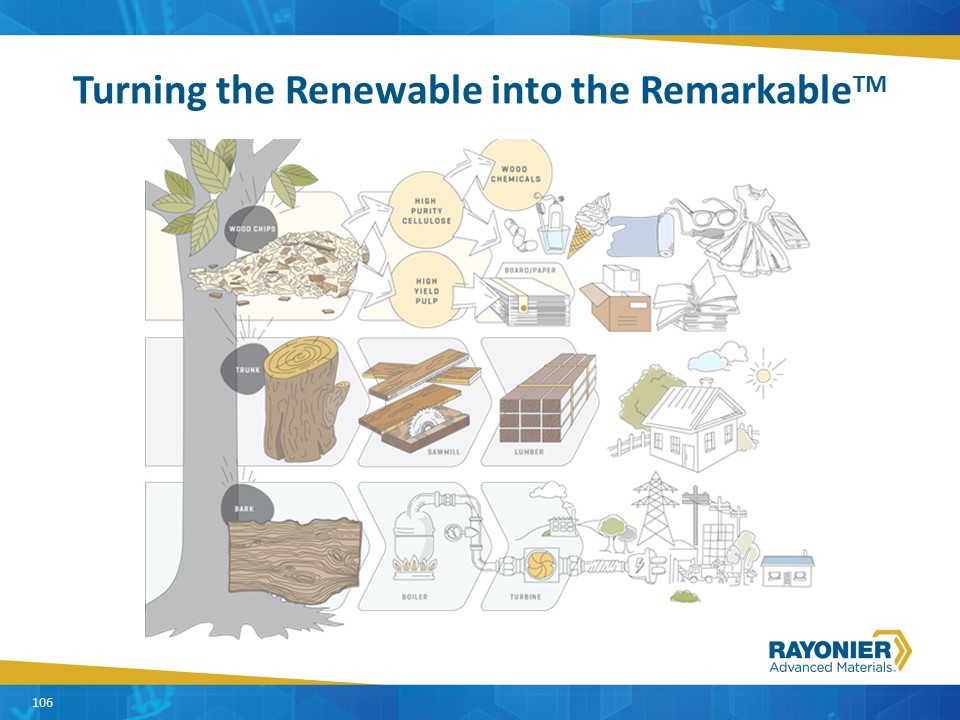
Turning the Renewable into the RemarkableTM 106 106
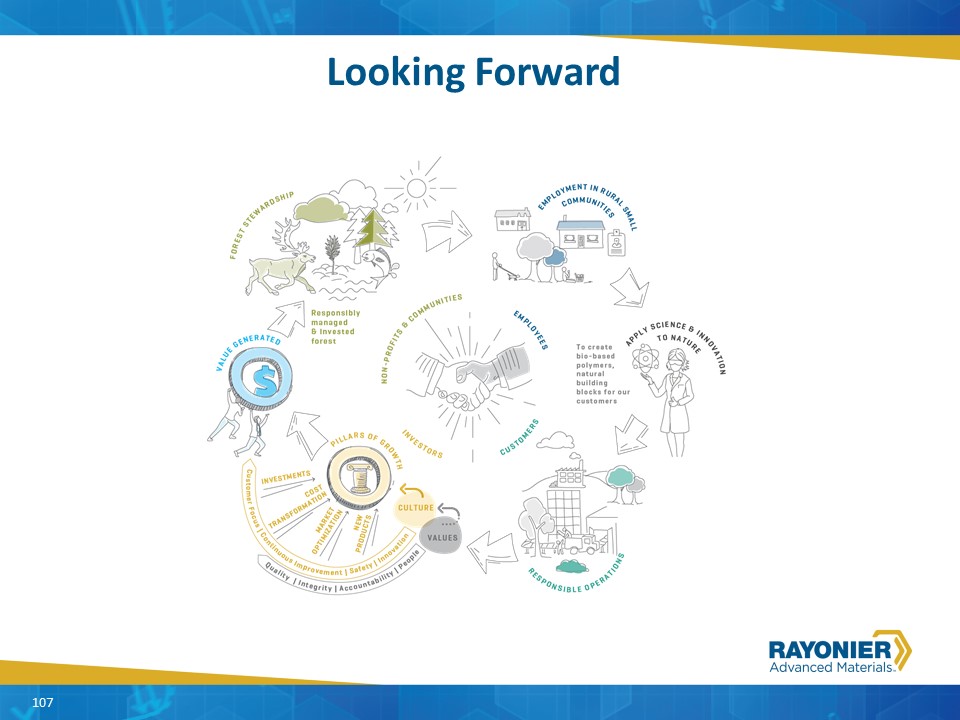
Looking Forward 107
www.rayonieram.com 108 108

QUESTIONS? 109
Strategic Pillars of Growth Frank RupertoChief Financial Officer and SVP, Finance & Strategy
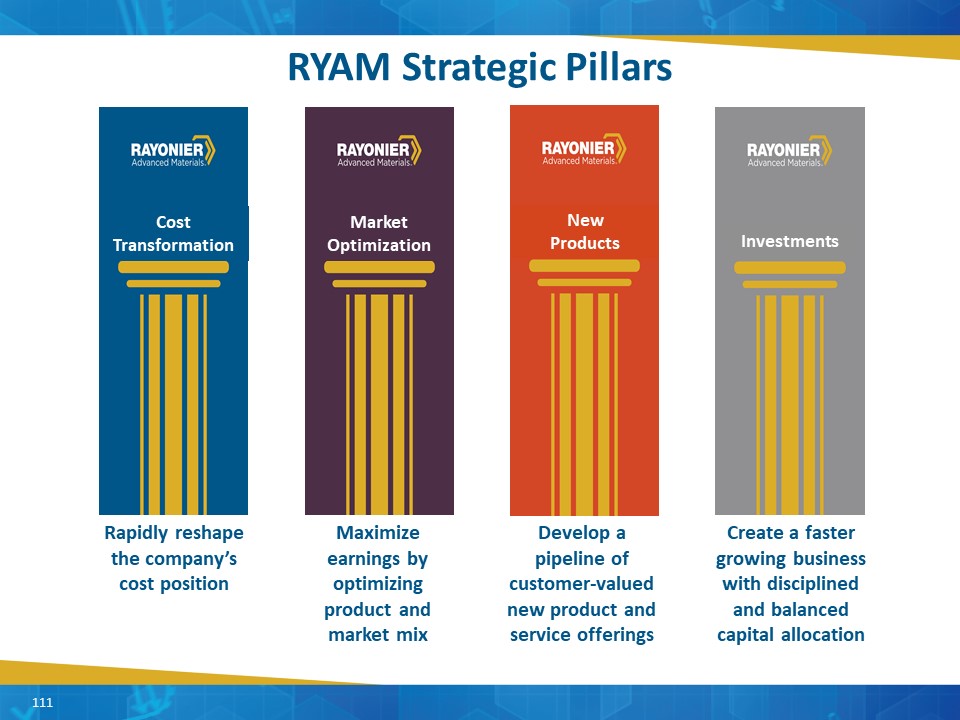
Rapidly reshape the company’s cost position Maximize earnings by optimizing product and market mix Develop a pipeline of customer-valued new product and service offerings Create a faster growing business with disciplined and balanced capital allocation Investments / RYAM Strategic Pillars Investments CostTransformation MarketOptimization NewProducts 111
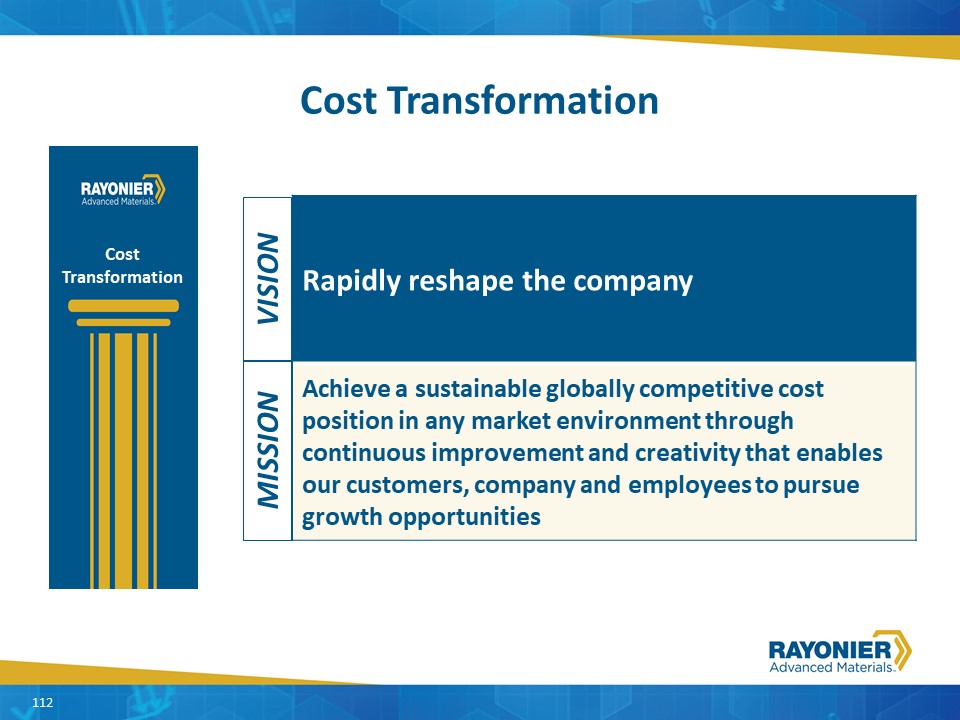
Cost Transformation Rapidly reshape the company Achieve a sustainable globally competitive cost position in any market environment through continuous improvement and creativity that enables our customers, company and employees to pursue growth opportunities VISION MISSION 112 CostTransformation
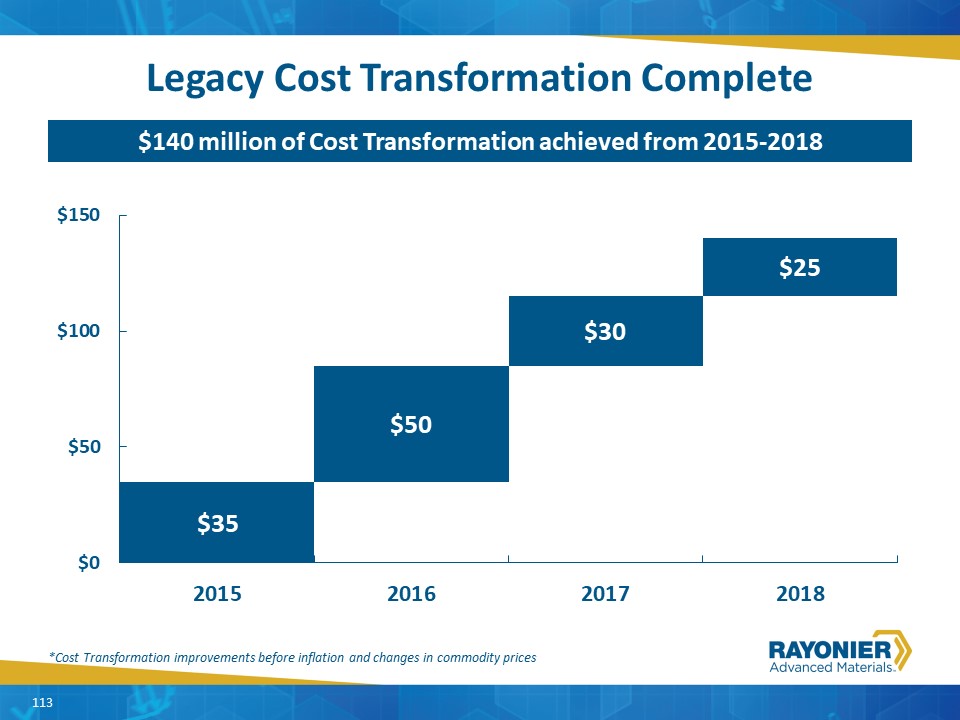
Legacy Cost Transformation Complete *Cost Transformation improvements before inflation and changes in commodity prices $140 million of Cost Transformation achieved from 2015-2018 113
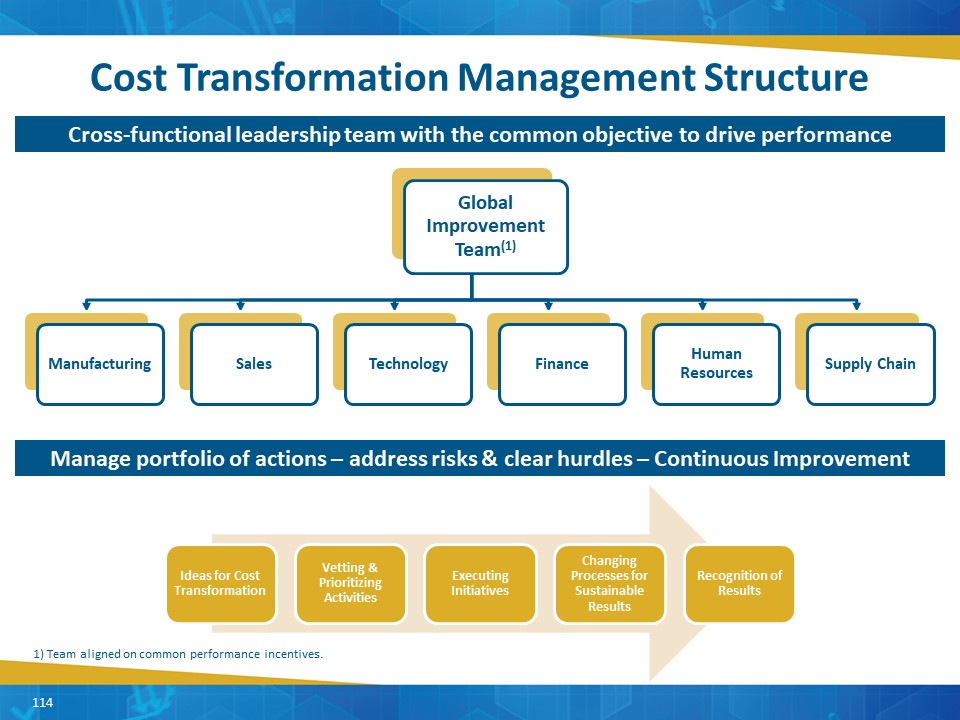
Cost Transformation Management Structure Cross-functional leadership team with the common objective to drive performance Manage portfolio of actions – address risks & clear hurdles – Continuous Improvement 1) Team aligned on common performance incentives. 114
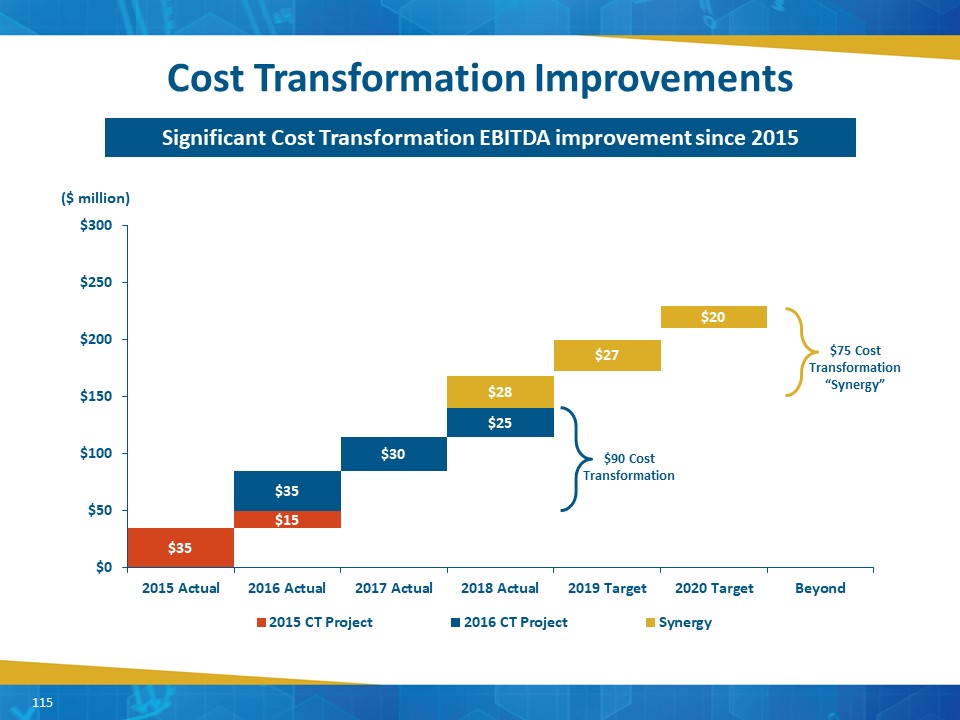
($ million) Cost Transformation Improvements Significant Cost Transformation EBITDA improvement since 2015 $90 Cost Transformation $75 Cost Transformation“Synergy” 115
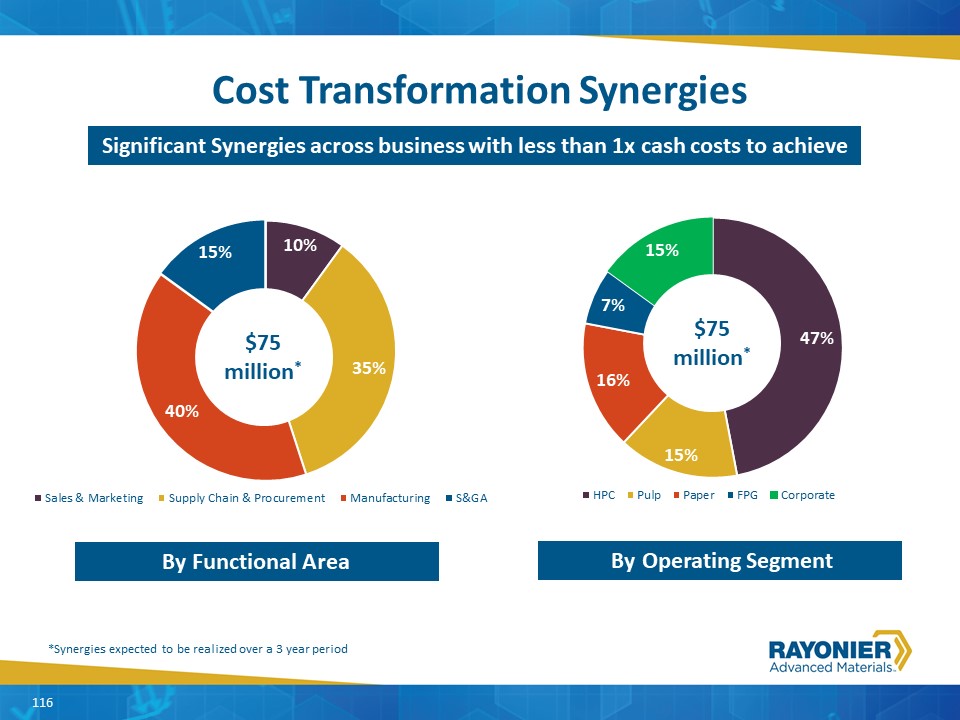
Granite Considerations---Granite Overview By Functional Area *Synergies expected to be realized over a 3 year period $75 million* By Operating Segment Cost Transformation Synergies Significant Synergies across business with less than 1x cash costs to achieve 116
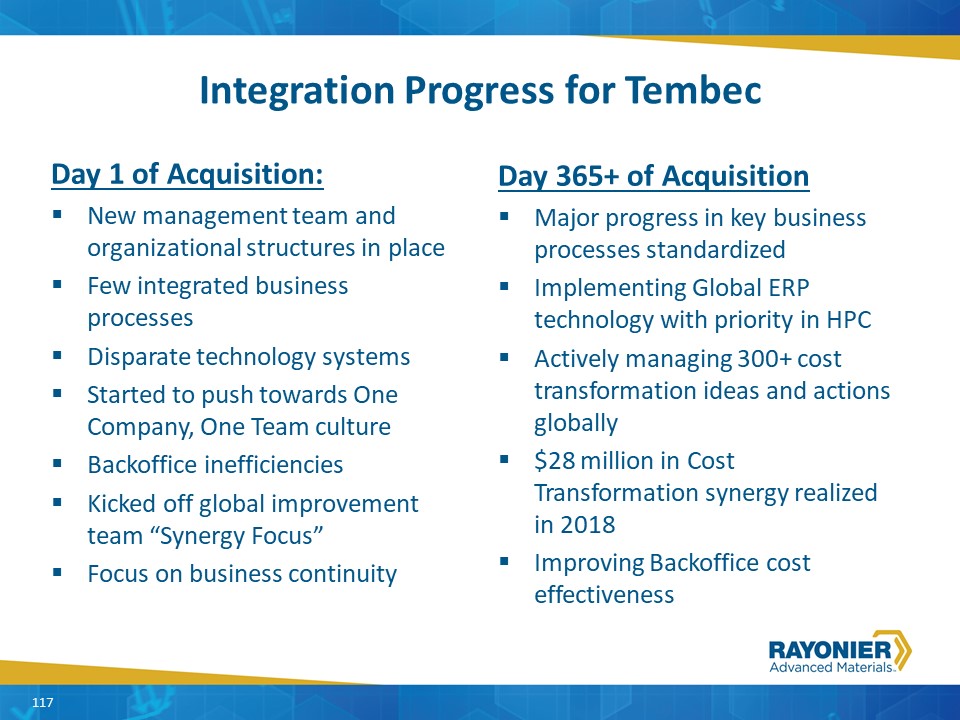
Integration Progress for Tembec Day 1 of Acquisition:New management team and organizational structures in placeFew integrated business processesDisparate technology systemsStarted to push towards One Company, One Team cultureBackoffice inefficienciesKicked off global improvement team “Synergy Focus”Focus on business continuity Day 365+ of AcquisitionMajor progress in key business processes standardizedImplementing Global ERP technology with priority in HPCActively managing 300+ cost transformation ideas and actions globally $28 million in Cost Transformation synergy realized in 2018Improving Backoffice cost effectiveness 117
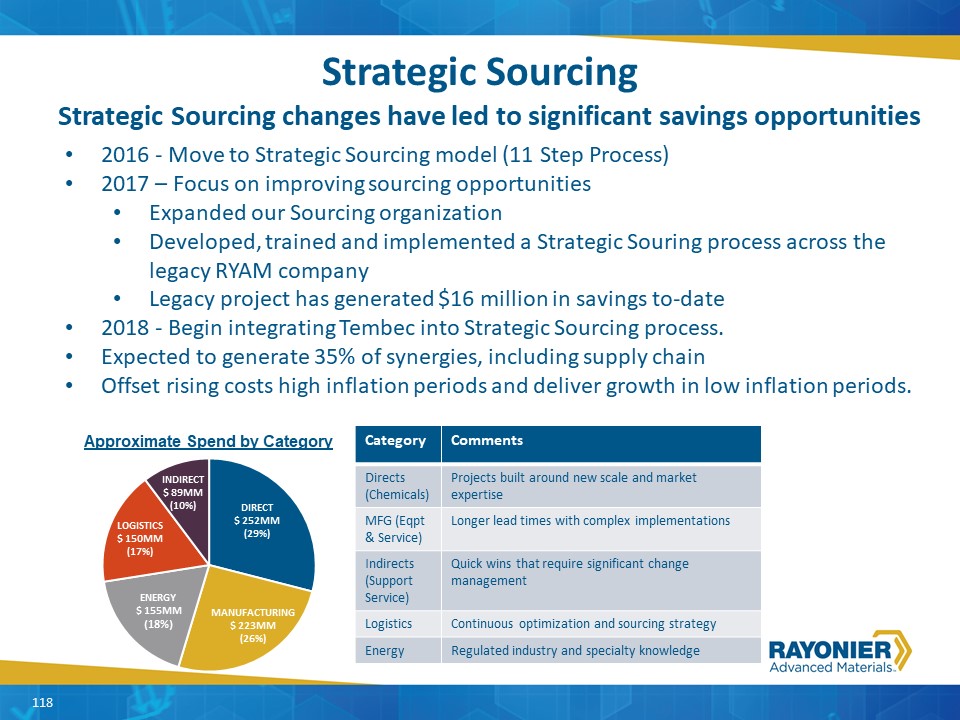
Strategic Sourcing Strategic Sourcing changes have led to significant savings opportunities 2016 - Move to Strategic Sourcing model (11 Step Process)2017 – Focus on improving sourcing opportunitiesExpanded our Sourcing organizationDeveloped, trained and implemented a Strategic Souring process across the legacy RYAM companyLegacy project has generated $16 million in savings to-date2018 - Begin integrating Tembec into Strategic Sourcing process. Expected to generate 35% of synergies, including supply chainOffset rising costs high inflation periods and deliver growth in low inflation periods. Category Comments Directs (Chemicals) Projects built around new scale and market expertise MFG (Eqpt & Service) Longer lead times with complex implementations Indirects (Support Service) Quick wins that require significant change management Logistics Continuous optimization and sourcing strategy Energy Regulated industry and specialty knowledge Approximate Spend by Category 118

Cost Transformation – Examples Corporate and Backoffice synergies Eliminate redundancy in management teamsImplement technology to automate transactional business processesOutsource certain transactional or support function to be more cost effective and efficient Drive functional back office costs to industry bench marksExpected to generate approximately 15% of targeted synergies Distribution of Synergy by Area 119
Market Optimization Maximize earnings by optimizing product and market mix Identify and achieve optimum sustainable sales mix based on RYAM production capabilities, end markets and customer attractiveness VISION MISSION 120 MarketOptimization
Go-to-Market Strategy Review Cellulose Specialties volumes to improve marginsReduce exposure to acetate and grow with the market in ethers and other CSExit lowest margin businessRealign production assetsGoal to reverse price declines from previous 5 yearsStabilize HPC segment and improve price, margins and EBITDAGo-to-Market Strategy aligned with and supports Market Optimization goal of generating $15 million in EBITDA by 2020 Commercial Actions and Realignment of Assets Drive Long-Term EBITDA Growth 121
New Products Develop a pipeline of customer-valued new product and service offerings Improve profitability by generating 20% of sales from new products developed in the prior five years VISION MISSION 122 NewProducts
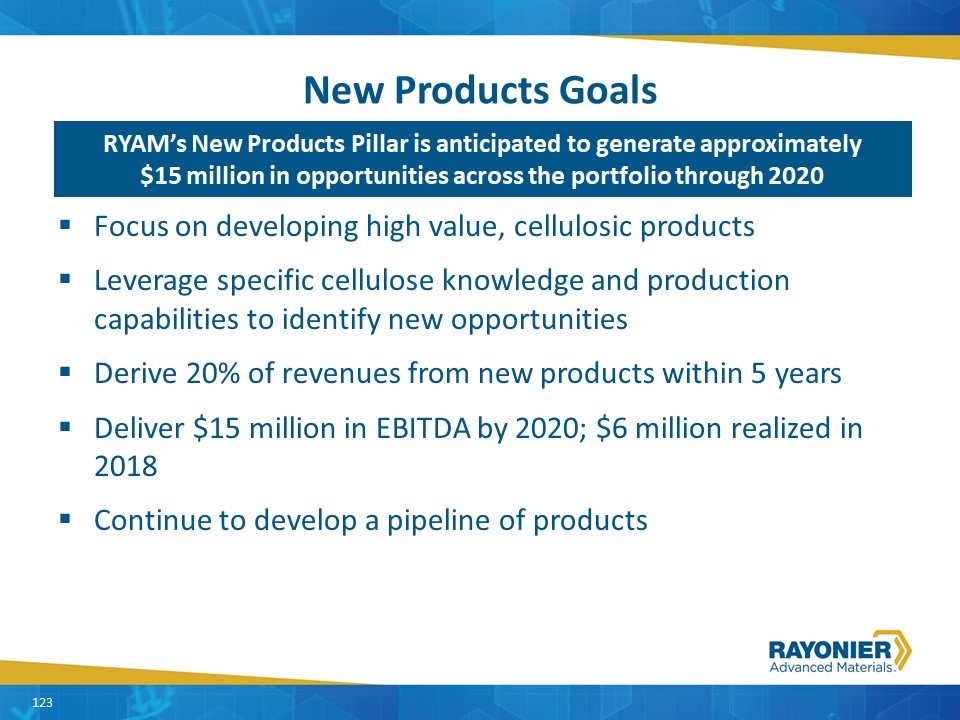
New Products Goals Focus on developing high value, cellulosic productsLeverage specific cellulose knowledge and production capabilities to identify new opportunitiesDerive 20% of revenues from new products within 5 yearsDeliver $15 million in EBITDA by 2020; $6 million realized in 2018Continue to develop a pipeline of products RYAM’s New Products Pillar is anticipated to generate approximately $15 million in opportunities across the portfolio through 2020 123
Investments Create a faster growing business with disciplined and balanced capital allocation Allocate capital in a disciplined and balanced method focused on manufacturing assets, managing debt levels and investing for risk adjusted returns to drive shareholder value VISION MISSION Investments 124 Investments
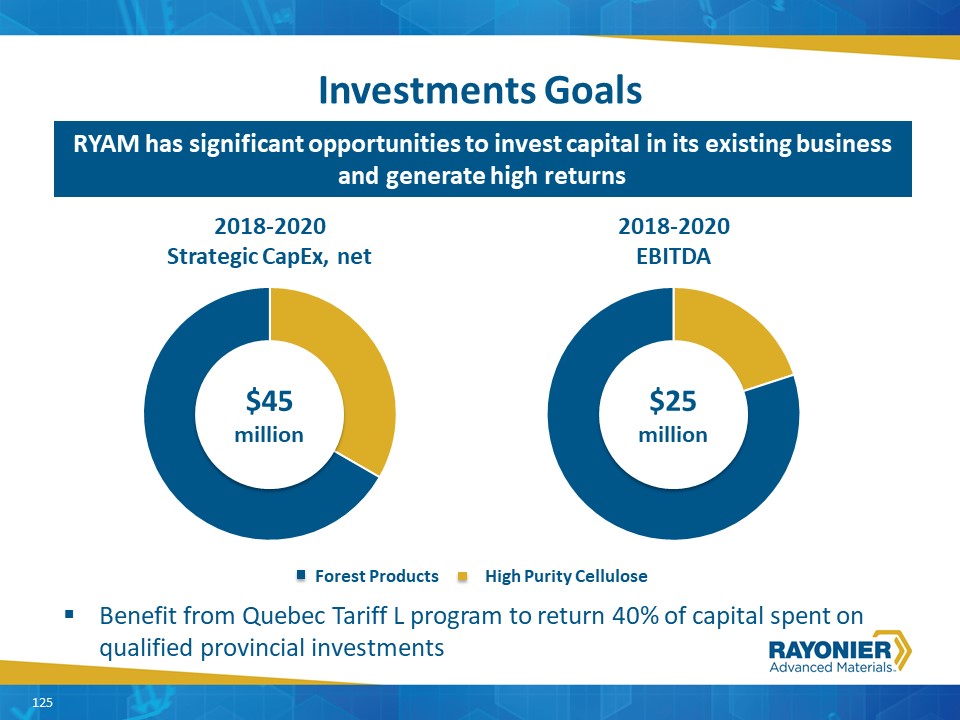
Investments Goals Benefit from Quebec Tariff L program to return 40% of capital spent on qualified provincial investments RYAM has significant opportunities to invest capital in its existing business and generate high returns 125 $45million Forest Products High Purity Cellulose $25million
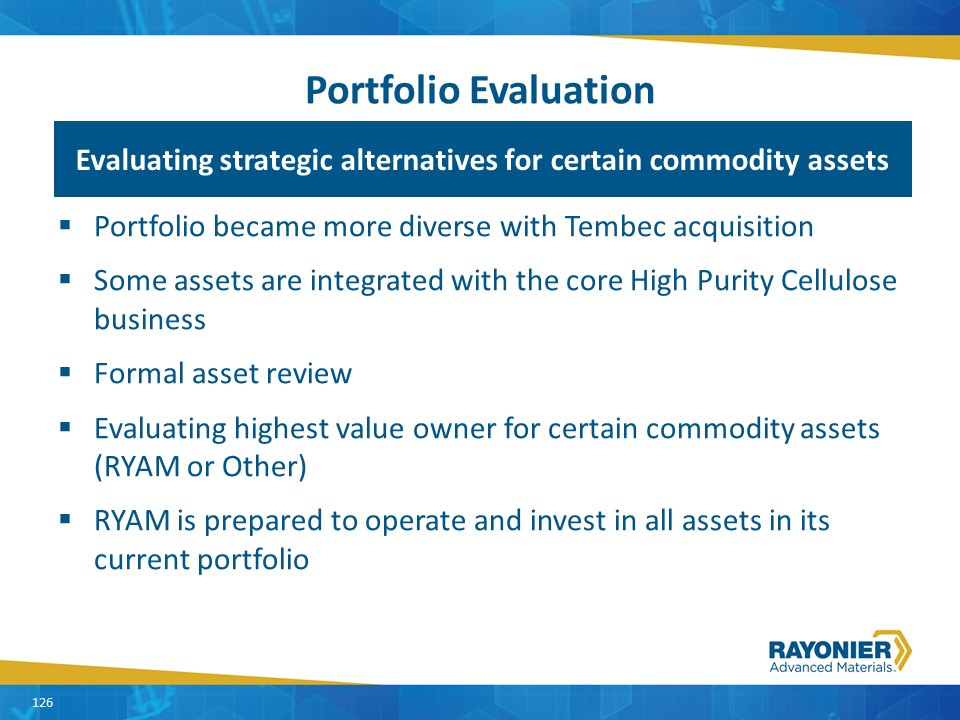
Portfolio Evaluation Portfolio became more diverse with Tembec acquisitionSome assets are integrated with the core High Purity Cellulose businessFormal asset reviewEvaluating highest value owner for certain commodity assets (RYAM or Other)RYAM is prepared to operate and invest in all assets in its current portfolio 126 Evaluating strategic alternatives for certain commodity assets 126
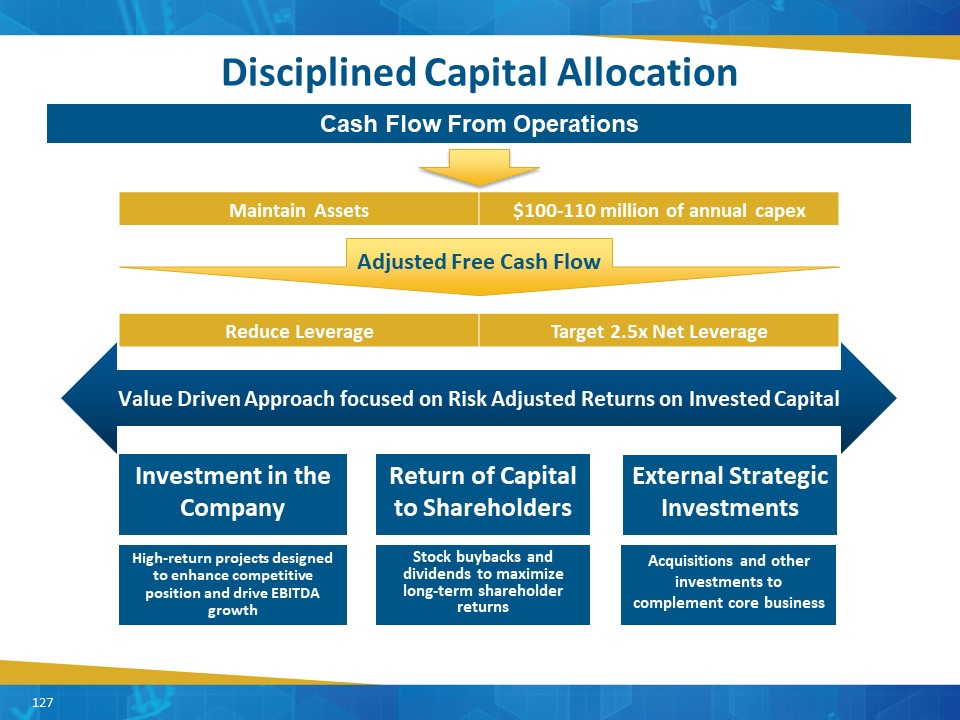
Disciplined Capital Allocation Maintain Assets $100-110 million of annual capex Adjusted Free Cash Flow Return of Capital to Shareholders Stock buybacks and dividends to maximize long-term shareholder returns External Strategic Investments Acquisitions and other investments to complement core business Investment in the Company High-return projects designed to enhance competitive position and drive EBITDA growth Reduce Leverage Target 2.5x Net Leverage Value Driven Approach focused on Risk Adjusted Returns on Invested Capital Cash Flow From Operations 127
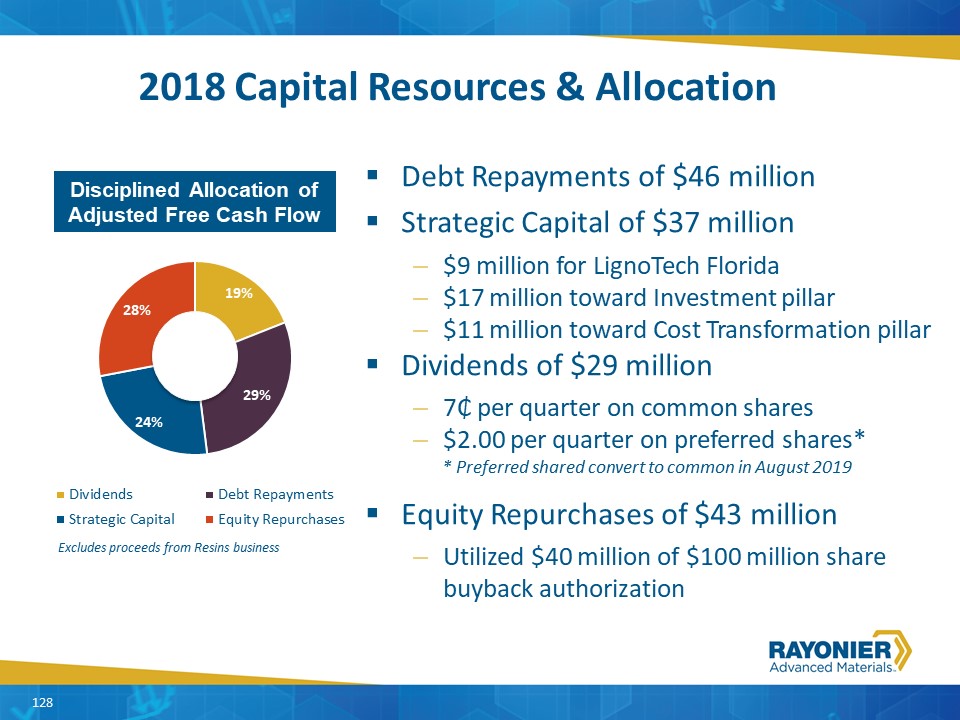
2018 Capital Resources & Allocation Disciplined Allocation of Adjusted Free Cash Flow Excludes proceeds from Resins business Debt Repayments of $46 millionStrategic Capital of $37 million$9 million for LignoTech Florida$17 million toward Investment pillar$11 million toward Cost Transformation pillarDividends of $29 million7₵ per quarter on common shares$2.00 per quarter on preferred shares* * Preferred shared convert to common in August 2019Equity Repurchases of $43 millionUtilized $40 million of $100 million share buyback authorization 128
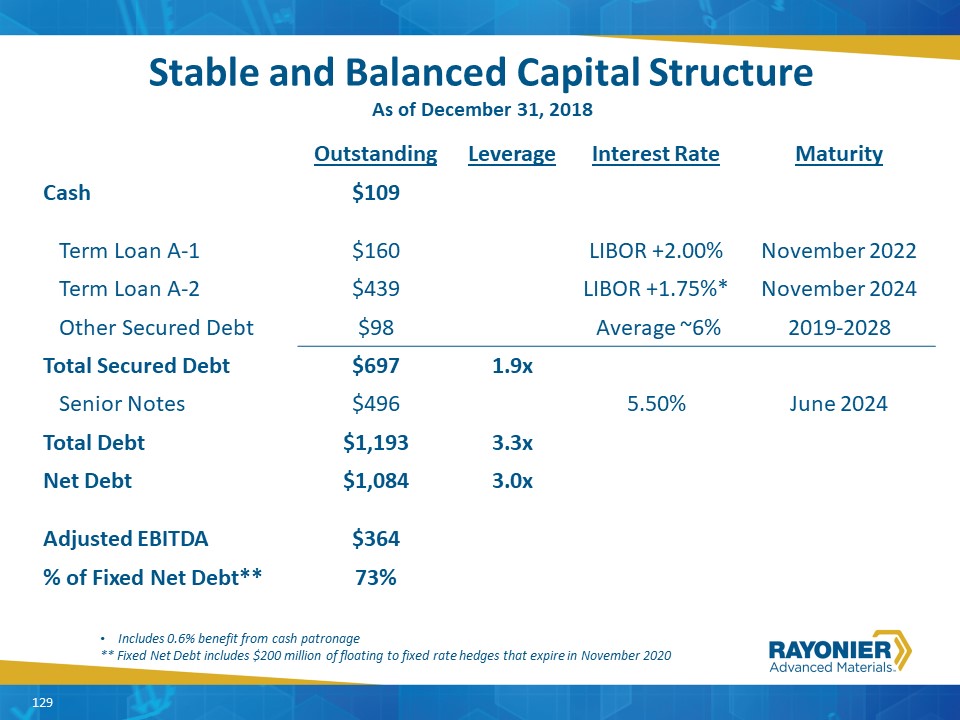
Stable and Balanced Capital StructureAs of December 31, 2018 Outstanding Leverage Interest Rate Maturity Cash $109 Term Loan A-1 $160 LIBOR +2.00% November 2022 Term Loan A-2 $439 LIBOR +1.75%* November 2024 Other Secured Debt $98 Average ~6% 2019-2028 Total Secured Debt $697 1.9x Senior Notes $496 5.50% June 2024 Total Debt $1,193 3.3x Net Debt $1,084 3.0x Adjusted EBITDA $364 % of Fixed Net Debt** 73% Includes 0.6% benefit from cash patronage** Fixed Net Debt includes $200 million of floating to fixed rate hedges that expire in November 2020 129
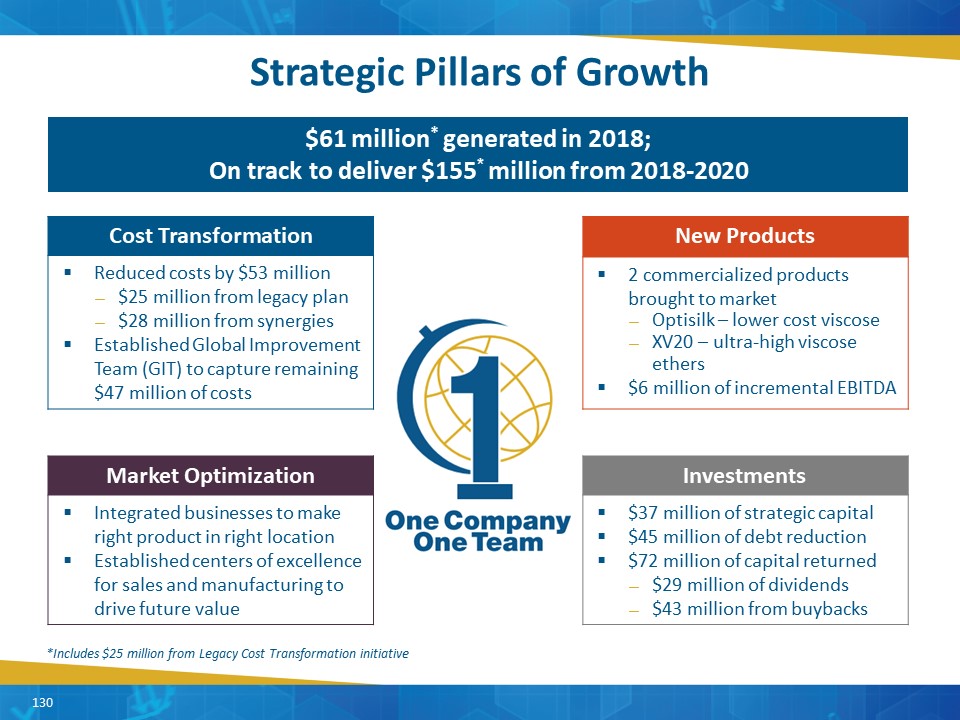
Granite Considerations---Granite Overview Strategic Pillars of Growth $61 million* generated in 2018;On track to deliver $155* million from 2018-2020 *Includes $25 million from Legacy Cost Transformation initiative Cost Transformation Reduced costs by $53 million$25 million from legacy plan$28 million from synergiesEstablished Global Improvement Team (GIT) to capture remaining $47 million of costs New Products 2 commercialized products brought to marketOptisilk – lower cost viscoseXV20 – ultra-high viscose ethers$6 million of incremental EBITDA Market Optimization Integrated businesses to make right product in right locationEstablished centers of excellence for sales and manufacturing to drive future value Investments $37 million of strategic capital$45 million of debt reduction$72 million of capital returned$29 million of dividends$43 million from buybacks 130
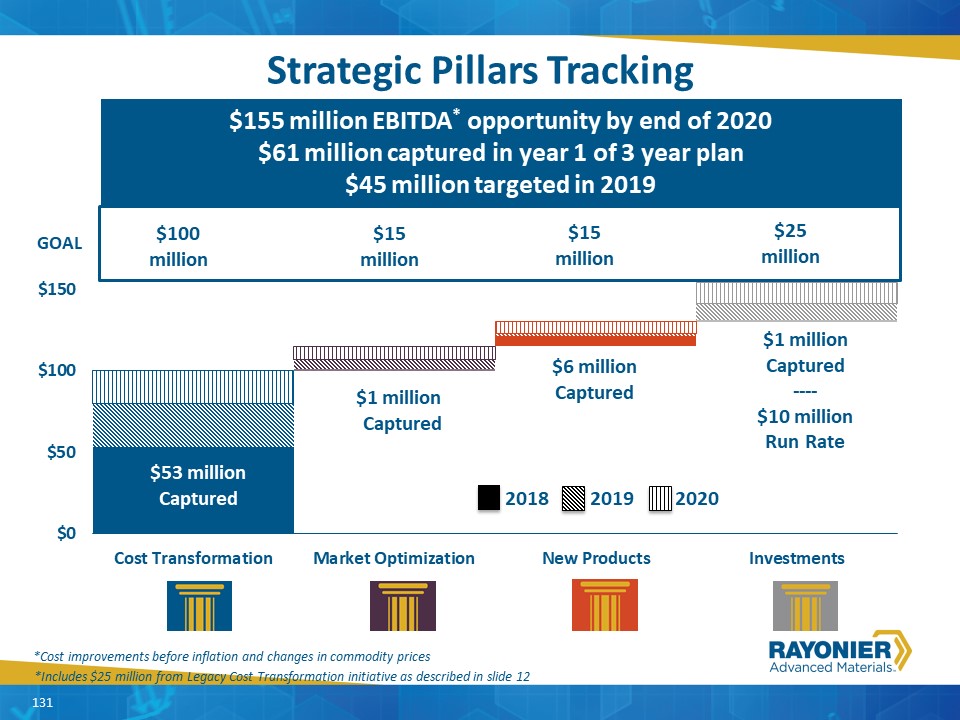
Strategic Pillars Tracking *Cost improvements before inflation and changes in commodity prices $155 million EBITDA* opportunity by end of 2020$61 million captured in year 1 of 3 year plan$45 million targeted in 2019 $100million $15 million $53 millionCaptured $1 million Captured $6 millionCaptured $1 millionCaptured----$10 millionRun Rate GOAL $15 million $25 million 2018 2019 2020 *Includes $25 million from Legacy Cost Transformation initiative as described in slide 12 131
Closing Comments Paul Boynton Chairman, President & Chief Executive Officer
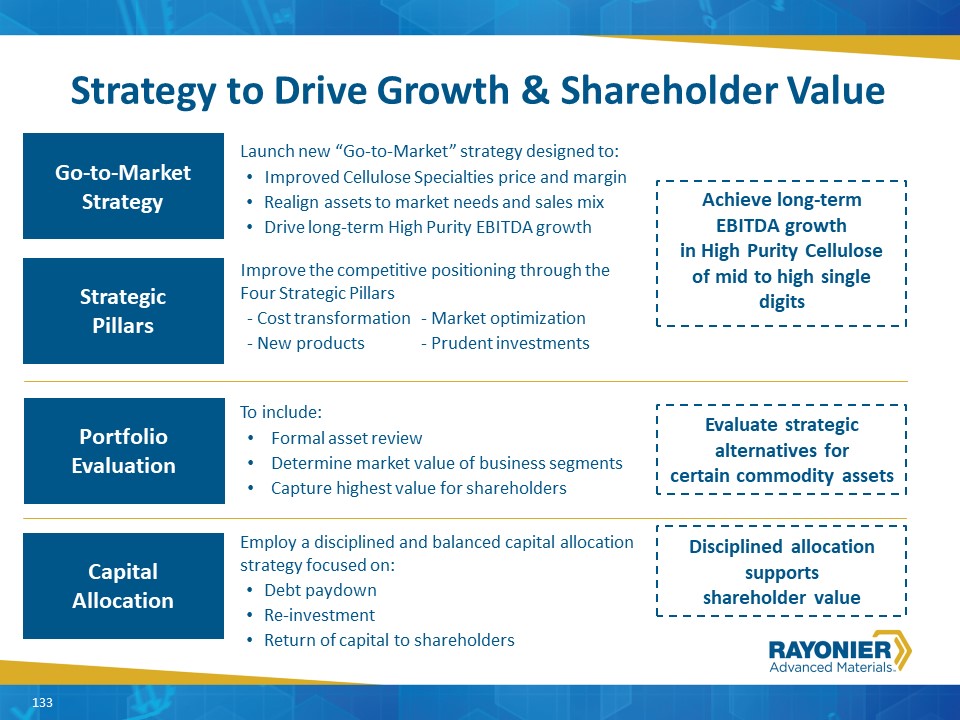
Granite Considerations---Granite Overview Strategy to Drive Growth & Shareholder Value Go-to-Market Strategy Strategic Pillars Capital Allocation Portfolio Evaluation Launch new “Go-to-Market” strategy designed to:Improved Cellulose Specialties price and marginRealign assets to market needs and sales mixDrive long-term High Purity EBITDA growth Improve the competitive positioning through the Four Strategic Pillars- Cost transformation - Market optimization- New products - Prudent investments To include:Formal asset reviewDetermine market value of business segmentsCapture highest value for shareholders Employ a disciplined and balanced capital allocation strategy focused on:Debt paydownRe-investment Return of capital to shareholders Achieve long-term EBITDA growth in High Purity Cellulose of mid to high single digits Evaluate strategic alternatives for certain commodity assets Disciplined allocation supports shareholder value 133
QUESTIONS? 134
Appendix
Granite Considerations---Granite Overview Presenters Paul BoyntonChairman, President & CEO 136 Mr. Boynton is Chairman, President and CEO of the Company, a position he has held since June 2014. Previously he held a number of positions of increasing responsibility with Rayonier Inc., including Senior Vice President, Performance Fibers from 2002 to 2008, Senior Vice President, Performance Fibers and Wood Products from 2008 to 2009, Executive Vice President, Forest Resources and Real Estate from 2009 to 2010, President and Chief Operating Officer from 2010 to 2011, President and CEO from January 2012 to May 2012 and Chairman, President and CEO from May 2012 to June 2014. Mr. Boynton joined Rayonier Inc. as Director, Specialty Pulp Marketing and Sales in 1999. Prior to joining Rayonier Inc., he held positions with 3M Corporation from 1990 to 1999, including as Global Brand Manager, 3M Home Care Division. Mr. Boynton serves on the Board of Directors of The Brink’s Company, is also a member of the Board of Governors and its Executive Committee of the National Council for Air and Stream Improvement, a member of the Board of Directors of the National Association of Manufacturers and a member of the Board of Directors of the Federal Reserve Bank of Atlanta’s Jacksonville Branch. From 2012 until 2014 Mr. Boynton also served as a director of Rayonier Inc. He holds a bachelor’s degree in Mechanical Engineering from Iowa State University, an MBA from the University of Iowa and graduated from the Harvard University Graduate School of Business Advanced Management Program. Erin M. ByersSVP, High Purity and High Yield Cellulose Business Dr. Byers joined Rayonier Inc. in September 1988 as Senior Research Specialist for R&D. In May 1993, he transferred to the Sales and Marketing group as a Technical Marketing Representative and in May 2007, he was promoted to Director, Cellulose Specialties. In November 2009, he was promoted to Vice President, Sales, Marketing and Research, a position he held until June 2014. Following our 2014 spinoff, Dr. Byers was appointed Vice President, Sales, Marketing and Research of the Company and was elected to his current position effective December 1, 2017. Dr. Byers holds a bachelor’s degree in Paper Science from the State University of New York and a master’s and PhD from the Institute of Paper Chemistry.
Granite Considerations---Granite Overview Presenters Bill ManzerSVP, High Purity Cellulose 137 Ken DuffyVP, Sales & Marketing High Yield Pulp Mr. Manzer joined Rayonier Inc. as Vice President, Manufacturing Operations in January 2011, a position he held until June 2014. Following our 2014 spinoff, Mr. Manzer was appointed to his current position for the Company. Prior to joining Rayonier Inc., from September 2001 to December 2010, he was employed in various senior manufacturing roles for Fraser Papers (a manufacturer of specialized printing, publishing and converting papers) and most recently was Senior Vice President, Business Strategy and Projects. Previously, Mr. Manzer worked from January 1991 to August 2001 for Champion International and from June 1980 until December 1991 for Fraser Papers in various pulp and paper manufacturing roles. His responsibilities have included pulp and paper mills in the US and Canada. Mr. Manzer holds a bachelor’s degree in chemical engineering from the University of Maine, Orono. Ken joined Rayonier Advanced Materials in November 2017 with the acquisition of Tembec. During the last 30 years, he has been involved in sales and marketing in different aspects of the pulp and paper industry. Together with the sales, marketing and technical service group, he is responsible for the global sales strategy for Rayonier Advanced Materials’ High-Yield pulp business. Joining Tembec in 2011 as Vice President, Sales (High Yield Pulp), Ken and the team worked hard to expand the High-Yield Pulp customer base. In 2013, Ken took on additional responsibilities when the softwood kraft sales group was combined with high-yield pulp to create the paper pulp sales group. In 2016, the Newsprint Sales group was also added to his area of responsibility. Prior to joining Tembec, Ken held various sales and technical service positions of increasing responsibility in the specialty chemicals sector, almost exclusively dedicated to the pulp and paper industry. Mr. Duffy earned a Bachelor’s Degree in Applied Science (Chemical Engineering) from the University of Toronto in 1987.
Granite Considerations---Granite Overview Presenters Chris BlackSVP, Forest Production & Paper 138 Carla YetterVP, Environmental & Regulatory Affairs Mr. Black joined Rayonier Advanced Materials in 2017 as Senior Vice President, Forest Products, Paper and Board Business, following the acquisition of Tembec. Prior to the acquisition, Mr. Black was Executive Vice President, Forest Products, Pulp and Paper at Tembec. Mr. Black began his career in 1983 with Kimberly-Clark Corporation where, over a ten-year period, he held increasingly senior positions in finance and marketing. In 1992, he joined Navistar as Director of Marketing and continued in the heavy truck industry in several sales and general management roles until joining Tembec in 2000. Mr. Black joined Tembec as Vice President, Sales and Marketing, Newsprint Division and was appointed Executive Vice President, Forest Products, Pulp and Paper in 2013. He holds a B.A. in Economics and a M.B.A. (Finance) from York University in Toronto. Ms. Yetter serves as Rayonier Advanced Materials' Vice President of Environmental Affairs overseeing all environmental matters for the company. With more than 25 years of environmental engineering, law and government relations experience, Yetter leads a team of 7 professionals providing counsel to company leaders and addressing issues related to air, water, waste, remediation and environmental policy. Yetter chairs the company's Sustainability Council and has served on the Talent Management Council.
Granite Considerations---Granite Overview Presenters 139 Frank RupertoCFO & SVP of Finance and Strategy Mr. Ruperto joined Rayonier Inc. in March 2014 as Senior Vice President, Corporate Development and Strategic Planning, a position he held until June 2014. Following our 2014 spinoff, he was appointed to the same position at the Company and was appointed to his current position in November 2014. Prior to joining Rayonier Inc., from 2003 to 2012, he served as Managing Director, Mergers and Acquisitions for Banc of America Securities and, subsequent to their merger, Bank of America Merrill Lynch (each a consumer banking and financial services provider). From 1996 to 2003, Mr. Ruperto held various positions at Merrill Lynch & Co. including Managing Director, Mergers & Acquisitions. Prior to that, Mr. Ruperto was an Associate with Kidder Peabody & Co./PaineWebber Inc. from 1993 to 1995 and with Smith Barney Inc. from 1995 to 1996. From 1988 to 1991, he was a Corporate Finance Analyst with Alex. Brown & Sons Inc. Mr. Ruperto received a Bachelor of Arts with a concentration in economics from Harvard College and holds an MBA, with a major in finance, from The Wharton School of Business at The University of Pennsylvania. Mickey WalshTreasurer & VP of Investor Relations Mr. Walsh joined Rayonier Advanced Materials in 2013 as Treasurer and added the role of Vice President, Investor relations to his responsibilities in 2015. He currently sits on the board for LignoTech Florida, and has done so since 2015. Prior to joining Rayonier, Mickey was Vice President of Cenveo, Inc. From 2007 to 2010 he was Assistant Treasurer and, from 2005 to 2007 he served as Treasury Director. Prior to his tenure at Cenveo he served held roles at International Paper Company as Senior Analyst, Global Market Risk and Applera Corporation as Senior Treasury Analyst and Foreign Exchange Analyst. Mr. Walsh holds a BS in Business Administration from Stonehill College and an MBA from the University of Connecticut and is a Certified Treasury Professional.
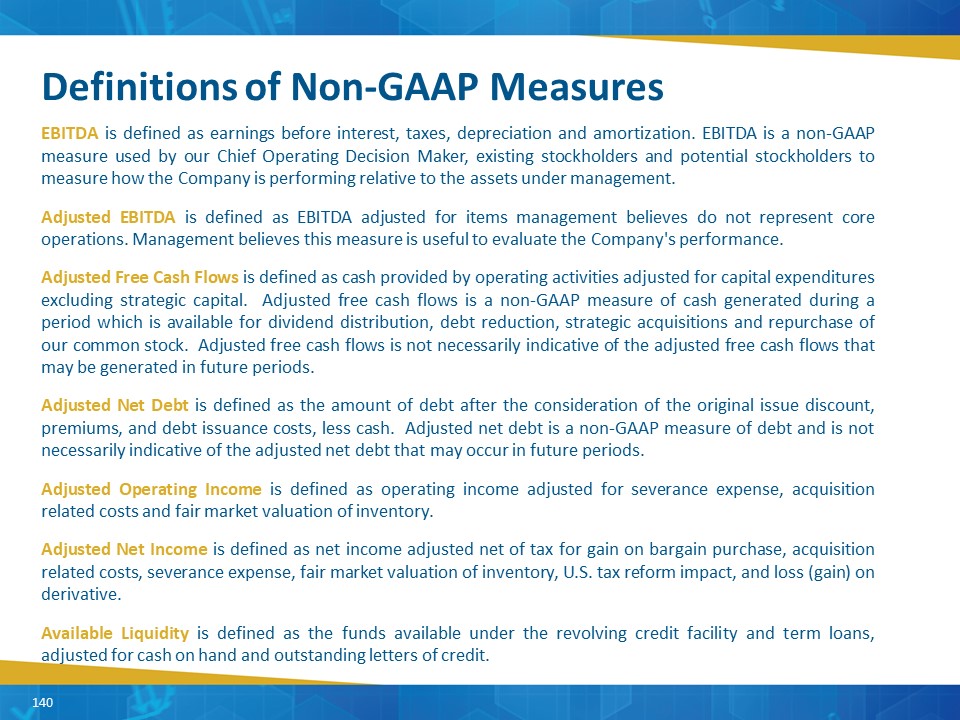
EBITDA is defined as earnings before interest, taxes, depreciation and amortization. EBITDA is a non-GAAP measure used by our Chief Operating Decision Maker, existing stockholders and potential stockholders to measure how the Company is performing relative to the assets under management. Adjusted EBITDA is defined as EBITDA adjusted for items management believes do not represent core operations. Management believes this measure is useful to evaluate the Company's performance.Adjusted Free Cash Flows is defined as cash provided by operating activities adjusted for capital expenditures excluding strategic capital. Adjusted free cash flows is a non-GAAP measure of cash generated during a period which is available for dividend distribution, debt reduction, strategic acquisitions and repurchase of our common stock. Adjusted free cash flows is not necessarily indicative of the adjusted free cash flows that may be generated in future periods. Adjusted Net Debt is defined as the amount of debt after the consideration of the original issue discount, premiums, and debt issuance costs, less cash. Adjusted net debt is a non-GAAP measure of debt and is not necessarily indicative of the adjusted net debt that may occur in future periods.Adjusted Operating Income is defined as operating income adjusted for severance expense, acquisition related costs and fair market valuation of inventory.Adjusted Net Income is defined as net income adjusted net of tax for gain on bargain purchase, acquisition related costs, severance expense, fair market valuation of inventory, U.S. tax reform impact, and loss (gain) on derivative.Available Liquidity is defined as the funds available under the revolving credit facility and term loans, adjusted for cash on hand and outstanding letters of credit. Definitions of Non-GAAP Measures 140
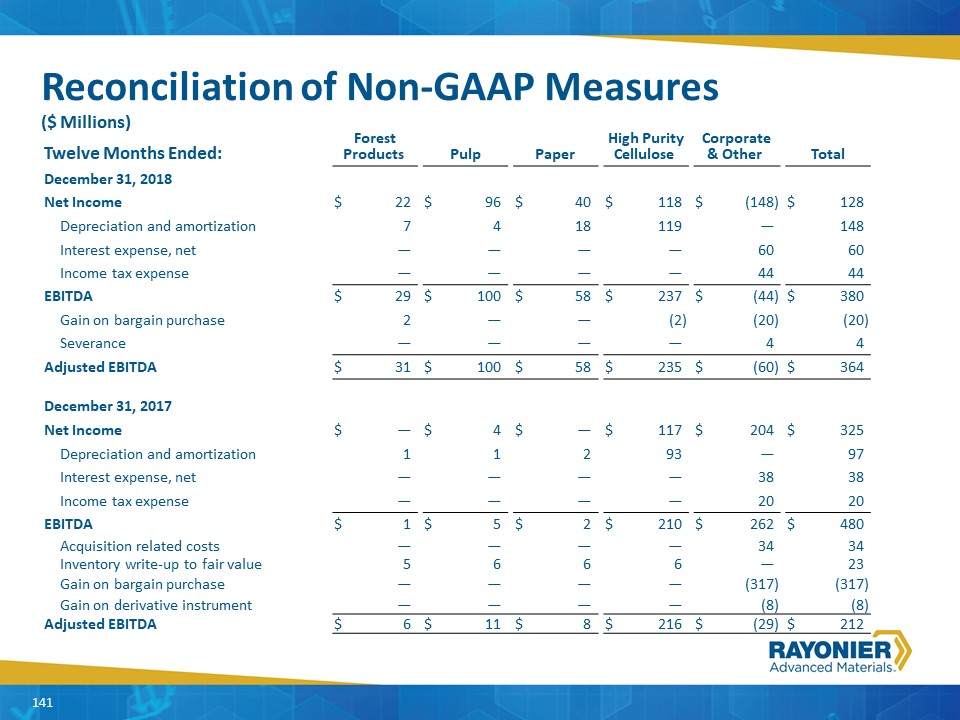
Reconciliation of Non-GAAP Measures($ Millions) Twelve Months Ended: Forest Products Forest Products Pulp Pulp Paper Paper High Purity Cellulose High Purity Cellulose Corporate & Other Corporate & Other Total Total December 31, 2018 Net Income $ 22 $ 96 $ 40 $ 118 $ (148 ) $ 128 Depreciation and amortization 7 4 18 119 — 148 Interest expense, net — — — — 60 60 Income tax expense — — — — 44 44 EBITDA $ 29 $ 100 $ 58 $ 237 $ (44 ) $ 380 Gain on bargain purchase 2 — — (2 ) (20 ) (20 ) Severance — — — — 4 4 Adjusted EBITDA $ 31 $ 100 $ 58 $ 235 $ (60 ) $ 364 December 31, 2017 Net Income $ — $ 4 $ — $ 117 $ 204 $ 325 Depreciation and amortization 1 1 2 93 — 97 Interest expense, net — — — — 38 38 Income tax expense — — — — 20 20 EBITDA $ 1 $ 5 $ 2 $ 210 $ 262 $ 480 Acquisition related costs — — — — 34 34 Inventory write-up to fair value 5 6 6 6 — 23 Gain on bargain purchase — — — — (317 ) (317 ) Gain on derivative instrument — — — — (8 ) (8 ) Adjusted EBITDA $ 6 $ 11 $ 8 $ 216 $ (29 ) $ 212 141
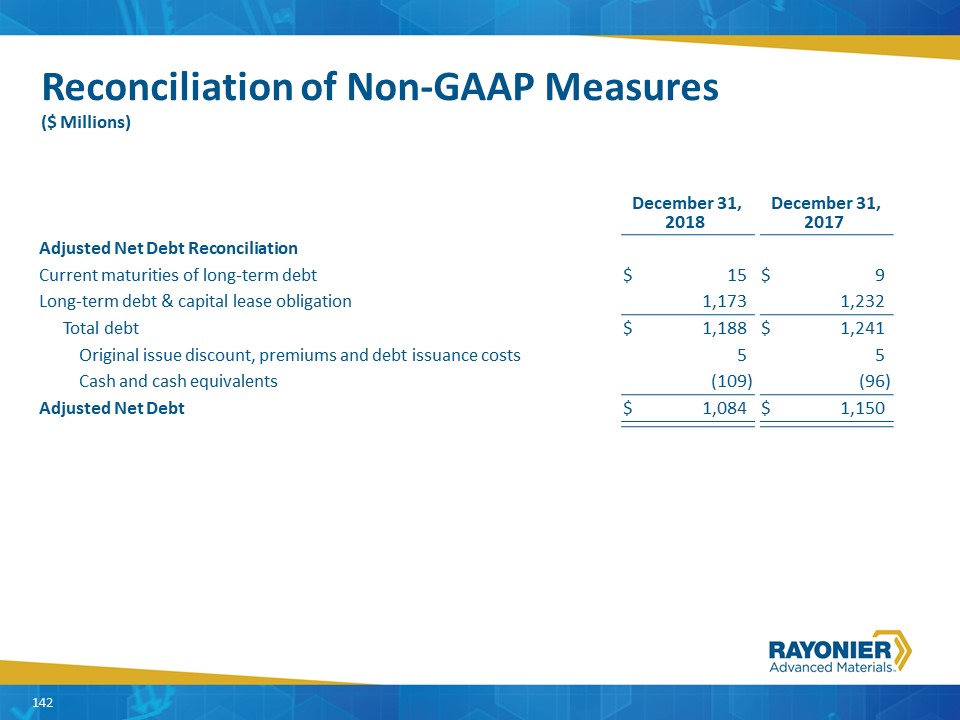
Reconciliation of Non-GAAP Measures($ Millions) December 31, 2018 December 31, 2018 December 31, 2017 December 31, 2017 Adjusted Net Debt Reconciliation Current maturities of long-term debt $ 15 $ 9 Long-term debt & capital lease obligation 1,173 1,232 Total debt $ 1,188 $ 1,241 Original issue discount, premiums and debt issuance costs 5 5 Cash and cash equivalents (109 ) (96 ) Adjusted Net Debt $ 1,084 $ 1,150 142
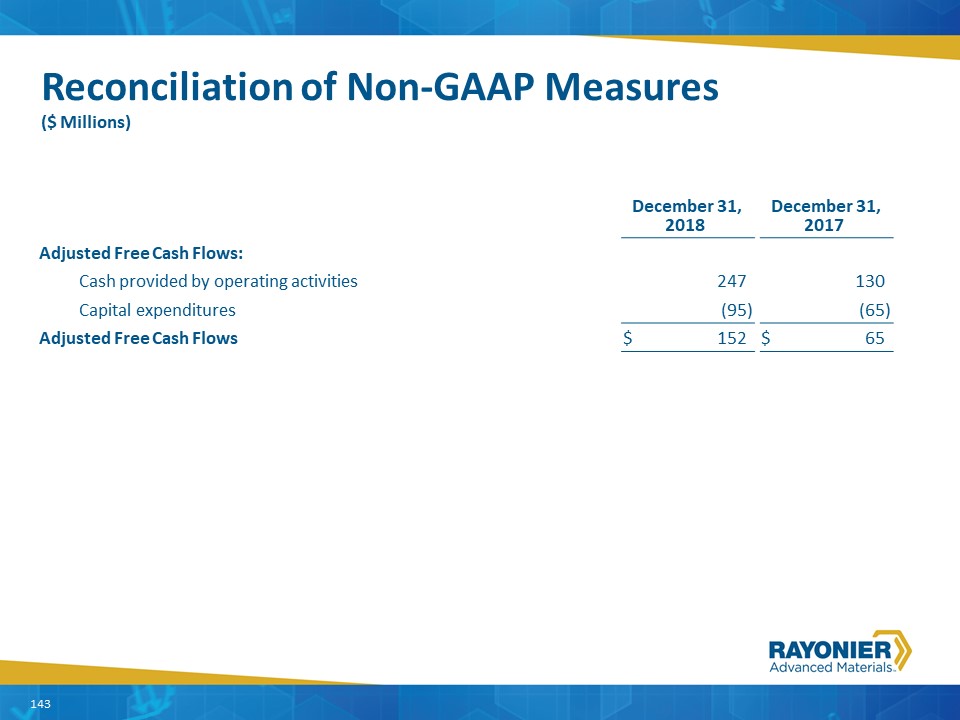
Reconciliation of Non-GAAP Measures($ Millions) December 31, 2018 December 31, 2018 December 31, 2017 December 31, 2017 Adjusted Free Cash Flows: Cash provided by operating activities 247 130 Capital expenditures (95 ) (65 ) Adjusted Free Cash Flows $ 152 $ 65 143
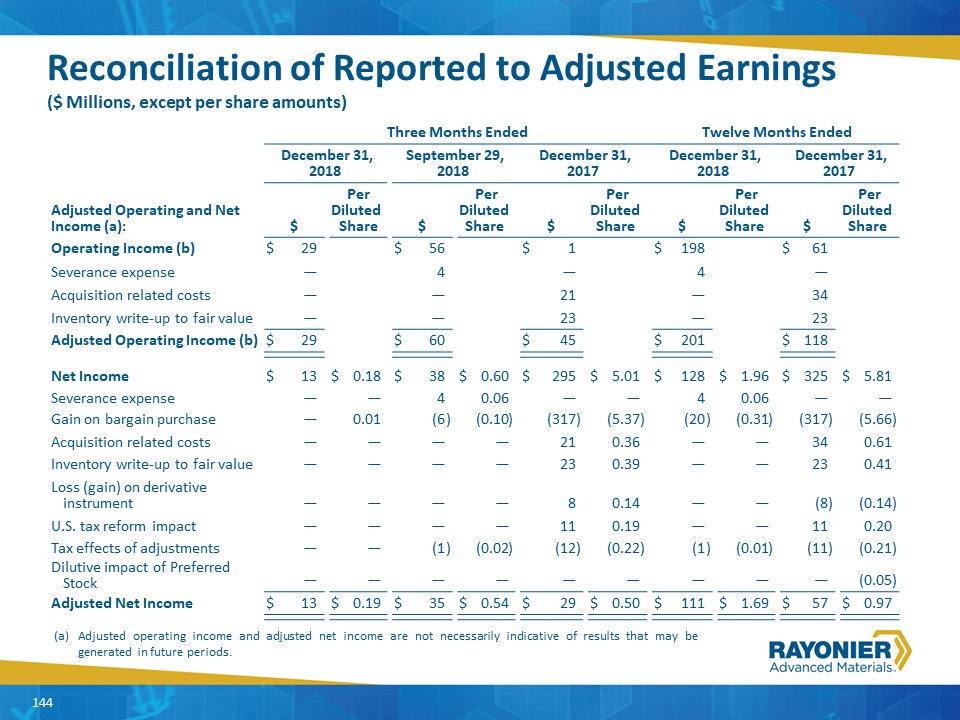
Reconciliation of Reported to Adjusted Earnings($ Millions, except per share amounts) Three Months Ended Three Months Ended Twelve Months Ended Twelve Months Ended December 31, 2018 December 31, 2018 September 29, 2018 September 29, 2018 December 31, 2017 December 31, 2017 December 31, 2018 December 31, 2018 December 31, 2017 December 31, 2017 Adjusted Operating and Net Income (a): $ $ Per Diluted Share Per Diluted Share $ $ Per Diluted Share Per Diluted Share $ $ Per Diluted Share Per Diluted Share $ $ Per Diluted Share Per Diluted Share $ $ Per Diluted Share Per Diluted Share Operating Income (b) $ 29 $ 56 $ 1 $ 198 $ 61 Severance expense — 4 — 4 — Acquisition related costs — — 21 — 34 Inventory write-up to fair value — — 23 — 23 Adjusted Operating Income (b) $ 29 $ 60 $ 45 $ 201 $ 118 Net Income $ 13 $ 0.18 $ 38 $ 0.60 $ 295 $ 5.01 $ 128 $ 1.96 $ 325 $ 5.81 Severance expense — — 4 0.06 — — 4 0.06 — — Gain on bargain purchase — 0.01 (6 ) (0.10 ) (317 ) (5.37 ) (20 ) (0.31 ) (317 ) (5.66 ) Acquisition related costs — — — — 21 0.36 — — 34 0.61 Inventory write-up to fair value — — — — 23 0.39 — — 23 0.41 Loss (gain) on derivative instrument — — — — 8 0.14 — — (8 ) (0.14 ) U.S. tax reform impact — — — — 11 0.19 — — 11 0.20 Tax effects of adjustments — — (1 ) (0.02 ) (12 ) (0.22 ) (1 ) (0.01 ) (11 ) (0.21 ) Dilutive impact of Preferred Stock — — — — — — — — — (0.05 ) Adjusted Net Income $ 13 $ 0.19 $ 35 $ 0.54 $ 29 $ 0.50 $ 111 $ 1.69 $ 57 $ 0.97 (a) Adjusted operating income and adjusted net income are not necessarily indicative of results that may be generated in future periods. 144