Diversified Real Asset Income Fund (DRA) Inactive
Filed: 3 Feb 17, 12:00am
UNITED STATES
SECURITIES AND EXCHANGE COMMISSION
Washington, D.C. 20549
FORM N-CSR
CERTIFIED SHAREHOLDER REPORT OF REGISTERED
MANAGEMENT INVESTMENT COMPANIES
| Investment Company Act file number | 811-22936 |
Diversified Real Asset Income Fund
(Exact name of registrant as specified in charter)
Nuveen Investments
333 West Wacker Drive, Chicago, IL 60606
(Address of principal executive offices) (Zip code)
Gifford R. Zimmerman
Nuveen Investments
333 West Wacker Drive, Chicago, IL 60606
(Name and address of agent for service)
Registrant’s telephone number, including area code: (312) 917-7700
Date of fiscal year end: May 31
Date of reporting period: November 30, 2016
Form N-CSR is to be used by management investment companies to file reports with the Commission not later than 10 days after the transmission to stockholders of any report that is required to be transmitted to stockholders under Rule 30e-1 under the Investment Company Act of 1940 (17 CFR 270.30e-1). The Commission may use the information provided on Form N-CSR in its regulatory, disclosure review, inspection, and policy making roles.
A registrant is required to disclose the information specified by Form N-CSR, and the Commission will make this information public. A registrant is not required to respond to the collection of information contained in Form N-CSR unless the Form displays a currently valid Office of Management and Budget (“OMB”) control number. Please direct comments concerning the accuracy of the information collection burden estimate and any suggestions for reducing the burden to Secretary, Securities and Exchange Commission, 450 Fifth Street, NW, Washington, DC 20549-0609. The OMB has reviewed this collection of information under the clearance requirements of 44 U.S.C. ss.3507.
ITEM 1. REPORTS TO STOCKHOLDERS.
 | ||
| Closed-End Funds |
| Nuveen | ||
| Closed-End Funds |
| Semi-Annual Report November 30, 2016
| |||||
| DRA | ||||||
| Diversified Real Asset Income Fund | ||||||
| ||||||||||||
| ||||||||||||
Life is Complex | ||||||||||||
Nuveen makes things e-simple.
It only takes a minute to sign up for e-Reports. Once enrolled, you’ll receive an e-mail as soon as your Nuveen Fund information is ready. No more waiting for delivery by regular mail. Just click on the link within the e-mail to see the report and save it on your computer if you wish. | ||||||||||||
| Free e-Reports right to your e-mail! | ||
www.investordelivery.com If you receive your Nuveen Fund distributions and statements from your financial advisor or brokerage account. | ||
www.nuveen.com/accountaccess If you receive your Nuveen Fund distributions and statements directly from Nuveen. | ||
| ||||||
of Contents
| 4 | ||||
| 7 | ||||
| 8 | ||||
| 10 | ||||
| 11 | ||||
| 13 | ||||
| 23 | ||||
| 24 | ||||
| 25 | ||||
| 26 | ||||
| 28 | ||||
| 30 | ||||
| 44 | ||||
| 45 | ||||
| 47 | ||||
Approving the Fund’s Investment Management and Investment Sub-Advisory Agreements | 48 | |||
| NUVEEN | 3 |
Comments
Diversified Real Asset Income Fund (DRA)
Diversified Real Asset Income Fund (DRA) (the Fund) is a closed-end fund managed by Nuveen Fund Advisors, LLC (NFAL) and sub-advised by Nuveen Asset Management, LLC (NAM). The Fund is sub-advised by NAM using its real asset income strategy, and its portfolio managers are John G. Wenker, Jay L. Rosenberg, Jeffrey T. Schmitz, CFA, Brenda A. Langenfeld, CFA, and Tryg T. Sarsland.
Here the portfolio management team reviews key investment strategies and the Fund’s performance for the six-month reporting period ended November 30, 2016.
What key strategies were used to manage the Fund during this six-month reporting period ended November 30, 2016?
The Fund’s investment objective is a high level of current income and long-term capital appreciation. Since the Fund’s commencement of operations in 2014, the portfolio management team has been repositioning its assets to align DRA’s portfolio with NAM’s real asset income strategy. With this strategy, at least 80% of the Fund’s managed assets will be invested in a global portfolio of securities that provide investment exposure to real assets, focusing on infrastructure and real estate investment trust (REIT) securities. The portfolio management team actively manages the Fund’s allocations among the infrastructure and real estate categories, with the flexibility to invest across the capital structure in any type of equity and debt security offered by a particular company, including common shares, preferred shares, corporate debt instruments and mortgage-backed securities. All of the Fund’s debt investments may be rated lower than investment grade (Ba1/BB+ or lower by S&P, Moody’s or Fitch), but no more than 10% of the Fund’s managed assets may be invested in securities rated CCC+/Caa1 or lower at any time. The Fund may also invest up to 75% of its managed assets in non-U.S. issuers. Our goal is to have the Fund’s portfolio fairly equally balanced between U.S. and non-U.S. exposure, although this allocation may change based on market conditions. We may also opportunistically write (sell) call options primarily on securities issued by real asset related companies, seeking to enhance the Fund’s risk-adjusted total returns over time.
In addition, we typically use leverage as part of the Fund’s management strategy, which we are currently doing through the use of bank borrowings. The Fund utilizes credit facilities that charge either one-month LIBOR plus a spread, or three-month LIBOR plus a spread. The borrowed proceeds are used to invest in more securities than the Fund would typically hold. Leverage is discussed in more detail in the Fund Leverage section of this report.
NAM’s real asset income strategy invests primarily in five security types: global infrastructure common stock, REIT common stock, global infrastructure preferred stock and hybrids, REIT preferred stock, and debt securities. The Fund’s primary benchmark is the Morgan Stanley Capital International (MSCI) World Index. The Fund’s comparative benchmark
Certain statements in this report are forward-looking statements. Discussions of specific investments are for illustration only and are not intended as recommendations of individual investments. The forward-looking statements and other views expressed herein are those of the portfolio managers as of the date of this report. Actual future results or occurrences may differ significantly from those anticipated in any forward-looking statements and the views expressed herein are subject to change at any time, due to numerous market and other factors. The Fund disclaims any obligation to update publicly or revise any forward-looking statements or views expressed herein.
Ratings shown are the highest rating given by one of the following national rating agencies: Standard & Poor’s (S&P), Moody’s Investors Service (Moody’s), Inc. or Fitch, Inc. (Fitch). Credit ratings are subject to change. AAA, AA, A and BBB are investment grade ratings; BB, B, CCC, CC, C and D are below investment grade ratings. Certain bonds backed by U.S. Government or agency securities are regarded as having an implied rating equal to the rating of such securities. Holdings designated N/R are not rated by these national rating agencies.
Refer to the Glossary of Terms Used in this Report for further definition of the terms used within this section.
| 4 | NUVEEN |
is a Custom Blended Index, which is an index NAM created to represent a model asset allocation for an income-oriented product providing investment exposure to real assets. The Custom Blended Index consists of 28% S&P Global Infrastructure Index, 21% FTSE EPRA/NAREIT Developed Index, 18% Wells Fargo Hybrid & Preferred Securities REIT Index, 15% Bloomberg Barclays Global Capital Securities Index and 18% Bloomberg Barclays U.S. Corporate High Yield Bond Index. Our real asset income strategy attempts to add value versus the benchmark in two ways: by re-allocating among the five main security types when we see pockets of value at differing times and, more importantly, through individual security selection.
Our security selection process starts with a screening process for securities across the real assets markets that provide higher yields. From the group of securities providing significant yields, we focus on owning those securities with the highest total return potential. Our process places a premium on finding securities with revenues that come from tangible assets with long-term concessions, contracts or leases, which are therefore capable of producing steady, predictable and recurring cash flows. We employ a bottom-up, fundamental approach to security selection and portfolio construction. We look for stable companies that demonstrate consistent and growing cash flow, strong balance sheets and histories of being good stewards of shareholder capital.
During the reporting period, we continued to reposition the portfolio in order to align it with our real asset income strategy. As part of this repositioning, we have been selling holdings that we believe have lower yield and lower capital appreciation potential and buying assets that have more potential to achieve the Fund’s objectives, while also more equally balancing the Fund’s U.S. and non-U.S. exposure. This includes looking for ways to opportunistically monetize the Fund’s whole loan positions, but only when we are confident that we are achieving fair value for these assets.
Since June 2016, the Fund has been party to five total return swaps for approximately $35 million using exchange-traded funds (ETFs) that align as closely as possible with the five sectors of the real asset income portion of the portfolio. In each of these total return swaps, the Fund receives the dividend payment from the ETF, pays a spread over London Inter-bank Offered Rate (LIBOR) to the swap provider and, at the termination of the swap, receives the capital gain (or pays the loss) accrued during the reporting period. The objective of the total return swaps is to increase income in the Fund. During the reporting period, these swaps had a negative impact on overall Fund performance.
In an effort to protect against potential increases in interest rates, we also sold (shorted) five-year U.S. Treasury futures contracts during the reporting period to hedge some of the duration, or interest rate sensitivity, of the bonds in the portfolio. Rates for Treasury securities across the yield curve moved higher during the reporting period, particularly for longer maturity Treasuries. Therefore, the hedge increased in value on a mark-to-market basis, offsetting much of the devaluation that rising interest rates caused within the underlying bond portfolio.
How did the Fund perform during this six-month reporting period ended November 30, 2016?
The table in the Performance Overview and Holding Summaries section of this report provides total return performance for the Fund for the six-month, one-year and since inception periods ended November 30, 2016. For the six-month reporting period ended November 30, 2016, the Fund’s total return at net asset value (NAV) underperformed both the MSCI World Index and its Custom Blended Index. Our management team is still in the process of transitioning the Fund’s portfolio to our global real asset income strategy, making comparisons to its global, equity-oriented benchmarks somewhat less meaningful.
Despite the fact that high yield debt was the only asset class in the Fund to produce positive absolute returns during the reporting period, it was the largest detractor from performance relative to the Custom Blended Index. While the Fund’s holdings collectively produced a strong gain, they underperformed the benchmark’s holdings. Among the largest weighted sectors in our blended index, the best performers were wireless telecommunications, metals and mining, energy exploration and production, and energy oil field services, which together represented approximately 20% of the index. However, the Fund’s mandate precludes us from investing in these sectors; therefore, our high yield portfolio
| NUVEEN | 5 |
Portfolio Managers’ Comments (continued)
couldn’t keep up with the benchmark’s results. Also, the rally in the high yield market broadened throughout the reporting period as investors searched for yield in credits that were beaten down in 2015 and early 2016. As a result, CCC rated credits outperformed for the six-month reporting period. Our high yield portfolio had an underweight to CCC and lower rated securities, given our modestly higher credit quality bias, which also detracted from performance during the reporting period. All that being said, the positive absolute performance of our high yield portfolio did contribute favorably to the Fund’s overall return.
On the other hand, the area that contributed the most to the Fund’s relative returns versus the benchmark was REIT common equities, mainly due to our security selection within the group. Our focus on higher yielding companies in the portfolio led our holdings to generally outperform as investors continued to clamor for income during much of the reporting period. Nine of the thirteen property types owned within the REIT common equity portfolio outperformed their respective benchmark sector with malls, office and diversified offering the strongest contributions.
REIT preferred shares also performed well within the Fund’s portfolio on both an absolute and relative basis. The leading contributor to our relative outperformance was a lack of exposure to self-storage preferreds, which make up a significant percentage of the index. The self-storage sector within the preferred securities benchmark posted negative total returns during the period after performing strongly in the first part of the year. We also benefited from security selection within the net lease group during the period. The preferred holdings we owned in the net lease space advanced by more than 8%, while the benchmark’s holdings collectively returned -2.5%, which favored our strategy.
The credit performance of the Fund’s whole loan portfolio was relatively stable during the reporting period due to the continued strong performance of the commercial real estate sector. As of November 30, 2016, approximately 7% of the Fund’s net asset value remained in whole loans, which we are continuing to monetize. During the reporting period, we sold or paid off five loans and reallocated the proceeds to the generally higher yielding real asset income strategy.
In the real asset income portion of the portfolio, we reduced the Fund’s U.S. REIT preferred exposure over the period mostly because of the significant premiums that these securities were trading at as investors continued to pile into the highest yielding parts of the market. Where possible, we continued to shift the portfolio higher up the quality spectrum within the investable universe, and slightly down the yield ladder as a result. This meant moving out of more senior positions of lower-quality companies and into subordinated positions higher up the quality spectrum. Therefore, within our preferred exposure, we took the proceeds from REIT preferred sales and redeployed that money to the infrastructure preferred sleeve. Within the infrastructure preferred segment, we increased our holdings in hybrids, mandatory convertible securities and straight utility preferred securities. We believed valuations looked more appealing in these segments, albeit at lower current yields, potentially providing more downside protection as these securities were not trading at the significant premiums observed within the real estate sector.
Within real estate, we continued to have a slight underweight to REIT equities and, after trimming our REIT preferred holdings over the period, a larger underweight to that category. Although real estate fundamentals remain supportive, we believe that growth within the sector is beginning to slow slightly, especially in some of the larger coastal markets such as New York City and San Francisco. In most major property sectors, building prices are also well past 2007 peak prices, which may indicate that REITs are a little later in their cycle.
Within the high yield portfolio, we maintained our pipeline exposure, which was the largest of all the sector weights. Our pipeline credits performed well, posting some of the best total returns in the space as the energy sector continued to be bolstered by the rising price of oil. While our next three biggest concentrations were in data centers, real estate and hospitals, we continued to invest our high yield portfolio across the spectrum of infrastructure.
| 6 | NUVEEN |
Leverage
IMPACT OF THE FUND’S LEVERAGE STRATEGY ON PERFORMANCE
One important factor impacting the return of the Fund relative to its benchmarks was the Fund’s utilization of leverage through the use of bank borrowings. The Fund uses leverage because our research has shown that, over time, leveraging provides opportunities for additional income and total return for shareholders. However, the use of leverage also can expose shareholders to additional volatility. For example, as the prices of securities held by the Fund decline, the negative impact of these valuation changes on NAV and shareholder total return is magnified by the use of leverage. Conversely, leverage may enhance returns during periods when the prices of securities held by the Fund generally are rising. During the reporting period, the income generated from the spread between the cost of borrowing and the yield from invested assets was positive. The Fund’s use of leverage had a negative impact on the performance of the Fund over the reporting period.
As of November 30, 2016, the Fund’s percentages of leverage are as shown in the accompanying table.
| DRA | ||||
Effective Leverage* | 35.02 | % | ||
Regulatory Leverage* | 30.05 | % | ||
| * | Effective leverage is the Fund’s effective economic leverage, and includes both regulatory leverage and the leverage effects of certain derivative and other investments in a Fund’s portfolio that increase the Fund’s investment exposure. Regulatory leverage consists of borrowings of the Fund, which is part of the Fund’s capital structure. A Fund, however, may from time to time borrow on a typically transient basis in connection with its day-to-day operations, primarily in connection with the need to settle portfolio trades. Such incidental borrowings are excluded from the calculation of a Fund’s effective leverage ratio. Regulatory leverage is subject to asset coverage limits set forth in the Investment Company Act of 1940. |
THE FUND’S REGULATORY LEVERAGE
Bank Borrowings
As noted above the Fund employs leverage through the use of bank borrowings. The Fund’s bank borrowing activities are as shown in the accompanying table.
| Current Reporting Period | Subsequent to the Close of the Reporting Period | |||||||||||||||||||||||||||||||||
| June 1, 2016 | Draws | Paydowns | November 30, 2016 | Average Balance Outstanding | Draws | Paydowns | January 25, 2017 | |||||||||||||||||||||||||||
| $136,300,000 | $ | 1,200,000 | $ | — | $ | 137,500,000 | $ | 136,503,279 | $ | — | $ | — | $ | 137,500,000 | ||||||||||||||||||||
Refer to Notes to Financial Statements, Note 8 – Borrowing Arrangements for further details.
THE FUND’S EFFECTIVE LEVERAGE
Total Return Swaps
During the current reporting period, the Fund invested in total return swaps which modestly increased the overall effective leverage of the Fund. Under the terms of the swaps, the Fund receives the total return on an underlying basket of exchange-traded-funds (ETFs) in exchange for periodic interest payments.
| NUVEEN | 7 |
Information
DISTRIBUTION INFORMATION
The following information regarding the Fund’s distributions is current as of November 30, 2016, and may differ from previously issued distribution notifications.
The Fund has a cash flow-based distribution program. Under this program, the Fund seeks to maintain an attractive and stable regular distribution based on the Fund’s net cash flow received from its portfolio investments. Fund distributions are not intended to include expected portfolio appreciation; however, the Fund invests in securities that make payments which ultimately may be fully or partially treated as gains or return of capital for tax purposes. This tax treatment will generally “flow through” to the Fund’s distributions, but the specific tax treatment is often not known with certainty until after the end of the Fund’s tax year. As a result, regular distributions throughout the year are likely to be re-characterized for tax purposes as either long-term gains (both realized and unrealized), or as a non-taxable return of capital.
The figures in the table below provide an estimate as of November 30, 2016 of the sources (for tax purposes) of the Fund’s distributions. These source estimates include amounts currently estimated to be attributable to realized gains and/or returns of capital. The Fund attributes these non-income sources equally to each regular distribution throughout the fiscal year. The estimated information shown below is for the distributions paid on common shares for all prior months in the current fiscal year. These estimates should not be used for tax reporting purposes, and the distribution sources may differ for financial reporting than for tax reporting. The final determination of the tax characteristics of all distributions paid in 2016 will be made in early 2017 and reported to you on Form 1099-DIV. More details about the tax characteristics of the Fund’s distributions are available on www.nuveen.com/CEFdistributions.
Data as of November 30, 2016
| Current Month Estimated Percentage of Distributions | Fiscal YTD Estimated Per Share Amounts | |||||||||||||||||||||||||||
Net Investment Income | Realized Gains | Return of Capital | Total Distributions | Net Investment Income | Realized Gains | Return of Capital | ||||||||||||||||||||||
| 100% | 0.0% | 0.0% | $0.6450 | $0.6450 | $0.0000 | $0.0000 | ||||||||||||||||||||||
The following table provides information regarding fund distributions and total return performance over various time periods. This information is intended to help you better understand whether Fund returns for the specified time periods were sufficient to meet Fund distributions.
Data as of November 30, 2016
| Annualized | Cumulative | |||||||||||||||||||||||||||
Inception Date | Latest Monthly Per Share Distribution | Current Distribution on NAV | 1-Year Return on NAV | Since Inception Return on NAV | Calendar YTD Distributions on NAV | Calendar YTD Return on NAV | ||||||||||||||||||||||
| 9/8/2014 | $0.1050 | 7.02% | 6.09% | 2.98% | 7.12% | 7.22% | ||||||||||||||||||||||
| 8 | NUVEEN |
SHARE REPURCHASES
The Fund’s Board of Trustees has authorized the Fund to participate in Nuveen’s closed-end fund complex-wide share repurchase program. Under the share repurchase program, the Fund may repurchase annually up to 10% of its outstanding shares in open-market transactions at the Adviser’s discretion. The Fund is prohibited, however, from repurchasing its shares during periods when the Fund also has an outstanding tender offer.
As of November 30, 2016, and since the inception of the Fund’s repurchase program, the Fund has cumulatively repurchased and retired its outstanding shares as shown in the accompanying table.
| DRA | ||||
Shares cumulatively repurchased and retired | 682,000 | |||
Approximate number of shares authorized for repurchase | 1,790,000 | |||
During the current reporting period, the Fund repurchased and retired its shares at a weighted average price per share and a weighted average discount per share as shown in the accompanying table.
| DRA | ||||
Shares repurchased and retired | 59,500 | |||
Weighted average price per share repurchased and retired | $16.10 | |||
Weighted average discount per share repurchased and retired | 15.30 | % | ||
OTHER SHARE INFORMATION
As of November 30, 2016, and during the current reporting period, the Fund’s share price was trading at a premium/(discount) to its NAV as shown in the accompanying table.
| DRA | ||||
NAV | $17.94 | |||
Share price | $15.41 | |||
Premium/(Discount) to NAV | (14.10 | )% | ||
6-month average premium/(discount) to NAV | (13.75 | )% | ||
| NUVEEN | 9 |
Considerations
Fund shares are not guaranteed or endorsed by any bank or other insured depository institution, and are not federally insured by the Federal Deposit Insurance Corporation.
Diversified Real Asset Income Fund (DRA)
Investing in closed-end funds involves risk; principal loss is possible. There is no guarantee the Fund’s investment objectives will be achieved. Closed-end fund shares may frequently trade at a discount or premium to their net asset value. Concentration in specific sectors may involve greater risk and volatility than more diversified investments: real estate investments may suffer due to economic downturns and changes in real estate values, rents, property taxes, interest rates and tax laws; infrastructure-related securities may face adverse economic, regulatory, political, and legal changes. Prices of equity securities may decline significantly over short or extended periods of time. Debt or fixed income securities such as those held by the Fund, are subject to market risk, credit risk, interest rate risk, derivatives risk, liquidity risk, and income risk. As interest rates rise, bond prices fall. Leverage increases return volatility and magnifies the Fund’s potential return and its risks; there is no guarantee a fund’s leverage strategy will be successful. For these and other risks such as whole loan risk and foreign investment risk, see the Fund’s web page at www.nuveen.com/DRA.
| 10 | NUVEEN |
DRA
Diversified Real Asset Income Fund
Performance Overview and Holding Summaries as of November 30, 2016
Refer to the Glossary of Terms Used in this Report for further definitions of terms used in this section.
Average Annual Total Returns as of November 30, 2016
| Cumulative | Average Annual | |||||||||||
| 6-Month | 1-Year | Since Inception | ||||||||||
| DRA at NAV | (1.13)% | 6.09% | 2.98% | |||||||||
| DRA at Share Price | (1.07)% | 2.79% | 1.32% | |||||||||
| MSCI World Index | 3.15% | 3.15% | 1.11% | |||||||||
| Custom Blended Index (New Comparative Benchmark) | (0.37)% | 5.72% | 1.08% | |||||||||
| Custom Blended Index (Old Comparative Benchmark) | (0.65)% | 5.73% | 2.34% | |||||||||
As previously noted in the Portfolio Managers’ Comments section of this report, the Fund is in the process of transitioning its portfolio to a global real asset income strategy. Therefore, comparisons to the Fund’s global, equity-oriented benchmarks are less meaningful until the Fund’s transitioning is complete. The Fund’s goal over time will be to opportunistically reduce its whole loan exposure while also more equally balancing its U.S. and non-U.S. exposure. Effective December 31, 2015, the Custom Blended Index constituents were changed. The changes were made with the aim to more accurately reflect the investment team’s experience and expectations for the long-run strategy positioning and offer a more appropriate performance benchmark. The Fund maintains the MSCI World Index as its primary benchmark.
Since inception returns are from September 8, 2014. Past performance is not predictive of future results. Current performance may be higher or lower than the data shown. Returns do not reflect the deduction of taxes that shareholders may have to pay on Fund distributions or upon the sale of Fund shares. Returns at NAV are net of Fund expenses, and assume reinvestment of distributions. Comparative index return information is provided for the Fund’s shares at NAV only. Indexes are not available for direct investment.
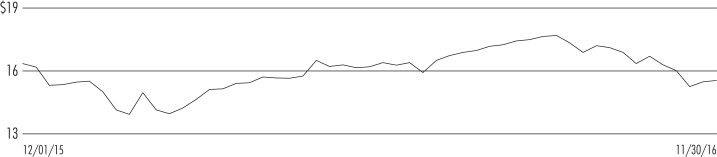
Share Price Performance — Weekly Closing Price
| NUVEEN | 11 |
This data relates to the securities held in the Fund’s portfolio of investments as of the end of the reporting period. It should not be construed as a measure of performance for the Fund itself. Holdings are subject to change.
For financial reporting purposes, the ratings disclosed are the highest rating given by one of the following national rating agencies: Standard & Poor’s Group, Moody’s Investors Service, Inc. or Fitch, Inc. This treatment of split-rated securities may differ from that used for other purposes, such as Fund investment policies. Credit ratings are subject to change. AAA, AA, A and BBB are investment grade ratings; BB, B, CCC, CC, C and D are below investment grade ratings. Certain bonds backed by U.S. Government or agency securities are regarded as having an implied rating equal to the rating of such securities. Holdings designated N/R are not rated by these national rating agencies.
Fund Allocation
(% of net assets)
| Common Stocks | 58.5% | |||
| Convertible Preferred Securities | 11.5% | |||
| $25 Par (or similar) Retail Preferred | 31.3% | |||
| Convertible Bonds | 1.0% | |||
| Corporate Bonds | 19.9% | |||
1,000 Par (or similar) Institutional Preferred | 8.6% | |||
Whole Loans | 6.7% | |||
Corporate Notes | 2.5% | |||
Investment Companies | 1.2% | |||
Repurchase Agreements | 2.1% | |||
Other Assets Less Liabilities | (0.3)% | |||
Net Assets Plus Borrowings | 143.0% | |||
Borrowings | (43.0)% | |||
Net Assets | 100% |
Portfolio Asset Allocation
(% of total investments, at value)1
| Common Stocks | 40.8% | |||
| Convertible Preferred Securities | 8.0% | |||
| $25 Par (or similar) Retail Preferred | 21.8% | |||
| Convertible Bonds | 0.7% | |||
| Corporate Bonds | 13.9% | |||
1,000 Par (or similar) Institutional Preferred | 6.0% | |||
Whole Loans | 4.7% | |||
Corporate Notes | 1.7% | |||
Investment Companies | 0.9% | |||
Repurchase Agreements | 1.5% | |||
Total | 100% |
Portfolio Credit Quality
(% of fixed-income securities, at value)
| A | 2.0% | |||
| BBB | 32.8% | |||
| BB | 18.0% | |||
| B | 8.8% | |||
| CCC | 1.2% | |||
| N/R (not rated) | 25.9% | |||
| N/A (not applicable) | 11.3% | |||
Total | 100% |
Country Allocation
(% of total investments, at value)1
| United States | 62.2% | |||
| Canada | 11.7% | |||
| Australia | 5.1% | |||
| United Kingdom | 4.0% | |||
| Singapore | 3.6% | |||
| Hong Kong | 2.1% | |||
| Spain | 1.7% | |||
| Other | 9.6% | |||
Total | 100% |
| 1 | Excluding investments in derivatives. |
| 12 | NUVEEN |
DRA
Diversified Real Asset Income Fund | ||
| November 30, 2016 (Unaudited) |
| Shares | Description (1) | Value | ||||||||||||||||||||
LONG-TERM INVESTMENTS – 141.2% (98.5% of Total Investments) |
| |||||||||||||||||||||
COMMON STOCKS – 58.5% (40.8% of Total Investments) | ||||||||||||||||||||||
| Air Freight & Logistics – 1.1% (0.8% of Total Investments) | ||||||||||||||||||||||
| 122,445 | BPost SA | $ | 2,751,194 | |||||||||||||||||||
| 25,466 | Oesterreichische Post AG | 824,818 | ||||||||||||||||||||
Total Air Freight & Logistics | 3,576,012 | |||||||||||||||||||||
| Commercial Services & Supplies – 0.8% (0.5% of Total Investments) | ||||||||||||||||||||||
| 171,041 | Covanta Holding Corporation | 2,497,199 | ||||||||||||||||||||
| Construction & Engineering – 0.1% (0.1% of Total Investments) | ||||||||||||||||||||||
| 16,485 | Ferrovial SA | 292,213 | ||||||||||||||||||||
| Diversified Telecommunication Services – 0.6% (0.4% of Total Investments) | ||||||||||||||||||||||
| 728,658 | HKBN Limited | 825,747 | ||||||||||||||||||||
| 372,080 | Singapore Telecommunications Limited | 981,241 | ||||||||||||||||||||
Total Diversified Telecommunication Services | 1,806,988 | |||||||||||||||||||||
| Electric Utilities – 7.4% (5.2% of Total Investments) | ||||||||||||||||||||||
| 97,359 | Alupar Investimento SA | 472,682 | ||||||||||||||||||||
| 2,195,976 | AusNet Services | 2,408,103 | ||||||||||||||||||||
| 116,746 | Brookfield Infrastructure Partners LP | 3,677,499 | ||||||||||||||||||||
| 420,948 | Contact Energy Limited | 1,401,143 | ||||||||||||||||||||
| 6,463 | Duke Energy Corporation | 476,776 | ||||||||||||||||||||
| 40,737 | EDP – Energias de Portugal, S.A. | 117,738 | ||||||||||||||||||||
| 56,522 | Endesa S.A, (10) | 1,168,444 | ||||||||||||||||||||
| 3,002 | Hafslund ASA, Class B Shares | 32,793 | ||||||||||||||||||||
| 1,150,848 | HK Electric Investments Limited, 144A | 1,011,898 | ||||||||||||||||||||
| 1,413,306 | Infratil Limited | 2,792,521 | ||||||||||||||||||||
| 124,954 | Scottish and Southern Energy PLC | 2,306,050 | ||||||||||||||||||||
| 9,983 | Southern Company, (11) | 467,404 | ||||||||||||||||||||
| 3,736,096 | Spark Infrastructure Group | 6,207,569 | ||||||||||||||||||||
| 201,709 | Transmissora Alianca de Energia Eletrica SA | 1,106,341 | ||||||||||||||||||||
Total Electric Utilities | 23,646,961 | |||||||||||||||||||||
| Equity Real Estate Investment Trusts – 23.2% (16.2% of Total Investments) | ||||||||||||||||||||||
| 235,587 | AEW UK REIT PLC | 285,923 | ||||||||||||||||||||
| 25,014 | American Hotel Income Properties REIT LP | 194,593 | ||||||||||||||||||||
| 117,510 | Armada Hoffler Properties Inc. | 1,651,015 | ||||||||||||||||||||
| 506,168 | Ascendas Real Estate Investment Trust | 829,870 | ||||||||||||||||||||
| 84,243 | Automotive Properties Real Estate Investment Trust | 657,237 | ||||||||||||||||||||
| 35,436 | CareTrust REIT Inc. | 501,419 | ||||||||||||||||||||
| 120,162 | Charter Hall Retail REIT | 377,118 | ||||||||||||||||||||
| 75,380 | Choice Properties Real Estate Investment Trust | 729,502 | ||||||||||||||||||||
| 117,040 | City Office REIT, Inc. | 1,465,341 | ||||||||||||||||||||
| 2,460 | Cofinimmo, SANV | 271,673 | ||||||||||||||||||||
| 73,772 | Community Healthcare Trust Inc. | 1,606,754 | ||||||||||||||||||||
| 24,249 | Crombie Real Estate Investment Trust | 248,934 | ||||||||||||||||||||
| 200,305 | Dream Global Real Estate Investment Trust | 1,368,868 | ||||||||||||||||||||
| 55,261 | Easterly Government Properties, Inc. | 1,072,063 | ||||||||||||||||||||
| 218 | Entertainment Properties Trust | 15,160 | ||||||||||||||||||||
| 41,451 | Eurocommercial Properties NV | 1,483,139 | ||||||||||||||||||||
| 1,338,463 | Fortune REIT | 1,580,651 | ||||||||||||||||||||
| 11,507 | Four Corners Property Trust, Inc. | 220,704 | ||||||||||||||||||||
| 56,624 | Franklin Street Properties Corporation | 711,197 | ||||||||||||||||||||
| 1,887,929 | Frasers Centrepoint Trust | 2,568,432 | ||||||||||||||||||||
| 4,651,090 | Frasers Logistics & Industrial Trust | 2,985,316 | ||||||||||||||||||||
| NUVEEN | 13 |
| DRA | Diversified Real Asset Income Fund | |||
| Portfolio of Investments (continued) | November 30, 2016 (Unaudited) |
| Shares | Description (1) | Value | ||||||||||||||||||||
| Equity Real Estate Investment Trusts – (continued) | ||||||||||||||||||||||
| 89,303 | Gaming and Leisure Properties Inc. | $ | 2,724,635 | |||||||||||||||||||
| 61,671 | Granite Real Estate, Inc. | 2,003,056 | ||||||||||||||||||||
| 14,274 | Highwoods Properties, Inc. | 686,008 | ||||||||||||||||||||
| 36,736 | Hospitality Properties Trust | 1,065,160 | ||||||||||||||||||||
| 11,606 | ICADE | 802,000 | ||||||||||||||||||||
| 196,306 | Immobiliare Grande Distribuzione SIIQ SpA | 131,283 | ||||||||||||||||||||
| 95,464 | Independence Realty Trust | 816,217 | ||||||||||||||||||||
| 7,518 | Investors Real Estate Trust | 47,288 | ||||||||||||||||||||
| 1,126,660 | Keppel DC REIT | 962,890 | ||||||||||||||||||||
| 179,111 | Killam Apartment Real Estate I | 1,604,039 | ||||||||||||||||||||
| 6,183 | Kilroy Realty Corporation | 447,278 | ||||||||||||||||||||
| 6,203 | LaSalle Hotel Properties | 174,118 | ||||||||||||||||||||
| 59,488 | Liberty Property Trust | 2,343,827 | ||||||||||||||||||||
| 21,396 | LTC Properties Inc. | 972,662 | ||||||||||||||||||||
| 338,074 | Macquarie Mexico Real Estate Management SA de CV | 338,797 | ||||||||||||||||||||
| 1,393,077 | Mapletree Commercial Trust | 1,404,400 | ||||||||||||||||||||
| 2,124,465 | Mapletree Greater China Commercial Trust | 1,430,292 | ||||||||||||||||||||
| 251,150 | Mapletree Logistics Trust | 177,847 | ||||||||||||||||||||
| 117,768 | MedEquities Realty Trust, Inc. | 1,282,494 | ||||||||||||||||||||
| 270,284 | Medical Properties Trust Inc. | 3,221,785 | ||||||||||||||||||||
| 67,151 | MGM Growth Properties LLC | 1,611,624 | ||||||||||||||||||||
| 40,982 | New Senior Investment Group Inc. | 415,557 | ||||||||||||||||||||
| 28,724 | Northview Apartment Real Estate Investment Trust | 409,274 | ||||||||||||||||||||
| 297,848 | NorthWest Healthcare Properties REIT | 2,148,550 | ||||||||||||||||||||
| 6,018 | Omega Healthcare Investors Inc. | 177,290 | ||||||||||||||||||||
| 97,043 | OneREIT | 251,403 | ||||||||||||||||||||
| 636,973 | Parkway Life Real Estate Investment Trust | 1,093,211 | ||||||||||||||||||||
| 442,150 | Plaza Retail REIT | 1,639,177 | ||||||||||||||||||||
| 812,476 | Prologis Property Mexico SA de CV | 1,169,198 | ||||||||||||||||||||
| 506,355 | Pure Industrial Real Estate Trust | 2,005,366 | ||||||||||||||||||||
| 60,234 | Senior Housing Properties Trust | 1,087,826 | ||||||||||||||||||||
| 55,036 | Smart Real Estate Investment Trust | 1,275,010 | ||||||||||||||||||||
| 154,582 | Spirit Realty Capital Inc. | 1,667,940 | ||||||||||||||||||||
| 159,202 | STAG Industrial Inc. | 3,758,759 | ||||||||||||||||||||
| 2,992 | Sunstone Hotel Investors Inc. | 43,504 | ||||||||||||||||||||
| 883,966 | TF Administradora Industrial S de RL de CV | 1,219,234 | ||||||||||||||||||||
| 14,811 | Universal Health Realty Income Trust | 878,440 | ||||||||||||||||||||
| 9,495 | Urstadt Biddle Properties Inc. | 215,062 | ||||||||||||||||||||
| 320,657 | VEREIT, Inc. | 2,658,247 | ||||||||||||||||||||
| 1,192,515 | Vicinity Centres | 2,571,389 | ||||||||||||||||||||
| 234,571 | Viva Energy REIT, (10) | 382,814 | ||||||||||||||||||||
| 72,836 | Washington Prime Group, Inc. | 729,817 | ||||||||||||||||||||
| 40,551 | Wereldhave NV | 1,693,762 | ||||||||||||||||||||
| 152,154 | WPT Industrial Real Estate Investment Trust | 1,764,986 | ||||||||||||||||||||
Total Equity Real Estate Investment Trusts | 74,328,425 | |||||||||||||||||||||
| Gas Utilities – 0.4% (0.3% of Total Investments) | ||||||||||||||||||||||
| 10,166 | AmeriGas Partners, LP | 456,250 | ||||||||||||||||||||
| 39,711 | Enagas | 978,539 | ||||||||||||||||||||
Total Gas Utilities | 1,434,789 | |||||||||||||||||||||
| Health Care Providers & Services – 0.6% (0.4% of Total Investments) | ||||||||||||||||||||||
| 158,883 | Sienna Senior Living Inc., Subscription | 1,884,170 | ||||||||||||||||||||
| Independent Power & Renewable Electricity Producers – 2.3% (1.6% of Total Investments) | ||||||||||||||||||||||
| 10,821 | Brookfield Renewable Energy Partners LP | 314,350 | ||||||||||||||||||||
| 81,339 | Brookfield Renewable Energy Partners LP | 2,364,541 | ||||||||||||||||||||
| 30,394 | Pattern Energy Group Inc. | 596,634 | ||||||||||||||||||||
| 313,041 | Renewables Infrastructure Group Limited | 417,919 | ||||||||||||||||||||
| 366,769 | Saeta Yield S.A, (10) | 3,179,730 | ||||||||||||||||||||
| 33,437 | TransAlta Renewables Inc. | 341,763 | ||||||||||||||||||||
Total Independent Power & Renewable Electricity Producers | 7,214,937 | |||||||||||||||||||||
| 14 | NUVEEN |
| Shares | Description (1) | Value | ||||||||||||||||||||
| Media – 0.2% (0.1% of Total Investments) | ||||||||||||||||||||||
| 30,880 | Eutelsat Communications | $ | 555,888 | |||||||||||||||||||
| Mortgage Real Estate Investment Trusts – 1.3% (0.9% of Total Investments) | ||||||||||||||||||||||
| 6,607 | Apollo Commercial Real Estate Finance, Inc. | 113,514 | ||||||||||||||||||||
| 12,894 | Ares Commercial Real Estate Corporation | 174,456 | ||||||||||||||||||||
| 90,314 | Blackstone Mortgage Trust Inc., Class A | 2,716,645 | ||||||||||||||||||||
| 58,759 | Starwood Property Trust Inc. | 1,320,315 | ||||||||||||||||||||
Total Mortgage Real Estate Investment Trusts | 4,324,930 | |||||||||||||||||||||
| Multi-Utilities – 7.0% (4.9% of Total Investments) | ||||||||||||||||||||||
| 11,568 | CenterPoint Energy, Inc. | 276,012 | ||||||||||||||||||||
| 888,112 | Centrica PLC | 2,336,865 | ||||||||||||||||||||
| 1,627,382 | Duet Group | 2,860,141 | ||||||||||||||||||||
| 318,386 | Engie | 3,931,191 | ||||||||||||||||||||
| 13,745 | Innogy SE, (10) | 485,321 | ||||||||||||||||||||
| 12,399,137 | Keppel Infrastructure Trust | 4,152,221 | ||||||||||||||||||||
| 64,065 | National Grid PLC | 3,656,190 | ||||||||||||||||||||
| 571,230 | Redes Energeticas Nacionais SA | 1,561,373 | ||||||||||||||||||||
| 1,460,814 | Vector Limited | 3,248,483 | ||||||||||||||||||||
Total Multi-Utilities | 22,507,797 | |||||||||||||||||||||
| Oil, Gas & Consumable Fuels – 6.8% (4.8% of Total Investments) | ||||||||||||||||||||||
| 41,958 | AltaGas Limited | 1,019,511 | ||||||||||||||||||||
| 1,629 | Cheniere Energy Partners LP Holdings LLC | 47,844 | ||||||||||||||||||||
| 3,529 | DCP Midstream Partners LP | 122,209 | ||||||||||||||||||||
| 7,250 | Enbridge Energy Partners LP | 179,075 | ||||||||||||||||||||
| 40,300 | Enbridge Income Fund Holdings Inc. | 1,024,525 | ||||||||||||||||||||
| 195,998 | Enterprise Products Partnership LP | 5,082,228 | ||||||||||||||||||||
| 82,561 | Inter Pipeline Limited | 1,678,509 | ||||||||||||||||||||
| 110 | Magellan Midstream Partners LP | 7,618 | ||||||||||||||||||||
| 13,657 | Noble Midstream Partners LP, (10) | 437,980 | ||||||||||||||||||||
| 11,181 | Pembina Pipeline Corporation | 328,530 | ||||||||||||||||||||
| 133,600 | Plains All American Pipeline LP | 4,402,120 | ||||||||||||||||||||
| 80,724 | Plains GP Holdings LP, Class A Shares | 2,838,269 | ||||||||||||||||||||
| 15,434 | Snam Rete Gas S.p.A | 59,771 | ||||||||||||||||||||
| 59,048 | Targa Resources Corporation | 3,146,668 | ||||||||||||||||||||
| 156,312 | Veresen Inc. | 1,435,934 | ||||||||||||||||||||
Total Oil, Gas & Consumable Fuels | 21,810,791 | |||||||||||||||||||||
| Real Estate Management & Development – 0.6% (0.4% of Total Investments) | ||||||||||||||||||||||
| 16,282 | Atrium European Real Estate Ltd | 66,783 | ||||||||||||||||||||
| 27,898 | Brookfield Property Partners | 590,601 | ||||||||||||||||||||
| 252,994 | Citycon Oyj | 582,391 | ||||||||||||||||||||
| 20,372 | Landmark Infrastructure Partners LP | 298,450 | ||||||||||||||||||||
| 489,033 | Propertylink Group | 261,817 | ||||||||||||||||||||
Total Real Estate Management & Development | 1,800,042 | |||||||||||||||||||||
| Road & Rail – 0.5% (0.3% of Total Investments) | ||||||||||||||||||||||
| 357,040 | Aurizon Holdings Limited | 1,313,008 | ||||||||||||||||||||
| 88,150 | Stagocoach Group PLC | 224,998 | ||||||||||||||||||||
Total Road & Rail | 1,538,006 | |||||||||||||||||||||
| Transportation Infrastructure – 5.2% (3.7% of Total Investments) | ||||||||||||||||||||||
| 246,823 | Abertis Infraestructuras S.A | 3,297,409 | ||||||||||||||||||||
| 45,969 | Cosco Shipping Ports Limited | 48,123 | ||||||||||||||||||||
| 221,486 | Enav S.p.A, (10) | 748,827 | ||||||||||||||||||||
| 7,336,751 | Hopewell Highway Infrastructure Limited | 3,764,619 | ||||||||||||||||||||
| 5,695,842 | Hutchison Port Holdings Trust | 2,392,254 | ||||||||||||||||||||
| 101,272 | Jiangsu Expressway Company Limited | 135,003 | ||||||||||||||||||||
| 22,183 | Macquarie Infrastructure Corporation | 1,817,675 | ||||||||||||||||||||
| 241,595 | Sydney Airport | 1,120,388 | ||||||||||||||||||||
| NUVEEN | 15 |
| DRA | Diversified Real Asset Income Fund | |||
| Portfolio of Investments (continued) | November 30, 2016 (Unaudited) |
| Shares | Description (1) | Value | ||||||||||||||||||||
| Transportation Infrastructure (continued) | ||||||||||||||||||||||
| 408,672 | Transurban Group | $ | 3,180,801 | |||||||||||||||||||
| 290,673 | Zhejiang Expressway Company Limited | 310,666 | ||||||||||||||||||||
Total Transportation Infrastructure | 16,815,765 | |||||||||||||||||||||
| Water Utilities – 0.4% (0.2% of Total Investments) | ||||||||||||||||||||||
| 670,845 | Inversiones Aguas Metropolitanas SA | 1,133,399 | ||||||||||||||||||||
Total Common Stocks (cost $189,816,634) | 187,168,312 | |||||||||||||||||||||
| Shares | Description (1) | Coupon | Ratings (12) | Value | ||||||||||||||||||
CONVERTIBLE PREFERRED SECURITIES – 11.5% (8.0% of Total Investments) |
| |||||||||||||||||||||
| Electric Utilities – 4.7% (3.3% of Total Investments) | ||||||||||||||||||||||
| 93,482 | Exelon Corporation | 6.500% | BB+ | $ | 4,286,150 | |||||||||||||||||
| 55,863 | Great Plains Energy Inc. | 7.000% | N/R | 2,737,287 | ||||||||||||||||||
| 91,667 | NextEra Energy Inc. | 6.123% | BBB | 4,308,349 | ||||||||||||||||||
| 65,378 | NextEra Energy Inc. | 6.371% | BBB | 3,655,284 | ||||||||||||||||||
Total Electric Utilities | 14,987,070 | |||||||||||||||||||||
| Equity Real Estate Investment Trusts – 3.1% (2.2% of Total Investments) | ||||||||||||||||||||||
| 64,965 | Alexandria Real Estate Equities Inc. | 7.000% | Baa3 | 2,243,241 | ||||||||||||||||||
| 45,883 | American Homes 4 Rent | 5.000% | N/R | 1,261,783 | ||||||||||||||||||
| 35,005 | American Tower Corporation | 5.500% | N/R | 3,562,809 | ||||||||||||||||||
| 20,315 | Equity Commonwealth | 6.500% | Ba1 | 522,095 | ||||||||||||||||||
| 1,147 | FelCor Lodging Trust Inc., Series A. | 1.950% | CCC | 27,700 | ||||||||||||||||||
| 5,234 | Lexington Corporate Properties Trust, Series B | 6.500% | N/R | 263,794 | ||||||||||||||||||
| 36,590 | Ramco-Gershenson Properties Trust | 7.250% | N/R | 2,283,948 | ||||||||||||||||||
Total Equity Real Estate Investment Trusts | 10,165,370 | |||||||||||||||||||||
| Gas Utilities – 0.5% (0.3% of Total Investments) | ||||||||||||||||||||||
| 27,189 | Spire, Inc., (13) | 6.750% | N/R | 1,569,893 | ||||||||||||||||||
| Multi-Utilities – 2.8% (1.9% of Total Investments) | ||||||||||||||||||||||
| 12,196 | Black Hills Corp | 7.750% | N/R | 804,448 | ||||||||||||||||||
| 103,986 | Dominion Resources Inc. | 6.750% | BBB– | 5,106,752 | ||||||||||||||||||
| 58,737 | DTE Energy Company | 5.000% | BBB– | 2,995,587 | ||||||||||||||||||
Total Multi-Utilities | 8,906,787 | |||||||||||||||||||||
| Oil, Gas & Consumable Fuels – 0.4% (0.3% of Total Investments) | ||||||||||||||||||||||
| 29,408 | Anadarko Petroleum Corporation | 7.500% | N/R | 1,209,551 | ||||||||||||||||||
Total Convertible Preferred Securities (cost $36,386,193) | 36,838,671 | |||||||||||||||||||||
| Shares | Description (1) | Coupon | Ratings (12) | Value | ||||||||||||||||||
$25 PAR (OR SIMILAR) RETAIL PREFERRED – 31.3% (21.8% of Total Investments) |
| |||||||||||||||||||||
| Electric Utilities – 6.6% (4.6% of Total Investments) | ||||||||||||||||||||||
| 11,814 | APT Pipelines Limited | 6.455% | N/R | $ | 905,556 | |||||||||||||||||
| 91,690 | Brookfield Infrastructure | 5.350% | BBB– | 1,731,005 | ||||||||||||||||||
| 99,660 | Entergy Arkansas Inc. | 4.875% | A | 2,117,775 | ||||||||||||||||||
| 17,721 | Entergy Louisiana LLC | 4.875% | A | 377,457 | ||||||||||||||||||
| 28,269 | Entergy New Orleans, Inc. | 5.500% | A | 687,219 | ||||||||||||||||||
| 24,771 | Entergy Texas Inc. | 5.625% | A | 620,514 | ||||||||||||||||||
| 82,026 | Integrys Energy Group Inc., (13) | 6.000% | Baa1 | 2,132,676 | ||||||||||||||||||
| 123,146 | NextEra Energy Inc. | 5.250% | BBB | 2,712,906 | ||||||||||||||||||
| 55,582 | NextEra Energy Inc. | 5.000% | BBB | 1,253,374 | ||||||||||||||||||
| 67,123 | Pacific Gas & Electric Corporation | 6.000% | BBB+ | 2,046,580 | ||||||||||||||||||
| 123,339 | PPL Capital Funding, Inc. | 5.900% | BBB | 3,069,908 | ||||||||||||||||||
| 37,147 | SCE Trust I | 5.625% | Baa1 | 899,329 | ||||||||||||||||||
| 123,985 | Southern Company | 5.250% | BBB | 2,717,751 | ||||||||||||||||||
Total Electric Utilities | 21,272,050 | |||||||||||||||||||||
| 16 | NUVEEN |
| Shares | Description (1) | Coupon | Ratings (12) | Value | ||||||||||||||||||
| Equity Real Estate Investment Trusts – 16.3% (11.3% of Total Investments) | ||||||||||||||||||||||
| 38,611 | American Homes 4 Rent | 6.350% | N/R | $ | 916,239 | |||||||||||||||||
| 39,253 | American Homes 4 Rent | 5.500% | N/R | 1,073,570 | ||||||||||||||||||
| 39,423 | American Homes 4 Rent | 5.000% | N/R | 1,095,959 | ||||||||||||||||||
| 47,768 | American Homes 4 Rent | 6.500% | N/R | 1,154,075 | ||||||||||||||||||
| 105,637 | CBL & Associates Properties Inc. | 7.375% | BB | 2,595,501 | ||||||||||||||||||
| 32,189 | CBL & Associates Properties Inc. | 6.625% | BB | 765,454 | ||||||||||||||||||
| 183,565 | Cedar Shopping Centers Inc., Series A | 7.250% | N/R | 4,541,398 | ||||||||||||||||||
| 39,955 | Chesapeake Lodging Trust | 7.750% | N/R | 1,022,049 | ||||||||||||||||||
| 116,713 | City Office REIT, Inc. | 6.625% | N/R | 2,561,850 | ||||||||||||||||||
| 8,851 | DDR Corporation | 6.250% | Baa3 | 218,177 | ||||||||||||||||||
| 56,817 | EPR Properties Inc. | 9.000% | BB | 2,009,617 | ||||||||||||||||||
| 2,960 | EPR Properties Inc. | 5.750% | BB | 81,992 | ||||||||||||||||||
| 34,296 | Gladstone Commercial Corporation | 7.000% | N/R | 848,826 | ||||||||||||||||||
| 79,423 | Gramercy Property Trust | 7.125% | BB+ | 2,057,056 | ||||||||||||||||||
| 69,158 | Hersha Hospitality Trust | 6.875% | N/R | 1,728,950 | ||||||||||||||||||
| 71,333 | Hersha Hospitality Trust | 6.500% | N/R | 1,683,459 | ||||||||||||||||||
| 117,674 | Hersha Hospitality Trust | 6.500% | N/R | 2,781,813 | ||||||||||||||||||
| 75,220 | Investors Real Estate Trust | 7.950% | N/R | 1,921,871 | ||||||||||||||||||
| 68,110 | LaSalle Hotel Properties | 6.300% | N/R | 1,638,727 | ||||||||||||||||||
| 56,811 | Monmouth Real Estate Investment Corp | 6.125% | N/R | 1,393,574 | ||||||||||||||||||
| 87,682 | Pebblebrook Hotel Trust | 6.500% | N/R | 2,235,891 | ||||||||||||||||||
| 59,934 | Pebblebrook Hotel Trust | 6.375% | N/R | 1,483,367 | ||||||||||||||||||
| 3,992 | Post Properties, Inc., Series A | 8.500% | Baa3 | 267,185 | ||||||||||||||||||
| 1,991 | PS Business Parks, Inc. | 6.000% | BBB | 49,078 | ||||||||||||||||||
| 20,122 | Public Storage, Inc. | 5.750% | A3 | 488,160 | ||||||||||||||||||
| 23,403 | Rait Financial Trust | 7.125% | N/R | 562,842 | ||||||||||||||||||
| 57 | Rexford Industrial Realty Inc. | 5.875% | BB | 1,297 | ||||||||||||||||||
| 16,120 | Senior Housing Properties Trust | 6.250% | BBB– | 398,970 | ||||||||||||||||||
| 41,073 | STAG Industrial Inc. | 6.875% | BB+ | 1,076,113 | ||||||||||||||||||
| 63,852 | Summit Hotel Properties Inc. | 7.875% | N/R | 1,642,273 | ||||||||||||||||||
| 123,744 | Summit Hotel Properties Inc. | 7.125% | N/R | 3,124,536 | ||||||||||||||||||
| 40,687 | Summit Hotel Properties Inc. | 6.450% | N/R | 962,248 | ||||||||||||||||||
| 85,003 | Sunstone Hotel Investors Inc. | 6.450% | N/R | 2,075,773 | ||||||||||||||||||
| 21,724 | Taubman Centers Incorporated, Series K | 6.250% | N/R | 543,100 | ||||||||||||||||||
| 54,861 | UMH Properties Inc. | 8.000% | N/R | 1,455,462 | ||||||||||||||||||
| 51,095 | Urstadt Biddle Properties | 7.125% | N/R | 1,305,477 | ||||||||||||||||||
| 77,598 | Urstadt Biddle Properties | 6.750% | N/R | 1,991,165 | ||||||||||||||||||
| 10,536 | Washington Prime Group, Inc. | 6.875% | Ba1 | 259,186 | ||||||||||||||||||
Total Equity Real Estate Investment Trusts | 52,012,280 | |||||||||||||||||||||
| Independent Power & Renewable Electricity Producers – 0.2% (0.2% of Total Investments) | ||||||||||||||||||||||
| 41,214 | Brookfield Renewable Partners, Preferred Equity | 5.750% | BB+ | 782,063 | ||||||||||||||||||
| Mortgage Real Estate Investment Trusts – 1.6% (1.1% of Total Investments) | ||||||||||||||||||||||
| 27,106 | Apollo Commercial Real Estate Finance | 8.625% | N/R | 691,203 | ||||||||||||||||||
| 53,499 | Arbor Realty Trust Incorporated | 7.375% | N/R | 1,354,595 | ||||||||||||||||||
| 26,727 | Colony Financial Inc. | 7.500% | N/R | 668,175 | ||||||||||||||||||
| 86,648 | Colony Financial Inc. | 7.125% | N/R | 2,077,819 | ||||||||||||||||||
| 7,338 | Colony Financial Inc. | 8.500% | N/R | 185,725 | ||||||||||||||||||
Total Mortgage Real Estate Investment Trusts | 4,977,517 | |||||||||||||||||||||
| Multi-Utilities – 3.7% (2.6% of Total Investments) | ||||||||||||||||||||||
| 45,190 | Dominion Resources Inc. | 6.375% | Baa3 | 2,271,701 | ||||||||||||||||||
| 213,439 | Dominion Resources Inc. | 5.250% | BBB– | 4,559,057 | ||||||||||||||||||
| 97,288 | DTE Energy Company, (WI/DD), (13) | 6.000% | Baa2 | 2,390,366 | ||||||||||||||||||
| 91,963 | DTE Energy Company | 5.375% | Baa2 | 2,048,936 | ||||||||||||||||||
| 30,646 | DTE Energy Company | 5.250% | Baa2 | 717,116 | ||||||||||||||||||
Total Multi-Utilities | 11,987,176 | |||||||||||||||||||||
| Oil, Gas & Consumable Fuels – 2.4% (1.7% of Total Investments) | ||||||||||||||||||||||
| 68,613 | Kinder Morgan Inc., Delaware | 9.750% | N/R | 3,373,015 | ||||||||||||||||||
| 108,221 | Nustar Energy LP | 8.500% | BB+ | 2,737,991 | ||||||||||||||||||
| NUVEEN | 17 |
| DRA | Diversified Real Asset Income Fund | |||
| Portfolio of Investments (continued) | November 30, 2016 (Unaudited) |
| Shares | Description (1) | Coupon | Ratings (12) | Value | ||||||||||||||||||
| Oil, Gas & Consumable Fuels – 2.4% (continued) | ||||||||||||||||||||||
| 3,989 | Nustar Logistics Limited Partnership | 7.625% | Ba2 | $ | 101,440 | |||||||||||||||||
| 68,538 | Pembina Pipeline Corporation | 5.750% | BB+ | 1,320,962 | ||||||||||||||||||
Total Oil, Gas & Consumable Fuels | 7,533,408 | |||||||||||||||||||||
| Real Estate Management & Development – 0.2% (0.1% of Total Investments) | ||||||||||||||||||||||
| 26,111 | Landmark Infrastructure Partners LP | 8.000% | N/R | 629,014 | ||||||||||||||||||
| Trading Companies & Distributors – 0.3% (0.2% of Total Investments) | ||||||||||||||||||||||
| 37,739 | GATX Corporation | 5.625% | BBB | 900,075 | ||||||||||||||||||
Total $25 Par (or similar) Retail Preferred (cost $102,856,248) | 100,093,583 | |||||||||||||||||||||
| Principal Amount (000) | Description (1) | Coupon | Maturity | Ratings (12) | Value | |||||||||||||||||
CONVERTIBLE BONDS – 1.0% (0.7% of Total Investments) | ||||||||||||||||||||||
| Multi-Utilities – 0.5% (0.4% of Total Investments) | ||||||||||||||||||||||
| $ | 1,670 | Dominion Resources Inc. | 5.750% | 10/01/54 | BBB– | $ | 1,711,750 | |||||||||||||||
| Oil, Gas & Consumable Fuels – 0.5% (0.3% of Total Investments) | ||||||||||||||||||||||
| 1,705 | DCP Midstream LLC, 144A | 5.850% | 5/21/43 | BB– | 1,449,250 | |||||||||||||||||
| $ | 3,375 | Total Convertible Bonds (cost $3,312,965) | 3,161,000 | |||||||||||||||||||
| Principal Amount (000) | (14) | Description (1) | Coupon | Maturity | Ratings (12) | Value | ||||||||||||||||
CORPORATE BONDS – 19.9% (13.9% of Total Investments) |
| |||||||||||||||||||||
| Commercial Services & Supplies – 1.6% (1.1% of Total Investments) | ||||||||||||||||||||||
| $ | 1,225 | Advanced Disposal Services, Inc., 144A | 5.625% | 11/15/24 | B– | $ | 1,212,750 | |||||||||||||||
| 2,285 | Covanta Holding Corporation | 5.875% | 3/01/24 | Ba3 | 2,227,875 | |||||||||||||||||
| 1,515 | GFL Environmental Corporation, 144A | 9.875% | 2/01/21 | B– | 1,643,775 | |||||||||||||||||
Total Commercial Services & Supplies | 5,084,400 | |||||||||||||||||||||
| Construction & Engineering – 0.2% (0.2% of Total Investments) | ||||||||||||||||||||||
| 7,500 | NOK | VV Holding AS, 144A | 6.230% | 7/10/19 | N/R | 819,268 | ||||||||||||||||
| Consumer Finance – 0.1% (0.1% of Total Investments) | ||||||||||||||||||||||
| 330 | Covenant Surgical Partners Inc., 144A | 8.750% | 8/01/19 | B– | 313,500 | |||||||||||||||||
| Diversified Telecommunication Services – 1.2% (0.9% of Total Investments) | ||||||||||||||||||||||
| 1,955 | Qualitytech LP/QTS Finance Corp. | 5.875% | 8/01/22 | BB | 1,998,988 | |||||||||||||||||
| 2,060 | SBA Communications Corporation, 144A | 4.875% | 9/01/24 | B | 1,993,050 | |||||||||||||||||
Total Diversified Telecommunication Services | 3,992,038 | |||||||||||||||||||||
| Electric Utilities – 0.2% (0.1% of Total Investments) | ||||||||||||||||||||||
| 775 | Intergen NV, 144A | 7.000% | 6/30/23 | B1 | 666,500 | |||||||||||||||||
| Energy Equipment & Services – 0.5% (0.4% of Total Investments) | ||||||||||||||||||||||
| 1,515 | EUR | Origin Energy Finance Limited, Reg S | 7.875% | 6/16/71 | BB | 1,693,263 | ||||||||||||||||
| Equity Real Estate Investment Trusts – 3.3% (2.3% of Total Investments) | ||||||||||||||||||||||
| 1,840 | Care Capital Properties, Inc., 144A | 5.125% | 8/15/26 | BBB– | 1,767,379 | |||||||||||||||||
| 555 | CoreCivic, Inc. | 4.625% | 5/01/23 | Ba1 | 539,738 | |||||||||||||||||
| 635 | Corporate Office Properties LP | 5.000% | 7/01/25 | BBB– | 650,328 | |||||||||||||||||
| 1,795 | DuPont Fabros Technology LP | 5.625% | 6/15/23 | Ba1 | 1,889,238 | |||||||||||||||||
| 1,390 | Geo Group Inc. | 6.000% | 4/15/26 | B+ | 1,334,400 | |||||||||||||||||
| 935 | MPT Operating Partnership Finance | 5.250% | 8/01/26 | BBB– | 876,562 | |||||||||||||||||
| 955 | Omega Healthcare Investors Inc. | 4.500% | 4/01/27 | BBB– | 913,372 | |||||||||||||||||
| 1,600 | PLA Administradora Industrial, S. de R.L. de C.V., 144A | 5.250% | 11/10/22 | Baa3 | 1,536,000 | |||||||||||||||||
| 1,070 | Trust F/1401, 144A | 5.250% | 1/30/26 | Baa2 | 1,027,200 | |||||||||||||||||
Total Equity Real Estate Investment Trusts | 10,534,217 | |||||||||||||||||||||
| 18 | NUVEEN |
| Principal Amount (000) | (14) | Description (1) | Coupon | Maturity | Ratings (12) | Value | ||||||||||||||||
| Gas Utilities – 1.5% (1.0% of Total Investments) | ||||||||||||||||||||||
| $ | 1,075 | AmeriGas Partners LP/AmeriGas Finance Corporation | 5.875% | 8/20/26 | BB | $ | 1,069,292 | |||||||||||||||
| 1,525 | Ferrellgas LP | 6.750% | 1/15/22 | B | 1,437,312 | |||||||||||||||||
| 965 | LBC Tank Terminals Holdings Netherlands BV, 144A | 6.875% | 5/15/23 | B | 965,000 | |||||||||||||||||
| 20 | Suburban Propane Partners LP | 5.500% | 6/01/24 | BB– | 20,050 | |||||||||||||||||
| 1,205 | Suburban Propane Partners LP | 5.750% | 3/01/25 | BB– | 1,211,025 | |||||||||||||||||
Total Gas Utilities | 4,702,679 | |||||||||||||||||||||
| Health Care Equipment & Supplies – 0.3% (0.2% of Total Investments) | ||||||||||||||||||||||
| 1,050 | Tenet Healthcare Corporation | 8.125% | 4/01/22 | B– | 958,125 | |||||||||||||||||
| Health Care Providers & Services – 1.3% (0.9% of Total Investments) | ||||||||||||||||||||||
| 935 | Acadia Healthcare | 5.625% | 2/15/23 | B | 920,975 | |||||||||||||||||
| 710 | Community Health Systems, Inc. | 6.875% | 2/01/22 | B | 473,925 | |||||||||||||||||
| 425 | HCA Inc. | 5.375% | 2/01/25 | BB | 415,969 | |||||||||||||||||
| 755 | IASIS Healthcare Capital Corporation | 8.375% | 5/15/19 | CCC+ | 660,625 | |||||||||||||||||
| 715 | Kindred Healthcare Inc. | 6.375% | 4/15/22 | B– | 609,537 | |||||||||||||||||
| 390 | Lifepoint Health Inc. | 5.875% | 12/01/23 | Ba2 | 388,537 | |||||||||||||||||
| 635 | Select Medical Corporation | 6.375% | 6/01/21 | B– | 609,200 | |||||||||||||||||
Total Health Care Providers & Services | 4,078,768 | |||||||||||||||||||||
| Hotels, Restaurants & Leisure – 0.4% (0.3% of Total Investments) | ||||||||||||||||||||||
| 1,255 | MGM Growth Properties Operating Partnership LP / MGP Escrow Co-Issuer, Inc., 144A | 4.500% | 9/01/26 | BB– | 1,201,662 | |||||||||||||||||
| Independent Power & Renewable Electricity Producers – 0.6% (0.4% of Total Investments) | ||||||||||||||||||||||
| 1,105 | Dynegy Inc., 144A | 8.000% | 1/15/25 | B+ | 1,016,600 | |||||||||||||||||
| 1,420 | GenOn Energy Inc. | 9.500% | 10/15/18 | CCC+ | 990,450 | |||||||||||||||||
Total Independent Power & Renewable Electricity Producers | 2,007,050 | |||||||||||||||||||||
| Internet Software & Services – 0.4% (0.2% of Total Investments) | ||||||||||||||||||||||
| 1,125 | Equinix Inc. | 5.750% | 1/01/25 | BB+ | 1,160,156 | |||||||||||||||||
| IT Services – 0.6% (0.4% of Total Investments) | ||||||||||||||||||||||
| 1,875 | Zayo Group LLC / Zayo Capital Inc. | 6.000% | 4/01/23 | B– | 1,954,688 | |||||||||||||||||
| Marine – 0.2% (0.1% of Total Investments) | ||||||||||||||||||||||
| 605 | Navios South American Logistics Inc., Finance US Inc., 144A | 7.250% | 5/01/22 | B– | 520,300 | |||||||||||||||||
| Multi-Utilities – 1.4% (1.0% of Total Investments) | ||||||||||||||||||||||
| 1,505 | GBP | Centrica PLC, Reg S | 5.250% | 4/10/75 | BBB | 1,897,856 | ||||||||||||||||
| 2,000 | GBP | RWE AG, Reg S | 7.000% | 3/29/49 | BB+ | 2,556,046 | ||||||||||||||||
Total Multi-Utilities | 4,453,902 | |||||||||||||||||||||
| Oil, Gas & Consumable Fuels – 3.7% (2.6% of Total Investments) | ||||||||||||||||||||||
| 215 | Calumet Specialty Products | 6.500% | 4/15/21 | CCC+ | 175,762 | |||||||||||||||||
| 1,420 | Calumet Specialty Products | 7.625% | 1/15/22 | CCC+ | 1,157,300 | |||||||||||||||||
| 540 | Crestwood Midstream Partners LP | 6.125% | 3/01/22 | BB– | 545,400 | |||||||||||||||||
| 1,420 | Energy Transfer Equity LP | 5.500% | 6/01/27 | BB+ | 1,390,720 | |||||||||||||||||
| 425 | Genesis Energy LP | 5.625% | 6/15/24 | B+ | 416,500 | |||||||||||||||||
| 920 | Gibson Energy, 144A | 6.750% | 7/15/21 | BB | 954,500 | |||||||||||||||||
| 670 | Global Partners LP/GLP Finance | 6.250% | 7/15/22 | B+ | 633,150 | |||||||||||||||||
| 95 | Global Partners LP/GLP Finance | 7.000% | 6/15/23 | B+ | 90,725 | |||||||||||||||||
| 1,100 | Martin Mid-Stream Partners LP Finance | 7.250% | 2/15/21 | B– | 1,067,000 | |||||||||||||||||
| 400 | NGL Energy Partners LP/Fin Co | 5.125% | 7/15/19 | BB– | 390,000 | |||||||||||||||||
| 335 | NGL Energy Partners LP/Fin Co | 6.875% | 10/15/21 | BB– | 334,162 | |||||||||||||||||
| 575 | Northern Tier Energy LLC | 7.125% | 11/15/20 | BB– | 598,000 | |||||||||||||||||
| 1,110 | PBF Holding Company LLC, 144A | 7.000% | 11/15/23 | BBB– | 1,060,050 | |||||||||||||||||
| 970 | Rose Rock Midstream LP / Rose Rock Finance Corporation | 5.625% | 7/15/22 | B+ | 931,200 | |||||||||||||||||
| 985 | Sabine Pass Liquefaction LLC | 6.250% | 3/15/22 | BBB– | 1,061,338 | |||||||||||||||||
| NUVEEN | 19 |
| DRA | Diversified Real Asset Income Fund | |||
| Portfolio of Investments (continued) | November 30, 2016 (Unaudited) |
| Principal Amount (000) | (14) | Description (1) | Coupon | Maturity | Ratings (12) | Value | ||||||||||||||||
| Oil, Gas & Consumable Fuels – 3.7% (continued) | ||||||||||||||||||||||
| $ | 805 | Summit Midstream Holdings LLC Finance | 5.500% | 8/15/22 | B | $ | 786,888 | |||||||||||||||
| 150 | Tesoro Logistics LP Finance Corporation | 5.250% | 1/15/25 | BB+ | 152,062 | |||||||||||||||||
Total Oil, Gas & Consumable Fuels | 11,744,757 | |||||||||||||||||||||
| Real Estate Management & Development – 1.0% (0.7% of Total Investments) | ||||||||||||||||||||||
| 1,295 | Hunt Companies Inc., 144A | 9.625% | 3/01/21 | N/R | 1,333,850 | |||||||||||||||||
| 1,735 | Kennedy-Wilson Holdings Incorporated | 5.875% | 4/01/24 | BB– | 1,748,013 | |||||||||||||||||
Total Real Estate Management & Development | 3,081,863 | |||||||||||||||||||||
| Road & Rail – 0.3% (0.2% of Total Investments) | ||||||||||||||||||||||
| 1,090 | Watco Companies LLC Finance, 144A | 6.375% | 4/01/23 | B– | 1,117,250 | |||||||||||||||||
| Software – 0.4% (0.3% of Total Investments) | ||||||||||||||||||||||
| 1,265 | SixSigma Networks Mexico SA de CV, 144A | 8.250% | 11/07/21 | B+ | 1,182,775 | |||||||||||||||||
| Transportation Infrastructure – 0.1% (0.1% of Total Investments) | ||||||||||||||||||||||
| 475 | Mexico City Airport Trust, 144A | 4.250% | 10/31/26 | BBB+ | 452,675 | |||||||||||||||||
| Wireless Telecommunication Services – 0.6% (0.4% of Total Investments) | ||||||||||||||||||||||
| 876 | Inmarsat Finance PLC, 144A | 4.875% | 5/15/22 | BB+ | 834,390 | |||||||||||||||||
| 1,105 | Inmarsat Finance PLC, 144A | 6.500% | 10/01/24 | BB+ | 1,107,762 | |||||||||||||||||
Total Wireless Telecommunication Services | 1,942,152 | |||||||||||||||||||||
Total Corporate Bonds (cost $65,449,861) | 63,661,988 | |||||||||||||||||||||
| Principal Amount (000) | (14) | Description (1) | Coupon | Maturity | Ratings (12) | Value | ||||||||||||||||
1,000 PAR (OR SIMILAR) INSTITUTIONAL PREFERRED – 8.6% (6.0% of Total Investments) |
| |||||||||||||||||||||
| Diversified Financial Services – 0.3% (0.2% of Total Investments) | ||||||||||||||||||||||
| $ | 810 | National Rural Utilities Cooperative Finance Corporation | 5.250% | 4/20/46 | A3 | $ | 852,591 | |||||||||||||||
| Electric Utilities – 5.1% (3.5% of Total Investments) | ||||||||||||||||||||||
| 1,435 | AES Gener SA, 144A | 8.375% | 12/18/73 | BB | 1,488,812 | |||||||||||||||||
| 6,710 | Emera, Inc. | 6.750% | 6/15/76 | BBB– | 7,112,600 | |||||||||||||||||
| 2,035 | Enel SpA, 144A | 8.750% | 9/24/73 | BBB– | 2,311,455 | |||||||||||||||||
| 1,000 | EUR | Energias de Portugal, SA, Reg S | 5.375% | 9/16/75 | Ba2 | 1,067,534 | ||||||||||||||||
| 1,445 | Exelon Corporation | 6.350% | 3/15/33 | Baa2 | 1,485,652 | |||||||||||||||||
| 2,075 | GBP | NGG Finance PLC, Reg S | 5.625% | 6/18/73 | BBB | 2,796,492 | ||||||||||||||||
Total Electric Utilities | 16,262,545 | |||||||||||||||||||||
| Energy Equipment & Services – 3.0% (2.1% of Total Investments) | ||||||||||||||||||||||
| 4,205 | TransCanada Trust | 5.875% | 8/15/76 | BBB | 4,352,175 | |||||||||||||||||
| 5,410 | TransCanada Trust | 5.625% | 5/20/75 | BBB | 5,424,715 | |||||||||||||||||
Total Energy Equipment & Services | 9,776,890 | |||||||||||||||||||||
| Oil, Gas & Consumable Fuels – 0.2% (0.2% of Total Investments) | ||||||||||||||||||||||
| 675 | Enterprise Products Operating LP | 7.034% | 1/15/68 | Baa2 | 705,251 | |||||||||||||||||
Total $1,000 Par (or similar) Institutional Preferred (cost $27,118,321) |
| 27,597,277 | ||||||||||||||||||||
| Principal Amount (000) | Description (1) | Interest Rate (8) | Maturity (8) | Value | ||||||||||||||||||
WHOLE LOANS – 6.7% (4.7% of Total Investments) (2), (3), (4) |
| |||||||||||||||||||||
| Commercial Loans – 3.6% (2.5% of Total Investments) | ||||||||||||||||||||||
| $ | 2,198 | 150 North Pantano I, AZ | 4.900% | 8/01/19 | $ | 2,191,384 | ||||||||||||||||
| 14,000 | NCH Commercial Pool II, Rocky Point, Mexico, (5), (7) | 11.925% | 8/01/14 | 3,690,400 | ||||||||||||||||||
| 20 | NUVEEN |
| Principal Amount (000) | Description (1) | Interest Rate (8) | Maturity (8) | Value | ||||||||||||||||||
| Commercial Loans (continued) | ||||||||||||||||||||||
| $ | 4,523 | RealtiCorp Fund III, Crystal River, FL, (5), (6) | 5.925% | 7/01/17 | $ | 4,046,315 | ||||||||||||||||
| 1,943 | RL Stowe Portfolio, Belmont, NC and Chattanooga, TN | 3.925% | 1/01/20 | 1,570,454 | ||||||||||||||||||
| 22,664 | Total Commercial Loans | 11,498,553 | ||||||||||||||||||||
| Multifamily Loans – 3.1% (2.2% of Total Investments) | ||||||||||||||||||||||
| 4,897 | NCH Multifamily Pool II, Rocky Point Mexico, (5), (7) | 11.925% | 8/01/14 | 33,645 | ||||||||||||||||||
| 4,400 | NCH Multifamily Pool, Oklahoma City, OK, (5), (7) | 11.925% | 8/01/14 | 2,460,040 | ||||||||||||||||||
| 12,435 | Sapphire Skies I, Cle Elum, WA, (5), (9) | 1.925% | 3/01/20 | 7,588,098 | ||||||||||||||||||
| 21,732 | Total Multifamily Loans | 10,081,783 | ||||||||||||||||||||
| $ | 44,396 | Total Whole Loans (cost $43,100,984) | 21,580,336 | |||||||||||||||||||
| Principal Amount (000) | Description (1) | Coupon | Maturity | Value | ||||||||||||||||||
CORPORATE NOTES – 2.5% (1.7% of Total Investments) (2), (3), (4) |
| |||||||||||||||||||||
| Diversified Financial Services – 2.5% (1.7% of Total Investments) | ||||||||||||||||||||||
| $ | 8,000,000 | Stratus III, Stratus Properties Inc., (5) | 7.250% | 12/31/16 | $ | 8,000,000 | ||||||||||||||||
| $ | 8,000,000 | Total Corporate Notes (cost $8,000,000) | 8,000,000 | |||||||||||||||||||
| Shares | Description (1), (15) | Value | ||||||||||||||||||||
INVESTMENT COMPANIES – 1.2% (0.9% of Total Investments) |
| |||||||||||||||||||||
| Diversified Other – 1.2% (0.9% of Total Investments) | ||||||||||||||||||||||
| 1,417,148 | John Laing Infrastructure Fund | $ | 2,243,016 | |||||||||||||||||||
| 500,022 | NextEnergy Solar Fund Limited | 656,909 | ||||||||||||||||||||
| 707,391 | Starwood European Real Estate Finance Limited | 922,704 | ||||||||||||||||||||
Total Diversified Other | 3,822,629 | |||||||||||||||||||||
Total Investment Companies (cost $4,187,379) | 3,822,629 | |||||||||||||||||||||
Total Long-Term Investments (cost $480,228,585) | 451,923,796 | |||||||||||||||||||||
| Principal Amount (000) | Description (1) | Coupon | Maturity | Value | ||||||||||||||||||
SHORT-TERM INVESTMENTS – 2.1% (1.5% of Total Investments) |
| |||||||||||||||||||||
| REPURCHASE AGREEMENTS – 2.1% (1.5% of Total Investments) | ||||||||||||||||||||||
| $ | 6,840 | Repurchase Agreement with Fixed Income | 0.030% | 12/01/16 | $ | 6,840,493 | ||||||||||||||||
Total Short-Term Investments (cost $6,840,493) | 6,840,493 | |||||||||||||||||||||
Total Investments (cost $487,069,078) – 143.3% | 458,764,289 | |||||||||||||||||||||
Borrowings – (43.0)% (16), (17) | (137,500,000 | ) | ||||||||||||||||||||
Other Assets Less Liabilities – (0.3)% (18) | (1,209,412 | ) | ||||||||||||||||||||
Net Assets – 100% | $ | 320,054,877 | ||||||||||||||||||||
Investments in Derivatives as of November 30, 2016
Futures Contracts
| Description | Contract Position | Number of Contracts | Contract Expiration | Notional Amount at Value | Variation Margin Receivable/ (Payable) | Unrealized Appreciation (Depreciation) | ||||||||||||||||||
U.S. Treasury 5-Year Note | Short | (64 | ) | 3/17 | $ | (7,542,000 | ) | $ | 18,000 | $ | 11,378 | |||||||||||||
| NUVEEN | 21 |
| DRA | Diversified Real Asset Income Fund | |||
| Portfolio of Investments (continued) | November 30, 2016 (Unaudited) |
Total Return Swaps
| Counterparty | Receive | Pay | Expiration Date | Notional Amount | Unrealized Appreciation (Depreciation) | |||||||||||
Morgan Stanley Capital Services LLC | iSHR DJ Real Estate ETF | 3-Month USD-LIBOR-ICE | 6/6/17 | $ | 3,710,025 | $ | (7,203 | ) | ||||||||
Morgan Stanley Capital Services LLC | Vanguard Global Ex-U.S. REIT ETF | 3-Month USD-LIBOR-ICE | 6/6/17 | 3,729,250 | (137,355 | ) | ||||||||||
Morgan Stanley Capital Services LLC | iShares iBoxx $ High Yield Corporate Bond ETF | 3-Month USD-LIBOR-ICE | 6/6/17 | 6,335,600 | 91,313 | |||||||||||
Morgan Stanley Capital Services LLC | iShares Global Infrastructure ETF | 3-Month USD-LIBOR-ICE | 6/6/17 | 9,528,800 | (279,835 | ) | ||||||||||
Morgan Stanley Capital Services LLC | iShares S&P® Preferred Stock Index ETF | 3-Month USD-LIBOR-ICE | 6/6/17 | 11,666,700 | (435,231 | ) | ||||||||||
| $ | 34,970,375 | $ | (768,311 | ) | ||||||||||||
For Fund portfolio compliance purposes, the Fund’s industry classifications refer to any one or more of the industry sub-classifications used by one or more widely recognized market indexes or ratings group indexes, and/or as defined by Fund management. This definition may not apply for purposes of this report which may combine industry sub-classifications into sectors for reporting ease.
| (1) | All percentages shown in the Portfolio of Investments are based on net assets unless otherwise noted. |
| (2) | Interest rates on whole loans and corporate notes are the net coupon rates in effect (after reducing the coupon rate by any mortgage servicing fees paid to mortgage servicers) as of the end of the reporting period. |
| (3) | Securities purchased as part of a private placement, which have not been registered with U.S. Securities and Exchange Commission under the Securities Act of 1933 and which are considered to be illiquid. |
| (4) | Investments valued at fair value using methods determined in good faith by, or at the discretion of, the Board. For fair value measurement disclosure purposes, investments are classified as Level 3 unless otherwise noted. See Notes to Financial Statements, Note 2 – Investment Valuation and Fair Value Measurements for more information. |
| (5) | Interest only – Represents securities that entitle holders to receive only interest payments on the mortgage. Principal balance on the loan is due at maturity. The interest rate disclosed represents the net coupon rate in effect as of the end of the reporting period. |
| (6) | As of, or subsequent to, the end of the reporting period, this security is non-income producing. Non-income producing, in the case of a fixed-income security, generally denotes that the issuer has (1) defaulted on the payment of principal or interest, (2) is under the protection of the Federal Bankruptcy Court or (3) the Fund’s Adviser has concluded that the issue is not likely to meet its future interest payment obligations and has ceased accruing additional income on the Fund’s records. |
| (7) | Loan is currently in default with regards to scheduled interest and/or principal payments. |
| (8) | Represents the interest rate, coupon and maturity in effect as of the end of the reporting period. |
| (9) | The interest rate will increase to 2.000% on March 1, 2017. |
| (10) | Non-income producing; issuer has not declared a dividend within the past twelve months. |
| (11) | Investment, or portion of investment, has been pledged to collateralize the net payment obligations for investments in derivatives. |
| (12) | For financial reporting purposes, the ratings disclosed are the highest of Standard & Poor’s Group (“Standard & Poor’s”), Moody’s Investors Service, Inc. (“Moody’s”) or Fitch, Inc. (“Fitch”) rating. This treatment of split-rated securities may differ from that used for other purposes, such as for Fund investment policies. Ratings below BBB by Standard & Poor’s, Baa by Moody’s or BBB by Fitch are considered to be below investment grade. Holdings designated N/R are not rated by any of these national rating agencies. |
| (13) | For fair value measurement disclosure purposes, investment classified as Level 2. See Notes to Financial Statements, Note 2 – Investment Valuation and Fair Value Measurements for more information. |
| (14) | Principal Amount (000) denominated in U.S. Dollars, unless otherwise noted. |
| (15) | A copy of the most recent financial statements for these investment companies can be obtained directly from the Securities and Exchange Commission on its website at http://www.sec.gov. |
| (16) | The Fund segregates 100% of its eligible investments (excluding any investments separately pledged as collateral for specific investments in derivatives) in the Portfolio of Investments as collateral for Borrowings. |
| (17) | Borrowings as a percentage of Total Investments is 30.0%. |
| (18) | Other assets less liabilities includes the unrealized appreciation (depreciation) of over-the-counter (“OTC”) derivatives as presented on the Statement of Assets and Liabilities, when applicable. The unrealized appreciation (depreciation) of OTC-cleared and exchange-traded derivatives is recognized as part of cash collateral at brokers and/or the receivable or payable for variation margin as presented on the Statement of Assets and Liabilities, when applicable. |
| 144A | Investment is exempt from registration under Rule 144A of the Securities Act of 1933, as amended. These investments may only be resold in transactions exempt from registration, which are normally those transactions with qualified institutional buyers. |
| EUR | Euro |
| GBP | Pound Sterling |
| NOK | Norwegian Krone |
| Reg S | Regulation S allows U.S. companies to sell securities to persons or entities located outside of the United States without registering those securities with the Securities and Exchange Commission. Specifically, Regulation S provides a safe harbor from the registration requirements of the Securities Act for the offers and sales of securities by both foreign and domestic issuers that are made outside the United States. |
| REIT | Real Estate Investment Trust |
| (WI/DD) | Investment, or portion of investment, purchased on a when-issued or delayed delivery basis. |
| USD-LIBOR-ICE | United States Dollar – London Inter-Bank Offered Rate – Intercontinental Exchange |
See accompanying notes to financial statements.
| 22 | NUVEEN |
Assets and Liabilities | November 30, 2016 (Unaudited) | |||||
Assets | ||||
Long-term investments, at value (cost $480,228,585) | $ | 451,923,796 | ||
Short-term investments, at value (cost approximates value) | 6,840,493 | |||
Cash denominated in foreign currencies (cost $161,961) | 161,590 | |||
Cash | 54,595 | |||
Receivable for: | ||||
Dividends | 1,550,403 | |||
Interest | 1,826,970 | |||
Investments sold | 8,613,221 | |||
Reclaims | 86,491 | |||
Variation margin on futures contracts | 18,000 | |||
Other assets | 663 | |||
Total assets | 471,076,222 | |||
Liabilities | ||||
Borrowings | 137,500,000 | |||
Unrealized depreciation on total return swaps, net | 768,311 | |||
Payable for: | ||||
Dividends | 1,834,276 | |||
Investments purchased | 9,826,745 | |||
Accrued expenses: | ||||
Management fees | 442,389 | |||
Interest on borrowings | 371,399 | |||
Other | 278,225 | |||
Total liabilities | 151,021,345 | |||
Net assets | $ | 320,054,877 | ||
Shares outstanding | 17,835,395 | |||
Net asset value (“NAV”) per share outstanding | $ | 17.94 | ||
Net assets consist of: | ||||
Shares, $.01 par value per share | $ | 178,354 | ||
Paid-in surplus | 434,682,235 | |||
Undistributed (Over-distribution of) net investment income | 1,133,725 | |||
Accumulated net realized gain (loss) | (86,853,152 | ) | ||
Net unrealized appreciation (depreciation) | (29,086,285 | ) | ||
Net assets | $ | 320,054,877 | ||
Authorized shares | Unlimited |
See accompanying notes to financial statements.
| NUVEEN | 23 |
Operations | Six Months Ended November 30, 2016 (Unaudited) | |||||
Investment Income | ||||
Dividends (net of tax withheld of $(326,547) | $ | 10,465,570 | ||
Interest | 4,476,548 | |||
Total investment income | 14,942,118 | |||
Expenses | ||||
Management fees | 2,286,827 | |||
Interest expense on borrowings | 956,830 | |||
Custodian fees | 121,601 | |||
Trustees fees | 106,288 | |||
Professional fees | 69,384 | |||
Shareholder reporting expenses | 48,610 | |||
Shareholder servicing agent fees | 7,093 | |||
Stock exchange listing fees | 3,916 | |||
Other | 23,988 | |||
Total expenses before expense reimbursement | 3,624,537 | |||
Expense reimbursement | (601,611 | ) | ||
Net expenses | 3,022,926 | |||
Net investment income (loss) | 11,919,192 | |||
Realized and Unrealized Gain (Loss) | ||||
Net realized gain (loss) from: | ||||
Investments and foreign currency | 1,989,626 | |||
Swaps | (516,036 | ) | ||
Futures contracts | 183,632 | |||
Change in net unrealized appreciation (depreciation) of: | ||||
Investments and foreign currency | (16,120,010 | ) | ||
Swaps | (768,311 | ) | ||
Futures contracts | 11,378 | |||
Net realized and unrealized gain (loss) | (15,219,721 | ) | ||
Net increase (decrease) in net assets from operations | $ | (3,300,529 | ) |
See accompanying notes to financial statements.
| 24 | NUVEEN |
Changes in Net Assets | (Unaudited) | |||||
| Six Months Ended 11/30/16 | Year Ended 5/31/16 | |||||||
Operations | ||||||||
Net investment income | $ | 11,919,192 | $ | 29,796,881 | ||||
Net realized gain (loss) from: | ||||||||
Investments and foreign currency | 1,989,626 | (42,360,044 | ) | |||||
Swaps | (516,036 | ) | — | |||||
Futures contracts | 183,632 | (143,895 | ) | |||||
Change in net unrealized appreciation (depreciation) of: | ||||||||
Investments and foreign currency | (16,120,010 | ) | 14,953,637 | |||||
Swaps | (768,311 | ) | — | |||||
Futures contracts | 11,378 | 41,626 | ||||||
Net increase (decrease) in net assets from operations | (3,300,529 | ) | 2,288,205 | |||||
Distributions to Shareholders | ||||||||
From net investment income | (11,531,531 | ) | (31,602,898 | ) | ||||
Decrease in net assets from distributions to shareholders | (11,531,531 | ) | (31,602,898 | ) | ||||
Capital Share Transactions | ||||||||
Common shares: | ||||||||
Cost of shares repurchased or retired | (959,221 | ) | (7,660,004 | ) | ||||
Cost of shares repurchased and retired through tender offer | — | (36,737,199 | ) | |||||
Net increase (decrease) in net assets from capital share transactions | (959,221 | ) | (44,397,203 | ) | ||||
Net increase (decrease) in net assets | (15,791,281 | ) | (73,711,896 | ) | ||||
Net assets at the beginning of period | 335,846,158 | 409,558,054 | ||||||
Net assets at the end of period | $ | 320,054,877 | $ | 335,846,158 | ||||
Undistributed (Over-distribution of) net investment income at the end of period | $ | 1,133,725 | $ | 746,064 | ||||
See accompanying notes to financial statements.
| NUVEEN | 25 |
Cash Flows | Six Months Ended November 30, 2016 | |||||
Cash Flows from Operating Activities: | ||||
Net Increase (Decrease) in Net Assets from Operations | $ | (3,300,529 | ) | |
Adjustments to reconcile the net increase (decrease) in net assets from operations to net cash provided by (used in) operating activities: | ||||
Purchases of investments | (233,248,044 | ) | ||
Proceeds from sales and maturities of investments | 222,285,909 | |||
Proceeds from (Purchases of) short-term investments, net | 8,496,341 | |||
Proceeds from (Payments for) swap contracts, net | (516,036 | ) | ||
Proceeds from (Payments for) cash denominated in foreign currencies, net | (52,361 | ) | ||
Proceeds from (Payments for) closed foreign currency spot contracts | 40,057 | |||
Amortization (Accretion) of premiums and discounts, net | (333,174 | ) | ||
(Increase) Decrease in: | ||||
Receivable for dividends | (466,327 | ) | ||
Receivable for interest | 1,824,182 | |||
Receivable for investments sold | (3,687,179 | ) | ||
Receivable for reclaims | 47,197 | |||
Receivable for variation margin on futures contracts | (18,000 | ) | ||
Other assets | 4,345 | |||
Increase (Decrease) in: | ||||
Payable for investments purchased | 4,807,840 | |||
Accrued management fees | 236,056 | |||
Accrued interest on borrowings | 37,462 | |||
Accrued other expenses | 5,034 | |||
Net realized (gain) loss from: | ||||
Investments and foreign currency | (1,989,626 | ) | ||
Swaps | 516,036 | |||
Paydowns | (2,800 | ) | ||
Change in net unrealized (appreciation) depreciation of: | ||||
Investments and foreign currency | 16,120,010 | |||
Swaps | 768,311 | |||
Net cash provided by (used in) operating activities | 11,574,704 | |||
Cash Flows from Financing Activities | ||||
Proceeds from borrowings | 1,200,000 | |||
Cash distributions paid to shareholders | (11,760,888 | ) | ||
Cost of shares repurchased and retired | (959,221 | ) | ||
Net cash provided by (used in) financing activities | (11,520,109 | ) | ||
Net Increase (Decrease) in Cash | 54,595 | |||
Cash at the beginning of period | — | |||
Cash at the end of period | $ | 54,595 | ||
| Supplemental Disclosure of Cash Flow Information | ||||
Cash paid for interest on borrowings (excluding borrowing costs) | $ | 904,437 | ||
See accompanying notes to financial statements.
| 26 | NUVEEN |
THIS PAGE INTENTIONALLY LEFT BLANK
| NUVEEN | 27 |
Highlights (Unaudited)
Selected data for a share outstanding throughout each period:
| Investment Operations | Less Distributions | Discounts from Shares | ||||||||||||||||||||||||||||||||||||||||||||||
| Beginning NAV | Net Investment Income(a) | Net Realized/ Unrealized Gain (Loss) | Total | From Net Investment Income | From Accumu lated Net Realized Gains | Return of Capital | Total | Repur chased and Retired | Repur and Retired through | Ending NAV | Ending Share Price | |||||||||||||||||||||||||||||||||||||
Year Ended 5/31: |
| |||||||||||||||||||||||||||||||||||||||||||||||
2017(g) | $ | 18.77 | $ | 0.67 | $ | (0.85 | ) | $ | (0.18 | ) | $ | (0.65 | ) | $ | — | $ | — | $ | (0.65 | ) | $ | — | ** | $ | — | $ | 17.94 | $ | 15.41 | |||||||||||||||||||
2016 | 20.06 | 1.55 | (1.28 | ) | 0.27 | (1.65 | ) | — | — | (1.65 | ) | 0.07 | 0.02 | 18.77 | 16.19 | |||||||||||||||||||||||||||||||||
2015(f) | 20.00 | 1.14 | (0.14 | ) | 1.00 | (1.03 | ) | — | — | (1.03 | ) | 0.01 | 0.08 | 20.06 | 17.91 | |||||||||||||||||||||||||||||||||
| Borrowings at End of Period | ||||||||
| Aggregate Amount Outstanding (000) | Asset Coverage Per $1,000 | |||||||
Year Ended 5/31: |
| |||||||
2017(g) | $ | 137,500 | $ | 3,328 | ||||
2016 | 136,300 | 3,464 | ||||||
2015(f) | 170,300 | 3,405 | ||||||
| 28 | NUVEEN |
| Ratios/Supplemental Data | ||||||||||||||||||||||||||||||
| Total Returns | Ratios to Average Net Assets Before Reimbursement(c) | Ratios to Average Net Assets After Reimbursement(c)(d) | ||||||||||||||||||||||||||||
| Based on NAV(b) | Based on Market Value(b) | Ending Net Assets (000) | Expenses | Net Investment Income | Expenses | Net Investment Income | Portfolio Turnover Rate(e) | |||||||||||||||||||||||
| (1.13 | )% | (1.07 | )% | $ | 320,055 | 2.09 | %* | 6.53 | %* | 1.74 | %* | 6.87 | %* | 53 | % | |||||||||||||||
| 2.26 | 0.09 | 335,846 | 2.22 | 7.80 | 1.63 | 8.40 | 87 | |||||||||||||||||||||||
| 5.60 | 3.99 | 409,558 | 2.10 | * | 7.10 | * | 1.40 | * | 7.80 | * | 104 | |||||||||||||||||||
| (a) | Per share Net Investment Income is calculated using the average daily shares method. |
| (b) | Total Return Based on NAV is the combination of changes in NAV, reinvested dividend income at NAV and reinvested capital gains distributions at NAV, if any. The last dividend declared in the period, which is typically paid on the first business day of the following month, is assumed to be reinvested at the ending NAV. The actual reinvest price for the last dividend declared in the period may often be based on the Fund’s market price (and not its NAV), and therefore may be different from the price used in the calculation. Total returns are not annualized. |
Total Return Based on Share Price is the combination of changes in the market price per share and the effect of reinvested dividend income and reinvested capital gains distributions, if any, at the average price paid per share at the time of reinvestment. The last dividend declared in the period, which is typically paid on the first business day of the following month, is assumed to be reinvested at the ending market price. The actual reinvestment for the last dividend declared in the period may take place over several days, and in some instances may not be based on the market price, so the actual reinvestment price may be different from the price used in the calculation. Total returns are not annualized.
| (c) • | Net Investment Income ratios reflect income earned and expenses incurred on assets attributable to reverse repurchase agreements and/or borrowings (as described in Note 8 – Borrowing Arrangements), where applicable. The Fund ceased utilizing reverse repurchase agreements during the period September 8, 2014 (commencement of operations) through May 31, 2015. |
| • | Each ratio includes the effect of all interest expense paid and other costs related to borrowings and/or reverse repurchase agreements, where applicable, as follows: |
| Ratios of Interest Expense to Average Net Assets | ||||
Year Ended 5/31: |
| |||
2017(g) | 0.55 | %* | ||
2016 | 0.51 | |||
2015(f) | 0.38 | * | ||
| (d) | After expense reimbursement from the Adviser, where applicable. As of September 8, 2016, the Adviser is no longer contractually reimbursing the Fund for any fees and expenses. |
| (e) | Portfolio Turnover Rate is calculated based on the lesser of long-term purchases or sales (as disclosed in Note 5 – Investment Transactions) divided by the average long-term market value during the period. |
| (f) | For the period from September 8, 2014 (commencement of operations) through May 31, 2015. |
| (g) | For the six months ending November 30, 2016. |
| * | Annualized. |
| ** | Value rounds to less than $0.01. |
See accompanying notes to financial statements.
| NUVEEN | 29 |
Financial Statements (Unaudited)
1. General Information and Significant Accounting Policies
General Information
Fund Information
Diversified Real Asset Income Fund (the “Fund”) is registered under the Investment Company Act of 1940, as amended, as a diversified closed-end management investment company. The Fund’s shares are listed on the New York Stock Exchange (“NYSE”) and trade under the ticker symbol “DRA.” The Fund was organized as a Massachusetts business trust on January 21, 2014.
The end of the reporting period for the Fund is November 30, 2016, and the period covered by these Notes to Financial Statements is the six months ended November 30, 2016 (the “current fiscal period”).
Investment Adviser
The Fund’s investment adviser is Nuveen Fund Advisors, LLC (the “Adviser”), a wholly-owned subsidiary of Nuveen Investments, Inc. (“Nuveen”). Nuveen is an operating division of TIAA Global Asset Management. The Adviser is responsible for the Fund’s overall investment strategy and asset allocation decisions, including the Fund’s use of leverage. The Adviser has entered into a sub-advisory agreement with Nuveen Asset Management, LLC (the “Sub-Adviser”), a subsidiary of the Adviser, under which the Sub-Adviser manages the Fund’s investment portfolio.
Investment Objectives and Principal Investment Strategies
The Fund’s investment objective is a high level of current income and long-term capital appreciation. Under normal conditions:
| • | The Fund will invest at least 80% of its managed assets in securities or other instruments that provide investment exposure to real assets. Real assets are any tangible assets, as distinguished from financial assets, and generally include real estate, infrastructure and natural resources. Real asset related investments are: (i) whole loans, loan participation and other mortgage-related interests; (ii) securities of companies that are in the energy, telecommunications, utilities or materials sectors; (iii) securities of companies in the real estate or transportation industry groups; (iv) securities of companies that, if not in one of these sectors or industry groups (a) derive at least 50% of their revenues or profits from the ownership, management, operation, development, construction, financing or sale of real assets or (b) have at least 50% of the fair market value of their assets invested in real assets or (v) pooled investment vehicles that primarily invest in the foregoing companies or that are otherwise designed primarily to provide investment exposure to real assets. |
| • | All of the Fund’s debt securities may be rated lower than investment grade quality (BB+/Ba1 or lower), and no more than 10% of the Fund’s managed assets may be invested in debt securities rated CCC+/Caa1 or lower (except that this limitation shall not apply to whole loans, mortgage participations and other mortgage-related instruments). |
| • | The Fund may invest up to 75% of its managed assets in securities of non-U.S. issuers through the direct investment in securities of non-U.S. companies and through depositary receipts. Non-U.S. issuers are those (i) whose securities are traded principally on a stock exchange or over-the-counter (“OTC”) in a non-U.S. country, (ii) that are organized under the laws of and have a principal office(s) in a non-U.S. country or (iii) that have at least 50% of their revenues, profits or assets in non-U.S. countries. |
| • | The Fund may invest up to 50% of its managed assets in securities of issuers located in emerging markets. |
| • | The Fund may invest up to 10% of its total assets in securities of other open- or closed-end investment companies (including exchange-traded-funds (“ETFs”)) that invest primarily in securities of the types in which the Fund may invest directly. |
The Fund may employ an option writing strategy, focused on securities issued by real asset related companies, that seeks to produce option premiums for the purpose of enhancing the Fund’s risk-adjusted total returns over time. The Fund may also enter into derivative instruments to manage market or business risk, enhance return, hedge certain risks of its investments in fixed-income securities or as a substitute for a position in the underlying asset. Such instruments include financial futures contracts, swap contracts (including credit default swaps and interest rate swaps), options on financial futures, options on swap contracts, or other derivative instruments.
The Fund may utilize leverage through the usage of (a) reverse repurchase agreements; (b) borrowings, including loans from certain financial institutions, and/or the issuance of debt securities, including fixed and floating rate notes or liquidity supported variable rate demand obligations; and (b) the issuance of preferred shares of beneficial interest or other senior securities. The Fund also may utilize derivatives and other portfolio techniques that have the economic effect of leverage by creating additional investment exposure.
| 30 | NUVEEN |
Significant Accounting Policies
The Fund is an investment company and follows accounting and reporting guidance under Financial Accounting Standards Board (FASB) Accounting Standards Codification (ASC) Topic 946 “Financial Services – Investment Companies.” The following is a summary of significant accounting policies followed by the Fund in the preparation of its financial statements in accordance with accounting principles generally accepted in the United States of America (“U.S. GAAP”).
Investment Transactions
Investment transactions are recorded on a trade date basis. Realized gains and losses from investment transactions are determined on the specific identification method, which is the same basis used for federal income tax purposes. Investments purchased on a when-issued/delayed delivery basis may have extended settlement periods. Any investments so purchased are subject to market fluctuation during this period. The Fund has earmarked securities in its portfolio with a current value at least equal to the amount of the when-issued/delayed delivery purchase commitments.
As of the end of the reporting period, the Fund’s outstanding when-issued/delayed delivery purchase commitments were as follows:
Outstanding when-issued/delayed delivery purchase commitments | $2,427,336 |
Investment Income
Dividend income is recorded on the ex-dividend date or, for foreign securities, when information is available. Interest income, which reflects the amortization of premiums and includes accretion of discounts for financial reporting purposes, is recorded on an accrual basis. Interest income collected for loans that are no longer held by the Fund is recorded when information is available. Interest income also reflects paydown gains and losses, if any.
During the normal course of business, the Fund may negotiate with the borrower in a loan agreement one or more of the following items: (i) entrance fees, (ii) exit fees, (iii) modification fees and (iv) prepayment penalties. Such fees, if any, are recorded when information is available and recognized as a component of “Fees income” on the Statement of Operations.
Professional Fees
Professional fees presented on the Statement of Operations consist of legal fees incurred in the normal course of operations, audit fees, tax consulting fees and, in some cases, workout expenditures. Workout expenditures are incurred in an attempt to protect or enhance an investment or to pursue other claims or legal actions on behalf of Fund shareholders. If a refund is received for workout expenditures paid in a prior reporting period, such amounts will be recognized as “Legal fee refund” on the Statement of Operations.
Dividends and Distributions to Shareholders
Distributions to shareholders are recorded on the ex-dividend date. The amount and timing of distributions are determined in accordance with federal income tax regulations, which may differ from U.S. GAAP.
The Fund makes monthly cash distributions to shareholders of a stated dollar amount per share. Subject to approval and oversight by the Fund’s Board of Trustees (the “Board”), the Fund seeks to establish a distribution rate that roughly corresponds to the cash flows from its investment strategies through regular distributions (a “Cash Flow-Based Distribution Program”). The Fund seeks to establish a relatively stable common share distribution rate that roughly corresponds to the Fund’s net cash flows after expense from its investments over an extended period of time. Actual net cash flows the Fund receives may differ from the Fund’s distribution rate over shorter time periods over a specific timeframe. The portion of distributions paid attributed to net unrealized gains, if any, is distributed from the Fund’s assets and is treated by shareholders as a non-taxable distribution (“Return of Capital”) for tax purposes. In the event that total distributions during a calendar year exceed the Fund’s total return on net asset value (“NAV”), the difference will reduce NAV per share. If the Fund’s total return on NAV exceeds total distributions during a calendar year, the excess will be reflected as an increase in NAV per share. The final determination of the source and character of all distributions for the fiscal year are made after the end of the fiscal year and is reflected in the financial statements contained in the annual report as of May 31 each year.
The tax character of Fund distributions for a fiscal year is dependent upon the amount and tax character of distributions received from securities held in the Fund’s portfolio. Distributions received from certain securities in which the Fund invests, most notably Real Estate Investment Trust (“REIT”) securities, may be characterized for tax purposes as ordinary income, long-term capital gain and/or a return of capital. The issuer of a security reports the tax character of its distributions only once per year, generally during the first two months of the calendar year. The distribution is included in the Fund’s ordinary income until such time the Fund is notified by the issuer of the actual tax character. For the fiscal year just ended, dividend income, net realized gain (loss) and unrealized appreciation (depreciation) recognized on the Statement of Operations reflect the amounts of ordinary income, capital gain, and/or return of capital as reported by the issuers of such securities as of the last calendar year end.
| NUVEEN | 31 |
Notes to Financial Statements (Unaudited) (continued)
Indemnifications
Under the Fund’s organizational documents, its officers and trustees are indemnified against certain liabilities arising out of the performance of their duties to the Fund. In addition, in the normal course of business, the Fund enters into contracts that provide general indemnifications to other parties. The Fund’s maximum exposure under these arrangements is unknown as this would involve future claims that may be made against the Fund that have not yet occurred. However, the Fund has not had prior claims or losses pursuant to these contracts and expects the risk of loss to be remote.
Netting Agreements
In the ordinary course of business, the Fund may enter into transactions subject to enforceable master repurchase agreements, International Swaps and Derivative Association, Inc. (“ISDA”) master agreements or other similar arrangements (“netting agreements”). Generally, the right to offset in netting agreements allows the Fund to offset certain securities and derivatives with a specific counterparty as well as any collateral received or delivered to that counterparty based on the terms of the agreements. Generally, the Fund manages its cash collateral and securities collateral on a counterparty basis.
The Fund’s investments subject to netting agreements as of the end of the reporting period, if any, are further described in Note 3 – Portfolio Securities and Investments in Derivatives.
Use of Estimates
The preparation of financial statements in conformity with U.S. GAAP requires management to make estimates and assumptions that affect the reported amounts of assets and liabilities at the date of the financial statements and the reported amounts of increases and decreases in net assets from operations during the reporting period. Actual results may differ from those estimates.
2. Investment Valuation and Fair Value Measurements
The fair valuation input levels as described below are for fair value measurement purposes.
Fair value is defined as the price that would be received upon selling an investment or transferring a liability in an orderly transaction to an independent buyer in the principal or most advantageous market for the investment. A three-tier hierarchy is used to maximize the use of observable market data and minimize the use of unobservable inputs and to establish classification of fair value measurements for disclosure purposes. Observable inputs reflect the assumptions market participants would use in pricing the asset or liability. Observable inputs are based on market data obtained from sources independent of the reporting entity. Unobservable inputs reflect the reporting entity’s own assumptions about the assumptions market participants would use in pricing the asset or liability. Unobservable inputs are based on the best information available in the circumstances. The following is a summary of the three-tiered hierarchy of valuation input levels.
| Level 1 – | Inputs are unadjusted and prices are determined using quoted prices in active markets for identical securities. | |
| Level 2 – | Prices are determined using other significant observable inputs (including quoted prices for similar securities, interest rates, prepayment speeds, credit risk, etc.). | |
| Level 3 – | Prices are determined using significant unobservable inputs (including management’s assumptions in determining the fair value of investments). |
Prices of fixed-income securities are provided by an independent pricing service (“pricing service”) approved by the Board. The pricing service establishes a security’s fair value using methods that may include consideration of the following: yields or prices of investments of comparable quality, type of issue, coupon, maturity and rating, market quotes or indications of value from security dealers, evaluations of anticipated cash flows or collateral, general market conditions and other information and analysis, including the obligor’s credit characteristics considered relevant. These securities are generally classified as Level 2. In pricing certain securities, particularly less liquid and lower quality securities, the pricing service may consider information about a security, its issuer or market activity, provided by the Adviser. These securities are generally classified as Level 2 or Level 3 depending on the observability of the significant inputs.
Prices of swap contracts are also provided by a pricing service approved by the Board using the same methods as described above, and are generally classified as Level 2.
Common stocks and other equity-type securities are valued at the last sales price on the securities exchange on which such securities are primarily traded and are generally classified as Level 1. Securities primarily traded on the NASDAQ National Market (“NASDAQ”) are valued at the NASDAQ Official Closing Price and are generally classified as Level 1. However, securities traded on a securities exchange or NASDAQ for which there were no transactions on a given day or securities not listed on a securities exchange or NASDAQ are valued at the quoted bid price and are generally classified as Level 2.
Investments in investment companies are valued at their respective NAVs on valuation date and are generally classified as Level 1.
Repurchase agreements are valued at contract amount plus accrued interest, which approximates market value. These securities are generally classified as Level 2.
| 32 | NUVEEN |
Futures contracts are valued using the closing settlement price or, in the absence of such a price, the last traded price and are generally classified as Level 1.
Investments initially valued in currencies other than the U.S. dollar are converted to the U.S. dollar using exchange rates obtained from pricing services. As a result, the NAV of the Fund’s shares may be affected by changes in the value of currencies in relation to the U.S. dollar. The value of securities traded in markets outside the United States or denominated in currencies other than the U.S. dollar may be affected significantly on a day that the NYSE is closed and an investor is not able to purchase, redeem or exchange shares. If significant market events occur between the time of determination of the closing price of a foreign security on an exchange and the time that the Fund’s NAV is determined, or if under the Fund’s procedures, the closing price of a foreign security is not deemed to be reliable, the security would be valued at fair value as determined in accordance with procedures established in good faith by the Board. These securities are generally classified as Level 2 or Level 3 depending on the priority of the significant inputs.
Commercial and multifamily whole loans are generally fair valued using a discounted cash flow methodology designed to incorporate, among other things, the present value of the projected stream of cash flows for such investments (the “discounted cash flow” methodology). For commercial and multifamily whole loans, the discounted cash flow methodology takes into account a number of relevant factors, including changes in prevailing interest rates, yield spreads, the borrower’s creditworthiness (i.e. the debt service coverage ratio), lien position, delinquency status, and the projected rate of prepayments. For first lien loans, if the resulting price from the discounted cash flow methodology is lower than the current average loss recovery on commercial mortgage-backed securities (the “price floor”), the loan will be fair valued at the price floor (the “price floor” methodology). In addition, for all loans, if the resulting price from the discounted cash flow methodology is above the loan’s par value plus any prepayment penalty (the “price ceiling”), the loan will be fair valued at the price ceiling (the “anticipated recovery rate” methodology). Newly purchased loans are initially fair valued at their purchase price and subsequently fair valued using the discounted cash flow methodology. Loans with a pending short payoff will be fair valued at the anticipated recovery rate. If the Fund’s Valuation Committee, as described below, concludes that the fundamentals of a loan or its underlying collateral do not support the use of the discounted cash flow, price ceiling or price floor methodologies, a fair value determination may be made that incorporates other relevant factors (e.g., third-party appraisal of loan collateral). Valuations of commercial and multifamily whole loans are determined no less frequently than weekly. Although the Adviser believes the pricing methodologies to be reasonable and appropriate, the actual values that may be realized upon a current sale of commercial and multifamily whole loans can only be determined in negotiations between the Fund and third parties, and may vary significantly from fair value prices used by the Fund.
The significant unobservable inputs used in the determination of fair value using the discounted cash flow methodology for commercial and multifamily whole loans include yield and liquidity spreads and debt service coverage ratios, ceilings, floors and appraisals. Significant increases (decreases) in yield and liquidity spreads would result in lower (higher) fair values. A significant decrease (increase) in the debt service coverage ratio of a loan’s borrower could result in lower (higher) fair values.
Single family whole loans are generally fair valued using the discounted cash flow methodology. For single family whole loans, the pricing methodology takes into account a number of relevant factors, including changes in prevailing interest rates, yield spreads, delinquency status, loan to value ratios, lien position, and prepayment speeds. If the resulting price from the discounted cash flow methodology is above 103% of the loan’s par value (the “price ceiling”), the loan will be fair valued at the price ceiling (the “price ceiling” methodology). Valuations of single family whole loans are determined no less frequently than weekly. Although the Adviser believes the pricing methodologies to be reasonable and appropriate, the actual values that may be realized upon a current sale of single family whole loans can only be determined in negotiations between the Fund and third parties, and may vary significantly from fair value prices used by the Fund.
The significant unobservable input used in the determination of fair value using the discounted cash flow methodology for single family whole loans is the yield spread. Significant increases (decreases) in yield spreads would result in lower (higher) fair values.
Corporate notes are fair valued using the discounted cash flow methodology. For corporate notes, the discounted cash flow methodology takes into account changes in prevailing interest rates, yield and liquidity spreads. If the resulting price from the discounted cash flow methodology is above the note’s par value plus any prepayment penalty (the “price ceiling”), the note will be fair valued at the price ceiling (the “price ceiling” methodology). Currently all corporate notes are fair valued at the price ceiling. Valuations of corporate notes are determined no less frequently than weekly. Although the Adviser believes the pricing methodologies to be reasonable and appropriate, the actual values that may be realized upon a current sale of corporate notes can only be determined in negotiations between the Fund and third parties, and may vary significantly from fair value prices used by the Fund.
The significant unobservable input used in the determination of fair value using the discounted cash flow methodology for corporate notes are yield and liquidity spreads. Significant increases (decreases) in yield and liquidity spreads would result in lower (higher) fair values.
Real estate owned properties are valued, whenever possible, using a third-party appraisal or broker’s opinion of value. If a third-party appraisal or broker’s opinion is not available, a property is valued at the current average loss recovery on commercial mortgage-backed securities (the “average recovery rate” methodology). There were no real estate owned properties held by the Fund as of the end of the reporting period.
| NUVEEN | 33 |
Notes to Financial Statements (Unaudited) (continued)
Certain securities may not be able to be priced by the pre-established pricing methods as described above. Such securities may be valued by the Board and/or its appointee at fair value. These securities generally include, but are not limited to, restricted securities (securities which may not be publicly sold without registration under the Securities Act of 1933, as amended) for which a pricing service is unable to provide a market price; securities whose trading has been formally suspended; debt securities that have gone into default and for which there is no current market quotation; a security whose market price is not available from a pre-established pricing source; a security with respect to which an event has occurred that is likely to materially affect the value of the security after the market has closed but before the calculation of the Fund’s NAV (as may be the case in non-U.S. markets on which the security is primarily traded) or make it difficult or impossible to obtain a reliable market quotation; and a security whose price, as provided by the pricing service, is not deemed to reflect the security’s fair value. As a general principle, the fair value of a security would appear to be the amount that the owner might reasonably expect to receive for it in a current sale. A variety of factors may be considered in determining the fair value of such securities, which may include consideration of the following: yields or prices of investments of comparable quality, type of issue, coupon, maturity and rating, market quotes or indications of value from security dealers, evaluations of anticipated cash flows or collateral, general market conditions and other information and analysis, including the obligor’s credit characteristics considered relevant. These securities are generally classified as Level 2 or Level 3 depending on the observability of the significant inputs. Regardless of the method employed to value a particular security, all valuations are subject to review by the Board and/or its appointee.
The inputs or methodologies used for valuing securities are not an indication of the risks associated with investing in those securities. The following is a summary of the Fund’s fair value measurements as of the end of the reporting period:
| Level 1 | Level 2 | Level 3 | Total | |||||||||||||
Long-Term Investments:* | ||||||||||||||||
Common Stocks | 187,168,312 | — | — | 187,168,312 | ||||||||||||
Convertible Preferred Securities | 35,268,778 | 1,569,893 | ** | — | 36,838,671 | |||||||||||
$25 Par (or similar) Retail Preferred | 95,570,541 | 4,523,042 | ** | — | 100,093,583 | |||||||||||
Convertible Bonds | — | 3,161,000 | — | 3,161,000 | ||||||||||||
Corporate Bonds | — | 63,661,988 | — | 63,661,988 | ||||||||||||
$1,000 Par (or similar) Institutional Preferred | — | 27,597,277 | — | 27,597,277 | ||||||||||||
Whole Loans | $ | — | $ | — | $ | 21,580,336 | ** | $ | 21,580,336 | |||||||
Corporate Notes | — | — | 8,000,000 | ** | 8,000,000 | |||||||||||
Investment Companies | 3,822,629 | — | — | 3,822,629 | ||||||||||||
Short-Term Investments: | ||||||||||||||||
Repurchase Agreements | — | 6,840,493 | — | 6,840,493 | ||||||||||||
Investments in Derivatives | ||||||||||||||||
Futures Contracts*** | 11,378 | — | — | 11,378 | ||||||||||||
Total Return Swaps*** | — | (768,311 | ) | — | (768,311 | ) | ||||||||||
Total | $ | 321,841,638 | $ | 106,585,382 | $ | 29,580,336 | $ | 458,007,356 | ||||||||
| * | Refer to the Fund’s portfolio of investments for whole loan categories and industry classifications. |
| ** | Refer to the Fund’s Portfolio of Investments for securities classified as Level 2 and/or Level 3, where applicable. |
| *** | Represents net unrealized appreciation (depreciation) as reported in the Fund’s Portfolio of Investments. |
The following is a reconciliation of the Fund’s Level 3 investments held at the beginning and end of the measurement period:
| Level 3 | ||||||||||||
| Whole Loans | Corporate Notes | Total | ||||||||||
Balance at the beginning of period | $ | 35,794,041 | $ | 8,000,000 | $ | 43,794,041 | ||||||
Gains (losses): | ||||||||||||
Net realized gains (losses) | (5,068,779 | ) | — | (5,068,779 | ) | |||||||
Change in net unrealized appreciation (depreciation) | 1,064,734 | — | 1,064,734 | |||||||||
Purchases at cost | 7,296 | — | 7,296 | |||||||||
Sales at proceeds | (10,500,123 | ) | — | (10,500,123 | ) | |||||||
Net discounts (premiums) | 283,167 | — | 283,167 | |||||||||
Transfers into | — | — | — | |||||||||
Transfers (out of) | — | — | — | |||||||||
Balance at the end of period | $ | 21,580,336 | $ | 8,000,000 | $ | 29,580,336 | ||||||
Change in net unrealized appreciation (depreciation) during the period of Level 3 securities held as of the end of the reporting period | $ | (4,068,286 | ) | $ | — | $ | (4,068,286 | ) | ||||
| 34 | NUVEEN |
The valuation techniques and significant unobservable inputs used in recurring Level 3 fair value measurements of assets as of the end of the reporting period, were as follows:
| Market Value | Techniques | Unobservable Inputs | Range | |||||||||
Commercial & Multifamily Whole Loans | $ | 7,841,798 | Discounted Cash Flow | Yield Spread | 2.900% - 2.95 | 0% | ||||||
| Discounted Cash Flow | Liquidity Spread | 0.50 | % | |||||||||
| Discounted Cash Flow | Debt Service Coverage Ratio | 0.00 - 1.00 | ||||||||||
| 13,738,538 | Appraisals | N/A | N/A | |||||||||
Corporate Notes | 8,000,000 | Price Ceiling | Cap | 100.00 | ||||||||
Total | $ | 29,580,336 | ||||||||||
The table below presents the transfers in and out of the three valuation levels for the Fund as of the end of the reporting period when compared to the valuation levels as of the end of the previous fiscal year. Changes in valuation inputs or methodologies may result in transfers into or out of an assigned level within the fair value hierarchy. Transfers in or out of levels are generally due to the availability of publicly available information and to the significance or extent the Adviser determines that the valuation inputs or methodologies may impact the valuation of those securities.
| Level 1 | Level 2 | Level 3 | ||||||||||||||||||||||
| Transfers In | (Transfers Out) | Transfers In | (Transfers Out) | Transfers In | (Transfers Out) | |||||||||||||||||||
Convertible Preferred Securities | $ | 2,243,241 | $ | — | $ | — | $ | (2,243,241 | ) | $ | — | $ | — | |||||||||||
$25 Par (or similar) Retail Preferred | 2,954,492 | — | — | (2,954,492 | ) | — | — | |||||||||||||||||
The Board is responsible for the valuation process and has appointed the oversight of the daily valuation process to the Adviser’s Valuation Committee. The Valuation Committee, pursuant to the valuation policies and procedures adopted by the Board, is responsible for making fair value determinations, evaluating the effectiveness of the Fund’s pricing policies and reporting to the Board. The Valuation Committee is aided in its efforts by the Adviser’s dedicated Securities Valuation Team, which is responsible for administering the daily valuation process and applying fair value methodologies as approved by the Valuation Committee. When determining the reliability of independent pricing services for investments owned by the Fund, the Valuation Committee, among other things, conducts due diligence reviews of the pricing services and monitors the quality of security prices received through various testing reports conducted by the Securities Valuation Team.
The Valuation Committee will consider pricing methodologies it deems relevant and appropriate when making a fair value determination, based on the facts and circumstances specific to the portfolio instrument. Fair value determinations generally will be derived as follows, using public or private market information:
| (i) | If available, fair value determinations shall be derived by extrapolating from recent transactions or quoted prices for identical or comparable securities. |
| (ii) | If such information is not available, an analytical valuation methodology may be used based on other available information including, but not limited to: analyst appraisals, research reports, corporate action information, issuer financial statements and shelf registration statements. Such analytical valuation methodologies may include, but are not limited to: multiple of earnings, discount from market value of a similar freely-traded security, discounted cash flow analysis, book value or a multiple thereof, risk premium/yield analysis, yield to maturity and/or fundamental investment analysis. |
The purchase price of a portfolio instrument will be used to fair value the instrument only if no other valuation methodology is available or deemed appropriate, and it is determined that the purchase price fairly reflects the instrument’s current value.
For each portfolio security that has been fair valued pursuant to the policies adopted by the Board, the fair value price is compared against the last available and next available market quotations. The Valuation Committee reviews the results of such testing and fair valuation occurrences are reported to the Board.
| NUVEEN | 35 |
Notes to Financial Statements (Unaudited) (continued)
3. Portfolio Securities and Investments in Derivatives
Portfolio Securities
Foreign Currency Transactions
To the extent that the Fund may invest in securities and/or contracts that are denominated in a currency other than U.S. dollars, the Fund will be subject to currency risk, which is the risk that an increase in the U.S. dollar relative to the foreign currency will reduce returns or portfolio value. Generally, when the U.S. dollar rises in value against a foreign currency, the Fund’s investments denominated in that currency will lose value because its currency is worth fewer U.S. dollars; the opposite effect occurs if the U.S. dollar falls in relative value. Investments and other assets and liabilities denominated in foreign currencies are converted into U.S. dollars on a spot (i.e. cash) basis at the spot rate prevailing in the foreign currency exchange market at the time of valuation. Purchases and sales of investments and income denominated in foreign currencies are translated into U.S. dollars on the respective dates of such transactions.
As of the end of the reporting period, the Fund’s investments in non-U.S. securities were as follows:
| Value | % of Total Investments | |||||||
Country: | ||||||||
Canada | $ | 53,691,123 | 11.7 | % | ||||
Australia | 23,281,968 | 5.1 | ||||||
United Kingdom | 18,346,452 | 4.0 | ||||||
Singapore | 16,585,720 | 3.6 | ||||||
Hong Kong | 9,575,168 | 2.1 | ||||||
Spain | 7,747,890 | 1.7 | ||||||
Other | 44,166,649 | 9.6 | ||||||
Total non-U.S. Securities | $ | 173,394,970 | 37.8 | % | ||||
The books and records of the Fund are maintained in U.S. dollars. Foreign currencies, assets and liabilities are translated into U.S. dollars at 4:00 p.m. Eastern Time. Investment transactions, income and expenses are translated on the respective dates of such transactions. Net realized foreign currency gains and losses resulting from changes in exchange rates include foreign currency gains and losses between trade date and settlement date of the transactions, foreign currency transactions and the difference between the amounts of interest and dividends recorded on the books of the Fund and the amounts actually received.
The realized gains and losses resulting from changes in foreign currency exchange rates and changes in foreign exchange rates associated with (i) foreign currency, (ii) investments, (iii) investments in derivatives and (iv) other assets and liabilities are recognized as a component of “Net realized gain (loss) from investments and foreign currency” on the Statement of Operations, when applicable.
The unrealized gains and losses resulting from changes in foreign currency exchange rates and changes in foreign exchange rates associated with (i) investments and (ii) other assets and liabilities are recognized as a component of “Change in net unrealized appreciation (depreciation) of investments and foreign currency” on the Statement of Operations, when applicable. The unrealized gains and losses resulting from changes in foreign exchange rates associated with investments in derivatives are recognized as a component of the respective derivative’s related “Change in net unrealized appreciation (depreciation)” on the Statement of Operations, when applicable.
Whole Loans
Whole loans and participating mortgages may bear a greater risk of loss arising from a default on the part of the borrower of the underlying loans than do traditional mortgage-backed securities. This is because whole loans and participating mortgages, unlike most mortgage-backed securities, generally are not backed by any government guarantee or private credit enhancement. Such risk may be greater during a period of declining or stagnant real estate values.
The Funds may invest in single family, multi-family and commercial loans. A participating loan is a whole loan that contains provisions for the lender to participate in the income stream provided by the property, including net cash flow and capital proceeds. An outstanding participating loan agreement may provide excess cash flows and certain appreciation rights after the mortgage obligation has been fully paid and before the sale of the property to a third party.
On occasion real estate property may be acquired through foreclosure or deed in lieu of foreclosure on whole loans or similar obligations. The Fund may incur costs and delays or loss in the collection of principal and/or interest to which it is entitled in the event of such foreclosure. Also there is no assurance that the subsequent sale of the foreclosed property will produce an amount equal to the sum of the unpaid principal balance of the loan as of the date the borrower went into default, the accrued unpaid interest, and all of the foreclosure expenses. In such case, the Fund may suffer a loss.
| 36 | NUVEEN |
The Fund may also receive rental or other income as a result of holding real estate. This income would generally fail to meet the test for “qualifying income” set forth in Section 851 of the Internal Revenue Code and could result in adverse tax consequences to the Fund. In addition; the Fund may incur expenses associated with maintaining or improving any real estate owned. When such events occur, real estate income is recognized on a net basis on the Statement of Operations and capital improvements are recorded as an addition to the cost basis of the property, which will increase any loss at sale.
As of the end of the reporting period, the Fund did not own any real estate property.
The delinquency loan profile as to the timely payment of principal and interest of the whole loans in which the Fund was invested as of the end of the reporting period is as follows:
| Current | 30 Days | 60 Days | 90 Days | 120+ Days | Total | |||||||||||||||||||||||||||||||||||||||||||
| Whole Loan Category | Value | %* | Value | %* | Value | %* | Value | %* | Value | %* | Value | % | ||||||||||||||||||||||||||||||||||||
Multi-family loans | $ | 7,588,098 | 75.3 | % | $ | — | — | % | $ | — | — | % | $ | — | — | % | $ | 2,493,685 | 24.7 | % | $ | 10,081,783 | 100 | % | ||||||||||||||||||||||||
Commercial loans | 3,761,838 | 32.7 | — | — | 4,046,315 | 35.2 | — | — | 3,690,400 | 32.1 | 11,498,553 | 100 | ||||||||||||||||||||||||||||||||||||
| * | As a of percentage of the total value of the whole loan category as of the end of the reporting period. |
Repurchase Agreements
In connection with transactions in repurchase agreements, it is the Fund’s policy that its custodian take possession of the underlying collateral securities, the fair value of which exceeds the principal amount of the repurchase transaction, including accrued interest, at all times. If the counterparty defaults, and the fair value of the collateral declines, realization of the collateral may be delayed or limited.
The following table presents the repurchase agreements for the Fund that are subject to netting agreements as of the end of the reporting period, and the collateral delivered related to those repurchase agreements.
| Counterparty | Short-Term Investments, at Value | Collateral Pledged (From) Counterparty* | Net Exposure | |||||||||
Fixed Income Clearing Corporation | $ | 6,840,493 | $ | (6,840,493 | ) | $ | — | |||||
| * | As of the end of the reporting period, the value of the collateral pledged from the counterparty exceeded the value of the repurchase agreements. Refer to the Fund’s Portfolio of Investments for details on the repurchase agreements. |
Zero Coupon Securities
A zero coupon security does not pay a regular interest coupon to its holders during the life of the security. Income to the holder of the security comes from accretion of the difference between the original purchase price of the security at issuance and the par value of the security at maturity and is effectively paid at maturity. The market prices of zero coupon securities generally are more volatile than the market prices of securities that pay interest periodically.
Investments in Derivatives
The Fund is authorized to invest in certain derivative instruments, such as futures, options and swap contracts. The Fund limits its investments in futures, options on futures and swap contracts to the extent necessary for the Adviser to claim the exclusion from registration by the Commodity Futures Trading Commission as a commodity pool operator with respect to the Fund. The Fund records derivative instruments at fair value, with changes in fair value recognized on the Statement of Operations, when applicable. Even though the Fund’s investments in derivatives may represent economic hedges, they are not considered to be hedge transactions for financial reporting purposes.
Futures Contracts
Upon execution of a futures contract, the Fund is obligated to deposit cash or eligible securities, also known as “initial margin,” into an account at its clearing broker equal to a specified percentage of the contract amount. Cash held by the broker to cover initial margin requirements on open futures contracts, if any, is recognized as “Cash collateral at brokers” on the Statement of Assets and Liabilities. Investments in futures contracts obligate the Fund and the clearing broker to settle monies on a daily basis representing changes in the prior days “mark-to-market” of the open contracts. If the Fund has unrealized appreciation the clearing broker would credit the Fund’s account with an amount equal to appreciation and conversely if the Fund has unrealized depreciation the clearing broker would debit the Fund’s account with an amount equal to depreciation. These daily cash settlements are also known as “variation margin.” Variation margin is recognized as a receivable and/or payable for “Variation margin on futures contracts” on the Statement of Assets and Liabilities.
During the period the futures contract is open, changes in the value of the contract are recognized as an unrealized gain or loss by “marking-to-market” on a daily basis to reflect the changes in market value of the contract, which is recognized as a component of “Change in net unrealized appreciation (depreciation) of futures contracts” on the Statement of Operations. When the contract is closed or expired, the Fund records a realized gain or loss equal
| NUVEEN | 37 |
Notes to Financial Statements (Unaudited) (continued)
to the difference between the value of the contract on the closing date and value of the contract when originally entered into, which is recognized as a component of “Net realized gain (loss) from futures contracts” on the Statement of Operations.
Risks of investments in futures contracts include the possible adverse movement in the price of the securities or indices underlying the contracts, the possibility that there may not be a liquid secondary market for the contracts and/or that a change in the value of the contract may not correlate with a change in the value of the underlying securities or indices.
During the current fiscal period, the Fund shorted U.S. Treasury futures contracts to hedge against potential increases in interest rates.
The average notional amount of futures contracts outstanding during the current fiscal period was as follows:
Average notional amount of futures contracts outstanding* | $ | 5,221,917 |
| * | The average notional amount is calculated based on the absolute aggregate notional amount of contracts outstanding at the beginning of the fiscal period and at the end of each fiscal quarter within the current fiscal period. |
The following table presents the fair value of all futures contracts held by the Fund as of the end of the reporting period, the location of these instruments on the Statement of Assets and Liabilities and the primary underlying risk exposure.
Location on the Statement of Assets and Liabilities | ||||||||||||||||||
Underlying Risk Exposure | Derivative Instrument | Asset Derivatives | (Liability) Derivatives | |||||||||||||||
| Location | Value | Location | Value | |||||||||||||||
| Interest rate | Futures contracts | Receivable for variation margin on futures contracts* | $ | 11,378 | — | $ | — | |||||||||||
| * | Value represents unrealized appreciation (depreciation) of futures contracts as reported in the Fund’s Portfolio of Investments and not the asset and/or liability derivative location as described in the table above. |
The following table presents the amount of net realized gain (loss) and change in net unrealized appreciation (depreciation) recognized on futures contracts on the Statement of Operations during the current fiscal period, and the primary underlying risk exposure.
| Underlying Risk Exposure | Derivative Instrument | Net Realized Gain (Loss) from Futures Contracts | Change in Net Unrealized Appreciation (Depreciation) of Futures Contracts | |||||||
| Interest rate | Futures contracts | $ | 183,632 | $ | 11,378 | |||||
Total Return Swap Contracts
Total return swap contracts involve commitments to pay interest in exchange for a market-linked return, both based on specified notional amounts. To the extent the total return of the security or index underlying the transaction exceeds or falls short of offsetting the interest rate obligation, a Fund will receive a payment from or make a payment to the counterparty.
Total return swap contracts are valued daily. A Fund accrues daily the periodic payments expected to be paid and received on each swap contract and recognizes the daily change in the market value of the Fund’s contractual rights and obligations under the contracts. For an over-the-counter (“OTC”) swap that is not cleared through a clearing house (“OTC Uncleared”), the net amount recorded on these transactions, for each counterparty, is recognized on the Statement of Assets and Liabilities as a component of “Unrealized appreciation or depreciation on total return swaps (,net)”.
Upon the execution of an OTC swap cleared through a clearing house (“OTC Cleared”), the Fund is obligated to deposit cash or eligible securities, also known as “initial margin,” into an account at its clearing broker equal to a specified percentage of the contract amount. Cash deposited by the Fund to cover initial margin requirements on open swap contracts, if any, is recognized as a component of “Cash collateral at brokers” on the Statement of Assets and Liabilities. Investments in OTC Cleared swaps obligate the Fund and the clearing broker to settle monies on a daily basis representing changes in the prior day’s “mark-to-market” of the swap contract. If the Fund has unrealized appreciation, the clearing broker will credit the Fund’s account with an amount equal to the appreciation. Conversely, if the Fund has unrealized depreciation, the clearing broker will debit the Fund’s account with an amount equal to the depreciation. These daily cash settlements are also known as “variation margin.” Variation margin for OTC Cleared swaps is recognized as a receivable and/or payable for “Variation margin on swap contracts” on the Statement of Assets and Liabilities. Upon the execution of an OTC Uncleared swap, neither the Fund nor the counterparty is required to deposit initial margin as the trades are recorded bilaterally between both parties to the swap contract, and the terms of the variation margin are subject to a predetermined threshold negotiated by the Fund and the counterparty. Variation margin for OTC Uncleared swaps is recognized as a component of “Unrealized appreciation or depreciation on total return swaps (, net)” as described in the preceding paragraph.
The net amount of periodic payments settled in cash are recognized as a component of “Net realized gain (loss) from swaps” on the Statement of Operations, in addition to the net realized gain or loss recorded upon the termination of the swap contract. For tax purposes, payments expected to be received or paid on the swap contracts are treated as ordinary income or expense, respectively. Changes in the value of the swap contracts during the
| 38 | NUVEEN |
fiscal period are recognized as a component of “Change in net unrealized appreciation (depreciation) of swaps” on the Statement of Operations. In certain instances, payments are made or received upon entering into the swap contract to compensate for differences between the stated terms of the swap agreements and prevailing market conditions (credit spreads, currency exchange rates, interest rates, and other relevant factors). Payments received or made at the beginning of the measurement period, if any, are recognized as “Total return swaps premiums paid and/or received” on the Statement of Assets and Liabilities.
During the current fiscal period, the Fund utilized total return swaps with the objective of increasing income in the Fund. The Fund added five total return swaps for approximately $35 million using exchange traded funds (ETFs) that align as closely as possible with the five sectors of the real asset income portion of the portfolio.
Average notional amount of total return swap contracts outstanding* | $ | 23,416,752 |
| * | The average notional amount is calculated based on the outstanding notional at the beginning of the fiscal period and at the end of each fiscal quarter within the current fiscal period. |
The following table presents the fair value of all swap contracts held by the Funds as of the end of the reporting period, the location of these instruments on the Statement of Assets and Liabilities and the primary underlying risk exposure.
Location on the Statement of Assets and Liabilities | ||||||||||||||||||
| Underlying Risk Exposure | Derivative Instrument | Asset Derivatives | (Liability) Derivatives | |||||||||||||||
| Location | Value | Location | Value | |||||||||||||||
Equity price | Swaps (OTC Uncleared) | Unrealized depreciation on total return swaps, net | $ | 91,313 | — | $ | — | |||||||||||
Equity price | Swaps (OTC Uncleared) | Unrealized depreciation on total return swaps, net | (859,624 | ) | — | — | ||||||||||||
| Total | $ | (768,311 | ) | $ — | ||||||||||||||
The following table presents the swap contracts subject to netting agreements and the collateral delivered related to those swap contracts as of end of the reporting period.
| Counterparty | Gross Swaps** | Gross Swaps** | Amounts Netted on Statement of Assets and Liabilities | Net Swaps | Collateral Pledged to (from) Counterparty | Net Exposure | ||||||||||||||||
| Morgan Stanley Capital Services LLC | $91,313 | $ | (859,624 | ) | $ | 91,313 | $ | (768,311 | ) | $ | 317,440 | $ | (450,871 | ) | ||||||||
| ** | Represents gross unrealized appreciation (depreciation) for the counterparty as reported in the Fund’s Portfolio of Investments. |
The following table presents the amount of net realized gain (loss) and change in net unrealized appreciation (depreciation) recognized on swap contracts on the Statement of Operations during the current fiscal period, and the primary underlying risk exposure.
Underlying Risk Exposure | Derivative Instrument | Net Realized Swaps | Change in Net Swaps | |||||
Equity price | Swaps | $(516,036) | $ | (768,311 | ) | |||
Market and Counterparty Credit Risk
In the normal course of business the Fund may invest in financial instruments and enter into financial transactions where risk of potential loss exists due to changes in the market (market risk) or failure of the other party to the transaction to perform (counterparty credit risk). The potential loss could exceed the value of the financial assets recorded on the financial statements. Financial assets, which potentially expose the Fund to counterparty credit risk, consist principally of cash due from counterparties on forward, option and swap transactions, when applicable. The extent of the Fund’s exposure to counterparty credit risk in respect to these financial assets approximates its carrying value as recorded on the Statement of Assets and Liabilities.
The Fund helps manage counterparty credit risk by entering into agreements only with counterparties the Adviser believes have the financial resources to honor their obligations and by having the Adviser monitor the financial stability of the counterparties. Additionally, counterparties may be required to pledge collateral daily (based on the daily valuation of the financial asset) on behalf of the Fund with a value approximately equal to the amount of any
| NUVEEN | 39 |
Notes to Financial Statements (Unaudited) (continued)
unrealized gain above a pre-determined threshold. Reciprocally, when the Fund has an unrealized loss, the Fund has instructed the custodian to pledge assets of the Fund as collateral with a value approximately equal to the amount of the unrealized loss above a pre-determined threshold. Collateral pledges are monitored and subsequently adjusted if and when the valuations fluctuate, either up or down, by at least the pre-determined threshold amount.
4. Fund Shares
Share Repurchase Program
The Board has authorized the Fund to participate in Nuveen’s closed-end fund complex-wide share repurchase program. Under the share repurchase program, the Fund may repurchase up to 10% of its outstanding shares as of the authorization date (approximately 1,790,000 shares) in open-market transactions at the Adviser’s discretion.
Tender Offers
The Board had authorized the Fund to conduct a series of up to three tender offers pursuant to which the Fund would offer to purchase up to 10% of its then outstanding shares for cash on a pro rata basis at a price per share equal to 99% of the NAV per share as determined as of the close of regular trading on the NYSE on the expiration date of the tender offer.
On September 23, 2014, Nuveen announced the Fund’s first tender offer, which commenced on October 3, 2014 and expired on November 7, 2014. The tender offer was oversubscribed (66% of outstanding shares were tendered), and therefore the Fund purchased 10% of its outstanding shares from participating shareholders on a pro-rata basis based on the number of shares properly tendered.
On March 24, 2015, Nuveen announced the Fund’s second tender offer, which commenced on April 6, 2015 and expired on May 8, 2015. The tender offer was oversubscribed (59% of outstanding shares were tendered), and therefore the Fund purchased 10% of its outstanding shares from participating shareholders on a pro-rata basis based on the number of shares properly tendered.
On October 22, 2015, Nuveen announced the Fund’s third and final tender offer, which commenced on November 2, 2015 and expired on December 1, 2015. The tender offer was oversubscribed (55% of outstanding shares were tendered), and therefore the Fund purchased 10% of its outstanding shares from participating shareholders on a pro-rata basis based on the number of shares properly tendered.
The final results of each tender offer are as shown in the accompanying table.
| November 7, 2014 Expiration | May 8, 2015 Expiration | December 1, 2015 Expiration | ||||||||||
Number of shares outstanding before tender offer | 25,344,382 | 22,683,944 | 20,241,550 | |||||||||
Number of shares authorized for tender offer | 2,534,438 | 2,268,394 | 2,024,155 | |||||||||
Purchase price (99% of share NAV on expiration date) | $19.8695 | $19.9754 | $18.1494 | |||||||||
Number of shares outstanding after tender offer | 22,809,944 | 20,415,550 | 18,217,395 | |||||||||
Share Transactions
Transactions in shares (excluding shares owned by the Adviser) during the current and prior fiscal periods were as follows:
| Six Months Ended 11/30/16 | Year Ended 5/31/16 | |||||||
Shares:* | ||||||||
Repurchased and retired (open market purchases) | (59,500 | ) | (496,500 | ) | ||||
Repurchased and retired through tender offer December 1, 2015 expiration | — | (2,024,155 | ) | |||||
Total | (59,500 | ) | (2,520,655 | ) | ||||
Open market purchases: | ||||||||
Weighted average price per share | $ | 16.10 | $ | 15.41 | ||||
Weighted average discount per share | 15.30 | % | 14.63 | % | ||||
| * | As of November 30, 2016 and May 31, 2016, the Adviser and Sub-Adviser each owned one share of the Fund. |
Tender Offers: | ||||
Expiration | December 1, 2015 | |||
Purchase price per share | $18.1494 | |||
Discount per share | 1.00 | % |
| 40 | NUVEEN |
5. Investment Transactions
Long-term purchases and sales (including maturities but excluding derivative transactions) during the current fiscal period aggregated $233,248,044 and $222,285,909, respectively.
6. Income Tax Information
The Fund intends to distribute substantially all of its investment company taxable income to shareholders and to otherwise comply with the requirements of Subchapter M of the Internal Revenue Code applicable to regulated investment companies. In any year when the Fund realizes net capital gains, the Fund may choose to distribute all or a portion of its net capital gains to shareholders, or alternatively, to retain all or a portion of its net capital gains and pay federal corporate income taxes on such retained gains.
For all open tax years and all major taxing jurisdictions, management of the Fund has concluded that there are no significant uncertain tax positions that would require recognition in the financial statements. Open tax years are those that are open for examination by taxing authorities (i.e., generally the last four tax year ends and the interim tax period since then). Furthermore, management of the Fund is also not aware of any tax positions for which it is reasonably possible that the total amounts of unrecognized tax benefits will significantly change in the next twelve months.
The following information is presented on an income tax basis. Differences between amounts for financial statement and federal income tax purposes are primarily due to timing differences in recognizing certain gains and losses on investment transactions. To the extent that differences arise that are permanent in nature, such amounts are reclassified within the capital accounts as detailed below. Temporary differences do not require reclassification. Temporary and permanent differences do not impact the NAV of the Fund.
As of November 30, 2016, the cost and unrealized appreciation (depreciation) of investments (excluding investments in derivatives), as determined on a federal income tax basis, were as follows:
Cost of investments | $ | 495,546,588 | ||
Gross unrealized: | ||||
Appreciation | $ | 13,323,852 | ||
Depreciation | (50,106,151 | ) | ||
Net unrealized appreciation (depreciation) of investments | $ | (36,782,299 | ) |
Permanent differences, primarily due to federal taxes paid, bond premium amortization adjustments, complex securities character adjustments, foreign currency transactions, investments in partnerships, investments in passive foreign investment companies, paydowns and nondeductible offering costs, resulted in reclassifications among the Fund’s components of net assets as of May 31, 2016, the Fund’s last tax year end, as follows:
Paid-in surplus | $(188,498) | |||
Undistributed (Over-distribution of) net investment income | (618,453 | ) | ||
Accumulated net realized gain (loss) | 806,951 | |||
| The tax components of undistributed net ordinary income and net long-term capital gains as of May 31, 2016, the Fund’s last tax year end, were as follows: | ||||
Undistributed net ordinary income1 | $ | 3,250,647 | ||
Undistributed net long-term capital gains | — | |||
1 Net ordinary income consists of net taxable income derived from dividends, interests, and net short-term capital gains, if any. Undistributed net ordinary income (on a tax basis) has not been reduced for the dividend declared on May 11, 2016 and paid on June 1, 2016. |
| |||
| The tax character of distributions paid during the Fund’s last tax year ended May 31, 2016, was designated for purposes of the dividends paid deduction as follows: | ||||
Distributions from net ordinary income2 | $ | 32,196,361 | ||
Distributions from net long-term capital gains | — | |||
2 Net ordinary income consists of net taxable income derived from dividends, interest and current year earnings and profits attributable to short-term realized gains. |
| |||
As of May 31, 2016, the Fund’s last tax year end, the Fund had unused capital loss carryforwards available for federal income tax purposes to be applied against future capital gains, if any. If not applied, the carryforwards will expire as shown in the following table.
Capital losses to be carried forward – not subject to expiration | $80,413,610 |
A portion of the Fund’s capital loss carryforwards are subject to an annual limitation under the Internal Revenue Code and related regulations.
| NUVEEN | 41 |
Notes to Financial Statements (Unaudited) (continued)
7. Management Fees and Other Transactions with Affiliates
Management Fees
The Fund’s management fee compensates the Adviser for overall investment advisory and administrative services and general office facilities. The Sub-Adviser is compensated for its services to the Fund from the management fees paid to the Adviser.
The Fund’s management fee consists of two components – a fund-level fee, based only on the amount of assets within the Fund, and a complex-level fee, based on the aggregate amount of all eligible fund assets managed by the Adviser. This pricing structure enables Fund shareholders to benefit from growth in the assets within the Fund as well as from growth in the amount of complex-wide assets managed by the Adviser.
The annual Fund-level fee, payable monthly, is calculated according to the following schedule:
| Average Daily Managed Assets* | Fund-Level Fee | |||
For the first $125 million | 0.8000 | % | ||
For the next $125 million | 0.7875 | |||
For the next $250 million | 0.7750 | |||
For the next $500 million | 0.7625 | |||
For managed assets over $1 billion | 0.7500 | |||
The annual complex-level fee, payable monthly, is calculated by multiplying the current complex-wide fee rate, determined according to the following schedule by the Fund’s daily managed assets:
| Complex-Level Managed Asset Breakpoint Level* | Effective Rate at Breakpoint Level | |||
$55 billion | 0.2000 | % | ||
$56 billion | 0.1996 | |||
$57 billion | 0.1989 | |||
$60 billion | 0.1961 | |||
$63 billion | 0.1931 | |||
$66 billion | 0.1900 | |||
$71 billion | 0.1851 | |||
$76 billion | 0.1806 | |||
$80 billion | 0.1773 | |||
$91 billion | 0.1691 | |||
$125 billion | 0.1599 | |||
$200 billion | 0.1505 | |||
$250 billion | 0.1469 | |||
$300 billion | 0.1445 | |||
| * | For the complex-level fees, managed assets include closed-end fund assets managed by the Adviser that are attributable to certain types of leverage. For these purposes, leverage includes the funds’ use of preferred stock and borrowings and certain investments in the residual interest certificates (also called inverse floating rate securities) in tender option bond (TOB) trusts, including the portion of assets held by a TOB trust that has been effectively financed by the trust’s issuance of floating rate securities, subject to an agreement by the Adviser as to certain funds to limit the amount of such assets for determining managed assets in certain circumstances. The complex-level fee is calculated based upon the aggregate daily managed assets of all Nuveen funds that constitute “eligible assets.” Eligible assets do not include assets attributable to investments in other Nuveen funds or assets in excess of a determined amount (originally $2 billion) added to the Nuveen fund complex in connection with the Adviser’s assumption of the management of the former First American Funds effective January 1, 2011. As of November 30, 2016, the complex-level fee for the Fund was 0.1621%. |
The Adviser has agreed to waive fees and/or reimburse expenses of the Fund through September 8, 2016, so that total annual Fund operating expenses, after fee waivers and/or expense reimbursements and excluding any costs of leverage and expenses related to the Fund’s tender offers, do not exceed 1.02% of the Fund’s average net assets.
Other Transactions with Affiliates
The Fund pays no compensation directly to those of its trustees who are affiliated with the Adviser or to its officers, all of whom receive remuneration for their services to the Fund from the Adviser or its affiliates.
8. Borrowing Arrangements
The Fund has previously entered into a borrowing arrangement as a means of leverage.
During the current fiscal period, the Fund sourced its leverage from a bank through a 364-day combined $122,000,000 (maximum commitment amount) Term Loan and a $38,000,000 (maximum commitment amount) Revolving Line of Credit, (collectively, the “Borrowings”). As of the end of the reporting period, the outstanding balance on these Borrowings was $137,500,000.
| 42 | NUVEEN |
Interest is charged on the Term Loan and the Revolving Line of Credit at a rate per annum equal to three-month LIBOR plus 0.65% and either one-month LIBOR or three-month LIBOR plus 0.65%, respectively. In addition to interest, the Fund also accrues a 0.125% per annum commitment fee on the undrawn portion of the Borrowings. During the current fiscal period, the average daily balance outstanding and average annual interest rate on these Borrowings were $136,503,279 and 1.40%, respectively.
In order to maintain these Borrowings, the Fund must meet certain collateral, asset coverage and other requirements. Borrowings outstanding are fully secured by assets held in the Fund’s portfolio of investments.
Borrowings outstanding are recognized as “Borrowings” on the Statement of Assets and Liabilities. Interest expense and other fees incurred on the drawn amount and undrawn balance are recognized as a component of “Interest expense on borrowings” on the Statement of Operations.
9. Subsequent Events
Borrowing Arrangements
On December 18, 2016, the Fund renewed its Borrowings through December 18, 2017. In conjunction with this renewal the Fund terminated the Term Loan and increased its Line of Credit to $152,000,000. All other terms remained unchanged.
| NUVEEN | 43 |
Fund Information
| Board of Trustees* | ||||||
| Roger A. Gibson | Leonard W. Kedrowski** | Richard K. Riederer | James M. Wade |
| * | The Fund’s Board of Trustees is comprised entirely of independent trustees. |
| ** | Chairman of the Board of Trustees |
Fund Manager Nuveen Fund Advisors, LLC 333 West Wacker Drive Chicago, IL 60606 | Custodians State Street Bank Boston, MA 02111
U.S. Bank National Association 1555 North RiverCenter Drive Suite 302 Milwaukee, WI 53202 | Legal Counsel Ropes & Gray LLP Chicago, IL 60606 | Independent Registered PricewaterhouseCoopers LLP One North Wacker Drive Chicago, IL 60606 | Transfer Agent and State Street Bank Nuveen Funds P.O. Box 43071 Providence, (800) 257-8787 | ||||
Quarterly Form N-Q Portfolio of Investments Information
The Fund is required to file its complete schedule of portfolio holdings with the Securities and Exchange Commission (SEC) for the first and third quarters of each fiscal year on Form N-Q. You may obtain this information directly from the SEC. Visit the SEC on-line at http://www.sec.gov or in person at the SEC’s Public Reference Room in Washington, D.C. Call the SEC toll-free at (800) SEC-0330 for room hours and operation.
Nuveen Funds’ Proxy Voting Information
You may obtain (i) information regarding how each fund voted proxies relating to portfolio securities held during the most recent twelve-month period ended June 30, without charge, upon request, by calling Nuveen toll-free at (800) 257-8787 or on Nuveen’s website at www.nuveen.com and (ii) a description of the policies and procedures that each fund used to determine how to vote proxies relating to portfolio securities without charge, upon request, by calling Nuveen toll free at (800) 257-8787. You may also obtain this information directly from the SEC. Visit the SEC on-line at http://www.sec.gov.
CEO Certification Disclosure
The Fund’s Chief Executive Officer (CEO) has submitted to the New York Stock Exchange (NYSE) the annual CEO certification as required by Section 303A.12(a) of the NYSE Listed Company Manual. The Fund has filed with the SEC the certification of its CEO and Chief Financial Officer required by Section 302 of the Sarbanes-Oxley Act.
Share Repurchases
The Fund intends to repurchase, through its open-market share repurchase program, shares of its own common shares of beneficial interest at such times and in such amounts as is deemed advisable. During the period covered by this report, the Fund repurchased shares of its common shares of beneficial interest (excluding common shares that may have been purchased through a tender offer), as shown in the accompanying table. Any future repurchases will be reported to shareholders in the next annual or semi-annual report.
| DRA | ||||
Shares repurchased | 59,500 | |||
FINRA BrokerCheck
The Financial Industry Regulatory Authority (FINRA) provides information regarding the disciplinary history of FINRA member firms and associated investment professionals. This information as well as an investor brochure describing FINRA BrokerCheck is available to the public by calling the FINRA BrokerCheck Hotline number at (800) 289-9999 or by visiting www.FlNRA.org.
| 44 | NUVEEN |
Used in this Report
| ∎ | Average Annual Total Return: This is a commonly used method to express an investment’s performance over a particular, usually multi-year time period. It expresses the return that would have been necessary each year to equal the investment’s actual cumulative performance (including change in NAV or market price and reinvested dividends and capital gains distributions, if any) over the time period being considered. |
| ∎ | Custom Blended Index (Old Comparative Benchmark): A five index blend comprised of weightings approximating the Fund’s proposed portfolio. The Fund’s proposed portfolio may differ significantly from the blended portfolio and actual returns may be substantially lower. Benchmark returns do not include the effects of any sales charges or management fees. |
| Weighting Percentage | Index | Definition | ||
| 33% | S&P Global Infrastructure Index | An unmanaged index comprised of 75 of the largest publicly listed infrastructure companies that meet specific investability requirements. | ||
| 20% | BofA/Merrill Lynch REIT Preferred Index | An unmanaged index of investment grade REIT preferred shares with a deal size in excess of $100 million, weighted by capitalization and considered representative of investment grade preferred real estate stock performance. | ||
| 20% | Bloomberg Barclays U.S. Corporate High Yield Bond Index | An index that covers the U.S. dollar-denominated, non-investment grade, fixed-rate, taxable corporate bond market. | ||
| 15% | MSCI U.S. RElT Index | A free float-adjusted market capitalization weighted index that is comprised of equity REITs that are included in the MSCI U.S. Investable Market 2500 Index, with the exception of specialty equity RElTs that do not generate a majority of their revenue and income from real estate rental and leasing operations. This index represents approximately 85% of the U.S. REIT universe. | ||
| 12% | BofA/Merrill Lynch Fixed Rate Preferred Securities Index | Tracks the performance of fixed-rate U.S. dollar denominated preferred securities issued in the U.S. domestic market. Qualifying securities must be rated investment-grade (based on an average of Moody’s, S&P and Fitch) and must have an investment grade rated country of risk (based on an average of Moody’s, S&P and Fitch foreign currency long-term sovereign debt ratings). |
| ∎ | Custom Blended Index (New Comparative Benchmark effective December 31, 2015): A five index blend comprised of weightings approximating the Fund’s proposed portfolio. The Fund’s proposed portfolio may differ significantly from the blended portfolio and actual returns may be substantially lower. Benchmark returns do not include the effects of any sales charges or management fees. |
| Weighting Percentage | Index | Definition | ||
| 28% | S&P Global Infrastructure Index | An unmanaged index comprised of 75 of the largest publicly listed infrastructure companies that meet specific investability requirements. | ||
| 21% | Financial Times Stock Exchange - European Public Real Estate Association/National Association of Real Estate Investments Trust (FTSE EPRA/NAREIT) Developed Index | An index designed to track the performance of listed real estate companies and REITs worldwide. | ||
| 18% | Wells Fargo Hybrid & Preferred Securities REIT Index | An Index designed to track the performance of preferred securities issued in the U.S. market by real estate investment trusts (REITs). The index is composed exclusively of preferred shares and depositary shares. | ||
| 15% | Bloomberg Barclays Global Capital Securities Index | An index that tracks fixed-rate, investment grade capital securities denominated in USD, EUR and GBP. | ||
| 18% | Bloomberg Barclays U.S. Corporate High Yield Bond Index | An index that covers the U.S. dollar-denominated, non-investment grade, fixed-rate, taxable corporate bond market. |
| NUVEEN | 45 |
Glossary of Terms Used in this Report (continued)
| ∎ | Effective Leverage: Effective leverage is a fund’s effective economic leverage, and includes both regulatory leverage (see below) and the leverage effects of certain derivative investments in the fund’s portfolio. |
| ∎ | Leverage: Leverage is created whenever a fund has investment exposure (both reward and/or risk) equivalent to more than 100% of the investment capital. |
| ∎ | Morgan Stanley Capital International (MSCI) World Index: A free-float adjusted market capitalization-weighted index that is designed to measure equity market performance of developed markets. Index returns assume reinvestment of distributions, but do not include the effects of any applicable sales charges or management fees. |
| ∎ | Net Asset Value (NAV) Per Share: A fund’s Net Assets is equal to its total assets (securities, cash, accrued earnings and receivables) less its total liabilities. NAV per share is equal to the fund’s Net Assets divided by its number of shares outstanding. |
| ∎ | Regulatory Leverage: Regulatory leverage consists of preferred shares issued by or borrowings of a fund. Both of these are part of a fund’s capital structure. Regulatory leverage is subject to asset coverage limits set in the Investment Company Act of 1940. |
| 46 | NUVEEN |
Easily and Conveniently
Nuveen makes reinvesting easy. A phone call is all it takes to set up your reinvestment account.
Nuveen Closed-End Funds Automatic Reinvestment Plan
Your Nuveen Closed-End Fund allows you to conveniently reinvest distributions in additional Fund shares.
By choosing to reinvest, you’ll be able to invest money regularly and automatically, and watch your investment grow through the power of compounding. Just like distributions in cash, there may be times when income or capital gains taxes may be payable on distributions that are reinvested.
It is important to note that an automatic reinvestment plan does not ensure a profit, nor does it protect you against loss in a declining market.
Easy and convenient
To make recordkeeping easy and convenient, each quarter you’ll receive a statement showing your total distributions, the date of investment, the shares acquired and the price per share, and the total number of shares you own.
How shares are purchased
The shares you acquire by reinvesting will either be purchased on the open market or newly issued by the Fund. If the shares are trading at or above net asset value at the time of valuation, the Fund will issue new shares at the greater of the net asset value or 95% of the then-current market price. If the shares are trading at less than net asset value, shares for your account will be purchased on the open market. If the Plan Agent begins purchasing Fund shares on the open market while shares are trading below net asset value, but the Fund’s shares subsequently trade at or above their net asset value before the Plan Agent is able to complete its purchases, the Plan Agent may cease open-market purchases and may invest the uninvested portion of the distribution in newly-issued Fund shares at a price equal to the greater of the shares’ net asset value or 95% of the shares’ market value on the last business day immediately prior to the purchase date. Distributions received to purchase shares in the open market will normally be invested shortly after the distribution payment date. No interest will be paid on distributions awaiting reinvestment. Because the market price of the shares may increase before purchases are completed, the average purchase price per share may exceed the market price at the time of valuation, resulting in the acquisition of fewer shares than if the distribution had been paid in shares issued by the Fund. A pro rata portion of any applicable brokerage commissions on open market purchases will be paid by Plan participants. These commissions usually will be lower than those charged on individual transactions.
Flexible
You may change your distribution option or withdraw from the Plan at any time, should your needs or situation change.
You can reinvest whether your shares are registered in your name, or in the name of a brokerage firm, bank, or other nominee. Ask your investment advisor if his or her firm will participate on your behalf. Participants whose shares are registered in the name of one firm may not be able to transfer the shares to another firm and continue to participate in the Plan.
The Fund reserves the right to amend or terminate the Plan at anytime. Although the Fund reserves the right to amend the Plan to include a service charge payable by the participants, there is no direct service charge to participants in the Plan at this time.
Call today to start reinvesting distributions
For more information on the Nuveen Automatic Reinvestment Plan or to enroll in or withdraw from the Plan, speak with your financial advisor or call us at (800) 257-8787.
| NUVEEN | 47 |
Investment Management and Investment Sub-Advisory Agreements
The Fund has entered into an Investment Management Agreement with Nuveen Fund Advisors, LLC (“NFA”) and NFA has entered into an Investment Sub-Advisory Agreement with Nuveen Asset Management, LLC (“NAM” and, collectively with NFA, “Nuveen”) with respect to the Fund (collectively, the “Agreements”).
Each year, the Board of Trustees (the “Board”), which is comprised entirely of independent Trustees, is required to determine whether to approve the terms of the Agreements and the renewal thereof. The Investment Company Act of 1940, as amended, requires that the Board request and evaluate, and that NFA and NAM provide, such information as may be reasonably necessary to evaluate the terms of the Agreements. The Board employs an independent consultant to prepare a report that provides information, including comparative information that the Board requests for that purpose. In addition to in-person meetings focused on this evaluation, the Board receives information throughout the year regarding Fund services, fees, expenses and performance.
At meetings held on May 10, 2016 and June 9, 2016, the Fund’s Board considered information relating to the proposed renewal of the Agreements. In considering the Agreements, the Board, advised by independent legal counsel, requested and received a substantial amount of information from NFA, NAM and the independent consultant on, among other things, the following factors: (i) the nature, quality and extent of NFA and NAM’s services, (ii) the comparative investment performance of the Fund, (iii) the fees and expenses of the Fund, including comparative fee and expense information, (iv) the profitability of NFA and NAM, including an analysis of the cost of providing services, (v) whether economies of scale are realized and whether fee levels reflect these economies of scale for Fund investors and (vi) other benefits to NFA and NAM from their relationship with the Fund. The Board was aware that there are alternatives to retaining NFA and NAM. Outlined below is a summary of the principal information considered by the Board as well as the Board’s conclusions.
Nature, Quality and Extent of Investment Advisory Services
The Board considered information about the nature, quality and extent of the services provided to the Fund under the Agreements. The Board noted that the Investment Management Agreement provides for the supervision of the Fund’s investment program, managing risks and leverage, determining dividends and distributions, providing tax advice and pricing the Fund’s securities. The Board further noted that the Investment Sub-Advisory Agreement provides that NAM makes investment decisions, place purchase and sale orders for portfolio transactions in the Fund and employs professional portfolio managers and securities analysts to provide research services relating to the Fund. The Board also considered that Nuveen is responsible for providing certain corporate administrative functions, including accounting and bookkeeping, supervising all administrative and clerical personnel, compiling and maintaining records with respect to the Fund’s operations, preparing and filing reports with the SEC, and preparing proxy materials and periodic reports to the shareholders. The Board considered the quality of the services provided and the quality of Nuveen’s resources that are available to the Fund. The Board evaluated Nuveen’s administrative, accounting, tax, legal, risk management and compliance services and the size and functions of its staff providing investment management services to the Fund. The Board also noted that it receives and reviews information on these services throughout the year. In this regard, the Board noted that, during the period since the Fund’s inception, Nuveen provided fee concessions to the Fund, and the Board considered those concessions when reviewing the performance and expenses of the Fund.
Investment Performance
The Board noted that the Fund is in the 24th percentile among the funds in the Lipper Sector Equity peer group for the one-year ended March 31, 2016. The Board also considered supplemental performance data provided by NFA and noted that the Fund outperformed its two performance benchmarks during the first quarter, one-year and since inception periods ended March 31, 2016. The Board also considered the Fund’s discount history and whether the continuity of services provided by NFA and NAM might minimize the Fund’s trading discount in the future.
| 48 | NUVEEN |
Fees and Expenses
The Board considered that the Fund currently has the lowest net total fee and expense ratio in its peer group by a wide margin and that if Nuveen were to substitute the contractual management fee (without fee waivers) for the actual management fee (with fee waivers) then the Fund would still have the second lowest net fee and expense ratio in its peer group. The Trustees further considered the Fund’s fee schedule, noting that it is consistent with other Nuveen funds that have a similar mandate and that NAM’s fee is paid by NFA.
Profitability of NFA and NAM
The Board examined Nuveen’s costs in providing investment advisory services to the Fund. The Board considered that NFA is currently waiving a portion of the management fees it receives from the Fund and, as a result, the Fund operates at a loss to Nuveen.
Economies of Scale
The Board considered that the Fund’s fee schedule is comprised of two components: a Fund-level fee and a complex-level fee, both of which are subject to specified breakpoints. The Board noted that the Fund-level breakpoints are based on the Fund’s assets under management and the complex-level breakpoints are based on the aggregate Nuveen mutual fund and closed-end fund assets under management and enable Fund shareholders to benefit from complex-wide economies of scale due to on-going growth in mutual fund and closed-end fund assets across the fund complex. The Board noted that Nuveen had agreed to cap expenses for the first two years after the closing of the mergers of American Strategic Income Portfolio Inc., American Strategic Income Portfolio Inc. II, American Strategic Income Portfolio Inc. III, and American Select Portfolio Inc. (together, the “predecessor funds”) into the Fund in September 2014. Nuveen agreed to waive fees or reimburse expenses during such two year time period so that the total annual operating expense ratio (excluding the costs of leverage) of the Fund would be two basis points (0.02%) less than the lowest total annual expense ratio (excluding the costs of leverage) of the predecessor funds for the period from the first day of the then-current fiscal year through the last day of the month prior to the consummation of the mergers, on an annualized basis.
Other Benefits to NFA and NAM
The Board also considered the direct and indirect benefits that may accrue to Nuveen from its relationship with the Fund. In this regard, the Trustees noted that there are no fall-out benefits accruing to Nuveen for its management of the Fund.
After full consideration of these factors, the Board concluded that the Fund benefits from the services provided under the Agreements as a result of Nuveen’s operations, resources, experience, reputation and personnel and that approval of the Agreements was in the interest of the Fund.
| NUVEEN | 49 |
Notes
| 50 | NUVEEN |
Notes
| NUVEEN | 51 |
| ||||||||||||||
| ||||||||||||||
| Nuveen: | ||||||||||||||
| Serving Investors for Generations | ||||||||||||||
| ||||||||||||||
| Since 1898, financial advisors and their clients have relied on Nuveen to provide dependable investment solutions through continued adherence to proven, long-term investing principles. Today, we offer a range of high quality equity and fixed-income solutions designed to be integral components of a well-diversified core portfolio. | ||||||||||||||
| ||||||||||||||
Focused on meeting investor needs.
Nuveen helps secure the long-term goals of individual investors and the advisors who serve them. As an operating division of TIAA Global Asset Management, Nuveen provides access to investment expertise from leading asset managers and solutions across traditional and alternative asset classes. Built on more than a century of industry leadership, Nuveen’s teams of experts align with clients’ specific financial needs and goals, demonstrating commitment to advisors and investors through market perspectives and wealth management and portfolio advisory services. Nuveen manages $236 billion in assets as of December 31, 2016. | ||||||||||||||
| ||||||||||||||
Find out how we can help you.
To learn more about how the products and services of Nuveen may be able to help you meet your financial goals, talk to your financial advisor, or call us at (800) 257-8787. Please read the information provided carefully before you invest. Investors should consider the investment objective and policies, risk considerations, charges and expenses of any investment carefully. Where applicable, be sure to obtain a prospectus, which contains this and other relevant information. To obtain a prospectus, please contact your securities representative or Nuveen, 333 W. Wacker Dr., Chicago, IL 60606. Please read the prospectus carefully before you invest or send money.
Learn more about Nuveen Funds at: www.nuveen.com/cef | ||||||||||||||
| ||||||||||||||
Distributed by Nuveen Securities, LLC | 333 West Wacker Drive | Chicago, IL 60606 | www.nuveen.com/cef
ESA-D-1116D 22029-INV-B-01/18
Item 2. Code of Ethics.
Not applicable to this filing.
Item 3. Audit Committee Financial Expert.
Not applicable to this filing.
Item 4. Principal Accountant Fees and Services.
Not applicable to this filing.
Item 5. Audit Committee of Listed Registrants.
Not applicable to this filing.
Item 6. Schedule of Investments.
(a) See Portfolio of Investments in Item 1.
(b) Not applicable.
Item 7. Disclosure of Proxy Voting Policies and Procedures for Closed-End Management Investment Companies.
Not applicable to this filing.
Item 8. Portfolio Managers of Closed-End Management Investment Companies.
Not applicable to this filing.
Item 9. Purchases of Equity Securities by Closed-End Management Investment Company and Affiliated Purchasers.
Period* | (a) Total Number of Shares (or Units) Purchased | (b) Average Price Paid per Share (or Unit) | (c) Total Number of Shares (or Units) Purchased as Part of Publicly Announced Plans or Programs | (d)* Maximum Number (or Approximate Dollar Value) of Shares (or Units) That May Yet Be Purchased Under The Plans or Programs | ||||||||||||
June 1-30, 2016 | 10,300 | $ | 16.28 | 10,300 | 1,692,200 | |||||||||||
July 1-31, 2016 | 0 | 0 | 1,692,200 | |||||||||||||
August 1-31, 2016 | 0 | 0 | 1,692,200 | |||||||||||||
September 1-30, 2016 | 0 | 0 | 1,790,000 | |||||||||||||
October 1-31, 2016 | 10,000 | $ | 16.47 | 10,000 | 1,780,000 | |||||||||||
November 1-30, 2016 | 39,200 | $ | 15.96 | 39,200 | 1,740,800 | |||||||||||
Total | 59,500 | |||||||||||||||
| * | The registrant’s repurchase program, for the repurchase of 2,025,000 shares was authorized on September 30, 2015. The program was reauthorized for a maximum repurchase amount of 1,790,000 shares on September 30, 2016. Any repurchases made by the registrant pursuant to the program were made through open-market transactions. |
Item 10. Submission of Matters to a Vote of Security Holders.
There have been no material changes to the procedures by which shareholders may recommend nominees to the registrant’s Board implemented after the registrant last provided disclosure in response to this item.
Item 11. Controls and Procedures.
| (a) | The registrant’s principal executive and principal financial officers, or persons performing similar functions, have concluded that the registrant’s disclosure controls and procedures (as defined in Rule 30a-3(c) under the Investment Company Act of 1940, as amended (the “1940 Act”) (17 CFR 270.30a-3(c))) are effective, as of a date within 90 days of the filing date of this report that includes the disclosure required by this paragraph, based on their evaluation of the controls and procedures required by Rule 30a-3(b) under the 1940 Act (17 CFR 270.30a-3(b)) and Rules 13a-15(b) or 15d-15(b) under the Securities Exchange Act of 1934, as amended (the “Exchange Act”) (17 CFR 240.13a-15(b) or 240.15d-15(b)). |
| (b) | There were no changes in the registrant’s internal control over financial reporting (as defined in Rule 30a-3(d) under the 1940 Act (17 CFR 270.30a-3(d)) that occurred during the second fiscal quarter of the period covered by this report that has materially affected, or is reasonably likely to materially affect, the registrant’s internal control over financial reporting. |
Item 12. Exhibits.
File the exhibits listed below as part of this Form.
(a)(1) Any code of ethics, or amendment thereto, that is the subject of the disclosure required by Item 2, to the extent that the registrant intends to satisfy the Item 2 requirements through filing of an exhibit: Not applicable to this filing.
(a)(2) A separate certification for each principal executive officer and principal financial officer of the registrant as required by Rule 30a-2(a) under the 1940 Act (17 CFR 270.30a-2(a)) in the exact form set forth below: See EX-99.CERT attached hereto.
(a)(3) Any written solicitation to purchase securities under Rule 23c-1 under the 1940 Act (17 CFR 270.23c-1) sent or given during the period covered by the report by or on behalf of the registrant to 10 or more persons: Not applicable.
(b) If the report is filed under Section 13(a) or 15(d) of the Exchange Act, provide the certifications required by Rule 30a-2 (b) under the 1940 Act (17 CFR 270.30a-2(b)), Rule 13a-14(b) or Rule 15d-14(b) under the Exchange Act (17 CFR 240.13a-14(b) or 240.15d-14(b)), and Section 1350 of Chapter 63 of Title 18 of the United States Code (18 U.S.C. 1350) as an Exhibit. A certification furnished pursuant to this paragraph will not be deemed “filed” for purposes of Section 18 of the Exchange Act (15 U.S.C. 78r), or otherwise subject to the liability of that section. Such certification will not be deemed to be incorporated by reference into any filing under the Securities Act of 1933 or the Exchange Act, except to the extent that the registration specifically incorporates it by reference: See EX-99.906 CERT attached hereto.
SIGNATURES
Pursuant to the requirements of the Securities Exchange Act of 1934 and the Investment Company Act of 1940, the registrant has duly caused this report to be signed on its behalf by the undersigned, thereunto duly authorized.
(Registrant) Diversified Real Asset Income Fund
| By (Signature and Title) | /s/ Gifford R. Zimmerman | |||
| Gifford R. Zimmerman | ||||
| Vice President and Secretary |
Date: February 3, 2017
Pursuant to the requirements of the Securities Exchange Act of 1934 and the Investment Company Act of 1940, this report has been signed below by the following persons on behalf of the registrant and in the capacities and on the dates indicated.
| By (Signature and Title) | /s/ Cedric H. Antosiewicz | |||
| Cedric H. Antosiewicz | ||||
| Chief Administrative Officer | ||||
| (principal executive officer) |
Date: February 3, 2017
| By (Signature and Title) | /s/ Stephen D. Foy | |||
| Stephen D. Foy | ||||
| Vice President and Controller | ||||
| (principal financial officer) |
Date: February 3, 2017