Exhibit 99.2
Introducing
Investor presentation
Investor Day
June 19, 2014
Forward-looking statements and non-GAAP financial information
The information provided today will include forward-looking statements relating to our goals and estimates for future years, including statements about expected sales, operating earnings per share, cash flow, segment margins, our worldwide markets, our anticipated effective income tax rate, and others. These statements should be used with caution and are subject to various risks and uncertainties, many of which are outside the company’s control. The following factors could cause actual results to differ, perhaps materially, from those anticipated in the forward-looking statements: unanticipated changes in the markets for the company’s business segments; unanticipated downturns in business relationships with customers or their purchases from us; competitive pressures on sales and pricing; increases in the cost of material and other production costs, or unexpected costs that cannot be recouped in product pricing; the introduction of competing technologies; unexpected technical or marketing difficulties; unexpected claims, charges, litigation or dispute resolutions; new laws and governmental regulations; interest rate changes; changes in currency exchange rates; stock market fluctuations; unanticipated deterioration of economic and financial conditions in the United States and around the world; the amount and timing of any dividends and share repurchases; and the risks identified in the company’s registration statement on Form 10 filed with the SEC. We do not assume any obligation to update these forward-looking statements.
The unaudited pro forma consolidated financial data in this presentation is subject to assumptions and adjustments described in the company’s registration statement on Form 10. TimkenSteel Corporation’s (“TimkenSteel”) management believes these assumptions and adjustments are reasonable under the circumstances and given the information available at this time. However, these adjustments are subject to change as The Timken Company and TimkenSteel finalize the terms of the spinoff, including the separation and distribution agreement and related transaction agreements. The unaudited pro forma consolidated financial data does not purport to represent what TimkenSteel’s financial position and results of operations actually would have been had the spinoff occurred on the dates indicated, or to project TimkenSteel’s financial performance for any future period following the spinoff.
This presentation includes certain non-GAAP financial measures as defined by SEC rules. A reconciliation of those measures to the most directly comparable GAAP equivalent is contained in your packet.
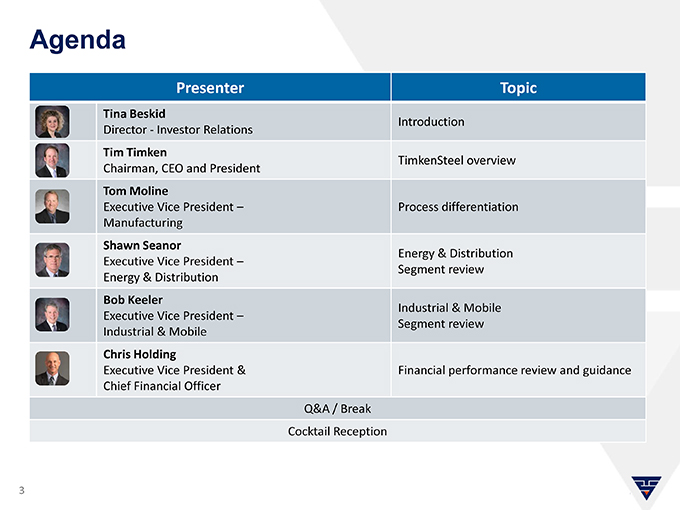
Agenda
Presenter Topic
Tina Beskid
Introduction Director—Investor Relations
Tim Timken
TimkenSteel overview Chairman, CEO and President
Tom Moline
Executive Vice President – Process differentiation Manufacturing
Shawn Seanor
Energy & Distribution Executive Vice President – Segment review Energy & Distribution
Bob Keeler
Industrial & Mobile Executive Vice President – Segment review Industrial & Mobile
Chris Holding
Executive Vice President & Financial performance review and guidance Chief Financial Officer
Q&A / Break
Cocktail Reception
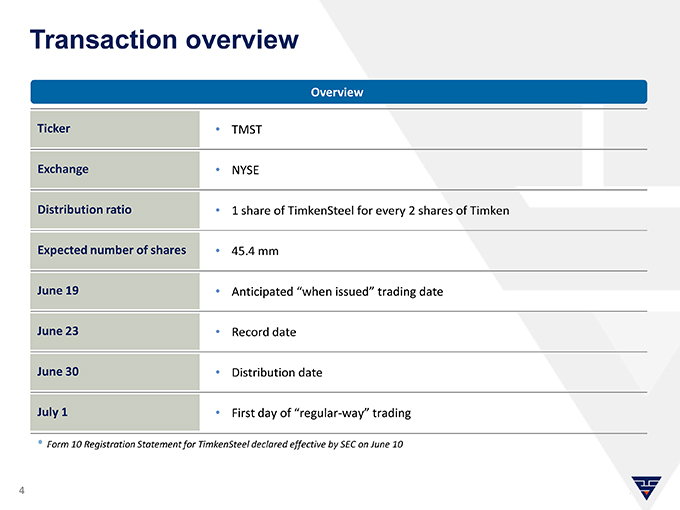
Transaction overview
Overview
Ticker • TMST
Exchange • NYSE
Distribution ratio • 1 share of TimkenSteel for every 2 shares of Timken
Expected number of shares • 45.4 mm
June 19 • Anticipated “when issued” trading date
June 23 • Record date
June 30 • Distribution date
July 1 • First day of “regular-way” trading
• |
| Form 10 Registration Statement for TimkenSteel declared effective by SEC on June 10 |
A new steel company
…like no other
Ward J. “Tim” Timken, Jr.
Chairman, CEO and President
TimkenSteel strategy creates value
Our Mission:
• |
| We help customers push the bounds of what’s possible by creating steel products and services to overcome their toughest challenges |
Our strategy to generate customer and shareholder value:
• |
| Our goal is to expand our leadership position in profitable niche market spaces in the specialized steel industry, serving customers that value high performance products in critical and demanding applications. We drive operational excellence through flexible, efficient and quality processes. Our reputation is built on our ability to innovate, creating tailored special bar quality (SBQ) solutions and providing integrated supply chain services, which provides a solid foundation for future growth |
Our values:
• |
| Ethics & Integrity | Quality | Innovation | Independence |
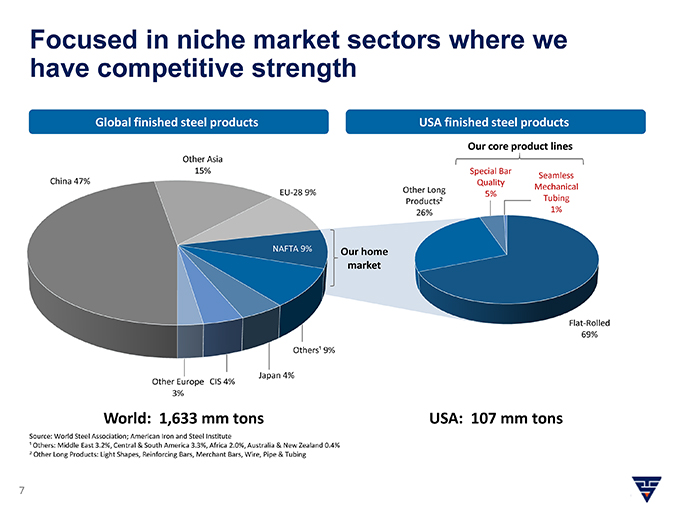
Focused in niche market sectors where we have competitive strength
USA finished steel products
Our core product lines
Other Asia
15% Special Bar
Seamless China 47% Quality Other Long Mechanical EU-28 9% 5% Products² Tubing 26% 1%
NAFTA 9% Our home
market
Flat-Rolled 69% Others¹ 9%
Japan 4% Other Europe CIS 4% 3%
USA: 107 mm tons
¹ Others: Middle East 3.2%, Central & South America 3.3%, Africa 2.0%, Australia & New Zealand 0.4%
2 |
| Other Long Products: Light Shapes, Reinforcing Bars, Merchant Bars, Wire, Pipe & Tubing |
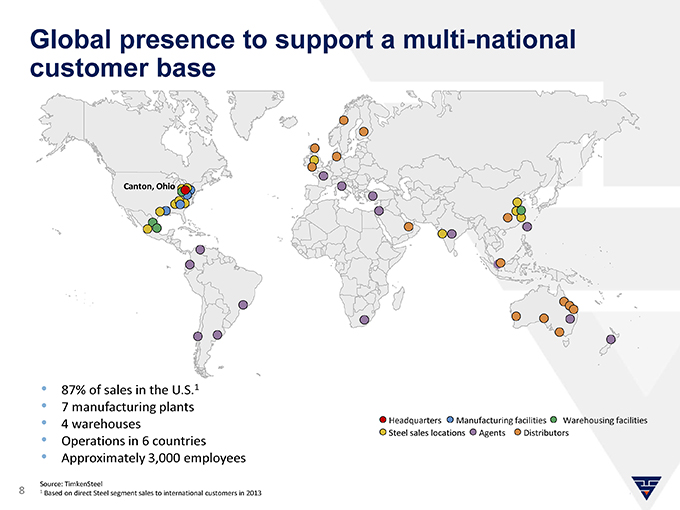
Global presence to support a multi-national customer base
Canton, Ohio
• |
| 87% of sales in the U.S.1 |
• |
| 7 manufacturing plants |
• |
| 4 warehouses Headquarters Manufacturing facilities Warehousing facilities Steel sales locations Agents Distributors |
• |
| Operations in 6 countries |
• |
| Approximately 3,000 employees |
Source: TimkenSteel
8 |
| 1 Based on direct Steel segment sales to international customers in 2013 |
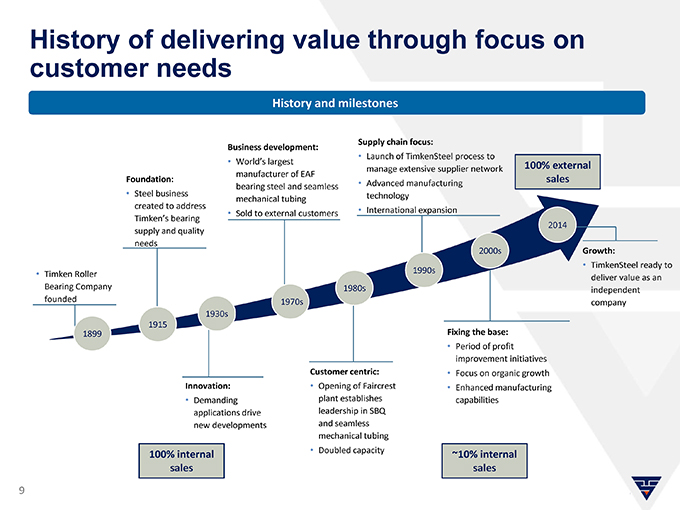
History of delivering value through focus on customer needs
History and milestones
Supply chain focus: Business development:
• |
| Launch of TimkenSteel process to |
• |
| World’s largest manage extensive supplier network 100% external manufacturer of EAF |
Foundation: sales bearing steel and seamless • Advanced manufacturing
• |
| Steel business technology created to address mechanical tubing |
• |
| Sold to external customers International expansion |
Timken’s bearing
2014 supply and quality needs 2000s Growth:
• |
| TimkenSteel ready to 1990s |
• |
| Timken Roller deliver value as an Bearing Company 1980s independent founded 1970s company 1930s |
1915 Fixing the base:
1899
• |
| Period of profit improvement initiatives Customer centric: Focus on organic growth Innovation: Opening of Faircrest Enhanced manufacturing |
• |
| Demanding plant establishes capabilities applications drive leadership in SBQ new developments and seamless mechanical tubing |
• |
| Doubled capacity |
100% internal ~10% internal sales sales
9
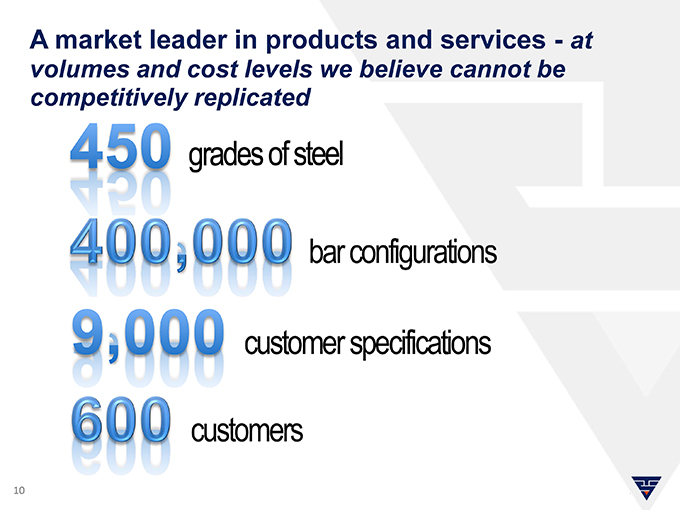
A market leader in products and services—at volumes and cost levels we believe cannot be replicated
customer specifications
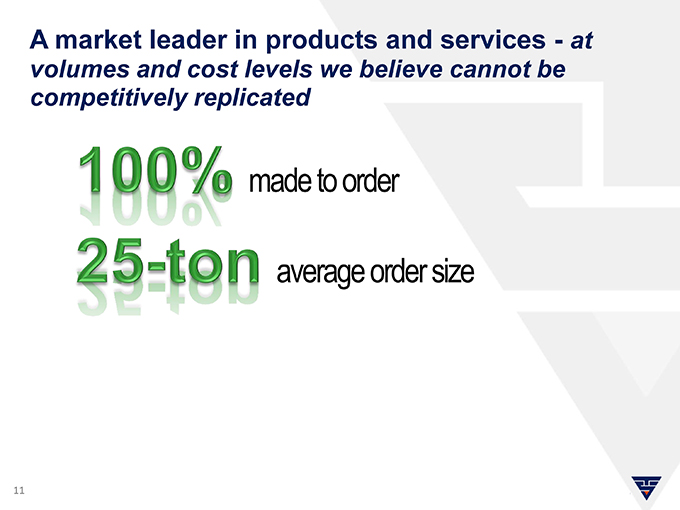
A market leader in products and services—at volumes and cost levels we believe cannot be competitively replicated
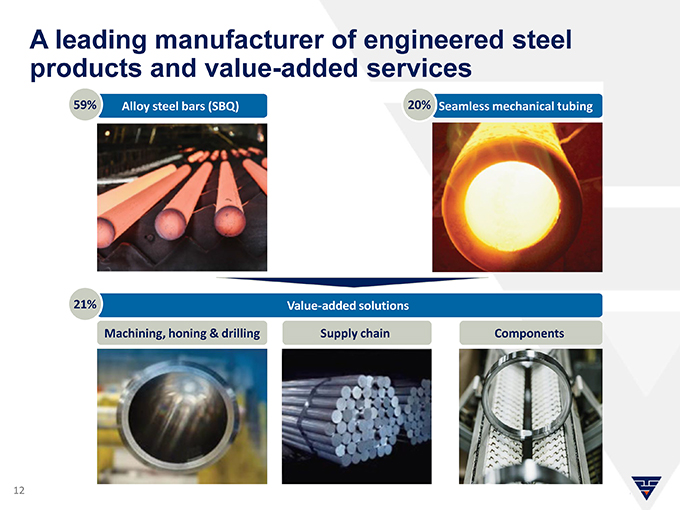
A leading manufacturer of engineered steel products and value-added services
59% Alloy steel bars (SBQ) 20% Seamless mechanical tubing
21% Value-added solutions
Machining, honing & drilling Supply chain Components
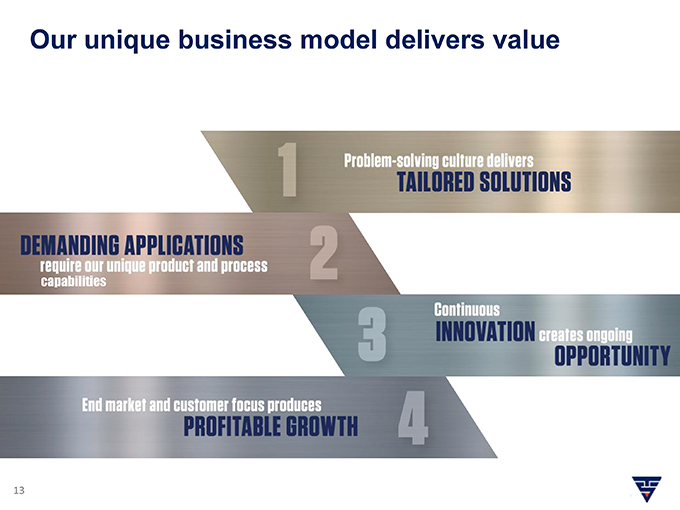
Our unique business model delivers value
capabilities
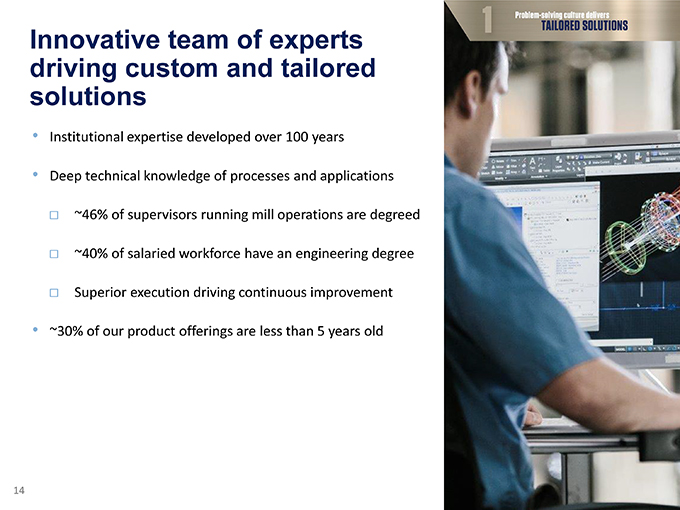
Innovative team of experts driving custom and tailored solutions
• |
| Institutional expertise developed over 100 years |
• |
| Deep technical knowledge of processes and applications ~46% of supervisors running mill operations are degreed |
~40% of salaried workforce have an engineering degree
Superior execution driving continuous improvement
• |
| ~30% of our product offerings are less than 5 years old |
capabilities
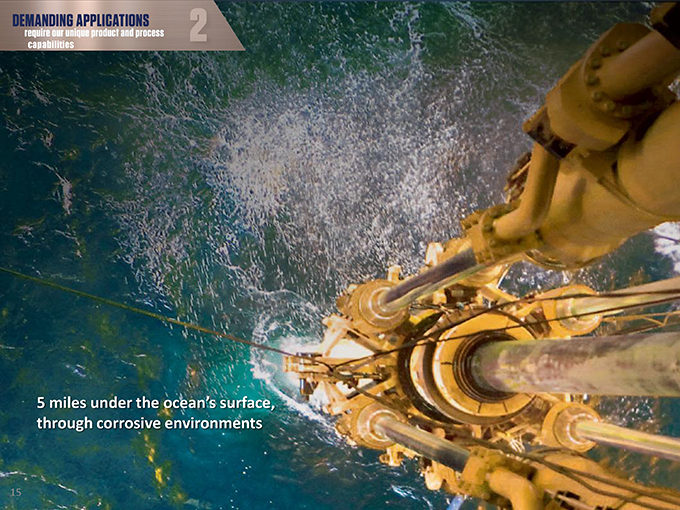
5 |
| miles under the ocean’s surface, through corrosive environments |
capabilities
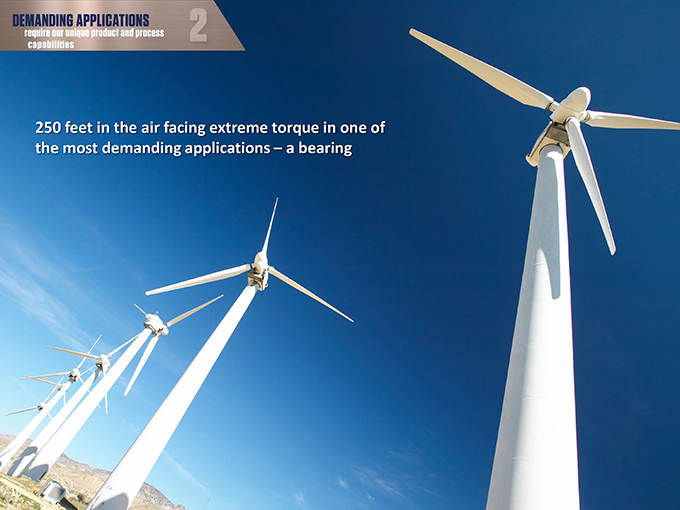
250 feet in the air facing extreme torque in one of the most demanding applications – a bearing
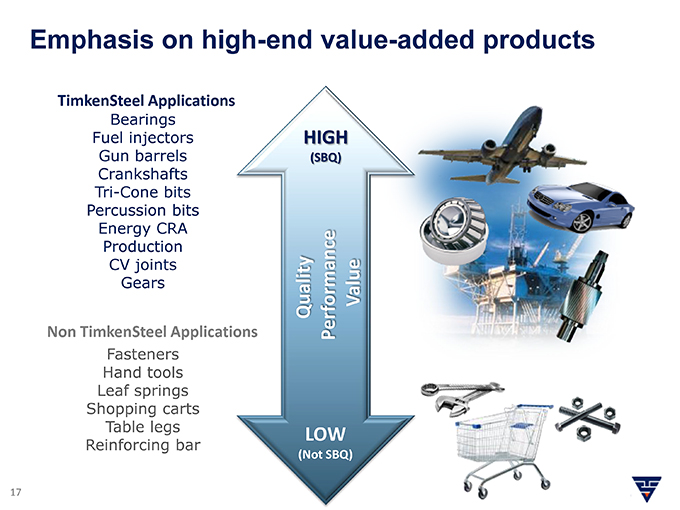
Emphasis on high-end value-added products
capabilities
TimkenSteel Applications
Bearings
Fuel injectors HIGH Gun barrels (SBQ) Crankshafts Tri-Cone bits Percussion bits Energy CRA
Production
CV joints Gears Value
Quality
Non TimkenSteel Applications Performance
Fasteners Hand tools Leaf springs Shopping carts Table legs
LOW
Reinforcing bar
(Not SBQ)
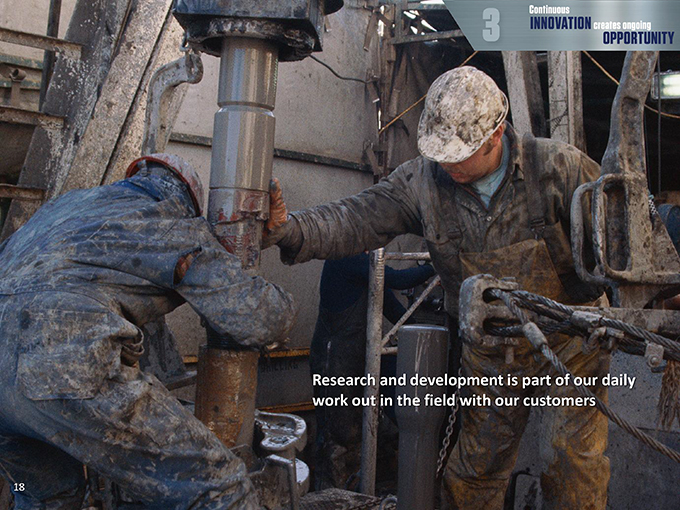
Research and development is part of our daily work out in the field with our customers
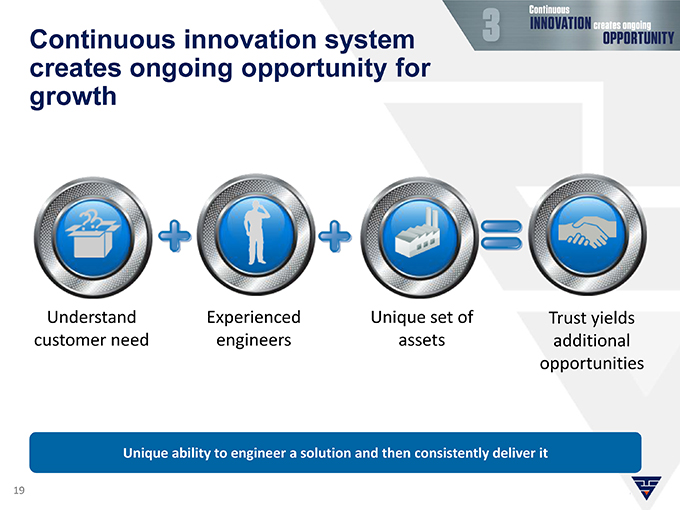
Continuous innovation system creates ongoing opportunity for growth
Understand Experienced Unique set of Trust yields customer need engineers assets additional opportunities
Unique ability to engineer a solution and then consistently deliver it
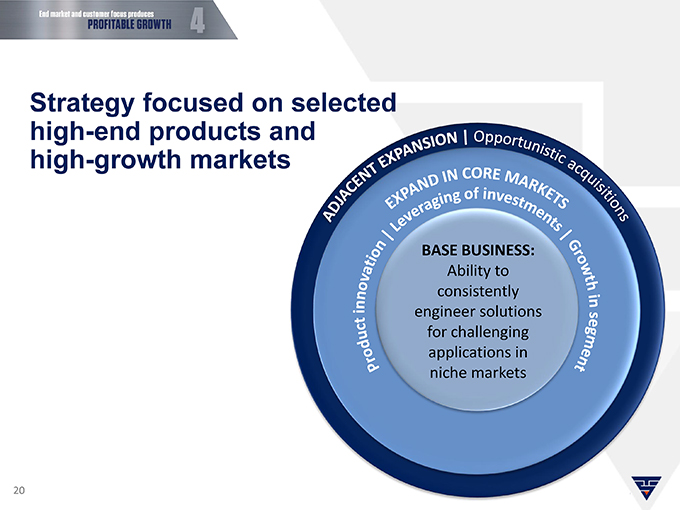
Strategy focused on selected high-end products and high-growth markets
BASE BUSINESS:
Ability to consistently engineer solutions for challenging applications in niche markets
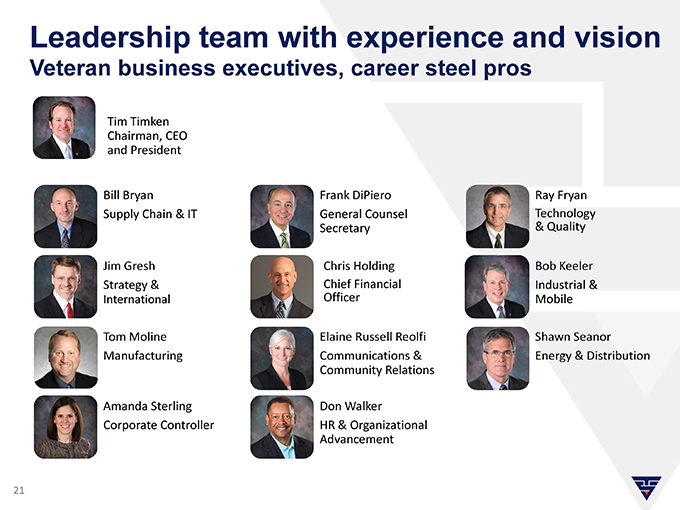
Leadership team with experience and vision
Veteran business executives, career steel pros
Tim Timken Chairman, CEO and President
Bill Bryan Frank DiPiero Ray Fryan Supply Chain & IT General Counsel Technology Secretary & Quality
Jim Gresh Chris Holding Bob Keeler Strategy & Chief Financial Industrial &
International Officer Mobile
Tom Moline Elaine Russell Reolfi Shawn Seanor Manufacturing Communications & Energy & Distribution Community Relations
Amanda Sterling Don Walker Corporate Controller HR & Organizational Advancement
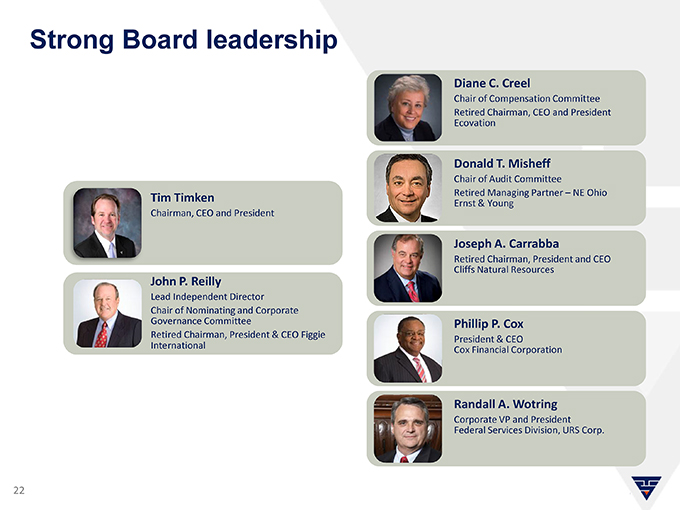
Strong Board leadership
Diane C. Creel
Chair of Compensation Committee Retired Chairman, CEO and President Ecovation
Donald T. Misheff
Chair of Audit Committee
Tim Timken Retired Managing Partner – NE Ohio Ernst & Young Chairman, CEO and President
Joseph A. Carrabba
Retired Chairman, President and CEO Cliffs Natural Resources
John P. Reilly
Lead Independent Director Chair of Nominating and Corporate
Governance Committee Phillip P. Cox Retired Chairman, President & CEO Figgie President & CEO International Cox Financial Corporation
Randall A. Wotring
Corporate VP and President Federal Services Division, URS Corp.
TimkenSteel priorities to create shareholder value
PROFIT
CASH FLOW
GROWTH
COMMUNICATIONS
VALUE CREATION & INDEPENDENCE
Process differentiation
Tom Moline
Executive Vice President—Manufacturing
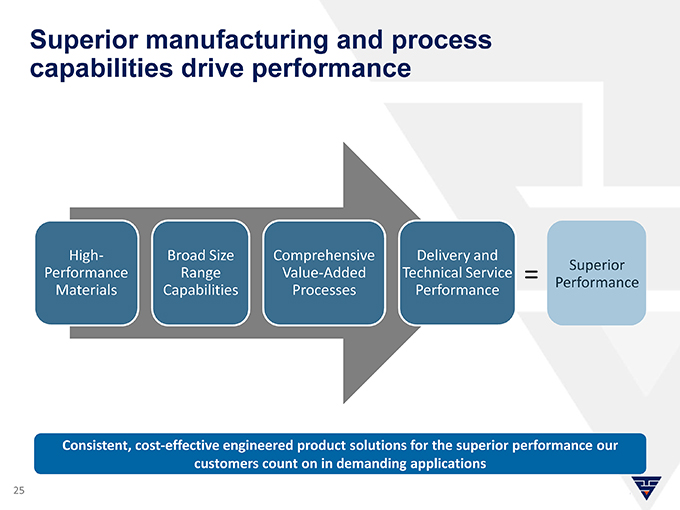
Superior manufacturing and process capabilities drive performance
High- Broad Size Comprehensive Delivery and
Superior Performance Range Value-Added Technical Service = Performance Materials Capabilities Processes Performance
Consistent, cost-effective engineered product solutions for the superior performance our customers count on in demanding applications
25
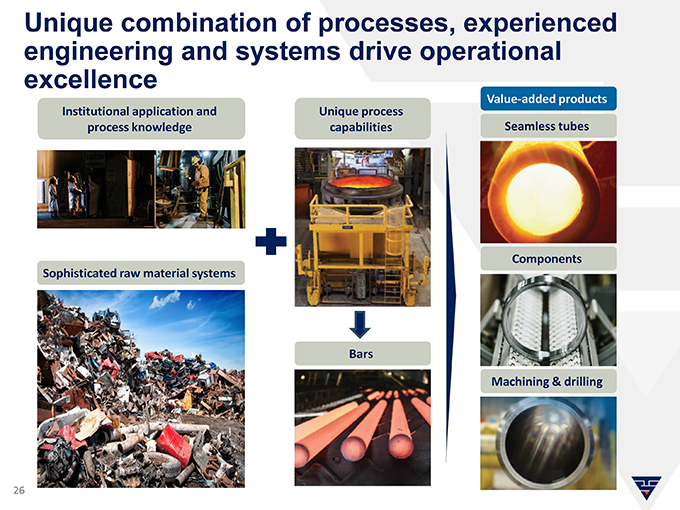
Unique combination of processes, experienced engineering and systems drive operational excellence
Value-added products Institutional application and Unique process process knowledge capabilities Seamless tubes
Components Sophisticated raw material systems
Bars
Machining & drilling
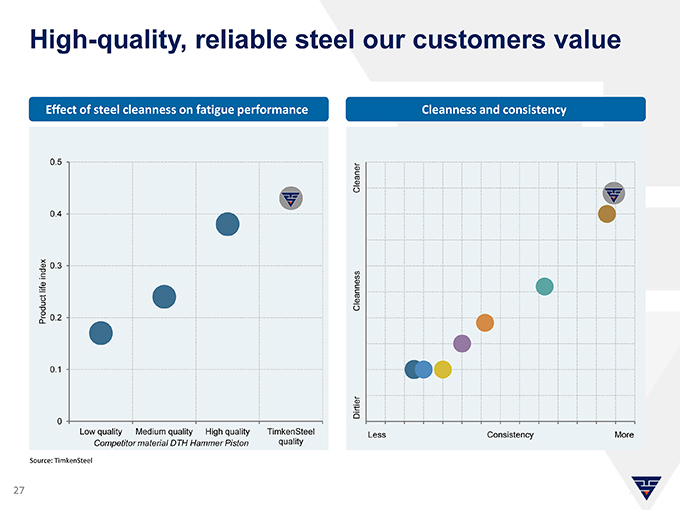
High-quality, reliable steel our customers value
Effect of steel cleanness on fatigue performance Cleanness and consistency
0.5 Cleaner
0.4
index 0.3 life Cleanness Product 0.2
0.1
Dirtier 0
Low quality Medium quality High quality TimkenSteel Less Consistency More
Competitor material DTH Hammer Piston quality
Source: TimkenSteel
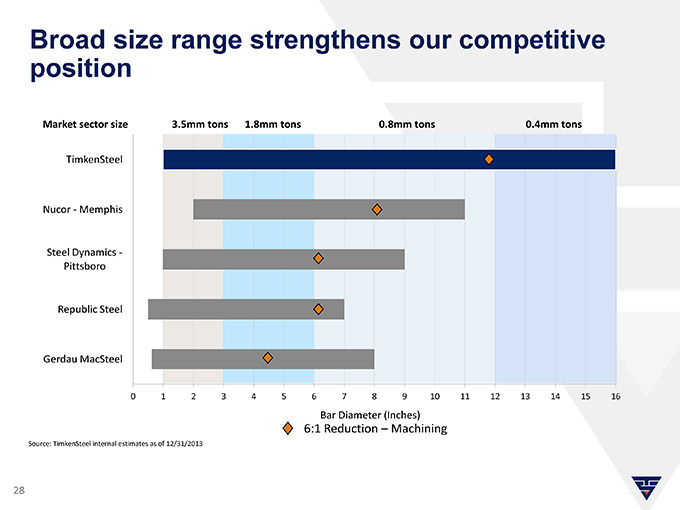
Broad size range strengthens our competitive position
Market sector size 3.5mm tons 1.8mm tons 0.8mm tons 0.4mm tons
TimkenSteel
Nucor—Memphis
Steel Dynamics—Pittsboro
Republic Steel
Gerdau MacSteel
0 1 2 3 4 5 6 7 8 9 10 11 12 13 14 15 16
Bar Diameter (Inches)
6:1 Reduction – Machining
Source: TimkenSteel internal estimates as of 12/31/2013
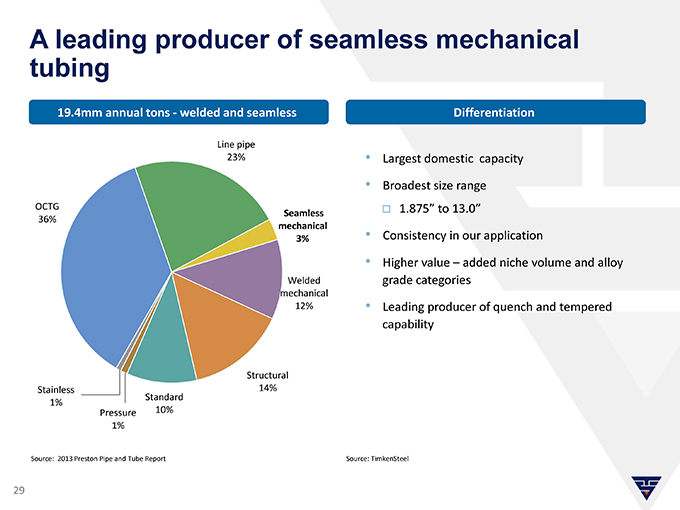
A leading producer of seamless mechanical tubing
19.4mm annual tons—welded and seamless Differentiation
Line pipe
23% • Largest domestic capacity
• |
| Broadest size range |
OCTG 1.875” to 13.0”
Seamless
36% mechanical
3% • Consistency in our application
• |
| Higher value – added niche volume and alloy Welded grade categories |
mechanical
12% • Leading producer of quench and tempered capability
Structural Stainless 14% Standard 1% Pressure 10% 1%
Source: 2013 Preston Pipe and Tube Report Source: TimkenSteel
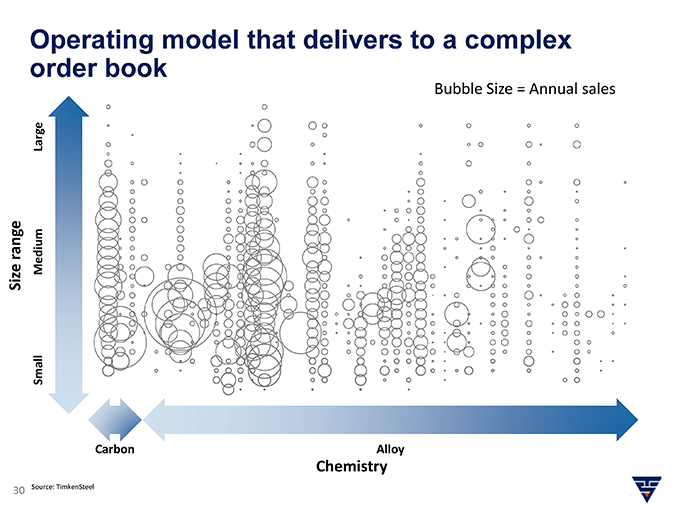
Operating model that delivers to a complex order book
Bubble Size = Annual sales
Large
range
Size Medium Small
Carbon Alloy
Chemistry
30 Source: TimkenSteel
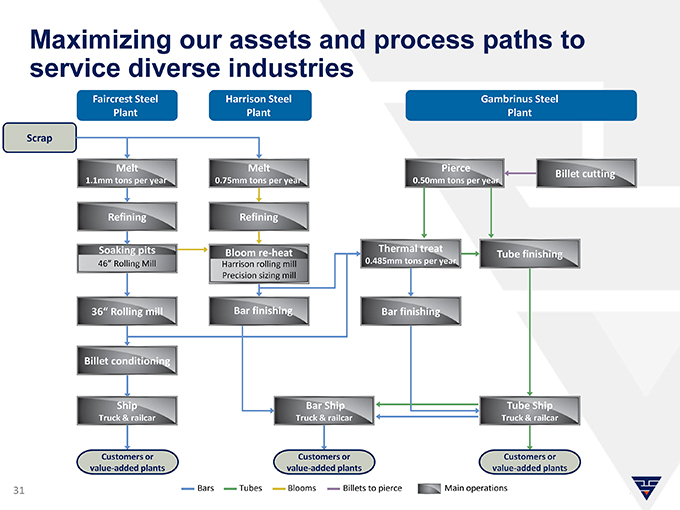
Maximizing our assets and process paths to service diverse industries
Faircrest Steel Harrison Steel Gambrinus Steel Plant Plant Plant
Scrap
Melt Melt Pierce
Billet cutting
1.1mm tons per year 0.75mm tons per year 0.50mm tons per year
Refining Refining
Soaking pits Bloom re-heat Thermal treat
Tube finishing
46” Rolling Mill Harrison rolling mill 0.485mm tons per year Precision sizing mill
36” Rolling mill Bar finishing Bar finishing
Billet conditioning
Ship Bar Ship Tube Ship
Truck & railcar Truck & railcar Truck & railcar
Customers or Customers or Customers or value-added plants value-added plants value-added plants
31 Bars Tubes Blooms Billets to pierce Main operations
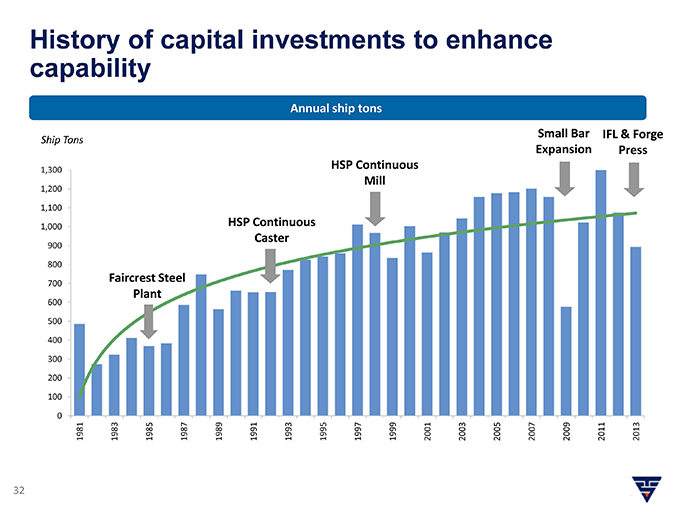
History of capital investments to enhance capability
Annual ship tons
Small Bar IFL & Forge Ship Tons Expansion Press HSP Continuous
1,300
1,200 Mill 1,100
1,000 HSP Continuous Caster
900
800
Faircrest Steel
700
600 Plant
500 400 300 200 100
0
1981 19831985 1987 198919911993199519971999 2001 2003 2005 200720092011 2013
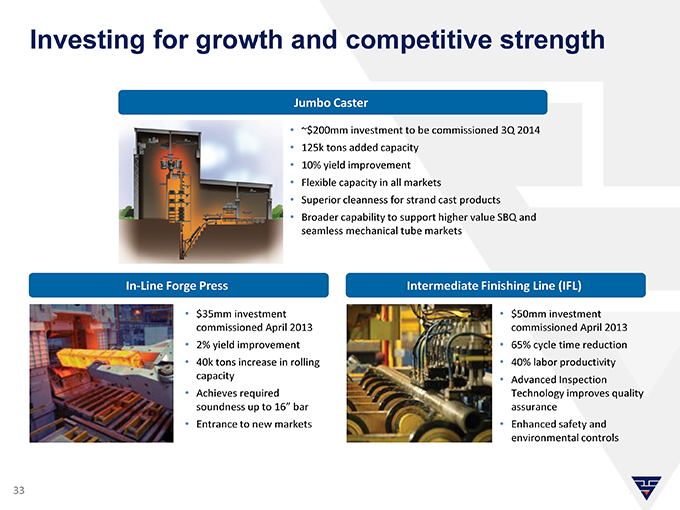
Investing for growth and competitive strength
Jumbo Caster
• |
| ~$200mm investment to be commissioned 3Q 2014 |
• |
| 125k tons added capacity |
• |
| 10% yield improvement |
• |
| Flexible capacity in all markets |
• |
| Superior cleanness for strand cast products |
• |
| Broader capability to support higher value SBQ and seamless mechanical tube markets |
In-Line Forge Press Intermediate Finishing Line (IFL)
• |
| $35mm investment $50mm investment commissioned April 2013 commissioned April 2013 |
• |
| 2% yield improvement 65% cycle time reduction |
• |
| 40k tons increase in rolling 40% labor productivity capacity Advanced Inspection |
• |
| Achieves required Technology improves quality soundness up to 16” bar assurance |
• |
| Entrance to new markets Enhanced safety and environmental controls |
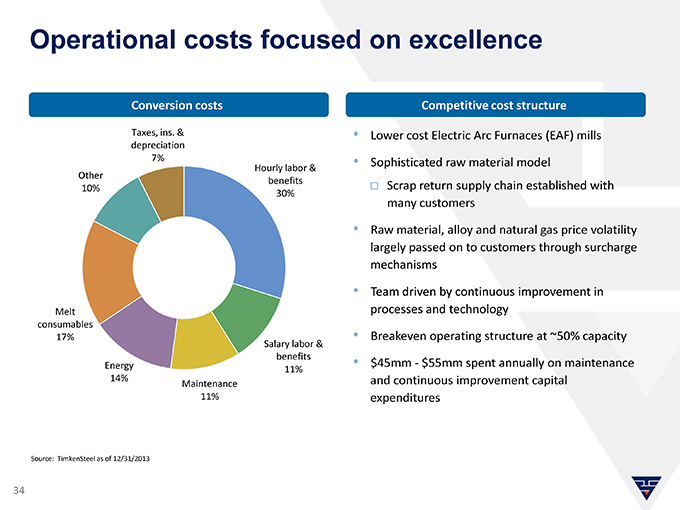
Operational costs focused on excellence
Conversion costs Competitive cost structure
Taxes, ins. & • Lower cost Electric Arc Furnaces (EAF) mills
depreciation
7% • Sophisticated raw material model
Other Hourly labor &
benefits Scrap return supply chain established with
10% 30%
many customers
• |
| Raw material, alloy and natural gas price volatility largely passed on to customers through surcharge mechanisms |
• |
| Team driven by continuous improvement in Melt processes and technology |
consumables
17% • Breakeven operating structure at ~50% capacity
Salary labor & benefits
Energy • $45mm—$55mm spent annually on maintenance
11%
14% and continuous improvement capital
Maintenance
11% expenditures
Source: TimkenSteel as of 12/31/2013
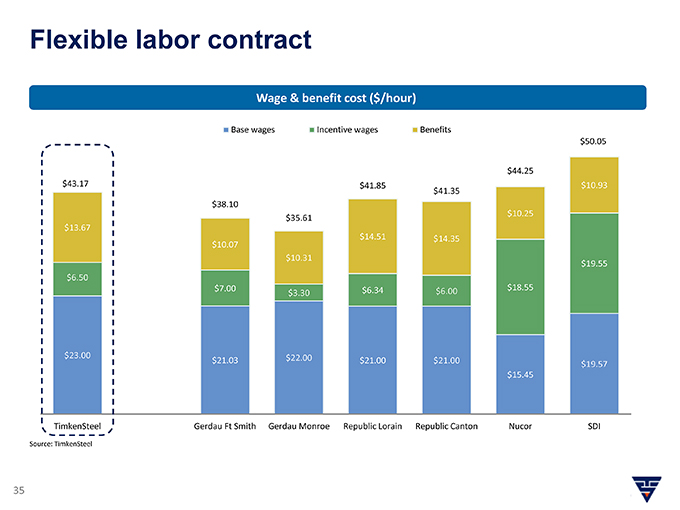
Flexible labor contract
Wage & benefit cost ($/hour)
Base wages Incentive wages Benefits
$50.05
$44.25
$43.17 $41.85 $41.35 $10.93
$38.10
$10.25
$35.61
$13.67
$14.51 $14.35
$10.07
$10.31
$19.55 $6.50 $7.00 $6.34 $18.55 $3.30 $6.00
$23.00 $22.00
$21.03 $21.00 $21.00
$19.57
$15.45
TimkenSteel Gerdau Ft Smith Gerdau Monroe Republic Lorain Republic Canton Nucor SDI
Source: TimkenSteel
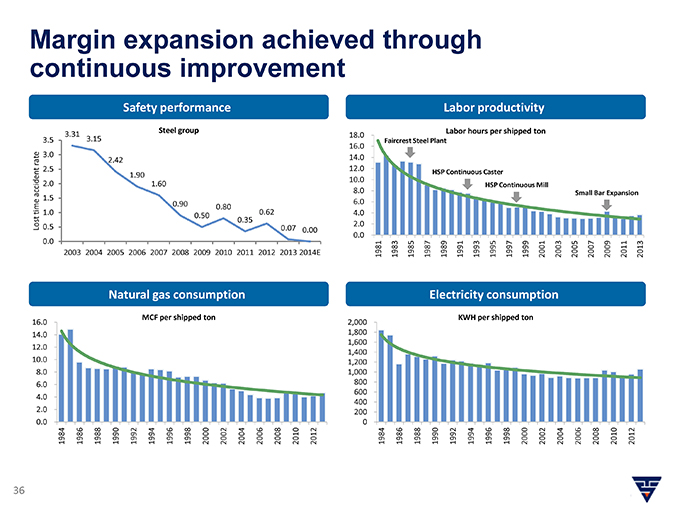
Margin expansion achieved through continuous improvement
Safety performance Labor productivity
Steel group Labor hours per shipped ton
3.31 18.0
3.5 3.15 Faircrest Steel Plant
16.0 3.0 14.0 rate 2.42 2.5 12.0
1.90 HSP Continuous Caster
10.0
2.0 1.60 HSP Continuous Mill accident 8.0 Small Bar Expansion
1.5
0.90 6.0 time 0.80 1.0 0.62 4.0 0.50 0.35 Lost 0.5 2.0 0.07 0.00 0.0
0.0
2003 2004 2005 2006 2007 2008 2009 2010 2011 2012 2013 2014E 1981 1983 1985 1987 1989 1991 1993 1995 1997 1999 2001 2003 2005 2007 2009 2011 2013
Natural gas consumption Electricity consumption
MCF per shipped ton KWH per shipped ton
16.0 2,000
14.0 1,800 1,600
12.0
1,400
10.0 1,200 8.0 1,000 6.0 800 600 4.0 400 2.0 200 0.0 0
1984 1986 198819901992 1994 1996 1998 2000 2002 2004 2006 2008 2010 2012 1984 1986 1988 1990 1992 1994 1996 19982000 2002 2004 20062008 2010 2012
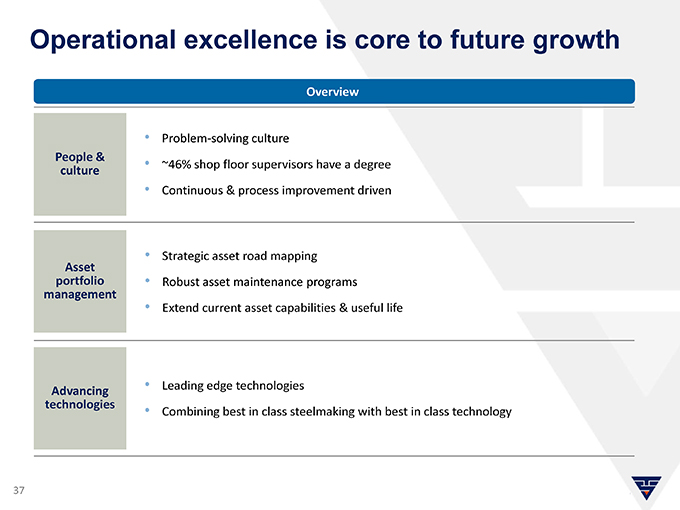
Operational excellence is core to future growth
Overview
• |
| Problem-solving culture |
People &
• |
| ~46% shop floor supervisors have a degree culture |
• |
| Continuous & process improvement driven |
• |
| Strategic asset road mapping |
Asset portfolio • Robust asset maintenance programs management
• |
| Extend current asset capabilities & useful life |
• |
| Leading edge technologies |
Advancing technologies
• |
| Combining best in class steelmaking with best in class technology |
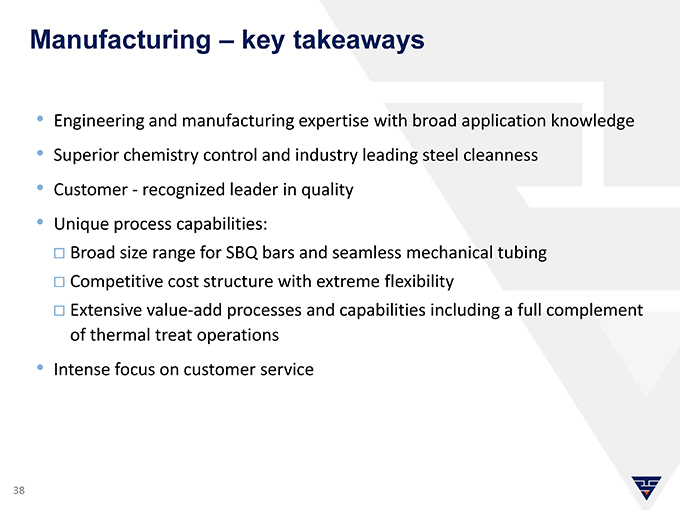
Manufacturing – key takeaways
• |
| Engineering and manufacturing expertise with broad application knowledge |
• |
| Superior chemistry control and industry leading steel cleanness |
• |
| Customer—recognized leader in quality |
• |
| Unique process capabilities: |
Broad size range for SBQ bars and seamless mechanical tubing Competitive cost structure with extreme flexibility
Extensive value-add processes and capabilities including a full complement of thermal treat operations
• |
| Intense focus on customer service |
Energy & Distribution
Shawn Seanor
Executive Vice President –
Energy & Distribution
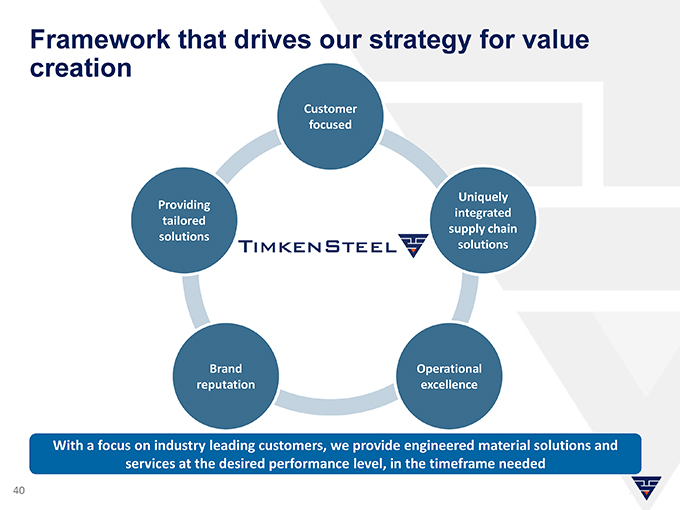
Framework that drives our strategy for value creation
Customer focused
Uniquely Providing integrated tailored supply chain solutions solutions
Brand Operational reputation excellence
With a focus on industry leading customers, we provide engineered material solutions and services at the desired performance level, in the timeframe needed
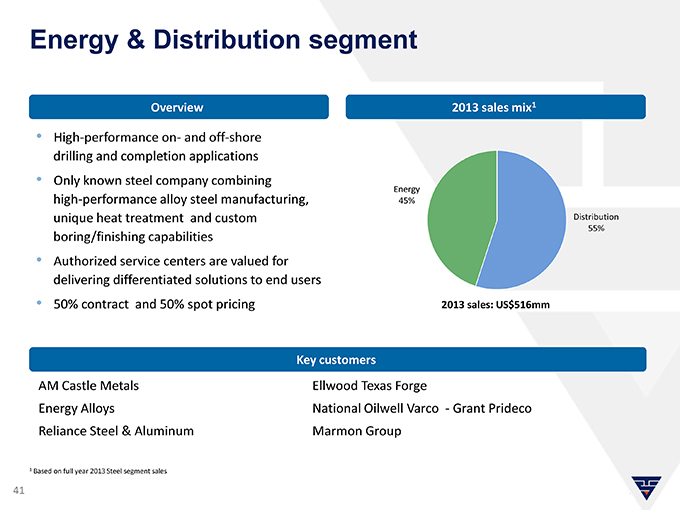
Energy & Distribution segment
Overview 2013 sales mix1
• |
| High-performance on- and off-shore drilling and completion applications |
• |
| Only known steel company combining Energy high-performance alloy steel manufacturing, 45% unique heat treatment and custom Distribution |
55%
boring/finishing capabilities
• |
| Authorized service centers are valued for delivering differentiated solutions to end users |
• |
| 50% contract and 50% spot pricing 2013 sales: US$516mm |
Key customers
AM Castle Metals Ellwood Texas Forge
Energy Alloys National Oilwell Varco —Grant Prideco Reliance Steel & Aluminum Marmon Group
1 |
| Based on full year 2013 Steel segment sales |
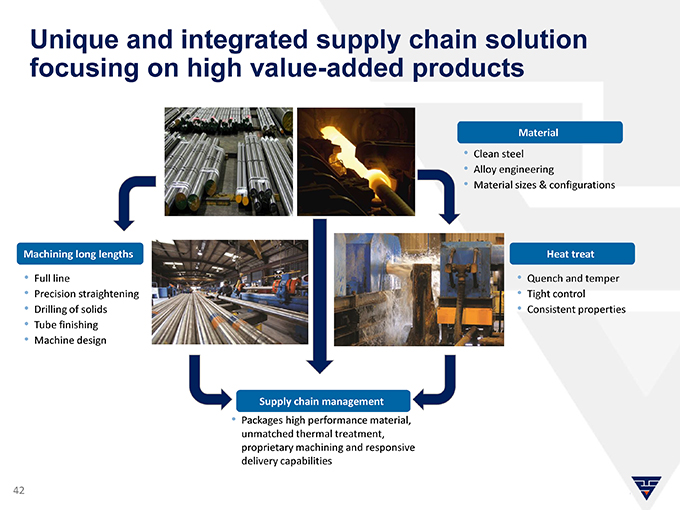
Unique and integrated supply chain solution focusing on high value-added products
Material
• |
| Clean steel |
• |
| Alloy engineering |
• |
| Material sizes & configurations |
Machining long lengths Heat treat
• |
| Full line Quench and temper |
• |
| Precision straightening Tight control |
• |
| Drilling of solids Consistent properties |
• |
| Tube finishing |
• |
| Machine design |
Supply chain management
• |
| Packages high performance material, unmatched thermal treatment, proprietary machining and responsive delivery capabilities |
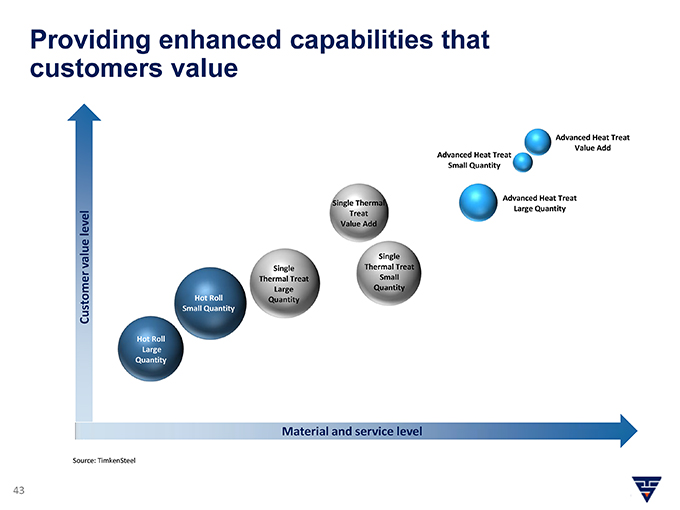
Providing enhanced capabilities that customers value
Advanced Heat Treat Value Add Advanced Heat Treat Small Quantity
Advanced Heat Treat Single Thermal Treat Large Quantity level Value Add value Single Single Thermal Treat Thermal Treat Small Large Quantity Hot Roll Quantity Customer Small Quantity Hot Roll Large Quantity
Material and service level
Source: TimkenSteel
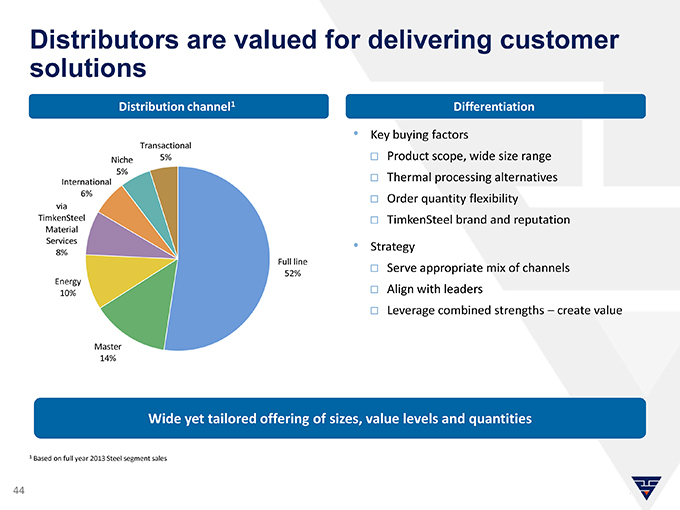
Distributors are valued for delivering customer solutions
Distribution channel1 Differentiation
• |
| Key buying factors |
Transactional
Niche 5% Product scope, wide size range
5%
Thermal processing alternatives
International 6%
via Order quantity flexibility
TimkenSteel TimkenSteel brand and reputation
Material Services
• |
| Strategy |
8%
Full line
Serve appropriate mix of channels
52% Energy
10% Align with leaders
Leverage combined strengths – create value
Master 14%
Wide yet tailored offering of sizes, value levels and quantities
1 |
| Based on full year 2013 Steel segment sales |
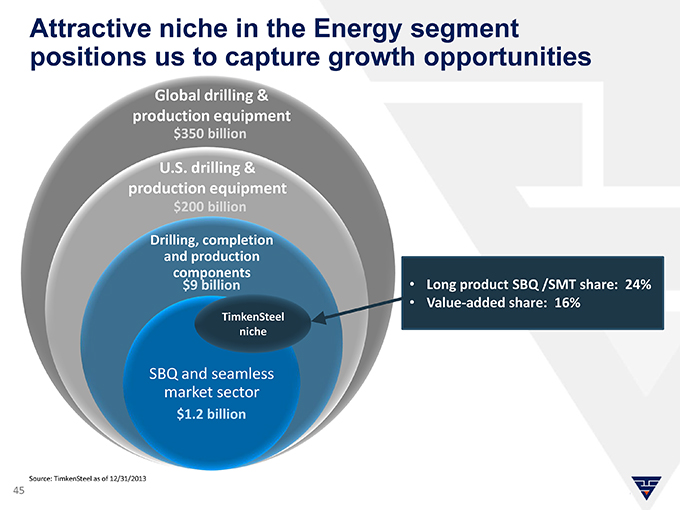
Attractive niche in the Energy segment positions us to capture growth opportunities
Global drilling & production equipment
$350 billion
U.S. drilling & production equipment
$200 billion
Drilling, completion and production components $9 billion • Long product SBQ /SMT share: 24%
• |
| Value-added share: 16% |
TimkenSteel niche
SBQ and seamless market sector
$1.2 billion
Source: TimkenSteel as of 12/31/2013
45
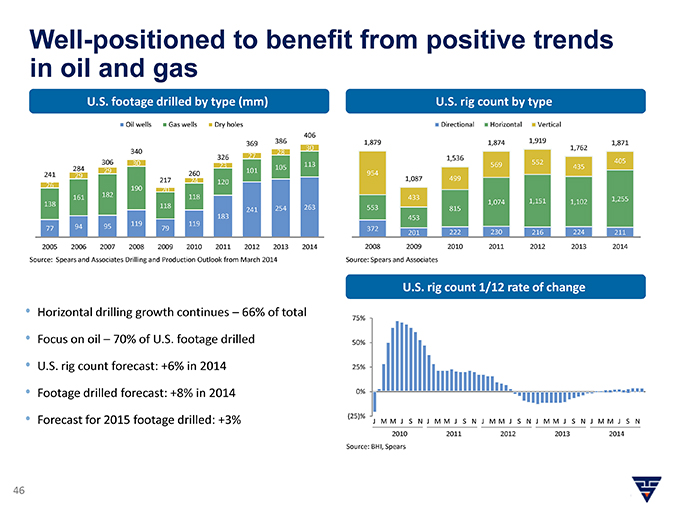
Well-positioned to benefit from positive trends in oil and gas
U.S. footage drilled by type (mm) U.S. rig count by type
Oil wells Gas wells Dry holes Directional Horizontal Vertical 386 406 1,919
369 30 1,879 1,874 1,762 1,871 340 28 326 27 1,536 306 30 552 405
23 113 569 435 284 105
29 101 954 241 29 260
217 24 1,087 499 120 26 190 20 161 182 118 433
1,151 1,255 138 1,074 1,102 118 254 263 553 815 241 183 453
95 119 119
77 94 79 372 201 222 230 216 224 211 2005 2006 2007 2008 2009 2010 2011 2012 2013 2014 2008 2009 2010 2011 2012 2013 2014 Source: Spears and Associates Drilling and Production Outlook from March 2014 Source: Spears and Associates
U.S. rig count 1/12 rate of change
• |
| Horizontal drilling growth continues – 66% of total |
75%
• |
| Focus on oil – 70% of U.S. footage drilled 50% |
• |
| U.S. rig count forecast: +6% in 2014 25% |
• |
| Footage drilled forecast: +8% in 2014 0% |
• |
| Forecast for 2015 footage drilled: +3% (25)% J M M J S N J M M J S N J M M J S N J M M J S N J M M J S N |
2010 2011 2012 2013 2014 Source: BHI, Spears
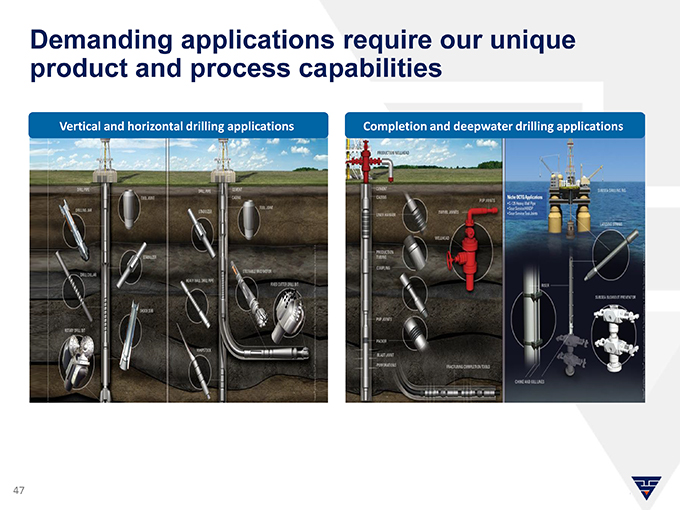
Demanding applications require our unique product and process capabilities
Vertical and horizontal drilling applications Completion and deepwater drilling applications
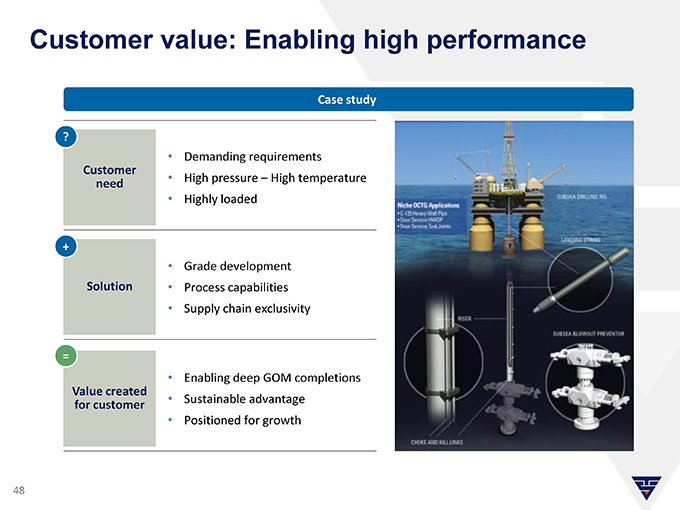
Customer value: Enabling high performance
Case study
?
• |
| Demanding requirements |
Customer
• |
| High pressure – High temperature need |
• |
| Highly loaded |
+
• |
| Grade development Solution Process capabilities |
• |
| Supply chain exclusivity |
=
• |
| Enabling deep GOM completions |
Value created
• |
| Sustainable advantage for customer |
• |
| Positioned for growth |
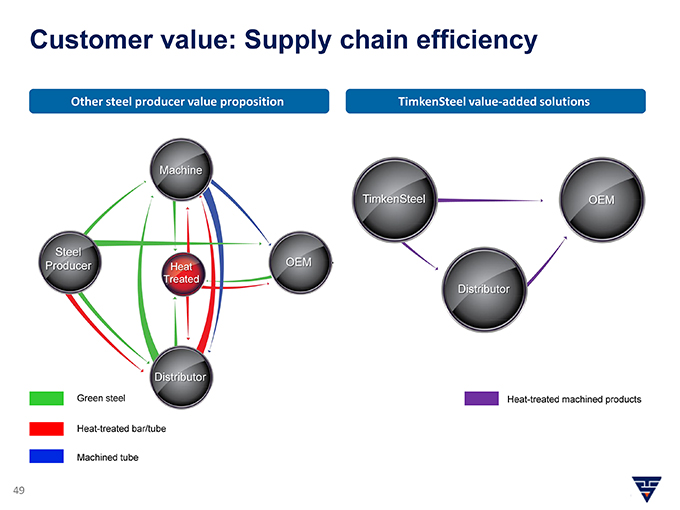
Customer value: Supply chain efficiency
Other steel producer value proposition TimkenSteel value-added solutions
Machine
TimkenSteel OEM
Steel OEM Producer Heat
Treated Distributor
Distributor
Green steel Heat-treated machined products Heat-treated bar/tube Machined tube
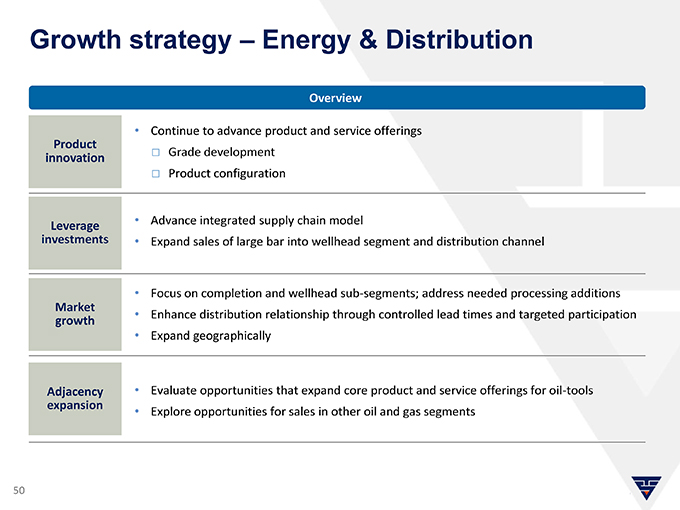
Growth strategy – Energy & Distribution
Overview
• |
| Continue to advance product and service offerings |
Product
Grade development innovation
Product configuration
• |
| Advance integrated supply chain model |
Leverage investments • Expand sales of large bar into wellhead segment and distribution channel
• |
| Focus on completion and wellhead sub-segments; address needed processing additions |
Market
• |
| Enhance distribution relationship through controlled lead times and targeted participation growth |
• |
| Expand geographically |
Adjacency • Evaluate opportunities that expand core product and service offerings for oil-tools expansion
• |
| Explore opportunities for sales in other oil and gas segments |

Energy & Distribution – key takeaways
• |
| Work closely with selected distribution channel partners to best reach targeted share participation levels leveraging one another’s strengths |
• |
| Serve global Energy OEM and service companies for their most critical applications operating in harsh environments |
• |
| With a proven history and extension of capabilities through organic growth and acquisition, our Energy offerings are valued and trusted by industry leaders |
• |
| Continue to grow globally our unique and integrated supply chain solution set which combines high performance materials, unmatched thermal treatment, proprietary machining processes and responsive delivery capabilities |
Industrial & Mobile
Bob Keeler
Executive Vice President –
Industrial & Mobile
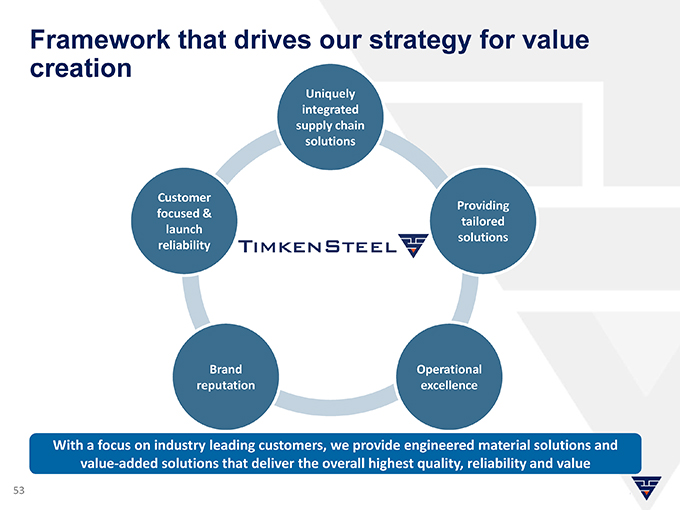
Framework that drives our strategy for value creation
Uniquely integrated supply chain solutions
Customer
Providing focused & tailored launch solutions reliability
Brand Operational reputation excellence
With a focus on industry leading customers, we provide engineered material solutions and value-added solutions that deliver the overall highest quality, reliability and value
Industrial & Mobile segment
Overview 2013 sales mix
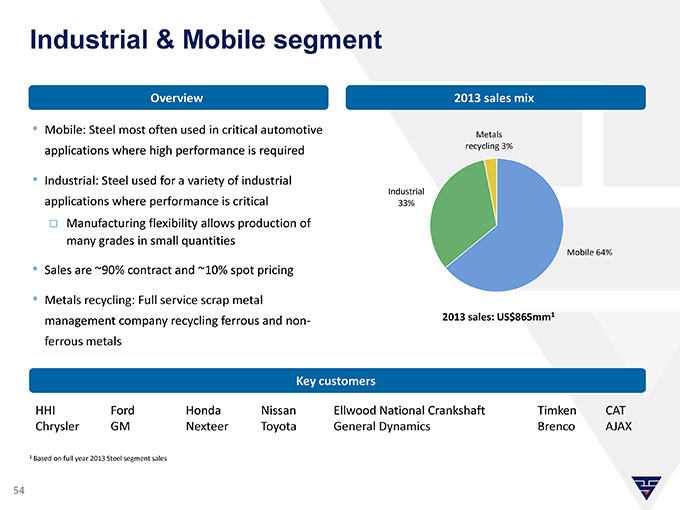
• |
| Mobile: Steel most often used in critical automotive Metals applications where high performance is required recycling 3% |
• |
| Industrial: Steel used for a variety of industrial |
Industrial
applications where performance is critical 33% Manufacturing flexibility allows production of many grades in small quantities
Mobile 64%
• |
| Sales are ~90% contract and ~10% spot pricing |
• |
| Metals recycling: Full service scrap metal |
2013 sales: US$865mm1
management company recycling ferrous and non-ferrous metals
Key customers
HHI Ford Honda Nissan Ellwood National Crankshaft Timken CAT Chrysler GM Nexteer Toyota General Dynamics Brenco AJAX
1 |
| Based on full year 2013 Steel segment sales |
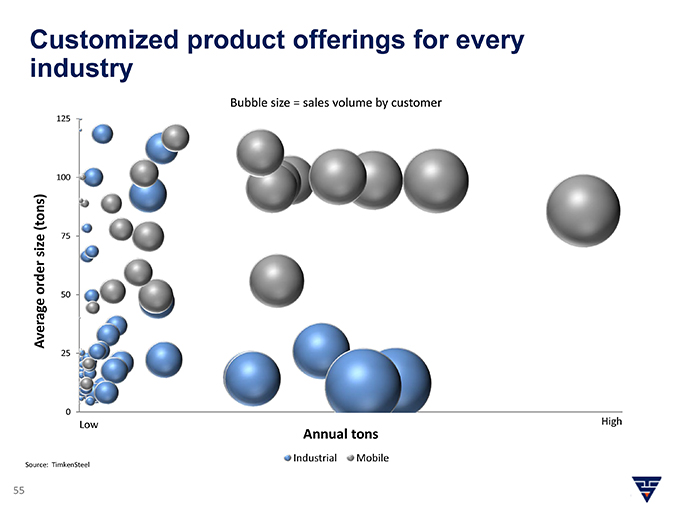
Customized product offerings for every industry
Bubble size = sales volume by customer
125
100
(tons) size 75 order
50
Average 25
0
Low High
Annual tons
Source: TimkenSteel Industrial Mobile
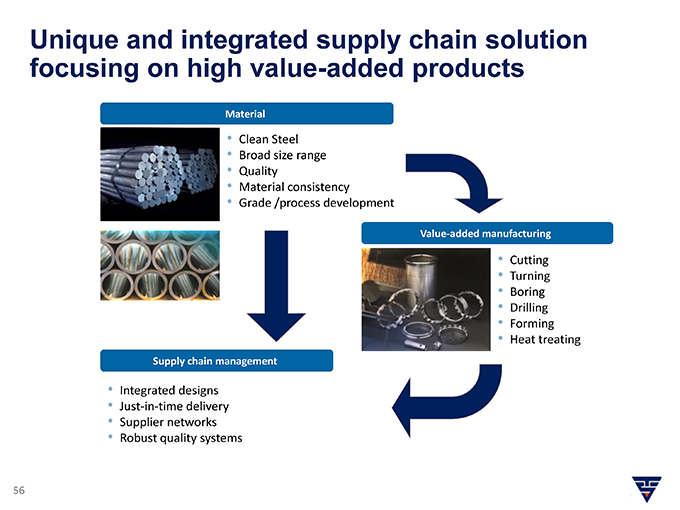
Unique and integrated supply chain solution focusing on high value-added products
Material
• |
| Clean Steel |
• |
| Broad size range |
• |
| Quality |
• |
| Material consistency |
• |
| Grade /process development |
Value-added manufacturing
• |
| Cutting |
• |
| Turning |
• |
| Boring |
• |
| Drilling |
• |
| Forming |
• |
| Heat treating |
Supply chain management
• |
| Integrated designs |
• |
| Just-in-time delivery |
• |
| Supplier networks |
• |
| Robust quality systems |
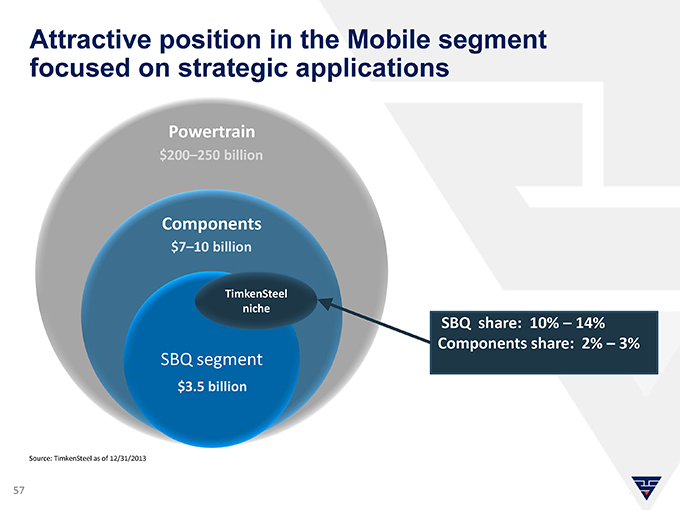
Attractive position in the Mobile segment focused on strategic applications
Powertrain
$200–250 billion
Components
$7–10 billion
TimkenSteel niche
SBQ share: 10% – 14% Components share: 2% – 3%
SBQ segment
$3.5 billion
Source: TimkenSteel as of 12/31/2013
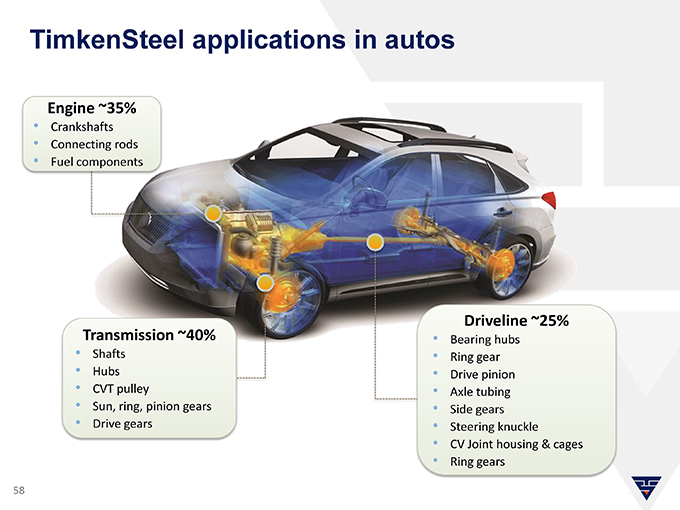
TimkenSteel applications in autos
Engine ~35%
• |
| Crankshafts |
• |
| Connecting rods |
• |
| Fuel components |
Driveline ~25%
Transmission ~40% • Bearing hubs
• |
| Shafts Ring gear |
• |
| Hubs Drive pinion |
• |
| CVT pulley Axle tubing |
• |
| Sun, ring, pinion gears Side gears |
• |
| Drive gears Steering knuckle |
• |
| CV Joint housing & cages |
• |
| Ring gears |
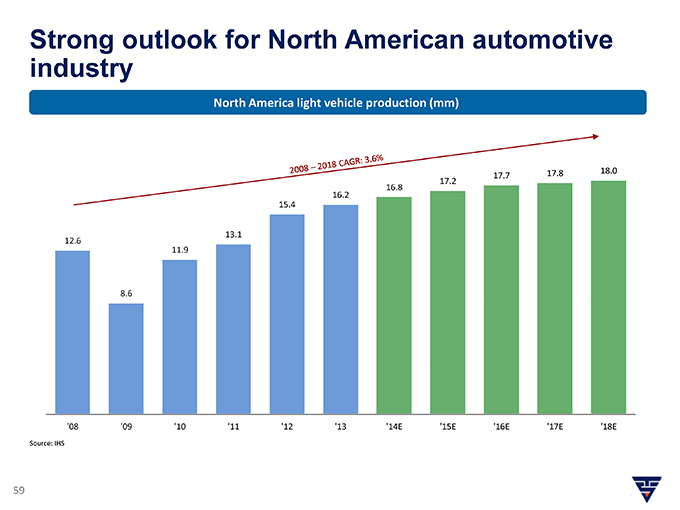
Strong outlook for North American automotive industry
North America light vehicle production (mm)
17.8 18.0
17.7
17.2
16.8
16.2
15.4
13.1
12.6
11.9 8.6
‘08 ‘09 ‘10 ‘11 ‘12 ‘13 ‘14E ‘15E ‘16E ‘17E ‘18E
Source: IHS
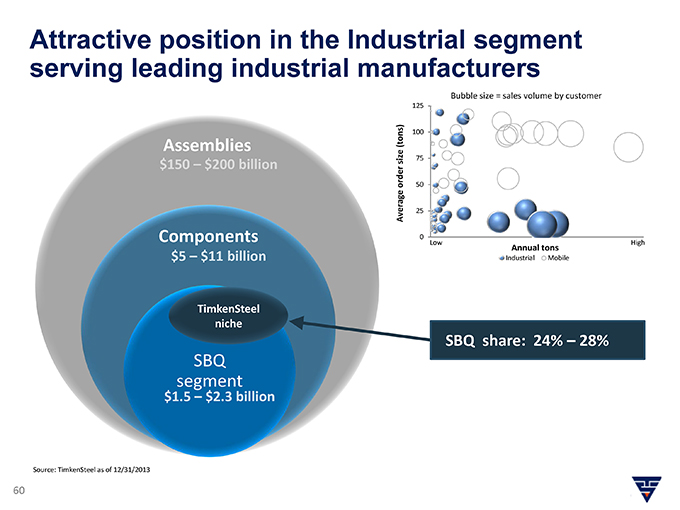
Attractive position in the Industrial segment serving leading industrial manufacturers
Bubble size = sales volume by customer
125
(tons) 100
Assemblies
size 75
$150 – $200 billion
order 50 Average 25
Components 0 Low High
Annual tons
$5 – $11 billion Industrial Mobile
TimkenSteel niche
SBQ share: 24% – 28%
SBQ segment
$1.5 – $2.3 billion
Source: TimkenSteel as of 12/31/2013
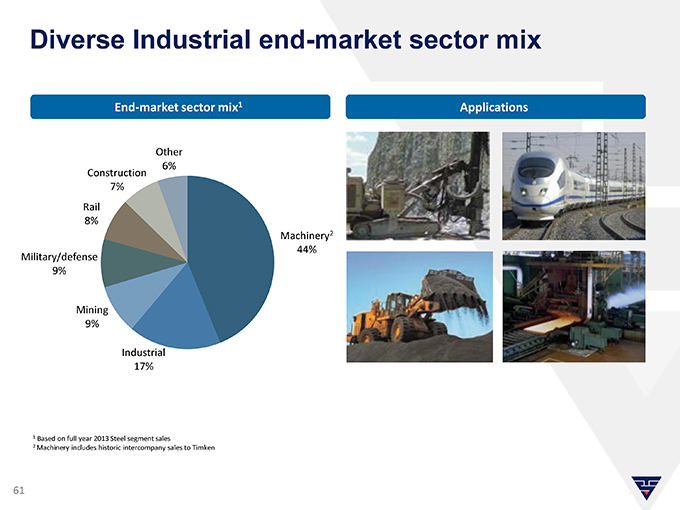
Diverse Industrial end-market sector mix
End-market sector mix1 Applications
Other
6%
Construction 7%
Rail 8%
Machinery2 44% Military/defense 9%
Mining
9%
Industrial
17%
1 |
| Based on full year 2013 Steel segment sales |
2 |
| Machinery includes historic intercompany sales to Timken |
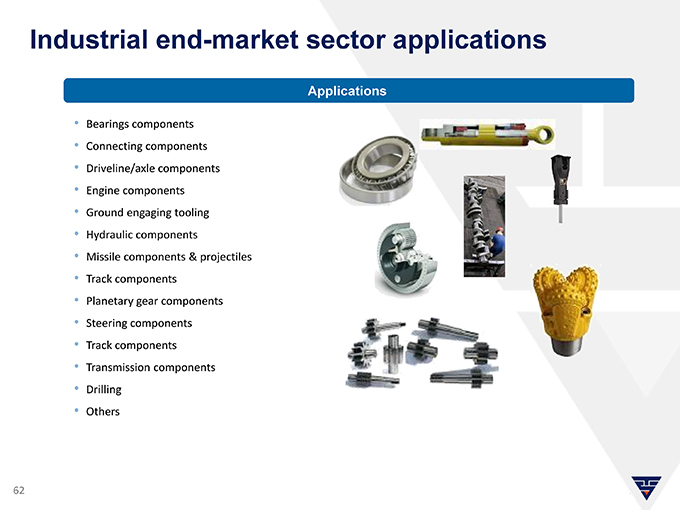
Industrial end-market sector applications
Applications
• |
| Bearings components |
• |
| Connecting components |
• |
| Driveline/axle components |
• |
| Engine components |
• |
| Ground engaging tooling |
• |
| Hydraulic components |
• |
| Missile components & projectiles |
• |
| Track components |
• |
| Planetary gear components |
• |
| Steering components |
• |
| Track components |
• |
| Transmission components |
• |
| Drilling |
• |
| Others |

U.S. industry continues to recover
U.S. industrial segments U.S. manufacturing PMI index, seasonally adjusted
% YOY Change
60
Segment 2014E 2015E
Industrial machinery segment 5.4 5.7
RR—equipment segment 7.7 3.1
Mining machinery segment 5.7 4.9 50 Construction machinery segment 3.3 4.6 Agricultural machinery segment (1.1) (0.3)
40
Cement segment 4.2 8.7 Engine, turbine, power trans segment 6.5 7.2 Utilities segment 3.1 1.3
Iron and steel segment 0.3 7.2 30
Jan-08 May-09 Aug-10 Nov-11 Feb-13 May-14
Source: IHS as of April 2014 Source: Bloomberg
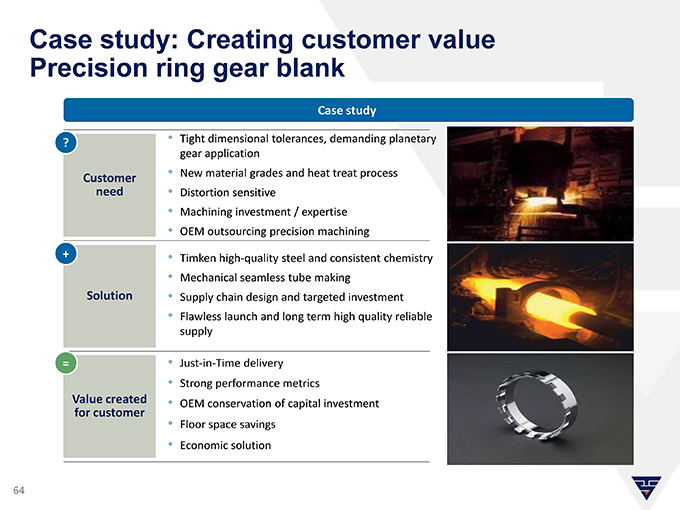
Case study: Creating customer value
Precision ring gear blank
Case study
? • Tight dimensional tolerances, demanding planetary gear application Customer • New material grades and heat treat process need • Distortion sensitive
• |
| Machining investment / expertise |
• |
| OEM outsourcing precision machining |
+ • Timken high-quality steel and consistent chemistry
• |
| Mechanical seamless tube making |
Solution • Supply chain design and targeted investment
• |
| Flawless launch and long term high quality reliable supply |
= • Just-in-Time delivery
• |
| Strong performance metrics |
Value created • OEM conservation of capital investment for customer
• |
| Floor space savings |
• |
| Economic solution |
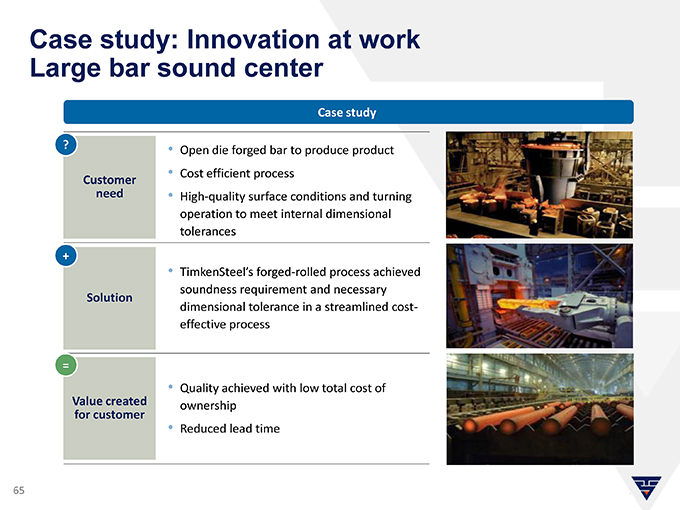
Case study: Innovation at work
Large bar sound center
Case study
?
• |
| Open die forged bar to produce product |
• |
| Cost efficient process |
Customer need
• |
| High-quality surface conditions and turning operation to meet internal dimensional tolerances |
+
• |
| TimkenSteel’s forged-rolled process achieved soundness requirement and necessary |
Solution dimensional tolerance in a streamlined cost-effective process
=
• |
| Quality achieved with low total cost of |
Value created ownership for customer
• |
| Reduced lead time |
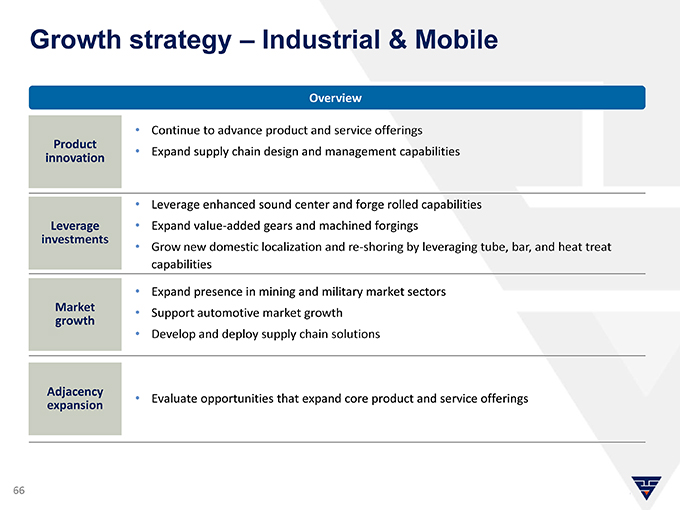
Growth strategy – Industrial & Mobile
Overview
• |
| Continue to advance product and service offerings |
Product
• |
| Expand supply chain design and management capabilities innovation |
• |
| Leverage enhanced sound center and forge rolled capabilities Leverage Expand value-added gears and machined forgings investments |
• |
| Grow new domestic localization and re-shoring by leveraging tube, bar, and heat treat capabilities |
• |
| Expand presence in mining and military market sectors |
Market
• |
| Support automotive market growth growth |
• |
| Develop and deploy supply chain solutions |
Adjacency
• |
| Evaluate opportunities that expand core product and service offerings expansion |
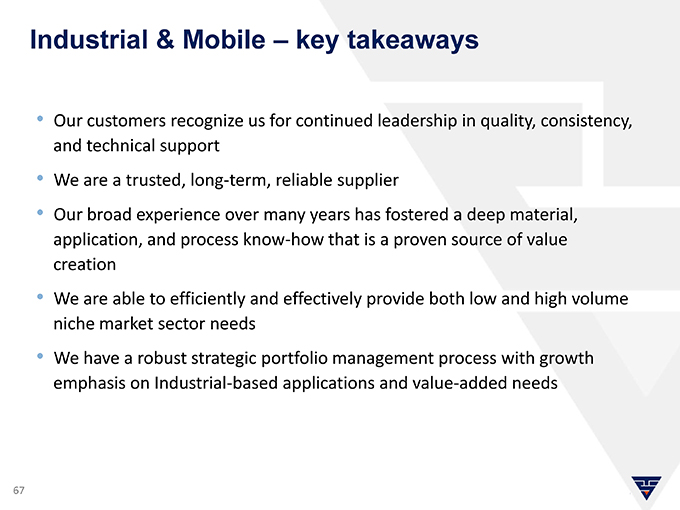
Industrial & Mobile – key takeaways
• |
| Our customers recognize us for continued leadership in quality, consistency, and technical support |
• |
| We are a trusted, long-term, reliable supplier |
• |
| Our broad experience over many years has fostered a deep material, application, and process know-how that is a proven source of value creation |
• |
| We are able to efficiently and effectively provide both low and high volume niche market sector needs |
• |
| We have a robust strategic portfolio management process with growth emphasis on Industrial-based applications and value-added needs |
Financial performance review and guidance
Chris Holding
Executive Vice President and
Chief Financial Officer
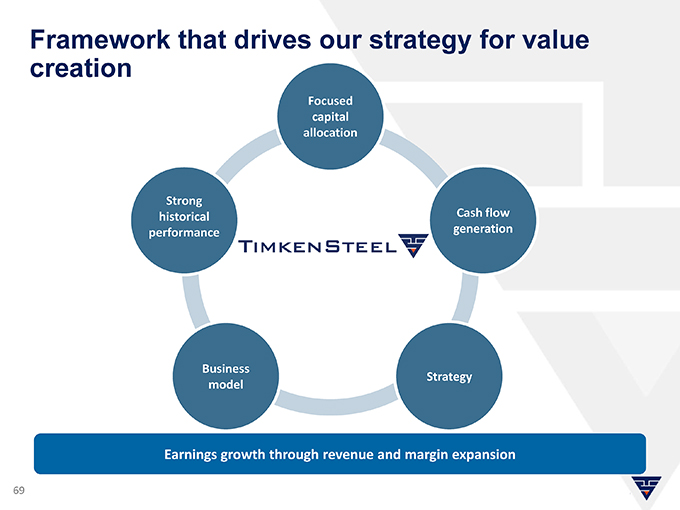
Framework that drives our strategy for value creation
Focused capital allocation
Strong historical Cash flow performance generation
Business
Strategy model
Earnings growth through revenue and margin expansion
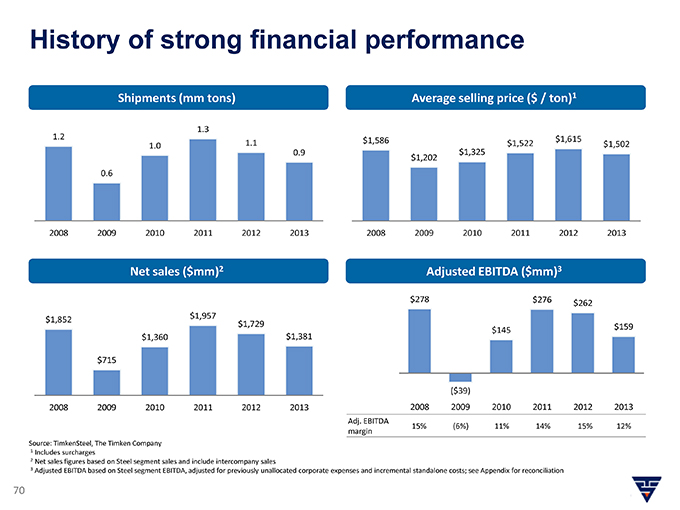
History of strong financial performance
Shipments (mm tons) Average selling price ($ / ton)1
1.2 1.3 $1,586 $1,615
1.0 1.1 $1,522 $1,502 0.9 $1,325 $1,202 0.6
2008 2009 2010 2011 2012 2013 2008 2009 2010 2011 2012 2013
Net sales ($mm)2 Adjusted EBITDA ($mm)3
$278 $276 $262 $1,957 $1,852 $1,729 $159 $145 $1,360 $1,381
$715
($39)
2008 2009 2010 2011 2012 2013 2008 2009 2010 2011 2012 2013
Adj. EBITDA
15% (6%) 11% 14% 15% 12% margin
Source: TimkenSteel, The Timken Company
1 |
| Includes surcharges |
2 |
| Net sales figures based on Steel segment sales and include intercompany sales |
3 Adjusted EBITDA based on Steel segment EBITDA, adjusted for previously unallocated corporate expenses and incremental standalone costs; see Appendix for reconciliation
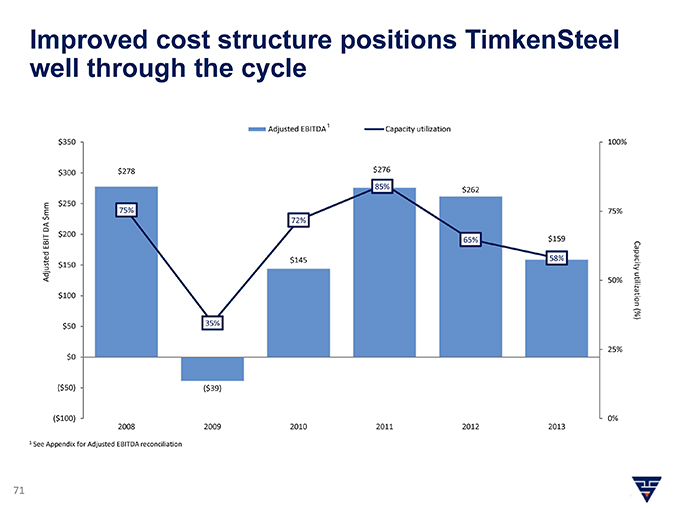
Improved cost structure positions TimkenSteel well through the cycle
1 |
|
Adjusted EBITDA Capacity utilization $350 100%
$300 $278 $276 85% $262 $250 mm 75% 75% $ 72% DA $200 EBIT 65% $159 $150 $145 58% Capacity Adjusted 50% $100 utilization (%) 35% $50
25% $0
($50) ($39)
($100) 0% 2008 2009 2010 2011 2012 2013
1 |
| See Appendix for Adjusted EBITDA reconciliation |
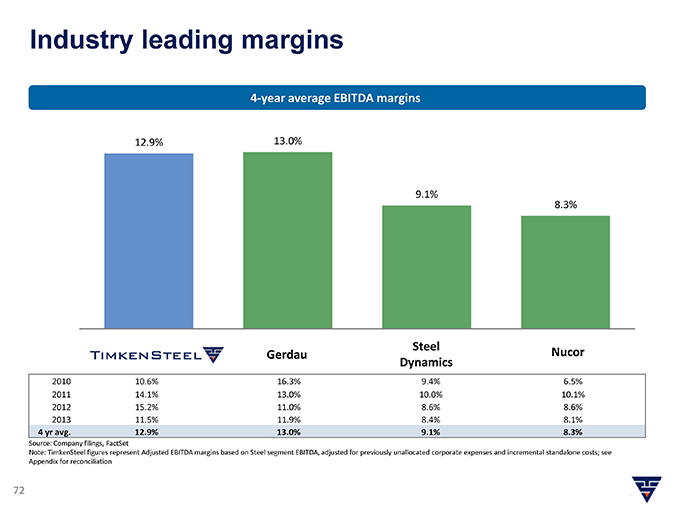
Industry leading margins
4-year average EBITDA margins
12.9% 13.0%
9.1%
8.3%
Steel
Gerdau Dynamics Nucor
2010 10.6% 16.3% 9.4% 6.5% 2011 14.1% 13.0% 10.0% 10.1% 2012 15.2% 11.0% 8.6% 8.6% 2013 11.5% 11.9% 8.4% 8.1%
4 |
| yr avg. 12.9% 13.0% 9.1% 8.3% |
Source: Company filings, FactSet
Note: TimkenSteel figures represent Adjusted EBITDA margins based on Steel segment EBITDA, adjusted for previously unallocated corporate expenses and incremental standalone costs; see Appendix for reconciliation
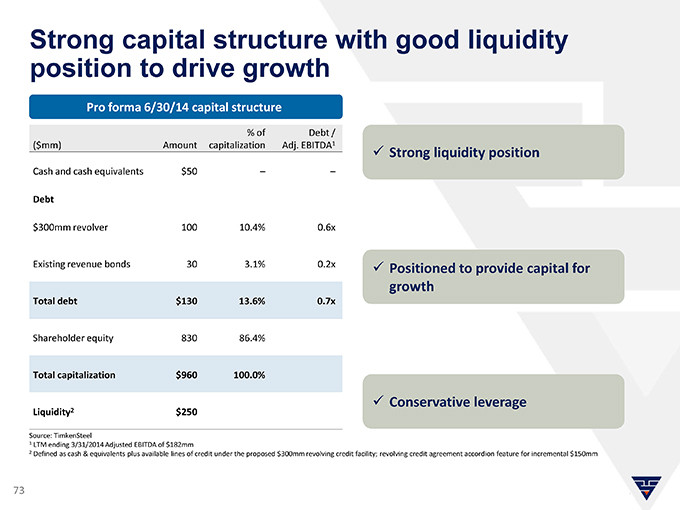
Strong capital structure with good liquidity position to drive growth
Pro forma 6/30/14 capital structure
% of Debt /
($mm) Amount capitalization Adj. EBITDA1 liquidity position
Strong
Cash and cash equivalents $50 – –
Debt
$300mm revolver 100 10.4% 0.6x
Existing revenue bonds 30 3.1% 0.2x Positioned to provide capital for growth
Total debt $130 13.6% 0.7x
Shareholder equity 830 86.4%
Total capitalization $960 100.0%
Conservative leverage
Liquidity2 $250
Source: TimkenSteel
1 |
| LTM ending 3/31/2014 Adjusted EBITDA of $182mm |
2 Defined as cash & equivalents plus available lines of credit under the proposed $300mm revolving credit facility; revolving credit agreement accordion feature for incremental $150mm
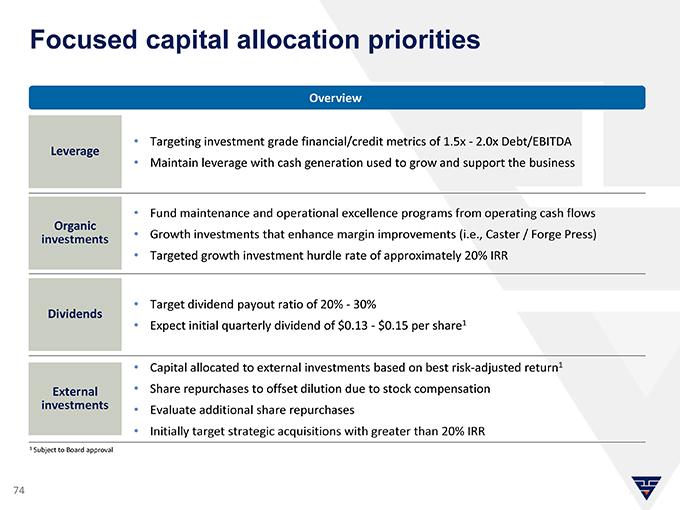
Focused capital allocation priorities
Overview
Leverage • Targeting investment grade financial/credit metrics of 1.5x—2.0x Debt/EBITDA
• |
| Maintain leverage with cash generation used to grow and support the business |
• |
| Fund maintenance and operational excellence programs from operating cash flows |
Organic investments • Growth investments that enhance margin improvements (i.e., Caster / Forge Press)
• |
| Targeted growth investment hurdle rate of approximately 20% IRR |
Dividends • Target dividend payout ratio of 20%—30%
• |
| Expect initial quarterly dividend of $0.13—$0.15 per share1 |
• |
| Capital allocated to external investments based on best risk-adjusted return1 External Share repurchases to offset dilution due to stock compensation investments Evaluate additional share repurchases |
• |
| Initially target strategic acquisitions with greater than 20% IRR |
1 |
| Subject to Board approval |

Investments that reinforce capabilities and grow market position
Capital expenditure ($mm)
Growth Maintenance & continuous improvement Growth Maintenance & continuous improvement Separation related
$180 $171 $165-$175 $45 $50 $120-$130
$45-$55 $100-$110
$96 $99
$45-$55
$45-$55
$43 $62 $135
$43 $121 $28
$52 $34
$22 $36
$6 $9
2008 2009 2010 2011 2012 2013 2014E 2015E 2016E
Source: TimkenSteel as of May 31, 2014
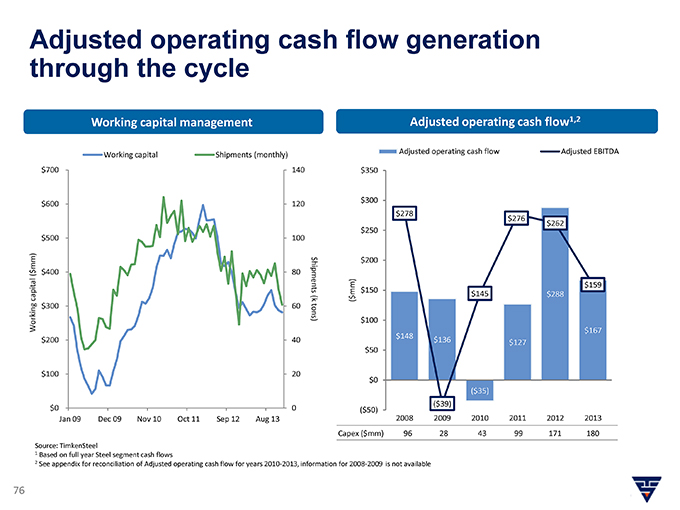
Adjusted operating cash flow generation through the cycle
Working capital management Adjusted operating cash flow1,2
Adjusted operating cash flow Adjusted EBITDA Working capital Shipments (monthly)
$700 140 $350
$300 $600 120 $278 $276 $262 $250 $500 100
mm) $200
$ ( $400 80 $159 Shipments mm) $150 $145 $288 capital (k ( $ $300 60 tons) Working $100 $167 $148 $200 40 $136 $127 $50
$100 20 $0
($35)
($39)
$0 0 ($50)
Jan 09 Dec 09 Nov 10 Oct 11 Sep 12 Aug 13 2008 2009 2010 2011 2012 2013 Capex ($mm) 96 28 43 99 171 180
Source: TimkenSteel
1 |
| Based on full year Steel segment cash flows |
2 See appendix for reconciliation of Adjusted operating cash flow for years 2010-2013, information for 2008-2009 is not available
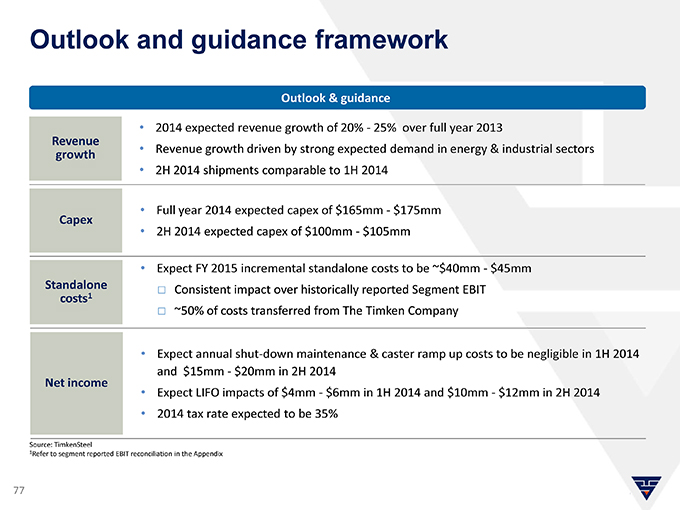
Outlook and guidance framework
Outlook & guidance
• |
| 2014 expected revenue growth of 20%—25% over full year 2013 |
Revenue
• |
| Revenue growth driven by strong expected demand in energy & industrial sectors growth |
• |
| 2H 2014 shipments comparable to 1H 2014 |
Capex • Full year 2014 expected capex of $165mm—$175mm
• |
| 2H 2014 expected capex of $100mm—$105mm |
• |
| Expect FY 2015 incremental standalone costs to be ~$40mm—$45mm Standalone over historically Segment EBIT |
Consistent impact reported costs1
~50% of costs transferred from The Timken Company
• |
| Expect annual shut-down maintenance & caster ramp up costs to be negligible in 1H 2014 and $15mm—$20mm in 2H 2014 Net income LIFO impacts of $4mm—$6mm in 1H 10mm—$12mm in 2H 2014 |
• |
| Expect 2014 and $ |
• |
| 2014 tax rate expected to be 35% |
Source: TimkenSteel
1Refer to segment reported EBIT reconciliation in the Appendix
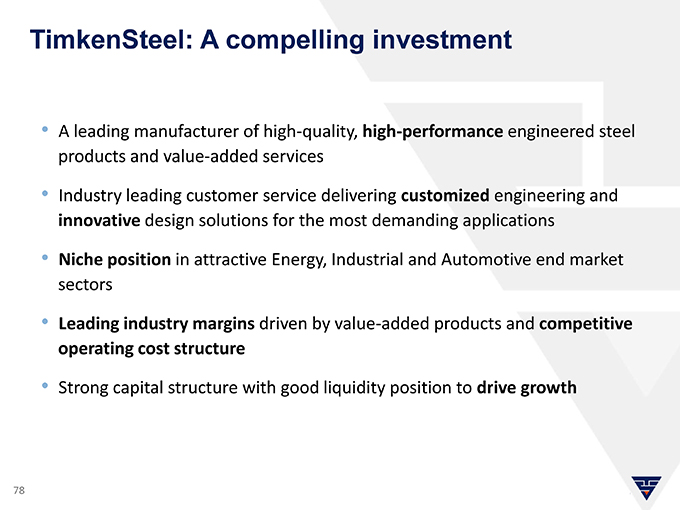
TimkenSteel: A compelling investment
• |
| A leading manufacturer of high-quality, high-performance engineered steel products and value-added services |
• |
| Industry leading customer service delivering customized engineering and innovative design solutions for the most demanding applications |
• |
| Niche position in attractive Energy, Industrial and Automotive end market sectors |
• |
| Leading industry margins driven by value-added products and competitive operating cost structure |
• |
| Strong capital structure with good liquidity position to drive growth |
Appendix
TimkenSteel team biographies
Ward J. “Tim” Timken, Jr.
Chairman, CEO and President
Ward J. “Tim” Timken, Jr., is Chairman, CEO and President of TimkenSteel Corporation, leading its transition to a strong and independent company.
Tim most recently served as Chairman of The Timken Company, leading a strategy that resulted in more than tripling the stock price during his tenure. He joined Timken’s Steel business in 1992 and progressed through a series of roles in sales and marketing management and geographic leadership in Europe and Latin America, where he helped fuel the company’s global growth. He served as Vice Chairman, playing a pivotal role in the development of the strategy that expanded the company’s product portfolio into industrial market segments. He also served as President of Steel before being named company Chairman in 2005.
Earlier in his career, Tim opened and managed the Washington, D.C., office of McGough & Associates, a Columbus, Ohio-based government affairs consulting firm.
Tim serves on the boards of Team NEO and the American Iron and Steel Institute, where he served as Chairman of each. Additional board memberships include Pella Corporation, the National Association of Manufacturers Executive Committee, the Ohio Business Development Council, the Ohio Business Roundtable Executive Committee, the Stark Development Board, and the Timken Foundation. Tim also serves as a trustee of the TimkenSteel Charitable Fund.
He holds a bachelor’s degree in marketing from Georgetown University and a Master of Business Administration degree from the Darden School at the University of Virginia.
TimkenSteel team biographies
Thomas D. Moline
Executive Vice President of Manufacturing
Thomas D. Moline is Executive Vice President of TimkenSteel, overseeing all steelmaking operations of the new company, ensuring a focus on safety, quality and efficiency.
Tom has held those responsibilities since 2006 when the business was part of The Timken Company. Tom joined the
Steel business in 1984 to serve as an engineer on the team that built the company’s Faircrest Steel Plant. Throughout his career, he served in numerous leadership positions in manufacturing, including managing the Harrison Steel Plant and serving as director of operations at a tube-manufacturing facility in the United Kingdom.
Active in his local community, Tom serves on the board of the Ohio and Erie Canalway Association.
Tom earned his bachelor’s degree in manufacturing engineering from Miami University in Oxford, Ohio.
TimkenSteel team biographies
Shawn J. Seanor
Executive Vice President of Energy and Distribution
Shawn J. Seanor, Executive Vice President at TimkenSteel, leads the company’s Energy and Distribution segment.
He directs the sales, marketing, distribution and customer engineering for the segment, including the TimkenSteel Material Services subsidiary.
Shawn most recently held the same position when the Steel business was part of The Timken Company. He joined the company in 1984 as part of the project management team that launched the Faircrest Steel Plant. After serving in purchasing and supply chain, he joined the company’s team of sales engineers, cultivating a broad understanding of steel customers and their applications during assignments in Dallas, Cleveland and Detroit. He subsequently served as Director – Marketing & Business Development, broadening the scope and value of steel products and services.
An active volunteer, Shawn serves on an impact council of the United Way of Greater Stark County in Ohio.
He holds a bachelor’s degree in management engineering from Grove City College and a master’s degree in business administration from Kent State University.
TimkenSteel team biographies
Robert N. Keeler
Executive Vice President of Industrial and Mobile
Robert N. Keeler, Executive Vice President at TimkenSteel, leads the company’s Industrial and Mobile segment. He directs the sales, marketing and customer engineering for the segment. He also manages the company’s precision components plant in Eaton, Ohio.
Bob most recently held the same position when the Steel business was part of The Timken Company. He joined the company in 1979 as a sales engineer, building a deep knowledge of steel customers and their applications. He went on to hold positions of increasing responsibility in sales and marketing.
A leader in industry, Bob also has served on the board of directors for the Metal Service Center Institute and the Forging Industry Association. He also is active in his local community as a member of the board of United Way of Greater Stark County.
Bob has a bachelor’s degree in metallurgical engineering from Grove City College and a master’s degree in business administration from the Joseph M. Katz Graduate School of Business at the University of Pittsburgh.
TimkenSteel team biographies
Christopher J. Holding
Executive Vice President and Chief Financial Officer
Christopher J. Holding, Executive Vice President and Chief Financial Officer for TimkenSteel, is responsible for the company’s financial planning, management and reporting.
He leads a team responsible for financial planning and analysis, controllership, investor relations, tax planning, treasury, and risk management activities. Chris also serves as Treasurer of the TimkenSteel Charitable Fund. Chris previously served as Senior Vice President of Tax and Treasury for The Timken Company, which he joined in 2004. His previous Timken Company roles were Global Business Segment Controller and Global Operations Controller. Prior to that, he held financial management positions with Arthur Andersen & Company and notable privately held companies.
Chris is a member of the American Institute of Certified Public Accountants and Financial Executives International. He serves on the CFO Council of the Manufacturers Alliance/MAPI and the board of the Akron Canton Airport in Ohio. He also volunteers his time as a board member of Project Rebuild and the Jackson Local Schools Foundation in Canton, Ohio.
He earned a bachelor’s degree in accounting and a master’s degree in taxation, both from the University of Cincinnati.
TimkenSteel team biographies
Tina M. Beskid
Director – Investor Relations & Forecast Planning & Analysis
Tina M. Beskid is Director – Investor Relations & Forecast Planning & Analysis for TimkenSteel, overseeing investor and forecasting activities.
Tina joined the Steel business in 2010 as the Operations Controller. Most recently, she served as the Organizational Advancement Manager for Steel. Prior to joining Timken, Tina held various financial management positions with Caterpillar, Eaton Corporation and Deloitte & Touche.
Tina is a member of the American Institute of Certified Public Accountants. She is also active in her local community, serving on the board of the Boys Scouts of America – Buckeye Council.
Tina earned her bachelor’s degree in accounting and philosophy from John Carroll University in University Heights,
Ohio.
Adjusted EBITDA reconciliation
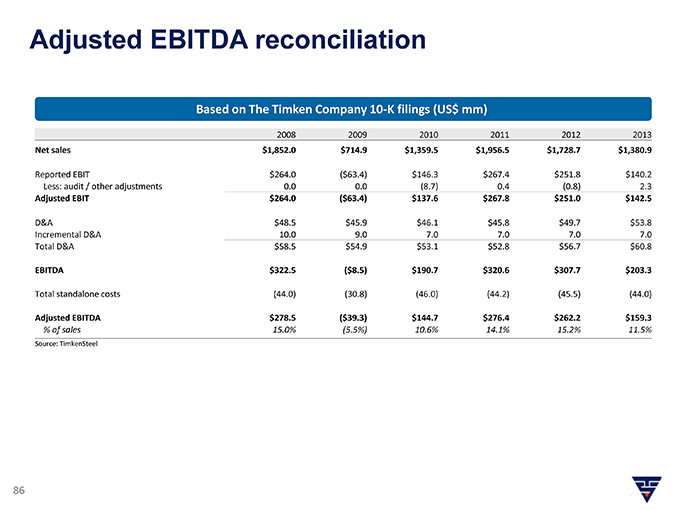
Based on The Timken Company 10-K filings (US$ mm)
2008 2009 2010 2011 2012 2013
Net sales $1,852.0 $714.9 $1,359.5 $1,956.5 $1,728.7 $1,380.9
Reported EBIT $264.0 ($63.4) $146.3 $267.4 $251.8 $140.2 Less: audit / other adjustments 0.0 0.0 (8.7) 0.4 (0.8) 2.3
Adjusted EBIT $264.0 ($63.4) $137.6 $267.8 $251.0 $142.5
D&A $48.5 $45.9 $46.1 $45.8 $49.7 $53.8 Incremental D&A 10.0 9.0 7.0 7.0 7.0 7.0 Total D&A $58.5 $54.9 $53.1 $52.8 $56.7 $60.8
EBITDA $322.5 ($8.5) $190.7 $320.6 $307.7 $203.3
Total standalone costs (44.0) (30.8) (46.0) (44.2) (45.5) (44.0)
Adjusted EBITDA $278.5 ($39.3) $144.7 $276.4 $262.2 $159.3
% of sales 15.0% (5.5%) 10.6% 14.1% 15.2% 11.5%
Source: TimkenSteel
Adjusted EBITDA reconciliation
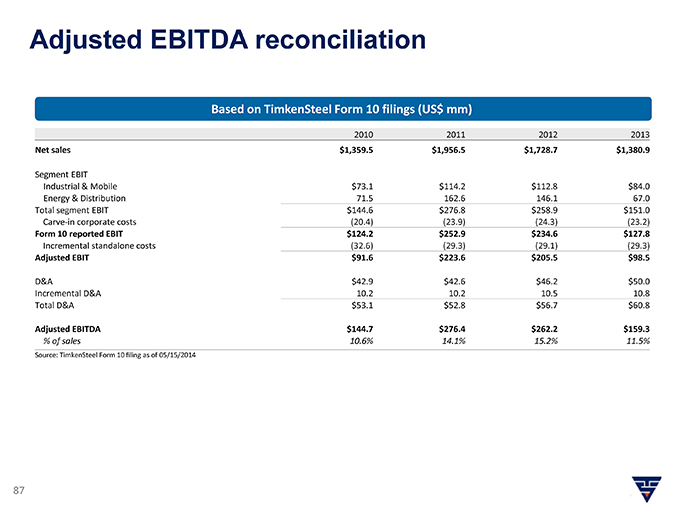
Based on TimkenSteel Form 10 filings (US$ mm)
2010 2011 2012 2013
Net sales $1,359.5 $1,956.5 $1,728.7 $1,380.9
Segment EBIT
Industrial & Mobile $73.1 $114.2 $112.8 $84.0
Energy & Distribution 71.5 162.6 146.1 67.0
Total segment EBIT $144.6 $276.8 $258.9 $151.0
Carve-in corporate costs (20.4) (23.9) (24.3) (23.2)
Form 10 reported EBIT $124.2 $252.9 $234.6 $127.8
Incremental standalone costs (32.6) (29.3) (29.1) (29.3)
Adjusted EBIT $91.6 $223.6 $205.5 $98.5
D&A $42.9 $42.6 $46.2 $50.0
Incremental D&A 10.2 10.2 10.5 10.8
Total D&A $53.1 $52.8 $56.7 $60.8
Adjusted EBITDA $144.7 $276.4 $262.2 $159.3
% of sales 10.6% 14.1% 15.2% 11.5%
Source: TimkenSteel Form 10 filing as of 05/15/2014
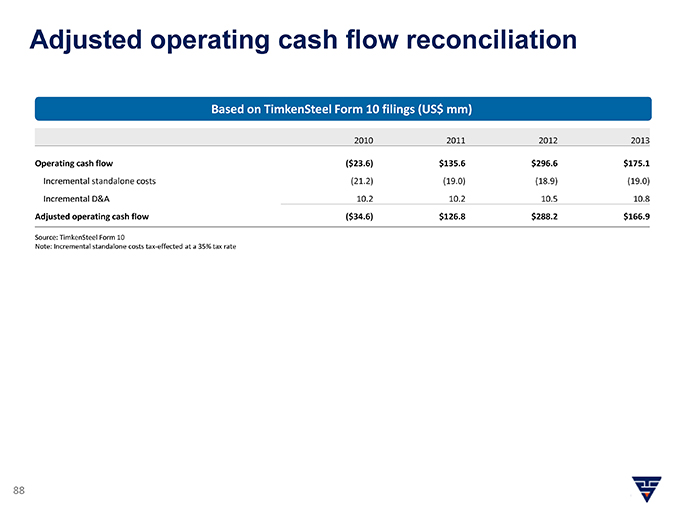
Adjusted operating cash flow reconciliation
Based on TimkenSteel Form 10 filings (US$ mm)
2010 2011 2012 2013
Operating cash flow ($23.6) $135.6 $296.6 $175.1
Incremental standalone costs (21.2) (19.0) (18.9) (19.0)
Incremental D&A 10.2 10.2 10.5 10.8
Adjusted operating cash flow ($34.6) $126.8 $288.2 $166.9
Source: TimkenSteel Form 10
Note: Incremental standalone costs tax-effected at a 35% tax rate
Timken steel