MANAGEMENT INVESTMENT COMPANIES
| Investment Company Act file number | 811-22935 |
| PAX WORLD FUNDS SERIES TRUST III |
| (Exact name of Registrant as specified in charter) |
| 30 Penhallow Street, Suite 400, Portsmouth, NH | 03801 |
| (Address of principal executive offices) | (Zip code) |
Pax World Management LLC 30 Penhallow Street, Suite 400, Portsmouth, NH 03801 Attn.: Joseph Keefe |
| (Name and address of agent for service) |
| Registrant's telephone number, including area code: | 800-767-1729 |
| Date of fiscal year end: | December 31 |
| Date of reporting period: | December 31, 2016 |
| Item 1. | Reports to Stockholders |
Table of Contents |
Glossary of Terms | 1 |
Letter to Shareholders | 5 |
Portfolio Manager Comments and Highlights | |
Pax Large Cap Fund | 9 |
Pax Mid Cap Fund | 11 |
Pax Small Cap Fund | 15 |
Pax ESG Beta Quality Fund (formerly Pax Growth Fund) | 19 |
Pax ESG Beta Dividend Fund | 23 |
Pax MSCI International ESG Index Fund | 25 |
Pax Ellevate Global Women’s Index Fund | 30 |
Pax Global Environmental Markets Fund | 35 |
Pax Core Bond Fund | 41 |
Pax High Yield Bond Fund | 44 |
Pax Balanced Fund | 49 |
Pax Sustainable Managers Capital Appreciation Fund (formerly ESG Managers® Growth and Income Portfolio) | 52 |
Pax Sustainable Managers Total Return Fund (formerly ESG Managers® Income Portfolio) | 56 |
Sustainable Investing Update | 60 |
Shareholder Expense Examples | 62 |
Schedules of Investments | 65 |
Statements of Assets and Liabilities | 110 |
Statements of Operations | 114 |
Statements of Changes in Net Assets | 116 |
Statements of Changes in Net Assets—Shares of Beneficial Interest | 122 |
Financial Highlights | 126 |
Notes to Financial Statements | 146 |
Report of Independent Registered Public Accounting Firm | 173 |
Account Options and Services | 187 |
For More Information | |
General Fund Information 800.767.1729
Shareholder Account Information 800.372.7827
Account Inquiries Pax World
Investment Advisers Pax World Management LLC |
Transfer and Boston Financial Data Services
Custodian State Street Bank |
Glossary of Terms |
Bloomberg Barclays U.S. Aggregate Bond Index is a broad base index, maintained by Bloomberg L.P. often used to represent investment grade bonds being traded in United States.
BofA Merrill Lynch U.S. High Yield Cash Pay BB-B (Constrained 2%) Index tracks the performance of BB- and B rated fixed income securities publicly issued in the major domestic or eurobond markets, with total index allocation to an individual issuer limited to 2%.
Blended Index
● | for the Balanced Fund is composed of 60% S&P 500 Index and 40% Bloomberg Barclays U.S. Aggregate Bond Index. |
● | for the Capital Appreciation Fund is comprised of 55% S&P 500 Index, 25% MSCI EAFE Index, and 20% Bloomberg Barclays U.S. Aggregate Bond Index. |
● | for the Total Return Fund is comprised of 24% S&P 500 Index, 11% MSCI EAFE Index and 65% Bloomberg Barclays U.S. Aggregate Bond Index. |
FTSE Environmental Opportunities Index Series measures the performance of global companies that have significant involvement in environmental business activities, including renewable and alternative energy, energy efficiency, water technology and waste and pollution control. The FTSE Environmental Opportunities Index Series requires companies to have at least 20% of their business derived from environmental markets and technologies. The FTSE Environmental Opportunities Index Series is published by a joint venture of Impax Asset Management, Ltd. (“Impax”) with FTSE International. Impax is also the sub-adviser to the Pax Global Environmental Markets Fund.
Lipper Core Bond Funds Index tracks the results of the 30 largest mutual funds in the Lipper Core Bond Index Funds Average. The Lipper Core Bond Index Funds Average is a total return performance average of mutual funds tracked by Lipper, Inc. that invest at least 85% in domestic investment-grade debt issues (rated in the top four grades) with any remaining investment in non-benchmark sectors such as high-yield, global and emerging market debt. These funds maintain dollar-weighted average maturities of five to ten years.
Lipper Equity Income Funds Index tracks the results of the 30 largest mutual funds in the Lipper Equity Income Funds Index Average. The Lipper Equity Income Funds Index Funds Average is a total return performance average of mutual funds tracked by Lipper, Inc. that by prospectus language and portfolio practice, seek relatively high current income and growth of income by investing at least 65% of their portfolio in dividend-paying equity securities.
Lipper Global Multi-Cap Core Funds Index tracks the results of the 30 largest mutual funds in the Global Multi-Cap Core Funds Average. The Global Multi-Cap Core Funds Index Average is a total return performance average of mutual funds tracked by Lipper, Inc. that track the results of funds that, by portfolio practice, invest in a variety of market capitalization ranges without concentrating 75% of their equity assets in any one market capitalization range over an extended period of time. Global multi-cap core funds typically have average characteristics compared to the MSCI World Index.
Lipper High Yield Bond Funds Index tracks the results of the 30 largest mutual funds in the Lipper High Yield Bond Funds Average. The Lipper High Yield Bond Funds Average is a total return performance average of mutual funds tracked by Lipper, Inc. that aim at high (relative) current yield from fixed income securities, have no quality or maturity restrictions and tend to invest in lower grade debt issues.
1
Glossary of Terms, continued |
Lipper International Large-Cap Core Funds Index tracks the results of the 30 largest mutual funds in the Lipper International Large-Cap Core Funds Average. The Lipper International Large-Cap Core Funds Index Average is a total return performance average of mutual funds tracked by Lipper, Inc. that track the results of funds that, by portfolio practice, invest at least 75% of their equity assets in companies strictly outside of the U.S. with market capitalizations (on a three-year weighted basis) above Lipper’s international large-cap floor. International large-cap core funds typically have an average price-to-cash flow ratio, price-to-book ration, and three-year sales-per-share growth value compared to the S&P/Citigroup World ex-U.S. BMI.
Lipper Large-Cap Core Funds Index tracks the results of the 30 largest mutual funds in the Lipper Large Cap Core Funds Index Average. The Lipper Large Cap Core Funds Index Funds Average is a total return performance average of mutual funds tracked by Lipper, Inc. that invest at least 75% of their equity assets in companies with market capitalizations (on a three-year weighted basis) above Lipper’s USDE large-cap floor. Large-cap core funds have more latitude in the companies in which they invest. These funds typically have an average characteristics compared to the S&P 500 Index.
Lipper Mid-Cap Core Funds Index tracks the results of the 30 largest mutual funds in the Lipper Mid-Cap Core Funds Average. The Lipper Mid-Cap Core Funds Average is a total return performance average of the mutual funds tracked by Lipper, Inc. that, by portfolio practice, invest at least 75% of their equity assets in companies with market capitalizations (on a three-year weighted basis) below Lipper’s USDE mid-cap ceiling. Mid-cap core funds have more latitude in the companies in which they invest. These funds typically have an average price-to-earnings ratio, price-to-book ratio, and three-year sales-per-share growth value, compared to the S&P MidCap 400 Index.
Lipper Mixed-Asset Target Allocation Conservative Funds Index tracks the results of the 30 largest mutual funds in the Lipper Mixed-Asset Target Allocation Conservative Funds Average. The Lipper Mixed-Asset Target Allocation Conservative Funds Average is a total return performance average of mutual funds tracked by Lipper, Inc. whose primary objective is to conserve principal by maintaining, at all times a mix of between 20%-40% equity securities, with the remainder invested in bonds, cash, and cash equivalents.
Lipper Mixed-Asset Target Allocation Growth Funds Index tracks the results of the 30 largest mutual funds in the Lipper Mixed-Asset Target Allocation Growth Funds Average. The Lipper Mixed-Asset Target Allocation Growth Funds Average is a total return performance average of mutual funds tracked by Lipper, Inc. whose primary objective is to conserve principal by maintaining, at all times a mix of between 60%-80% equity securities, with the remainder invested in bonds, cash, and cash equivalents.
Lipper Multi-Cap Core Funds Index tracks the results of the 30 largest mutual funds in the Lipper Multi-Cap Core Funds Index Average. The Lipper Multi-Cap Core Funds Index Funds Average is a total return performance average of mutual funds tracked by Lipper, Inc. that invest in a variety of market capitalization ranges without concentrating 75% of their equity assets in any one market capitalization range over an extended period of time. These funds typically have average characteristics compared to the S&P SuperComposite 1500 Index.
Lipper Small-Cap Core Funds Index tracks the results of the 30 largest mutual funds in the Lipper Small- Cap Core Funds Average. The Lipper Small-Cap Core Funds Average is a total return performance average of the mutual funds tracked by Lipper, Inc. that, by portfolio practice, invest at least 75% of their equity assets in companies with market capitalizations (on a three-year weighted basis) below Lipper’s USDE small-cap ceiling. Small-cap core funds have more latitude
2
in the companies in which they invest. These funds typically have an average price-to-earnings ratio, price-to-book ratio, and three-year sales-per-share growth value, compared to the S&P SmallCap 600 Index.
MSCI All-Country World Index (“ACWI”) Index is a free float-adjusted market capitalization weighted index that is designed to measure the equity market performance of developed and emerging markets. The MSCI ACWI consists of 46 country indexes comprising 23 developed and 23 emerging market country indexes. The developed market country indexes included are: Australia, Austria, Belgium, Canada, Denmark, Finland, France, Germany, Hong Kong, Ireland, Israel, Italy, Japan, Netherlands, New Zealand, Norway, Portugal, Singapore, Spain, Sweden, Switzerland, United Kingdom and United States. The emerging market country indexes included are: Brazil, Chile, China, Colombia, Czech Republic, Egypt, Greece, Hungary, India, Indonesia, Korea, Malaysia, Mexico, Peru, Philippines, Poland, Qatar, Russia, South Africa, Taiwan, Thailand, Turkey and United Arab Emirates.
MSCI EAFE (Europe, Australasia, Far East) Index is a free float-adjusted market capitalization index that is designed to measure the equity market performance of developed markets, excluding the U.S. and Canada. The MSCI EAFE (Net) Index consists of the following 21 developed market country indices: Australia, Austria, Belgium, Denmark, Finland, France, Germany, Hong Kong, Ireland, Israel, Italy, Japan, Netherlands, New Zealand, Norway, Portugal, Singapore, Spain, Sweden, Switzerland, and United Kingdom.
MSCI EAFE ESG Index is a free float-adjusted market capitalization weighted index designed to measure the performance of equity securities of issuers organized or operating in developed market countries around the world excluding the U.S. and Canada that have high environmental, social and governance (ESG) ratings relative to their sector and industry group peers, as rated by MSCI ESG Research annually. MSCI ESG Research evaluates companies’ ESG characteristics and derives corresponding ESG scores and ratings. Companies are ranked by ESG score against their sector peers to determine their eligibility for the MSCI ESG indices. MSCI ESG Research identifies the highest-rated companies in each peer group to meet the float-adjusted market capitalization sector targets. The rating system is based on general and industry-specific ESG criteria, assigning ratings on a 7-point scale from AAA (highest) to CCC (lowest).
MSCI World Index is a free float-adjusted market capitalization weighted index that is designed to measure the equity market performance of developed markets. The MSCI World Index consisted of the following 23 developed market country indices: Australia, Austria, Belgium, Canada, Denmark, Finland, France, Germany, Hong Kong, Ireland, Israel, Italy, Japan, Netherlands, New Zealand, Norway, Portugal, Singapore, Spain, Sweden, Switzerland, the United Kingdom, and the United States.
Pax Global Women’s Leadership Index a customized market-weighted index consisting of equity securities of issuers organized or operating in countries around the world that demonstrate a commitment to advancing and empowering women through gender diversity on their boards, in management and through other policies and programs, and an understanding of the potential business advantages associated with greater gender diversity, as rated by Pax World Gender Analytics. In addition, the companies comprising the Women’s Index meet certain environmental, social and governance (ESG) or sustainability thresholds, as rated by MSCI ESG Research.
Russell 1000 Index measures the performance of the 1,000 largest U.S. companies, as measured by market capitalization. It is a subset of the Russell 3000 Index, which measures the largest 3,000 companies. The Russell 1000 Index is comprised of over 90% of the total market capitalization of all listed U.S stocks.
3
Glossary of Terms, continued |
Russell 1000 Growth Index measures the performance of the large-cap growth segment of the U.S. equity universe. It includes those companies in the Russell 1000 Index with higher price-to-book ratios and higher forecasted growth values. The Russell 1000 Index measures the performance of the 1,000 largest companies, as measured by market capitalization.
Russell 2000 Index measures the performance of the small-cap segment of the U.S. equity universe. The Russell 2000 Index is a subset of the Russell 3000 Index representing approximately 10% of the total market capitalization of that index. It includes approximately 2,000 of the smallest securities based on a combination of their market cap and current index membership.
Russell Midcap Index measures performance of the mid-capitalization sector of the U.S. equity market. The index is a float-adjusted, capitalization-weighted index of the 800 smallest issuers in the Russell 1000 Index. The index is a subset of the Russell 1000 Index and serves as the underlying index for the Russell Midcap Growth and Value Index series. The Index is reconstituted annually.
S&P 500 Index is an unmanaged index of large capitalization common stocks.
Performance for the MSCI ACWI Index, the MSCI EAFE Index, the MSCI EAFE ESG Index, the MSCI World Index and the Pax Global Women’s Leadership Index are shown “net”, which includes dividend reinvestments after deduction of foreign withholding tax.
Securities Indices above assume reinvestment of all distributions and interest payments, have no policy of sustainable investing and do not take in to account brokerage fees or expenses.
Lipper Indices above are not what are typically considered to be an “index” because they track the performance of other mutual funds rather than changes in the value of a group of securities, a securities index or some other traditional economic indicator.
Diversification does not eliminate the risk of experiencing investment losses.
One cannot invest directly in any index.
4
Letter to Shareholders |
by Joseph Keefe, President & CEO |

Dear fellow shareholders,
2016 will be remembered for the stunning election of Donald Trump, the almost equally stunning Brexit vote in the United Kingdom, and more generally, the rise of a new strain of populist nationalism throughout the West. This new nationalism is in part a reaction to political polarization, in the United States and elsewhere, which has led to policy paralysis and the perception that government is no longer working. It is in part a reaction to globalization and free trade which are perceived to have lifted up elites but failed to deliver for average citizens whose incomes have been stagnant and whose share of economic growth has been falling for decades. It is in part a reaction to technological progress itself, and to what economist Joseph Schumpeter called creative destruction: The robot replaces the line worker; the coal industry disappears to make way for cleaner energy; some people advance while others fall behind. Thus, economic insecurity, rising inequality, political polarization, reactive populism, the de-legitimation of elites – not only political leaders but other perceived elites (CEOs, bankers, law enforcement, the media, academics) – and an increasingly pessimistic mindset have become distinct features of our age.
Donald Trump deftly exploited this popular disillusionment to attain the presidency despite grave questions about his qualifications, character and temperament, and the result is unprecedented economic uncertainty as we enter 2017. In fact, Trump’s “America first” nationalism represents an historic break with decades of U.S. foreign policy, trade policy and international leadership that has been indispensable to international stability and predictability for the global economy since the end of World War II. We now find ourselves in what Ian Bremer of Eurasia Group has called a “deep geopolitical recession.”
Since his election, Mr. Trump has done little to allay concerns about his presidency. To the contrary, it appears that his presidency, like his campaign, will be driven on a daily basis by extraordinary tweets, controversies and revelations. Moreover, a president this impulsive and uninformed will likely need strong checks and balances, be they his own cabinet, the Republican Congress, a free press, the judicial system or the court of public opinion. One can therefore expect an extraordinary level of intra-party squabbling on top of the usual partisan bickering. Loud, contentious days lay ahead. It’s hard to see how this will be beneficial for public confidence or financial markets, but we shall have to see.
5
On some of the core issues that sustainable investors care about – e.g., climate change, gender inequality, financial regulation – there is not only great uncertainty but also great concern over what direction a Trump administration will take. It seems clear that the Securities and Exchange Commission will not be as friendly to investors as during the last administration. Moreover, we are already hearing about the rollback of financial regulations, including Dodd-Frank legislation passed in the aftermath of the 2008 financial crisis and the Department of Labor’s new Fiduciary Rule governing financial brokers and advisors, as well as climate change regulations.
For the next four years, it seems clear that sustainable investors will best not look to Washington for meaningful progress on many of the issues we care about. Instead, we should look to the private sector, which is fine because, (1) as sustainable investors, that’s what we focus on anyway, and (2) just as importantly, the private sector is way ahead of the public sector on many of the core issues we care about. For example, there is broad agreement in the global business community that we need to confront climate change. Bill Gates, Mark Zuckerberg, Jeff Bezos, Jack Ma and other tech leaders recently committed $1 billion to launching a new, low carbon energy fund. Warren Buffett’s company is investing in new solar and wind energy projects, including the world’s largest solar plant. Indeed, a large cross-section of global businesses advocated for, not against, the Paris climate accord.
On climate change and other issues, this is where the opportunity lies over the next four years: working with the business community to advance the sustainability agenda over and against the recalcitrance of entrenched political elites. Sustainable investors can turn this moment of uncertainty into a moment of opportunity. Now is the time to invest in companies making a difference when it comes to climate change. (See, e.g., the Pax Global Environmental Markets Fund (PGRNX).) Now is the time to invest in companies that are embracing gender diversity and advancing women in the workplace. (See, e.g., the Pax Ellevate Global Women’s Index Fund (PXWEX).) Now is the time to think globally, to act sustainably and to invest in a way that truly makes a difference.
During 2016, our Funds strived to deliver positive investment returns alongside positive social and environmental outcomes. It was a difficult market for some of our funds because our focus generally is on quality stocks and we pay careful attention to risk. In 2016, however, it was riskier stocks that led the way, and this was particularly true of the so-called “Trump rally” late in the year when riskier companies and some entire sectors took off in anticipation of lower taxes, less regulation and a curious fiscal stimulus in the form of added debt and infrastructure spending that Trump has talked about but Republicans in the past
6
have seldom supported. It will be interesting to see how 2017 unfolds. In the meantime, I commend you to our Portfolio Manager commentaries as well as Julie Gorte’s Sustainability Update contained herein.
Two final thoughts:
First, I would be remiss if I did not mention that Pax introduced five new investment strategies in 2016, as we continue to expand our fund platform to offer more options for sustainable investors. These new strategies include the Pax Large Cap Fund (PAXLX), Pax Mid Cap Fund (PWMDX), Pax Core Bond Fund (PAXBX) and two smart beta funds, the Pax ESG Beta Quality Fund (PXWGX) and Pax ESG Beta Dividend Fund (PAXDX), both of which are sub-advised by our colleagues at Aperio Group LLC (www.aperiogroup.com). And in December, we converted the Pax Balanced Fund (PAXWX) to a fund of funds structure to offer investors the ability to more efficiently allocate assets and gain greater diversification benefits in a single investment vehicle.
Second, Pax will continue to do everything in our power to live by the values we preach. Through our engagement efforts and impact investing platform, through our annual Impact Report, through Pax World Management’s family friendly workplace policies, our community service and our charitable giving, we strive to be a good corporate citizen and encourage others to do the same. In these uncertain times, there is always something we can do. There are always ways to make a difference. We can always roll up our sleeves and go to work. We can always stand and be counted. With the fondest hopes that our nation will set itself on a course toward peace and justice, equanimity and reconciliation, I hope we will all resolve to work, and to stand and be counted, for the values we cherish and the people we seek to serve.
I thank you for being a shareholder and wish you and yours a happy and healthy new year.
Sincerely,

Joseph F. Keefe
President & CEO
7
Performance Information |
Commentary The portfolio manager commentaries in this report provide insight from the respective fund managers in an effort to help you examine your fund. The views expressed therein are those of the portfolio managers and are for the period covered by this report. Such commentary does not necessarily represent the views of the Board of Trustees of your fund. The views expressed herein are subject to change at any time based upon market and/or other conditions and Pax World Management LLC, Pax Ellevate Management LLC and the funds disclaim any responsibility to update such views. The commentaries should not be relied upon as investment advice.
Historical performance Historical performance can be evaluated in several ways. Each fund’s portfolio highlights provide total and average annual total returns. A comparison of this historical data to an appropriate benchmark is also provided. These performance figures include changes in a fund’s share price, plus reinvestment of any dividends (generally income) and any capital gains (generally profits the fund earns when it sells securities that have grown in value). Past performance does not guarantee future results.
The Funds’ distributor, ALPS Distributors, Inc., is not affiliated with Pax World Management LLC, Pax Ellevate Management LLC, Aperio Group LLC, Impax Asset Management, Ltd., or Morningstar Investment Management, LLC.
8
December 31, 2016
|
Pax Large Cap Fund |
Portfolio Manager’s Comments |
How did the Pax Large Cap Fund (the Fund) perform for the period?
The inception date for the Pax Large Cap Fund was December 16, 2016. For the period from inception date December 16, 2016 through December 31, 2016, the Individual Investor Class and Institutional Class shares of the Fund had total returns of -0.83% and -0.83%, respectively, compared to -0.78% for the S&P 500 Index and -0.79% for the Lipper Large-Cap Core Funds Index.
Returns—Period ended December 31, 2016
Share class | Ticker | Total Return Since Inception1 |
Institutional Class2 | PXLIX | -0.83% |
Individual Investor Class2 | PAXLX | -0.83% |
S&P 500 Index | -0.78% | |
Lipper Large-Cap Core Funds Index | -0.79% | |
See “Glossary of Terms” for descriptions of benchmarks.
These figures represent past performance, which is no guarantee of future results. Investment return and principal value of an investment will fluctuate so that an investor’s shares, when redeemed, may be worth more or less than their original cost. Current performance may be lower or higher than the performance data quoted. Total returns for periods of less than one year have not been annualized. For more recent month-end performance data, please visit www.paxworld.com or call 800.767.1729.
1 | The Fund’s inception date is December 16, 2016. (Note A) |
2 | Total return figures include reinvested dividends and capital gains distributions, and changes in principal value, and do not reflect the taxes that a shareholder might pay on Fund distributions or on the redemption of Fund shares. |
Asset Allocation | Percent of Investments |
U.S. Stocks | 91.7% |
Foreign Stocks | 5.8% |
Exchange-Traded Funds | 2.4% |
Cash & Cash Equivalents | 0.1% |
Total | 100.0% |
9
December 31, 2016
|
Pax Large Cap Fund, continued
|
Portfolio Highlights (Unaudited) |
Top Ten Holdings
Company | Percent of Net Assets |
Apple, Inc. | 4.4% |
Microsoft Corp. | 4.3% |
Chubb, Ltd. | 3.5% |
Berkshire Hathaway, Inc., Class B | 3.2% |
Time Warner, Inc. | 2.8% |
Schlumberger, Ltd. | 2.6% |
PepsiCo, Inc. | 2.6% |
Goldman Sachs Group, Inc., The | 2.5% |
iShares Core S&P 500 ETF | 2.4% |
Pioneer Natural Resources Co. | 2.4% |
Total | 30.7% |
Ten largest holdings do not include money market securities, certificates of deposit, commercial paper or cash and equivalents, if applicable.
Holdings are subject to change.
Sector Diversification
Sector | Percent of Net Assets |
Financials | 19.4% |
Information Technology | 19.0% |
Health Care | 13.7% |
Consumer Staples | 10.2% |
Industrials | 10.0% |
Consumer Discretionary | 9.0% |
Energy | 8.2% |
Real Estate | 3.0% |
Exchange-Traded Funds | 2.4% |
Telecommunication Services | 2.0% |
Utilities | 1.8% |
Materials | 1.2% |
Other assets and liabilities (net) | 0.1% |
Total | 100.0% |
May include companies representing multiple industries within a single “Sector”.
10
December 31, 2016
|
Pax Mid Cap Fund |
|
Portfolio Manager |

Portfolio Manager’s Comments |
How did the Pax Mid Cap Fund (the Fund) perform for the period?
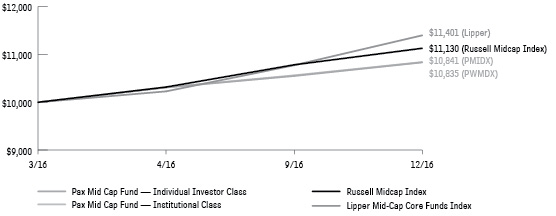
The inception date for the Pax Mid Cap Fund was March 31, 2016. For the period since inception through December 31, 2016, the Individual Investor Class and Institutional Class shares of the Fund had total returns of 8.35% and 8.41%, respectively, compared to 11.30% for the Russell Midcap Index (the Index) and 14.01% for the Lipper Mid-Cap Core Funds Index.
What factors contributed to the Fund’s performance?
Strong stock selection in the Materials and Industrials sectors was not enough to offset poor results in the Technology and Energy sectors. From an allocation standpoint, our overweight to Financials was a strong contributor. The Fund’s lower risk, higher quality emphasis was out of favor with the market environment which rewarded investors for taking on risk, especially in the latter part of the period.
Can you discuss any significant changes to the Fund’s positioning throughout the period?
We have reduced our exposure to rising interest rates by underweighting the Utilities and Real Estate sectors. In addition, we are also less exposed to dividend-paying companies. Our largest overweight continues to be Financials, as we find banks and insurers attractive.
What portfolio holdings contributed positively to performance?
Citizens Financial Group Inc., a commercial bank, was our top contributor to performance. The bank has posted better than expected quarterly results and has benefitted from higher interest rates.
Newmont Mining Corp., a diversified mining company, was a strong performer for the Fund. The combination of a discounted valuation and low expectations led to outperformance as gold prices rose.
11
December 31, 2016
|
Pax Mid Cap Fund, continued |
Oshkosh Corp., a manufacturer of trucks and access equipment, increased nearly 60% during the period. In our view, the strong performance was due to positive financial results and increased investor expectations of earnings growth. In addition, valuation entering the period was relatively low.
What portfolio holdings detracted from performance?
Syntel, Inc., a business process outsourcing company, was our largest detractor to performance. Poor quarterly results and downwardly revised financial guidance drove shares lower. In addition, in our view, management credibility was hurt when they decided to repatriate a large portion of their overseas cash to pay a special dividend, resulting in a large tax bill. We no longer hold shares.
Sally Beauty Holdings, Inc., a distributor and retailer of beauty products, declined nearly 17% during the period. In our view, lower than expected same store sales drove the underperformance. We continue to hold our position due to our belief that expectations are very low and that valuation is attractive.
Brookdale Senior Living, Inc., an operator of senior living facilities, declined sharply on worse than expected financial results. The company continues to struggle with increased competition and lower than expected occupancy. We no longer hold shares.
Portfolio Highlights (Unaudited)
Annual Total Return—Historical Growth of $10,000 – Since Inception
12
December 31, 2016 |
Returns—Period ended December 31, 2016
Share class | Ticker | Total Return Since Inception1 |
Institutional Class2 | PMIDX | 8.41% |
Individual Investor Class2 | PWMDX | 8.35% |
Russell Midcap Index | 11.30% | |
Lipper Mid-Cap Core Funds Index | 14.01% | |
See “Glossary of Terms” for descriptions of benchmarks.
These figures represent past performance, which is no guarantee of future results. Investment return and principal value of an investment will fluctuate so that an investor’s shares, when redeemed, may be worth more or less than their original cost. Current performance may be lower or higher than the performance data quoted. Total returns for periods of less than one year have not been annualized. For more recent month-end performance data, please visit www.paxworld.com or call 800.767.1729.
1 | The Fund’s inception date is March 31, 2016. |
2 | Total return figures include reinvested dividends and capital gains distributions, and changes in principal value, and do not reflect the taxes that a shareholder might pay on Fund distributions or on the redemption of Fund shares. |
Asset Allocation | Percent of Investments |
U.S. Stocks | 88.1% |
Foreign Stocks | 7.9% |
Cash & Cash Equivalents | 4.0% |
Total | 100.0% |
Top Ten Holdings
Company | Percent of Net Assets |
Alleghany Corp. | 4.5% |
Investors Bancorp, Inc. | 3.5% |
Hologic, Inc. | 3.0% |
Citizens Financial Group, Inc. | 3.0% |
White Mountains Insurance Group, Ltd. | 2.9% |
Capitol Federal Financial, Inc. | 2.9% |
US Foods Holding Corp. | 2.8% |
Antero Resources Corp. | 2.7% |
Amdocs, Ltd. | 2.6% |
Yum! Brands, Inc. | 2.5% |
Total | 30.4% |
Ten largest holdings do not include money market securities, certificates of deposit, commercial paper or cash and equivalents, if applicable.
Holdings are subject to change.
13
December 31, 2016
|
Pax Mid Cap Fund, continued
|
Portfolio Highlights (Unaudited), continued |
Sector Diversification
Sector | Percent of Net Assets |
Financials | 21.9% |
Information Technology | 14.3% |
Consumer Discretionary | 14.1% |
Industrials | 9.7% |
Consumer Staples | 8.4% |
Real Estate | 7.7% |
Energy | 7.1% |
Health Care | 5.0% |
Materials | 3.8% |
Utilities | 2.1% |
Other assets and liabilities (net) | 5.9% |
Total | 100.0% |
May include companies representing multiple industries within a single “Sector”.
14
December 31, 2016 |
Pax Small Cap Fund |
|
Portfolio Manager |
Portfolio Manager’s Comments |
How did the Pax Small Cap Fund (the Fund) perform for the period?
For the one-year period ended December 31, 2016, the Individual Investor Class, Class A, Institutional Class and Class R shares of the Fund had total returns of 17.90%, 17.85%, 18.17% and 17.62%, respectively, compared to 21.31% for the Russell 2000 Index (the Index) and 22.54% for the Lipper Small-Cap Core Funds Index.
What factors contributed to the Fund’s performance?
Strong stock selection in the Consumer Discretionary and Industrials sectors was not enough to offset poor results in the Technology and Financials sectors. From an allocation standpoint, our underweight to Healthcare and overweight to Financials were strong contributors. The Fund’s lower risk, higher quality emphasis was out of favor with the market environment which rewarded investors for taking on risk, especially in the latter part of the period.
Can you discuss any significant changes to the Fund’s positioning throughout the period?
We have reduced our exposure to rising interest rates by underweighting the Utilities and Real Estate sectors. In addition, we are also less exposed to dividend-paying companies. Our largest overweight continues to be Financials, as we find banks and insurers attractive.
What portfolio holdings contributed positively to performance?
Newmont Mining Corp., a diversified mining company, was our top contributor to performance. The combination of a discounted valuation and low expectations led to outperformance as gold prices rose. We exited our position early in the year as the company’s market capitalization no longer met our investment criteria.
ONE Gas, Inc., a regulated natural gas utility, was a strong performer for the Fund. Shares rallied sharply in early 2016 as investors sought out defensive holdings. We exited our position due to valuation and our desire to reduce our allocation to the Utilities sector.
15
December 31, 2016
|
Pax Small Cap Fund, continued |
MRC Global, Inc., a distributor of pipe, valves and fittings to the chemical and energy markets, increased nearly 57% during the year. The recovery in the energy industry led to increased confidence in the eventual growth of MRC earnings.
What portfolio holdings detracted from performance?
Natus Medical, Inc., a medical device company focused on neurology and newborn care, was our largest detractor to performance. The combination of profit taking from a strong 2015 and execution missteps led to the underperformance.
Brookdale Senior Living, Inc., an operator of senior living facilities, declined sharply on worse than expected financial results. The company continues to struggle with increased competition and lower than expected occupancy.
Legg Mason, Inc., a global asset management company, declined during the period. The industry continues to face the headwinds of active to passive fund flows as well as fee compression. We believe Legg Mason is attractive from a valuation standpoint and used share price declines to add to our position.
Portfolio Highlights (Unaudited)
Annual Total Return—Historical Growth of $10,000 – Since Inception

* | Represents a hypothetical investment of $10,000 in the fund after deducting the maximum sales load of 5.50% ($10,000 investment minus $550 sales load = $9,450). |
16
December 31, 2016 |
Returns—Period ended December 31, 2016
Total Return | Average Annual Return | |||||
Share class | Ticker |
| 1 year | 3 years | 5 years | Since Inception |
Individual Investor Class1 | PXSCX | 17.90% | 6.67% | 14.55% | 10.01% | |
Class A1,2,4 | PXSAX | NAV3 | 17.85% | 6.66% | 14.55% | 10.01% |
POP | 11.39% | 4.67% | 13.26% | 9.30% | ||
Institutional Class1 | PXSIX | 18.17% | 6.92% | 14.82% | 10.29% | |
Class R1 | PXSRX | 17.62% | 6.41% | 14.27% | 9.74% | |
Russell 2000 Index | 21.31% | 6.74% | 14.46% | 9.51% | ||
Lipper Small-Cap Core Funds Index | 22.54% | 6.90% | 14.03% | 9.50% | ||
See “Glossary of Terms” for descriptions of benchmarks.
The Fund’s inception date is March 27, 2008.
These figures represent past performance, which is no guarantee of future results. Investment return and principal value of an investment will fluctuate so that an investor’s shares, when redeemed, may be worth more or less than their original cost. Current performance may be lower or higher than the performance data quoted. Total returns for periods of less than one year have not been annualized. For more recent month-end performance data, please visit www.paxworld.com or call 800.767.1729.
1 | The Fund’s investment adviser assumed certain expenses in prior periods: average annual returns would have been lower had these expenses not been assumed. Total return figures include reinvested dividends and capital gains distributions, and changes in principal value, and do not reflect the taxes that a shareholder might pay on Fund distributions or on the redemption of Fund shares. |
2 | A 1.00% CDSC (contingent deferred sales charge) may be charged on any shares sold within 18 months of purchase over $1 million. POP (public offering price) reflects the maximum sales load for the Fund’s Class A Shares of 5.50%. NAV performance does not reflect the deduction of the sales load or the CDSC, which if reflected would reduce the performance shown. |
3 | NAV is Net Asset Value. |
4 | Inception of Class A shares is May 1, 2013. The performance information shown for Class A shares includes the performance of Individual Investor Class shares, adjusted to reflect the sales charge applicable to Class A shares, for the period prior to Class A inception. |
Asset Allocation | Percent of Investments |
U.S. Stocks | 93.8% |
Foreign Stocks | 4.1% |
Cash & Cash Equivalents | 2.1% |
Total | 100.0% |
17
December 31, 2016
|
Pax Small Cap Fund, continued
|
Portfolio Highlights (Unaudited), continued |
Top Ten Holdings
Company | Percent of Net Assets |
Investors Bancorp, Inc. | 3.1% |
Antero Resources Corp. | 3.1% |
Legg Mason, Inc. | 3.0% |
Capitol Federal Financial, Inc. | 3.0% |
US Foods Holding Corp. | 2.9% |
WCI Communities, Inc. | 2.9% |
Natus Medical, Inc. | 2.8% |
MRC Global, Inc. | 2.6% |
Aspen Insurance Holdings, Ltd. | 2.6% |
RenaissanceRe Holdings, Ltd. | 2.5% |
Total | 28.5% |
Ten largest holdings do not include money market securities, certificates of deposit, commercial paper or cash and equivalents, if applicable.
Holdings are subject to change.
Sector Diversification
Sector | Percent of Net Assets |
Financials | 29.2% |
Industrials | 15.7% |
Consumer Discretionary | 12.6% |
Health Care | 9.8% |
Information Technology | 9.5% |
Energy | 7.3% |
Consumer Staples | 6.2% |
Real Estate | 3.3% |
Utilities | 2.1% |
Materials | 1.7% |
Other assets and liabilities (net) | 2.6% |
Total | 100.0% |
May include companies representing multiple industries within a single “Sector”.
18
December 31, 2016
|
Pax ESG Beta Quality Fund |
Portfolio Manager’s Comments |
How did the Pax ESG Beta Quality Fund (the Fund) perform for the period?
Effective June 30, 2016, the Pax Growth Fund became the Pax ESG Beta Quality Fund. The change includes a new subadviser, Aperio Group LLC, approved by shareholders, a restructuring of portfolio holdings as of June 30, 2016, and a change in the Fund’s broad based benchmark from the Russell 1000 Growth Index to the Russell 1000 Index. As these changes were put in place at the middle of this annual reporting period, the commentary that follows relates to the Fund’s performance in the first half of the year through June 30, 2016 versus the Russell 1000 Growth Index (the Fund’s previous primary benchmark) and in the second half of the year through December 31, 2016 versus the Russell 1000 Index.
For the one-year period ended December 31, 2016, the Individual Investor Class, Class A, Institutional Class, and Class R shares of the Fund had total returns of 6.26%, 6.24%, 6.49%, and 5.99%, respectively, compared to 12.05% for the Russell 1000 Index (the Index) and 12.27% for the Lipper Multi-Cap Core Funds Index.
What factors contributed to the Fund’s performance?
As the Pax Growth Fund for the period prior to June 30, 2016, the Fund underperformed the Russell 1000 Growth Index. From a sector perspective, holdings in the Financials, Information Technology and Consumer Staples sectors were the largest relative detractors. Conversely, performance of the Fund’s investments in the Industrials, Utilities and Materials sectors were the top contributors to performance relative to the Index.
In the second half of 2016, the Pax ESG Beta Quality Fund underperformed the Russell 1000 Index. While the factors used in the strategy construction boosted performance relative to the Index, industry exposures more than offset the value added from the targeted factors. The tilt towards companies with higher profitability, higher earnings quality and earnings yield added to relative performance, while the strategy’s exposure to lower volatility companies weighed on relative results. Environmental, social and governance (ESG) factors, as measured by the Pax Sustainability Score, had a negligible impact on relative performance for the second half of 2016. The Fund benefited slightly from an underweight position in companies that scored in the bottom quartile.
19
December 31, 2016
|
Pax ESG Beta Quality Fund, continued |
Can you discuss any significant changes to the Fund’s positioning throughout the period?
The portfolio transitioned during the period and now reflects the Pax ESG Beta Quality Fund investment strategy. The Fund follows a factor investing strategy designed to emphasize ESG, quality and value factors that we believe will benefit the long-term return potential of the Fund.
As of December 31, 2016 the portfolio consisted of 152 stocks and relative to the Russell 1000 Index, the portfolio in aggregate had overweight exposures to stocks with stronger ESG profiles, higher profitability, higher earnings quality, lower risk and lower valuations. The portfolio’s risk profile is optimized relative to the Russell 1000 Index, providing investors with a large-cap core portfolio. Sectors are aligned +/- 5% versus the Index and the portfolio beta* is targeted to be between 0.90 and 0.95. For more information about the Fund’s investment strategy, visit paxworld.com/quality.
* | Beta reflects the sensitivity of a Fund’s return to fluctuations in its benchmark; a beta for a benchmark is 1.00; a beta greater than 1.00 indicates above average volatility and risk. |
Portfolio Highlights (Unaudited)
Ten Year Annual Total Return—Historical Growth of $10,000

* | Represents a hypothetical investment of $10,000 in the fund after deducting the maximum sales load of 5.50% ($10,000 investment minus $550 sales load = $9,450). |
20
December 31, 2016 |
Returns—Period ended December 31, 2016
Total Return | Average Annual Return | |||||
Share class | Ticker |
| 1 year | 3 years | 5 years | 10 years |
Individual Investor Class1 | PXWGX | 6.26% | 6.64% | 12.17% | 6.95% | |
Class A1,2,4 | PXGAX | NAV3 | 6.24% | 6.65% | 12.18% | 6.96% |
POP | 0.39% | 4.66% | 10.91% | 6.35% | ||
Institutional Class1,5 | PWGIX | 6.49% | 6.90% | 12.45% | 7.19% | |
Class R1,6 | PXGRX | 5.99% | 6.37% | 11.90% | 6.72% | |
Russell 1000 Index7 | 12.05% | 8.59% | 14.69% | 7.08% | ||
Russell 1000 Growth Index | 7.08% | 8.55% | 14.50% | 8.33% | ||
Lipper Multi-Cap Core Funds Index | 12.27% | 6.78% | 13.39% | 6.32% | ||
See “Glossary of Terms” for descriptions of benchmarks.
These figures represent past performance, which is no guarantee of future results. Investment return and principal value of an investment will fluctuate so that an investor’s shares, when redeemed, may be worth more or less than their original cost. Current performance may be lower or higher than the performance data quoted. Total returns for periods of less than one year have not been annualized. For more recent month-end performance data, please visit www.paxworld.com or call 800.767.1729.
1 | The Fund’s investment adviser assumed certain expenses during the period; total returns would have been lower had these expenses not been assumed. Total return figures include reinvested dividends and capital gains distributions, and changes in principal value, and do not reflect the taxes that a shareholder might pay on Fund distributions or on the redemption of Fund shares. |
2 | A 1.00% CDSC (contingent deferred sales charge) may be charged on any shares sold within 18 months of purchase over $1 million. POP (public offering price) reflects the maximum sales load for the Fund’s Class A Shares of 5.50%. NAV performance does not reflect the deduction of the sales load or the CDSC, which if reflected would reduce the performance shown. |
3 | NAV is Net Asset Value. |
4 | Inception of Class A shares is May 1, 2013. The performance information shown for Class A shares includes the performance of Individual Investor Class shares, adjusted to reflect the sales charge applicable to Class A shares, for the period prior to Class A inception. |
5 | Inception of Institutional Class shares is April 2, 2007. The performance information shown for Institutional Class shares includes the performance of Individual Investor Class shares for the period prior to Institutional Class inception. Expenses have not been adjusted to reflect the expenses allocable to Institutional Class shares. If such expenses were reflected, the returns would be higher than those shown. |
6 | Inception of Class R shares is April 2, 2007. The performance information shown for Class R shares includes the performance of Class A shares for the period prior to Class R inception. Expenses have not been adjusted to reflect the expenses allocable to Class R shares. If such expenses were reflected, the returns would be lower than those shown. |
7 | Effective June 30, 2016, the performance benchmark of the Pax ESG Beta Quality Fund changed from the Russell 1000 Growth Index to the Russell 1000 Index. The Adviser believes that the Russell 1000 Index better represents the investment strategies of the Fund. |
21
December 31, 2016
|
Pax ESG Beta Quality Fund, continued
|
Portfolio Highlights (Unaudited), continued |
Asset Allocation | Percent of Investments |
U.S. Stocks | 99.0% |
Foreign Stocks | 0.1% |
Cash & Cash Equivalents | 0.9% |
Total | 100.0% |
Top Ten Holdings
Company | Percent of Net Assets |
Apple, Inc. | 2.9% |
Alphabet, Inc., Class A | 2.9% |
Verizon Communications, Inc. | 2.9% |
PepsiCo, Inc. | 2.4% |
Baxter International, Inc. | 2.4% |
Johnson & Johnson | 2.3% |
3M Co. | 2.2% |
Amazon.com, Inc. | 2.0% |
AT&T, Inc. | 1.9% |
PNC Financial Services Group, Inc. | 1.8% |
Total | 23.7% |
Ten largest holdings do not include money market securities, certificates of deposit, commercial paper or cash and equivalents, if applicable.
Holdings are subject to change.
Sector Diversification
Sector | Percent of Net Assets |
Information Technology | 21.2% |
Health Care | 14.1% |
Consumer Discretionary | 13.3% |
Financials | 11.8% |
Consumer Staples | 10.7% |
Industrials | 10.1% |
Telecommunication Services | 4.9% |
Utilities | 4.4% |
Real Estate | 3.8% |
Energy | 2.3% |
Materials | 2.3% |
Other assets and liabilities (net) | 1.1% |
Total | 100.0% |
May include companies representing multiple industries within a single “Sector”.
22
December 31, 2016
|
Pax ESG Beta Dividend Fund |
Portfolio Manager’s Comments |
How did the Pax ESG Beta Dividend Fund (the Fund) perform for the period?
The inception date for the Pax ESG Beta Dividend Fund was December 16, 2016. For the period from inception date December 16, 2016 through December 31, 2016, the Individual Investor Class and Institutional Class shares of the Fund each had total returns of -0.89% compared to -0.77% for the Russell 1000 Index and -0.53% for the Lipper Equity Income Funds Index. The Fund is subadvised by Aperio Group LLC.
Portfolio Highlights (Unaudited)
Returns—Period ended December 31, 2016
Share class | Ticker | Total Return Since Inception1 |
Institutional Class2 | PXDIX | -0.89% |
Individual Investor Class2 | PAXDX | -0.89% |
Russell 1000 Index | -0.77% | |
Lipper Equity Income Funds Index | -0.53% | |
See “Glossary of Terms” for descriptions of benchmarks.
These figures represent past performance, which is no guarantee of future results. Investment return and principal value of an investment will fluctuate so that an investor’s shares, when redeemed, may be worth more or less than their original cost. Current performance may be lower or higher than the performance data quoted. Total returns for periods of less than one year have not been annualized. For more recent month-end performance data, please visit www.paxworld.com or call 800.767.1729.
1 | The Fund’s inception date is December 16, 2016. (Note A) |
2 | Total return figures include reinvested dividends and capital gains distributions, and changes in principal value, and do not reflect the taxes that a shareholder might pay on Fund distributions or on the redemption of Fund shares. |
Asset Allocation | Percent of Investments |
U.S. Stocks | 96.4% |
Foreign Stocks | 3.6% |
Cash & Cash Equivalents | 0.0%* |
Total | 100.0% |
* | Rounds to less than 0.05%. |
23
December 31, 2016
|
Pax ESG Beta Dividend Fund, continued
|
Portfolio Highlights (Unaudited), continued |
Top Ten Holdings
Company | Percent of Net Assets |
3M Co. | 2.7% |
Johnson & Johnson | 2.4% |
AT&T, Inc. | 2.3% |
Cisco Systems, Inc. | 2.1% |
Merck & Co., Inc. | 2.0% |
Procter & Gamble Co., The | 2.0% |
Amazon.com, Inc. | 1.9% |
PepsiCo, Inc. | 1.9% |
IBM | 1.8% |
Verizon Communications, Inc. | 1.8% |
Total | 20.9% |
Ten largest holdings do not include money market securities, certificates of deposit, commercial paper or cash and equivalents, if applicable.
Holdings are subject to change.
Sector Diversification
Sector | Percent of Net Assets |
Information Technology | 18.5% |
Industrials | 13.5% |
Consumer Discretionary | 13.1% |
Health Care | 13.0% |
Financials | 12.3% |
Consumer Staples | 9.3% |
Energy | 5.5% |
Telecommunication Services | 5.5% |
Real Estate | 3.7% |
Utilities | 2.8% |
Materials | 2.7% |
Other assets and liabilities (net) | 0.1% |
Total | 100.0% |
May include companies representing multiple industries within a single “Sector”.
24
December 31, 2016
|
Pax MSCI International ESG Index Fund |
|
Portfolio Manager
|
|
Portfolio Manager
|
|
Portfolio Manager |


Portfolio Managers’ Comments |
How did the Pax MSCI International ESG Index Fund (the Fund) perform for the period?
For the one-year period ended December 31, 2016, the Institutional Class, Individual Investor Class and Class R shares of the Fund had total returns of -1.63%, -1.85% and -2.07%, respectively, compared to -0.45% for the MSCI EAFE ESG (Net) Index (the “Index”) and 1.00% for the MSCI EAFE (Net) Index (“EAFE Index”) and 2.64% for the Lipper International Large-Cap Core Funds Index.
The Fund underperformed the EAFE Index during the year as high beta outperformed and drove market returns during the second half of 2016. These conditions were unfavorable based on the Fund’s lower risk profile, a byproduct of the Fund’s ESG focus, as ESG drives the security selection process of our Fund. The Fund’s Institutional Class (PXNIX) has produced 9% lower beta and 7% lower risk (as measured by standard deviation) than the EAFE Index over the trailing 3 years, ending December 31, 2016.1
Investing in international developed companies demonstrating strong ESG characteristics is the Fund’s strategy for obtaining better long-term investment performance. On a short-term basis, other factors can negatively affect returns and mitigate the impact of international developed markets ESG investing, which was the case during the second half of the year.
Over longer time periods, the Fund has produced strong peer results. Over the five-year period ending December 31, 2016, the Fund (PXNIX) had produced a top 20% five-year peer percentile ranking out of 108 funds based on average annual returns within its Lipper International Large Cap Core classification.2
25
December 31, 2016
|
Pax MSCI International ESG Index Fund, continued |
What is the investment objective of the Fund?
The Fund is designed to track the performance of the Index with a view towards outperforming the EAFE Index over the long term. The Fund and the Index are constructed to have a better environmental, social and governance (ESG) profile than the EAFE Index. Based on evaluations of ESG characteristics conducted by MSCI ESG Research as of December 31, 2016, the ESG profile of the Fund’s holdings averaged an overall rating of AA on MSCI ESG Research’s seven-point scale compared to an overall rating of A for the EAFE Index.3
What contributed positively and negatively to performance?
International developed markets, as represented by the EAFE Index, rallied in the second half of the year after posting negative absolute returns through June 30, 2016. However, adjusting for the strong U.S. dollar against most currencies, foreign developed markets ended the year slightly positive. The EAFE Index returned 1.00% in U.S. dollars, and 5.34% in local currencies during the year.
In 2016, allocation effects across multiple sectors and regions impacted the Fund negatively relative to the EAFE Index. In fact, half of the Fund’s relative underperformance during the year can be contributed to holdings not held in the Fund, since they do not meet minimum ESG thresholds to become a constituent of our Fund’s underlying Index. Our Fund’s constituents are among the highest-rated sustainable companies in international developed markets as rated by MSCI ESG Research, and as a result have a higher quality and lower risk profile than the EAFE Index.
1 | The Pax MSCI International ESG Index Fund – Institutional Class (PXNIX) three-year beta is 0.91 compared to 1.00 for the MSCI EAFE Index. The Fund’s (PXNIX) three-year standard deviation is 11.64 compared to 12.46 for the MSCI EAFE Index. The minimum investment needed for investment in PXNIX is $250,000. |
2 | Data shown represents rankings for the Pax World MSCI International ESG Index Fund Institutional Class in the Lipper International Large Cap Core category based on average annual returns. Lipper rankings are based on total returns (not including sales charges) for the periods indicated and compare total return performance with that of other funds in the category. The Pax MSCI International ESG Index Fund – Institutional Class (PXNIX) 1-year 80th percentile rank out of 133 funds, 3-year 35th percentile rank out of 113 funds and the 5-year 20th percentile rank out of 108 funds. PXNIX is the oldest share class. |
3 | MSCI ESG Research evaluates companies’ ESG characteristics and derives corresponding ESG scores and ratings. Companies are ranked by ESG score against their sector peers to determine their eligibility for the MSCI ESG indices. MSCI ESG Research identifies the highest-rated companies in each peer group to meet the float-adjusted market capitalization sector targets. The rating system is based on general and industry-specific ESG criteria, assigning ratings on a 7-point scale from AAA (highest) to CCC (lowest). |
26
December 31, 2016
|
Portfolio Highlights (Unaudited) |
Annual Total Return—Historical Growth of $10,000 – Since Inception

Returns—Period ended December 31, 2016
Total Return | Average Annual Return | ||||
Share class | Ticker | 1 year | 3 Years | 5 Years | Since Inception |
Institutional Class1 | PXNIX | -1.63% | -2.02% | 6.55% | 2.86% |
Individual Investor Class1,2 | PXINX | -1.85% | -2.31% | 6.29% | 2.60% |
Class R1,2 | PXIRX | -2.07% | -2.53% | 6.02% | 2.36% |
MSCI EAFE ESG (Net) Index | -0.45% | -0.88% | 7.20% | 3.53% | |
MSCI EAFE (Net) Index | 1.00% | -1.60% | 6.53% | 2.60% | |
Lipper International Large-Cap Core Funds Index | 2.64% | -1.84% | 6.27% | 2.19% | |
See “Glossary of Terms” for descriptions of benchmarks.
These figures represent past performance, which is no guarantee of future results. Investment return and principal value of an investment will fluctuate so that an investor’s shares, when redeemed, may be worth more or less than their original cost. Current performance may be lower or higher than the performance data quoted. Total returns for periods of less than one year have not been annualized. For more recent month-end performance data, please visit www.paxworld.com or call us at 800.767.1729.
1 | The Fund’s inception date is January 27, 2011. On March 31, 2014, Pax World International Fund and Pax MSCI EAFE ESG Index ETF merged into the Pax MSCI International ESG Index Fund (the Fund), a passively managed index fund which seeks investment returns that closely correspond to the price and yield performance, before fees and expenses, of the MSCI EAFE ESG Index. Based on the similarity of the Fund to Pax MSCI EAFE ESG Index ETF, Pax MSCI EAFE ESG Index ETF (the Predecessor Fund) is treated as the survivor of the mergers for accounting and performance reporting purposes. Accordingly, all performance and other information shown for the Fund for periods prior to March 31, 2014 is that of the Predecessor Fund. Total return figures include reinvested dividends and capital gains distributions, and changes in principal value, and do not reflect the taxes that a shareholder might pay on Fund distributions or on the redemption of Fund shares. |
27
December 31, 2016
|
Pax MSCI International ESG Index Fund, continued
|
Portfolio Highlights (Unaudited), continued |
2 | Inception of the Individual Investor Class and Class R is March 31, 2014. The performance information shown for the Individual Investor Class and Class R shares for periods prior to March 31, 2014 includes the performance of the Predecessor Fund. These returns have been adjusted to reflect the expenses allocable to Individual Investor Class and Class R shares. |
Asset Allocation | Percent of Investments |
Foreign Stocks | 99.7% |
Exchange-Traded Funds | 0.3% |
Cash & Cash Equivalents | 0.0%* |
Total | 100.0% |
* | Rounds to less than 0.05%. |
Top Ten Holdings
Company | Percent of Net Assets |
Novartis AG | 2.5% |
Roche Holding AG | 2.5% |
Commonwealth Bank of Australia | 2.1% |
GlaxoSmithKline PLC | 1.6% |
BASF SE | 1.4% |
ING Groep NV | 1.4% |
TOTAL SA | 1.3% |
Novo Nordisk A/S, Class B | 1.3% |
SAP SE | 1.3% |
Westpac Banking Corp. | 1.2% |
Total | 16.6% |
Ten largest holdings do not include money market securities, certificates of deposit, commercial paper or cash and equivalents, if applicable.
Holdings are subject to change.
28
December 31, 2016 |
Sector Diversification
Sector | Percent of Net Assets |
Financials | 21.9% |
Industrials | 14.3% |
Consumer Discretionary | 12.4% |
Health Care | 11.9% |
Consumer Staples | 10.2% |
Materials | 7.4% |
Information Technology | 5.8% |
Telecommunication Services | 4.5% |
Real Estate | 3.9% |
Energy | 3.9% |
Utilities | 3.5% |
Exchange-Traded Funds | 0.3% |
Other assets & liabilities (net) | 0.0%* |
Total | 100.0% |
May include companies representing multiple industries within a single “Sector”.
* | Rounds to less than 0.05%. |
Geographical Diversification
Country | Percent of Net Assets |
Japan | 24.2% |
United Kingdom | 14.1% |
France | 10.8% |
Switzerland | 9.5% |
Australia | 9.4% |
Germany | 7.7% |
Netherlands | 5.7% |
Sweden | 4.9% |
Spain | 3.2% |
Denmark | 2.0% |
Hong Kong | 1.9% |
Singapore | 1.6% |
Italy | 1.3% |
Norway | 1.0% |
Luxembourg | 0.6% |
Ireland | 0.6% |
Belgium | 0.4% |
Portugal | 0.3% |
Israel | 0.2% |
New Zealand | 0.1% |
Austria | 0.1% |
Finland | 0.1% |
Other assets & liabilities (net) | 0.3% |
Total | 100.0% |
29
December 31, 2016
|
Pax Ellevate Global Women’s Index Fund |
|
Portfolio Manager
|
|
Portfolio Manager
|
|
Portfolio Manager
Pax Ellevate Management LLC |


Portfolio Managers’ Comments |
How did the Pax Ellevate Global Women’s Index Fund (the Fund) perform for the period?
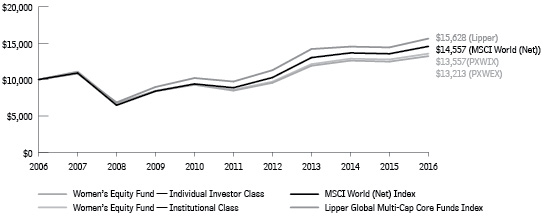
For the one-year period ended December 31, 2016, the Individual Investor and Institutional Class had total returns of 6.01% and 6.30%, respectively, compared to 6.34% for the Pax Global Women’s Leadership Index (Women’s Index), 7.51% for the MSCI World (Net) Index (World Index) and 8.39% for the Lipper Global Multi-Cap Core Funds Index.
Investing in companies advancing women’s leadership is the Fund’s strategy for obtaining better long-term investment performance. On a short-term basis, other factors can affect returns negatively and mitigate the impact of investing in companies with gender-diverse boards and senior leadership, which has been positively and significantly linked to better financial performance. This was the case during the second half of the year.
The Fund underperformed the World Index for the year as high beta stocks led market returns, particularly during the second half of 2016. These are unfavorable conditions based on the Fund’s quality focus and lower risk profile, which have been a byproduct of the Fund’s gender leadership focus. Since reorganization 30 months ending December 31, 20161, the Fund’s Institutional Class has produced 13% lower beta, 12% lower standard deviation and 15% lower downside capture versus the World Index.
What is the investment objective of the Fund?
The Pax Ellevate Global Women’s Index Fund seeks investment returns that closely correspond to or exceed the price and yield performance, before fees and expenses, of the Women’s Index, an index of companies around the world that are leaders in advancing women through gender diversity on their boards of directors and in management, and through other policies and programs while maintaining risk characteristics that Pax Ellevate Management LLC believes are generally similar to those of the Women’s Index.
30
December 31, 2016 |
This Fund is the first of its kind—a broadly diversified mutual fund that invests in the highest-rated companies in the world for advancing women’s leadership. Among the companies in the Fund, 33% of board seats and 27% of executive management positions are held by women, as compared to global averages of 16% and 16%, respectively.2 Companies in the Women’s Index also meet threshold environmental, social and governance (ESG) standards, as rated by MSCI ESG Research.
What contributed positively and negatively to performance?
In 2016, the Fund performed relatively well in the first half of the year then lagged broader global markets in the second half of the year. The Fund’s large overweight to companies with three or more women on boards, at least 30% women on their boards of directors and to companies that have at least 25% women in senior management added to relative performance, especially in the first half of the year. Conversely, the Fund’s holdings and underweight allocation to companies with less representation of women on boards and in management detracted from performance for the second half of the year.
In addition, the Fund’s underperformance relative to the World Index can be partly explained by companies that are not included in the Women’s Index or in the Fund. In particular, excluded companies within the Energy, Materials, and Industrials sectors posted strong absolute returns during the year and are among the lowest rated sectors when it comes to gender leadership. By contrast, our Fund’s constituents are the highest-rated companies in the World Index when it comes to gender diverse leadership and these higher quality, lower risk companies underperformed in the second half of the year.
1 | The Pax Ellevate Global Women’s Index Fund – Institutional Class (PXWIX) since reorganization (30-months) beta is 0.87 compared to 1.00 for the MSCI World Index. The Pax Ellevate Global Women’s Index Fund – Institutional Class (PXWIX) since reorganization (30-months) standard deviation is 9.90 compared to 11.21 for the MSCI World Index. The Pax Ellevate Global Women’s Index Fund – Institutional Class (PXWIX) since reorganization (30-months) downside capture is 85.42 compared to 100 for the MSCI World Index. The minimum investment needed for investment in PXWIX is $250,000. |
2 | “The Tipping Point: Women on Boards and Financial Performance.” MSCI ESG Research LLC, December 2016. MSCI World Index, Pax Gender Analytics, 2016. |
31
December 31, 2016
|
Pax Ellevate Global Women’s Index Fund, continued
|
Portfolio Highlights (Unaudited) |
Ten Year Annual Total Return—Historical Growth of $10,000
Returns—Period ended December 31, 2016
Total Return | Average Annual Return | ||||
Share class | Ticker | 1 year | 3 years | 5 years | 10 years |
Individual Investor Class1 | PXWEX | 6.01% | 3.57% | 9.28% | 2.82% |
Institutional Class1,2 | PXWIX | 6.30% | 3.83% | 9.55% | 3.09% |
Pax Global Women's Leadership (Net) Index* | 6.34% | N/A | N/A | N/A | |
MSCI World (Net) Index | 7.51% | 3.80% | 10.41% | 3.83% | |
Lipper Global Multi-Cap Core Funds Index | 8.39% | 3.26% | 9.96% | 4.57% | |
See “Glossary of Terms” for descriptions of benchmarks.
These figures represent past performance, which is no guarantee of future results. Investment return and principal value of an investment will fluctuate so that an investor’s shares, when redeemed, may be worth more or less than their original cost. Current performance may be lower or higher than the performance data quoted. Total returns for periods of less than one year have not been annualized. For more recent month-end performance data, please visit www.paxworld.com or call us at 800.767.1729.
* | A custom index calculated by MSCI. Inception date of Women’s Index is February 28, 2014. |
1 | On June 4, 2014 the Pax World Global Women’s Equality Fund merged into the Pax Ellevate Global Women’s Index Fund (the Fund), pursuant to an Agreement and Plan of Reorganization dated March 4, 2014 (the “Reorganization”). Because the Fund had no investment operations prior to the closing of the Reorganization, Pax World Global Women’s Equality Fund (the “Predecessor Fund”) is treated as the survivor of the Reorganization for accounting and performance reporting purposes. Accordingly, all performance and other information shown for the Fund for periods prior to June 4, 2014 is that of the Predecessor Fund. Total return figures include reinvested dividends and capital gains distributions, and changes in principal value, and do not reflect the taxes that a shareholder might pay on Fund distributions or on the redemption of Fund shares. |
2 | Inception of Institutional Class Shares is April 19, 2006. Pax World Global Women’s Equality Fund, a series of Pax World Funds Series Trust I, acquired Women’s Equity Fund, a series of Professionally Managed Portfolios (“Old Women’s Equity Fund”), on October 29, 2007. Performance information shown for Institutional Class Shares includes the performance of Retail Class shares of Old Women’s Equity Fund for periods prior to |
32
December 31, 2016 |
October 29, 2007, which has not been adjusted to reflect any differences in expenses between Old Women’s Equity Fund and the Pax World Global Women’s Equality Fund; if such expense adjustments were reflected, the returns would be higher than those shown. The Fund’s investment adviser assumed certain expenses during the period; total returns would have been lower had these expenses not been assumed.
Asset Allocation | Percent of Investments |
U.S. Stocks | 61.5% |
Foreign Stocks | 36.0% |
Exchange-Traded Funds | 1.9% |
Cash & Cash Equivalents | 0.6% |
Total | 100.0% |
Top Ten Holdings
Company | Percent of Net Assets |
Microsoft Corp. | 2.7% |
NIKE, Inc., Class B | 2.0% |
Johnson & Johnson | 1.9% |
Facebook, Inc., Class A | 1.8% |
salesforce.com, Inc. | 1.8% |
American Water Works Co., Inc. | 1.8% |
Yahoo!, Inc. | 1.7% |
Abbott Laboratories | 1.6% |
Aetna, Inc. | 1.6% |
AT&T, Inc. | 1.5% |
Total | 18.4% |
Ten largest holdings do not include money market securities, certificates of deposit, commercial paper or cash and equivalents, if applicable.
Holdings are subject to change.
Sector Diversification
Sector | Percent of Net Assets |
Information Technology | 18.5% |
Financials | 18.4% |
Consumer Staples | 12.9% |
Consumer Discretionary | 12.3% |
Health Care | 11.1% |
Industrials | 6.1% |
Telecommunication Services | 6.0% |
Utilities | 5.1% |
Materials | 2.7% |
Real Estate | 2.6% |
Energy | 2.1% |
Exchange-Traded Funds | 1.9% |
Other assets and liabilities (net) | 0.3% |
Total | 100.0% |
May include companies representing multiple industries within a single “Sector”.
33
December 31, 2016
|
Pax Ellevate Global Women’s Index Fund, continued
|
Portfolio Highlights (Unaudited), continued |
Geographical Diversification
Country | Percent of Net Assets |
United States | 61.1% |
France | 7.1% |
Canada | 5.6% |
United Kingdom | 4.9% |
Australia | 4.3% |
Sweden | 4.2% |
Germany | 3.3% |
Norway | 1.8% |
Netherlands | 1.6% |
Ireland | 1.4% |
Finland | 1.1% |
Spain | 0.7% |
Singapore | 0.6% |
Denmark | 0.5% |
Switzerland | 0.5% |
Hong Kong | 0.3% |
Italy | 0.3% |
Belgium | 0.2% |
Israel | 0.1% |
New Zealand | 0.1% |
Time Deposit | 0.6% |
Other assets and liabilities (net) | -0.3% |
Total | 100.0% |
34
December 31, 2016
|
Pax Global Environmental Markets Fund |
|
Portfolio Manager
|
|
Portfolio Manager
Sub-Adviser |


Portfolio Managers’ Comments |
How did the Pax Global Environmental Markets Fund (the Fund) perform for the period?
For the one-year period ended December 31, 2016, the Individual Investor Class, Class A, Institutional Class and Class R shares of the Fund had total returns of 10.62%, 10.62%, 10.91% and 10.35%, respectively, versus 7.86% for the MSCI All-Country World (Net) Index and 11.68% for the FTSE Environmental Opportunities Index Series (“FTSE EOAS”).
What factors contributed to the Fund’s performance?
2016 was a year of confounded expectations in terms of political developments, with both Brexit and the outcome of the U.S. election surprising many observers and the global equity markets. While separating the rhetoric from the reality will take some patience, a Trump Administration could well prove positive for global investors over the medium term given his stated commitments to cutting U.S. corporate taxes and implementing growth-friendly policies.
The 22nd Conference of the Parties to the United Nation Framework Convention on Climate Change (COP22) took place in Marrakesh in November and the mood was defiantly optimistic. The response from the international community to Trump’s pre-election threat to “cancel” the 2015 Paris Climate Agreement has been to redouble support for the climate treaty, with China, crucially, reiterating its commitment to addressing climate change. China also released its own 13th Five Year Plan, with heavy emphasis on improving environmental health, tackling air, water and land pollution, and investing further in renewable energy and energy efficiency.
Cyclical stocks delivered strong performance during the year, encouraged by the expectation of pro-growth policies including tax reform in the U.S. Economically sensitive companies outperformed.
35
December 31, 2016
|
Pax Global Environmental Markets Fund, continued |
Can you discuss any significant changes to the Fund’s positioning throughout the period?
The Fund’s exposure to the Sustainable Food and Agriculture sub-sector was increased during 2016. The portfolio management team continues to see compelling opportunities within these markets and the benefits this diversification brings to the portfolio.
The Fund made its first investment in the Public Transportation sub-sector, with the purchase of East Japan Railway Co. The company is the world’s largest passenger railway company and demonstrates strong energy efficiency and pollution control credentials.
Renewable Energy exposure was reduced over the period as the managers remain cautious on the overcapacity issues within solar markets.
What portfolio holdings contributed positively to performance relative to the FTSE EOAS?
The Water Infrastructure sub-sector delivered the strongest performance, driven by robust municipal spending on repair and renewal of aging networks, particularly in the U.S. Xylem, Inc. was one such example within the portfolio, additionally benefiting from the announcement of a significant water meter acquisition during the period. The outcome of the U.S. election also proved beneficial for this sub-sector. Under a Trump presidency, increased infrastructure spending is expected, with aging water infrastructure cited as a major issue and a priority to be addressed. This, we believe, should lead to higher spending on components and services, together with other infrastructure hardware that comply with local environmental standards.
The Fund’s Sustainable Food and Agriculture holdings performed well. WestRock Co. (Logistics, Food Safety and Packaging, U.S.) rose as U.S. containerboard prices increased during the year. Marine Harvest ASA (Sustainable and Efficient Agriculture, Norway) was driven by record-high prices of salmon in Europe early in the year, combined with expectations for continued tight supply in the market.
What portfolio holdings detracted from performance relative to the FTSE EOAS?
Following strong performance earlier in the year, defensive Water Utilities underperformed as investor preference moved away from ‘expensive defensives’ toward more cyclical stocks. Water Utilities serve as bond proxies and with the
36
December 31, 2016 |
renewed growth expectations leading to higher interest rates, European and UK utilities underperformed. Suez (France) and Pennon Group PLC (UK) were two such examples.
Negative sentiment within the automotive industry presented a headwind for Transport Energy Efficiency companies including Delphi Automotive PLC (U.S.). The portfolio managers continue to believe companies operating in emission control technologies and hybrid/electric vehicle supply chains are well positioned over the longer term, benefiting from tighter legislation and demand for lower carbon transportation.
Portfolio Highlights (Unaudited)
Annual Total Return—Historical Growth of $10,000 – Since Inception

* | Represents a hypothetical investment of $10,000 in the fund after deducting the maximum sales load of 5.50% ($10,000 investment minus $550 sales load = $9,450). |
37
December 31, 2016
|
Pax Global Environmental Markets Fund, continued
|
Portfolio Highlights (Unaudited), continued |
Returns—Period ended December 31, 2016
Total Return | Average Annual Return | |||||
Share class | Ticker |
| 1 year | 3 years | 5 years | Since Inception |
Individual Investor Class1 | PGRNX | 10.62% | 1.96% | 10.77% | 4.46% | |
Class A1,2,4 | PXEAX | NAV3 | 10.62% | 1.98% | 10.78% | 4.46% |
POP | 4.58% | 0.08% | 9.54% | 3.79% | ||
Institutional Class1 | PGINX | 10.91% | 2.22% | 11.04% | 4.72% | |
Class R1 | PGRGX | 10.35% | 1.72% | 10.51% | 4.19% | |
MSCI AC World (Net) Index5 | 7.86% | 3.13% | 9.36% | 3.87% | ||
FTSE Environmental Opportunities Index Series | 11.68% | 3.13% | 11.04% | NA | ||
MSCI World (Net) Index | 7.51% | 3.80% | 10.41% | 4.43% | ||
See “Glossary of Terms” for descriptions of benchmarks.
These figures represent past performance, which is no guarantee of future results. Investment return and principal value of an investment will fluctuate so that an investor’s shares, when redeemed, may be worth more or less than their original cost. Current performance may be lower or higher than the performance data quoted. Total returns for periods of less than one year have not been annualized. For more recent month-end performance data, please visit www.paxworld.com or call us at 800.767.1729.
1 | The Fund’s inception date is March 27, 2008. The Fund’s investment adviser assumed certain expenses during the period; total returns would have been lower had these expenses not been assumed. Total return figures include reinvested dividends and capital gains distributions, and changes in principal value, and do not reflect the taxes that a shareholder might pay on Fund distributions or on the redemption of Fund shares. |
2 | A 1.00% CDSC (contingent deferred sales charge) may be charged on any shares sold within 18 months of purchase over $1 million. POP (public offering price) reflects the maximum sales load for the Fund’s Class A Shares of 5.50%. NAV performance does not reflect the deduction of the sales load or the CDSC, which if reflected would reduce the performance shown. |
3 | NAV is Net Asset Value. |
4 | Inception of Class A shares is May 1, 2013. The performance information shown for Class A shares includes the performance of Individual Investor Class shares, adjusted to reflect the sales charge applicable to Class A shares, for the period prior to Class A inception. |
5 | Effective April 1, 2016, the performance benchmark of the Pax Global Environmental Markets Fund changed from the MSCI World Index to the MSCI AC World Index. The Adviser believes the MSCI AC World Index better represents the investment strategies of the Fund. |
Asset Allocation | Percent of Investments |
U.S. Stocks | 50.2% |
Foreign Stocks | 46.7% |
Cash & Cash Equivalents | 3.1% |
Total | 100.0% |
38
December 31, 2016 |
Top Ten Holdings
Company | Percent of Net Assets |
Legrand SA | 3.2% |
Suez | 3.0% |
Delphi Automotive PLC | 3.0% |
Danaher Corp. | 3.0% |
Sealed Air Corp. | 2.9% |
Waste Management, Inc. | 2.9% |
Ecolab, Inc. | 2.9% |
WestRock Co. | 2.9% |
Thermo Fisher Scientific, Inc. | 2.7% |
East Japan Railway Co. | 2.7% |
Total | 29.2% |
Ten largest holdings do not include money market securities, certificates of deposit, commercial paper or cash and equivalents, if applicable.
Holdings are subject to change.
Geographical Diversification
Country | Percent of Net Assets |
United States | 50.3% |
Japan | 11.0% |
United Kingdom | 8.9% |
France | 6.3% |
Germany | 5.5% |
Switzerland | 2.1% |
Taiwan | 2.0% |
Norway | 1.9% |
Finland | 1.8% |
Hong Kong | 1.8% |
Spain | 1.5% |
Belgium | 1.4% |
China | 1.2% |
Ireland | 1.2% |
Other assets and liabilities (net) | 3.1% |
Total | 100.0% |
39
December 31, 2016
|
Pax Global Environmental Markets Fund, continued
|
Portfolio Highlights (Unaudited), continued |
Environmental Markets Classification System (EMCS)
Sector | Sub Sector | Percent of Net Assets | |
Renewable & Alternative Energy | 1.2% | ||
Renewable Energy Developers & Independent Power Producers (IPPs) | 1.2% | ||
Energy Efficiency | 25.2% | ||
Power Network Efficiency | 3.5% | ||
Industrial Energy Efficiency | 2.0% | ||
Buildings Energy Efficiency | 9.7% | ||
Transport Energy Efficiency | 5.3% | ||
Consumer Energy Efficiency | 2.6% | ||
Diversified Energy Efficiency | 2.1% | ||
Water Infrastructure & Technologies | 32.1% | ||
Water Infrastructure | 12.3% | ||
Water Treatment Equipment | 7.7% | ||
Water Utilities | 12.1% | ||
Pollution Control | 17.2% | ||
Pollution Control Solutions | 1.4% | ||
Environmental Testing & Gas Sensing | 13.1% | ||
Public Transportation | 2.7% | ||
Waste Management & Technologies | 2.9% | ||
General Waste Management | 2.9% | ||
Food, Agriculture & Forestry | 13.3% | ||
Logistics, Food Safety and Packaging | 7.8% | ||
Sustainable & Efficient Agriculture | 5.5% | ||
Diversified Environmental | 5.0% | ||
Diversified Environmental | 5.0% | ||
Other assets and liabilities (net) | 3.1% | ||
100.0% | |||
May include companies representing multiple industries within a single “Sector”.
40
December 31, 2016
|
Pax Core Bond Fund |
Portfolio Manager’s Comments |
How did the Pax Core Bond Fund (the Fund) perform for the period?
The inception date for the Pax Core Bond Fund was December 16, 2016. For the period from inception date December 16, 2016 through December 31, 2016, the Individual Investor Class and Institutional Class shares of the Fund had total returns of 0.87% and 0.93%, respectively, compared to 1.11% for the Bloomberg Barclays US Aggregate Bond Index and 0.97% for the Lipper Core Bond Funds Index.
Portfolio Highlights (Unaudited)
Returns—Period ended December 31, 2016
Share class | Ticker | Total Return Since Inception1 |
Institutional Class2 | PXBIX | 0.93% |
Individual Investor Class2 | PAXBX | 0.87% |
Bloomberg Barclays US Aggregate Bond Index | 1.11% | |
Lipper Core Bond Funds Index | 0.97% | |
See “Glossary of Terms” for descriptions of benchmarks.
These figures represent past performance, which is no guarantee of future results. Investment return and principal value of an investment will fluctuate so that an investor’s shares, when redeemed, may be worth more or less than their original cost. Current performance may be lower or higher than the performance data quoted. Total returns for periods of less than one year have not been annualized. For more recent month-end performance data, please visit www.paxworld.com or call 800.767.1729.
1 | The Fund’s inception date is December 16, 2016. (Note A) |
2 | Total return figures include reinvested dividends and capital gains distributions, and changes in principal value, and do not reflect the taxes that a shareholder might pay on Fund distributions or on the redemption of Fund shares. |
Asset Allocation | Percent of Investments |
U.S. Bonds | 97.1% |
Foreign Bonds | 1.1% |
Cash & Cash Equivalents | 1.8% |
Total | 100.0% |
41
December 31, 2016
|
Pax Core Bond Fund, continued
|
Portfolio Highlights (Unaudited), continued |
Credit Quality
Bond Rating | Percent of Bonds |
U.S. Government | 63.3% |
AAA | 3.6% |
AA+ | 1.5% |
AA | 1.6% |
AA- | 3.3% |
A+ | 0.9% |
A | 4.6% |
A- | 2.9% |
BBB+ | 8.3% |
BBB | 4.8% |
BBB- | 2.2% |
BB+ | 0.6% |
BB | 0.8% |
BB- | 0.7% |
Not Rated | 0.9% |
Total | 100.0% |
* | Credit quality ratings by Standard & Poor’s assist investors by evaluating the credit worthiness of many bond issues. AAA: An obligation rated ‘AAA’ has the highest rating assigned by S&P Global Ratings. The obligor’s capacity to meet its financial commitment on the obligation is extremely strong. AA: An obligation rated ‘AA’ differs from the highest-rated obligations only to a small degree. The obligor’s capacity to meet its financial commitment on the obligation is very strong. A: An obligation rated ‘A’ is somewhat more susceptible to the adverse effects of changes in circumstances and economic conditions than obligations in higher-rated categories. However, the obligor’s capacity to meet its financial commitment on the obligation is still strong. BBB: An obligation rated ‘BBB’ exhibits adequate protection parameters. However, adverse economic conditions or changing circumstances are more likely to lead to a weakened capacity of the obligor to meet its financial commitment on the obligation. BB: An obligation rated ‘BB’ is less vulnerable to nonpayment than other speculative issues. However, it faces major ongoing uncertainties or exposure to adverse business, financial, or economic conditions which could lead to the obligor’s inadequate capacity to meet its financial commitment on the obligation. Not Rated: This indicates that no rating has been requested, or that there is insufficient information on which to base a rating, or that Standard & Poor’s does not rate a particular obligation as a matter of policy. |
42
December 31, 2016 |
Top Ten Holdings
Company | Percent of Net Assets |
United States Treasury Note, 2.375%, 08/15/24 | 6.5% |
United States Treasury Note, 1.750%, 11/30/21 | 5.9% |
United States Treasury Note, 3.125%, 08/15/44 | 2.5% |
United States Treasury Note, 2.125%, 11/30/23 | 2.5% |
United States Treasury Note, 4.500%, 02/15/36 | 1.9% |
United States Treasury Note, 1.625%, 05/15/26 | 1.9% |
United States Treasury Note, 2.125%, 09/30/21 | 1.7% |
United States Treasury Note, 1.750%, 09/30/19 | 1.3% |
United States Treasury Note, 1.000%, 10/15/19 | 1.0% |
United States Treasury Note, 6.250%, 05/15/30 | 0.9% |
Total | 26.1% |
Ten largest holdings do not include money market securities, certificates of deposit, commercial paper or cash and equivalents, if applicable.
Holdings are subject to change.
Sector Diversification
Sector | Percent of Net Assets |
Treasury Bonds | 30.9% |
Mortgage-Backed Bonds | 28.6% |
Corporate Bonds | 28.0% |
Municipal Bonds | 5.2% |
Agency/Government Related Bonds | 3.4% |
Government Bonds | 0.9% |
Community Investment Notes | 0.6% |
Other assets and liabilities (net) | 2.4% |
Total | 100.0% |
May include companies representing multiple industries within a single “Sector”.
43
December 31, 2016
|
Pax High Yield Bond Fund |
|
Portfolio Manager |

Portfolio Manager’s Comments |
How did the Pax High Yield Bond Fund (the Fund) perform for the period?
For the one-year period ended December 31, 2016, the Individual Investor Class, Class A, Institutional Class, and Class R shares of the Fund had total returns of 13.81%, 13.80%, 13.96% and 13.52%, respectively, compared to 14.76% for the BofA Merrill Lynch U.S. High Yield—Cash Pay—BB-B (Constrained 2%) Index (the Index) and 14.54% for the Lipper High Yield Bond Funds Index.
What factors contributed to the Fund’s performance?
Recovering commodity prices, stable economic performance, moderate defaults and a global search for yield drove the robust performance in the asset class. The Pax High Yield Bond Fund, while falling modestly short of the benchmark for the year, performed relatively well in the second half on the back of a number of positions which recovered from their lows in late 2015 and early 2016.
Specific credit selection drove the majority of the fund’s performance. Sectors which contributed to performance were Technology, Media and Healthcare. Sectors which detracted during the year were Basic Industry, Retail and Energy.
Can you discuss any significant changes to the Fund’s positioning throughout the period?
The Fund diversified into a larger number of positions during the year, growing from 107 to 155 companies. This resulted in average position sizes declining from 85 basis points to 55 basis points. By sector, the Fund increased exposure to the Consumer Goods, Leisure and Energy (mid-stream) sectors. The Fund reduced exposure to the Media, Financial Services and Transportation sectors.
The average credit quality of the Fund as measured by Standard & Poor’s was unchanged from the prior fiscal year at B+. The duration of the Fund declined from 4.45 years at 12/31/15 (versus the benchmark duration at 4.51) to 4.03 years at 12/31/16 (versus the benchmark duration at 4.15).
44
December 31, 2016 |
What portfolio holdings contributed positively to performance?
Syniverse Holdings, Inc., a technology company, performed very well in 2016 as their operating performance stabilized and the company was successful in extending its debt maturities. Chaparral Energy, Inc., an exploration and production company, recovered along with oil prices despite going through a pre-packaged bankruptcy. Quad Graphics, Inc., a commercial printing company, also performed very well as management executed material cost savings and bond buybacks in the open market.
What portfolio holdings detracted from performance?
Charlotte Russe Holdings, Inc., a retailer, has been facing declining mall traffic and heightened competition in “fast fashion.” The Company’s term loan has been very illiquid and volatile. SM Energy, Co., an exploration and production company, performed poorly in the early part of the year when the position was exited. Lastly, Carlstar Group, LLC, a niche industrial manufacturer, performed poorly on cyclical weakness in its end-markets and unclear intentions from its owner/sponsor.
Portfolio Highlights (Unaudited)
Ten Year Annual Total Return—Historical Growth of $10,000
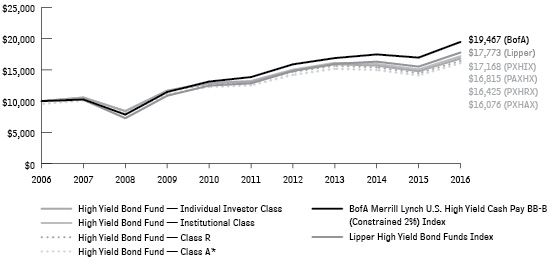
* | Represents a hypothetical investment of $10,000 in the fund after deducting the maximum sales load of 4.50% ($10,000 investment minus $450 sales load = $9,550). |
45
December 31, 2016
|
Pax High Yield Bond Fund, continued
|
Portfolio Highlights (Unaudited), continued |
Returns—Period ended December 31, 2016
Total Return | Average Annual Return | |||||
Share class | Ticker |
| 1 year | 3 years | 5 years | 10 years |
Individual Investor Class1 | PAXHX | 13.81% | 1.89% | 5.09% | 5.33% | |
Class A1,2,4 | PXHAX | NAV3 | 13.80% | 1.93% | 5.12% | 5.34% |
POP | 8.76% | 0.37% | 4.15% | 4.86% | ||
Institutional Class1,4 | PXHIX | 13.96% | 2.13% | 5.35% | 5.55% | |
Class R1,5 | PXHRX | 13.52% | 1.64% | 4.86% | 5.08% | |
BofA Merrill Lynch U.S. High Yield - Cash Pay - BB-B (Constrained 2%) Index | 14.76% | 4.89% | 7.04% | 6.95% | ||
Lipper High Yield Bond Funds Index | 14.54% | 3.67% | 6.72% | 5.92% | ||
See “Glossary of Terms” for descriptions of benchmarks.
These figures represent past performance, which is no guarantee of future results. Investment return and principal value of an investment will fluctuate so that an investor’s shares, when redeemed, may be worth more or less than their original cost. Current performance may be lower or higher than the performance data quoted. Total returns for periods of less than one year have not been annualized. For more recent month-end performance data, please visit www.paxworld.com or call 800.767.1729.
1 | The Fund’s investment adviser assumed certain expenses in prior periods: average annual returns would have been lower had these expenses not been assumed. Total return figures include reinvested dividends and capital gains distributions, and changes in principal value, and do not reflect the taxes that a shareholder might pay on Fund distributions or on the redemption of Fund shares. |
2 | A 1.00% CDSC (contingent deferred sales charge) may be charged on any shares sold within 18 months of purchase over $1 million. POP (public offering price) reflects the maximum sales load for the Fund’s Class A Shares of 4.50%. NAV performance does not reflect the deduction of the sales load or the CDSC, which if reflected would reduce the performance shown. |
3 | NAV is Net Asset Value. |
4 | Inception of Class A shares is May 1, 2013. The performance information shown for Class A shares includes the performance of Individual Investor Class shares, adjusted to reflect the sales charge applicable to Class A shares, for the period prior to Class A inception. |
5 | Inception of Class R shares is April 2, 2007. The performance information shown for Class R shares includes the performance of Individual Investor Class shares for the period prior to Class R inception. Expenses have not been adjusted to reflect the expenses allocable to Class R shares. If such expenses were reflected, the returns would be lower than those shown. |
46
December 31, 2016 |
Asset Allocation | Percent of Investments |
U.S. Bonds | 77.1% |
Foreign Bonds | 14.3% |
Loans | 3.7% |
U.S. Stocks | 0.1% |
Cash & Cash Equivalents | 4.8% |
Total | 100.0% |
Credit Quality
Bond Rating | Percent of Bonds |
BBB | 0.3% |
BBB- | 5.7% |
BB+ | 8.6% |
BB | 11.2% |
BB- | 22.6% |
B+ | 13.7% |
B | 15.7% |
B- | 14.7% |
CCC+ | 5.5% |
CCC- | 0.6% |
Not Rated | 1.4% |
Total | 100.0% |
See bond rating descriptions on page 42.
Top Ten Holdings
Company | Percent of Net Assets |
HCA, Inc., 5.875%, 02/15/26 | 1.5% |
Kennedy-Wilson, Inc., 5.875%, 04/01/24 | 1.2% |
Charlotte Russe, Inc., 6.750%, 05/21/19 | 1.2% |
Ahern Rentals, Inc., 144A, 7.375%, 05/15/23 | 1.1% |
Syniverse Holdings, Inc., 9.125%, 01/15/19 | 1.1% |
Michael Baker Holdings LLC/Finance Corp., 144A, 8.875%, 04/15/19 | 1.1% |
Frontier Communications Corp, 10.500%, 09/15/22 | 1.1% |
Sprint Communications, Inc., 8.375%, 08/15/17 | 1.0% |
Sirius XM Radio, Inc., 144A, 5.375%, 04/15/25 | 1.0% |
Simmons Foods, Inc., 144A, 7.875%, 10/01/21 | 1.0% |
Total | 11.3% |
Ten largest holdings do not include money market securities, certificates of deposit, commercial paper or cash and equivalents, if applicable.
Holdings are subject to change.
47
December 31, 2016
|
Pax High Yield Bond Fund, continued
|
Portfolio Highlights (Unaudited), continued |
Fixed Income Sector Diversification
Sector | Percent of Net Assets |
Energy | 14.6% |
Telecommunications | 10.4% |
Media | 9.7% |
Basic Industry | 8.7% |
Health Care | 8.0% |
Retail | 5.7% |
Capital Goods | 5.7% |
Technology & Electronics | 4.9% |
Services | 4.4% |
Banking | 4.1% |
Financial Services | 3.6% |
Consumer Goods | 3.4% |
Leisure | 2.8% |
Real Estate | 2.3% |
Transportation | 2.3% |
Automotive | 2.2% |
Utility | 1.4% |
Insurance | 0.4% |
Other assets and liabilities (net) | 5.4% |
Total | 100.0% |
May include companies representing multiple industries within a single “Sector”.
48
December 31, 2016
|
Pax Balanced Fund |
|
Portfolio Manager
|
|
Portfolio Manager
|
|
Portfolio Manager |


Portfolio Managers’ Comments |
How did the Pax Balanced Fund (the Fund) perform for the period?
For the one-year period ended December 31, 2016, the Individual Investor Class, Institutional Class and Class R shares of the Fund had total returns of 5.81%, 6.06% and 5.50% respectively, compared to 8.31% for the 60% S&P 500 Index/40% Bloomberg Barclays U.S. Aggregate Bond Index (“BARCAP”) blend (the Blended Index) and 7.54% for the Lipper Mixed-Asset Target Allocation Growth Funds Index.
What factors contributed to the Fund’s performance?
The overall equity component of the Fund underperformed relative to the S&P 500 Index. Stock selection in the Information Technology sector and the Fund’s exposure to international developed markets were the largest detractors to relative performance. Stock selection within the Healthcare sector contributed positively to relative performance. The bond component of the Fund underperformed the BARCAP. However, the Fund’s underweight to fixed income versus the Blended Index contributed positively to the overall relative performance of the Fund.
Can you discuss any significant changes to the Fund’s positioning throughout the period?
The Fund converted to a fund of funds structure in December 2016. It continues to have the same investment objective, portfolio management team and strategic asset allocation; however, the Fund’s strategy has changed such that asset allocation components are now fully invested in Pax World Funds rather than a combination of individual securities and mutual funds.
During this structural change we initiated a position in the recently launched Pax ESG Beta Dividend Fund to help increase the dividend yield of the equity component of the Fund. Additionally, the Fund converted its large cap component of individual securities (“large cap sleeve”) into a direct investment in the recently
49
December 31, 2016
|
Pax Balanced Fund, continued |
launched Pax Large Cap Fund, and converted its fixed income component of individual securities (“fixed income sleeve”) into a direct investment in the recently launched Pax Core Bond Fund. The large cap sleeve and Large Cap Fund were/are managed by Chris Brown, and the fixed income sleeve and Core Bond Fund were/are managed by Anthony Trzcinka.
The Fund continues to obtain its U.S. mid cap exposure through direct investments in the Pax Mid Cap Fund and its Non-U.S. exposure through direct investments in the Pax MSCI International ESG Index Fund.
Portfolio Highlights (Unaudited)
Ten Year Annual Total Return—Historical Growth of $10,000
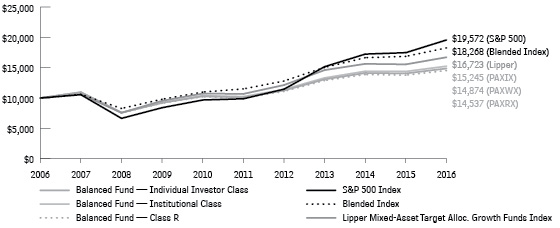
Returns—Period ended December 31, 2016
Average Annual Return | |||||
Share class | Ticker | 1 year | 3 years | 5 years | 10 years |
Individual Investor Class1 | PAXWX | 5.81% | 4.36% | 8.03% | 4.05% |
Institutional Class1,2 | PAXIX | 6.06% | 4.62% | 8.30% | 4.30% |
Class R1,3 | PAXRX | 5.50% | 4.09% | 7.76% | 3.81% |
S&P 500 Index | 11.96% | 8.87% | 14.66% | 6.95% | |
Blended Index | 8.31% | 6.66% | 9.69% | 6.21% | |
Lipper Mixed-Asset Target Alloc. Growth Funds Index | 7.54% | 4.61% | 9.38% | 5.28% | |
See “Glossary of Terms” for descriptions of benchmarks.
50
December 31, 2016 |
These figures represent past performance, which is no guarantee of future results. Investment return and principal value of an investment will fluctuate so that an investor’s shares, when redeemed, may be worth more or less than their original cost. Current performance may be lower or higher than the performance data quoted. Total returns for periods of less than one year have not been annualized. For more recent month-end performance data, please visit www.paxworld.com or call us at 800.767.1729.
1 | Total return figures include reinvested dividends and capital gains distributions, and changes in principal value, and do not reflect the taxes that a shareholder might pay on Fund distributions or on the redemption of Fund shares. |
2 | Inception of Institutional Class shares is April 2, 2007. The performance information shown for Institutional Class shares includes the performance of Individual Investor Class shares for the period prior to Institutional Class inception. Expenses have not been adjusted to reflect the expenses allocable to Institutional Class shares. If such expenses were reflected, the returns would be higher than those shown. |
3 | Inception of Class R shares is April 2, 2007. The performance information shown for Class R shares includes the performance of Individual Investor Class shares for the period prior to Class R inception. Expenses have not been adjusted to reflect the expenses allocable to Class R shares. If such expenses were reflected, the returns would be lower than those shown. |
Fund Allocation | Percent of Net Assets |
Equity | |
Large-Cap/Multi-Cap Core Strategies | |
Pax Large Cap Fund | 42.0% |
Pax ESG Beta Dividend Fund | 7.3% |
Small/Mid-Cap Core Strategies | |
Pax Mid Cap Fund | 9.2% |
Foreign Large Cap Blend Strategy | |
Pax MSCI International ESG Index Fund | 8.5% |
Total Equity | 67.0% |
Fixed Income | |
Investment Grade/Intermediate | |
Pax Core Bond Fund | 32.0% |
Total Fixed Income | 32.0% |
Cash & Cash Equivalents | 1.0% |
Total | 100.0% |
51
December 31, 2016
|
Pax Sustainable Managers Capital |
|
Portfolio Manager
|
|
Portfolio Manager |


Portfolio Managers’ Comments |
How did the Pax Sustainable Managers Capital Appreciation Fund (the Fund) perform for the period?
For the one-year period ended December 31, 2016, the Individual Investor Class, Class A, Institutional Class, and Class C shares of the Fund returned 7.98%, 8.03%, 8.38%, and 7.24%, respectively, compared to 7.41% for its Blended Index*, and 7.54% for the Lipper Mixed-Asset Target Allocation Growth Funds Index.
How is the Fund’s portfolio positioned?
At the end of the year, the portfolio’s positioning was consistent with its longtime make up of a moderate overweight to equities and an emphasis on more-flexible funds in the fixed-income portion of the portfolio.
Can you discuss any significant changes to the Fund’s positioning throughout the period?
There were no significant changes to the Fund’s positioning but we did incrementally decrease the equity overweight while bringing international developed and emerging markets exposure closer to neutral weightings.
What contributed positively to performance?
In a year that saw equities deliver strong overall results while interest rate-sensitive bonds were solid but unexceptional, the portfolio’s overweight to equities and exposure to credit-sensitive bonds were positive contributors to the Fund’s performance.
What detracted from performance?
Although equity exposure overall was a positive for the Fund’s performance in 2016, holdings in developed international markets detracted from results as they posted a loss for the year.
* | See “Glossary of Terms” for descriptions of benchmarks. |
52
December 31, 2016
|
Portfolio Highlights (Unaudited) |
Annual Total Return—Historical Growth of $10,000 – Since Inception

* | Represents a hypothetical investment of $10,000 in the fund after deducting the maximum sales load of 5.50% ($10,000 investment minus $550 sales load = $9,450). |
Returns—Period ended December 31, 2016
Total Return | Average Annual Return | |||||
Share class | Ticker |
| 1 year | 3 years | 5 years | Since Inception |
Individual Investor Class1,2,6 | PWCAX | 7.98% | 3.55% | 8.74% | 7.27% | |
Class A1,3,6 | PGPAX | NAV4 | 8.03% | 3.57% | 8.75% | 7.28% |
POP | 2.06% | 1.62% | 7.53% | 6.42% | ||
Institutional Class1,6 | PMIIX | 8.38% | 3.86% | 9.09% | 7.56% | |
Class C1,5,6 | PWCCX | NAV4 | 7.24% | 2.78% | 7.94% | 6.46% |
CDSC | 6.17% | |||||
Blended Index | 7.41% | 5.15% | 10.20% | 8.68% | ||
Lipper Mixed-Asset Target Allocation Growth Funds Index | 7.54% | 4.61% | 9.38% | 8.16% | ||
S&P 500 Index | 11.96% | 8.87% | 14.66% | 12.59% | ||
See “Glossary of Terms” for descriptions of benchmarks.
These figures represent past performance, which is no guarantee of future results. Investment return and principal value of an investment will fluctuate so that an investor’s shares, when redeemed, may be worth more or less than their original cost. Current performance may be lower or higher than the performance data quoted. Total returns for periods of less than one year have not been annualized. For more recent month-end performance data, please visit www.paxworld.com or call us at 800.767.1729.
1 | The Fund’s inception date is January 4, 2010. The Fund’s investment adviser assumed certain expenses during the period; total returns would have been lower had these expenses not been assumed. Total return figures include reinvested dividends and capital gains distributions, and changes in principal value, and do not reflect the taxes that a shareholder might pay on Fund distributions or on the redemption of Fund shares. |
2 | Inception of Individual Investor Class is April 1, 2016. The performance information shown for Individual Investor Class shares includes the NAV performance of Class A shares for the period prior to Individual Investor Class inception. |
53
December 31, 2016
|
Pax Sustainable Managers Capital Appreciation Fund, continued
|
Portfolio Highlights (Unaudited), continued |
3 | A 1.00% CDSC (contingent deferred sales charge) may be charged on any shares purchased without an initial sales charge as part of a purchase over $1 million that are sold within 18 months of purchase. POP (public offering price) reflects the maximum sales load for the Fund’s Class A shares of 5.50%. NAV performance does not reflect the deduction of the sales load or the CDSC, which if reflected would reduce the performance shown. |
4 | NAV is Net Asset Value. |
5 | A 1.00% CDSC (contingent deferred sales charge) may be charged on shares redeemed within one year of purchase. NAV performance does not reflect the deduction of the sales load or the CDSC, which if reflected would reduce the performance shown. |
6 | Effective March 29, 2016, the ESG Managers Growth Portfolio was consolidated into the ESG Managers Growth and Income Portfolio, and the ESG Managers Growth and Income Portfolio was renamed the Pax Sustainable Managers Capital Appreciation Fund. The ESG Managers Growth and Income Portfolio is considered the “Surviving Fund” of the reorganization for accounting and performance reporting purposes. Accordingly, all performance and other information shown for the Capital Appreciation Fund for periods prior to March 29, 2016 is that of the Surviving Fund. |
Allocations
Manager/Strategy | Percent of Net Assets |
EQUITY | |
Large-Cap Multi-Cap | |
Neuberger Berman Socially Responsive Fund | 0.4% |
Parnassus Core Equity Fund | 23.3% |
TIAA-CREF Social Choice Equity Fund | 14.3% |
Touchstone Premium Yield Equity Fund | 0.5% |
Small/Mid-Cap | |
Ariel Fund | 5.7% |
Eventide Gilead Fund | 8.5% |
Pax Small Cap Fund | 6.5% |
International/World | |
Appleseed Fund | 1.1% |
Hartford Schroders Emerging Markets Equity Fund | 4.5% |
Pax MSCI International ESG Index Fund | 19.5% |
Portfolio 21 Global Equity Fund | 1.2% |
Sector Specific | |
Pax Global Environmental Markets Fund | 2.5% |
Total Equities | 88.0% |
FIXED INCOME | |
Investment Grade | |
PIMCO Income Fund | 7.9% |
Praxis Impact Bond Fund | 0.1% |
TIAA-CREF Social Choice Bond Fund | 3.4% |
High Yield | |
Pax High Yield Bond Fund | 0.9% |
Total Fixed Income | 12.3% |
Other assets and liabilities (net) | -0.3% |
Total | 100.0% |
54
December 31, 2016 |
Top Ten Holdings
Company | Percent of Net Assets |
Parnassus Core Equity Fund | 23.3% |
Pax MSCI International ESG Index Fund | 19.5% |
TIAA-CREF Social Choice Equity Fund | 14.3% |
Eventide Gilead Fund | 8.5% |
PIMCO Income Fund | 7.9% |
Pax Small Cap Fund | 6.5% |
Ariel Fund | 5.7% |
Hartford Schroders Emerging Markets Equity Fund | 4.5% |
TIAA-CREF Social Choice Bond Fund | 3.4% |
Pax Global Environmental Markets Fund | 2.5% |
Total | 96.1% |
Ten largest holdings do not include money market securities, certificates of deposit, commercial paper or cash and equivalents, if applicable.
Holdings are subject to change.
55
December 31, 2016
|
Pax Sustainable Managers Total Return Fund |
|
Portfolio Manager |
|
Portfolio Manager |
Portfolio Managers’ Comments |
How did the Pax Sustainable Managers Total Return Fund (the Fund) perform for the period?
For the one-year period ended December 31, 2016, the Individual Investor Class, Class A, Institutional Class, and Class C shares of the Fund returned 4.67%, 4.70%, 5.06%, and 3.96%, respectively, compared to 4.81% for its Blended Index* and 6.28% for the Lipper Mixed-Asset Target Allocation Conservative Funds Index.
How is the Fund’s portfolio positioned?
At the end of the year, the portfolio’s positioning was consistent with its longtime make up of a moderate overweight to equities and an emphasis on more-flexible funds in the fixed-income portion of the portfolio.
Can you discuss any significant changes to the Fund’s positioning throughout the period?
There were no significant changes to the Fund’s positioning but we did incrementally decrease the equity overweight while bringing international developed and emerging markets exposure closer to neutral weightings.
What contributed positively to performance?
In a year that saw equities deliver strong overall results while interest rate-sensitive bonds were solid but unexceptional, the portfolio’s overweight to equities and exposure to credit-sensitive bonds were positive contributors to the Fund’s performance.
What detracted from performance?
Although equity exposure overall was a positive for the Fund’s performance in 2016, holdings in developed international markets detracted from results as they posted a loss for the year. That weakness was the biggest factor in the Fund trailing its category for the year as the portfolio held roughly 4% more in international markets than the category average.
* | See “Glossary of Terms” for descriptions of benchmarks. |
56
December 31, 2016
|
Portfolio Highlights (Unaudited) |
Annual Total Return—Historical Growth of $10,000 – Since Inception

* | Represents a hypothetical investment of $10,000 in the fund after deducting the maximum sales load of 4.50% ($10,000 investment minus $450 sales load = $9,550). |
Returns—Period ended December 31, 2016
Total Return | Average Annual Return | |||||
Share class | Ticker |
| 1 year | 3 years | 5 years | Since Inception |
Individual Investor Class1,2,6 | PWTRX | 4.67% | 3.19% | 5.20% | 5.14% | |
Class A1,3,6 | PWMAX | NAV4 | 4.70% | 3.20% | 5.21% | 5.15% |
POP | 0.03% | 1.64% | 4.24% | 4.46% | ||
Institutional Class1,6 | PWMIX | 5.06% | 3.47% | 5.47% | 5.40% | |
Class C1,5,6 | PWMCX | NAV4 | 3.96% | 2.41% | 4.42% | 4.35% |
CDSC | 2.92% | |||||
Blended Index | 4.81% | 4.05% | 5.75% | 5.96% | ||
Lipper Mixed-Asset Target Allocation Conservative Funds Index | 6.28% | 3.06% | 5.01% | 5.23% | ||
Barclays U.S. Aggregate Bond Index | 2.65% | 3.03% | 2.23% | 3.61% | ||
See “Glossary of Terms” for descriptions of benchmarks.
These figures represent past performance, which is no guarantee of future results. Investment return and principal value of an investment will fluctuate so that an investor’s shares, when redeemed, may be worth more or less than their original cost. Current performance may be lower or higher than the performance data quoted. Total returns for periods of less than one year have not been annualized. For more recent month-end performance data, please visit www.paxworld.com or call us at 800.767.1729.
1 | The Fund’s inception date is January 4, 2010. The Fund’s investment adviser assumed certain expenses during the period; total returns would have been lower had these expenses not been assumed. Total return figures include reinvested dividends and capital gains distributions, and changes in principal value, and do not reflect the taxes that a shareholder might pay on Fund distributions or on the redemption of Fund shares. |
57
December 31, 2016
|
Pax Sustainable Managers Total Return Fund, continued |
Portfolio Highlights (Unaudited), continued |
2 | Inception of Individual Investor Class is April 1, 2016. The performance information shown for Individual Investor Class shares includes the NAV performance of Class A shares for the period prior to Individual Investor Class inception. |
3 | A 1.00% CDSC (contingent deferred sales charge) may be charged on any shares purchased without an initial sales charge as part of a purchase over $1 million that are sold within 18 months of purchase. POP (public offering price) reflects the maximum sales load for the Fund’s Class A shares of 4.50%. NAV performance does not reflect the deduction of the sales load or the CDSC, which if reflected would reduce the performance shown. |
4 | NAV is Net Asset Value. |
5 | A 1.00% CDSC (contingent deferred sales charge) may be charged on shares redeemed within one year of purchase. NAV performance does not reflect the deduction of the sales load or the CDSC, which if reflected would reduce the performance shown. |
6 | Effective March 29, 2016, the ESG Managers Balanced Portfolio was consolidated into the ESG Managers Income Portfolio, and the ESG Managers Income Portfolio was renamed the Pax Sustainable Managers Total Return Fund. The ESG Managers Income Portfolio is considered the “Surviving Fund” of the reorganization for accounting and performance reporting purposes. Accordingly, all performance and other information shown for the Total Return Fund for periods prior to March 29, 2016 is that of the Surviving Fund. |
Allocations
Manager/Strategy | Percent of Net Assets |
EQUITY | |
Large-Cap Multi-Cap | |
Neuberger Berman Socially Responsive Fund | 2.9% |
Parnassus Core Equity Fund | 8.3% |
TIAA-CREF Social Choice Equity Fund | 1.7% |
Touchstone Premium Yield Equity Fund | 4.9% |
Small/Mid-Cap | |
Ariel Fund | 1.2% |
Eventide Gilead Fund | 3.5% |
Pax Small Cap Fund | 2.1% |
International/World | |
Appleseed Fund | 3.8% |
Hartford Schroders Emerging Markets Equity Fund | 2.2% |
Pax MSCI International ESG Index Fund | 7.7% |
Portfolio 21 Global Equity | 1.3% |
Sector Specific | |
Pax Global Environmental Markets Fund | 1.3% |
Total Equities | 40.9% |
FIXED INCOME | |
Investment Grade | |
Access Capital Community Investment Fund | 5.8% |
CRA Qualified Investment Fund | 5.8% |
PIMCO Income Fund | 12.2% |
Praxis Impact Bond Fund | 14.7% |
TIAA-CREF Social Choice Bond Fund | 16.4% |
58
December 31, 2016 |
Manager/Strategy | Percent of Net Assets |
High Yield | |
Pax High Yield Bond Fund | 4.6% |
Total Fixed Income | 59.5% |
Other assets and liabilities (net) | -0.4% |
Total | 100.0% |
Top Ten Holdings
Company | Percent of Net Assets |
TIAA-CREF Social Choice Bond Fund | 16.4% |
Praxis Impact Bond Fund | 14.7% |
PIMCO Income Fund | 12.2% |
Parnassus Core Equity Fund | 8.3% |
Pax MSCI International ESG Index Fund | 7.7% |
Access Capital Community Investment Fund | 5.8% |
CRA Qualified Investment Fund | 5.8% |
Touchstone Premium Yield Equity Fund | 4.9% |
Pax High Yield Bond Fund | 4.6% |
Appleseed Fund | 3.8% |
Total | 84.2% |
Ten largest holdings do not include money market securities, certificates of deposit, commercial paper or cash and equivalents, if applicable.
Holdings are subject to change.
59
December 31, 2016
|
Sustainable Investing Update (Unaudited) |
|
Senior Vice President
Julie Gorte, Ph.D., |
For those of us committed to sustainability, 2016 was a year of drama. There were some great highs, including the entry into force of the Paris Agreement, in which most countries committed to reduce greenhouse gas emissions. And then there was the U.S. election, which brought climate skeptics into senior Administration positions.
We understand how important public policy can be to sustainability, but we also understand its limitations. Our own commitment to sustainability in investment is not diminished by policy headwinds. For example, Pax filed or co-filed shareholder resolutions with ten companies for the 2016 shareholder season, concentrating on two key aspects of sustainability: gender equality and climate change. For this year’s shareholder season, we have filed or co-filed 11 resolutions, again on the same two key topics. And even though the season has not really begun yet, we’ve already been able to withdraw one gender pay equity resolution after reaching an agreement on a way forward with one company. We are optimistic that we will be able to withdraw others as the season progresses, just as we were able to withdraw half our resolutions last year.
This kind of progress may sound laborious, but many, if not most, of the companies we’ve engaged with on these topics are some of the largest in the world. And when those companies commit to gender pay equity or agree to establish targets for greenhouse gas reduction, it helps to create pressure on others—including the thousands of companies in these companies’ supply chains—to step up as well. There is a halo effect to this kind of engagement that’s difficult to quantify, but real nonetheless.
When I first started engaging with companies on board diversity, the two typical polite responses I got were, “Okay, but can you prove to me that women will make effective board members?” and “We are committed to diversity, but there aren’t enough qualified women available.” Times have changed. Pax has been able to withdraw every resolution we have filed with companies on board gender diversity because we were able to reach agreements with companies to include diverse candidates for every director search. Several of the companies we’ve engaged with have added women to their boards. Our record on gender pay equity is similar, though this is only the second year we’ve focused our engagement efforts on that topic.
60
December 31, 2016
|
Sustainable Investing Update (Unaudited), continued |
Why the success? Because both issues—and gender equality more generally—have become mainstream economic topics, and the recognition among investors that gender equality has financial value is growing quickly. Yes, in some countries, policy has also been a tailwind, especially countries that have statutes requiring gender diversity on boards (which is not the case in the United States). The thing that’s driving gender equality, in terms of board and executive suite representation as well as pay equality, is not so much policy as economics. Companies with more women in decision-making roles do better financially, according to numerous studies, as well as our own experience and analysis. In short, the market recognizes the importance of gender equality.
Similarly, financial markets are increasingly aware of and integrating climate risks and opportunities into investment decisions. President Trump has vowed to kill the Clean Power Plan, and that might happen. But the main thrust of that plan—reducing dependence on coal to produce electricity—has been underway in the U.S. for almost a decade, and there is widespread agreement among financial pundits that coal’s demise was market-driven, not policy-driven. Meanwhile, renewable energy continues to constitute the majority of new capacity added, and wind and solar, in particular, are increasingly cost-competitive with fossil fuels. Why? Not because of subsidies, but in our view, because of technology.
In short, sustainability is alive and well, and our own commitment to advancing it, using the tools we have as investors, is stronger than ever.
61
December 31, 2016
|
Shareholder Expense Examples (Unaudited) |
Examples As a shareholder of the Funds, you incur ongoing costs, including management fees; distribution and/or service (12b-1) fees; and other Fund expenses. The examples on the next page are intended to help you understand your ongoing costs (in dollars) of investing in each of the Funds and compare these costs with the ongoing costs of investing in other mutual funds. For more information, see the relevant Fund’s prospectus or talk to your financial adviser.
The examples are based on an investment of $1,000 invested at the beginning of the period and held for the entire period beginning on July 1, 2016 and ending on December 31, 2016.
Please note that Individual Retirement Account (IRA), Coverdell Education Savings, Roth IRA, SEP-IRA, SIMPLE IRA, and 403(b)(7) accounts are charged an annual custodial fee of twelve dollars. If you are invested in one of these account types, you should add an additional six dollars to the estimated expenses paid during the period.
Actual Expenses For each Fund, the first table on the next page provides information about actual account values and actual expenses. You may use the information in this table, together with the amount you invested, to estimate the expenses that you paid over the period. For the Fund, simply divide your account value by $1,000 (for example, an $8,600 account value divided by $1,000 = 8.6), then multiply the result by the number under the heading entitled “Expenses Paid During Period” to estimate the expenses you paid on your account during this period.
Hypothetical Examples for Comparison Purposes For each Fund, the second table on the following pages provides information about hypothetical account values and hypothetical expenses based on each Fund’s actual expense ratio and an assumed rate of return of 5% per year before expenses, which is not each Fund’s actual return. The hypothetical account values and expenses may not be used to estimate the actual ending account balance or expenses you paid for the period. You may use this information to compare the ongoing costs of investing in the Funds and other funds. To do so, compare these 5% hypothetical examples with the 5% hypothetical examples that appear in the shareholder reports of the other funds.
Please note that the expenses shown in the tables are meant to highlight your ongoing costs only and do not reflect any transactional costs. Therefore, the second table is useful in comparing ongoing costs only, and will not help you determine the relative total costs of owning different funds. In addition if these transactional costs were included, our costs would have been higher.
62
December 31, 2016
|
Shareholder Expense Examples (Unaudited), continued |
Based on Actual Fund Return | ||||
| Beginning Account Value | Ending 12/31/16 | Annualized | Expenses Paid During Period1 |
Large Cap Fund - Individual Investor 2 | $ 1,000.00 | $ 991.70 | 0.96% | $ 0.52 |
Large Cap Fund - Institutional Investor 2 | 1,000.00 | 991.70 | 0.71% | 0.39 |
Mid Cap Fund - Individual Investor | 1,000.00 | 1,050.90 | 1.15% | 5.93 |
Mid Cap Fund - Institutional | 1,000.00 | 1,051.20 | 0.90% | 4.64 |
Small Cap Fund - Individual Investor | 1,000.00 | 1,125.70 | 1.20% | 6.41 |
Small Cap Fund - Class A | 1,000.00 | 1,125.90 | 1.20% | 6.41 |
Small Cap Fund - Institutional | 1,000.00 | 1,127.00 | 0.95% | 5.08 |
Small Cap Fund - Class R | 1,000.00 | 1,124.20 | 1.45% | 7.74 |
ESG Beta Quality Fund - Individual Investor | 1,000.00 | 1,063.90 | 0.90% | 4.67 |
ESG Beta Quality Fund - Class A | 1,000.00 | 1,063.70 | 0.90% | 4.67 |
ESG Beta Quality Fund - Institutional | 1,000.00 | 1,065.00 | 0.65% | 3.37 |
ESG Beta Quality Fund - Class R | 1,000.00 | 1,062.50 | 1.15% | 5.96 |
ESG Beta Dividend Fund - Individual Investor 2 | 1,000.00 | 991.10 | 0.90% | 0.49 |
ESG Beta Dividend Fund - Institutional Investor 2 | 1,000.00 | 991.10 | 0.65% | 0.35 |
MSCI International ESG Index Fund - Individual Investor | 1,000.00 | 1,024.60 | 0.80% | 4.07 |
MSCI International ESG Index Fund - Institutional | 1,000.00 | 1,025.10 | 0.55% | 2.80 |
MSCI International ESG Index Fund - Class R | 1,000.00 | 1,023.80 | 1.05% | 5.34 |
Global Women's Index Fund - Individual Investor | 1,000.00 | 1,037.00 | 0.90% | 4.61 |
Global Women's Index Fund - Institutional | 1,000.00 | 1,038.80 | 0.65% | 3.33 |
Global Environmental Markets Fund - Individual Investor | 1,000.00 | 1,065.00 | 1.23% | 6.38 |
Global Environmental Markets Fund - Class A | 1,000.00 | 1,065.00 | 1.23% | 6.38 |
Global Environmental Markets Fund - Institutional | 1,000.00 | 1,066.10 | 0.98% | 5.09 |
Global Environmental Markets Fund - Class R | 1,000.00 | 1,063.30 | 1.48% | 7.68 |
Core Bond Fund - Individual Investor 2 | 1,000.00 | 1,008.70 | 0.74% | 0.41 |
Core Bond Fund - Institutional Investor 2 | 1,000.00 | 1,009.30 | 0.49% | 0.27 |
High Yield Bond Fund - Individual Investor | 1,000.00 | 1,086.60 | 0.96% | 5.04 |
High Yield Bond Fund - Class A | 1,000.00 | 1,086.50 | 0.96% | 5.03 |
High Yield Bond Fund - Institutional | 1,000.00 | 1,086.60 | 0.71% | 3.72 |
High Yield Bond Fund - Class R | 1,000.00 | 1,085.20 | 1.21% | 6.34 |
Balanced Fund - Individual Investor | 1,000.00 | 1,030.90 | 0.70% | 3.57 |
Balanced Fund - Institutional | 1,000.00 | 1,032.40 | 0.45% | 2.30 |
Balanced Fund - Class R | 1,000.00 | 1,029.70 | 0.95% | 4.85 |
Capital Appreciation Fund - Individual Investor | 1,000.00 | 1,062.70 | 0.95% | 4.93 |
Capital Appreciation Fund - Class A | 1,000.00 | 1,062.70 | 0.92% | 4.77 |
Capital Appreciation Fund - Institutional | 1,000.00 | 1,065.10 | 0.68% | 3.53 |
Capital Appreciation Fund - Class C | 1,000.00 | 1,059.00 | 1.67% | 8.64 |
Total Return Fund - Individual Investor | 1,000.00 | 1,020.00 | 0.88% | 4.47 |
Total Return Fund - Class A | 1,000.00 | 1,020.90 | 0.87% | 4.42 |
Total Return Fund - Institutional | 1,000.00 | 1,022.70 | 0.62% | 3.15 |
Total Return Fund - Class C | 1,000.00 | 1,017.30 | 1.62% | 8.21 |
1 | Expenses are equal to each Funds’ annualized expense ratio, multiplied by the average account value over the period, multiplied by 184/366 (to reflect the one-half year period beginning on July 1, 2016 and ending on December 31, 2016). |
2 | Commencement of operations for the Large Cap Fund, ESG Beta Dividend Fund and Pax Core Bond Fund were December 12, 2016. Expense calculations are based on 20 days, to reflect the period from December 12, 2016 through December 31, 2016. |
63
December 31, 2016
|
Shareholder Expense Examples (Unaudited), continued |
Based on Hypothetical 5% Return (before expenses) | ||||
| Beginning Account Value | Ending 12/31/16 | Annualized | Expenses Paid During Period1 |
Large Cap Fund - Individual Investor 2 | $ 1,000.00 | $ 1,021.57 | 0.96% | $ 4.88 |
Large Cap Fund - Institutional Investor 2 | 1,000.00 | 1,021.57 | 0.71% | 3.61 |
Mid Cap Fund - Individual Investor | 1,000.00 | 1,019.36 | 1.15% | 5.84 |
Mid Cap Fund - Institutional | 1,000.00 | 1,020.61 | 0.90% | 4.57 |
Small Cap Fund - Individual Investor | 1,000.00 | 1,019.10 | 1.20% | 6.09 |
Small Cap Fund - Class A | 1,000.00 | 1,019.10 | 1.20% | 6.09 |
Small Cap Fund - Institutional | 1,000.00 | 1,020.36 | 0.95% | 4.82 |
Small Cap Fund - Class R | 1,000.00 | 1,017.85 | 1.45% | 7.35 |
ESG Beta Quality Fund - Individual Investor | 1,000.00 | 1,020.61 | 0.90% | 4.57 |
ESG Beta Quality Fund - Class A | 1,000.00 | 1,020.61 | 0.90% | 4.57 |
ESG Beta Quality Fund - Institutional | 1,000.00 | 1,021.87 | 0.65% | 3.30 |
ESG Beta Quality Fund - Class R | 1,000.00 | 1,019.36 | 1.15% | 5.84 |
ESG Beta Dividend Fund - Individual Investor 2 | 1,000.00 | 1,021.87 | 0.90% | 4.57 |
ESG Beta Dividend Fund - Institutional Investor 2 | 1,000.00 | 1,021.87 | 0.65% | 3.30 |
MSCI International ESG Index Fund - | 1,000.00 | 1,021.11 | 0.80% | 4.06 |
MSCI International ESG Index Fund - Institutional | 1,000.00 | 1,022.37 | 0.55% | 2.80 |
MSCI International ESG Index Fund - Class R | 1,000.00 | 1,019.86 | 1.05% | 5.33 |
Global Women's Index Fund - Individual Investor | 1,000.00 | 1,020.61 | 0.90% | 4.57 |
Global Women's Index Fund - Institutional | 1,000.00 | 1,021.87 | 0.65% | 3.30 |
Global Environmental Markets Fund - | 1,000.00 | 1,018.95 | 1.23% | 6.24 |
Global Environmental Markets Fund - Class A | 1,000.00 | 1,018.95 | 1.23% | 6.24 |
Global Environmental Markets Fund - Institutional | 1,000.00 | 1,020.21 | 0.98% | 4.98 |
Global Environmental Markets Fund - Class R | 1,000.00 | 1,017.70 | 1.48% | 7.51 |
Core Bond Fund - Individual Investor 2 | 1,000.00 | 1,021.42 | 0.74% | 3.76 |
Core Bond Fund - Institutional Investor 2 | 1,000.00 | 1,022.67 | 0.49% | 2.49 |
High Yield Bond Fund - Institutional | 1,000.00 | 1,020.31 | 0.96% | 4.88 |
High Yield Bond Fund - Class R | 1,000.00 | 1,020.31 | 0.96% | 4.88 |
High Yield Bond Fund - Institutional | 1,000.00 | 1,021.57 | 0.71% | 3.61 |
High Yield Bond Fund - Class R | 1,000.00 | 1,019.05 | 1.21% | 6.14 |
Balanced Fund - Individual Investor | 1,000.00 | 1,021.62 | 0.70% | 3.56 |
Balanced Fund - Institutional | 1,000.00 | 1,022.87 | 0.45% | 2.29 |
Balanced Fund - Class R | 1,000.00 | 1,020.36 | 0.95% | 4.82 |
Capital Appreciation Fund - Individual Investor | 1,000.00 | 1,020.36 | 0.95% | 4.82 |
Capital Appreciation Fund - Class A | 1,000.00 | 1,020.51 | 0.92% | 4.67 |
Capital Appreciation Fund - Institutional | 1,000.00 | 1,021.72 | 0.68% | 3.46 |
Capital Appreciation Fund - Class C | 1,000.00 | 1,016.74 | 1.67% | 8.47 |
Total Return Fund - Individual Investor | 1,000.00 | 1,020.71 | 0.88% | 4.47 |
Total Return Fund - Class A | 1,000.00 | 1,020.76 | 0.87% | 4.42 |
Total Return Fund - Institutional | 1,000.00 | 1,022.02 | 0.62% | 3.15 |
Total Return Fund - Class C | 1,000.00 | 1,016.99 | 1.62% | 8.21 |
1 | Expenses are equal to each Funds’ annualized expense ratio, multiplied by the average account value over the period, multiplied by 184/366 (to reflect the one-half year period beginning on July 1, 2016 and ending on December 31, 2016). |
2 | For the Hypothetical examples, calculations shown assume the new Fund or new Share Class was in existence for the entire one-half year period beginning on July 1, 2016 and ending on December 31, 2016. |
64
December 31, 2016
|
Schedule of Investments |
Pax Large Cap Fund
Percent of Net Assets | Shares/Principal | Value | ||||||
COMMON STOCKS: 97.5% | ||||||||
Consumer Discretionary: 9.0% | ||||||||
Amazon.com, Inc. (a) | 23,539 | $ | 17,651,190 | |||||
Home Depot, Inc., The | 25,673 | 3,442,236 | ||||||
Mohawk Industries, Inc. (a) | 59,903 | 11,961,431 | ||||||
Ross Stores, Inc. | 136,921 | 8,982,018 | ||||||
Time Warner, Inc. | 228,158 | 22,024,092 | ||||||
Walt Disney Co., The | 64,230 | 6,694,051 | ||||||
70,755,018 | ||||||||
Consumer Staples: 10.2% | ||||||||
Estee Lauder Cos, Inc., The, Class A | 190,355 | 14,560,254 | ||||||
General Mills, Inc. | 239,954 | 14,821,959 | ||||||
Molson Coors Brewing Co., Class B | 94,133 | 9,160,082 | ||||||
PepsiCo, Inc. | 192,545 | 20,145,983 | ||||||
Procter & Gamble Co., The | 201,103 | 16,908,740 | ||||||
Whole Foods Market, Inc. | 171,151 | 5,264,605 | ||||||
80,861,623 | ||||||||
Energy: 8.2% | ||||||||
EOG Resources, Inc. | 141,248 | 14,280,173 | ||||||
Occidental Petroleum Corp. | 158,144 | 11,264,597 | ||||||
Pioneer Natural Resources Co. | 106,114 | 19,107,948 | ||||||
Schlumberger, Ltd. | 243,377 | 20,431,499 | ||||||
65,084,217 | ||||||||
Financials: 19.4% | ||||||||
Bank of America Corp. | 840,000 | 18,564,000 | ||||||
Bank of New York Mellon Corp., The | 360,530 | 17,081,911 | ||||||
Berkshire Hathaway, Inc., Class B (a) | 154,036 | 25,104,787 | ||||||
Charles Schwab Corp., The | 397,927 | 15,706,179 | ||||||
Chubb, Ltd. | 210,431 | 27,802,144 | ||||||
First Republic Bank | 105,429 | 9,714,228 | ||||||
Goldman Sachs Group, Inc., The | 83,436 | 19,978,750 | ||||||
JPMorgan Chase & Co. | 87,018 | 7,508,783 | ||||||
U.S. Bancorp | 213,939 | 10,990,046 | ||||||
152,450,828 | ||||||||
Health Care: 13.7% | ||||||||
Biogen, Inc. (a) | 50,918 |
| 14,439,326 | |||||
Celgene Corp. (a) | 124,085 | 14,362,839 | ||||||
Gilead Sciences, Inc. | 171,151 | 12,256,123 | ||||||
Johnson & Johnson | 141,200 | 16,267,652 | ||||||
Merck & Co., Inc. | 303,794 | 17,884,353 | ||||||
Thermo Fisher Scientific, Inc. | 115,527 | 16,300,860 | ||||||
Zoetis, Inc. | 316,754 | 16,955,841 | ||||||
108,466,994 | ||||||||
Industrials: 10.0% | ||||||||
3M Co. | 68,461 | 12,225,081 | ||||||
Ingersoll-Rand PLC | 236,003 | 17,709,665 | ||||||
Stanley Black & Decker, Inc. | 156,863 | 17,990,617 | ||||||
United Parcel Service, Inc., Class B | 115,527 | 13,244,015 | ||||||
Waste Management, Inc. | 256,727 | 18,204,512 | ||||||
79,373,890 | ||||||||
Information Technology: 19.0% | ||||||||
Alphabet, Inc., Class A (a) | 23,533 | 18,648,726 | ||||||
Alphabet, Inc., Class C (a) | 23,575 | 18,195,660 | ||||||
Apple, Inc. | 297,375 | 34,441,973 | ||||||
Cisco Systems, Inc. | 359,784 | 10,872,672 | ||||||
Facebook, Inc., Class A (a) | 38,461 | 4,424,938 | ||||||
Microsoft Corp. | 548,357 | 34,074,901 | ||||||
PayPal Holdings Inc (a) | 80,000 | 3,157,600 | ||||||
QUALCOMM, Inc. | 256,727 | 16,738,600 | ||||||
Visa, Inc., Class A | 122,594 | 9,564,784 | ||||||
150,119,854 | ||||||||
Materials: 1.2% | ||||||||
Ecolab, Inc. | 80,612 | 9,449,339 | ||||||
Real Estate: 3.0% | ||||||||
American Tower Corp., REIT | 129,525 | 13,688,202 | ||||||
Crown Castle International Corp., REIT | 111,248 | 9,652,989 | ||||||
23,341,191 | ||||||||
Telecommunication Services: 2.0% | ||||||||
AT&T, Inc. | 364,296 | 15,493,509 | ||||||
Utilities: 1.8% | ||||||||
Eversource Energy | 253,394 | 13,994,951 | ||||||
TOTAL COMMON STOCKS | ||||||||
(Cost $628,883,240) | 769,391,414 | |||||||
SEE NOTES TO FINANCIAL STATEMENTS
65
December 31, 2016
|
Schedule of Investments |
Pax Large Cap Fund, continued
Percent of Net Assets | Shares/Principal | Value | ||||||
EXCHANGE-TRADED FUNDS: 2.4% | ||||||||
iShares Core S&P 500 ETF | 85,576 | $ | 19,253,744 | |||||
(Cost $19,046,359) | ||||||||
TIME DEPOSIT: 0.1% | ||||||||
State Street Euro Dollar Time Deposit, 0.010%, 01/03/17 |
| 1,142,000 | 1,142,000 | |||||
(Cost $1,142,000) | ||||||||
TOTAL INVESTMENTS: 100.0% | ||||||||
(Cost $649,071,599) | 789,787,158 | |||||||
OTHER ASSETS AND LIABILITIES— (NET): 0.0% (b) | 163,411 | |||||||
NET ASSETS: 100.0% | $ | 789,950,569 | ||||||
(a) | Non-income producing security. |
(b) | Rounds to less than 0.05%. |
REIT | Real Estate Investment Trust |
SEE NOTES TO FINANCIAL STATEMENTS
66
December 31, 2016
|
Schedule of Investments, continued |
Pax Mid Cap Fund
Percent of Net Assets | Shares/Principal | Value | ||||||
COMMON STOCKS: 94.1% | ||||||||
Consumer Discretionary: 14.1% | ||||||||
Aramark | 75,000 | $ | 2,679,000 | |||||
Cabela's, Inc. (a) | 69,259 | 4,055,114 | ||||||
Carter's, Inc. | 42,471 | 3,669,070 | ||||||
Genuine Parts Co. | 20,000 | 1,910,800 | ||||||
Newell Brands, Inc. | 93,403 | 4,170,444 | ||||||
WCI Communities, Inc. (a) | 153,302 | 3,594,932 | ||||||
Yum! Brands, Inc. | 68,544 | 4,340,892 | ||||||
24,420,252 | ||||||||
Consumer Staples: 8.4% | ||||||||
Conagra Brands, Inc. | 70,000 | 2,768,500 | ||||||
Lamb Weston Holdings, Inc. (a) | 53,333 | 2,018,654 | ||||||
Maple Leaf Foods, Inc. | 145,200 | 3,041,019 | ||||||
US Foods Holding Corp. (a) | 176,000 | 4,836,480 | ||||||
Whole Foods Market, Inc. | 60,000 | 1,845,600 | ||||||
14,510,253 | ||||||||
Energy: 7.1% | ||||||||
Antero Resources Corp. (a) | 197,300 | 4,666,145 | ||||||
Concho Resources, Inc. (a)(b) | 31,459 | 4,171,463 | ||||||
EQT Corp. | 52,906 | 3,460,052 | ||||||
12,297,660 | ||||||||
Financials: 21.9% | ||||||||
Alleghany Corp. (a) | 12,977 | 7,891,573 | ||||||
Capitol Federal Financial, Inc. | 304,002 | 5,003,873 | ||||||
Citizens Financial Group, Inc. | 145,000 | 5,166,350 | ||||||
Investors Bancorp, Inc. | 434,319 | 6,058,750 | ||||||
Legg Mason, Inc. | 102,693 | 3,071,548 | ||||||
RenaissanceRe Holdings, Ltd. | 30,034 | 4,091,231 | ||||||
White Mountains Insurance Group, Ltd. | 6,000 | 5,016,300 | ||||||
Willis Towers Watson PLC | 15,000 | 1,834,200 | ||||||
38,133,825 | ||||||||
Health Care: 5.0% | ||||||||
Hologic, Inc. (a) | 131,100 | 5,259,732 | ||||||
ICON PLC (a) | 45,908 | 3,452,282 | ||||||
8,712,014 | ||||||||
Industrials: 9.7% | ||||||||
Arconic, Inc. | 103,333 |
| 1,915,794 | |||||
Expeditors Intl. of Washington, Inc. | 65,575 | 3,472,852 | ||||||
Lincoln Electric Holdings, Inc. | 22,500 | 1,725,075 | ||||||
Masco Corp. | 70,597 | 2,232,277 | ||||||
Oshkosh Corp. | 26,612 | 1,719,401 | ||||||
Robert Half International, Inc. | 30,000 | 1,463,400 | ||||||
Waste Management, Inc. | 60,000 | 4,254,600 | ||||||
16,783,399 | ||||||||
Information Technology: 14.3% | ||||||||
Amdocs, Ltd. | 77,000 | 4,485,250 | ||||||
ARRIS International PLC (a) | 139,308 | 4,197,350 | ||||||
Avnet, Inc. | 80,000 | 3,808,800 | ||||||
Check Point Software Technologies, Ltd. (a)(b) | 37,000 | 3,125,020 | ||||||
Citrix Systems, Inc. (a) | 40,000 | 3,572,400 | ||||||
Genpact, Ltd. (a) | 142,420 | 3,466,503 | ||||||
Qorvo, Inc. (a) | 40,000 | 2,109,200 | ||||||
24,764,523 | ||||||||
Materials: 3.8% | ||||||||
Alcoa Corp. | 49,999 | 1,403,972 | ||||||
Celanese Corp., Series A | 45,000 | 3,543,300 | ||||||
Newmont Mining Corp. (b) | 50,000 | 1,703,500 | ||||||
6,650,772 | ||||||||
Real Estate: 7.7% | ||||||||
Crown Castle International Corp., REIT | 13,120 | 1,138,422 | ||||||
Forest City Realty Trust, Inc., REIT | 128,253 | 2,672,793 | ||||||
Jones Lang LaSalle, Inc. | 23,500 | 2,374,440 | ||||||
Prologis, Inc., REIT | 58,000 | 3,061,820 | ||||||
Weyerhaeuser Co., REIT | 137,500 | 4,137,375 | ||||||
13,384,850 | ||||||||
Utilities: 2.1% | ||||||||
ONE Gas, Inc. | 57,821 | 3,698,231 | ||||||
TOTAL COMMON STOCKS | ||||||||
(Cost $142,725,014) | 163,355,779 | |||||||
SEE NOTES TO FINANCIAL STATEMENTS
67
December 31, 2016
|
Schedule of Investments, continued |
Pax Mid Cap Fund, continued
Percent of Net Assets | Shares/Principal | Value | ||||||
TIME DEPOSIT: 4.0% | ||||||||
State Street Euro Dollar Time Deposit, 0.010%, 01/03/17 | $ | 6,863,000 | $ | 6,863,000 | ||||
(Cost $6,863,000) | ||||||||
TOTAL INVESTMENTS: 98.1% | ||||||||
(Cost $149,588,014) | 170,218,779 | |||||||
OTHER ASSETS AND LIABILITIES— (NET): 1.9% | 3,263,263 | |||||||
NET ASSETS: 100.0% | $ | 173,482,042 | ||||||
(a) | Non-income producing security. |
(b) | Security or partial portion of this security was on loan as of December 31, 2016. The total market value of securities on loan at December 31, 2016 was $7,009,805. |
REIT | Real Estate Investment Trust |
SEE NOTES TO FINANCIAL STATEMENTS
68
December 31, 2016
|
Schedule of Investments, continued |
Pax Small Cap Fund
Percent of Net Assets | Shares/Principal | Value | ||||||
COMMON STOCKS: 97.4% | ||||||||
Consumer Discretionary: 12.6% | ||||||||
Cabela's, Inc. (a) | 314,821 | $ | 18,432,769 | |||||
Carter's, Inc. | 140,000 | 12,094,600 | ||||||
Gentex Corp. (b) | 960,000 | 18,902,400 | ||||||
Jamba, Inc. (a) | 650,000 | 6,695,000 | ||||||
Metaldyne Performance Group, Inc. | 256,907 | 5,896,016 | ||||||
Planet Fitness, Inc., Class A | 360,000 | 7,236,000 | ||||||
Sally Beauty Holdings, Inc. (a)(b) | 290,000 | 7,661,800 | ||||||
WCI Communities, Inc. (a) | 993,822 | 23,305,126 | ||||||
100,223,711 | ||||||||
Consumer Staples: 6.2% | ||||||||
Maple Leaf Foods, Inc. | 660,000 | 13,822,813 | ||||||
Performance Food Group Co. (a) | 525,000 | 12,600,000 | ||||||
US Foods Holding Corp. (a) | 851,700 | 23,404,716 | ||||||
49,827,529 | ||||||||
Energy: 7.3% | ||||||||
Antero Resources Corp. (a)(b) | 1,042,426 | 24,653,375 | ||||||
PDC Energy, Inc. (a)(b) | 243,055 | 17,640,932 | ||||||
SemGroup Corp, Class A | 390,429 | 16,300,411 | ||||||
58,594,718 | ||||||||
Financials: 29.2% (c) | ||||||||
Alleghany Corp. (a)(b) | 29,681 | 18,049,610 | ||||||
Aspen Insurance Holdings, Ltd. | 376,964 | 20,733,020 | ||||||
Beneficial Bancorp, Inc. | 950,000 | 17,480,000 | ||||||
Capitol Federal Financial, Inc. | 1,460,000 | 24,031,600 | ||||||
Charter Financial Corp. | 401,997 | 6,701,290 | ||||||
FBR & Co. | 269,972 | 3,509,636 | ||||||
HomeTrust Bancshares, Inc. (a)(b) | 766,839 | 19,861,130 | ||||||
Investors Bancorp, Inc. (b) | 1,800,000 | 25,110,000 | ||||||
Kearny Financial Corp/MD | 1,020,000 | 15,861,000 | ||||||
Legg Mason, Inc. | 808,392 | 24,179,005 | ||||||
Meridian Bancorp, Inc. | 864,516 | 16,339,352 | ||||||
RenaissanceRe Holdings, Ltd. (b) | 146,404 | 19,943,153 | ||||||
TheStreet, Inc. (a)(b) | 1,471,653 | 1,250,904 | ||||||
White Mountains Insurance Group, Ltd. | 23,500 | 19,647,175 | ||||||
232,696,875 | ||||||||
Health Care: 9.8% | ||||||||
Brookdale Senior Living, Inc. (a)(b) | 680,000 |
| 8,445,600 | |||||
ICON PLC (a) | 210,000 | 15,792,000 | ||||||
Integra LifeSciences Holdings Corp. (a)(b) | 204,278 | 17,525,010 | ||||||
Ligand Pharmaceuticals, Inc. (a)(b) | 143,049 | 14,535,209 | ||||||
Natus Medical, Inc. (a)(b) | 632,668 | 22,016,846 | ||||||
78,314,665 | ||||||||
Industrials: 15.7% | ||||||||
EMCOR Group, Inc. (b) | 221,400 | 15,666,264 | ||||||
ICF International, Inc. (a) | 94,793 | 5,232,574 | ||||||
KLX, Inc. (a) | 265,000 | 11,954,150 | ||||||
Korn/Ferry International | 572,347 | 16,844,172 | ||||||
Lincoln Electric Holdings, Inc. (b) | 150,000 | 11,500,500 | ||||||
MRC Global, Inc. (a) | 1,035,000 | 20,969,100 | ||||||
NN, Inc. (b) | 420,000 | 8,001,000 | ||||||
Oshkosh Corp. | 138,064 | 8,920,315 | ||||||
Thermon Group Holdings, Inc. (a) | 635,000 | 12,122,150 | ||||||
WESCO International, Inc. (a) | 210,000 | 13,975,500 | ||||||
125,185,725 | ||||||||
Information Technology: 9.5% | ||||||||
Apptio, Inc. (a) | 477,172 | 8,841,997 | ||||||
ARRIS International PLC (a) | 590,000 | 17,776,700 | ||||||
Callidus Software, Inc. (a)(b) | 515,000 | 8,652,000 | ||||||
ExlService Holdings, Inc. (a) | 253,869 | 12,805,152 | ||||||
Progress Software Corp. | 165,587 | 5,287,193 | ||||||
Syntel, Inc. (b) | 350,000 | 6,926,500 | ||||||
Verint Systems, Inc. (a) | 420,000 | 14,805,000 | ||||||
Westell Technologies, Inc., Class A (a) | 1,565,681 | 1,017,693 | ||||||
76,112,235 | ||||||||
Materials: 1.7% | ||||||||
Kaiser Aluminum Corp. | 176,081 | 13,679,733 | ||||||
Real Estate: 3.3% | ||||||||
Physicians Realty Trust, REIT (b) | 550,000 | 10,428,000 | ||||||
Ryman Hospitality Properties, Inc., REIT | 170,000 | 10,711,700 | ||||||
Terreno Realty Corp., REIT | 180,000 | 5,128,200 | ||||||
26,267,900 | ||||||||
SEE NOTES TO FINANCIAL STATEMENTS
69
December 31, 2016
|
Schedule of Investments, continued |
Pax Small Cap Fund, continued
Percent of Net Assets | Shares/Principal | Value | ||||||
COMMON STOCKS, continued | ||||||||
Utilities: 2.1% | ||||||||
Unitil Corp. | 375,000 | $ | 17,002,500 | |||||
TOTAL COMMON STOCKS | ||||||||
(Cost $710,544,898) | 777,905,591 | |||||||
TIME DEPOSIT: 2.1% | ||||||||
State Street Euro Dollar Time Deposit, 0.010%, 01/03/17 |
| 16,776,000 | 16,776,000 | |||||
(Cost $16,776,000) | ||||||||
SECURITIES PURCHASED WITH CASH COLLATERAL FROM SECURITIES LENDING: 2.4% | ||||||||
State Street Navigator Securities Lending Government Money Market Portfolio | 18,992,177 | 18,992,177 | ||||||
(Cost $18,992,177) | ||||||||
TOTAL INVESTMENTS: 101.9% | ||||||||
(Cost $746,313,075) | 813,673,768 | |||||||
PAYABLE UPON RETURN OF SECURITIES LOANED— (NET): -2.4% | (18,992,177 | ) | ||||||
OTHER ASSETS AND LIABILITIES— (NET): 0.5% | 3,933,524 | |||||||
NET ASSETS: 100.0% | $ | 798,615,115 | ||||||
(a) | Non-income producing security. |
(b) | Security or partial position of this security was on loan as of December 31, 2016. The total market value of securities on loan as of December 31, 2016 was $66,548,299. |
(c) | Broad industry sectors used for financial reporting purposes. Diversification compliance testing is based on narrower industries within broad sector. |
REIT | Real Estate Investment Trust |
SEE NOTES TO FINANCIAL STATEMENTS
70
December 31, 2016
|
Schedule of Investments, continued |
Pax ESG Beta Quality Fund
Percent of Net Assets | Shares/Principal | Value | ||||||
COMMON STOCKS: 98.9% | ||||||||
Consumer Discretionary: 13.3% | ||||||||
Amazon.com, Inc. (a) | 5,166 | $ | 3,873,828 | |||||
Best Buy Co., Inc. (b) | 3,094 | 132,021 | ||||||
BorgWarner, Inc. (b) | 20,464 | 807,100 | ||||||
Brinker International, Inc. (b) | 31,879 | 1,578,967 | ||||||
Darden Restaurants, Inc. (b) | 2,298 | 167,111 | ||||||
Delphi Automotive PLC | 1,712 | 115,303 | ||||||
Foot Locker, Inc. | 2,506 | 177,650 | ||||||
GameStop Corp., Class A (b) | 18,739 | 473,347 | ||||||
Gap Inc., The | 10,095 | 226,532 | ||||||
Home Depot, Inc., The | 15,500 | 2,078,240 | ||||||
Lowe's Cos., Inc. | 11,832 | 841,492 | ||||||
Macy's, Inc. (b) | 28,545 | 1,022,196 | ||||||
Marriott International, Inc., Class A (b) | 23,180 | 1,916,522 | ||||||
McDonald's Corp. | 12,235 | 1,489,244 | ||||||
Michael Kors Holdings, Ltd. (a)(b) | 441 | 18,954 | ||||||
NIKE, Inc., Class B (b) | 26,027 | 1,322,952 | ||||||
Nordstrom, Inc. (b) | 27,417 | 1,314,097 | ||||||
Sally Beauty Holdings, Inc. (a)(b) | 3,000 | 79,260 | ||||||
Scripps Networks Interactive, Inc., Class A (b) | 11,500 | 820,755 | ||||||
Starbucks Corp. | 45,300 | 2,515,056 | ||||||
Target Corp. (b) | 18,620 | 1,344,923 | ||||||
Time Warner, Inc. | 11,579 | 1,117,721 | ||||||
VF Corp. (b) | 16,300 | 869,605 | ||||||
Walt Disney Co., The | 14,180 | 1,477,840 | ||||||
25,780,716 | ||||||||
Consumer Staples: 10.7% | ||||||||
Campbell Soup Co. (b) | 13,901 | 840,593 | ||||||
Casey's General Stores, Inc. (b) | 2,584 | 307,186 | ||||||
Clorox Co., The (b) | 7,701 | 924,274 | ||||||
CVS Health Corp. | 3,515 | 277,369 | ||||||
Dr. Pepper Snapple Group, Inc. | 14,139 | 1,281,983 | ||||||
Estee Lauder Cos, Inc., The, Class A | 8,219 | 628,671 | ||||||
General Mills, Inc. (b) | 29,116 | 1,798,495 | ||||||
Hershey Co/The (b) | 6,686 | 691,533 | ||||||
Ingredion, Inc. | 7,122 | 889,965 | ||||||
JM Smucker Co., The | 2,493 | 319,254 | ||||||
Kimberly-Clark Corp. | 16,238 | 1,853,081 | ||||||
Kroger Co., The | 75,845 |
| 2,617,411 | |||||
PepsiCo, Inc. | 45,180 | 4,727,183 | ||||||
Procter & Gamble Co., The (b) | 22,100 | 1,858,168 | ||||||
Sysco Corp. (b) | 8,800 | 487,256 | ||||||
Walgreens Boots Alliance, Inc. | 7,894 | 653,307 | ||||||
Whole Foods Market, Inc. (b) | 20,992 | 645,714 | ||||||
20,801,443 | ||||||||
Energy: 2.3% | ||||||||
ConocoPhillips | 943 | 47,282 | ||||||
Dril-Quip, Inc. (a)(b) | 11,504 | 690,815 | ||||||
Phillips 66 (b) | 3,300 | 285,153 | ||||||
Schlumberger, Ltd. (b) | 19,288 | 1,619,228 | ||||||
Spectra Energy Corp. (b) | 2,662 | 109,382 | ||||||
Valero Energy Corp. (b) | 10,615 | 725,217 | ||||||
World Fuel Services Corp. | 22,405 | 1,028,614 | ||||||
4,505,691 | ||||||||
Financials: 11.8% | ||||||||
Aflac, Inc. | 39,136 | 2,723,866 | ||||||
Allstate Corp., The | 2,401 | 177,962 | ||||||
American Express Co. (b) | 6,578 | 487,298 | ||||||
Amtrust Financial Services, Inc. (b) | 15,605 | 427,265 | ||||||
Discover Financial Services | 26,470 | 1,908,222 | ||||||
East West Bancorp, Inc. (b) | 22,447 | 1,140,981 | ||||||
Factset Research Systems, Inc. (b) | 789 | 128,946 | ||||||
FNF Group | 1,241 | 42,144 | ||||||
Lincoln National Corp. | 21,569 | 1,429,378 | ||||||
M&T Bank Corp. (b) | 563 | 88,070 | ||||||
MetLife, Inc. | 40,374 | 2,175,755 | ||||||
Nasdaq, Inc. | 5,242 | 351,843 | ||||||
PNC Financial Services Group, Inc. (b) | 30,700 | 3,590,672 | ||||||
Reinsurance Group of America, Inc. (b) | 23,738 | 2,986,953 | ||||||
Travelers Cos., Inc., The (b) | 16,532 | 2,023,847 | ||||||
Unum Group | 55,824 | 2,452,348 | ||||||
U.S. Bancorp (b) | 14,647 | 752,416 | ||||||
Validus Holdiings, Ltd. | 1,944 | 106,939 | ||||||
22,994,905 | ||||||||
Health Care: 14.1% | ||||||||
AbbVie, Inc. | 13,948 | 873,424 | ||||||
Agilent Technologies, Inc. | 27,250 | 1,241,510 | ||||||
AmerisourceBergen Corp. | 997 | 77,955 | ||||||
Anthem, Inc. | 2,937 | 422,252 | ||||||
Baxter International, Inc. | 104,113 | 4,616,370 | ||||||
SEE NOTES TO FINANCIAL STATEMENTS
71
December 31, 2016
|
Schedule of Investments, continued |
Pax ESG Beta Quality Fund, continued
Percent of Net Assets | Shares/Principal | Value | ||||||
COMMON STOCKS, continued | ||||||||
Health Care, continued | ||||||||
Bristol-Myers Squibb Co. | 13,450 | $ | 786,018 | |||||
Cardinal Health, Inc. (b) | 2,261 | 162,724 | ||||||
Celgene Corp. (a) | 17,207 | 1,991,710 | ||||||
Cigna Corp. | 331 | 44,152 | ||||||
Gilead Sciences, Inc. | 30,757 | 2,202,509 | ||||||
HCA Holdings, Inc. (a)(b) | 14,908 | 1,103,490 | ||||||
Henry Schein, Inc. (a)(b) | 589 | 89,357 | ||||||
Humana, Inc. | 3,485 | 711,045 | ||||||
Johnson & Johnson | 38,902 | 4,481,899 | ||||||
Merck & Co., Inc. | 39,885 | 2,348,030 | ||||||
Quest Diagnostics, Inc. (b) | 8,763 | 805,320 | ||||||
Quintiles Transnational Holdings, Inc. (a)(b) | 3,717 | 282,678 | ||||||
Thermo Fisher Scientific, Inc. | 24,962 | 3,522,138 | ||||||
UnitedHealth Group, Inc. | 10,365 | 1,658,815 | ||||||
27,421,396 | ||||||||
Industrials: 10.1% | ||||||||
3M Co. (b) | 23,800 | 4,249,966 | ||||||
C.H. Robinson Worldwide, Inc. (b) | 535 | 39,194 | ||||||
Chicago Bridge & Iron Co. NV | 5,123 | 162,655 | ||||||
Delta Air Lines, Inc. | 13,402 | 659,244 | ||||||
Expeditors Intl. of Washington, Inc. (b) | 12,396 | 656,492 | ||||||
FedEx Corp. | 3,731 | 694,712 | ||||||
JB Hunt Transport Services, Inc. | 2,335 | 226,658 | ||||||
Landstar System, Inc. | 22,000 | 1,876,600 | ||||||
Owens Corning | 1,148 | 59,191 | ||||||
Roper Technologies, Inc. (b) | 8,580 | 1,570,826 | ||||||
Ryder System, Inc. (b) | 17,933 | 1,334,933 | ||||||
Spirit AeroSystems Holdings, Inc., Class A (a)(b) | 26,057 | 1,520,426 | ||||||
Stanley Black & Decker, Inc. | 26,500 | 3,039,285 | ||||||
United Parcel Service, Inc., Class B | 22,251 | 2,550,855 | ||||||
Waste Management, Inc. | 13,039 | 924,595 | ||||||
W.W. Grainger, Inc. (b) | 733 | 170,239 | ||||||
19,735,871 | ||||||||
Information Technology: 21.2% | ||||||||
Accenture PLC, Class A (b) | 884 | 103,543 | ||||||
Alphabet, Inc., Class A (a) | 7,051 | 5,587,565 | ||||||
Alphabet, Inc., Class C (a) | 1,456 | 1,123,772 | ||||||
Apple, Inc. | 49,086 | 5,685,141 | ||||||
CA, Inc. | 5,519 |
| 175,339 | |||||
Cisco Systems, Inc. (b) | 66,029 | 1,995,396 | ||||||
Cognizant Technology Solutions, Class A (a) | 31,811 | 1,782,370 | ||||||
F5 Networks, Inc. (a) | 180 | 26,050 | ||||||
Facebook, Inc., Class A (a) | 15,000 | 1,725,750 | ||||||
HP, Inc. | 130,758 | 1,940,449 | ||||||
IBM (b) | 15,980 | 2,652,520 | ||||||
Intel Corp. (b) | 52,130 | 1,890,755 | ||||||
Intuit, Inc. | 2,033 | 233,002 | ||||||
MasterCard, Inc., Class A (b) | 28,000 | 2,891,000 | ||||||
Microsoft Corp. | 52,646 | 3,271,422 | ||||||
NVIDIA Corp. | 11,789 | 1,258,358 | ||||||
Oracle Corp. (b) | 23,974 | 921,800 | ||||||
QUALCOMM, Inc. | 17,000 | 1,108,400 | ||||||
Red Hat, Inc. (a)(b) | 9,990 | 696,303 | ||||||
salesforce.com, Inc. (a)(b) | 10,208 | 698,840 | ||||||
Synopsys, Inc. (a) | 14,737 | 867,420 | ||||||
Texas Instruments, Inc. | 45,595 | 3,327,068 | ||||||
Visa, Inc., Class A (b) | 16,335 | 1,274,457 | ||||||
41,236,720 | ||||||||
Materials: 2.3% | ||||||||
Air Products & Chemicals, Inc. | 4,886 | 702,705 | ||||||
Bemis Co., Inc. (b) | 10,563 | 505,123 | ||||||
Eastman Chemical Co. | 17,159 | 1,290,528 | ||||||
Praxair, Inc. (b) | 10,232 | 1,199,088 | ||||||
Sonoco Products Co. (b) | 12,362 | 651,477 | ||||||
Valspar Corp., The | 1,450 | 150,235 | ||||||
4,499,156 | ||||||||
Real Estate: 3.8% | ||||||||
CBRE Group, Inc., Class A (a)(b) | 45,500 | 1,432,795 | ||||||
Chimera Investment Corp., REIT (b) | 164,637 | 2,802,122 | ||||||
Hospitality Properties Trust, REIT | 1,120 | 35,549 | ||||||
Host Hotels & Resorts, Inc., REIT (b) | 18,641 | 351,196 | ||||||
MFA Financial, Inc., REIT | 253,770 | 1,936,265 | ||||||
Realogy Holdings Corp. (b) | 4,201 | 108,092 | ||||||
Senior Housing Properties Trust, REIT | 12,713 | 240,657 | ||||||
Starwood Property Trust, Inc., REIT (b) | 17,120 | 375,784 | ||||||
7,282,460 | ||||||||
SEE NOTES TO FINANCIAL STATEMENTS
72
December 31, 2016
|
Schedule of Investments, continued |
Pax ESG Beta Quality Fund, continued
Percent of Net Assets | Shares/Principal | Value | ||||||
COMMON STOCKS, continued | ||||||||
Telecommunication Services: 4.9% | ||||||||
AT&T, Inc. (b) | 86,571 | $ | 3,681,865 | |||||
CenturyLink, Inc. | 10,676 | 253,875 | ||||||
Verizon Communications, Inc. | 104,281 | 5,566,520 | ||||||
9,502,260 | ||||||||
Utilities: 4.4% | ||||||||
American Water Works Co., Inc. (b) | 37,984 | 2,748,522 | ||||||
Consolidated Edison, Inc. (b) | 19,743 | 1,454,664 | ||||||
Dominion Resources, Inc. (b) | 8,566 | 656,070 | ||||||
Entergy Corp. (b) | 18,904 | 1,388,877 | ||||||
Eversource Energy (b) | 7,832 | 432,561 | ||||||
Hawaiian Electric Industries, Inc. (b) | 9,721 | 321,473 | ||||||
NextEra Energy, Inc. (b) | 1,828 | 218,373 | ||||||
PG&E Corp. | 8,457 | 513,932 | ||||||
Pinnacle West Capital Corp. (b) | 7,636 | 595,837 | ||||||
WEC Energy Group, Inc. | 4,681 | 274,541 | ||||||
8,604,850 | ||||||||
TOTAL COMMON STOCKS | ||||||||
(Cost $136,028,905) | 192,365,468 | |||||||
TIME DEPOSIT: 0.9% | ||||||||
State Street Euro Dollar Time Deposit, 0.010%, 01/03/17 |
| 1,738,000 |
| 1,738,000 | ||||
(Cost $1,738,000) | ||||||||
SECURITIES PURCHASED WITH CASH COLLATERAL FROM SECURITIES LENDING: 0.3% | ||||||||
State Street Navigator Securities Lending Government Money Market Portfolio | 593,023 | 593,023 | ||||||
(Cost $593,023) | ||||||||
TOTAL INVESTMENTS: 100.1% | ||||||||
(Cost $138,359,928) | 194,696,491 | |||||||
PAYABLE UPON RETURN OF SECURITIES LOANED— (NET): -0.3% | (593,023 | ) | ||||||
OTHER ASSETS AND LIABILITIES— (NET): 0.2% | 410,654 | |||||||
NET ASSETS: 100.0% | $ | 194,514,122 | ||||||
(a) | Non-income producing security. |
(b) | Security or partial position of this security was on loan as of December 31, 2016. The total market value of securities on loan as of December 31, 2016 was $50,372,954. |
REIT | Real Estate Investment Trust |
SEE NOTES TO FINANCIAL STATEMENTS
73
December 31, 2016
|
Schedule of Investments, continued |
Pax ESG Beta Dividend Fund
Percent of Net Assets | Shares/Principal | Value | ||||||
COMMON STOCKS: 99.9% | ||||||||
Consumer Discretionary: 13.1% | ||||||||
Amazon.com, Inc. (a) | 3,408 | $ | 2,555,557 | |||||
Brinker International, Inc. | 6,490 | 321,450 | ||||||
Coach, Inc. | 12,833 | 449,412 | ||||||
Darden Restaurants, Inc. | 12,626 | 918,163 | ||||||
Delphi Automotive PLC | 3,351 | 225,690 | ||||||
Domino's Pizza, Inc. | 1,335 | 212,585 | ||||||
GameStop Corp., Class A | 7,269 | 183,615 | ||||||
Gap Inc., The | 22,922 | 514,370 | ||||||
Garmin, Ltd. | 12,106 | 587,020 | ||||||
Harley-Davidson, Inc. | 2,781 | 162,244 | ||||||
Home Depot, Inc., The | 15,672 | 2,101,302 | ||||||
John Wiley & Sons, Inc., Class A | 2,461 | 134,125 | ||||||
Kohl's Corp. | 9,123 | 450,494 | ||||||
Lowe's Cos., Inc. | 7,182 | 510,784 | ||||||
Macy's, Inc. | 3,675 | 131,602 | ||||||
Marriott International, Inc., Class A | 2,761 | 228,279 | ||||||
Mattel, Inc. | 5,349 | 147,365 | ||||||
McDonald's Corp. | 12,672 | 1,542,436 | ||||||
Nordstrom, Inc. | 8,203 | 393,170 | ||||||
Omnicom Group, Inc. | 4,552 | 387,421 | ||||||
Regal Entertainment Group | 23,928 | 492,917 | ||||||
Royal Caribbean Cruises, Ltd. | 4,657 | 382,060 | ||||||
Staples, Inc. | 84,116 | 761,250 | ||||||
Starbucks Corp. | 12,600 | 699,551 | ||||||
Target Corp. | 10,172 | 734,724 | ||||||
Time Warner, Inc. | 4,008 | 386,892 | ||||||
Tupperware Brands Corp. | 13,464 | 708,476 | ||||||
VF Corp. | 6,400 | 341,440 | ||||||
Walt Disney Co., The | 4,408 | 459,402 | ||||||
Williams-Sonoma, Inc. | 14,980 | 724,882 | ||||||
17,848,678 | ||||||||
Consumer Staples: 9.3% | ||||||||
Campbell Soup Co. | 6,922 | 418,573 | ||||||
Clorox Co., The | 2,641 | 316,973 | ||||||
Coca-Cola Co., The | 46,352 | 1,921,754 | ||||||
CVS Health Corp. | 3,625 | 286,049 | ||||||
General Mills, Inc. | 16,737 | 1,033,844 | ||||||
Hershey Co/The | 2,537 | 262,402 | ||||||
Kellogg Co. | 11,306 | 833,365 | ||||||
Kimberly-Clark Corp. | 7,617 | 869,252 | ||||||
Kroger Co., The | 4,180 | 144,252 | ||||||
PepsiCo, Inc. | 24,223 | 2,534,452 | ||||||
Procter & Gamble Co., The | 32,260 | 2,712,421 | ||||||
Sysco Corp. | 17,327 | 959,396 | ||||||
Walgreens Boots Alliance, Inc. | 3,192 |
| 264,170 | |||||
Whole Foods Market, Inc. | 5,598 | 172,194 | ||||||
12,729,097 | ||||||||
Energy: 5.5% | ||||||||
Baker Hughes, Inc. | 9,540 | 619,814 | ||||||
EOG Resources Inc | 6,023 | 608,925 | ||||||
Marathon Petroleum Corp. | 4,247 | 213,836 | ||||||
Occidental Petroleum Corp. | 10,352 | 737,373 | ||||||
Oceaneering International, Inc. | 26,692 | 752,981 | ||||||
ONEOK, Inc. | 14,083 | 808,505 | ||||||
Schlumberger, Ltd. | 19,360 | 1,625,272 | ||||||
Spectra Energy Corp. | 22,613 | 929,168 | ||||||
Targa Resources Corp. | 15,979 | 895,943 | ||||||
Valero Energy Corp. | 5,407 | 369,406 | ||||||
7,561,223 | ||||||||
Financials: 12.3% | ||||||||
American Express Co. | 1,874 | 138,826 | ||||||
Ameriprise Financial, Inc. | 6,762 | 750,176 | ||||||
Bank of America Corp. | 31,250 | 690,625 | ||||||
Bank of Hawaii Corp. | 1,619 | 143,589 | ||||||
BlackRock, Inc. | 877 | 333,734 | ||||||
Cullen/Frost Bankers, Inc. | 2,233 | 197,018 | ||||||
Discover Financial Services | 3,362 | 242,367 | ||||||
Eaton Vance Corp. | 11,166 | 467,632 | ||||||
Factset Research Systems, Inc. | 2,274 | 371,640 | ||||||
Invesco, Ltd. | 32,687 | 991,724 | ||||||
JPMorgan Chase & Co. | 15,274 | 1,317,993 | ||||||
KeyCorp | 23,560 | 430,441 | ||||||
LPL Financial Holdings, Inc. | 16,597 | 584,380 | ||||||
MetLife, Inc. | 18,776 | 1,011,839 | ||||||
New York Community Bancorp, Inc. | 9,487 | 150,938 | ||||||
Old Republic International Corp. | 46,626 | 885,894 | ||||||
People's United Financial, Inc. | 123,267 | 2,386,449 | ||||||
Principal Financial Group, Inc. | 12,419 | 718,563 | ||||||
Prudential Financial, Inc. | 11,492 | 1,195,858 | ||||||
Regions Financial Corp. | 23,014 | 330,481 | ||||||
State Street Corp. | 4,683 | 363,963 | ||||||
T Rowe Price Group, Inc. | 15,341 | 1,154,564 | ||||||
TD Ameritrade Holding Corp. | 8,177 | 356,517 | ||||||
U.S. Bancorp | 31,277 | 1,606,699 | ||||||
16,821,910 | ||||||||
SEE NOTES TO FINANCIAL STATEMENTS
74
December 31, 2016
|
Schedule of Investments, continued |
Pax ESG Beta Dividend Fund, continued
Percent of Net Assets | Shares/Principal | Value | ||||||
COMMON STOCKS, continued | ||||||||
Health Care: 13.0% | ||||||||
Abbott Laboratories | 27,383 | $ | 1,051,781 | |||||
AbbVie, Inc. | 28,511 | 1,785,359 | ||||||
Alkermes PLC (a) | 2,376 | 132,058 | ||||||
Amgen, Inc. | 8,843 | 1,292,935 | ||||||
Anthem, Inc. | 948 | 136,294 | ||||||
Baxter International, Inc. | 5,263 | 233,361 | ||||||
Becton Dickinson & Co. | 2,436 | 403,280 | ||||||
Bristol-Myers Squibb Co. | 21,827 | 1,275,570 | ||||||
Cardinal Health, Inc. | 10,513 | 756,621 | ||||||
Celgene Corp. (a) | 1,959 | 226,754 | ||||||
Eli Lilly & Co. | 12,308 | 905,253 | ||||||
Humana, Inc. | 3,400 | 693,702 | ||||||
IDEXX Laboratories, Inc. (a) | 1,147 | 134,509 | ||||||
Illumina, Inc. (a) | 2,085 | 266,963 | ||||||
Johnson & Johnson | 28,438 | 3,276,342 | ||||||
Merck & Co., Inc. | 46,166 | 2,717,792 | ||||||
Quest Diagnostics, Inc. | 4,908 | 451,045 | ||||||
ResMed, Inc. | 3,556 | 220,650 | ||||||
UnitedHealth Group, Inc. | 11,376 | 1,820,615 | ||||||
17,780,884 | ||||||||
Industrials: 13.5% | ||||||||
3M Co. | 20,631 | 3,684,078 | ||||||
Covanta Holding Corp. | 47,237 | 736,897 | ||||||
Cummins, Inc. | 8,329 | 1,138,324 | ||||||
Dover Corp. | 6,179 | 462,992 | ||||||
Emerson Electric Co. | 31,796 | 1,772,627 | ||||||
Fastenal Co | 13,714 | 644,284 | ||||||
Hubbell, Inc. | 1,202 | 140,273 | ||||||
Illinois Tool Works, Inc. | 13,385 | 1,639,127 | ||||||
Ingersoll-Rand PLC | 9,262 | 695,020 | ||||||
Lincoln Electric Holdings, Inc. | 1,913 | 146,670 | ||||||
ManpowerGroup, Inc. | 1,581 | 140,503 | ||||||
MSC Industrial Direct Co. | 1,551 | 143,297 | ||||||
Nielsen Holdings PLC | 9,299 | 390,093 | ||||||
Robert Half International, Inc. | 8,803 | 429,410 | ||||||
Rockwell Automation, Inc. | 10,480 | 1,408,512 | ||||||
RR Donnelley & Sons, Co. | 23,989 | 391,500 | ||||||
Ryder System, Inc. | 2,970 | 221,087 | ||||||
Stanley Black & Decker, Inc. | 3,462 | 397,057 | ||||||
Timken Co. | 3,457 | 137,243 | ||||||
Union Pacific Corp. | 5,221 | 541,313 | ||||||
United Parcel Service, Inc., Class B | 17,910 | 2,053,202 | ||||||
Waste Management, Inc. | 7,965 | 564,798 | ||||||
Watsco, Inc. | 1,414 | 209,442 | ||||||
W.W. Grainger, Inc. | 1,711 |
| 397,380 | |||||
18,485,129 | ||||||||
Information Technology: 18.5% | ||||||||
Accenture PLC, Class A | 15,254 | 1,786,701 | ||||||
Activision Blizzard, Inc. | 5,670 | 204,744 | ||||||
Adobe Systems, Inc. (a) | 3,019 | 310,806 | ||||||
Akamai Technologies, Inc. (a) | 2,677 | 178,502 | ||||||
Alphabet, Inc., Class A (a) | 2,394 | 1,897,125 | ||||||
Analog Devices, Inc. | 8,021 | 582,485 | ||||||
Automatic Data Processing, Inc. | 4,917 | 505,369 | ||||||
Booz Allen Hamilton Holding Corp. | 6,573 | 237,088 | ||||||
CA, Inc. | 35,679 | 1,133,522 | ||||||
Cisco Systems, Inc. | 93,371 | 2,821,672 | ||||||
Corning, Inc. | 7,028 | 170,570 | ||||||
Facebook, Inc., Class A (a) | 5,860 | 674,193 | ||||||
HP, Inc. | 30,337 | 450,201 | ||||||
IBM | 14,467 | 2,401,377 | ||||||
Intel Corp. | 51,095 | 1,853,216 | ||||||
Intuit, Inc. | 3,864 | 442,853 | ||||||
Jack Henry & Associates, Inc. | 2,038 | 180,934 | ||||||
Leidos Holdings, Inc. | 4,510 | 230,641 | ||||||
Linear Technology Corp. | 5,669 | 353,462 | ||||||
MasterCard, Inc., Class A | 9,060 | 935,445 | ||||||
Maxim Integrated Products, Inc. | 15,534 | 599,146 | ||||||
National Instruments Corp. | 12,813 | 394,897 | ||||||
NetApp, Inc. | 7,586 | 267,558 | ||||||
NVIDIA Corp. | 8,828 | 942,301 | ||||||
Oracle Corp. | 12,974 | 498,850 | ||||||
QUALCOMM, Inc. | 17,969 | 1,171,579 | ||||||
Sabre Corp. | 9,059 | 226,022 | ||||||
salesforce.com, Inc. (a) | 5,385 | 368,657 | ||||||
ServiceNow, Inc. (a) | 2,421 | 179,977 | ||||||
Texas Instruments, Inc. | 27,590 | 2,013,242 | ||||||
Visa, Inc., Class A | 7,850 | 612,457 | ||||||
Western Digital Corp. | 4,319 | 293,476 | ||||||
Xilinx, Inc. | 4,735 | 285,852 | ||||||
25,204,920 | ||||||||
Materials: 2.7% | ||||||||
Air Products & Chemicals, Inc. | 3,819 | 549,249 | ||||||
Avery Dennison Corp. | 3,769 | 264,659 | ||||||
Celanese Corp., Series A | 1,702 | 134,015 | ||||||
Eastman Chemical Co. | 1,797 | 135,152 | ||||||
SEE NOTES TO FINANCIAL STATEMENTS
75
December 31, 2016
|
Schedule of Investments, continued |
Pax ESG Beta Dividend Fund, continued
Percent of Net Assets | Shares/Principal | Value | ||||||
COMMON STOCKS, continued | ||||||||
Materials, continued | ||||||||
Ecolab, Inc. | 1,278 | $ | 149,807 | |||||
EI du Pont de Nemours & Co. | 2,082 | 152,819 | ||||||
International Flavors & Fragrances, Inc. | 2,625 | 309,304 | ||||||
Mosaic Co., The | 15,224 | 446,520 | ||||||
Praxair, Inc. | 8,356 | 979,240 | ||||||
Sherwin-Williams Co., The | 502 | 134,907 | ||||||
Sonoco Products Co. | 7,259 | 382,549 | ||||||
3,638,221 | ||||||||
Real Estate: 3.7% | ||||||||
Chimera Investment Corp., REIT | 36,533 | 621,792 | ||||||
Columbia Property Trust, Inc., REIT | 28,146 | 607,954 | ||||||
Communications Sales & Leasing, Inc., REIT | 14,314 | 363,719 | ||||||
Host Hotels & Resorts, Inc., REIT | 22,729 | 428,214 | ||||||
Iron Mountain, Inc., REIT | 18,494 | 600,685 | ||||||
MFA Financial, Inc., REIT | 110,909 | 846,236 | ||||||
Outfront Media, Inc., REIT | 5,393 | 134,124 | ||||||
Public Storage, REIT | 645 | 144,158 | ||||||
Senior Housing Properties Trust, REIT | 38,534 | 729,449 | ||||||
Starwood Property Trust, Inc., REIT | 24,043 | 527,744 | ||||||
5,004,075 | ||||||||
Telecommunication Services: 5.5% | ||||||||
AT&T, Inc. | 72,753 | 3,094,185 | ||||||
CenturyLink, Inc. | 72,217 | 1,717,320 | ||||||
Frontier Communications Corp. | 85,997 | 290,670 | ||||||
Verizon Communications, Inc. | 44,939 | 2,398,844 | ||||||
7,501,019 | ||||||||
Utilities: 2.8% | ||||||||
CenterPoint Energy, Inc. | 47,107 |
| 1,160,716 | |||||
Consolidated Edison, Inc. | 16,139 | 1,189,122 | ||||||
Dominion Resources, Inc. | 10,642 | 815,071 | ||||||
PG&E Corp. | 11,467 | 696,850 | ||||||
3,861,759 | ||||||||
TOTAL COMMON STOCKS | ||||||||
(Cost $129,906,361) | 136,436,915 | |||||||
TOTAL INVESTMENTS: 99.9% | ||||||||
(Cost $129,906,361) | 136,436,915 | |||||||
OTHER ASSETS AND LIABILITIES— (NET): 0.1% | 164,021 | |||||||
NET ASSETS: 100.0% | $ | 136,600,936 | ||||||
(a) | Non-income producing security. |
REIT | Real Estate Investment Trust |
SEE NOTES TO FINANCIAL STATEMENTS
76
December 31, 2016
|
Schedule of Investments, continued |
Pax MSCI International ESG Index Fund
Percent of Net Assets | Shares/Principal | Value | ||||||
COMMON STOCKS: 99.2% | ||||||||
Australia: 9.4% | ||||||||
AGL Energy, Ltd. | 91,884 | $ | 1,461,916 | |||||
Amcor, Ltd. | 181,115 | 1,949,308 | ||||||
AMP, Ltd. | 197,082 | 714,785 | ||||||
APA Group | 90,306 | 557,487 | ||||||
Australia & New Zealand Banking Group, Ltd. | 215,143 | 4,709,733 | ||||||
Bendigo & Adelaide Bank, Ltd. | 37,379 | 341,934 | ||||||
Brambles, Ltd. | 127,521 | 1,138,007 | ||||||
Caltex Australia, Ltd. | 35,117 | 769,963 | ||||||
Commonwealth Bank of Australia | 175,259 | 10,397,075 | ||||||
Dexus Property Group, REIT | 31,189 | 216,364 | ||||||
Goodman Group, REIT | 183,000 | 939,819 | ||||||
GPT Group, The, REIT | 351,695 | 1,275,084 | ||||||
Insurance Australia Group, Ltd. | 211,555 | 912,294 | ||||||
LendLease Group | 41,629 | 437,460 | ||||||
Macquarie Group, Ltd. | 26,257 | 1,644,791 | ||||||
Mirvac Group, REIT | 418,144 | 642,141 | ||||||
National Australia Bank, Ltd. | 209,893 | 4,636,217 | ||||||
Newcrest Mining, Ltd. | 56,881 | 815,619 | ||||||
Stockland, REIT | 313,949 | 1,037,187 | ||||||
Sydney Airport | 224,404 | 968,627 | ||||||
Transurban Group | 174,731 | 1,300,400 | ||||||
Wesfarmers, Ltd. | 91,137 | 2,766,183 | ||||||
Westpac Banking Corp. | 252,854 | 5,935,469 | ||||||
Woodside Petroleum, Ltd. | 80,928 | 1,812,647 | ||||||
47,380,510 | ||||||||
Austria: 0.1% | ||||||||
OMV AG | 19,436 | 685,191 | ||||||
Belgium: 0.4% | ||||||||
Colruyt SA | 8,694 | 429,701 | ||||||
KBC Group NV | 16,297 | 1,006,955 | ||||||
Umicore SA | 5,735 | 326,272 | ||||||
1,762,928 | ||||||||
Denmark: 2.0% | ||||||||
Novo Nordisk A/S, Class B | 183,343 | 6,576,914 | ||||||
Novozymes A/S, Class B | 15,396 | 529,806 | ||||||
Pandora A/S | 10,873 | 1,419,361 | ||||||
Vestas Wind Systems A/S | 25,814 | 1,671,831 | ||||||
10,197,912 | ||||||||
Finland: 0.1% | ||||||||
Wartsila OYJ Abp | 11,548 | 517,770 | ||||||
France: 10.8% | ||||||||
Accor SA | 18,680 |
| 695,880 | |||||
Air Liquide SA | 29,173 | 3,244,000 | ||||||
Atos SE | 15,400 | 1,623,122 | ||||||
AXA SA | 126,213 | 3,181,677 | ||||||
Bouygues SA | 17,618 | 630,712 | ||||||
Bureau Veritas SA | 100,963 | 1,954,068 | ||||||
Capgemini SA | 20,795 | 1,751,960 | ||||||
Carrefour SA | 37,840 | 911,034 | ||||||
Christian Dior SE | 4,591 | 961,869 | ||||||
Cie de Saint-Gobain | 51,790 | 2,409,134 | ||||||
Danone SA | 47,386 | 2,998,518 | ||||||
Essilor International SA | 29,480 | 3,326,176 | ||||||
Gecina SA, REIT | 6,896 | 952,461 | ||||||
Kering | 6,462 | 1,449,450 | ||||||
Legrand SA | 24,581 | 1,394,607 | ||||||
L'Oreal SA | 27,000 | 4,921,163 | ||||||
Natixis SA | 58,580 | 329,885 | ||||||
Renault SA | 19,021 | 1,689,384 | ||||||
Rexel SA | 56,455 | 927,549 | ||||||
Schneider Electric SE | 45,776 | 3,179,988 | ||||||
Societe BIC SA | 3,046 | 413,880 | ||||||
Suez | 28,167 | 415,026 | ||||||
Technip SA | 7,146 | 509,022 | ||||||
TOTAL SA | 131,544 | 6,747,168 | ||||||
Unibail-Rodamco SE, REIT | 9,851 | 2,347,539 | ||||||
Valeo SA | 55,887 | 3,208,350 | ||||||
Vivendi SA | 94,085 | 1,784,502 | ||||||
53,958,124 | ||||||||
Germany: 7.3% | ||||||||
adidas AG | 15,629 | 2,464,977 | ||||||
Allianz SE | 29,742 | 4,908,557 | ||||||
BASF SE | 74,832 | 6,935,161 | ||||||
Bayerische Motoren Werke AG | 26,638 | 2,480,957 | ||||||
Beiersdorf AG | 7,057 | 597,783 | ||||||
Deutsche Post AG | 69,456 | 2,277,812 | ||||||
Fraport AG Frankfurt Airport Svc Worldwide | 5,735 | 338,411 | ||||||
GEA Group AG | 22,334 | 896,273 | ||||||
HeidelbergCement AG | 17,128 | 1,594,274 | ||||||
Henkel AG & Co. KGaA | 9,128 | 949,982 | ||||||
Merck KGaA | 21,306 | 2,218,399 | ||||||
METRO AG | 25,626 | 851,735 | ||||||
Muenchener Rueckversicherungs AG | 11,634 | 2,197,406 | ||||||
ProSiebenSat.1 Media SE | 16,772 | 645,587 | ||||||
SEE NOTES TO FINANCIAL STATEMENTS
77
December 31, 2016
|
Schedule of Investments, continued |
Pax MSCI International ESG Index Fund, continued
Percent of Net Assets | Shares/Principal | Value | ||||||
COMMON STOCKS, continued | ||||||||
Germany, continued | ||||||||
SAP SE | 75,330 | $ | 6,516,425 | |||||
TUI AG | 48,701 | 697,259 | ||||||
36,570,998 | ||||||||
Hong Kong: 1.9% | ||||||||
BOC Hong Kong Holdings Ltd | 287,557 | 1,024,150 | ||||||
CLP Holdings, Ltd. | 167,500 | 1,536,123 | ||||||
Hang Seng Bank, Ltd. | 56,400 | 1,045,914 | ||||||
Hong Kong & China Gas Co., Ltd. | 395,440 | 698,423 | ||||||
Hong Kong Exchanges and Clearing, Ltd. | 119,106 | 2,801,179 | ||||||
Li & Fung, Ltd. | 812,000 | 355,866 | ||||||
MTR Corp. Ltd. | 144,045 | 698,363 | ||||||
Swire Pacific, Ltd., Class A | 99,000 | 942,061 | ||||||
Swire Properties Ltd | 183,400 | 504,880 | ||||||
9,606,959 | ||||||||
Ireland: 0.6% | ||||||||
CRH PLC | 59,505 | 2,052,478 | ||||||
Kerry Group PLC, Class A | 12,712 | 908,590 | ||||||
2,961,068 | ||||||||
Israel: 0.2% | ||||||||
Bank Hapoalim BM | 161,248 | 957,090 | ||||||
Italy: 1.2% | ||||||||
Assicurazioni Generali SpA | 72,871 | 1,080,120 | ||||||
CNH Industrial NV | 92,539 | 802,960 | ||||||
Intesa Sanpaolo SpA | 812,593 | 2,058,413 | ||||||
Snam SpA | 386,996 | 1,591,657 | ||||||
Terna Rete Elettrica Nazionale | 148,293 | 678,195 | ||||||
6,211,345 | ||||||||
Japan: 24.2% | ||||||||
Aeon Co., Ltd. | 59,600 | 842,362 | ||||||
AEON Financial Service Co., Ltd. | 12,200 | 216,088 | ||||||
Aisin Seiki Co., Ltd. | 17,100 | 739,907 | ||||||
Ajinomoto Co., Inc. | 47,000 | 945,760 | ||||||
Asahi Glass Co., Ltd. | 123,000 | 834,512 | ||||||
Asahi Kasei Corp. | 110,000 | 957,139 | ||||||
Asics Corp. | 15,800 | 314,861 | ||||||
Astellas Pharma, Inc. | 145,700 | 2,021,347 | ||||||
Benesse Holdings, Inc. | 10,200 | 280,245 | ||||||
Casio Computer Co., Ltd. | 16,400 | 231,127 | ||||||
Central Japan Railway Co. | 11,300 | 1,855,342 | ||||||
Chugai Pharmaceutical Co., Ltd. | 22,600 | 648,259 | ||||||
Dai Nippon Printing Co., Ltd. | 88,000 | 868,265 | ||||||
Daikin Industries, Ltd. | 19,000 |
| 1,740,569 | |||||
Daiwa House Industry Co., Ltd. | 86,500 | 2,358,886 | ||||||
Denso Corp. | 25,500 | 1,103,040 | ||||||
Dentsu, Inc. | 17,100 | 804,098 | ||||||
East Japan Railway Co. | 24,900 | 2,146,846 | ||||||
Eisai Co., Ltd. | 19,200 | 1,100,301 | ||||||
Fast Retailing Co., Ltd. | 3,900 | 1,392,405 | ||||||
Fuji Heavy Industries, Ltd. | 46,100 | 1,878,317 | ||||||
Fujitsu, Ltd. | 158,000 | 874,932 | ||||||
Hitachi Chemical Co., Ltd. | 16,400 | 409,119 | ||||||
Hitachi Construction Machinery Co., Ltd. | 17,700 | 382,654 | ||||||
Honda Motor Co., Ltd. | 120,600 | 3,520,952 | ||||||
Inpex Corp. | 46,100 | 460,807 | ||||||
Kajima Corp. | 113,000 | 780,504 | ||||||
Kao Corp. | 39,100 | 1,850,793 | ||||||
KDDI Corp. | 122,800 | 3,101,065 | ||||||
Keio Corp. | 41,000 | 336,782 | ||||||
Keyence Corp. | 3,400 | 2,326,449 | ||||||
Kikkoman Corp. | 18,000 | 574,312 | ||||||
Kobe Steel, Ltd. (a) | 26,400 | 251,016 | ||||||
Komatsu, Ltd. | 81,500 | 1,845,987 | ||||||
Konica Minolta, Inc. | 54,800 | 543,106 | ||||||
Kubota Corp. | 88,000 | 1,254,071 | ||||||
Kyocera Corp. | 33,900 | 1,680,779 | ||||||
Lawson, Inc. | 3,900 | 273,748 | ||||||
Marui Group Co., Ltd. | 15,800 | 230,200 | ||||||
Mazda Motor Corp. | 40,300 | 656,244 | ||||||
Mitsubishi Corp. | 127,900 | 2,716,422 | ||||||
Mitsubishi Electric Corp. | 187,000 | 2,601,013 | ||||||
Mitsubishi Materials Corp. | 11,400 | 348,694 | ||||||
Mitsubishi UFJ Lease & Finance Co., Ltd. | 54,900 | 283,160 | ||||||
Mitsui Fudosan Co., Ltd. | 127,000 | 2,940,113 | ||||||
Mitsui OSK Lines, Ltd. | 127,000 | 350,529 | ||||||
Mizuho Financial Group, Inc. | 2,150,200 | 3,858,608 | ||||||
Murata Manufacturing Co., Ltd. | 19,300 | 2,577,259 | ||||||
NEC Corp. | 223,000 | 589,818 | ||||||
NGK Insulators, Ltd. | 32,000 | 619,419 | ||||||
NGK Spark Plug Co., Ltd. | 16,100 | 356,852 | ||||||
Nikon Corp. | 31,700 | 492,315 | ||||||
Nippon Telegraph & Telephone Corp. | 53,500 | 2,252,090 | ||||||
Nissan Motor Co., Ltd. | 200,600 | 2,012,247 | ||||||
SEE NOTES TO FINANCIAL STATEMENTS
78
December 31, 2016
|
Schedule of Investments, continued |
Pax MSCI International ESG Index Fund, continued
Percent of Net Assets | Shares/Principal | Value | ||||||
COMMON STOCKS, continued | ||||||||
Japan, continued | ||||||||
Nitto Denko Corp. | 13,400 | $ | 1,025,918 | |||||
NSK, Ltd. | 40,900 | 472,373 | ||||||
NTT DOCOMO, Inc. | 100,700 | 2,290,448 | ||||||
Obayashi Corp. | 75,000 | 716,051 | ||||||
Omron Corp. | 18,700 | 714,620 | ||||||
Oriental Land Co., Ltd./Japan | 17,600 | 993,373 | ||||||
Osaka Gas Co., Ltd. | 60,000 | 230,224 | ||||||
Panasonic Corp. | 167,300 | 1,696,782 | ||||||
Resona Holdings, Inc. | 674,800 | 3,458,361 | ||||||
Santen Pharmaceutical Co., Ltd. | 210,900 | 2,573,258 | ||||||
Secom Co., Ltd. | 15,800 | 1,154,413 | ||||||
Sekisui House, Ltd. | 52,200 | 867,266 | ||||||
Seven & i Holdings Co., Ltd. | 51,900 | 1,973,714 | ||||||
Shimadzu Corp. | 32,000 | 508,383 | ||||||
Shimizu Corp. | 64,000 | 584,190 | ||||||
Shin-Etsu Chemical Co., Ltd. | 28,300 | 2,190,107 | ||||||
Sompo Holdings, Inc. | 29,500 | 996,253 | ||||||
Sony Corp. | 104,100 | 2,908,754 | ||||||
Stanley Electric Co., Ltd. | 11,800 | 321,463 | ||||||
Sumitomo Chemical Co., Ltd. | 86,000 | 407,668 | ||||||
Sumitomo Corp. | 97,100 | 1,139,897 | ||||||
Sumitomo Electric Industries, Ltd. | 58,200 | 838,040 | ||||||
Sumitomo Metal Mining Co., Ltd. | 60,000 | 765,461 | ||||||
Sumitomo Mitsui Financial Group | 111,600 | 4,250,059 | ||||||
Sumitomo Mitsui Trust Holdings Inc | 21,100 | 754,931 | ||||||
Suzuken Co., Ltd./Aichi Japan | 14,400 | 470,340 | ||||||
Sysmex Corp. | 14,700 | 849,358 | ||||||
T&D Holdings, Inc. | 241,400 | 3,185,852 | ||||||
Takeda Pharmaceutical Co., Ltd. | 56,500 | 2,343,960 | ||||||
TDK Corp. | 13,100 | 898,244 | ||||||
Teijin, Ltd. | 16,000 | 323,291 | ||||||
Toho Gas Co., Ltd. | 57,000 | 462,944 | ||||||
Tokyo Electron, Ltd. | 17,200 | 1,617,649 | ||||||
Tokyo Gas Co., Ltd. | 181,000 | 817,059 | ||||||
Tokyu Corp. | 220,000 | 1,614,396 | ||||||
Toray Industries, Inc. | 136,000 | 1,098,271 | ||||||
TOTO, Ltd. | 19,700 | 778,121 | ||||||
Toyota Industries Corp. | 14,800 | 703,669 | ||||||
Yakult Honsha Co., Ltd. | 5,500 |
| 254,465 | |||||
Yamada Denki Co., Ltd. | 857,800 | 4,618,778 | ||||||
Yamaha Corp. | 18,600 | 567,161 | ||||||
Yamaha Motor Co., Ltd. | 21,600 | 473,667 | ||||||
121,540,967 | ||||||||
Luxembourg: 0.6% | ||||||||
SES SA | 26,718 | 587,871 | ||||||
Tenaris SA | 144,983 | 2,588,023 | ||||||
3,175,894 | ||||||||
Netherlands: 5.7% | ||||||||
Aegon NV | 130,485 | 716,838 | ||||||
Akzo Nobel NV | 20,947 | 1,308,910 | ||||||
ASML Holding NV | 29,205 | 3,273,016 | ||||||
Gemalto NV | 12,967 | 748,862 | ||||||
ING Groep NV | 488,776 | 6,881,356 | ||||||
Koninklijke Ahold Delhaize NV | 114,600 | 2,413,819 | ||||||
Koninklijke DSM NV | 25,058 | 1,501,657 | ||||||
Koninklijke KPN NV | 202,721 | 599,471 | ||||||
Koninklijke Philips NV | 92,782 | 2,836,524 | ||||||
NN Group NV | 24,805 | 839,712 | ||||||
RELX NV | 69,410 | 1,167,468 | ||||||
Unilever NV | 126,826 | 5,209,862 | ||||||
Wolters Kluwer NV | 34,208 | 1,237,274 | ||||||
28,734,769 | ||||||||
New Zealand: 0.1% | ||||||||
Auckland International Airport, Ltd. | 167,786 | 727,772 | ||||||
Norway: 1.0% | ||||||||
DNB ASA | 107,452 | 1,595,156 | ||||||
Norsk Hydro ASA | 140,922 | 672,582 | ||||||
Statoil ASA | 79,169 | 1,444,967 | ||||||
Telenor ASA | 86,544 | 1,291,817 | ||||||
5,004,522 | ||||||||
Portugal: 0.3% | ||||||||
EDP - Energias de Portugal SA | 182,333 | 554,939 | ||||||
Galp Energia SGPS SA | 60,311 | 899,131 | ||||||
1,454,070 | ||||||||
Singapore: 1.6% | ||||||||
Ascendas Real Estate Investment Trust, REIT | 173,000 | 270,476 | ||||||
CapitaLand, Ltd. | 204,200 | 424,350 | ||||||
City Developments, Ltd. | 295,900 | 1,688,635 | ||||||
DBS Group Holdings, Ltd. | 188,749 | 2,251,934 | ||||||
Keppel Corp., Ltd. | 110,700 | 440,579 | ||||||
SEE NOTES TO FINANCIAL STATEMENTS
79
December 31, 2016
|
Schedule of Investments, continued |
Pax MSCI International ESG Index Fund, continued
Percent of Net Assets | Shares/Principal | Value | ||||||
COMMON STOCKS, continued | ||||||||
Singapore, continued | ||||||||
Singapore Press Holdings, Ltd. | 265,300 | $ | 645,170 | |||||
Singapore Telecommunications, Ltd. | 921,400 | 2,311,271 | ||||||
8,032,415 | ||||||||
Spain: 3.2% | ||||||||
Amadeus IT Group SA, Class A | 65,437 | 2,967,838 | ||||||
Banco Bilbao Vizcaya Argentaria SA | 417,405 | 2,812,861 | ||||||
Banco de Sabadell SA | 420,253 | 583,973 | ||||||
CaixaBank SA | 160,829 | 530,056 | ||||||
Distribuidora Internacional d Alimentacion | 52,439 | 257,191 | ||||||
Enagas SA | 17,069 | 432,584 | ||||||
Ferrovial SA | 32,190 | 574,084 | ||||||
Iberdrola SA | 412,331 | 2,699,895 | ||||||
Industria de Diseno Textil SA | 80,265 | 2,734,305 | ||||||
Red Electrica Corp. SA | 38,016 | 716,227 | ||||||
Repsol SA | 106,671 | 1,499,062 | ||||||
15,808,076 | ||||||||
Sweden: 4.9% | ||||||||
Alfa Laval AB | 28,035 | 462,447 | ||||||
Assa Abloy AB, Class B | 105,509 | 1,952,300 | ||||||
Atlas Copco AB, Class A | 63,913 | 1,938,900 | ||||||
Atlas Copco AB, Class B | 35,462 | 964,121 | ||||||
Boliden AB | 30,706 | 797,588 | ||||||
Electrolux AB, Class B | 20,436 | 506,016 | ||||||
Hennes & Mauritz AB, Class B | 67,745 | 1,877,966 | ||||||
Kinnevik AB, Class B | 11,355 | 271,216 | ||||||
Nordea Bank AB | 193,354 | 2,142,483 | ||||||
Sandvik AB | 116,580 | 1,438,138 | ||||||
Skandinaviska Enskilda Banken AB, Class A | 94,236 | 984,784 | ||||||
Skanska AB, Class B | 26,783 | 630,589 | ||||||
SKF AB, Class B | 54,554 | 1,000,311 | ||||||
Svenska Cellulosa AB SCA, Class B | 98,577 | 2,774,599 | ||||||
Svenska Handelsbanken AB, Class A | 118,956 | 1,647,594 | ||||||
Swedbank AB, Class A | 68,961 | 1,661,579 | ||||||
Telia Co AB | 411,970 | 1,654,962 | ||||||
Volvo AB, Class B | 158,636 | 1,846,842 | ||||||
24,552,435 | ||||||||
Switzerland: 9.5% | ||||||||
Actelion, Ltd. (a) | 9,667 |
| 2,089,120 | |||||
Aryzta AG (a) | 5,210 | 229,117 | ||||||
Chocoladefabriken Lindt & Spruengli AG | 837 | 4,331,004 | ||||||
Givaudan SA | 802 | 1,467,798 | ||||||
Kuehne & Nagel International AG | 12,948 | 1,709,119 | ||||||
LafargeHolcim, Ltd. (a) | 40,675 | 2,135,115 | ||||||
Lonza Group AG (a) | 12,860 | 2,222,582 | ||||||
Novartis AG | 172,624 | 12,553,811 | ||||||
Roche Holding AG | 54,167 | 12,347,507 | ||||||
SGS SA | 622 | 1,263,756 | ||||||
Swiss Re AG | 25,239 | 2,387,933 | ||||||
Swisscom AG | 3,632 | 1,623,483 | ||||||
Zurich Insurance Group AG (a) | 11,126 | 3,057,645 | ||||||
47,417,990 | ||||||||
United Kingdom: 14.1% | ||||||||
3i Group PLC | 151,361 | 1,309,331 | ||||||
Aberdeen Asset Management PLC | 77,269 | 244,308 | ||||||
Associated British Foods PLC | 26,974 | 910,158 | ||||||
Aviva PLC | 305,045 | 1,817,039 | ||||||
Barratt Developments PLC | 88,394 | 502,530 | ||||||
British Land Co. PLC, The, REIT | 80,877 | 627,646 | ||||||
BT Group PLC | 621,509 | 2,805,677 | ||||||
Bunzl PLC | 51,551 | 1,338,332 | ||||||
Burberry Group PLC | 42,408 | 781,533 | ||||||
Capita PLC | 65,189 | 426,244 | ||||||
Croda International PLC | 65,821 | 2,588,711 | ||||||
GlaxoSmithKline PLC | 422,667 | 8,118,793 | ||||||
Hammerson PLC, REIT | 79,013 | 556,848 | ||||||
InterContinental Hotels Group PLC | 24,876 | 1,112,308 | ||||||
Intertek Group PLC | 23,531 | 1,008,492 | ||||||
Intu Properties PLC, REIT | 120,134 | 416,110 | ||||||
Investec PLC | 45,815 | 300,482 | ||||||
ITV PLC | 373,183 | 947,513 | ||||||
Johnson Matthey PLC | 16,098 | 629,870 | ||||||
Kingfisher PLC | 161,462 | 695,640 | ||||||
Land Securities Group PLC, REIT | 64,906 | 852,678 | ||||||
Legal & General Group PLC | 425,712 | 1,296,878 | ||||||
SEE NOTES TO FINANCIAL STATEMENTS
80
December 31, 2016
|
Schedule of Investments, continued |
Pax MSCI International ESG Index Fund, continued
Percent of Net Assets | Shares/Principal | Value | ||||||
COMMON STOCKS, continued | ||||||||
United Kingdom, continued | ||||||||
London Stock Exchange Group PLC | 22,936 | $ | 819,757 | |||||
Marks & Spencer Group PLC | 128,030 | 551,513 | ||||||
Mondi PLC | 35,200 | 718,863 | ||||||
National Grid PLC | 308,256 | 3,601,582 | ||||||
Next PLC | 15,861 | 973,003 | ||||||
Old Mutual PLC | 362,357 | 923,999 | ||||||
Pearson PLC | 77,814 | 780,757 | ||||||
Petrofac, Ltd. | 35,459 | 379,468 | ||||||
Prudential PLC | 190,393 | 3,799,761 | ||||||
Reckitt Benckiser Group PLC | 55,614 | 4,710,946 | ||||||
RELX PLC | 79,221 | 1,411,757 | ||||||
RSA Insurance Group PLC | 97,809 | 705,331 | ||||||
Schroders PLC | 9,485 | 348,364 | ||||||
Segro PLC, REIT | 59,681 | 337,556 | ||||||
SSE PLC | 88,835 | 1,696,221 | ||||||
Standard Chartered PLC (a) | 234,489 | 1,912,237 | ||||||
Standard Life PLC | 136,287 | 624,083 | ||||||
Taylor Wimpey PLC | 361,727 | 682,247 | ||||||
Tesco PLC (a) | 660,383 | 1,683,843 | ||||||
Unilever PLC | 105,742 | 4,276,191 | ||||||
United Utilities Group PLC | 79,368 | 879,738 | ||||||
Vodafone Group PLC | 1,986,874 | 4,889,452 | ||||||
Whitbread PLC | 20,901 | 972,276 | ||||||
Wm Morrison Supermarkets PLC | 319,969 | 908,801 | ||||||
Wolseley PLC | 18,534 | 1,131,429 | ||||||
WPP PLC | 77,085 | 1,715,405 | ||||||
70,721,701 | ||||||||
TOTAL COMMON STOCKS | ||||||||
(Cost $516,966,527) | 497,980,506 | |||||||
PREFERRED STOCKS: 0.5% | ||||||||
Germany: 0.4% | ||||||||
Bayerische Motoren Werke AG | 9,007 |
| 687,866 | |||||
Henkel AG & Co. KGaA | 12,130 | 1,443,953 | ||||||
2,131,819 | ||||||||
Italy: 0.1% | ||||||||
Intesa Sanpaolo SpA | 159,732 | 374,123 | ||||||
TOTAL PREFERRED STOCKS | ||||||||
(Cost $2,355,305) | 2,505,942 | |||||||
EXCHANGE-TRADED FUNDS: 0.3% | ||||||||
iShares MSCI EAFE ETF | 24,565 | 1,418,137 | ||||||
(Cost $1,412,873) | ||||||||
TOTAL INVESTMENTS: 100.0% | ||||||||
(Cost $520,734,705) | 501,904,585 | |||||||
OTHER ASSETS AND LIABILITIES— (NET): 0.0% (b) | (206,460 | ) | ||||||
NET ASSETS: 100.0% | $ | 501,698,125 | ||||||
(a) | Non-income producing security. |
(b) | Rounds to less than 0.05% |
REIT | Real Estate Investment Trust |
SEE NOTES TO FINANCIAL STATEMENTS
81
December 31, 2016
|
Schedule of Investments, continued |
Pax MSCI International ESG Index Fund, continued
SUMMARY OF INVESTMENTS BY SECTOR
Percent of Net Assets | Value | Percent | ||||||
Consumer Discretionary | $ | 62,609,123 | 12.4 | % | ||||
Consumer Staples | 51,199,327 | 10.2 | % | |||||
Energy | 19,387,106 | 3.9 | % | |||||
Financials | 109,727,769 | 21.9 | % | |||||
Health Care | 59,460,125 | 11.9 | % | |||||
Industrials | 71,819,226 | 14.3 | % | |||||
Information Technology | 29,212,462 | 5.8 | % | |||||
Materials | 37,044,696 | 7.4 | % | |||||
Real Estate | 19,768,294 | 3.9 | % | |||||
Telecommunication Services | 22,819,737 | 4.5 | % | |||||
Utilities | 17,438,583 | 3.5 | % | |||||
Exchange Traded Funds | 1,418,137 | 0.3 | % | |||||
Other assets and liabilities - (net) | (206,460 | ) | 0.0 | %* | ||||
Total | $ | 501,698,125 | 100.0 | % | ||||
* | Rounds to less than 0.05%. |
SEE NOTES TO FINANCIAL STATEMENTS
82
December 31, 2016
|
Schedule of Investments, continued |
Pax Ellevate Global Women’s Index Fund
Percent of Net Assets | Shares/Principal | Value | ||||||
COMMON STOCKS: 97.7% | ||||||||
Consumer Discretionary: 12.3% | ||||||||
Accor SA | 1,118 | $ | 41,648 | |||||
Aristocrat Leisure, Ltd. | 3,429 | 38,256 | ||||||
Bayerische Motoren Werke AG | 2,166 | 201,733 | ||||||
Best Buy Co., Inc. (b) | 1,931 | 82,396 | ||||||
Burberry Group PLC | 2,818 | 51,933 | ||||||
Carnival PLC | 1,246 | 63,134 | ||||||
Coach, Inc. (b) | 1,831 | 64,122 | ||||||
Darden Restaurants, Inc. (b) | 866 | 62,976 | ||||||
Dixon Carphone PLC | 6,400 | 27,952 | ||||||
Dollar General Corp. (b) | 1,898 | 140,585 | ||||||
Electrolux AB, Class B | 1,524 | 37,736 | ||||||
Eutelsat Communications SA | 1,106 | 21,387 | ||||||
Foot Locker, Inc. | 900 | 63,801 | ||||||
Gap Inc., The | 1,606 | 36,039 | ||||||
Genuine Parts Co. (b) | 1,000 | 95,540 | ||||||
Hasbro, Inc. (b) | 743 | 57,798 | ||||||
Hennes & Mauritz AB, Class B | 26,316 | 729,509 | ||||||
Hermes International | 169 | 69,327 | ||||||
Home Depot, Inc., The | 8,166 | 1,094,897 | ||||||
Husqvarna AB, Class B | 2,723 | 21,128 | ||||||
InterContinental Hotels Group PLC | 1,227 | 54,864 | ||||||
Interpublic Group of Cos., Inc., The | 2,653 | 62,107 | ||||||
Kering | 6,209 | 1,392,701 | ||||||
Kingfisher PLC | 14,569 | 62,769 | ||||||
Kohl's Corp. (b) | 1,263 | 62,367 | ||||||
Lagardere SCA | 766 | 21,261 | ||||||
lululemon athletica, Inc. (a)(b) | 791 | 51,407 | ||||||
Macy's, Inc. (b) | 34,700 | 1,242,607 | ||||||
Marks & Spencer Group PLC | 10,271 | 44,244 | ||||||
Marriott International, Inc., Class A | 2,204 | 182,227 | ||||||
MGM China Holdings, Ltd. | 6,400 | 13,220 | ||||||
Michael Kors Holdings, Ltd. (a)(b) | 11,550 | 496,419 | ||||||
Michelin | 1,191 | 132,390 | ||||||
Netflix, Inc. (a) | 2,801 | 346,764 | ||||||
Next PLC | 907 | 55,640 | ||||||
NIKE, Inc., Class B | 42,523 | 2,161,444 | ||||||
Nokian Renkaat OYJ | 749 | 27,846 | ||||||
Nordstrom, Inc. (b) | 853 | 40,884 | ||||||
Omnicom Group, Inc. (b) | 1,555 | 132,346 | ||||||
Publicis Groupe SA | 1,240 | 85,442 | ||||||
REA Group, Ltd. | 310 | 12,319 | ||||||
Renault SA | 1,257 |
| 111,643 | |||||
Schibsted ASA, Class A | 494 | 11,306 | ||||||
Schibsted ASA, Class B | 583 | 12,339 | ||||||
Scripps Networks Interactive, Inc. Class A (b) | 532 | 37,969 | ||||||
Signet Jewelers, Ltd. | 493 | 46,470 | ||||||
Singapore Press Holdings, Ltd. | 10,500 | 25,534 | ||||||
Sodexo SA | 4,774 | 548,119 | ||||||
Staples, Inc. (b) | 4,109 | 37,186 | ||||||
Tabcorp Holdings, Ltd. | 5,009 | 17,354 | ||||||
Target Corp. | 3,700 | 267,251 | ||||||
Taylor Wimpey PLC | 20,333 | 38,350 | ||||||
TEGNA, Inc. (b) | 13,000 | 278,070 | ||||||
Telenet Group Holding NV (a) | 334 | 18,513 | ||||||
Tiffany & Co. (b) | 894 | 69,222 | ||||||
TJX Cos., Inc., The | 4,387 | 329,595 | ||||||
TUI AG | 3,262 | 46,703 | ||||||
Ulta Salon Cosmetics & Fragrance, Inc. (a) | 2,820 | 718,931 | ||||||
Valeo SA | 1,559 | 89,499 | ||||||
Viacom, Inc., Class B (a) | 2,269 | 79,642 | ||||||
Walt Disney Co., The | 10,102 | 1,052,830 | ||||||
Whitbread PLC | 1,165 | 54,194 | ||||||
Wyndham Worldwide Corp. (b) | 779 | 59,492 | ||||||
13,633,377 | ||||||||
Consumer Staples: 12.8% | ||||||||
Brown-Forman Corp., Class B (b) | 1,500 | 67,380 | ||||||
Campbell Soup Co. (b) | 1,370 | 82,844 | ||||||
Carrefour SA | 3,622 | 87,203 | ||||||
Clorox Co., The (b) | 851 | 102,137 | ||||||
Coca-Cola Amatil, Ltd. | 3,691 | 26,918 | ||||||
Coca-Cola Co., The (b) | 26,935 | 1,116,725 | ||||||
Colgate-Palmolive Co. (b) | 5,632 | 368,558 | ||||||
CVS Health Corp. | 7,067 | 557,657 | ||||||
Danone SA | 3,860 | 244,255 | ||||||
Diageo PLC | 21,053 | 546,322 | ||||||
Dr. Pepper Snapple Group, Inc. | 1,251 | 113,428 | ||||||
Empire Co., Ltd., Class A | 1,100 | 12,879 | ||||||
Estee Lauder Cos, Inc., The, Class A | 16,867 | 1,290,157 | ||||||
General Mills, Inc. | 22,709 | 1,402,735 | ||||||
Heineken Holding NV | 660 | 45,897 | ||||||
SEE NOTES TO FINANCIAL STATEMENTS
83
December 31, 2016
|
Schedule of Investments, continued |
Pax Ellevate Global Women’s Index Fund, continued
Percent of Net Assets | Shares/Principal | Value | ||||||
COMMON STOCKS, continued | ||||||||
Consumer Staples, continued | ||||||||
Henkel AG & Co. KGaA | 680 | $ | 70,770 | |||||
ICA Gruppen AB | 474 | 14,428 | ||||||
Ingredion, Inc. | 3,259 | 407,245 | ||||||
J Sainsbury PLC | 10,724 | 32,960 | ||||||
Jean Coutu Group PJC, Inc., The, Class A | 500 | 7,791 | ||||||
JM Smucker Co., The (b) | 860 | 110,132 | ||||||
Kellogg Co. (b) | 20,681 | 1,524,397 | ||||||
Kimberly-Clark Corp. | 2,384 | 272,062 | ||||||
Kroger Co., The | 5,956 | 205,542 | ||||||
Loblaw Cos, Ltd. | 1,500 | 79,142 | ||||||
L'Oreal SA | 1,657 | 302,014 | ||||||
Marine Harvest ASA (a) | 2,502 | 45,237 | ||||||
McCormick & Co., Inc. | 755 | 70,464 | ||||||
Mead Johnson Nutrition Co. (b) | 1,267 | 89,653 | ||||||
Metro, Inc., Class A | 1,600 | 47,858 | ||||||
Mondelez International, Inc., Class A | 10,159 | 450,348 | ||||||
Orkla ASA | 5,161 | 46,700 | ||||||
PepsiCo, Inc. | 9,486 | 992,520 | ||||||
Procter & Gamble Co., The (b) | 19,972 | 1,679,246 | ||||||
Remy Cointreau SA | 138 | 11,763 | ||||||
Saputo, Inc. | 1,717 | 60,756 | ||||||
Svenska Cellulosa AB SCA, Class B | 3,969 | 111,714 | ||||||
Tate & Lyle PLC | 2,892 | 25,168 | ||||||
Unilever NV | 10,727 | 440,652 | ||||||
Unilever PLC | 8,467 | 342,404 | ||||||
Walgreens Boots Alliance, Inc. | 6,100 | 504,836 | ||||||
Woolworths, Ltd. | 8,362 | 145,144 | ||||||
14,156,041 | ||||||||
Energy: 2.1% | ||||||||
Cameco Corp. | 2,531 | 26,466 | ||||||
ConocoPhillips | 8,197 | 410,998 | ||||||
Core Laboratories NV | 334 | 40,093 | ||||||
Encana Corp. | 39,103 | 458,990 | ||||||
Lundin Petroleum AB (a) | 1,281 | 27,761 | ||||||
Neste OYJ | 812 | 31,073 | ||||||
Occidental Petroleum Corp. | 5,000 | 356,150 | ||||||
Phillips 66 | 3,177 | 274,525 | ||||||
PrairieSky Royalty, Ltd. | 1,411 | 33,566 | ||||||
Snam SpA | 15,514 | 63,807 | ||||||
Statoil ASA | 7,293 | 133,109 | ||||||
Technip SA | 720 | 51,287 | ||||||
TransCanada Corp. | 5,254 |
| 236,903 | |||||
Veresen, Inc. | 1,830 | 17,869 | ||||||
Williams Cos., Inc., The | 4,700 | 146,358 | ||||||
2,308,955 | ||||||||
Financials: 18.4% | ||||||||
3i Group PLC | 6,158 | 53,269 | ||||||
ABN AMRO Group NV | 1,537 | 34,032 | ||||||
Admiral Group PLC | 1,375 | 30,922 | ||||||
Allianz SE | 2,989 | 493,298 | ||||||
Allstate Corp., The | 2,541 | 188,339 | ||||||
Ally Financial, Inc. (b) | 2,767 | 52,628 | ||||||
Ameriprise Financial, Inc. | 1,100 | 122,034 | ||||||
AMP, Ltd. | 19,180 | 69,563 | ||||||
Aon PLC (b) | 1,740 | 194,062 | ||||||
Assicurazioni Generali SpA | 7,650 | 113,391 | ||||||
ASX, Ltd. | 1,226 | 43,922 | ||||||
Australia & New Zealand Banking Group, Ltd. | 19,602 | 429,111 | ||||||
AXA SA | 12,703 | 320,227 | ||||||
Banco Santander SA | 95,472 | 496,671 | ||||||
Bank Hapoalim BM | 6,740 | 40,005 | ||||||
Bank Leumi Le-Israel BM (a) | 9,461 | 38,881 | ||||||
Bank of America Corp. | 67,240 | 1,486,005 | ||||||
Bank of Montreal | 4,347 | 312,658 | ||||||
Bank of Nova Scotia, The | 7,931 | 441,605 | ||||||
Bank of Queensland, Ltd. | 2,294 | 19,605 | ||||||
Bankinter SA | 4,268 | 33,006 | ||||||
Bendigo & Adelaide Bank, Ltd. | 3,019 | 27,617 | ||||||
BNP Paribas SA | 6,928 | 440,883 | ||||||
Canadian Imperial Bank of Commerce | 2,604 | 212,486 | ||||||
CIT Group, Inc. | 1,343 | 57,319 | ||||||
Citizens Financial Group, Inc. | 3,500 | 124,705 | ||||||
CNP Assurances | 1,010 | 18,694 | ||||||
Comerica, Inc. | 1,216 | 82,822 | ||||||
Commonwealth Bank of Australia | 12,086 | 716,991 | ||||||
DBS Group Holdings, Ltd. | 11,421 | 136,262 | ||||||
Deutsche Bank AG (a) | 9,019 | 163,599 | ||||||
Deutsche Boerse AG | 1,262 | 101,256 | ||||||
Discover Financial Services | 2,717 | 195,869 | ||||||
DNB ASA | 47,584 | 706,398 | ||||||
Eaton Vance Corp. | 764 | 31,996 | ||||||
Eurazeo SA | 265 | 15,492 | ||||||
EXOR NV | 725 | 31,180 | ||||||
First Republic Bank (b) | 986 | 90,850 | ||||||
SEE NOTES TO FINANCIAL STATEMENTS
84
December 31, 2016
|
Schedule of Investments, continued |
Pax Ellevate Global Women’s Index Fund, continued
Percent of Net Assets | Shares/Principal | Value | ||||||
COMMON STOCKS, continued | ||||||||
Financials, continued | ||||||||
Gjensidige Forsikring ASA | 30,989 | $ | 491,288 | |||||
Hang Seng Bank, Ltd. | 5,100 | 94,577 | ||||||
Hartford Financial Services Group | 2,581 | 122,985 | ||||||
Industrivarden AB, Class C | 1,074 | 19,974 | ||||||
ING Groep NV | 25,353 | 356,939 | ||||||
Insurance Australia Group, Ltd. | 15,735 | 67,854 | ||||||
Intact Financial Corp. | 17,543 | 1,255,639 | ||||||
Investor AB, Class B | 2,980 | 111,035 | ||||||
KBC Group NV | 1,641 | 101,394 | ||||||
KeyCorp | 7,184 | 131,252 | ||||||
Kinnevik AB, Class B | 1,491 | 35,613 | ||||||
Macquarie Group, Ltd. | 9,315 | 583,510 | ||||||
Manulife Financial Corp. | 13,000 | 231,505 | ||||||
MetLife, Inc. | 6,147 | 331,262 | ||||||
Mizrahi Tefahot Bank, Ltd. | 796 | 11,625 | ||||||
Moody's Corp. | 1,215 | 114,538 | ||||||
MSCI, Inc. (b) | 3,466 | 273,051 | ||||||
Muenchener Rueckversicherungs AG | 1,057 | 199,644 | ||||||
National Australia Bank, Ltd. | 17,298 | 382,086 | ||||||
National Bank of Canada | 2,259 | 91,746 | ||||||
Nordea Bank AB | 19,862 | 220,083 | ||||||
Old Mutual PLC | 32,229 | 82,183 | ||||||
PNC Financial Services Group, Inc. | 3,300 | 385,968 | ||||||
Poste Italiane SpA | 3,416 | 22,672 | ||||||
Principal Financial Group, Inc. (b) | 2,072 | 119,886 | ||||||
Progressive Corp., The | 3,900 | 138,450 | ||||||
Prudential Financial, Inc. (b) | 2,940 | 305,936 | ||||||
Prudential PLC | 16,824 | 335,764 | ||||||
Regions Financial Corp. | 8,194 | 117,666 | ||||||
Royal Bank of Canada | 19,428 | 1,314,881 | ||||||
Royal Bank of Scotland Group PLC (a) | 23,026 | 63,624 | ||||||
Sampo OYJ, Class A | 2,924 | 130,711 | ||||||
Skandinaviska Enskilda Banken AB, Class A | 9,933 | 103,802 | ||||||
Societe Generale SA | 5,018 | 246,819 | ||||||
Standard Chartered PLC (a) | 21,463 | 175,029 | ||||||
Sun Life Financial, Inc. | 4,009 | 153,922 | ||||||
Suncorp Group, Ltd. | 8,414 | 81,928 | ||||||
Svenska Handelsbanken AB, Class A | 9,907 |
| 137,216 | |||||
Swedbank AB, Class A | 21,786 | 524,922 | ||||||
Toronto-Dominion Bank, The | 12,219 | 602,646 | ||||||
Travelers Cos., Inc., The (b) | 1,996 | 244,350 | ||||||
Tryg A/S | 654 | 11,810 | ||||||
Unum Group | 1,600 | 70,288 | ||||||
U.S. Bancorp (b) | 11,325 | 581,765 | ||||||
Voya Financial, Inc. | 1,386 | 54,359 | ||||||
Wendel SA | 189 | 22,743 | ||||||
Westpac Banking Corp. | 22,446 | 526,895 | ||||||
Willis Towers Watson PLC (b) | 935 | 114,332 | ||||||
Zurich Insurance Group AG (a) | 985 | 270,698 | ||||||
20,336,518 | ||||||||
Health Care: 11.1% | ||||||||
Abbott Laboratories | 46,224 | 1,775,464 | ||||||
Aetna, Inc. | 14,071 | 1,744,945 | ||||||
Alkermes PLC (a) | 1,041 | 57,859 | ||||||
AmerisourceBergen Corp. | 1,312 | 102,585 | ||||||
AstraZeneca PLC | 8,269 | 451,551 | ||||||
Becton Dickinson & Co. (b) | 1,426 | 236,074 | ||||||
Biogen, Inc. (a) | 1,528 | 433,310 | ||||||
Bristol-Myers Squibb Co. | 10,996 | 642,606 | ||||||
Cardinal Health, Inc. (b) | 2,152 | 154,879 | ||||||
Cigna Corp. | 1,740 | 232,099 | ||||||
CSL, Ltd. | 2,992 | 216,381 | ||||||
DaVita, Inc. (a) | 1,100 | 70,620 | ||||||
Eli Lilly & Co. | 6,595 | 485,062 | ||||||
Getinge AB | 1,309 | 20,974 | ||||||
GlaxoSmithKline PLC | 31,855 | 611,886 | ||||||
Healthscope, Ltd. | 11,346 | 18,703 | ||||||
Hologic, Inc. (a) | 1,714 | 68,766 | ||||||
IDEXX Laboratories, Inc. (a)(b) | 585 | 68,603 | ||||||
Johnson & Johnson | 18,077 | 2,082,652 | ||||||
McKesson Corp. (b) | 1,562 | 219,383 | ||||||
Medtronic PLC | 9,232 | 657,595 | ||||||
Novo Nordisk A/S, Class B | 12,503 | 448,510 | ||||||
Orion OYJ, Class B | 671 | 29,814 | ||||||
Patterson Cos., Inc. (b) | 601 | 24,659 | ||||||
Quest Diagnostics, Inc. (b) | 1,000 | 91,900 | ||||||
Ryman Healthcare, Ltd. | 2,452 | 13,806 | ||||||
Sanofi | 7,574 | 612,473 | ||||||
Shire PLC | 5,876 | 335,515 | ||||||
Smith & Nephew PLC | 5,716 | 85,793 | ||||||
SEE NOTES TO FINANCIAL STATEMENTS
85
December 31, 2016
|
Schedule of Investments, continued |
Pax Ellevate Global Women’s Index Fund, continued
Percent of Net Assets | Shares/Principal | Value | ||||||
COMMON STOCKS, continued | ||||||||
Health Care, continued | ||||||||
UCB SA | 801 | $ | 51,249 | |||||
United Therapeutics Corp. (a) | 300 | 43,029 | ||||||
Varian Medical Systems, Inc. (a)(b) | 684 | 61,410 | ||||||
Vertex Pharmaceuticals, Inc. (a)(b) | 1,666 | 122,734 | ||||||
12,272,889 | ||||||||
Industrials: 6.1% | ||||||||
Aeroports de Paris | 188 | 20,132 | ||||||
Alfa Laval AB | 1,859 | 30,665 | ||||||
Alstom SA (a) | 1,003 | 27,581 | ||||||
Ashtead Group PLC | 3,292 | 63,998 | ||||||
Atlantia SpA | 2,614 | 61,158 | ||||||
Atlas Copco AB, Class A | 4,391 | 133,208 | ||||||
Atlas Copco AB, Class B | 2,552 | 69,382 | ||||||
Auckland International Airport, Ltd. | 6,031 | 26,159 | ||||||
Bouygues SA | 1,311 | 46,933 | ||||||
Brambles, Ltd. | 20,687 | 184,612 | ||||||
Capita PLC | 99,623 | 651,393 | ||||||
Cie de Saint-Gobain | 3,237 | 150,577 | ||||||
CNH Industrial NV | 6,684 | 57,997 | ||||||
Cummins, Inc. | 1,735 | 237,122 | ||||||
Deere & Co. | 1,800 | 185,472 | ||||||
Deutsche Lufthansa AG | 1,471 | 18,962 | ||||||
Deutsche Post AG | 6,345 | 208,084 | ||||||
Dun & Bradstreet Corp., The | 301 | 36,517 | ||||||
easyJet PLC | 21,665 | 267,983 | ||||||
Edenred | 28,488 | 564,077 | ||||||
Fraport AG Frankfurt Airport Svc Worldwide | 240 | 14,162 | ||||||
Groupe Eurotunnel SE | 2,960 | 28,120 | ||||||
Ingersoll-Rand PLC (b) | 1,700 | 127,568 | ||||||
Intertek Group PLC | 1,022 | 43,801 | ||||||
Kone OYJ, Class B | 2,205 | 98,527 | ||||||
Koninklijke Philips NV | 6,089 | 186,152 | ||||||
Legrand SA | 1,747 | 99,116 | ||||||
ManpowerGroup, Inc. | 540 | 47,990 | ||||||
MTR Corp. Ltd. | 9,849 | 47,750 | ||||||
Qantas Airways, Ltd. | 4,072 | 9,755 | ||||||
Randstad Holding NV | 749 | 40,572 | ||||||
Rexel SA | 35,415 | 581,864 | ||||||
Royal Mail PLC | 5,886 | 33,458 | ||||||
Sandvik AB | 6,972 | 86,007 | ||||||
Schneider Electric SE | 3,658 | 254,116 | ||||||
Securitas AB, Class B | 1,983 | 31,105 | ||||||
SEEK, Ltd. | 2,072 |
| 22,191 | |||||
Siemens AG | 5,003 | 612,567 | ||||||
Skanska AB, Class B | 2,224 | 52,363 | ||||||
Societe BIC SA | 183 | 24,865 | ||||||
Southwest Airlines Co. | 1,130 | 56,319 | ||||||
Sydney Airport | 42,918 | 185,253 | ||||||
Transurban Group | 19,298 | 143,621 | ||||||
United Parcel Service, Inc., Class B | 4,583 | 525,395 | ||||||
Vestas Wind Systems A/S | 1,449 | 93,844 | ||||||
Volvo AB, Class B | 10,082 | 117,375 | ||||||
Wolters Kluwer NV | 1,975 | 71,434 | ||||||
Zodiac Aerospace | 1,328 | 30,452 | ||||||
6,707,754 | ||||||||
Information Technology: 18.5% | ||||||||
Accenture PLC, Class A (b) | 4,130 | 483,747 | ||||||
Alphabet, Inc., Class A (a) | 1,927 | 1,527,051 | ||||||
Alphabet, Inc., Class C (a) | 2,035 | 1,570,654 | ||||||
Arrow Electronics, Inc. (a) | 600 | 42,780 | ||||||
ASML Holding NV | 2,409 | 269,978 | ||||||
Auto Trader Group PLC | 6,546 | 32,910 | ||||||
Autodesk, Inc. (a) | 1,408 | 104,206 | ||||||
Capgemini SE | 1,070 | 90,147 | ||||||
CDW Corp. | 975 | 50,788 | ||||||
Cisco Systems, Inc. (b) | 32,925 | 994,994 | ||||||
Dassault Systemes SA | 841 | 64,014 | ||||||
Ericsson, Class B | 165,415 | 969,492 | ||||||
Facebook, Inc., Class A (a) | 17,798 | 2,047,660 | ||||||
Gemalto NV | 508 | 29,338 | ||||||
Hexagon AB, Class B | 1,637 | 58,303 | ||||||
HP, Inc. | 11,429 | 169,606 | ||||||
IBM (b) | 6,042 | 1,002,912 | ||||||
Ingenico Group SA | 348 | 27,765 | ||||||
Intuit, Inc. | 1,670 | 191,399 | ||||||
MasterCard, Inc., Class A | 6,403 | 661,110 | ||||||
Microsoft Corp. | 48,829 | 3,034,234 | ||||||
Open Text Corp. | 819 | 50,580 | ||||||
salesforce.com, Inc. (a)(b) | 29,500 | 2,019,570 | ||||||
Symantec Corp. (b) | 4,216 | 100,720 | ||||||
Texas Instruments, Inc. | 6,575 | 479,778 | ||||||
Visa, Inc., Class A (b) | 12,538 | 978,215 | ||||||
Xerox Corp. | 170,830 | 1,491,346 | ||||||
Yahoo!, Inc. (a) | 49,174 | 1,901,559 | ||||||
20,444,856 | ||||||||
SEE NOTES TO FINANCIAL STATEMENTS
86
December 31, 2016
|
Schedule of Investments, continued |
Pax Ellevate Global Women’s Index Fund, continued
Percent of Net Assets | Shares/Principal | Value | ||||||
COMMON STOCKS, continued | ||||||||
Materials: 2.7% | ||||||||
Agrium, Inc. | 900 | $ | 90,466 | |||||
Air Liquide SA | 2,534 | 281,778 | ||||||
Akzo Nobel NV | 1,620 | 101,229 | ||||||
Avery Dennison Corp. | 592 | 41,570 | ||||||
Boliden AB | 1,732 | 44,989 | ||||||
Boral, Ltd. | 4,946 | 19,255 | ||||||
Celanese Corp., Series A | 1,000 | 78,740 | ||||||
CRH PLC | 5,425 | 187,122 | ||||||
Ecolab, Inc. (b) | 1,751 | 205,252 | ||||||
EMS-Chemie Holding AG | 52 | 26,407 | ||||||
Goldcorp, Inc. | 5,500 | 74,882 | ||||||
International Flavors & Fragrances, Inc. | 531 | 62,568 | ||||||
Kinross Gold Corp. (a) | 7,800 | 24,341 | ||||||
Koninklijke DSM NV | 1,187 | 71,134 | ||||||
Martin Marietta Materials, Inc. (b) | 400 | 88,612 | ||||||
Methanex Corp. | 589 | 25,834 | ||||||
Newmont Mining Corp. (b) | 18,149 | 618,336 | ||||||
Norsk Hydro ASA | 83,676 | 399,363 | ||||||
Potash Corp. of Saskatchewan, Inc. | 5,413 | 97,927 | ||||||
Solvay SA | 470 | 54,946 | ||||||
Stora Enso OYJ, Class R | 3,488 | 37,311 | ||||||
Syngenta AG, Registered Shares | 608 | 240,222 | ||||||
UPM-Kymmene OYJ | 3,491 | 85,374 | ||||||
Yara International ASA | 1,133 | 44,571 | ||||||
3,002,229 | ||||||||
Real Estate: 2.6% | ||||||||
Azrieli Group Ltd | 270 | 11,718 | ||||||
British Land Co. PLC, The, REIT | 6,394 | 49,621 | ||||||
Cheung Kong Property Holdings, Ltd. | 18,000 | 109,926 | ||||||
Dexus Property Group, REIT | 6,128 | 42,511 | ||||||
Duke Realty Corp., REIT (b) | 2,322 | 61,672 | ||||||
Federal Realty Investment Trust, REIT (b) | 494 | 70,202 | ||||||
First Capital Realty, Inc. | 900 | 13,855 | ||||||
Fonciere Des Regions, REIT | 222 | 19,356 | ||||||
Gecina SA, REIT | 261 | 36,049 | ||||||
GPT Group, The, REIT | 11,376 | 41,244 | ||||||
Host Hotels & Resorts, Inc., REIT (b) | 4,835 | 91,091 | ||||||
ICADE, REIT | 235 |
| 16,749 | |||||
Intu Properties PLC, REIT | 6,036 | 20,907 | ||||||
Jones Lang LaSalle, Inc. | 335 | 33,848 | ||||||
Klepierre, REIT | 1,394 | 54,699 | ||||||
Land Securities Group PLC, REIT | 5,039 | 66,198 | ||||||
LendLease Group | 3,618 | 38,020 | ||||||
Link, REIT | 15,000 | 97,246 | ||||||
Mirvac Group, REIT | 225,518 | 346,326 | ||||||
Realty Income Corp., REIT (b) | 1,705 | 98,003 | ||||||
Scentre Group, REIT | 34,816 | 116,546 | ||||||
UDR, Inc., REIT | 1,813 | 66,138 | ||||||
Unibail-Rodamco SE, REIT | 648 | 154,422 | ||||||
Vicinity Centres, REIT | 21,303 | 45,940 | ||||||
Weyerhaeuser Co., REIT (b) | 38,239 | 1,150,613 | ||||||
2,852,900 | ||||||||
Telecommunication Services: 6.0% | ||||||||
AT&T, Inc. (b) | 40,283 | 1,713,236 | ||||||
Deutsche Telekom AG | 21,086 | 361,777 | ||||||
Elisa OYJ | 901 | 29,248 | ||||||
Frontier Communications Corp. (b) | 35,752 | 120,842 | ||||||
Iliad SA | 173 | 33,224 | ||||||
Orange SA | 12,991 | 196,995 | ||||||
Proximus SADP | 963 | 27,683 | ||||||
Rogers Communications, Inc., Class B | 2,373 | 91,534 | ||||||
Singapore Telecommunications, Ltd. | 197,100 | 494,412 | ||||||
Tele2 AB, Class B | 2,367 | 18,927 | ||||||
Telefonica Deutschland Holding AG | 253,566 | 1,083,843 | ||||||
Telenor ASA | 4,909 | 73,275 | ||||||
Telia Co AB | 227,903 | 915,530 | ||||||
Telstra Corp., Ltd. | 27,980 | 102,817 | ||||||
Verizon Communications, Inc. | 26,663 | 1,423,271 | ||||||
6,686,614 | ||||||||
Utilities: 5.1% | ||||||||
Alliant Energy Corp. (b) | 1,546 | 58,578 | ||||||
Ameren Corp. (b) | 1,665 | 87,346 | ||||||
American Electric Power Co., Inc. | 3,247 | 204,431 | ||||||
American Water Works Co., Inc. (b) | 27,496 | 1,989,611 | ||||||
Atco, Ltd., Class I | 500 | 16,631 | ||||||
SEE NOTES TO FINANCIAL STATEMENTS
87
December 31, 2016
|
Schedule of Investments, continued |
Pax Ellevate Global Women’s Index Fund, continued
Percent of Net Assets | Shares/Principal | Value | ||||||
COMMON STOCKS, continued | ||||||||
Utilities, continued | ||||||||
AusNet Services | 11,866 | $ | 13,508 | |||||
Canadian Utilities, Ltd., Class A | 875 | 23,585 | ||||||
CenterPoint Energy, Inc. | 2,764 | 68,105 | ||||||
CMS Energy Corp. | 1,900 | 79,078 | ||||||
Consolidated Edison, Inc. | 1,999 | 147,286 | ||||||
Contact Energy, Ltd. | 4,279 | 13,837 | ||||||
Dominion Resources, Inc. (b) | 4,048 | 310,036 | ||||||
DUET Group | 15,909 | 31,418 | ||||||
Duke Energy Corp. (b) | 4,603 | 357,285 | ||||||
Edison International (b) | 2,135 | 153,699 | ||||||
Engie SA | 9,555 | 121,625 | ||||||
Entergy Corp. (b) | 1,200 | 88,164 | ||||||
Fortum OYJ | 51,963 | 794,315 | ||||||
Hydro One, Ltd. | 7,168 | 125,886 | ||||||
Mercury NZ , Ltd. | 4,118 | 8,460 | ||||||
National Grid PLC | 24,501 | 286,263 | ||||||
NiSource, Inc. | 2,103 | 46,560 | ||||||
Red Electrica Corp. SA | 11,281 | 212,536 | ||||||
Sempra Energy (b) | 1,603 | 161,326 | ||||||
Severn Trent PLC | 1,490 | 40,720 | ||||||
Suez | 2,062 | 30,383 | ||||||
United Utilities Group PLC | 4,317 | 47,851 | ||||||
WEC Energy Group, Inc. | 2,100 | 123,165 | ||||||
5,641,688 | ||||||||
TOTAL COMMON STOCKS | ||||||||
(Cost $104,038,457) | 108,043,821 | |||||||
PREFERRED STOCKS: 0.1% | ||||||||
Consumer Discretionary: 0.0% (c) | ||||||||
Bayerische Motoren Werke AG | 357 | 27,264 | ||||||
Consumer Staples: 0.1% | ||||||||
Henkel AG & Co. KGaA | 1,165 | 138,681 | ||||||
TOTAL PREFERRED STOCKS | ||||||||
(Cost $163,570) | 165,945 | |||||||
EXCHANGE-TRADED FUNDS: 1.9% | ||||||||
iShares Core S&P 500 ETF | 5,879 |
| 1,322,716 | |||||
iShares MSCI EAFE ETF | 14,217 | 820,747 | ||||||
TOTAL EXCHANGE-TRADED FUNDS | ||||||||
(Cost $2,155,451) | 2,143,463 | |||||||
TIME DEPOSIT: 0.6% | ||||||||
State Street Euro Dollar Time Deposit, 0.010%, 01/03/17 |
| 635,000 | 635,000 | |||||
(Cost $635,000) | ||||||||
SECURITIES PURCHASED WITH CASH COLLATERAL FROM SECURITIES LENDING: 0.1% | ||||||||
State Street Navigator Securities Lending Government Money Market Portfolio | 125,132 | 125,132 | ||||||
(Cost $125,132) | ||||||||
TOTAL INVESTMENTS: 100.4% | ||||||||
(Cost $107,117,610) | 111,113,361 | |||||||
PAYABLE UPON RETURN OF SECURITIES LOANED— (NET): -0.1% | (125,132 | ) | ||||||
OTHER ASSETS AND LIABILITIES— (NET): -0.3% | (297,804 | ) | ||||||
NET ASSETS: 100.0% | $ | 110,690,425 | ||||||
(a) | Non-income producing security. |
(b) | Security or partial position of this security was on loan as of December 31, 2016. The total market value of securities on loan as of December 31, 2016 was $20,493,636. |
(c) | Rounds to less than 0.05%. |
REIT | Real Estate Investment Trust |
SEE NOTES TO FINANCIAL STATEMENTS
88
December 31, 2016
|
Schedule of Investments, continued |
Pax Ellevate Global Women’s Index Fund, continued
SUMMARY OF INVESTMENTS BY COUNTRY
Percent of Net Assets | Value | Percent | ||||||
Australia | $ | 4,767,176 | 4.3 | % | ||||
Belgium | 253,785 | 0.2 | % | |||||
Canada | 6,234,827 | 5.6 | % | |||||
Denmark | 554,164 | 0.5 | % | |||||
Finland | 1,264,219 | 1.1 | % | |||||
France | 7,842,309 | 7.1 | % | |||||
Germany | 3,742,343 | 3.3 | % | |||||
Hong Kong | 362,720 | 0.3 | % | |||||
Ireland | 1,570,364 | 1.4 | % | |||||
Israel | 102,229 | 0.1 | % | |||||
Italy | 319,025 | 0.3 | % | |||||
Netherlands | 1,718,630 | 1.6 | % | |||||
New Zealand | 62,262 | 0.1 | % | |||||
Norway | 1,963,587 | 1.8 | % | |||||
Singapore | 656,208 | 0.6 | % | |||||
Spain | 742,213 | 0.7 | % | |||||
Sweden | 4,643,241 | 4.2 | % | |||||
Switzerland | 537,327 | 0.5 | % | |||||
United Kingdom | 5,424,636 | 4.9 | % | |||||
United States | 67,591,964 | 61.1 | % | |||||
Time Deposit | 635,000 | 0.6 | % | |||||
Other assets and liabilities - (net) | (297,804 | ) | -0.3 | % | ||||
Total | $ | 110,690,425 | 100.0 | % | ||||
SEE NOTES TO FINANCIAL STATEMENTS
89
December 31, 2016
|
Schedule of Investments, continued |
Pax Global Environmental Markets Fund
Percent of Net Assets | Shares/Principal | Value | ||||||
COMMON STOCKS: 96.9% | ||||||||
RENEWABLE & ALTERNATIVE ENERGY: 1.2% | ||||||||
Renewable Energy Developers & Independent Power Producers (IPPS) : 1.2% | ||||||||
Huaneng Renewables Corp., Ltd. | 13,164,000 | $ | 4,255,748 | |||||
ENERGY EFFICIENCY: 25.2% | ||||||||
Power Network Efficiency: 3.5% | ||||||||
Hubbell, Inc. | 63,741 | 7,438,575 | ||||||
Itron, Inc. (a) | 73,485 | 4,618,532 | ||||||
12,057,107 | ||||||||
Industrial Energy Efficiency: 2.0% | ||||||||
Delta Electronics, Inc. | 1,414,475 | 6,953,740 | ||||||
Buildings Energy Efficiency: 9.7% | ||||||||
Acuity Brands, Inc. | 13,500 | 3,116,610 | ||||||
Ingersoll-Rand PLC | 112,300 | 8,426,992 | ||||||
Kingspan Group PLC | 148,152 | 4,023,568 | ||||||
Legrand SA | 198,774 | 11,277,478 | ||||||
Sekisui Chemical Co., Ltd. | 438,200 | 6,975,503 | ||||||
33,820,151 | ||||||||
Transport Energy Efficiency: 5.3% | ||||||||
BorgWarner, Inc. | 197,300 | 7,781,512 | ||||||
Delphi Automotive PLC | 156,358 | 10,530,711 | ||||||
18,312,223 | ||||||||
Consumer Energy Efficiency: 2.6% | ||||||||
Murata Manufacturing Co., Ltd. | 68,300 | 9,120,558 | ||||||
Diversified Energy Efficiency: 2.1% | ||||||||
Siemens AG | 60,000 | 7,346,397 | ||||||
WATER INFRASTRUCTURE & TECHNOLOGIES: 32.1% | ||||||||
Water Infrastructure: 12.3% | ||||||||
IDEX Corp. | 93,750 | 8,443,124 | ||||||
Roper Technologies, Inc. (b) | 34,239 | 6,268,476 | ||||||
Toro Co., The | 97,200 | 5,438,340 | ||||||
Watts Water Technologies, Inc., Class A | 104,386 | 6,805,967 | ||||||
Wolseley PLC | 118,189 | 7,214,981 | ||||||
Xylem, Inc. | 179,699 | 8,898,694 | ||||||
43,069,582 | ||||||||
Water Treatment Equipment: 7.7% | ||||||||
Danaher Corp. (b) | 132,000 |
| 10,274,880 | |||||
Ecolab, Inc. | 85,454 | 10,016,918 | ||||||
Kemira Oyj | 499,476 | 6,367,021 | ||||||
26,658,819 | ||||||||
Water Utilities: 12.1% | ||||||||
American Water Works Co., Inc. | 114,359 | 8,275,017 | ||||||
Beijing Enterprises Water Group, Ltd. (a) | 9,456,000 | 6,258,486 | ||||||
Pennon Group PLC | 861,389 | 8,766,975 | ||||||
Severn Trent PLC | 305,212 | 8,341,069 | ||||||
Suez | 718,549 | 10,587,449 | ||||||
42,228,996 | ||||||||
POLLUTION CONTROL: 17.2% | ||||||||
Pollution Control Solutions: 1.4% | ||||||||
Umicore SA | 84,747 | 4,821,376 | ||||||
Environmental Testing & Gas Sensing: 13.1% | ||||||||
Agilent Technologies, Inc. | 202,798 | 9,239,477 | ||||||
Applus Services SA | 499,633 | 5,063,520 | ||||||
Horiba, Ltd. | 141,193 | 6,520,664 | ||||||
Intertek Group PLC | 84,000 | 3,600,073 | ||||||
PerkinElmer, Inc. (b) | 131,400 | 6,852,510 | ||||||
Thermo Fisher Scientific, Inc. | 67,600 | 9,538,360 | ||||||
Waters Corp. (a) | 37,500 | 5,039,625 | ||||||
45,854,229 | ||||||||
Public Transportation: 2.7% | ||||||||
East Japan Railway Co. | 108,200 | 9,328,863 | ||||||
WASTE MANAGEMENT & TECHNOLOGIES: 2.9% | ||||||||
General Waste Management: 2.9% | ||||||||
Waste Management, Inc. | 144,034 | 10,213,451 | ||||||
FOOD, AGRICULTURE & FORESTRY: 13.3% | ||||||||
Logistics, Food Safety & Packaging: 7.8% | ||||||||
GEA Group AG | 175,175 | 7,029,847 | ||||||
Sealed Air Corp. | 226,500 | 10,269,510 | ||||||
WestRock Co. | 195,933 | 9,947,518 | ||||||
27,246,875 | ||||||||
SEE NOTES TO FINANCIAL STATEMENTS
90
December 31, 2016
|
Schedule of Investments, continued |
Pax Global Environmental Markets Fund, continued
Percent of Net Assets | Shares/Principal | Value | ||||||
COMMON STOCKS, continued | ||||||||
FOOD, AGRICULTURE & FORESTRY, continued | ||||||||
Sustainable & Efficient Agriculture: 5.5% | ||||||||
Kubota Corp. | 492,000 | $ | 7,011,399 | |||||
Marine Harvest ASA (a) | 362,481 | 6,553,831 | ||||||
Trimble, Inc. (a) | 181,700 | 5,478,255 | ||||||
19,043,485 | ||||||||
DIVERSIFIED ENVIRONMENTAL: 5.0% | ||||||||
Diversified Environmental: 5.0% | ||||||||
3M Co. | 35,586 | 6,354,592 | ||||||
Linde AG | 29,322 | 4,809,910 | ||||||
Praxair, Inc. | 52,616 | 6,166,069 | ||||||
17,330,571 | ||||||||
TOTAL COMMON STOCKS | ||||||||
(Cost $291,864,641) | 337,662,171 | |||||||
TIME DEPOSIT: 3.1% | ||||||||
State Street Euro Dollar Time Deposit, 0.010%, 01/03/17 |
| 10,623,000 | 10,623,000 | |||||
(Cost $10,623,000) | ||||||||
TOTAL INVESTMENTS: 100.0% | ||||||||
(Cost $302,487,641) | 348,285,171 | |||||||
OTHER ASSETS AND LIABILITIES— (NET): 0.0% | (80,021 | ) | ||||||
NET ASSETS: 100.0% | $ | 348,205,150 | ||||||
(a) | Non-income producing security. |
(b) | Security or partial position of this security was on loan as of December 31, 2016. The total market value of securities on loan as of December 31, 2016 was $13,243,117. |
(c) | Rounds to less than 0.05%. |
SUMMARY OF INVESTMENTS BY COUNTRY
Percent of Net Assets | Value | Percent | ||||||
Belgium | $ | 4,821,376 | 1.4 | % | ||||
China | 4,255,748 | 1.2 | % | |||||
Finland | 6,367,021 | 1.8 | % | |||||
France | 21,864,928 | 6.3 | % | |||||
Germany | 19,186,154 | 5.5 | % | |||||
Hong Kong | 6,258,486 | 1.8 | % | |||||
Ireland | 4,023,568 | 1.2 | % | |||||
Japan | 38,956,986 | 11.0 | % | |||||
Norway | 6,553,831 | 1.9 | % | |||||
Spain | 5,063,519 | 1.5 | % | |||||
Switzerland | 7,214,981 | 2.1 | % | |||||
Taiwan | 6,953,740 | 2.0 | % | |||||
United Kingdom | 31,238,828 | 8.9 | % | |||||
United States | 174,903,005 | 50.3 | % | |||||
Time Deposit | 10,623,000 | 3.1 | % | |||||
Other assets and liabilities - (net) | (80,021 | ) | 0.0 | %(c) | ||||
Total | $ | 348,205,150 | 100.0 | % | ||||
SEE NOTES TO FINANCIAL STATEMENTS
91
December 31, 2016
|
Schedule of Investments, continued |
Pax Core Bond Fund
Percent of Net Assets | Shares/Principal | Value | ||||||
BONDS: 97.6% | ||||||||
Community Investment Notes: 0.6% | ||||||||
Calvert Social Investment Foundation, Inc., 1.500%, 04/30/20 | $ | 3,000,000 | $ | 3,000,000 | ||||
CINI Investment Note, 2.000%, 11/01/17 (a)(b) | 265,516 | 265,516 | ||||||
Envest Microfinance Fund, LLC, Sr. Note, Series A, 4.000%, 09/15/20 (a) | 100,000 | 97,752 | ||||||
TOTAL COMMUNITY INVESTMENT NOTES | ||||||||
(Cost $3,365,516) | 3,363,268 | |||||||
CORPORATE BONDS: 28.0% | ||||||||
Consumer Discretionary: 2.6% | ||||||||
Home Depot, Inc., The, 3.000%, 04/01/26 | 2,000,000 | 1,998,564 | ||||||
Marriott International, Inc., 3.250%, 09/15/22 | 3,000,000 | 3,028,875 | ||||||
MGM Resorts International, 4.625%, 09/01/26 | 2,000,000 | 1,935,000 | ||||||
Newell Brands, Inc., 2.050%, 12/01/17 | 170,000 | 170,601 | ||||||
Ross Stores, Inc., 3.375%, 09/15/24 | 3,000,000 | 3,025,872 | ||||||
Sirius XM Radio, Inc., 144A, 4.625%, 05/15/23 (c) | 1,500,000 | 1,490,625 | ||||||
Time Warner Cable LLC, 6.750%, 07/01/18 | 1,000,000 | 1,068,001 | ||||||
TJX Cos, Inc., The, 2.250%, 09/15/26 | 1,000,000 | 922,171 | ||||||
Walt Disney Co., The, 3.750%, 06/01/21 | 2,026,000 | 2,152,568 | ||||||
15,792,277 | ||||||||
Consumer Staples: 2.3% | ||||||||
Aramark Services, Inc., 144A, 4.750%, 06/01/26 (c) | 1,000,000 | 992,500 | ||||||
Campbell Soup Co., 3.300%, 03/19/25 | 3,000,000 | 3,018,435 | ||||||
Coca-Cola Refreshments USA, Inc., 6.750%, 09/15/28 | 1,000,000 | 1,285,118 | ||||||
General Mills, Inc., 5.650%, 02/15/19 | 2,500,000 | 2,689,205 | ||||||
Kimberly-Clark Corp., 2.650%, 03/01/25 |
| 2,000,000 |
| 1,947,548 | ||||
Lamb Weston Holdings, Inc., 144A, 4.625%, 11/01/24 (c) | 1,500,000 | 1,507,500 | ||||||
Lamb Weston Holdings, Inc., 144A, 4.875%, 11/01/26 (c) | 500,000 | 495,938 | ||||||
PepsiCo, Inc., 2.375%, 10/06/26 | 2,000,000 | 1,895,788 | ||||||
13,832,032 | ||||||||
Energy: 2.4% | ||||||||
AmeriGas Partners LP / Finance Corp., 5.875%, 08/20/26 | 1,000,000 | 1,020,000 | ||||||
Antero Midstream Partners LP, 144A, 5.375%, 09/15/24 (c) | 1,000,000 | 1,015,000 | ||||||
ConocoPhillips Co., 2.875%, 11/15/21 | 3,000,000 | 3,026,175 | ||||||
Hess Corp, 3.500%, 07/15/24 | 2,000,000 | 1,928,156 | ||||||
Noble Energy, Inc., 3.900%, 11/15/24 | 2,000,000 | 2,018,538 | ||||||
Occidental Petroleum Corp., 3.500%, 06/15/25 | 2,000,000 | 2,030,404 | ||||||
ONEOK Partners, LP, 8.625%, 03/01/19 | 2,000,000 | 2,257,166 | ||||||
Sabine Pass Liquefaction LLC, 144A, 5.000%, 03/15/27 (c) | 1,000,000 | 1,012,500 | ||||||
14,307,939 | ||||||||
Financials: 11.9% | ||||||||
Ally Financial, Inc., 3.250%, 11/05/18 | 2,000,000 | 2,007,500 | ||||||
American Express Co., 7.000%, 03/19/18 | 1,000,000 | 1,063,003 | ||||||
Asian Development Bank, 2.125%, 03/19/25 | 2,000,000 | 1,932,658 | ||||||
Bank of America Corp., 1.950%, 05/12/18 | 3,000,000 | 3,005,211 | ||||||
Bank of America Corp., 2.151%, 11/09/20 | 2,000,000 | 1,975,812 | ||||||
SEE NOTES TO FINANCIAL STATEMENTS
92
December 31, 2016
|
Schedule of Investments, continued |
Pax Core Bond Fund, continued
Percent of Net Assets | Shares/Principal | Value | ||||||
BONDS, continued | ||||||||
CORPORATE BONDS, continued | ||||||||
Financials, continued | ||||||||
Bank of America Corp., 3.300%, 01/11/23 | $ | 1,000,000 | $ | 1,004,700 | ||||
Bank of America Corp., 3.500%, 04/19/26 | 1,000,000 | 988,613 | ||||||
Bank of New York Mellon Corp., The, 2.450%, 08/17/26 | 1,000,000 | 930,376 | ||||||
BlackRock, Inc., 3.375%, 06/01/22 | 2,350,000 | 2,438,146 | ||||||
CIT Group, Inc., 5.000%, 08/15/22 | 1,000,000 | 1,045,000 | ||||||
Discover Bank, 3.200%, 08/09/21 | 1,000,000 | 1,006,908 | ||||||
Discover Bank, 4.250%, 03/13/26 | 1,300,000 | 1,326,850 | ||||||
Fifth Third Bank, 2.250%, 06/14/21 | 1,000,000 | 989,254 | ||||||
Ford Motor Credit Co., LLC, 1.886%, 11/20/18 | 3,000,000 | 2,997,405 | ||||||
Ford Motor Credit Co., LLC, 1.783%, 03/12/19 | 1,000,000 | 1,001,784 | ||||||
Ford Motor Credit Co., LLC, 8.125%, 01/15/20 | 2,000,000 | 2,307,936 | ||||||
GE Capital International Funding Co. Unlimited Co., 4.418%, 11/15/35 | 2,000,000 | 2,099,868 | ||||||
Goldman Sachs Group, Inc., The, 2.087%, 04/30/18 | 4,000,000 | 4,035,628 | ||||||
Goldman Sachs Group, Inc., The, 6.750%, 10/01/37 | 2,000,000 | 2,477,180 | ||||||
ING Bank NV, 144A, 2.000%, 11/26/18 (c) | 2,000,000 | 1,999,756 | ||||||
International Bank for Reconstruction & Development, 0.625%, 07/12/17 | 2,000,000 | 1,992,760 | ||||||
International Bank for Reconstruction & Development, 2.125%, 03/03/25 | 4,000,000 | 3,856,712 | ||||||
International Finance Corp., 2.000%, 09/15/24 | 3,000,000 | 2,997,834 | ||||||
International Lease Finance Corp., 4.625%, 04/15/21 |
| 1,000,000 |
| 1,038,750 | ||||
JPMorgan Chase & Co., 2.972%, 01/15/23 | 2,000,000 | 1,994,942 | ||||||
JPMorgan Chase & Co., 2.950%, 10/01/26 | 2,000,000 | 1,911,370 | ||||||
Morgan Stanley, 1.918%, 04/25/18 | 4,000,000 | 4,042,636 | ||||||
Morgan Stanley, 3.100%, 11/09/18 | 1,177,000 | 1,183,566 | ||||||
Morgan Stanley, 2.200%, 12/07/18 | 2,000,000 | 2,008,304 | ||||||
North American Development Bank, 2.400%, 10/26/22 | 2,000,000 | 1,943,088 | ||||||
PNC Bank NA, 6.875%, 04/01/18 | 2,000,000 | 2,119,520 | ||||||
Prudential Financial, Inc., 7.375%, 06/15/19 | 2,000,000 | 2,252,692 | ||||||
Raymond James Financial, Inc., 3.625%, 09/15/26 | 1,000,000 | 977,197 | ||||||
State Street Corp., 4.956%, 03/15/18 | 2,010,000 | 2,077,176 | ||||||
Toyota Motor Credit Corp., 4.250%, 01/11/21 | 1,480,000 | 1,590,370 | ||||||
Toyota Motor Credit Corp., 1.900%, 04/08/21 | 500,000 | 490,203 | ||||||
Travelers Cos, Inc., The, 3.750%, 05/15/46 | 1,000,000 | 946,062 | ||||||
U.S. Bancorp, 1.950%, 11/15/18 | 2,064,000 | 2,075,042 | ||||||
72,131,812 | ||||||||
Health Care: 2.2% | ||||||||
Becton Dickinson & Co., 3.250%, 11/12/20 | 1,000,000 | 1,029,113 | ||||||
Becton Dickinson & Co., 7.000%, 08/01/27 | 2,250,000 | 2,822,603 | ||||||
Care Capital Properties LP, 144A, 5.125%, 08/15/26 (c) | 2,000,000 | 1,951,872 | ||||||
SEE NOTES TO FINANCIAL STATEMENTS
93
December 31, 2016
|
Schedule of Investments, continued |
Pax Core Bond Fund, continued
Percent of Net Assets | Shares/Principal | Value | ||||||
BONDS, continued | ||||||||
CORPORATE BONDS, continued | ||||||||
Health Care, continued | ||||||||
Celgene Corp., 3.950%, 10/15/20 | $ | 2,000,000 | $ | 2,092,706 | ||||
Gilead Sciences, Inc., 3.700%, 04/01/24 | 2,000,000 | 2,054,740 | ||||||
HCA, Inc., 4.500%, 02/15/27 | 1,500,000 | 1,477,500 | ||||||
Merck & Co., Inc., 2.350%, 02/10/22 | 2,000,000 | 1,987,404 | ||||||
13,415,938 | ||||||||
Industrials: 1.9% | ||||||||
Cummins, Inc., 7.125%, 03/01/28 | 1,000,000 | 1,299,052 | ||||||
Ingersoll-Rand Co., 6.443%, 11/15/27 | 2,000,000 | 2,382,556 | ||||||
Ryder System, Inc., 2.500%, 05/11/20 | 2,000,000 | 1,992,442 | ||||||
SolarCity Corp., 4.700%, 05/29/25 | 2,000,000 | 1,977,410 | ||||||
United Parcel Service, Inc., 5.500%, 01/15/18 | 1,000,000 | 1,042,355 | ||||||
Waste Management, Inc., 2.900%, 09/15/22 | 2,500,000 | 2,516,170 | ||||||
11,209,985 | ||||||||
Information Technology: 2.7% | ||||||||
Adobe Systems, Inc., 4.750%, 02/01/20 | 1,150,000 | 1,236,497 | ||||||
Apple, Inc., 2.850%, 05/06/21 | 2,500,000 | 2,553,423 | ||||||
CA, Inc., 5.375%, 12/01/19 | 3,000,000 | 3,242,310 | ||||||
Cisco Systems, Inc., 1.431%, 03/01/19 | 2,000,000 | 2,012,052 | ||||||
Corning, Inc., 8.875%, 08/15/21 | 2,000,000 | 2,468,424 | ||||||
eBay, Inc., 3.800%, 03/09/22 | 2,000,000 | 2,068,648 | ||||||
Microsoft Corp., 2.400%, 08/08/26 | 1,000,000 | 945,897 | ||||||
NetApp, Inc., 3.250%, 12/15/22 | 671,000 | 665,482 | ||||||
NVIDIA Corp., 2.200%, 09/16/21 | 1,000,000 | 977,183 | ||||||
16,169,916 | ||||||||
Materials: 0.5% | ||||||||
LyondellBasell Industries NV, 6.000%, 11/15/21 |
| 2,000,000 |
| 2,270,450 | ||||
Steel Dynamics, Inc., 144A, 5.000%, 12/15/26 (c) | 500,000 | 499,375 | ||||||
2,769,825 | ||||||||
Real Estate: 0.6% | ||||||||
American Tower Corp., REIT, 2.250%, 01/15/22 | 2,000,000 | 1,917,992 | ||||||
Digital Realty Trust LP, REIT, 3.950%, 07/01/22 | 1,750,000 | 1,800,425 | ||||||
3,718,417 | ||||||||
Telecommunication Services: 0.4% | ||||||||
Verizon Communications, Inc., 3.500%, 11/01/24 | 2,500,000 | 2,496,215 | ||||||
Utilities: 0.5% | ||||||||
CenterPoint Energy Houston Electric LLC, 2.250%, 08/01/22 | 1,000,000 | 978,639 | ||||||
Southern Power Co., 4.150%, 12/01/25 | 2,000,000 | 2,076,082 | ||||||
3,054,721 | ||||||||
TOTAL CORPORATE BONDS | ||||||||
(Cost $167,985,737) | 168,899,077 | |||||||
U.S. GOVERNMENT AGENCY BONDS: 3.4% | ||||||||
Federal Farm Credit Bank (Agency): 2.0% | ||||||||
1.120%, 08/20/18 | 4,000,000 | 3,981,583 | ||||||
1.140%, 09/04/18 | 3,500,000 | 3,476,218 | ||||||
1.875%, 03/02/22 | 2,000,000 | 1,982,196 | ||||||
1.770%, 10/05/23 | 2,465,000 | 2,352,902 | ||||||
11,792,899 | ||||||||
Federal Home Loan Bank System (Agency): 0.2% | ||||||||
2.375%, 03/12/21 | 1,000,000 | 1,016,184 | ||||||
Fannie Mae (Agency): 1.2% | ||||||||
1.050%, 05/25/18 | 3,000,000 | 2,994,159 | ||||||
1.000%, 12/20/18 | 4,000,000 | 3,981,504 | ||||||
6,975,663 | ||||||||
TOTAL U.S. GOVERNMENT AGENCY BONDS | ||||||||
(Cost $19,919,585) | 19,784,746 | |||||||
SEE NOTES TO FINANCIAL STATEMENTS
94
December 31, 2016
|
Schedule of Investments, continued |
Pax Core Bond Fund, continued
Percent of Net Assets | Shares/Principal | Value | ||||||
BONDS, continued | ||||||||
GOVERNMENT BONDS: 0.9% | ||||||||
U.S. Dept of Housing & Urban Development, 4.620%, 08/01/18 | $ | 5,000,000 | $ | 5,256,520 | ||||
(Cost $4,992,320) | ||||||||
MUNICIPAL BONDS: 5.2% | ||||||||
American Municipal Power, Inc., 6.973%, 02/15/24 | 2,000,000 | 2,413,740 | ||||||
City of Napa CA Solid Waste Revenue, 2.890%, 08/01/31 | 1,500,000 | 1,418,325 | ||||||
City of San Francisco CA Public Utilities Commission, 6.000%, 11/01/40 | 2,815,000 | 3,413,187 | ||||||
Commonwealth of Massachusetts, 4.200%, 12/01/21 | 2,000,000 | 2,154,840 | ||||||
Dallas Independent School District, 6.450%, 02/15/35 | 1,000,000 | 1,144,270 | ||||||
Kentucky State Property & Building Commission, 5.373%, 11/01/25 | 2,000,000 | 2,217,400 | ||||||
Long Island Power Authority, 3.983%, 09/01/25 | 2,000,000 | 2,067,640 | ||||||
Metropolitan Water Reclamation District of Greater Chicago, 4.000%, 12/01/36 | 1,000,000 | 919,480 | ||||||
New Jersey Transportation Trust Fund Authority, 6.104%, 12/15/28 | 2,500,000 | 2,655,150 | ||||||
New York City Transitional Finance Authority, 3.190%, 08/01/25 | 2,000,000 | 1,993,900 | ||||||
New York City Transitional Finance Authority, 4.100%, 11/01/27 | 2,550,000 | 2,683,748 | ||||||
Santa Clara Valley Water District, 3.369%, 06/01/27 | 1,305,000 | 1,311,029 | ||||||
State Board of Administration Finance Corp., Ser A, 2.995%, 07/01/20 |
| 1,000,000 |
| 1,029,440 | ||||
State of California, 5.000%, 10/01/28 | 1,000,000 | 1,165,700 | ||||||
University of California, 4.059%, 05/15/31 | 2,800,000 | 2,821,896 | ||||||
University of Massachusetts Building Authority, 6.573%, 05/01/39 | 1,800,000 | 1,946,736 | ||||||
TOTAL MUNICIPAL BONDS | ||||||||
(Cost $32,094,162) | 31,356,481 | |||||||
U.S. TREASURY NOTES: 30.9% | ||||||||
0.125%, 04/15/18 | 1,024,766 | 1,034,357 | ||||||
1.750%, 09/30/19 | 8,000,000 | 8,080,160 | ||||||
1.000%, 10/15/19 | 6,000,000 | 5,936,604 | ||||||
1.250%, 07/15/20 (TIPS) | 4,433,480 | 4,684,406 | ||||||
2.125%, 09/30/21 | 10,000,000 | 10,090,430 | ||||||
2.000%, 10/31/21 | 3,000,000 | 3,009,198 | ||||||
2.000%, 11/15/21 | 3,000,000 | 3,008,790 | ||||||
1.750%, 11/30/21 | 36,000,000 | 35,736,336 | ||||||
0.375%, 07/15/23 (TIPS) | 2,077,360 | 2,097,677 | ||||||
2.125%, 11/30/23 | 15,000,000 | 14,902,440 | ||||||
2.375%, 08/15/24 | 39,000,000 | 39,188,136 | ||||||
0.625%, 01/15/26 (TIPS) | 3,051,870 | 3,080,396 | ||||||
1.625%, 02/15/26 | 5,000,000 | 4,672,755 | ||||||
1.625%, 05/15/26 | 12,000,000 | 11,192,112 | ||||||
0.125%, 07/15/26 (TIPS) | 3,025,260 | 2,927,157 | ||||||
6.250%, 05/15/30 | 4,000,000 | 5,660,080 | ||||||
4.500%, 02/15/36 | 9,000,000 | 11,391,156 | ||||||
4.375%, 11/15/39 | 4,000,000 | 4,939,296 | ||||||
3.125%, 08/15/44 | 15,000,000 | 15,185,160 | ||||||
TOTAL U.S. TREASURY NOTES | ||||||||
(Cost $188,848,169) | 186,816,646 | |||||||
MORTGAGE-BACKED SECURITIES: 28.6% | ||||||||
Ginnie Mae (Mortgage-Backed): 3.2% | ||||||||
2.000%, 11/20/33 | 1,576,863 | 1,636,947 | ||||||
2.125%, 05/20/34 | 1,710,413 | 1,777,361 | ||||||
2.125%, 08/20/34 | 935,345 | 974,795 | ||||||
2.125%, 04/20/35 | 1,625,811 | 1,689,553 | ||||||
SEE NOTES TO FINANCIAL STATEMENTS
95
December 31, 2016
|
Schedule of Investments, continued |
Pax Core Bond Fund, continued
Percent of Net Assets | Shares/Principal | Value | ||||||
BONDS, continued | ||||||||
MORTGAGE-BACKED SECURITIES, continued | ||||||||
Ginnie Mae (Mortgage-Backed), continued | ||||||||
2.125%, 07/20/35 | $ | 1,257,041 | $ | 1,311,068 | ||||
6.000%, 01/15/38 | 430,156 | 501,365 | ||||||
3.020%, 09/15/41 | 1,987,121 | 1,905,211 | ||||||
2.125%, 06/20/43 | 1,436,460 | 1,477,487 | ||||||
4.000%, 02/20/45 | 1,147,692 | 1,220,396 | ||||||
3.458%, 05/16/53 | 2,432,011 | 2,469,468 | ||||||
2.900%, 10/16/53 | 1,795,353 | 1,781,014 | ||||||
2.582%, 03/16/55 | 2,408,588 | 2,370,870 | ||||||
19,115,535 | ||||||||
Freddie Mac (Mortgage-Backed): 6.7% | ||||||||
2.313%, 03/25/20 | 4,000,000 | 4,051,013 | ||||||
3.062%, 12/25/24 | 2,250,000 | 2,300,940 | ||||||
3.000%, 11/01/26 | 1,439,299 | 1,478,358 | ||||||
3.500%, 06/01/28 | 1,433,661 | 1,502,956 | ||||||
3.000%, 11/01/28 | 1,589,966 | 1,634,758 | ||||||
3.500%, 01/01/29 | 1,266,116 | 1,326,439 | ||||||
4.000%, 08/01/31 | 1,703,440 | 1,808,635 | ||||||
3.000%, 07/01/33 | 2,310,026 | 2,345,522 | ||||||
3.500%, 01/01/34 | 2,146,647 | 2,227,105 | ||||||
3.500%, 03/01/35 | 1,558,923 | 1,611,283 | ||||||
4.000%, 10/01/35 | 2,988,082 | 3,175,034 | ||||||
2.619%, 12/01/35 | 962,538 | 1,018,647 | ||||||
2.750%, 01/01/38 | 1,018,956 | 1,078,160 | ||||||
5.500%, 10/01/39 | 518,965 | 575,855 | ||||||
2.747%, 12/01/39 | 2,348,471 | 2,482,334 | ||||||
3.500%, 01/01/41 | 1,280,114 | 1,319,083 | ||||||
3.000%, 01/15/42 | 1,946,000 | 1,869,070 | ||||||
3.500%, 04/01/42 | 1,659,464 | 1,709,877 | ||||||
2.437%, 01/01/43 | 2,619,918 | 2,647,496 | ||||||
4.000%, 08/01/44 | 1,715,546 | 1,814,830 | ||||||
3.500%, 02/01/45 | 2,434,900 | 2,513,456 | ||||||
40,490,851 | ||||||||
Fannie Mae (Mortgage-Backed): 16.7% | ||||||||
3.500%, 01/01/26 | 1,080,090 | 1,127,639 | ||||||
3.500%, 02/01/26 | 905,959 | 945,802 | ||||||
2.480%, 08/01/26 | 2,000,000 | 1,912,124 | ||||||
2.270%, 09/01/26 | 2,000,000 | 1,868,210 | ||||||
4.000%, 10/01/26 | 1,512,048 | 1,595,178 | ||||||
3.000%, 11/01/26 | 2,346,077 | 2,413,668 | ||||||
3.500%, 12/01/26 | 1,717,298 | 1,794,820 | ||||||
2.500%, 03/01/27 | 1,249,889 | 1,254,108 | ||||||
2.500%, 06/01/27 | 3,723,858 | 3,736,494 | ||||||
2.500%, 09/01/27 | 1,655,272 | 1,660,886 | ||||||
2.500%, 12/01/27 | 2,410,305 | 2,418,474 | ||||||
3.000%, 09/01/28 |
| 2,317,531 |
| 2,382,615 | ||||
4.000%, 01/01/31 | 1,446,904 | 1,535,373 | ||||||
4.000%, 02/01/31 | 818,469 | 868,567 | ||||||
4.000%, 01/01/32 | 1,508,559 | 1,622,812 | ||||||
2.679%, 03/01/34 | 2,360,997 | 2,487,731 | ||||||
4.500%, 04/01/34 | 1,984,139 | 2,148,083 | ||||||
4.000%, 05/01/34 | 1,371,189 | 1,454,187 | ||||||
2.805%, 07/01/34 | 852,335 | 899,862 | ||||||
3.500%, 07/01/35 | 2,467,871 | 2,565,384 | ||||||
3.000%, 09/01/35 | 2,550,955 | 2,586,271 | ||||||
2.548%, 10/01/35 | 1,700,733 | 1,772,245 | ||||||
4.000%, 07/01/36 | 1,922,195 | 2,044,645 | ||||||
2.760%, 09/01/37 | 2,173,097 | 2,283,998 | ||||||
2.708%, 09/01/39 | 2,213,261 | 2,325,817 | ||||||
6.000%, 06/01/40 | 1,037,706 | 1,199,851 | ||||||
5.000%, 06/01/40 | 1,636,759 | 1,808,639 | ||||||
3.500%, 12/01/40 | 1,811,588 | 1,868,738 | ||||||
4.000%, 01/01/41 | 2,019,577 | 2,132,602 | ||||||
4.000%, 02/01/41 | 1,512,341 | 1,605,983 | ||||||
4.500%, 03/01/41 | 1,751,933 | 1,888,948 | ||||||
3.500%, 10/01/41 | 1,693,246 | 1,747,057 | ||||||
3.000%, 03/01/42 | 1,749,231 | 1,748,737 | ||||||
2.716%, 04/01/42 | 1,427,649 | 1,460,688 | ||||||
3.500%, 07/01/42 | 2,083,676 | 2,149,683 | ||||||
2.070%, 09/01/42 | 1,262,363 | 1,329,706 | ||||||
3.000%, 06/01/43 | 1,472,930 | 1,472,971 | ||||||
2.766%, 09/01/43 | 2,122,772 | 2,195,029 | ||||||
3.066%, 08/01/44 | 1,756,231 | 1,825,645 | ||||||
4.000%, 01/01/45 | 1,845,216 | 1,941,364 | ||||||
3.500%, 04/01/45 | 1,596,849 | 1,638,520 | ||||||
4.000%, 06/01/45 | 2,313,396 | 2,451,126 | ||||||
3.500%, 08/01/45 | 4,642,885 | 4,783,767 | ||||||
4.000%, 09/01/45 | 2,576,653 | 2,723,760 | ||||||
4.000%, 10/01/45 | 4,157,232 | 4,376,171 | ||||||
3.500%, 10/01/45 | 2,697,359 | 2,770,655 | ||||||
4.000%, 11/01/45 | 2,483,714 | 2,613,509 | ||||||
3.500%, 06/01/46 | 1,938,170 | 1,994,919 | ||||||
3.000%, 06/01/46 | 1,933,169 | 1,923,167 | ||||||
3.000%, 10/01/46 | 1,992,654 | 1,982,345 | ||||||
101,338,573 | ||||||||
SEE NOTES TO FINANCIAL STATEMENTS
96
December 31, 2016
|
Schedule of Investments, continued |
Pax Core Bond Fund, continued
Percent of Net Assets | Shares/Principal | Value | ||||||
BONDS, continued | ||||||||
MORTGAGE-BACKED SECURITIES, continued | ||||||||
Commercial Mortgage-Backed: 2.0% | ||||||||
FREMF Mortgage Trust, 144A, 5.449%, 04/25/20 (c) | $ | 3,264,000 | $ | 3,546,945 | ||||
FREMF Mortgage Trust, 144A, 5.167%, 02/25/47 (c) | 3,300,000 | 3,612,444 | ||||||
FREMF Mortgage Trust, 3.565%, 11/25/47 (c) | 2,000,000 | 1,954,297 | ||||||
FREMF Mortgage Trust, 144A, 4.610%, 01/25/48 (c) | 2,986,504 | 3,192,587 | ||||||
12,306,273 | ||||||||
TOTAL MORTGAGE-BACKED SECURITIES | ||||||||
(Cost $174,446,080) | 173,251,232 | |||||||
TOTAL BONDS | ||||||||
(Cost $591,651,569) | 588,727,970 | |||||||
CERTIFICATES OF DEPOSIT: 0.1% | ||||||||
Hope Community Credit Union, 1.300%, 05/07/17 | 100,000 | 100,000 | ||||||
Urban Partnership Bank, 0.200%, 07/01/17 | 248,000 | 248,000 | ||||||
TOTAL CERTIFICATES OF DEPOSIT | ||||||||
(Cost $348,000) | 348,000 | |||||||
MONEY MARKET: 0.1% | ||||||||
Self Help Credit Union Money Market Account | 422,388 | 422,388 | ||||||
(Cost $422,388) | ||||||||
TIME DEPOSIT: 1.6% | ||||||||
State Street Euro Dollar Time Deposit, 0.010%, 01/03/17 |
| 9,539,000 |
| 9,539,000 | ||||
(Cost $9,539,000) | ||||||||
TOTAL INVESTMENTS: 99.4% | ||||||||
(Cost $601,960,957) | 599,037,358 | |||||||
OTHER ASSETS AND LIABILITIES— (NET): 0.6% | 3,455,151 | |||||||
NET ASSETS: 100.0% | $ | 602,492,509 | ||||||
(a) | Fair valued security. |
(b) | Illiquid security. |
(c) | Security purchased pursuant to Rule 144A of the Securities Act of 1933 and may be resold only to qualified institutional buyers. |
LP | Limited Partnership |
REIT | Real Estate Investment Trust |
TIPS | Treasury Inflation Protected Securities |
SEE NOTES TO FINANCIAL STATEMENTS
97
December 31, 2016
|
Schedule of Investments, continued |
Pax High Yield Bond Fund
Percent of Net Assets | Shares/Principal/ Contracts | Value | ||||||
COMMON STOCKS: 0.1% | ||||||||
Energy: 0.1% | ||||||||
ION Geophysical Corp. (d) | 50,000 | $ | 300,000 | |||||
Health Care: 0.0% | ||||||||
Interactive Health, Inc. (b)(c)(d) | 706 | 0 | ||||||
TOTAL COMMON STOCKS | ||||||||
(Cost $921,481) | 300,000 | |||||||
PREFERRED STOCKS: 0.0% (e) | ||||||||
Health Care: 0.0% | ||||||||
Interactive Health, Inc., 0.000% (b)(c) | 1,412 | 0 | ||||||
(Cost $357,962) | ||||||||
BONDS: 94.6% | ||||||||
CORPORATE BONDS: 90.9% | ||||||||
Automotive: 2.2% | ||||||||
Allison Transmission, Inc., 144A, 5.000%, 10/01/24 (a) |
| 1,900,000 | 1,923,750 | |||||
IHO Verwaltungs GmbH, 144A, 4.500%, 09/15/23 (a) | 1,450,000 | 1,421,000 | ||||||
Meritor, Inc., 6.750%, 06/15/21 | 1,000,000 | 1,027,500 | ||||||
Meritor, Inc., 6.250%, 02/15/24 | 1,000,000 | 985,000 | ||||||
MPG Holdco I, Inc., 7.375%, 10/15/22 | 950,000 | 997,500 | ||||||
Nexteer Automotive Group Ltd, 144A, 5.875%, 11/15/21 (a) | 1,000,000 | 1,042,500 | ||||||
TI Group Automotive Systems LLC, 144A, 8.750%, 07/15/23 (a) | 1,500,000 | 1,575,000 | ||||||
8,972,250 | ||||||||
Banking: 4.1% | ||||||||
Ally Financial, Inc., 3.250%, 11/05/18 | 1,000,000 | 1,003,750 | ||||||
Ally Financial, Inc., 3.500%, 01/27/19 | 1,500,000 | 1,511,250 | ||||||
Ally Financial, Inc., 4.250%, 04/15/21 |
| 2,000,000 |
| 2,023,750 | ||||
Ally Financial, Inc., 4.125%, 02/13/22 | 2,300,000 | 2,285,625 | ||||||
Ally Financial, Inc., 5.750%, 11/20/25 | 3,750,000 | 3,754,688 | ||||||
CIT Group, Inc., 144A, 5.000%, 05/15/18 (a) | 1,000,000 | 1,015,000 | ||||||
CIT Group, Inc., 5.000%, 08/01/23 | 1,000,000 | 1,035,000 | ||||||
Citigroup, Inc, 5.950%, 05/15/25 | 3,000,000 | 2,966,850 | ||||||
Royal Bank of Scotland Group PLC, 5.125%, 05/28/24 | 900,000 | 898,741 | ||||||
16,494,654 | ||||||||
Basic Industry: 8.7% | ||||||||
Alcoa Nederland Holding BV, 144A, 7.000%, 09/30/26 (a) | 200,000 | 219,500 | ||||||
Aleris International, Inc., 7.875%, 11/01/20 | 1,000,000 | 1,007,500 | ||||||
Aleris International, Inc., 144A, 9.500%, 04/01/21 (a) | 1,400,000 | 1,508,500 | ||||||
Barminco Finance Pty, Ltd., 144A, 9.000%, 06/01/18 (a) | 1,069,000 | 1,103,743 | ||||||
BlueScope Steel Finance, Ltd/USA LLC, 144A, 6.500%, 05/15/21 (a) | 900,000 | 955,890 | ||||||
Boise Cascade Co., 144A, 5.625%, 09/01/24 (a) | 950,000 | 947,625 | ||||||
Brookfield Residential Properties, Inc., 144A, 6.375%, 05/15/25 (a) | 1,400,000 | 1,403,500 | ||||||
Constellium NV, 144A, 7.875%, 04/01/21 (a) | 900,000 | 970,875 | ||||||
FBM Finance, Inc., 144A, 8.250%, 08/15/21 (a) | 2,000,000 | 2,120,000 | ||||||
First Quantum Minerals, Ltd., 144A, 7.250%, 10/15/19 (a) | 1,000,000 | 1,015,000 | ||||||
SEE NOTES TO FINANCIAL STATEMENTS
98
December 31, 2016
|
Schedule of Investments, continued |
Pax High Yield Bond Fund, continued
Percent of Net Assets | Shares/Principal/ Contracts | Value | ||||||
BONDS, continued | ||||||||
CORPORATE BONDS, continued | ||||||||
Basic Industry, continued | ||||||||
First Quantum Minerals, Ltd., 144A, 6.750%, 02/15/20 (a) | $ | 1,000,000 | $ | 1,002,500 | ||||
Lennar Corp., 4.750%, 05/30/25 | 1,000,000 | 980,000 | ||||||
Lundin Mining Corp., 144A, 7.500%, 11/01/20 (a) | 1,000,000 | 1,068,750 | ||||||
M/I Homes, Inc., 6.750%, 01/15/21 | 1,500,000 | 1,571,250 | ||||||
Petra Diamonds US Treasury PLC, 144A, 8.250%, 05/31/20 (a) | 1,900,000 | 1,971,250 | ||||||
Sappi Papier Holding GmbH, 144A, 7.500%, 06/15/32 (a) | 1,900,000 | 1,767,000 | ||||||
SPCM SA, 144A, 6.000%, 01/15/22 (a) | 2,400,000 | 2,501,999 | ||||||
Steel Dynamics, Inc., 144A, 5.000%, 12/15/26 (a) | 1,000,000 | 998,750 | ||||||
Summit Materials LLC / Finance Corp., 8.500%, 04/15/22 | 2,000,000 | 2,220,000 | ||||||
Taylor Morrison Communities, Inc./Monarch Communities, Inc., 144A, 5.625%, 03/01/24 (a) | 1,500,000 | 1,522,500 | ||||||
TRI Pointe Group, Inc., 4.875%, 07/01/21 | 1,400,000 | 1,431,500 | ||||||
US Concrete, Inc., 6.375%, 06/01/24 | 1,750,000 | 1,855,000 | ||||||
WESCO Distribution, Inc., 144A, 5.375%, 06/15/24 (a) | 1,900,000 | 1,909,500 | ||||||
Wise Metals Group LLC/Alloys Finance Corp., 144A, 8.750%, 12/15/18 (a) | 2,000,000 | 2,090,000 | ||||||
Xerium Technologies, Inc., 144A, 9.500%, 08/15/21 (a) | 950,000 | 950,000 | ||||||
35,092,132 | ||||||||
Capital Goods: 5.7% | ||||||||
Arconic, Inc., 5.870%, 02/23/22 |
| 1,000,000 |
| 1,075,000 | ||||
ARD Finance SA, 144A, 7.125%, 09/15/23 (a) | 3,000,000 | 2,973,750 | ||||||
Ardagh Packaging Finance PLC/ Holdings USA, Inc., 144A, 7.250%, 05/15/24 (a) | 2,000,000 | 2,115,000 | ||||||
Bombardier, Inc., 144A, 8.750%, 12/01/21 (a) | 2,400,000 | 2,553,000 | ||||||
CTP Transportation Products LLC/Finance, Inc., 144A, 8.250%, 12/15/19 (a) | 3,700,000 | 3,209,749 | ||||||
Milacron LLC/Mcron Finance Corp., 144A, 7.750%, 02/15/21 (a) | 2,950,000 | 3,045,875 | ||||||
PaperWorks Industries, Inc., 144A, 9.500%, 08/15/19 (a) | 3,000,000 | 2,610,000 | ||||||
Shape Technologies Group, Inc., 144A, 7.625%, 02/01/20 (a) | 1,650,000 | 1,695,375 | ||||||
SPX FLOW, Inc., 144A, 5.875%, 08/15/26 (a) | 500,000 | 501,250 | ||||||
Unifrax I, LLC/Holding Co., 144A, 7.500%, 02/15/19 (a) | 2,916,000 | 2,916,000 | ||||||
22,694,999 | ||||||||
Consumer Goods: 3.4% | ||||||||
Lamb Weston Holdings, Inc., 144A, 4.625%, 11/01/24 (a) | 1,475,000 | 1,482,375 | ||||||
Lamb Weston Holdings, Inc., 144A, 4.875%, 11/01/26 (a) | 1,450,000 | 1,438,219 | ||||||
Post Holdings, Inc., 144A, 6.000%, 12/15/22 (a) | 900,000 | 942,750 | ||||||
Post Holdings, Inc., 144A, 5.000%, 08/15/26 (a) | 2,000,000 | 1,920,000 | ||||||
Prestige Brands, Inc., 144A, 6.375%, 03/01/24 (a) | 2,000,000 | 2,110,000 | ||||||
Simmons Foods, Inc., 144A, 7.875%, 10/01/21 (a) | 3,800,000 | 3,923,500 | ||||||
SEE NOTES TO FINANCIAL STATEMENTS
99
December 31, 2016
|
Schedule of Investments, continued |
Pax High Yield Bond Fund, continued
Percent of Net Assets | Shares/Principal/ Contracts | Value | ||||||
BONDS, continued | ||||||||
CORPORATE BONDS, continued | ||||||||
Consumer Goods, continued | ||||||||
Tempur Sealy International, Inc., 5.500%, 06/15/26 | $ | 1,800,000 | $ | 1,813,500 | ||||
13,630,344 | ||||||||
Energy: 14.6% | ||||||||
Alta Mesa Holdings LP/Finance Services Corp., 144A, 7.875%, 12/15/24 (a) | 1,000,000 | 1,040,000 | ||||||
AmeriGas Partners LP / Finance Corp., 5.625%, 05/20/24 | 2,000,000 | 2,055,000 | ||||||
AmeriGas Partners LP / Finance Corp., 5.875%, 08/20/26 | 1,000,000 | 1,020,000 | ||||||
Antero Midstream Partners LP/Finance Corp., 144A, 5.375%, 09/15/24 (a) | 1,900,000 | 1,928,500 | ||||||
Antero Resources Corp., 5.375%, 11/01/21 | 3,000,000 | 3,078,750 | ||||||
Archrock Partners LP/Finance Corp., 6.000%, 04/01/21 | 2,250,000 | 2,193,750 | ||||||
Archrock Partners LP/Finance Corp., 6.000%, 10/01/22 | 1,000,000 | 975,000 | ||||||
Callon Petroleum Co., 144A, 6.125%, 10/01/24 (a) | 900,000 | 931,500 | ||||||
Chaparral Energy, Inc., 7.625%, 11/15/22 | 3,000,000 | 2,700,000 | ||||||
Concho Resources, Inc., 5.500%, 04/01/23 | 2,900,000 | 3,019,770 | ||||||
DCP Midstream LLC, 144A, 4.750%, 09/30/21 (a) | 1,650,000 | 1,678,875 | ||||||
DCP Midstream Operating LP, 3.875%, 03/15/23 | 900,000 | 870,192 | ||||||
Denbury Resources, Inc., 6.375%, 08/15/21 | 1,000,000 | 905,000 | ||||||
Ferrellgas LP/Finance Corp., 6.750%, 01/15/22 | 1,950,000 | 1,935,375 | ||||||
Genesis Energy LP / Finance Corp., 5.750%, 02/15/21 |
| 850,000 |
| 862,750 | ||||
Genesis Energy LP / Finance Corp., 6.000%, 05/15/23 | 1,000,000 | 1,022,500 | ||||||
Genesis Energy LP / Finance Corp., 5.625%, 06/15/24 | 1,450,000 | 1,431,875 | ||||||
Great Western Petroleum LLC/Finance Corp., 144A, 9.000%, 09/30/21 (a) | 1,000,000 | 1,045,000 | ||||||
ION Geophysical Corp., 144A, 9.125%, 12/15/21 (a)(b) | 5,000,000 | 3,200,000 | ||||||
Laredo Petroleum, Inc., 5.625%, 01/15/22 | 2,000,000 | 2,025,000 | ||||||
Laredo Petroleum, Inc., 6.250%, 03/15/23 | 1,350,000 | 1,404,000 | ||||||
Noble Holding International, Ltd., 7.750%, 01/15/24 | 1,900,000 | 1,791,890 | ||||||
Precision Drilling Corp., 144A, 7.750%, 12/15/23 (a) | 950,000 | 1,007,000 | ||||||
Pride International, Inc., 6.875%, 08/15/20 | 1,000,000 | 1,072,500 | ||||||
RSP Permian, Inc., 144A, 5.250%, 01/15/25 (a) | 950,000 | 957,125 | ||||||
Sabine Pass Liquefaction, LLC, 6.250%, 03/15/22 | 2,900,000 | 3,189,999 | ||||||
Sabine Pass Liquefaction, LLC, 144A, 5.875%, 06/30/26 (a) | 1,500,000 | 1,621,875 | ||||||
Sabine Pass Liquefaction, LLC, 144A, 5.000%, 03/15/27 (a) | 500,000 | 506,250 | ||||||
Southwestern Energy Co., 7.500%, 02/01/18 | 900,000 | 940,500 | ||||||
Southwestern Energy Co., 4.100%, 03/15/22 | 1,450,000 | 1,377,210 | ||||||
SEE NOTES TO FINANCIAL STATEMENTS
100
December 31, 2016
|
Schedule of Investments, continued |
Pax High Yield Bond Fund, continued
Percent of Net Assets | Shares/Principal/ Contracts | Value | ||||||
BONDS, continued | ||||||||
CORPORATE BONDS, continued | ||||||||
Energy, continued | ||||||||
Southwestern Energy Co., 6.700%, 01/23/25 | $ | 500,000 | $ | 513,750 | ||||
Sunoco LP / Sunoco Finance Corp., 6.250%, 04/15/21 | 950,000 | 970,188 | ||||||
Sunoco LP / Sunoco Finance Corp., 6.375%, 04/01/23 | 1,900,000 | 1,933,250 | ||||||
Targa Resources Partners LP/Finance Corp., 5.250%, 05/01/23 | 1,350,000 | 1,370,250 | ||||||
Targa Resources Partners LP/Finance Corp., 144A, 5.125%, 02/01/25 (a) | 1,400,000 | 1,394,750 | ||||||
Tesoro Logistics LP/Finance Corp., 6.125%, 10/15/21 | 1,000,000 | 1,052,500 | ||||||
Tesoro Logistics LP/Finance Corp., 6.375%, 05/01/24 | 900,000 | 967,500 | ||||||
Tesoro Logistics LP/Finance Corp., 5.250%, 01/15/25 | 950,000 | 973,750 | ||||||
Weatherford International, Ltd., 5.125%, 09/15/20 | 900,000 | 850,500 | ||||||
Weatherford International, Ltd., 144A, 9.875%, 02/15/24 (a) | 1,000,000 | 1,068,120 | ||||||
58,881,744 | ||||||||
Financial Services: 3.6% | ||||||||
AerCap Ireland Capital Ltd/Global Aviation Trust, 3.950%, 02/01/22 | 1,000,000 | 1,011,250 | ||||||
Fly Leasing, Ltd., 6.750%, 12/15/20 | 2,000,000 | 2,097,500 | ||||||
Fly Leasing, Ltd., 6.375%, 10/15/21 | 3,000,000 | 3,135,000 | ||||||
International Lease Finance Corp., 4.625%, 04/15/21 | 950,000 | 986,813 | ||||||
International Lease Finance Corp., 5.875%, 08/15/22 |
| 1,900,000 |
| 2,066,250 | ||||
KCG Holdings, Inc., 144A, 6.875%, 03/15/20 (a) | 1,400,000 | 1,407,000 | ||||||
Springleaf Finance Corp., 7.750%, 10/01/21 | 3,350,000 | 3,546,813 | ||||||
14,250,626 | ||||||||
Health Care: 8.0% | ||||||||
Care Capital Properties LP, 144A, 5.125%, 08/15/26 (a) | 3,350,000 | 3,269,386 | ||||||
Centene Corp., 5.625%, 02/15/21 | 450,000 | 474,255 | ||||||
Centene Corp., 6.125%, 02/15/24 | 900,000 | 950,625 | ||||||
DaVita, Inc., 5.125%, 07/15/24 | 1,850,000 | 1,848,844 | ||||||
DaVita, Inc., 5.000%, 05/01/25 | 1,000,000 | 986,250 | ||||||
Endo Finance, LLC/Finco, Inc., 144A, 7.250%, 01/15/22 (a) | 850,000 | 786,250 | ||||||
Endo, Ltd/ Finance, LLC/ Finco, Inc., 144A, 6.000%, 07/15/23 (a) | 1,100,000 | 969,375 | ||||||
HCA, Inc., 5.875%, 05/01/23 | 1,750,000 | 1,863,750 | ||||||
HCA, Inc., 5.875%, 02/15/26 | 5,850,000 | 6,040,124 | ||||||
HCA, Inc., 5.250%, 06/15/26 | 1,000,000 | 1,036,250 | ||||||
HCA, Inc., 4.500%, 02/15/27 | 950,000 | 935,750 | ||||||
inVentiv Group Holdings, Inc., 144A, 7.500%, 10/01/24 (a) | 1,000,000 | 1,052,400 | ||||||
Kindred Healthcare, Inc., 6.375%, 04/15/22 | 550,000 | 492,938 | ||||||
Kindred Healthcare, Inc., 8.750%, 01/15/23 | 1,500,000 | 1,408,125 | ||||||
LifePoint Health, Inc., 144A, 5.375%, 05/01/24 (a) | 2,800,000 | 2,749,600 | ||||||
SEE NOTES TO FINANCIAL STATEMENTS
101
December 31, 2016
|
Schedule of Investments, continued |
Pax High Yield Bond Fund, continued
Percent of Net Assets | Shares/Principal/ Contracts | Value | ||||||
BONDS, continued | ||||||||
CORPORATE BONDS, continued | ||||||||
Health Care, continued | ||||||||
Mallinckrodt International Finance SA/CB, LLC, 144A, 5.625%, 10/15/23 (a) | $ | 1,500,000 | $ | 1,406,250 | ||||
MEDNAX, Inc., 144A, 5.250%, 12/01/23 (a) | 2,850,000 | 2,942,625 | ||||||
MPT Operating Partnership LP/Finance Corp., 6.375%, 03/01/24 | 1,000,000 | 1,051,250 | ||||||
Tenet Healthcare Corp., 6.750%, 06/15/23 | 2,000,000 | 1,770,000 | ||||||
32,034,047 | ||||||||
Insurance: 0.4% | ||||||||
MGIC Investment Corp., 5.750%, 08/15/23 | 1,450,000 | 1,515,250 | ||||||
Leisure: 2.8% | ||||||||
Carlson Travel, Inc., 144A, 6.750%, 12/15/23 (a) | 950,000 | 990,375 | ||||||
Carlson Travel, Inc., 144A, 9.500%, 12/15/24 (a) | 1,000,000 | 1,048,750 | ||||||
Live Nation Entertainment, Inc., 144A, 4.875%, 11/01/24 (a) | 1,450,000 | 1,457,250 | ||||||
MGM Growth Properties Operating Partnership LP, 144A, 4.500%, 09/01/26 (a) | 1,900,000 | 1,833,500 | ||||||
MGM Resorts International, 4.625%, 09/01/26 | 900,000 | 870,750 | ||||||
NCL Corp., Ltd., 144A, 4.625%, 11/15/20 (a) | 1,750,000 | 1,789,375 | ||||||
NCL Corp., Ltd., 144A, 4.750%, 12/15/21 (a) | 1,950,000 | 1,953,666 | ||||||
Scientific Games International, Inc., 6.625%, 05/15/21 | 500,000 | 425,000 | ||||||
Scientific Games International, Inc., 10.000%, 12/01/22 | 1,000,000 | 1,000,000 | ||||||
11,368,666 | ||||||||
Media: 9.7% | ||||||||
Altice Financing SA, 144A, 6.500%, 01/15/22 (a) |
| 2,000,000 |
| 2,090,000 | ||||
Altice Financing SA, 144A, 6.625%, 02/15/23 (a) | 2,000,000 | 2,060,000 | ||||||
Altice Financing SA, 144A, 7.500%, 05/15/26 (a) | 3,750,000 | 3,909,374 | ||||||
CBS Radio, Inc., 144A, 7.250%, 11/01/24 (a) | 1,800,000 | 1,894,500 | ||||||
CCO Holdings LLC/Capital Corp., 144A, 5.875%, 04/01/24 (a) | 900,000 | 963,000 | ||||||
CCO Holdings LLC/Capital Corp., 144A, 5.750%, 02/15/26 (a) | 2,000,000 | 2,075,000 | ||||||
CCO Holdings LLC/Capital Corp., 144A, 5.500%, 05/01/26 (a) | 1,000,000 | 1,022,500 | ||||||
Camelot Finance SA, 144A, 7.875%, 10/15/24 (a) | 1,000,000 | 1,037,500 | ||||||
Columbus Cable Barbados, Ltd., 144A, 7.375%, 03/30/21 (a) | 2,600,000 | 2,776,514 | ||||||
Donnelley Financial Solutions, Inc., 144A, 8.250%, 10/15/24 (a) | 1,900,000 | 1,938,000 | ||||||
Gray Television, Inc., 144A, 5.125%, 10/15/24 (a) | 900,000 | 873,000 | ||||||
Harland Clarke Holdings Corp., 144A, 6.875%, 03/01/20 (a) | 2,500,000 | 2,425,000 | ||||||
Nexstar Broadcasting, Inc., 144A, 6.125%, 02/15/22 (a) | 2,000,000 | 2,080,000 | ||||||
SFR Group SA, 144A, 6.000%, 05/15/22 (a) | 2,000,000 | 2,060,000 | ||||||
SFR Group SA, 144A, 6.250%, 05/15/24 (a) | 900,000 | 907,875 | ||||||
SFR Group SA, 144A, 7.375%, 05/01/26 (a) | 1,900,000 | 1,954,625 | ||||||
Sirius XM Radio, Inc., 144A, 5.375%, 04/15/25 (a) | 4,000,000 | 3,990,000 | ||||||
Unitymedia GmbH, 144A, 6.125%, 01/15/25 (a) | 2,000,000 | 2,065,000 | ||||||
SEE NOTES TO FINANCIAL STATEMENTS
102
December 31, 2016
|
Schedule of Investments, continued |
Pax High Yield Bond Fund, continued
Percent of Net Assets | Shares/Principal/ Contracts | Value | ||||||
BONDS, continued | ||||||||
CORPORATE BONDS, continued | ||||||||
Media, continued | ||||||||
Virgin Media Finance PLC, 144A, 6.000%, 10/15/24 (a) | $ | 950,000 | $ | 982,063 | ||||
Virgin Media Secured Finance PLC, 144A, 5.500%, 08/15/26 (a) | 950,000 | 950,000 | ||||||
VTR Finance BV, 144A, 6.875%, 01/15/24 (a) | 900,000 | 931,500 | ||||||
38,985,451 | ||||||||
Real Estate: 2.3% | ||||||||
ESH Hospitality, Inc., 144A, 5.250%, 05/01/25 (a) | 2,800,000 | 2,793,000 | ||||||
iStar, Inc., 6.500%, 07/01/21 | 1,500,000 | 1,548,750 | ||||||
Kennedy-Wilson, Inc., 5.875%, 04/01/24 | 4,700,000 | 4,805,750 | ||||||
9,147,500 | ||||||||
Retail: 2.5% | ||||||||
CST Brands, Inc., 5.000%, 05/01/23 | 3,000,000 | 3,112,500 | ||||||
Ingles Markets, Inc., 5.750%, 06/15/23 | 1,000,000 | 1,032,500 | ||||||
JC Penney Corp., Inc., 5.650%, 06/01/20 | 2,000,000 | 1,982,500 | ||||||
Performance Food Group, Inc., 144A, 5.500%, 06/01/24 (a) | 900,000 | 909,000 | ||||||
Sally Holdings LLC/Capital, Inc., 5.625%, 12/01/25 | 3,000,000 | 3,135,000 | ||||||
10,171,500 | ||||||||
Services: 4.4% | ||||||||
Ahern Rentals, Inc., 144A, 7.375%, 05/15/23 (a) | 5,300,000 | 4,478,500 | ||||||
Alliance Data Systems Corp., 144A, 5.875%, 11/01/21 (a) | 1,900,000 | 1,933,250 | ||||||
Aramark Services, Inc., 144A, 4.750%, 06/01/26 (a) | 950,000 | 942,875 | ||||||
Avis Budget Car Rental LLC / Finance, Inc., 144A, 6.375%, 04/01/24 (a) | 1,800,000 | 1,806,750 | ||||||
Cloud Crane LLC, 144A, 10.125%, 08/01/24 (a) |
| 1,900,000 |
| 2,037,750 | ||||
Michael Baker Holdings LLC/Finance Corp., 144A, 8.875%, 04/15/19 (a) | 4,653,675 | 4,258,112 | ||||||
Prime Security Services Borrower LLC/Finance, Inc., 144A, 9.250%, 05/15/23 (a) | 1,000,000 | 1,091,250 | ||||||
Richie Bros Auctioneers, Inc., 144A, 5.375%, 01/15/25 (a) | 950,000 | 971,375 | ||||||
17,519,862 | ||||||||
Technology & Electronics: 4.9% | ||||||||
BCP Singapore VI Cayman Financing Co., Ltd., 144A, 8.000%, 04/15/21 (a) | 1,600,000 | 1,576,000 | ||||||
Diamond 1 Finance Corp/ 2 Finance Corp, 144A, 5.875%, 06/15/21 (a) | 950,000 | 1,011,081 | ||||||
Diamond 1 Finance Corp/ 2 Finance Corp, 144A, 7.125%, 06/15/24 (a) | 1,450,000 | 1,610,663 | ||||||
Entegris, Inc., 144A, 6.000%, 04/01/22 (a) | 1,510,000 | 1,576,063 | ||||||
First Data Corp., 144A, 7.000%, 12/01/23 (a) | 3,000,000 | 3,202,500 | ||||||
Inception Merger Sub, Inc./Rackspace Hosting, Inc., 144A, 8.625%, 11/15/24 (a) | 1,900,000 | 2,015,805 | ||||||
Micron Technology, Inc., 144A, 7.500%, 09/15/23 (a) | 900,000 | 999,000 | ||||||
Sensata Technologies UK Financing Co. PLC, 144A, 6.250%, 02/15/26 (a) | 900,000 | 945,000 | ||||||
Solera LLC / Finance, Inc., 144A, 10.500%, 03/01/24 (a) | 1,000,000 | 1,130,000 | ||||||
Syniverse Holdings, Inc., 9.125%, 01/15/19 | 5,013,000 | 4,411,440 | ||||||
Western Digital Corp., 144A, 7.375%, 04/01/23 (a) | 1,000,000 | 1,102,500 | ||||||
19,580,052 | ||||||||
SEE NOTES TO FINANCIAL STATEMENTS
103
December 31, 2016
|
Schedule of Investments, continued |
Pax High Yield Bond Fund, continued
Percent of Net Assets | Shares/Principal/ Contracts | Value | ||||||
BONDS, continued | ||||||||
CORPORATE BONDS, continued | ||||||||
Telecommunications: 9.9% | ||||||||
CenturyLink, Inc., 7.500%, 04/01/24 | $ | 1,900,000 | $ | 1,999,750 | ||||
Cogent Communications Group, Inc., 144A, 5.375%, 03/01/22 (a) | 3,100,000 | 3,216,250 | ||||||
Communications Sales & Leasing, Inc./CSL Capital LLC, 144A, 7.125%, 12/15/24 (a) | 1,000,000 | 1,012,500 | ||||||
Digicel, Ltd., 144A, 6.000%, 04/15/21 (a) | 1,900,000 | 1,727,992 | ||||||
Equinix, Inc., 5.750%, 01/01/25 | 1,000,000 | 1,050,000 | ||||||
Frontier Communications Corp., 10.500%, 09/15/22 | 4,000,000 | 4,220,200 | ||||||
Frontier Communications Corp., 6.875%, 01/15/25 | 900,000 | 766,125 | ||||||
Hughes Satellite Systems Corp., 144A, 5.250%, 08/01/26 (a) | 900,000 | 884,250 | ||||||
Inmarsat Finance PLC, 144A, 6.500%, 10/01/24 (a) | 950,000 | 966,625 | ||||||
Intelsat Jackson Holdings SA, 144A, 8.000%, 02/15/24 (a) | 950,000 | 980,875 | ||||||
Level 3 Communications, Inc., 5.750%, 12/01/22 | 900,000 | 927,000 | ||||||
Level 3 Financing, Inc., 5.375%, 01/15/24 | 1,000,000 | 1,012,500 | ||||||
Level 3 Financing, Inc., 144A, 5.250%, 03/15/26 (a) | 1,000,000 | 992,500 | ||||||
Sprint Communications, Inc., 8.375%, 08/15/17 | 4,000,000 | 4,155,000 | ||||||
Sprint Communications, Inc., 144A, 7.000%, 03/01/20 (a) | 1,000,000 | 1,087,500 | ||||||
Sprint Communications, Inc., 6.000%, 11/15/22 |
| 2,000,000 |
| 2,020,000 | ||||
Sprint Corp., 7.250%, 09/15/21 | 1,000,000 | 1,065,000 | ||||||
Sprint Corp., 7.875%, 09/15/23 | 1,000,000 | 1,070,000 | ||||||
Sprint Corp., 7.125%, 06/15/24 | 2,000,000 | 2,065,000 | ||||||
Sprint Corp., 7.625%, 02/15/25 | 1,500,000 | 1,580,625 | ||||||
T-Mobile USA, Inc., 6.731%, 04/28/22 | 500,000 | 523,750 | ||||||
T-Mobile USA, Inc., 6.625%, 04/01/23 | 1,000,000 | 1,062,500 | ||||||
T-Mobile USA, Inc., 6.000%, 04/15/24 | 1,000,000 | 1,056,250 | ||||||
T-Mobile USA, Inc., 6.375%, 03/01/25 | 1,000,000 | 1,071,250 | ||||||
T-Mobile USA, Inc., 6.500%, 01/15/26 | 1,000,000 | 1,083,750 | ||||||
Wind Acquisition Finance SA, 144A, 7.375%, 04/23/21 (a) | 2,000,000 | 2,085,000 | ||||||
39,682,192 | ||||||||
Transportation: 2.3% | ||||||||
Air Canada, 144A, 7.750%, 04/15/21 (a) | 2,800,000 | 3,143,000 | ||||||
Kenan Advantage Group, Inc., The, 144A, 7.875%, 07/31/23 (a) | 3,000,000 | 3,045,000 | ||||||
Navios Maritime Acquisition Corp./Finance US, Inc., 144A, 8.125%, 11/15/21 (a) | 3,450,000 | 2,949,750 | ||||||
9,137,750 | ||||||||
Utility: 1.4% | ||||||||
Atlantica Yield PLC, 144A, 7.000%, 11/15/19 (a) | 900,000 | 922,500 | ||||||
Calpine Corp., 144A, 7.875%, 01/15/23 (a) | 1,850,000 | 1,935,563 | ||||||
Calpine Corp., 5.500%, 02/01/24 | 1,000,000 | 970,000 | ||||||
SEE NOTES TO FINANCIAL STATEMENTS
104
December 31, 2016
|
Schedule of Investments, continued |
Pax High Yield Bond Fund, continued
Percent of Net Assets | Shares/Principal/ Contracts | Value | ||||||
BONDS, continued | ||||||||
CORPORATE BONDS, continued | ||||||||
Utility, continued | ||||||||
Calpine Corp., 5.750%, 01/15/25 | $ | 1,000,000 | $ | 970,000 | ||||
FPL Energy National Wind Portfolio LLC, 144A, 6.125%, 03/25/19 (a) | 25,420 | 25,547 | ||||||
Ormat Funding Corp., 8.250%, 12/30/20 (b) | 683,217 | 679,801 | ||||||
5,503,411 | ||||||||
TOTAL CORPORATE BONDS | ||||||||
(Cost $357,846,731) | 364,662,430 | |||||||
LOANS: 3.7% | ||||||||
Retail: 3.2% | ||||||||
Charlotte Russe, Inc., 6.750%, 05/21/19 (b) | 7,850,277 | 4,773,989 | ||||||
JC Penney Corp., Inc., 5.250%, 06/23/23 | 2,484,382 | 2,499,388 | ||||||
Neiman Marcus Group LTD LLC, 1.000%, 10/25/20 | 1,900,000 | 1,657,275 | ||||||
TOMS Shoes LLC, 1.000%, 10/31/20 (b) | 3,890,303 | 2,878,824 | ||||||
Toys R Us - Delaware, Inc., 1.000%, 04/24/20 | 1,000,000 | 881,250 | ||||||
12,690,726 | ||||||||
Telecommunications: 0.5% | ||||||||
PRWireless, Inc., 1.000%, 06/29/20 (b) | 2,925,000 | 2,120,625 | ||||||
TOTAL LOANS | ||||||||
(Cost $19,401,610) | 14,811,351 | |||||||
TOTAL BONDS | ||||||||
(Cost $377,248,341) | 379,473,781 | |||||||
CERTIFICATES OF DEPOSIT: 0.3% | ||||||||
Beneficial State Bank, 1.250%, 05/10/17 |
| 100,074 |
| 100,074 | ||||
Beneficial State Bank, 0.500%, 01/21/18 | 200,000 | 200,000 | ||||||
Beneficial State Bank, FSB CDARS, 0.200%, 04/27/17 | 100,160 | 100,160 | ||||||
Self Help Credit Union, 1.050%, 01/04/17 | 100,000 | 100,000 | ||||||
Shared Interest, Inc., 0.700%, 09/30/18 | 500,000 | 500,000 | ||||||
Urban Partnership Bank, 0.200%, 02/03/17 | 100,000 | 100,000 | ||||||
Urban Partnership Bank, 0.300%, 07/01/17 | 100,539 | 100,539 | ||||||
TOTAL CERTIFICATES OF DEPOSIT | ||||||||
(Cost $1,200,773) | 1,200,773 | |||||||
MONEY MARKET: 0.0% (e) | ||||||||
Beneficial State Bank Money Market Account | 200,443 | 200,443 | ||||||
(Cost $200,443) | ||||||||
TIME DEPOSIT: 4.3% | ||||||||
State Street Euro Dollar Time Deposit, 0.010%, 01/03/17 | 17,448,000 | 17,448,000 | ||||||
(Cost $17,448,000) | ||||||||
TOTAL INVESTMENTS: 99.3% | ||||||||
(Cost $397,377,000) | 398,622,997 | |||||||
OTHER ASSETS AND LIABILITIES— (NET): 0.7% | 2,774,507 | |||||||
NET ASSETS: 100.0% | $ | 401,397,504 | ||||||
(a) | Security purchased pursuant to Rule 144A of the Securities Act of 1933 and may be resold only to qualified institutional buyers. |
(b) | Illiquid security. |
(c) | Fair valued security. |
(d) | Non-income producing security. |
(e) | Rounds to less than 0.05% |
SEE NOTES TO FINANCIAL STATEMENTS
105
December 31, 2016
|
Schedule of Investments, continued |
Pax Balanced Fund
Percent of Net Assets | Shares/Principal | Value | ||||||
AFFILIATED INVESTMENT COMPANIES: 99.0% | ||||||||
Pax Core Bond Fund (a) | 60,156,106 | $ | 602,162,621 | |||||
Pax ESG Beta Dividend Fund (a) | 13,854,711 | 136,607,447 | ||||||
Pax Large Cap Fund (a) | 79,743,155 | 790,254,663 | ||||||
Pax Mid Cap Fund (a) | 16,309,362 | 173,042,330 | ||||||
Pax MSCI International ESG Index Fund (a) | 20,935,664 | 160,157,829 | ||||||
TOTAL AFFILIATED INVESTMENT COMPANIES | ||||||||
(Cost $1,875,310,738) | 1,862,224,890 | |||||||
TIME DEPOSIT: 0.9% | ||||||||
State Street Euro Dollar Time Deposit, 0.010%, 01/03/17 | 17,769,000 | 17,769,000 | ||||||
(Cost $17,769,000) | ||||||||
TOTAL INVESTMENTS: 99.9% | ||||||||
(Cost $1,893,079,738) | 1,879,993,890 | |||||||
OTHER ASSETS AND LIABILITIES— (NET): 0.1% | 2,560,210 | |||||||
NET ASSETS: 100.0% | $ | 1,882,554,100 | ||||||
(a) | Institutional Class shares |
SEE NOTES TO FINANCIAL STATEMENTS
106
December 31, 2016
|
Schedule of Investments, continued |
Pax Sustainable Managers Capital Appreciation Fund
Percent of Net Assets | Shares/Principal | Value | ||||||
AFFILIATED INVESTMENT COMPANIES: 29.3% | ||||||||
Pax Global Environmental Markets Fund (a) | 52,484 | $ | 694,892 | |||||
Pax High Yield Bond Fund (a) | 37,589 | 251,095 | ||||||
Pax MSCI International ESG Index Fund (a) | 713,533 | 5,458,531 | ||||||
Pax Small Cap Fund (a) | 117,116 | 1,808,274 | ||||||
TOTAL AFFILIATED INVESTMENT COMPANIES | ||||||||
(Cost $7,651,558) | 8,212,792 | |||||||
NON-AFFILIATED INVESTMENT COMPANIES: 71.0% | ||||||||
Appleseed Fund (a) | 27,050 | 321,630 | ||||||
Ariel Fund (a) | 24,786 | 1,594,733 | ||||||
Eventide Gilead Fund (a)(b) | 91,492 | 2,391,605 | ||||||
Hartford Schroders Emerging Markets Equity Fund (c) | 104,782 | 1,247,948 | ||||||
Neuberger Berman Socially Responsive Fund (a) | 3,477 | 118,569 | ||||||
Parnassus Core Equity Fund (a) | 165,071 | 6,495,552 | ||||||
PIMCO Income Fund (a) | 184,152 | 2,220,878 | ||||||
Portfolio 21 Global Equity Fund (a) | 10,070 | 345,602 | ||||||
NON-AFFILIATED INVESTMENT COMPANIES, continued | ||||||||
Praxis Impact Bond Fund (a) | 1,843 |
| 18,895 | |||||
TIAA-CREF Social Choice Bond Fund (a) | 93,600 | 947,236 | ||||||
TIAA-CREF Social Choice Equity Fund (a) | 242,123 | 3,995,035 | ||||||
Touchstone Premium Yield Equity Fund (d) | 17,179 | 151,176 | ||||||
TOTAL NON-AFFILIATED INVESTMENT COMPANIES | ||||||||
(Cost $18,444,200) | 19,848,859 | |||||||
TOTAL INVESTMENTS: 100.3% | ||||||||
(Cost $26,095,758) | 28,061,651 | |||||||
OTHER ASSETS AND LIABILITIES— (NET): -0.3% | (76,081 | ) | ||||||
NET ASSETS: 100.0% | $ | 27,985,570 | ||||||
(a) | Institutional Class shares |
(b) | Non-income producing security |
(c) | Investor Class shares |
(d) | Class Y shares |
SEE NOTES TO FINANCIAL STATEMENTS
107
December 31, 2016
|
Schedule of Investments, continued |
Pax Sustainable Managers Total Return Fund
Percent of Net Assets | Shares/Principal | Value | ||||||
AFFILIATED INVESTMENT COMPANIES: 15.7% | ||||||||
Pax Global Environmental Markets Fund (a) | 31,486 | $ | 416,872 | |||||
Pax High Yield Bond Fund (a) | 218,103 | 1,456,925 | ||||||
Pax MSCI International ESG Index Fund (a) | 313,271 | 2,396,520 | ||||||
Pax Small Cap Fund (a) | 43,796 | 676,207 | ||||||
TOTAL AFFILIATED INVESTMENT COMPANIES | ||||||||
(Cost $4,601,107) | 4,946,524 | |||||||
NON-AFFILIATED INVESTMENT COMPANIES: 84.7% | ||||||||
Access Capital Community Investment Fund (a) | 203,667 | 1,839,114 | ||||||
Appleseed Fund (a) | 101,850 | 1,211,001 | ||||||
Ariel Fund (a) | 5,759 | 370,549 | ||||||
CRA Qualified Investment Fund (a) | 174,514 | 1,835,886 | ||||||
Eventide Gilead Fund (a)(b) | 42,701 | 1,116,192 | ||||||
Hartford Schroders Emerging Markets Equity Fund (c) | 58,294 | 694,286 | ||||||
Neuberger Berman Socially Responsive Fund (a) | 26,522 | 904,386 | ||||||
Parnassus Core Equity Fund (a) | 66,911 | 2,632,944 | ||||||
PIMCO Income Fund (a) | 320,354 | 3,863,465 | ||||||
NON-AFFILIATED INVESTMENT COMPANIES, continued | ||||||||
Portfolio 21 Global Equity Fund (a) | 11,799 |
| 404,941 | |||||
Praxis Impact Bond Fund (a) | 452,617 | 4,639,328 | ||||||
TIAA-CREF Social Choice Bond Fund (a) | 511,374 | 5,175,104 | ||||||
TIAA-CREF Social Choice Equity Fund (a) | 33,062 | 545,515 | ||||||
Touchstone Premium Yield Equity Fund (d) | 175,089 | 1,540,782 | ||||||
TOTAL NON-AFFILIATED INVESTMENT COMPANIES | ||||||||
(Cost $26,491,193) | 26,773,493 | |||||||
TOTAL INVESTMENTS: 100.4% | ||||||||
(Cost $31,092,300) | 31,720,017 | |||||||
OTHER ASSETS AND LIABILITIES— (NET): -0.4% | (134,005 | ) | ||||||
NET ASSETS: 100.0% | $ | 31,586,012 | ||||||
(a) | Institutional Class shares |
(b) | Non-income producing security |
(c) | Investor Class shares |
(d) | Class Y shares |
SEE NOTES TO FINANCIAL STATEMENTS
108
THIS PAGE INTENTIONALLY LEFT BLANK
December 31, 2016
|
Statements of Assets and Liabilities |
| Large Cap Fund | Mid Cap Fund | Small Cap Fund | ESG Beta Quality Fund | ESG Beta Dividend Fund | |||||||||||||||
ASSETS | ||||||||||||||||||||
Investments, at cost - Note A | $ | 649,071,599 | $ | 149,588,014 | $ | 746,313,075 | $ | 138,359,928 | $ | 129,906,361 | ||||||||||
Investments in unaffiliated issuers, at value | $ | 789,787,158 | $ | 170,218,779 | $ | 813,673,768 | $ | 194,696,491 | $ | 136,436,915 | ||||||||||
Investments in affiliated issuers, at value | — | — | — | — | — | |||||||||||||||
Total investments, at value - Note A1 | 789,787,158 | 170,218,779 | 813,673,768 | 194,696,491 | 136,436,915 | |||||||||||||||
Cash | 601 | 602 | 11,789 | 939 | 39,061 | |||||||||||||||
Foreign currency at value | — | 8,273 | 35,268 | — | — | |||||||||||||||
Prepaid expenses | 39,846 | 16,218 | 30,352 | — | — | |||||||||||||||
Receivables: | ||||||||||||||||||||
Capital stock sold | 1,000 | 22,500 | 4,934,947 | 265,626 | — | |||||||||||||||
Dividends and interest - Note A | 470,164 | 94,323 | 414,418 | 329,049 | 173,962 | |||||||||||||||
Investment securities sold | 3,131,646 | 6,083,386 | 310,416 | — | — | |||||||||||||||
Investment Adviser reimbursement | — | — | — | — | — | |||||||||||||||
Other | — | 319 | 6,536 | 22,841 | — | |||||||||||||||
Total Assets | 793,430,415 | 176,444,400 | 819,417,494 | 195,314,946 | 136,649,938 | |||||||||||||||
LIABILITIES | ||||||||||||||||||||
Collateral on securities loaned, at value | — | — | 18,992,177 | 593,023 | — | |||||||||||||||
Payables: | ||||||||||||||||||||
Capital stock reacquired | — | — | 1,051,621 | 63,934 | — | |||||||||||||||
Investment securities purchased | 3,173,079 | 2,771,419 | — | — | — | |||||||||||||||
Dividend payable - Note A | — | — | — | — | — | |||||||||||||||
Payable to bank | — | — | — | — | — | |||||||||||||||
Accrued expenses: | ||||||||||||||||||||
Investment advisory fees - Note B | 283,565 | 110,696 | 500,672 | 107,983 | 49,002 | |||||||||||||||
Distribution expense | — | 59 | 67,799 | 35,884 | — | |||||||||||||||
Transfer agent fees | 1,967 | 14,489 | 100,557 | — | — | |||||||||||||||
Printing and other shareholder communication fees | — | 6,979 | 721 | — | — | |||||||||||||||
Custodian fees | 5,473 | 1,924 | 7,333 | — | — | |||||||||||||||
Legal and audit fees | 15,762 | 23,150 | 23,400 | — | — | |||||||||||||||
Other accrued expenses | — | 33,642 | 58,099 | — | — | |||||||||||||||
Total Liabilities | 3,479,846 | 2,962,358 | 20,802,379 | 800,824 | 49,002 | |||||||||||||||
NET ASSETS | $ | 789,950,569 | $ | 173,482,042 | $ | 798,615,115 | $ | 194,514,122 | $ | 136,600,936 | ||||||||||
1 | Investments at market value include securities loaned. At December 31, 2016, the Mid Cap Fund, Small Cap Fund, ESG Beta Quality Fund, Global Women’s Index Fund and Global Environmental Markets Fund had a total market value of securities on loan of $7,009,805; $66,548,299; $50,372,954; $20,493,636 and $13,243,117, respectively. |
SEE NOTES TO FINANCIAL STATEMENTS
110
December 31, 2016 |
|
Intl ESG | Global Women’s Index Fund | Global Environmental Markets Fund | Core Bond Fund | High Yield Bond Fund | Balanced | Capital Appreciation Fund | Total Return Fund | |||||||||||||||||||||||
$ | 520,734,705 | $ | 107,117,610 | $ | 302,487,641 | $ | 601,960,957 | $ | 397,377,000 | $ | 1,893,079,738 | $ | 26,095,758 | $ | 31,092,300 | |||||||||||||||
$ | 501,904,585 | $ | 111,113,361 | $ | 348,285,171 | $ | 599,037,358 | $ | 398,622,997 | $ | 17,769,000 | $ | 19,848,859 | $ | 26,773,493 | |||||||||||||||
— | — | — | — | — | 1,862,224,890 | 8,212,792 | 4,946,524 | |||||||||||||||||||||||
501,904,585 | 111,113,361 | 348,285,171 | 599,037,358 | 398,622,997 | 1,879,993,890 | 28,061,651 | 31,720,017 | |||||||||||||||||||||||
— | 127 | 46,392 | 494 | 112,463 | 2,780,123 | — | — | |||||||||||||||||||||||
9,126 | 835 | — | — | — | — | — | — | |||||||||||||||||||||||
— | — | 20,328 | 39,429 | 21,938 | — | 12,893 | 12,902 | |||||||||||||||||||||||
2,144,640 | 482,881 | 2,013,971 | — | 246,633 | 1,444,019 | 1,829 | 4,593 | |||||||||||||||||||||||
659,801 | 138,716 | 321,989 | 3,571,554 | 6,248,600 | 1,433,635 | — | 60,145 | |||||||||||||||||||||||
406,674 | — | — | — | 107,280 | — | 1,133,909 | 153,189 | |||||||||||||||||||||||
— | — | 46,160 | — | — | — | 31,777 | 35,716 | |||||||||||||||||||||||
545,804 | 34,275 | 15,103 | — | — | 2,162 | — | — | |||||||||||||||||||||||
505,670,630 | 111,770,195 | 350,749,114 | 602,648,835 | 405,359,911 | 1,885,653,829 | 29,242,059 | 31,986,562 | |||||||||||||||||||||||
— | 125,132 | — | — | — | — | — | — | |||||||||||||||||||||||
1,648,077 | 76,870 | 308,089 | — | 732,025 | 1,772,402 | 111,954 | 141,055 | |||||||||||||||||||||||
1,412,873 | 801,987 | 1,848,128 | — | 2,587,500 | 730,919 | — | 60,145 | |||||||||||||||||||||||
— | — | — | — | 290,107 | — | — | — | |||||||||||||||||||||||
657,091 | — | — | — | — | — | 1,058,600 | 110,444 | |||||||||||||||||||||||
233,085 | 60,410 | 231,947 | 130,828 | 168,585 | 255,233 | 13,077 | 13,483 | |||||||||||||||||||||||
21,379 | 15,371 | 29,733 | 7 | 49,758 | 341,175 | 9,647 | 11,028 | |||||||||||||||||||||||
— | — | 51,790 | 1,311 | 54,349 | — | 3,746 | 3,672 | |||||||||||||||||||||||
— | — | 1,418 | — | 4,989 | — | 1,356 | 523 | |||||||||||||||||||||||
— | — | 5,409 | 8,975 | 13,738 | — | 2,064 | 2,518 | |||||||||||||||||||||||
— | — | 27,768 | 15,205 | 44,448 | — | 47,554 | 47,555 | |||||||||||||||||||||||
— | — | 39,682 | — | 16,908 | — | 8,491 | 10,127 | |||||||||||||||||||||||
3,972,505 | 1,079,770 | 2,543,964 | 156,326 | 3,962,407 | 3,099,729 | 1,256,489 | 400,550 | |||||||||||||||||||||||
$ | 501,698,125 | $ | 110,690,425 | $ | 348,205,150 | $ | 602,492,509 | $ | 401,397,504 | $ | 1,882,554,100 | $ | 27,985,570 | $ | 31,586,012 | |||||||||||||||
SEE NOTES TO FINANCIAL STATEMENTS
111
December 31, 2016
|
Statements of Assets and Liabilities, continued |
| Large Cap Fund | Mid Cap Fund | Small Cap Fund | ESG Beta Quality Fund | ESG Beta Dividend Fund | |||||||||||||||
Net Assets Represented By: | ||||||||||||||||||||
Paid in Capital | $ | 645,355,532 | $ | 153,258,130 | $ | 722,931,585 | $ | 137,577,432 | $ | 130,104,287 | ||||||||||
Undistributed net investment income | 14,991 | — | 44,010 | 126,995 | — | |||||||||||||||
Accumulated net realized gain | 3,864,487 | (406,889 | ) | 8,278,674 | 475,515 | (33,905 | ) | |||||||||||||
Net unrealized appreciation (depreciation) of: | ||||||||||||||||||||
Investments and written options | 140,715,559 | 20,630,765 | 67,360,693 | 56,336,563 | 6,530,554 | |||||||||||||||
Foreign currency translations | — | 36 | 153 | (2,383 | ) | — | ||||||||||||||
NET ASSETS | $ | 789,950,569 | $ | 173,482,042 | $ | 798,615,115 | $ | 194,514,122 | $ | 136,600,936 | ||||||||||
Individual Investor Class | ||||||||||||||||||||
Net assets | $ | 1,010 | $ | 306,168 | $ | 272,158,843 | $ | 161,040,918 | $ | 10 | ||||||||||
Capital Shares Outstanding | 102 | 28,842 | 17,741,380 | 9,529,908 | 1 | |||||||||||||||
Net asset value per share1 | $ | 9.91 | $ | 10.62 | $ | 15.34 | $ | 16.90 | $ | 9.86 | ||||||||||
Class A | ||||||||||||||||||||
Net assets | $ | 39,477,044 | $ | 4,296,401 | ||||||||||||||||
Capital Shares Outstanding | 2,578,470 | 254,832 | ||||||||||||||||||
Net asset value per share | $ | 15.31 | $ | 16.86 | ||||||||||||||||
Institutional Class | ||||||||||||||||||||
Net assets | $ | 789,949,559 | $ | 173,175,874 | $ | 482,315,267 | $ | 27,579,905 | $ | 136,600,926 | ||||||||||
Capital Shares Outstanding | 79,743,154 | 16,315,398 | 31,228,071 | 1,590,513 | 13,854,710 | |||||||||||||||
Net asset value per share | $ | 9.91 | $ | 10.61 | $ | 15.44 | $ | 17.34 | $ | 9.86 | ||||||||||
Class C | ||||||||||||||||||||
Net assets | ||||||||||||||||||||
Capital Shares Outstanding | ||||||||||||||||||||
Net asset value per share | ||||||||||||||||||||
Class R | ||||||||||||||||||||
Net assets | $ | 4,663,961 | $ | 1,596,898 | ||||||||||||||||
Capital Shares Outstanding | 307,265 | 95,124 | ||||||||||||||||||
Net asset value per share | $ | 15.18 | $ | 16.79 | ||||||||||||||||
SEE NOTES TO FINANCIAL STATEMENTS
112
December 31, 2016 |
|
Intl ESG | Global Women’s Index Fund | Global Environmental Markets Fund | Core Bond Fund | High Yield Bond Fund | Balanced | Capital Appreciation Fund | Total Return Fund | |||||||||||||||||||||||
$ | 538,889,094 | $ | 106,714,336 | $ | 304,156,813 | $ | 605,430,637 | $ | 460,641,476 | $ | 1,697,859,270 | $ | 25,728,530 | $ | 31,348,368 | |||||||||||||||
(350,171 | ) | (35,207 | ) | (76,594 | ) | 7 | (123,109 | ) | 7,117,337 | 328,418 | 193,640 | |||||||||||||||||||
(17,970,447 | ) | 19,178 | (1,668,783 | ) | (14,536 | ) | (60,366,860 | ) | 190,681,134 | (37,271 | ) | (583,713 | ) | |||||||||||||||||
(18,830,120 | ) | 3,995,751 | 45,797,530 | (2,923,599 | ) | 1,245,997 | (13,085,848 | ) | 1,965,893 | 627,717 | ||||||||||||||||||||
(40,231 | ) | (3,633 | ) | (3,816 | ) | — | — | (17,793 | ) | — | — | |||||||||||||||||||
$ | 501,698,125 | $ | 110,690,425 | $ | 348,205,150 | $ | 602,492,509 | $ | 401,397,504 | $ | 1,882,554,100 | $ | 27,985,570 | $ | 31,586,012 | |||||||||||||||
$ | 97,924,407 | $ | 72,770,813 | $ | 122,610,022 | $ | 108,679 | $ | 228,936,748 | $ | 1,596,717,174 | $ | 54,795 | $ | 88,162 | |||||||||||||||
12,564,834 | 3,539,978 | 9,313,542 | 10,853 | 34,123,961 | 71,476,127 | 4,429 | 8,152 | |||||||||||||||||||||||
$ | 7.79 | $ | 20.56 | $ | 13.16 | $ | 10.01 | $ | 6.71 | $ | 22.34 | $ | 12.37 | $ | 10.81 | |||||||||||||||
$ | 13,042,378 | $ | 5,622,998 | $ | 16,757,878 | $ | 15,251,617 | |||||||||||||||||||||||
992,374 | 836,736 | 1,354,580 | 1,410,306 | |||||||||||||||||||||||||||
$ | 13.14 | $ | 6.72 | $ | 12.37 | $ | 10.81 | |||||||||||||||||||||||
$ | 402,693,778 | $ | 37,919,612 | $ | 209,758,631 | $ | 602,383,830 | $ | 166,051,399 | $ | 279,573,597 | $ | 5,897,848 | $ | 8,578,115 | |||||||||||||||
52,616,013 | 1,836,665 | 15,837,944 | 60,156,105 | 24,840,548 | 12,356,391 | 474,257 | 792,013 | |||||||||||||||||||||||
$ | 7.65 | $ | 20.65 | $ | 13.24 | $ | 10.01 | $ | 6.68 | $ | 22.63 | $ | 12.44 | $ | 10.83 | |||||||||||||||
$ | 5,275,049 | $ | 7,668,118 | |||||||||||||||||||||||||||
431,945 | 719,826 | |||||||||||||||||||||||||||||
$ | 12.21 | $ | 10.65 | |||||||||||||||||||||||||||
$ | 1,079,940 | $ | 2,794,119 | $ | 786,359 | $ | 6,263,329 | |||||||||||||||||||||||
139,681 | 214,029 | 117,124 | 278,436 | |||||||||||||||||||||||||||
$ | 7.73 | $ | 13.05 | $ | 6.71 | $ | 22.49 | |||||||||||||||||||||||
1 | The net asset value per share for Large Cap Fund and ESG Beta Dividend Fund do not compute due to rounding. |
SEE NOTES TO FINANCIAL STATEMENTS
113
For the Year Ended December 31, 2016
|
Statements of Operations |
| Large Cap Fund1 | Mid Cap Fund2 | Small Cap Fund | ESG Beta Quality Fund | ESG Beta Dividend Fund1 | |||||||||||||||
Investment Income | ||||||||||||||||||||
Income | ||||||||||||||||||||
Dividends (net of foreign withholding tax of $0; $0; $6,883; $0; $0; $1,233,333; $152,701; $272,477; $0; $0; $0; $0 and $0 respectively) | $ | 880,649 | $ | 3,311,071 | $ | 13,015,669 | $ | 3,890,056 | $ | 213,013 | ||||||||||
Dividends from affiliate - Note C | — | — | — | — | — | |||||||||||||||
Interest | 3 | 130 | 2,912 | 393 | — | |||||||||||||||
Income from securities lending - Note A | — | 1,194 | 40,599 | 34,329 | — | |||||||||||||||
Total Income | 880,652 | 3,312,395 | 13,059,180 | 3,924,778 | 213,013 | |||||||||||||||
Expenses | ||||||||||||||||||||
Investment advisory fees - Note B | 283,565 | 938,887 | 4,765,306 | 1,384,180 | 49,002 | |||||||||||||||
Distribution expenses - Individual Investor (Note B) | — | 382 | 587,575 | 399,657 | — | |||||||||||||||
Distribution expenses - Class A (Note B) | — | — | 82,631 | 8,492 | — | |||||||||||||||
Distribution expenses - Class C (Note B) | — | — | — | — | — | |||||||||||||||
Distribution expenses - Class R (Note B) | — | — | 18,176 | 7,092 | — | |||||||||||||||
Service Plan expenses - Class C (Note B) | — | — | — | — | — | |||||||||||||||
Transfer agent fees - Note A | 1,967 | 18,784 | 749,756 | 136,006 | — | |||||||||||||||
Printing and other shareholder communication fees | 250 | 7,514 | 64,398 | 18,627 | — | |||||||||||||||
Custodian fees | 5,473 | 20,218 | 98,093 | 22,884 | — | |||||||||||||||
Legal fees and related expenses | 3,262 | 16,203 | 47,447 | 13,350 | — | |||||||||||||||
Trustees' fees and expenses - Note B | — | 23,873 | 61,139 | 16,795 | — | |||||||||||||||
Compliance expense | — | 11,738 | 16,957 | 8,176 | — | |||||||||||||||
Audit fees | 12,500 | 30,418 | 30,419 | 29,086 | — | |||||||||||||||
Registration fees | 2,459 | 33,812 | 115,157 | 32,392 | — | |||||||||||||||
Other expenses | — | 20,519 | 49,337 | 8,698 | — | |||||||||||||||
Total Expenses | 309,476 | 1,122,348 | 6,686,391 | 2,085,435 | 49,002 | |||||||||||||||
Less: Advisory fee waiver - Note B | — | — | — | — | — | |||||||||||||||
Expenses assumed by Adviser - Note B | — | — | — | (49,125 | ) | — | ||||||||||||||
Net expenses | 309,476 | 1,122,348 | 6,686,391 | 2,036,310 | 49,002 | |||||||||||||||
Net investment income | 571,176 | 2,190,047 | 6,372,789 | 1,888,468 | 164,011 | |||||||||||||||
REALIZED AND UNREALIZED GAIN (LOSS) - Notes A and C | ||||||||||||||||||||
Net realized gain (loss) on: | ||||||||||||||||||||
Investments in unaffiliated issuers (including premium on options exercised) | 4,728,918 | 1,107,377 | 21,021,983 | 17,277,446 | — | |||||||||||||||
Investment in affiliated issuers | — | — | — | — | — | |||||||||||||||
Option contracts written | — | — | — | — | — | |||||||||||||||
Foreign currency transactions | — | (8,824 | ) | (8,981 | ) | (111 | ) | — | ||||||||||||
Change in unrealized appreciation (depreciation) on: | ||||||||||||||||||||
Investments in unaffiliated issuers | 140,715,559 | 20,630,765 | 87,666,815 | (6,844,015 | ) | 6,530,554 | ||||||||||||||
Investment in affiliated issuers | — | — | — | — | — | |||||||||||||||
Foreign currency translation | — | 36 | 170 | 57 | — | |||||||||||||||
Net realized and unrealized gain (loss) on investments and foreign currency | 145,444,477 | 21,729,354 | 108,679,987 | 10,433,377 | 6,530,554 | |||||||||||||||
Net increase (decrease) in net assets resulting from operations | $ | 146,015,653 | $ | 23,919,401 | $ | 115,052,776 | $ | 12,321,845 | $ | 6,694,565 | ||||||||||
1 | Commencement of operations is December 12, 2016. (Note A) |
2 | Commencement of operations is March 31, 2016. |
SEE NOTES TO FINANCIAL STATEMENTS
114
For the Year Ended December 31, 2016 |
Intl ESG | Global Women’s Index Fund | Global Environmental Markets Fund | Core Bond Fund1 | High Yield Bond Fund | Balanced | Capital Appreciation Fund | Total Return Fund | |||||||||||||||||||||||
$ | 15,520,370 | $ | 2,718,164 | $ | 5,723,822 | $ | — | $ | 311,790 | $ | 16,766,370 | $ | 457,171 | $ | 728,015 | |||||||||||||||
— | — | — | — | — | 7,896,351 | 221,188 | 170,355 | |||||||||||||||||||||||
158 | 33 | 310 | 890,020 | 26,854,852 | 13,961,146 | — | — | |||||||||||||||||||||||
— | 4,852 | 1,802 | — | 7,857 | 55,719 | — | — | |||||||||||||||||||||||
15,520,528 | 2,723,049 | 5,725,934 | 890,020 | 27,174,499 | 38,679,586 | 678,359 | 898,370 | |||||||||||||||||||||||
2,574,091 | 645,392 | 2,550,303 | 130,828 | 1,974,071 | 8,913,458 | 150,995 | 147,233 | |||||||||||||||||||||||
227,494 | 172,071 | 282,972 | 7 | 574,559 | 3,975,420 | 71 | 244 | |||||||||||||||||||||||
— | — | 34,113 | — | 3,691 | — | 51,431 | 40,658 | |||||||||||||||||||||||
— | — | — | — | — | — | 46,342 | 61,987 | |||||||||||||||||||||||
4,592 | — | 12,704 | — | 15,946 | 30,451 | — | — | |||||||||||||||||||||||
— | — | — | — | — | — | 15,447 | 20,662 | |||||||||||||||||||||||
— | — | 363,877 | 1,311 | 453,962 | 1,578,694 | 42,330 | 39,227 | |||||||||||||||||||||||
— | — | 36,920 | 250 | 57,468 | 157,139 | 6,766 | 1,758 | |||||||||||||||||||||||
— | — | 98,399 | 8,975 | 142,456 | 301,718 | 20,130 | 22,296 | |||||||||||||||||||||||
— | — | 32,301 | 2,705 | 39,522 | 98,743 | 21,962 | 21,985 | |||||||||||||||||||||||
— | — | 42,236 | — | 48,868 | 126,958 | 27,679 | 27,653 | |||||||||||||||||||||||
— | — | 15,885 | — | 18,193 | 28,849 | 14,958 | 14,955 | |||||||||||||||||||||||
— | — | 35,534 | 12,500 | 61,169 | 81,297 | 48,302 | 48,301 | |||||||||||||||||||||||
— | — | 80,692 | 2,459 | 79,397 | 57,135 | 75,047 | 76,635 | |||||||||||||||||||||||
— | — | 25,215 | — | 30,070 | 116,061 | 4,468 | 4,955 | |||||||||||||||||||||||
2,806,177 | 817,463 | 3,611,151 | 159,035 | 3,499,372 | 15,465,923 | 525,928 | 528,549 | |||||||||||||||||||||||
— | — | — | — | — | (1,796,652 | ) | (34,981 | ) | (19,328 | ) | ||||||||||||||||||||
— | — | (141,275 | ) | — | — | — | (148,262 | ) | (179,252 | ) | ||||||||||||||||||||
2,806,177 | 817,463 | 3,469,876 | 159,035 | 3,499,372 | 13,669,271 | 342,685 | 329,969 | |||||||||||||||||||||||
12,714,351 | 1,905,586 | 2,256,058 | 730,985 | 23,675,127 | 25,010,315 | 335,674 | 568,401 | |||||||||||||||||||||||
(10,325,741 | ) | 418,713 | 1,326,194 | (14,536 | ) | (20,886,542 | ) | 211,239,426 | 454,935 | (133,484 | ) | |||||||||||||||||||
— | — | — | — | — | (2,087,169 | ) | (145,565 | ) | (135,052 | ) | ||||||||||||||||||||
— | — | — | — | — | 450,725 | |||||||||||||||||||||||||
(435,274 | ) | (12,125 | ) | (150,536 | ) | — | — | (4,820 | ) | 19 | — | |||||||||||||||||||
(3,677,345 | ) | 3,413,916 | 28,099,750 | (2,923,599 | ) | 48,381,946 | (127,803,135 | ) | 1,655,425 | 411,928 | ||||||||||||||||||||
— | — | — | — | — | (673,793 | ) | 627,483 | 280,306 | ||||||||||||||||||||||
(14,365 | ) | 714 | 272 | — | — | 4,700 | — | — | ||||||||||||||||||||||
(14,452,725 | ) | 3,821,218 | 29,275,680 | (2,938,135 | ) | 27,495,404 | 81,125,934 | 2,592,297 | 423,698 | |||||||||||||||||||||
$ | (1,738,374 | ) | $ | 5,726,804 | $ | 31,531,738 | $ | (2,207,150 | ) | $ | 51,170,531 | $ | 106,136,249 | $ | 2,927,971 | $ | 992,099 | |||||||||||||
SEE NOTES TO FINANCIAL STATEMENTS
115
Statements of Changes in Net Assets |
Large Cap | Mid Cap | |||||||
| Period Ended 12/31/16 | Period Ended 12/31/16 | ||||||
Increase (Decrease) in Net Assets | ||||||||
Operations | ||||||||
Investment income, net | $ | 571,176 | $ | 2,190,047 | ||||
Net realized gain (loss) on investments and foreign currency transactions | 4,728,918 | 1,098,553 | ||||||
Change in unrealized appreciation (depreciation) on investments and foreign currency translations | 140,715,559 | 20,630,801 | ||||||
Net increase (decrease) in net assets resulting from operations | 146,015,653 | 23,919,401 | ||||||
Distributions to shareholders from: | ||||||||
Net investment income | ||||||||
Individual Investor Class | — | (3,069 | ) | |||||
Class A | — | — | ||||||
Institutional Class | (537,108 | ) | (2,179,224 | ) | ||||
Class R | — | — | ||||||
Realized gains | ||||||||
Individual Investor Class | — | (2,542 | ) | |||||
Class A | — | — | ||||||
Institutional Class | — | (1,538,463 | ) | |||||
Class R | — | — | ||||||
Total distributions to shareholders | (537,108 | ) | (3,723,298 | ) | ||||
From capital share transactions: | ||||||||
Individual Investor Class | ||||||||
Proceeds from shares sold | 1,010 | 401,813 | ||||||
Proceeds from reinvestment of distributions | — | 5,513 | ||||||
Cost of shares redeemed | — | (111,486 | ) | |||||
Net increase (decrease) from Individual Investor Class transactions | 1,010 | 295,840 | ||||||
Class A | ||||||||
Proceeds from shares sold | ||||||||
Proceeds from reinvestment of distributions | ||||||||
Cost of shares redeemed | ||||||||
Net increase from Class A transactions | ||||||||
Institutional Class | ||||||||
Proceeds from shares sold | — | 62,107 | ||||||
Shares issued in connection with in kind subscription | 796,895,502 | 159,614,142 | ||||||
Proceeds from reinvestment of distributions | 537,108 | 3,717,687 | ||||||
Cost of shares redeemed | — | (385 | ) | |||||
Net increase (decrease) from Institutional Class transactions | 797,432,610 | 163,393,551 | ||||||
Class R | ||||||||
Proceeds from shares sold | ||||||||
Proceeds from reinvestment of distributions | ||||||||
Cost of shares redeemed | ||||||||
Net increase (decrease) from Class R transactions | ||||||||
NAV of shares issued in connection with in kind subscription | (152,961,596 | ) | (10,403,452 | ) | ||||
Net increase (decrease) from capital share transactions | 644,472,024 | 153,285,939 | ||||||
Net increase (decrease) in net assets | 789,950,569 | 173,482,042 | ||||||
Net assets | ||||||||
Beginning of period | — | — | ||||||
End of period (1) | $ | 789,950,569 | $ | 173,482,042 | ||||
(1) Includes undistributed net investment income (loss) | $ | 14,991 | $ | — | ||||
1 | Commencement of Operations is December 12, 2016. (Note A) |
2 | Commencement of Operations is March 31, 2016. |
SEE NOTES TO FINANCIAL STATEMENTS
116
Small Cap Fund | ESG Beta Quality Fund | ESG Beta Dividend Fund1 | International ESG Index Fund | |||||||||||||||||||||||
Year Ended 12/31/16 | Year Ended 12/31/15 | Year Ended 12/31/16 | Year Ended 12/31/15 | Period Ended 12/31/16 | Year Ended 12/31/16 | Year Ended 12/31/15 | ||||||||||||||||||||
$ | 6,372,789 | $ | 1,236,922 | $ | 1,888,468 | $ | 470,417 | $ | 164,011 | $ | 12,714,351 | $ | 6,411,960 | |||||||||||||
21,013,002 | 1,472,623 | 17,277,335 | 9,716,070 | — | (10,761,015 | ) | (6,713,015 | ) | ||||||||||||||||||
87,666,985 | (28,400,681 | ) | (6,843,958 | ) | (5,657,554 | ) | 6,530,554 | (3,691,710 | ) | (12,779,092 | ) | |||||||||||||||
115,052,776 | (25,691,136 | ) | 12,321,845 | 4,528,933 | 6,694,565 | (1,738,374 | ) | (13,080,147 | ) | |||||||||||||||||
(1,809,899 | ) | (295,628 | ) | (1,418,134 | ) | (253,458 | ) | — | (2,284,218 | ) | (1,041,350 | ) | ||||||||||||||
(262,699 | ) | (37,413 | ) | (35,441 | ) | (5,668 | ) | — | ||||||||||||||||||
(4,009,698 | ) | (800,679 | ) | (311,119 | ) | (149,491 | ) | (158,371 | ) | (10,377,391 | ) | (5,526,704 | ) | |||||||||||||
(26,154 | ) | — | (10,057 | ) | (448 | ) | — | (21,975 | ) | (12,478 | ) | |||||||||||||||
(4,135,100 | ) | (1,060,603 | ) | (14,126,494 | ) | (9,603,201 | ) | — | — | (5,006 | ) | |||||||||||||||
(598,504 | ) | (141,411 | ) | (355,608 | ) | (186,122 | ) | — | ||||||||||||||||||
(7,194,420 | ) | (1,213,531 | ) | (2,370,055 | ) | (2,206,751 | ) | — | — | (22,668 | ) | |||||||||||||||
(72,359 | ) | (11,710 | ) | (138,567 | ) | (94,630 | ) | — | — | (73 | ) | |||||||||||||||
(18,108,833 | ) | (3,560,975 | ) | (18,765,475 | ) | (12,499,769 | ) | (158,371 | ) | (12,683,584 | ) | (6,608,279 | ) | |||||||||||||
| �� | ||||||||||||||||||||||||||
77,721,155 | 183,819,174 | 13,520,744 | 20,940,113 | 10 | 54,701,132 | 52,181,467 | ||||||||||||||||||||
5,755,645 | 1,318,500 | 15,127,470 | 9,616,037 | — | 2,150,378 | 986,985 | ||||||||||||||||||||
(62,201,999 | ) | (58,943,968 | ) | (23,344,644 | ) | (22,659,641 | ) | — | (24,612,118 | ) | (20,962,556 | ) | ||||||||||||||
21,274,801 | 126,193,706 | 5,303,570 | 7,896,509 | 10 | 32,239,392 | 32,205,896 | ||||||||||||||||||||
14,084,352 | 17,299,149 | 1,202,387 | 1,755,464 | |||||||||||||||||||||||
787,871 | 163,619 | 365,884 | 178,749 | |||||||||||||||||||||||
(8,697,571 | ) | (7,133,316 | ) | (345,487 | ) | (240,818 | ) | |||||||||||||||||||
6,174,652 | 10,329,452 | 1,222,784 | 1,693,395 | |||||||||||||||||||||||
236,330,266 | 236,632,301 | 8,680,004 | 8,919,545 | — | 163,386,603 | 275,536,280 | ||||||||||||||||||||
138,387,930 | — | |||||||||||||||||||||||||
9,377,290 | 1,751,229 | 2,292,574 | 2,003,146 | 158,371 | 8,998,478 | 4,677,404 | ||||||||||||||||||||
(81,623,197 | ) | (40,392,289 | ) | (21,547,104 | ) | (8,444,660 | ) | — | (82,092,606 | ) | (26,968,031 | ) | ||||||||||||||
164,084,359 | 197,991,241 | (10,574,526 | ) | 2,478,031 | 138,546,301 | 90,292,475 | 253,245,653 | |||||||||||||||||||
2,553,886 | 2,337,697 | 493,107 | 835,373 | 562,423 | 259,982 | |||||||||||||||||||||
47,716 | 9,031 | 146,735 | 94,190 | 21,966 | 12,550 | |||||||||||||||||||||
(1,323,832 | ) | (807,903 | ) | (563,672 | ) | (264,660 | ) | (357,444 | ) | (178,225 | ) | |||||||||||||||
1,277,770 | 1,538,825 | 76,170 | 664,903 | 226,945 | 94,307 | |||||||||||||||||||||
(8,481,569 | ) | — | — | |||||||||||||||||||||||
192,811,582 | 336,053,224 | (3,972,002 | ) | 12,732,838 | 130,064,742 | 122,758,812 | 285,545,856 | |||||||||||||||||||
289,755,525 | 306,801,113 | (10,415,632 | ) | 4,762,002 | 136,600,936 | 108,336,854 | 265,857,430 | |||||||||||||||||||
508,859,590 | 202,058,477 | 204,929,754 | 200,167,752 | — | 393,361,271 | 127,503,841 | ||||||||||||||||||||
$ | 798,615,115 | $ | 508,859,590 | $ | 194,514,122 | $ | 204,929,754 | $ | 136,600,936 | $ | 501,698,125 | $ | 393,361,271 | |||||||||||||
$ | 44,010 | $ | — | $ | 126,995 | $ | 99,432 | $ | — | $ | (350,171 | ) | $ | 54,335 | ||||||||||||
SEE NOTES TO FINANCIAL STATEMENTS
117
Statements of Changes in Net Assets, continued |
Global Women’s Index Fund | ||||||||
| Year Ended 12/31/16 | Year Ended 12/31/15 | ||||||
Increase (Decrease) in Net Assets | ||||||||
Operations | ||||||||
Investment income, net | $ | 1,905,586 | $ | 1,322,084 | ||||
Net realized gain (loss) on investments and foreign currency transactions | 406,588 | (257,523 | ) | |||||
Change in unrealized appreciation (depreciation) on investments and foreign currency translations | 3,414,630 | (2,134,839 | ) | |||||
Net increase (decrease) in net assets resulting from operations | 5,726,804 | (1,070,278 | ) | |||||
Distributions to shareholders from: | ||||||||
Net investment income | ||||||||
Individual Investor Class | (1,286,039 | ) | (983,136 | ) | ||||
Class A | ||||||||
Institutional Class | (637,546 | ) | (331,300 | ) | ||||
Class R | ||||||||
Realized gains | ||||||||
Individual Investor Class | — | (496,242 | ) | |||||
Class A | ||||||||
Institutional Class | — | (137,863 | ) | |||||
Class R | ||||||||
Total distributions to shareholders | (1,923,585 | ) | (1,948,541 | ) | ||||
From capital share transactions: | ||||||||
Individual Investor Class | ||||||||
Proceeds from shares sold | 15,762,854 | 19,895,482 | ||||||
Proceeds from reinvestment of distributions | 1,187,184 | 1,372,490 | ||||||
Cost of shares redeemed | (11,871,295 | ) | (9,619,621 | ) | ||||
Net increase (decrease) from Individual Investor Class transactions | 5,078,743 | 11,648,351 | ||||||
Class A | ||||||||
Proceeds from shares sold | ||||||||
Proceeds from reinvestment of distributions | ||||||||
Cost of shares redeemed | ||||||||
Net increase from Class A transactions | ||||||||
Institutional Class | ||||||||
Proceeds from shares sold | 21,617,754 | 11,353,602 | ||||||
Shares issued in connection with in kind subscription | ||||||||
Proceeds from reinvestment of distributions | 457,256 | 341,295 | ||||||
Cost of shares redeemed | (5,546,254 | ) | (3,738,084 | ) | ||||
Net increase (decrease) from Institutional Class transactions | 16,528,756 | 7,956,813 | ||||||
Class R | ||||||||
Proceeds from shares sold | ||||||||
Proceeds from reinvestment of distributions | ||||||||
Cost of shares redeemed | ||||||||
Net increase (decrease) from Class R transactions | ||||||||
NAV of shares issued in connection with in kind subscription | ||||||||
Net increase (decrease) from capital share transactions | 21,607,499 | 19,605,164 | ||||||
Net increase (decrease) in net assets | 25,410,718 | 16,586,345 | ||||||
Net assets | ||||||||
Beginning of period | 85,279,707 | 68,693,362 | ||||||
End of period (1) | $ | 110,690,425 | $ | 85,279,707 | ||||
(1) Includes undistributed net investment income (loss) | $ | (35,207 | ) | $ | (1,547 | ) | ||
1 | Commencement of Operations is December 12, 2016. (Note A) |
SEE NOTES TO FINANCIAL STATEMENTS
118
Global Environmental | Core | High Yield Bond Fund | Balanced Fund | |||||||||||||||||||||||
Year Ended 12/31/16 | Year Ended 12/31/15 | Period Ended 12/31/16 | Year Ended 12/31/16 | Year Ended 12/31/15 | Year Ended 12/31/16 | Year Ended 12/31/15 | ||||||||||||||||||||
$ | 2,256,058 | $ | 990,771 | $ | 730,985 | $ | 23,675,127 | $ | 30,179,068 | $ | 25,010,315 | $ | 21,661,647 | |||||||||||||
1,175,658 | (1,204,512 | ) | (14,536 | ) | (20,886,542 | ) | (24,909,709 | ) | 209,598,162 | 126,993,287 | ||||||||||||||||
28,100,022 | (4,084,915 | ) | (2,923,599 | ) | 48,381,946 | (30,061,469 | ) | (128,472,228 | ) | (157,774,516 | ) | |||||||||||||||
31,531,738 | (4,298,656 | ) | (2,207,150 | ) | 51,170,531 | (24,792,110 | ) | 106,136,249 | (9,119,582 | ) | ||||||||||||||||
(631,107 | ) | (311,071 | ) | (66 | ) | (13,487,522 | ) | (18,165,717 | ) | (20,540,475 | ) | (14,138,878 | ) | |||||||||||||
(72,507 | ) | (38,210 | ) | — | (372,913 | ) | (252,283 | ) | ||||||||||||||||||
(1,455,687 | ) | (540,230 | ) | (730,919 | ) | (9,662,124 | ) | (11,656,549 | ) | (4,149,013 | ) | (2,949,223 | ) | |||||||||||||
(7,518 | ) | (4,546 | ) | — | (41,326 | ) | (49,600 | ) | (63,448 | ) | (36,932 | ) | ||||||||||||||
— | (676,043 | ) | — | — | — | (27,424,924 | ) | (111,813,463 | ) | |||||||||||||||||
— | (86,015 | ) | — | — | — | |||||||||||||||||||||
— | (847,504 | ) | — | — | — | (4,661,322 | ) | 17,767,453 | ||||||||||||||||||
— | (14,944 | ) | — | — | — | (105,949 | ) | (411,612 | ) | |||||||||||||||||
(2,166,819 | ) | (2,518,563 | ) | (730,985 | ) | (23,563,885 | ) | (30,124,149 | ) | (56,945,131 | ) | (147,117,561 | ) | |||||||||||||
36,079,799 | 26,597,939 | 107,830 | 39,365,229 | 78,418,520 | 82,777,482 | 87,386,792 | ||||||||||||||||||||
589,280 | 937,050 | 66 | 12,515,145 | 16,756,106 | 46,086,723 | 121,508,288 | ||||||||||||||||||||
(29,912,660 | ) | (16,449,267 | ) | — | (81,001,057 | ) | (171,134,720 | ) | (170,721,222 | ) | (219,178,498 | ) | ||||||||||||||
6,756,419 | 11,085,722 | 107,896 | (29,120,683 | ) | (75,960,094 | ) | (41,857,017 | ) | (10,283,418 | ) | ||||||||||||||||
3,338,849 | 5,979,853 | 2,279,150 | 3,985,259 | |||||||||||||||||||||||
56,133 | 111,735 | 270,949 | 211,186 | |||||||||||||||||||||||
(5,076,814 | ) | (2,086,991 | ) | (3,330,517 | ) | (737,652 | ) | |||||||||||||||||||
(1,681,832 | ) | 4,004,597 | (780,418 | ) | 3,458,793 | |||||||||||||||||||||
82,907,508 | 65,450,880 | — | 45,847,131 | 51,324,587 | 59,873,990 | 68,555,214 | ||||||||||||||||||||
600,830,860 | ||||||||||||||||||||||||||
1,337,553 | 1,277,589 | 730,920 | 7,208,966 | 8,789,598 | 8,357,025 | 19,506,073 | ||||||||||||||||||||
(24,991,204 | ) | (16,720,924 | ) | — | (60,480,878 | ) | (78,067,416 | ) | (52,446,577 | ) | (58,111,829 | ) | ||||||||||||||
59,253,857 | 50,007,545 | 601,561,780 | (7,424,781 | ) | (17,953,231 | ) | 15,784,438 | 29,949,458 | ||||||||||||||||||
737,189 | 865,376 | 94,815 | 405,208 | 1,392,665 | 1,828,678 | |||||||||||||||||||||
7,294 | 19,275 | 41,284 | 49,593 | 167,031 | 443,997 | |||||||||||||||||||||
(509,340 | ) | (1,012,630 | ) | (79,728 | ) | (814,859 | ) | (1,532,141 | ) | (1,014,640 | ) | |||||||||||||||
235,143 | (127,979 | ) | 56,371 | (360,058 | ) | 27,555 | 1,258,035 | |||||||||||||||||||
3,760,968 | ||||||||||||||||||||||||||
64,563,587 | 64,969,885 | 605,430,644 | (37,269,511 | ) | (90,814,590 | ) | (26,045,024 | ) | 20,924,075 | |||||||||||||||||
93,928,506 | 58,152,666 | 602,492,509 | (9,662,865 | ) | (145,730,849 | ) | 23,146,094 | (135,313,068 | ) | |||||||||||||||||
254,276,644 | 196,123,978 | — | 411,060,369 | 556,791,218 | 1,859,408,006 | 1,994,721,074 | ||||||||||||||||||||
$ | 348,205,150 | $ | 254,276,644 | $ | 602,492,509 | $ | 401,397,504 | $ | 411,060,369 | $ | 1,882,554,100 | $ | 1,859,408,006 | |||||||||||||
$ | (76,594 | ) | $ | (18,412 | ) | $ | 7 | $ | (123,109 | ) | $ | (216,007 | ) | $ | 7,117,337 | $ | 7,233,041 | |||||||||
SEE NOTES TO FINANCIAL STATEMENTS
119
Statements of Changes in Net Assets, continued |
Capital Appreciation Fund | ||||||||
| Year Ended 12/31/16 | Year Ended 12/31/15 | ||||||
Increase (Decrease) in Net Assets | ||||||||
Operations | ||||||||
Investment income, net | $ | 335,674 | $ | 207,912 | ||||
Net realized gain (loss) on investments and foreign currency transactions | 309,389 | 541,003 | ||||||
Change in unrealized appreciation (depreciation) on investments and foreign currency translations | 2,282,908 | (1,574,256 | ) | |||||
Net increase (decrease) in net assets resulting from operations | 2,927,971 | (825,341 | ) | |||||
Distributions to shareholders from: | ||||||||
Net investment income | ||||||||
Individual Investor Class | — | — | ||||||
Class A | (13,048 | ) | (143,202 | ) | ||||
Institutional Class | (5,111 | ) | (35,536 | ) | ||||
Class C | (4 | ) | (21,133 | ) | ||||
Realized gains | ||||||||
Individual Investor Class | (424 | ) | — | |||||
Class A | (386,438 | ) | (283,213 | ) | ||||
Institutional Class | (112,230 | ) | (67,127 | ) | ||||
Class C | (105,068 | ) | (95,439 | ) | ||||
Total distributions to shareholders | (622,323 | ) | (645,650 | ) | ||||
From capital share transactions: | ||||||||
Individual Investor Class | ||||||||
Proceeds from shares sold | 62,430 | |||||||
Proceeds from reinvestment of distributions | 423 | |||||||
Cost of shares redeemed | (10,602 | ) | ||||||
Net increase (decrease) from Individual Investor Class transactions | 52,251 | |||||||
Class A | ||||||||
Proceeds from shares sold | 4,384,714 | 5,202,514 | ||||||
Shares issued in connection with fund acquisition | 10,468,434 | |||||||
Proceeds from reinvestment of distributions | 383,704 | 393,554 | ||||||
Cost of shares redeemed | (13,322,894 | ) | (1,798,690 | ) | ||||
Net increase from Class A transactions | 1,913,958 | 3,797,378 | ||||||
Institutional Class | ||||||||
Proceeds from shares sold | 3,539,972 | 1,333,468 | ||||||
Shares issued in connection with fund acquisition | 3,212,112 | |||||||
Proceeds from reinvestment of distributions | 113,279 | 102,370 | ||||||
Cost of shares redeemed | (4,052,426 | ) | (1,219,520 | ) | ||||
Net increase (decrease) from Institutional Class transactions | 2,812,937 | 216,318 | ||||||
Class C | ||||||||
Proceeds from shares sold | 855,673 | 1,469,049 | ||||||
Shares issued in connection with fund acquisition | 2,639,824 | |||||||
Proceeds from reinvestment of distributions | 101,444 | 114,582 | ||||||
Cost of shares redeemed | (2,825,628 | ) | (1,442,159 | ) | ||||
Net increase (decrease) from Institutional Class transactions | 771,313 | 141,472 | ||||||
NAV of shares issued in fund merger | (147,629 | ) | ||||||
Net increase (decrease) from capital share transactions | 5,402,830 | 4,155,168 | ||||||
Net increase (decrease) in net assets | 7,708,478 | 2,684,177 | ||||||
Net assets | ||||||||
Beginning of period | 20,277,092 | 17,592,915 | ||||||
End of period (1) | $ | 27,985,570 | $ | 20,277,092 | ||||
(1) Includes undistributed net investment income (loss) | $ | 328,418 | $ | 18,102 | ||||
SEE NOTES TO FINANCIAL STATEMENTS
120
|
Total Return Fund | |||||||
Year Ended 12/31/16 | Year Ended 12/31/15 | ||||||
$ | 568,401 | $ | 201,139 | ||||
(268,536 | ) | 168,112 | |||||
692,234 | (436,610 | ) | |||||
992,099 | (67,359 | ) | |||||
(1,072 | ) | — | |||||
(203,772 | ) | (94,863 | ) | ||||
(129,872 | ) | (53,911 | ) | ||||
(46,807 | ) | (29,596 | ) | ||||
(435 | ) | — | |||||
(82,178 | ) | (96,292 | ) | ||||
(42,210 | ) | (49,651 | ) | ||||
(47,238 | ) | (47,166 | ) | ||||
(553,584 | ) | (371,479 | ) | ||||
225,182 | |||||||
1,507 | |||||||
(140,491 | ) | ||||||
86,198 | |||||||
4,240,245 | 2,318,914 | ||||||
14,179,827 | |||||||
263,515 | 170,143 | ||||||
(9,473,644 | ) | (1,036,607 | ) | ||||
9,209,943 | 1,452,450 | ||||||
1,441,627 | 3,682,084 | ||||||
7,438,464 | |||||||
169,102 | 102,678 | ||||||
(3,525,978 | ) | (3,532,236 | ) | ||||
5,523,215 | 252,526 | ||||||
697,486 | 1,279,474 | ||||||
8,010,088 | |||||||
90,396 | 73,920 | ||||||
(4,297,551 | ) | (231,835 | ) | ||||
4,500,419 | 1,121,559 | ||||||
735,947 | |||||||
20,055,722 | 2,826,535 | ||||||
20,494,237 | 2,387,697 | ||||||
11,091,775 | 8,704,078 | ||||||
$ | 31,586,012 | $ | 11,091,775 | ||||
$ | 193,640 | $ | 20,113 | ||||
SEE NOTES TO FINANCIAL STATEMENTS
121
Statements of Changes in Net Assets—Shares of Beneficial Interest |
Large Cap | Mid Cap | |||||||
| Period Ended 12/31/16 | Period Ended 12/31/16 | ||||||
Individual Investor Class | ||||||||
Shares sold | 102 | 38,617 | ||||||
Shares issued in reinvestment of distributions | — | 515 | ||||||
Shares redeemed | — | (10,290 | ) | |||||
Net increase (decrease) in shares outstanding | 102 | 28,842 | ||||||
Class A | ||||||||
Shares sold | ||||||||
Shares issued in reinvestment of distributions | ||||||||
Shares redeemed | ||||||||
Net increase in shares outstanding | ||||||||
Institutional Class | ||||||||
Shares sold | — | 5,951 | ||||||
Shares issued in in kind subscription | 79,689,550 | 15,961,414 | ||||||
Shares issued in reinvestment of distributions | 53,604 | 348,069 | ||||||
Shares redeemed | — | (36 | ) | |||||
Net increase (decrease) in shares outstanding | 79,743,154 | 16,315,398 | ||||||
Class R | ||||||||
Shares sold | ||||||||
Shares issued in reinvestment of distributions | ||||||||
Shares redeemed | ||||||||
Net increase (decrease) in shares outstanding | ||||||||
International ESG Index Fund | ||||||||
| Year Ended 12/31/16 | Year Ended 12/31/15 | ||||||
Individual Investor Class | ||||||||
Shares sold | 7,099,277 | 6,158,518 | ||||||
Shares issued in reinvestment of distributions | 274,700 | 113,670 | ||||||
Shares redeemed | (3,147,105 | ) | (2,523,478 | ) | ||||
Net increase (decrease) in shares outstanding | 4,226,872 | 3,748,710 | ||||||
Class A | ||||||||
Shares sold | ||||||||
Shares issued in reinvestment of distributions | ||||||||
Shares redeemed | ||||||||
Net increase in shares outstanding | ||||||||
Institutional Class | ||||||||
Shares sold | 21,525,533 | 32,248,255 | ||||||
Shares issued in reinvestment of distributions | 1,170,900 | 551,896 | ||||||
Shares redeemed | (10,701,836 | ) | (3,245,725 | ) | ||||
Net increase (decrease) in shares outstanding | 11,994,597 | 29,554,426 | ||||||
Class R | ||||||||
Shares sold | 72,575 | 30,931 | ||||||
Shares issued in reinvestment of distributions | 2,829 | 1,447 | ||||||
Shares redeemed | (45,644 | ) | (21,214 | ) | ||||
Net increase (decrease) in shares outstanding | 29,760 | 11,164 | ||||||
1 | Commencement of Operations is December 12, 2016. (Note A) |
2 | Commencement of Operations is March 31, 2016. |
SEE NOTES TO FINANCIAL STATEMENTS
122
Small Cap Fund | ESG Beta Quality Fund | ESG Beta Dividend Fund1 | |||||||||||||||||
Year Ended 12/31/16 | Year Ended 12/31/15 | Year Ended 12/31/16 | Year Ended 12/31/15 | Period Ended 12/31/16 | |||||||||||||||
5,543,358 | 13,038,448 | 785,969 | 1,127,502 | 1 | |||||||||||||||
372,066 | 97,900 | 886,027 | 538,833 | — | |||||||||||||||
(4,477,132 | ) | (4,267,608 | ) | (1,335,262 | ) | (1,225,815 | ) | — | |||||||||||
1,438,292 | 8,868,740 | 336,734 | 440,520 | 1 | |||||||||||||||
1,007,794 | 1,223,563 | 67,906 | 93,649 | ||||||||||||||||
51,030 | 12,174 | 21,483 | 10,047 | ||||||||||||||||
(619,185 | ) | (514,494 | ) | (20,161 | ) | (12,953 | ) | ||||||||||||
439,639 | 721,243 | 69,228 | 90,743 | ||||||||||||||||
16,874,824 | 16,743,968 | 507,308 | 472,696 | — | |||||||||||||||
13,838,793 | |||||||||||||||||||
603,625 | 129,155 | 130,881 | 109,635 | 15,917 | |||||||||||||||
(5,737,566 | ) | (2,917,817 | ) | (1,203,977 | ) | (442,288 | ) | — | |||||||||||
11,740,883 | 13,955,306 | (565,788 | ) | 140,043 | 13,854,710 | ||||||||||||||
186,713 | 171,597 | 27,982 | 44,960 | ||||||||||||||||
3,119 | 684 | 8,653 | 5,315 | ||||||||||||||||
(97,729 | ) | (57,292 | ) | (33,376 | ) | (14,321 | ) | ||||||||||||
92,103 | 114,989 | 3,259 | 35,954 | ||||||||||||||||
Global Women’s Index Fund | Global Environmental | ||||||||||||||
Year Ended 12/31/16 | Year Ended 12/31/15 | Year Ended 12/31/16 | Year Ended 12/31/15 | ||||||||||||
783,031 | 971,972 | 2,894,496 | 2,136,032 | ||||||||||||
58,493 | 66,871 | 46,021 | 76,072 | ||||||||||||
(586,206 | ) | (473,479 | ) | (2,382,741 | ) | (1,316,248 | ) | ||||||||
255,318 | 565,364 | 557,776 | 895,856 | ||||||||||||
270,899 | 475,850 | ||||||||||||||
4,400 | 9,103 | ||||||||||||||
(399,469 | ) | (166,950 | ) | ||||||||||||
(124,170 | ) | 318,003 | |||||||||||||
1,057,931 | 555,542 | 6,612,461 | 5,259,933 | ||||||||||||
22,387 | 16,635 | 103,437 | 102,858 | ||||||||||||
(273,532 | ) | (182,985 | ) | (2,010,404 | ) | (1,348,817 | ) | ||||||||
806,786 | 389,192 | 4,705,494 | 4,013,974 | ||||||||||||
60,156 | 69,806 | ||||||||||||||
578 | 1,587 | ||||||||||||||
(41,025 | ) | (82,739 | ) | ||||||||||||
19,709 | (11,346 | ) | |||||||||||||
SEE NOTES TO FINANCIAL STATEMENTS
123
Statements of Changes in Net Assets—Shares of Beneficial Interest, continued |
Core Bond | ||||
| Period Ended 12/31/16 | |||
Individual Investor Class | ||||
Shares sold | 10,846 | |||
Shares issued in reinvestment of distributions | 7 | |||
Shares redeemed | — | |||
Net increase (decrease) in shares outstanding | 10,853 | |||
Class A | ||||
Shares sold | ||||
Shares issued in reinvestment of distributions | ||||
Shares redeemed | ||||
Net increase in shares outstanding | ||||
Institutional Class | ||||
Shares sold | — | |||
Shares issued in in kind subscription | 60,083,086 | |||
Shares issued in reinvestment of distributions | 73,019 | |||
Shares redeemed | — | |||
Net increase (decrease) in shares outstanding | 60,156,105 | |||
Class R | ||||
Shares sold | ||||
Shares issued in reinvestment of distributions | ||||
Shares redeemed | ||||
Net increase (decrease) in shares outstanding | ||||
Capital Appreciation Fund | ||||||||
| Year Ended 12/31/16 | Year Ended 12/31/15 | ||||||
Individual Investor Class | ||||||||
Shares sold | 5,242 | |||||||
Shares issued in reinvestment of distributions | 36 | |||||||
Shares redeemed | (849 | ) | ||||||
Net increase (decrease) in shares outstanding | 4,429 | |||||||
Class A | ||||||||
Shares sold | 375,109 | 425,617 | ||||||
Shares issued in connection with fund acquisition | 898,568 | |||||||
Shares issued in reinvestment of distributions | 32,879 | 31,922 | ||||||
Shares redeemed | (1,126,135 | ) | (147,038 | ) | ||||
Net increase in shares outstanding | 180,421 | 310,501 | ||||||
Institutional Class | ||||||||
Shares sold | 303,352 | 107,700 | ||||||
Shares issued in connection with fund acquisition | 274,774 | |||||||
Shares issued in reinvestment of distributions | 9,666 | 8,264 | ||||||
Shares redeemed | (330,049 | ) | (101,141 | ) | ||||
Net increase (decrease) in shares outstanding | 257,743 | 14,823 | ||||||
Class C | ||||||||
Shares sold | 74,941 | 118,501 | ||||||
Shares issued in connection with fund acquisition | 228,359 | |||||||
Shares issued in reinvestment of distributions | 8,768 | 9,257 | ||||||
Shares redeemed | (234,227 | ) | (118,000 | ) | ||||
Net increase (decrease) in shares outstanding | 77,841 | 9,758 | ||||||
1 | Commencement of Operations is December 12, 2016. (Note A) |
SEE NOTES TO FINANCIAL STATEMENTS
124
High Yield Bond Fund | Balanced Fund | ||||||||||||||
Year Ended 12/31/16 | Year Ended 12/31/15 | Year Ended 12/31/16 | Year Ended 12/31/15 | ||||||||||||
6,161,960 | 11,424,575 | �� | 3,755,137 | 3,720,601 | |||||||||||
1,960,488 | 2,452,964 | 2,078,479 | 5,508,927 | ||||||||||||
(12,729,382 | ) | (25,087,817 | ) | (7,723,141 | ) | (9,311,560 | ) | ||||||||
(4,606,934 | ) | (11,210,278 | ) | (1,889,525 | ) | (82,032 | ) | ||||||||
360,864 | 589,205 | ||||||||||||||
42,322 | 31,174 | ||||||||||||||
(512,931 | ) | (108,792 | ) | ||||||||||||
(109,745 | ) | 511,587 | |||||||||||||
7,196,109 | 7,511,337 | 2,670,613 | 2,861,032 | ||||||||||||
1,133,746 | 1,293,470 | 371,971 | 872,522 | ||||||||||||
(9,572,756 | ) | (11,473,450 | ) | (2,332,984 | ) | (2,474,098 | ) | ||||||||
(1,242,901 | ) | (2,668,643 | ) | 709,600 | 1,259,456 | ||||||||||
15,246 | 60,580 | 62,567 | 77,359 | ||||||||||||
6,452 | 7,242 | 7,482 | 20,014 | ||||||||||||
(12,339 | ) | (118,632 | ) | (69,429 | ) | (43,057 | ) | ||||||||
9,359 | (50,810 | ) | 620 | 54,316 | |||||||||||
Total Return Fund | |||||||
Year Ended 12/31/16 | Year Ended 12/31/15 | ||||||
20,914 | |||||||
141 | |||||||
(12,903 | ) | ||||||
8,152 | |||||||
396,634 | 212,857 | ||||||
1,344,059 | |||||||
24,583 | 15,747 | ||||||
(877,094 | ) | (95,297 | ) | ||||
888,182 | 133,307 | ||||||
135,659 | 350,446 | ||||||
703,733 | |||||||
15,742 | 9,481 | ||||||
(325,890 | ) | (325,518 | ) | ||||
529,244 | 34,409 | ||||||
66,492 | 118,014 | ||||||
771,685 | |||||||
8,586 | 6,926 | ||||||
(403,082 | ) | (21,951 | ) | ||||
443,681 | 102,989 | ||||||
SEE NOTES TO FINANCIAL STATEMENTS
125
December 31, 2016
|
Financial Highlights |
Selected data for a share outstanding throughout each period. |
Income (loss) from investment operations | Distributions to shareholders | |||||||||||||||||||||||
| Net asset value, beginning of period | Net income1 | Net realized and unrealized gain (loss) | Total from investment operations | From net investment income | From net realized gains | ||||||||||||||||||
Large Cap Fund5 | ||||||||||||||||||||||||
Individual Investor Class | ||||||||||||||||||||||||
Period Ended December 31, 2016 | $ | 10.00 | $ | — | $ | (0.08 | ) | $ | (0.08 | ) | $ | 0.01 | $ | — | ||||||||||
Institutional Class | ||||||||||||||||||||||||
Period Ended December 31, 2016 | $ | 10.00 | $ | 0.01 | $ | (0.09 | ) | $ | (0.08 | ) | $ | 0.01 | $ | — | ||||||||||
Mid Cap Fund6 | ||||||||||||||||||||||||
Individual Investor Class | ||||||||||||||||||||||||
Period Ended December 31, 2016 | $ | 10.00 | $ | 0.14 | $ | 0.70 | $ | 0.84 | $ | 0.12 | $ | 0.10 | ||||||||||||
Institutional Class | ||||||||||||||||||||||||
Period Ended December 31, 2016 | $ | 10.00 | $ | 0.14 | $ | 0.71 | $ | 0.85 | $ | 0.14 | $ | 0.10 | ||||||||||||
1 | Based on average shares outstanding during the period. |
2 | Total return represents aggregate total return for the period indicated, includes reinvestment of all dividends and distributions, and does not reflect the deduction of any applicable sales charges. Total returns for periods of less than one year have not been annualized. |
3 | Ratios representing periods of less than one year have been annualized. |
4 | Not annualized |
SEE NOTES TO FINANCIAL STATEMENTS
126
December 31, 2016 |
Ratios to average net assets3 | ||||||||||||||||||||||||||||||
Total distributions | Net asset value, | Total return2 | Net assets end of period (in $000’s) | Net expenses including reimbursements and waivers | Net income | Total expenses excluding reimbursements and waivers | Portfolio Turnover4 | |||||||||||||||||||||||
$ | 0.01 | $ | 9.91 | (0.83 | %) | $ | 1 | 0.96 | % | 1.06 | % | 0.96 | % | 3 | %7 | |||||||||||||||
$ | 0.01 | $ | 9.91 | (0.83 | %) | $ | 789,950 | 0.71 | % | 1.31 | % | 0.71 | % | 3 | %7 | |||||||||||||||
$ | 0.22 | $ | 10.62 | 8.35 | % | $ | 306 | 1.15 | % | 1.82 | % | 1.15 | % | 53 | %7 | |||||||||||||||
$ | 0.24 | $ | 10.61 | 8.41 | % | $ | 173,176 | 0.90 | % | 1.75 | % | 0.90 | % | 53 | %7 | |||||||||||||||
5 | Per share data is reflected from the Fund’s inception date of December 16, 2016. |
6 | Per share data is reflected from the Fund’s inception date of March 31, 2016. |
7 | For purposes of calculating the turnover ratio for the Large Cap Fund and Mid Cap Fund, transactions related to the in-kind subscription have been excluded (Note C). |
SEE NOTES TO FINANCIAL STATEMENTS
127
December 31, 2016
|
Financial Highlights, continued |
Selected data for a share outstanding throughout each period. |
Income (loss) from investment operations | Distributions to shareholders | |||||||||||||||||||||||
| Net asset value, beginning of period | Net | Net realized and unrealized gain(loss) | Total from investment operations | From net investment income | From net realized gains | ||||||||||||||||||
Small Cap Fund | ||||||||||||||||||||||||
Individual Investor Class | ||||||||||||||||||||||||
Year Ended December 31, 2016 | $ | 13.30 | $ | 0.12 | $ | 2.26 | $ | 2.38 | $ | 0.10 | $ | 0.24 | ||||||||||||
Year Ended December 31, 2015 | 13.92 | 0.03 | (0.56 | ) | (0.53 | ) | 0.02 | 0.07 | ||||||||||||||||
Year Ended December 31, 2014 | 13.58 | 0.12 | 0.83 | 0.95 | 0.10 | 0.51 | ||||||||||||||||||
Year Ended December 31, 2013 | 10.58 | 0.10 | 4.43 | 4.53 | 0.11 | 1.42 | ||||||||||||||||||
Year Ended December 31, 2012 | 9.65 | 0.19 | 1.09 | 1.28 | 0.10 | 0.25 | ||||||||||||||||||
Class A | ||||||||||||||||||||||||
Year Ended December 31, 2016 | $ | 13.28 | $ | 0.12 | $ | 2.25 | $ | 2.37 | $ | 0.10 | $ | 0.24 | ||||||||||||
Year Ended December 31, 2015 | 13.90 | 0.03 | (0.56 | ) | (0.53 | ) | 0.02 | 0.07 | ||||||||||||||||
Year Ended December 31, 2014 | 13.56 | 0.13 | 0.83 | 0.96 | 0.11 | 0.51 | ||||||||||||||||||
Period Ended December 31, 20135 | 11.83 | 0.13 | 3.15 | 3.28 | 0.13 | 1.42 | ||||||||||||||||||
Institutional Class | ||||||||||||||||||||||||
Year Ended December 31, 2016 | $ | 13.38 | $ | 0.16 | $ | 2.27 | $ | 2.43 | $ | 0.13 | $ | 0.24 | ||||||||||||
Year Ended December 31, 2015 | 14.00 | 0.06 | (0.56 | ) | (0.50 | ) | 0.05 | 0.07 | ||||||||||||||||
Year Ended December 31, 2014 | 13.65 | 0.16 | 0.83 | 0.99 | 0.13 | 0.51 | ||||||||||||||||||
Year Ended December 31, 2013 | 10.62 | 0.15 | 4.44 | 4.59 | 0.14 | 1.42 | ||||||||||||||||||
Year Ended December 31, 2012 | 9.69 | 0.17 | 1.13 | 1.30 | 0.12 | 0.25 | ||||||||||||||||||
Class R | ||||||||||||||||||||||||
Year Ended December 31, 2016 | $ | 13.18 | $ | 0.09 | $ | 2.24 | $ | 2.33 | $ | 0.09 | $ | 0.24 | ||||||||||||
Year Ended December 31, 2015 | 13.81 | (0.01 | ) | (0.55 | ) | (0.56 | ) | — | 0.07 | |||||||||||||||
Year Ended December 31, 2014 | 13.48 | 0.09 | 0.82 | 0.91 | 0.07 | 0.51 | ||||||||||||||||||
Year Ended December 31, 2013 | 10.52 | 0.08 | 4.39 | 4.47 | 0.09 | 1.42 | ||||||||||||||||||
Year Ended December 31, 2012 | 9.61 | 0.21 | 1.03 | 1.24 | 0.08 | 0.25 | ||||||||||||||||||
1 | Based on average shares outstanding during the period. |
2 | Total return represents aggregate total return for the period indicated, includes reinvestment of all dividends and distributions, and does not reflect the deduction of any applicable sales charges. Total returns for periods of less than one year have not been annualized. |
3 | Ratios representing periods of less than one year have been annualized. |
SEE NOTES TO FINANCIAL STATEMENTS
128
December 31, 2016 |
|
Ratios to average net assets3 | ||||||||||||||||||||||||||||||
Total distributions | Net asset value, | Total return2 | Net assets (in $000’s) | Net expenses including reimbursements and waivers | Net income | Total expenses excluding reimbursements and waivers | Portfolio Turnover4 | |||||||||||||||||||||||
$ | 0.34 | $ | 15.34 | 17.90 | % | $ | 272,159 | 1.19 | % | 0.82 | % | 1.19 | % | 49 | % | |||||||||||||||
0.09 | 13.30 | (3.85 | %) | 216,844 | 1.22 | % | 0.20 | % | 1.23 | % | 48 | % | ||||||||||||||||||
0.61 | 13.92 | 7.06 | % | 103,508 | 1.24 | % | 0.88 | % | 1.37 | % | 167 | % | ||||||||||||||||||
1.53 | 13.58 | 43.24 | % | 45,890 | 1.24 | % | 0.75 | % | 1.66 | % | 162 | % | ||||||||||||||||||
0.35 | 10.58 | 13.55 | % | 15,447 | 1.24 | % | 1.89 | % | 2.20 | % | 166 | % | ||||||||||||||||||
$ | 0.34 | $ | 15.31 | 17.85 | % | $ | 39,477 | 1.19 | % | 0.84 | % | 1.19 | % | 49 | % | |||||||||||||||
0.09 | 13.28 | (3.87 | %) | 28,394 | 1.22 | % | 0.19 | % | 1.23 | % | 48 | % | ||||||||||||||||||
0.62 | 13.90 | 7.10 | % | 19,698 | 1.24 | % | 0.91 | % | 1.37 | % | 167 | % | ||||||||||||||||||
1.55 | 13.56 | 28.10 | % | 3,151 | 1.24 | % | 1.36 | % | 1.66 | % | 162 | % | ||||||||||||||||||
$ | 0.37 | $ | 15.44 | 18.17 | % | $ | 482,315 | 0.94 | % | 1.14 | % | 0.94 | % | 49 | % | |||||||||||||||
0.12 | 13.38 | (3.62 | %) | 260,786 | 0.97 | % | 0.44 | % | 0.98 | % | 48 | % | ||||||||||||||||||
0.64 | 14.00 | 7.31 | % | 77,469 | 0.99 | % | 1.14 | % | 1.11 | % | 167 | % | ||||||||||||||||||
1.56 | 13.65 | 43.64 | % | 8,507 | 0.99 | % | 1.10 | % | 1.41 | % | 162 | % | ||||||||||||||||||
0.37 | 10.62 | 13.75 | % | 442 | 0.99 | % | 1.69 | % | 1.95 | % | 166 | % | ||||||||||||||||||
$ | 0.33 | $ | 15.18 | 17.62 | % | $ | 4,664 | 1.45 | % | 0.64 | % | 1.45 | % | 49 | % | |||||||||||||||
0.07 | 13.18 | (4.09 | %) | 2,836 | 1.47 | % | (0.07 | %) | 1.48 | % | 48 | % | ||||||||||||||||||
0.58 | 13.81 | 6.79 | % | 1,384 | 1.49 | % | 0.63 | % | 1.62 | % | 167 | % | ||||||||||||||||||
1.51 | 13.48 | 42.90 | % | 621 | 1.49 | % | 0.58 | % | 1.91 | % | 162 | % | ||||||||||||||||||
0.33 | 10.52 | 13.24 | % | 111 | 1.49 | % | 2.12 | % | 2.45 | % | 166 | % | ||||||||||||||||||
4 | Not annualized |
5 | Per share data is reflected from class inception date of May 1, 2013. |
SEE NOTES TO FINANCIAL STATEMENTS
129
December 31, 2016
|
Financial Highlights, continued |
Selected data for a share outstanding throughout each period. |
Income (loss) from investment operations | Distributions to shareholders | |||||||||||||||||||||||
| Net asset value, beginning of period | Net income1 | Net realized and unrealized gain (loss) | Total from investment operations | From net investment income | From net realized gains | ||||||||||||||||||
ESG Beta Quality Fund | ||||||||||||||||||||||||
Individual Investor Class | ||||||||||||||||||||||||
Year Ended December 31, 2016 | $ | 17.55 | $ | 0.16 | $ | 0.95 | $ | 1.11 | $ | 0.16 | $ | 1.60 | ||||||||||||
Year Ended December 31, 2015 | 18.26 | 0.03 | 0.38 | 0.41 | 0.03 | 1.09 | ||||||||||||||||||
Year Ended December 31, 2014 | 17.08 | 0.12 | 1.87 | 1.99 | 0.11 | 0.70 | ||||||||||||||||||
Year Ended December 31, 2013 | 13.50 | 0.03 | 3.96 | 3.99 | 0.04 | 0.37 | ||||||||||||||||||
Year Ended December 31, 2012 | 11.96 | 0.05 | 1.51 | 1.56 | 0.02 | — | ||||||||||||||||||
Class A | ||||||||||||||||||||||||
Year Ended December 31, 2016 | $ | 17.52 | $ | 0.17 | $ | 0.93 | $ | 1.10 | $ | 0.16 | $ | 1.60 | ||||||||||||
Year Ended December 31, 2015 | 18.23 | 0.04 | 0.38 | 0.42 | 0.04 | 1.09 | ||||||||||||||||||
Year Ended December 31, 2014 | 17.06 | 0.08 | 1.91 | 1.99 | 0.12 | 0.70 | ||||||||||||||||||
Period Ended December 31, 20135 | 14.39 | — | 3.09 | 3.09 | 0.05 | 0.37 | ||||||||||||||||||
Institutional Class | ||||||||||||||||||||||||
Year Ended December 31, 2016 | $ | 17.97 | $ | 0.19 | $ | 0.99 | $ | 1.18 | $ | 0.21 | $ | 1.60 | ||||||||||||
Year Ended December 31, 2015 | 18.66 | 0.08 | 0.39 | 0.47 | 0.07 | 1.09 | ||||||||||||||||||
Year Ended December 31, 2014 | 17.44 | 0.16 | 1.91 | 2.07 | 0.15 | 0.70 | ||||||||||||||||||
Year Ended December 31, 2013 | 13.76 | 0.07 | 4.03 | 4.10 | 0.05 | 0.37 | ||||||||||||||||||
Year Ended December 31, 2012 | 12.19 | 0.08 | 1.56 | 1.64 | 0.07 | — | ||||||||||||||||||
Class R | ||||||||||||||||||||||||
Year Ended December 31, 2016 | $ | 17.45 | $ | 0.12 | $ | 0.94 | $ | 1.06 | $ | 0.12 | $ | 1.60 | ||||||||||||
Year Ended December 31, 2015 | 18.18 | (0.01 | ) | 0.38 | 0.37 | 0.01 | 1.09 | |||||||||||||||||
Year Ended December 31, 2014 | 17.03 | 0.08 | 1.85 | 1.93 | 0.08 | 0.70 | ||||||||||||||||||
Year Ended December 31, 2013 | 13.48 | (0.01 | )6 | 3.95 | 3.94 | 0.02 | 0.37 | |||||||||||||||||
Year Ended December 31, 2012 | 11.95 | 0.01 | 1.52 | 1.53 | — | — | ||||||||||||||||||
ESG Beta Dividend Fund7 | ||||||||||||||||||||||||
Individual Investor Class | ||||||||||||||||||||||||
Period Ended December 31, 2016 | $ | 9.96 | $ | 0.01 | $ | (0.10 | ) | $ | (0.09 | ) | $ | 0.01 | $ | — | ||||||||||
Institutional Class | ||||||||||||||||||||||||
Period Ended December 31, 2016 | $ | 9.96 | $ | 0.01 | $ | (0.10 | ) | $ | (0.09 | ) | $ | 0.01 | $ | — | ||||||||||
1 | Based on average shares outstanding during the period. |
2 | Total return represents aggregate total return for the period indicated, includes reinvestment of all dividends and distributions, and does not reflect the deduction of any applicable sales charges. Total returns for periods of less than one year have not been annualized. |
3 | Ratios representing periods of less than one year have been annualized. |
4 | Not annualized |
SEE NOTES TO FINANCIAL STATEMENTS
130
December 31, 2016 |
Ratios to average net assets3 | ||||||||||||||||||||||||||||||
Total distributions | Net asset value, | Total return2 | Net assets (in $000’s) | Net expenses including reimbursements and waivers | Net income | Total expenses excluding reimbursements and waivers | Portfolio Turnover4 | |||||||||||||||||||||||
$ | 1.76 | $ | 16.90 | 6.26 | % | $ | 161,041 | 1.07 | % | 0.93 | % | 1.09 | % | 80 | % | |||||||||||||||
1.12 | 17.55 | 2.20 | % | 161,334 | 1.24 | % | 0.18 | % | 1.28 | % | 26 | % | ||||||||||||||||||
0.81 | 18.26 | 11.66 | % | 159,794 | 1.26 | % | 0.69 | % | 1.32 | % | 29 | % | ||||||||||||||||||
0.41 | 17.08 | 29.61 | % | 141,698 | 1.29 | % | 0.18 | % | 1.35 | % | 27 | % | ||||||||||||||||||
0.02 | 13.50 | 13.08 | % | 123,870 | 1.29 | % | 0.36 | % | 1.44 | % | 21 | % | ||||||||||||||||||
$ | 1.76 | $ | 16.86 | 6.24 | % | $ | 4,296 | 1.06 | % | 0.96 | % | 1.09 | % | 80 | % | |||||||||||||||
1.13 | 17.52 | 2.24 | % | 3,251 | 1.24 | % | 0.20 | % | 1.28 | % | 26 | % | ||||||||||||||||||
0.82 | 18.23 | 11.68 | % | 1,729 | 1.26 | % | 0.47 | % | 1.33 | % | 29 | % | ||||||||||||||||||
0.42 | 17.06 | 21.58 | % | 289 | 1.29 | % | 0.02 | % | 1.35 | % | 27 | % | ||||||||||||||||||
$ | 1.81 | $ | 17.34 | 6.49 | % | $ | 27,580 | 0.84 | % | 1.08 | % | 0.84 | % | 80 | % | |||||||||||||||
1.16 | 17.97 | 2.50 | % | 38,741 | 0.99 | % | 0.44 | % | 1.03 | % | 26 | % | ||||||||||||||||||
0.85 | 18.66 | 11.91 | % | 37,629 | 1.01 | % | 0.91 | % | 1.07 | % | 29 | % | ||||||||||||||||||
0.42 | 17.44 | 29.93 | % | 28,590 | 1.04 | % | 0.48 | % | 1.10 | % | 27 | % | ||||||||||||||||||
0.07 | 13.76 | 13.35 | % | 6,147 | 1.04 | % | 0.63 | % | 1.19 | % | 21 | % | ||||||||||||||||||
$ | 1.72 | $ | 16.79 | 5.99 | % | $ | 1,597 | 1.31 | % | 0.70 | % | 1.34 | % | 80 | % | |||||||||||||||
1.10 | 17.45 | 1.97 | % | 1,603 | 1.49 | % | (0.05 | %) | 1.53 | % | 26 | % | ||||||||||||||||||
0.78 | 18.18 | 11.37 | % | 1,016 | 1.51 | % | 0.47 | % | 1.57 | % | 29 | % | ||||||||||||||||||
0.39 | 17.03 | 29.30 | % | 819 | 1.54 | % | (0.07 | %) | 1.60 | % | 27 | % | ||||||||||||||||||
— | 13.48 | 12.80 | % | 489 | 1.54 | % | 0.11 | % | 1.69 | % | 21 | % | ||||||||||||||||||
$ | 0.01 | $ | 9.86 | (0.89 | %) | $ | 0 | 0.90 | % | 1.93 | % | 0.90 | % | 0 | %8 | |||||||||||||||
$ | 0.01 | $ | 9.86 | (0.89 | %) | $ | 136,601 | 0.65 | % | 2.18 | % | 0.65 | % | 0 | %8 | |||||||||||||||
5 | Per share data is reflected from class inception date of May 1, 2013. |
6 | The amount shown for a share outstanding does not correspond with the aggregate net investment income for the period due to the timing of sales and repurchases of the shares in relation to fluctuating market value of the investments of the Fund. |
7 | Per share data is reflected from the Fund’s inception date of December 16, 2016. |
8 | For purposes of calculating the turnover ratio for the ESG Beta Dividend Fund, transactions related to the in-kind subscription have been excluded (Note C). |
SEE NOTES TO FINANCIAL STATEMENTS
131
December 31, 2016
|
Financial Highlights, continued |
Selected data for a share outstanding throughout each period. |
Income (loss) from investment operations | Distributions to shareholders | |||||||||||||||||||||||
| Net asset value, beginning of period | Net income1 | Net realized and unrealized gain (loss) | Total from investment operations | From net investment income | From net realized gains | ||||||||||||||||||
International ESG Index Fund | ||||||||||||||||||||||||
Individual Investor Class | ||||||||||||||||||||||||
Year Ended December 31, 2016 | $ | 8.13 | $ | 0.20 | $ | (0.35 | ) | $ | (0.15 | ) | $ | 0.19 | $ | — | ||||||||||
Year Ended December 31, 2015 | 8.19 | 0.16 | (0.08 | ) | 0.08 | 0.14 | 0.00 | 7 | ||||||||||||||||
Period Ended December 31, 20145 | 8.84 | 0.20 | (0.70 | ) | (0.50 | ) | 0.11 | 0.04 | ||||||||||||||||
Institutional Class6 | ||||||||||||||||||||||||
Year Ended December 31, 2016 | $ | 7.99 | $ | 0.21 | $ | (0.34 | ) | $ | (0.13 | ) | $ | 0.21 | $ | — | ||||||||||
Year Ended December 31, 2015 | 8.05 | 0.18 | (0.08 | ) | 0.10 | 0.16 | 0.00 | 7 | ||||||||||||||||
Year Ended December 31, 2014 | 8.84 | 0.34 | (0.80 | ) | (0.46 | ) | 0.29 | 0.04 | ||||||||||||||||
Year Ended December 31, 2013 | 7.23 | 0.19 | 1.51 | 1.70 | 0.17 | — | ||||||||||||||||||
Year Ended December 31, 2012 | 6.36 | 0.22 | 0.76 | 0.98 | 0.19 | — | ||||||||||||||||||
Class R | ||||||||||||||||||||||||
Year Ended December 31, 2016 | $ | 8.07 | $ | 0.18 | $ | (0.35 | ) | $ | (0.17 | ) | $ | 0.17 | $ | — | ||||||||||
Year Ended December 31, 2015 | 8.13 | 0.15 | (0.09 | ) | 0.06 | 0.12 | 0.00 | 7 | ||||||||||||||||
Period Ended December 31, 20145 | 8.80 | 0.16 | (0.67 | ) | (0.51 | ) | 0.12 | 0.04 | ||||||||||||||||
1 | Based on average shares outstanding during the period. |
2 | Total return represents aggregate total return for the period indicated, includes reinvestment of all dividends and distributions, and does not reflect the deduction of any applicable sales charges. Total returns for periods of less than one year have not been annualized. |
3 | Ratios representing periods of less than one year have been annualized. |
4 | Not annualized |
5 | Per share data is reflected from class inception date of March 31, 2014 |
6 | Pax MSCI International ESG Index Fund acquired the assets of Pax World International Fund, a series of Pax World Funds Series Trust I, and the assets of Pax MSCI EAFE ESG Index ETF, a series of Pax World Funds Trust II, on March 31, 2014 (the “Reorganizations”). Pax MSCI EAFE ESG Index ETF (the “Predecessor Fund”) is treated as the survivor of the Reorganizations for accounting and performance reporting purposes. Accordingly, performance information shown for periods prior to the Reorganization is that of the Predecessor Fund. Per share data shown for periods prior to the Reorganization has been restated to reflect the share conversion that occurred upon completion of the Reorganizations. |
SEE NOTES TO FINANCIAL STATEMENTS
132
December 31, 2016 |
Ratios to average net assets3 | ||||||||||||||||||||||||||||||||||
Total distributions | Equalization Credits and Charges | Net asset value, | Total return2 | Net assets (in $000’s) | Net expenses including reimbursements and waivers | Net | Total expenses excluding reimbursements and waivers | Portfolio Turnover4 | ||||||||||||||||||||||||||
$ | 0.19 | $ | — | $ | 7.79 | (1.85 | %) | $ | 97,924 | 0.80 | % | 2.55 | % | 0.80 | % | 44 | %9 | |||||||||||||||||
0.14 | — | 8.13 | 0.91 | % | 67,823 | 0.80 | % | 1.94 | % | 0.80 | % | 86 | %9 | |||||||||||||||||||||
0.15 | — | 8.19 | (5.75 | %) | 37,603 | 0.80 | % | 2.27 | % | 0.80 | % | 36 | %8,9 | |||||||||||||||||||||
$ | 0.21 | $ | — | $ | 7.65 | (1.63 | %) | $ | 402,694 | 0.55 | % | 2.76 | % | 0.55 | % | 44 | %9 | |||||||||||||||||
0.16 | — | 7.99 | 1.16 | % | 324,651 | 0.55 | % | 2.13 | % | 0.55 | % | 86 | %9 | |||||||||||||||||||||
0.33 | — | 8.05 | (5.49 | %) | 89,098 | 0.55 | % | 3.91 | % | 0.55 | % | 36 | %8,9 | |||||||||||||||||||||
0.17 | 0.08 | 8.84 | 24.96 | % | 58,549 | 0.55 | % | 2.34 | % | 0.55 | % | 12 | % | |||||||||||||||||||||
0.19 | 0.08 | 7.23 | 16.98 | % | 13,162 | 0.55 | % | 3.21 | % | 0.55 | % | 8 | % | |||||||||||||||||||||
$ | 0.17 | $ | — | $ | 7.73 | (2.07 | %) | $ | 1,080 | 1.05 | % | 2.34 | % | 1.05 | % | 44 | %9 | |||||||||||||||||
0.12 | — | 8.07 | 0.66 | % | 888 | 1.05 | % | 1.75 | % | 1.05 | % | 86 | %9 | |||||||||||||||||||||
0.16 | — | 8.13 | (6.06 | %) | 803 | 1.05 | % | 1.86 | % | 1.05 | % | 36 | %8,9 | |||||||||||||||||||||
7 | Rounds to less than $0.01 |
8 | For purposes of calculating turnover ratio for the International ESG Index Fund, transactions related to the Reorganization have been excluded. |
9 | To manage cash flows, minimize trading costs and equitize cash balances in between trading blocks of securities, the International ESG Index Fund utilizes one or more exchange-traded funds (ETFs) which have an investment objective that tracks the Fund’s broad-based benchmark. These investments are frequent and short-term, however, the Fund is required to include such ETF investment activity in the calculation of its portfolio turnover. Had such transactions been excluded, the portfolio turnover would have been 10% for the year ended December 31, 2016, 8% for the year ended December 31, 2015, and 15% for the year ended December 31, 2014. |
SEE NOTES TO FINANCIAL STATEMENTS
133
December 31, 2016
|
Financial Highlights, continued |
Selected data for a share outstanding throughout each period. |
Income (loss) from investment operations | Distributions to shareholders | |||||||||||||||||||||||
| Net asset value, beginning of period | Net income1 | Net realized and unrealized gain (loss) | Total from investment operations | From net investment income | From net realized gains | ||||||||||||||||||
Global Women’s Index Fund4 | ||||||||||||||||||||||||
Individual Investor Class | ||||||||||||||||||||||||
Year Ended December 31, 2016 | $ | 19.75 | $ | 0.39 | $ | 0.79 | $ | 1.18 | $ | 0.37 | $ | — | ||||||||||||
Year Ended December 31, 2015 | 20.43 | 0.33 | (0.53 | ) | (0.20 | ) | 0.32 | 0.16 | ||||||||||||||||
Year Ended December 31, 2014 | 21.78 | 0.47 | 0.84 | 1.31 | 0.45 | 2.21 | ||||||||||||||||||
Year Ended December 31, 2013 | 17.67 | 0.23 | 4.07 | 4.30 | 0.19 | — | ||||||||||||||||||
Year Ended December 31, 2012 | 15.90 | 0.23 | 1.76 | 1.99 | 0.22 | — | ||||||||||||||||||
Institutional Class | ||||||||||||||||||||||||
Year Ended December 31, 2016 | $ | 19.83 | $ | 0.42 | $ | 0.82 | $ | 1.24 | $ | 0.42 | $ | — | ||||||||||||
Year Ended December 31, 2015 | 20.52 | 0.38 | (0.54 | ) | (0.16 | ) | 0.37 | 0.16 | ||||||||||||||||
Year Ended December 31, 2014 | 21.86 | 0.39 | 0.99 | 1.38 | 0.51 | 2.21 | ||||||||||||||||||
Year Ended December 31, 2013 | 17.71 | 0.29 | 4.08 | 4.37 | 0.22 | — | ||||||||||||||||||
Year Ended December 31, 2012 | 15.94 | 0.27 | 1.77 | 2.04 | 0.27 | — | ||||||||||||||||||
1 | Based on average shares outstanding during the period. |
2 | Total return represents aggregate total return for the period indicated, includes reinvestment of all dividends and distributions, and does not reflect the deduction of any applicable sales charges. Total returns for periods of less than one year have not been annualized. |
3 | Not annualized |
SEE NOTES TO FINANCIAL STATEMENTS
134
December 31, 2016 |
Ratios to average net assets3 | ||||||||||||||||||||||||||||||
Total distributions | Net asset value, | Total return2 | Net assets (in $000’s) | Net expenses including reimbursements and waivers | Net income | Total expenses excluding reimbursements and waivers | Portfolio Turnover4 | |||||||||||||||||||||||
$ | 0.37 | $ | 20.56 | 6.01 | % | $ | 72,771 | 0.92 | % | 1.93 | % | 0.92 | % | 49 | %5 | |||||||||||||||
0.48 | 19.75 | (1.08 | %) | 64,587 | 0.98 | % | 1.62 | % | 0.98 | % | 50 | %5 | ||||||||||||||||||
2.66 | 20.43 | 5.95 | % | 55,548 | 1.09 | % | 2.13 | % | 1.22 | % | 134 | %5 | ||||||||||||||||||
0.19 | 21.78 | 24.56 | % | 44,461 | 1.24 | % | 1.17 | % | 1.59 | % | 28 | % | ||||||||||||||||||
0.22 | 17.67 | 12.67 | % | 33,988 | 1.24 | % | 1.37 | % | 1.69 | % | 35 | % | ||||||||||||||||||
$ | 0.42 | $ | 20.65 | 6.30 | % | $ | 37,920 | 0.67 | % | 2.09 | % | 0.67 | % | 49 | %5 | |||||||||||||||
0.53 | 19.83 | (0.86 | %) | 20,422 | 0.74 | % | 1.85 | % | 0.74 | % | 50 | %5 | ||||||||||||||||||
2.72 | 20.52 | 6.21 | % | 13,146 | 0.78 | % | 1.73 | % | 0.84 | % | 134 | %5 | ||||||||||||||||||
0.22 | 21.86 | 24.88 | % | 1,914 | 0.99 | % | 1.51 | % | 1.34 | % | 28 | % | ||||||||||||||||||
0.27 | 17.71 | 12.92 | % | 1,295 | 0.99 | % | 1.56 | % | 1.44 | % | 35 | % | ||||||||||||||||||
4 | Effective June 4, 2014, the Global Women’s Index Fund acquired the assets of the Pax World Global Women’s Equality Fund, Pax World Global Women’s Equality Fund (the “Predecessor Fund”) is treated as the survivor of the Reorganization for accounting and performance reporting purposes. Accordingly, all performance and other information shown for periods prior to June 4, 2014 is that of the Predecessor Fund. |
5 | To manage cash flows, minimize trading costs and equitize cash balances in between trading blocks of securities, the Global Women’s Index Fund utilizes one or more exchange-traded funds (ETFs), the combination of which is intended to track the Fund’s broad-based benchmark. These investments are frequent and short-term, however, the Fund is required to include such ETF investment activity in the calculation of its portfolio turnover. Had such transactions been excluded, the portfolio turnover would have been 21% for the year ended December 31, 2016, 25% for the year ended December 31, 2015, and 99% for the year ended December 31, 2014. |
SEE NOTES TO FINANCIAL STATEMENTS
135
December 31, 2016
|
Financial Highlights, continued |
Selected data for a share outstanding throughout each period. |
Income (loss) from investment operations | Distributions to shareholders | |||||||||||||||||||||||
| Net asset value, beginning of period | Net income1 | Net realized and unrealized gain (loss) | Total from investment operations | From net investment income | From net realized gains | ||||||||||||||||||
Global Environmental Markets Fund | ||||||||||||||||||||||||
Individual Investor Class | ||||||||||||||||||||||||
Year Ended December 31, 2016 | $ | 11.96 | $ | 0.08 | $ | 1.19 | $ | 1.27 | $ | 0.07 | $ | — | ||||||||||||
Year Ended December 31, 2015 | 12.25 | 0.04 | (0.21 | ) | (0.17 | ) | 0.04 | 0.08 | ||||||||||||||||
Year Ended December 31, 2014 | 12.80 | 0.07 | (0.42 | ) | (0.35 | ) | 0.12 | 0.08 | ||||||||||||||||
Year Ended December 31, 2013 | 9.88 | 0.07 | 3.07 | 3.14 | 0.20 | 0.02 | ||||||||||||||||||
Year Ended December 31, 2012 | 8.42 | 0.06 | 1.55 | 1.61 | 0.15 | — | ||||||||||||||||||
Class A | ||||||||||||||||||||||||
Year Ended December 31, 2016 | $ | 11.94 | $ | 0.08 | $ | 1.19 | $ | 1.27 | $ | 0.07 | $ | — | ||||||||||||
Year Ended December 31, 2015 | 12.23 | 0.04 | (0.21 | ) | (0.17 | ) | 0.04 | 0.08 | ||||||||||||||||
Year Ended December 31, 2014 | 12.78 | 0.04 | (0.38 | ) | (0.34 | ) | 0.13 | 0.08 | ||||||||||||||||
Period Ended December 31, 20135 | 10.75 | (0.02 | ) | 2.29 | 2.27 | 0.22 | 0.02 | |||||||||||||||||
Institutional Class | ||||||||||||||||||||||||
Year Ended December 31, 2016 | $ | 12.03 | $ | 0.11 | $ | 1.20 | $ | 1.31 | $ | 0.10 | $ | — | ||||||||||||
Year Ended December 31, 2015 | 12.31 | 0.07 | (0.21 | ) | (0.14 | ) | 0.06 | 0.08 | ||||||||||||||||
Year Ended December 31, 2014 | 12.86 | 0.08 | (0.40 | ) | (0.32 | ) | 0.15 | 0.08 | ||||||||||||||||
Year Ended December 31, 2013 | 9.92 | 0.09 | 3.10 | 3.19 | 0.23 | 0.02 | ||||||||||||||||||
Year Ended December 31, 2012 | 8.46 | 0.08 | 1.56 | 1.64 | 0.18 | — | ||||||||||||||||||
Class R | ||||||||||||||||||||||||
Year Ended December 31, 2016 | $ | 11.86 | $ | 0.04 | $ | 1.19 | $ | 1.23 | $ | 0.04 | $ | — | ||||||||||||
Year Ended December 31, 2015 | 12.16 | 0.01 | (0.21 | ) | (0.20 | ) | 0.02 | 0.08 | ||||||||||||||||
Year Ended December 31, 2014 | 12.71 | 0.04 | (0.42 | ) | (0.38 | ) | 0.09 | 0.08 | ||||||||||||||||
Year Ended December 31, 2013 | 9.81 | 0.05 | 3.05 | 3.10 | 0.18 | 0.02 | ||||||||||||||||||
Year Ended December 31, 2012 | 8.37 | 0.04 | 1.54 | 1.58 | 0.14 | — | ||||||||||||||||||
1 | Based on average shares outstanding during the period. |
2 | Total return represents aggregate total return for the period indicated, includes reinvestment of all dividends and distributions, and does not reflect the deduction of any applicable sales charges. Total returns for periods of less than one year have not been annualized. |
SEE NOTES TO FINANCIAL STATEMENTS
136
December 31, 2016 |
Ratios to average net assets3 | ||||||||||||||||||||||||||||||
Total distributions | Net asset value, | Total return2 | Net assets (in $000’s) | Net expenses including reimbursements and waivers | Net income | Total expenses excluding reimbursements and waivers | Portfolio Turnover4 | |||||||||||||||||||||||
$ | 0.07 | $ | 13.16 | 10.62 | % | $ | 122,610 | 1.29 | % | 0.61 | % | 1.34 | % | 30 | % | |||||||||||||||
0.12 | 11.96 | (1.45 | %) | 104,712 | 1.40 | % | 0.31 | % | 1.41 | % | 22 | % | ||||||||||||||||||
0.20 | 12.25 | (2.78 | %) | 96,255 | 1.40 | % | 0.56 | % | 1.46 | % | �� | 27 | % | |||||||||||||||||
0.22 | 12.80 | 32.01 | % | 94,214 | 1.40 | % | 0.65 | % | 1.54 | % | 20 | % | ||||||||||||||||||
0.15 | 9.88 | 19.27 | % | 46,392 | 1.40 | % | 0.64 | % | 1.81 | % | 46 | % | ||||||||||||||||||
$ | 0.07 | $ | 13.14 | 10.62 | % | $ | 13,042 | 1.30 | % | 0.63 | % | 1.34 | % | 30 | % | |||||||||||||||
0.12 | 11.94 | (1.44 | %) | 13,330 | 1.40 | % | 0.30 | % | 1.41 | % | 22 | % | ||||||||||||||||||
0.21 | 12.23 | (2.73 | %) | 9,763 | 1.40 | % | 0.31 | % | 1.46 | % | 27 | % | ||||||||||||||||||
0.24 | 12.78 | 21.32 | % | 2,188 | 1.40 | % | (0.23 | %) | 1.54 | % | 20 | % | ||||||||||||||||||
$ | 0.10 | $ | 13.24 | 10.91 | % | $ | 209,759 | 1.04 | % | 0.86 | % | 1.09 | % | 30 | % | |||||||||||||||
0.14 | 12.03 | (1.21 | %) | 133,930 | 1.15 | % | 0.55 | % | 1.16 | % | 22 | % | ||||||||||||||||||
0.23 | 12.31 | (2.53 | %) | 87,605 | 1.15 | % | 0.63 | % | 1.21 | % | 27 | % | ||||||||||||||||||
0.25 | 12.86 | 32.37 | % | 42,898 | 1.15 | % | 0.78 | % | 1.29 | % | 20 | % | ||||||||||||||||||
0.18 | 9.92 | 19.47 | % | 10,644 | 1.15 | % | 0.90 | % | 1.56 | % | 46 | % | ||||||||||||||||||
$ | 0.04 | $ | 13.05 | 10.35 | % | $ | 2,794 | 1.54 | % | 0.36 | % | 1.59 | % | 30 | % | |||||||||||||||
0.10 | 11.86 | (1.65 | %) | 2,305 | 1.65 | % | 0.06 | % | 1.66 | % | 22 | % | ||||||||||||||||||
0.17 | 12.16 | (3.04 | %) | 2,501 | 1.65 | % | 0.30 | % | 1.71 | % | 27 | % | ||||||||||||||||||
0.20 | 12.71 | 31.72 | % | 2,476 | 1.65 | % | 0.42 | % | 1.79 | % | 20 | % | ||||||||||||||||||
0.14 | 9.81 | 18.95 | % | 1,545 | 1.65 | % | 0.42 | % | 2.06 | % | 46 | % | ||||||||||||||||||
3 | Ratios representing periods of less than one year have been annualized. |
4 | Not annualized |
5 | Per share data is reflected from class inception date of May 1, 2013. |
SEE NOTES TO FINANCIAL STATEMENTS
137
December 31, 2016
|
Financial Highlights, continued |
Selected data for a share outstanding throughout each period. |
Income (loss) from investment operations | Distributions to shareholders | |||||||||||||||||||||||
| Net asset value, beginning of period | Net income1 | Net realized and unrealized gain (loss) | Total from investment operations | From net investment income | From net realized gains | ||||||||||||||||||
Core Bond Fund5 | ||||||||||||||||||||||||
Individual Investor Class | ||||||||||||||||||||||||
Period Ended December 31, 2016 | $ | 9.93 | $ | 0.01 | $ | 0.08 | $ | 0.09 | $ | 0.01 | $ | — | ||||||||||||
Institutional Class | ||||||||||||||||||||||||
Period Ended December 31, 2016 | $ | 9.93 | $ | 0.01 | $ | 0.08 | $ | 0.09 | $ | 0.01 | $ | — | ||||||||||||
High Yield Bond Fund | ||||||||||||||||||||||||
Individual Investor Class | ||||||||||||||||||||||||
Year Ended December 31, 2016 | $ | 6.25 | $ | 0.38 | $ | 0.45 | $ | 0.83 | $ | 0.37 | $ | — | ||||||||||||
Year Ended December 31, 2015 | 7.03 | 0.40 | (0.78 | ) | (0.38 | ) | 0.40 | — | ||||||||||||||||
Year Ended December 31, 2014 | 7.57 | 0.44 | (0.53 | ) | (0.09 | ) | 0.44 | 0.01 | ||||||||||||||||
Year Ended December 31, 2013 | 7.53 | 0.46 | 0.07 | 0.53 | 0.48 | 0.01 | ||||||||||||||||||
Year Ended December 31, 2012 | 7.20 | 0.53 | 0.40 | 0.93 | 0.53 | 0.07 | ||||||||||||||||||
Class A | ||||||||||||||||||||||||
Year Ended December 31, 2016 | $ | 6.26 | $ | 0.38 | $ | 0.45 | $ | 0.83 | $ | 0.37 | $ | — | ||||||||||||
Year Ended December 31, 2015 | 7.04 | 0.40 | (0.78 | ) | (0.38 | ) | 0.40 | — | ||||||||||||||||
Year Ended December 31, 2014 | 7.57 | 0.43 | (0.51 | ) | (0.08 | ) | 0.44 | 0.01 | ||||||||||||||||
Period Ended December 31, 20137 | 7.67 | 0.29 | (0.08 | ) | 0.21 | 0.30 | 0.01 | |||||||||||||||||
Institutional Class | ||||||||||||||||||||||||
Year Ended December 31, 2016 | $ | 6.23 | $ | 0.39 | $ | 0.45 | $ | 0.84 | $ | 0.39 | $ | — | ||||||||||||
Year Ended December 31, 2015 | 7.01 | 0.42 | (0.78 | ) | (0.36 | ) | 0.42 | — | ||||||||||||||||
Year Ended December 31, 2014 | 7.54 | 0.46 | (0.52 | ) | (0.06 | ) | 0.46 | 0.01 | ||||||||||||||||
Year Ended December 31, 2013 | 7.50 | 0.47 | 0.05 | 0.52 | 0.47 | 0.01 | ||||||||||||||||||
Year Ended December 31, 2012 | 7.17 | 0.55 | 0.40 | 0.95 | 0.55 | 0.07 | ||||||||||||||||||
Class R | ||||||||||||||||||||||||
Year Ended December 31, 2016 | $ | 6.25 | $ | 0.36 | $ | 0.46 | $ | 0.82 | $ | 0.36 | $ | — | ||||||||||||
Year Ended December 31, 2015 | 7.03 | 0.38 | (0.78 | ) | (0.40 | ) | 0.38 | — | ||||||||||||||||
Year Ended December 31, 2014 | 7.57 | 0.42 | (0.53 | ) | (0.11 | ) | 0.42 | 0.01 | ||||||||||||||||
Year Ended December 31, 2013 | 7.53 | 0.44 | 0.05 | 0.49 | 0.44 | 0.01 | ||||||||||||||||||
Year Ended December 31, 2012 | 7.19 | 0.52 | 0.41 | 0.93 | 0.52 | 0.07 | ||||||||||||||||||
1 | Based on average shares outstanding during the period. |
2 | Total return represents aggregate total return for the period indicated, includes reinvestment of all dividends and distributions, and does not reflect the deduction of any applicable sales charges. Total returns for periods of less than one year have not been annualized. |
3 | Ratios representing periods of less than one year have been annualized. |
4 | Not annualized |
SEE NOTES TO FINANCIAL STATEMENTS
138
December 31, 2016 |
Ratios to average net assets3 | ||||||||||||||||||||||||||||||
Total distributions | Net asset value, | Total return2 | Net assets (in $000’s) | Net expenses including reimbursements and waivers | Net income | Total expenses excluding reimbursements and waivers | Portfolio Turnover4 | |||||||||||||||||||||||
$ | 0.01 | $ | 10.01 | 0.87 | % | $ | 109 | 0.74 | % | 1.99 | % | 0.74 | % | 1 | %6 | |||||||||||||||
$ | 0.01 | $ | 10.01 | 0.93 | % | $ | 602,384 | 0.49 | % | 2.23 | % | 0.49 | % | 1 | %6 | |||||||||||||||
$ | 0.37 | $ | 6.71 | 13.81 | % | $ | 228,936 | 0.99 | % | 5.90 | % | 0.99 | % | 111 | % | |||||||||||||||
0.40 | 6.25 | (5.74 | %) | 242,038 | 0.96 | % | 5.82 | % | 0.96 | % | 78 | % | ||||||||||||||||||
0.45 | 7.03 | (1.41 | %)8 | 351,180 | 0.98 | % | 5.81 | % | 0.98 | % | 74 | % | ||||||||||||||||||
0.49 | 7.57 | 6.91 | % | 472,484 | 0.96 | % | 6.05 | % | 0.96 | % | 58 | % | ||||||||||||||||||
0.60 | 7.53 | 13.41 | % | 346,071 | 0.98 | % | 7.20 | % | 0.98 | % | 73 | % | ||||||||||||||||||
$ | 0.37 | $ | 6.72 | 13.80 | % | $ | 5,623 | 0.98 | % | 5.88 | % | 0.98 | % | 111 | % | |||||||||||||||
0.40 | 6.26 | (5.73 | %) | 5,923 | 0.96 | % | 5.87 | % | 0.96 | % | 78 | % | ||||||||||||||||||
0.45 | 7.04 | (1.27 | %)8 | 3,061 | 0.98 | % | 5.80 | % | 0.98 | % | 74 | % | ||||||||||||||||||
0.31 | 7.57 | 2.78 | % | 786 | 0.96 | % | 5.87 | % | 0.96 | % | 58 | % | ||||||||||||||||||
$ | 0.39 | $ | 6.68 | 13.96 | % | $ | 166,051 | 0.74 | % | 6.15 | % | 0.74 | % | 111 | % | |||||||||||||||
0.42 | 6.23 | (5.54 | %) | 162,425 | 0.71 | % | 6.08 | % | 0.71 | % | 78 | % | ||||||||||||||||||
0.47 | 7.01 | (1.05 | %)8 | 201,435 | 0.73 | % | 6.07 | % | 0.73 | % | 74 | % | ||||||||||||||||||
0.48 | 7.54 | 7.18 | % | 187,522 | 0.71 | % | 6.32 | % | 0.71 | % | 58 | % | ||||||||||||||||||
0.62 | 7.50 | 13.72 | % | 135,382 | 0.73 | % | 7.46 | % | 0.73 | % | 73 | % | ||||||||||||||||||
$ | 0.36 | $ | 6.71 | 13.52 | % | $ | 786 | 1.24 | % | 5.64 | % | 1.24 | % | 111 | % | |||||||||||||||
0.38 | 6.25 | (5.97 | %) | 674 | 1.21 | % | 5.57 | % | 1.21 | % | 78 | % | ||||||||||||||||||
0.43 | 7.03 | (1.64 | %)8 | 1,115 | 1.23 | % | 5.56 | % | 1.23 | % | 74 | % | ||||||||||||||||||
0.45 | 7.57 | 6.63 | % | 694 | 1.21 | % | 5.82 | % | 1.21 | % | 58 | % | ||||||||||||||||||
0.59 | 7.53 | 13.29 | % | 882 | 1.23 | % | 6.96 | % | 1.23 | % | 73 | % | ||||||||||||||||||
5 | Per share data is reflected from the Fund’s inception date of December 16, 2016. |
6 | For purposes of calculating the turnover ratio for the Core Bond Fund, transactions related to the in-kind subscription have been excluded (Note C). |
7 | Per share data is reflected from class inception date of May 1, 2013. |
8 | In 2014, the Investment Adviser reimbursed the Fund $90,278 for a realized loss incurred by the Fund due to a trading error. Before the reimbursement from Adviser for the loss on trading error, the difference in the total return for the year would have been less than 0.005% for each class of shares. |
SEE NOTES TO FINANCIAL STATEMENTS
139
December 31, 2016
|
Financial Highlights, continued |
Selected data for a share outstanding throughout each period. |
Income (loss) from investment operations | Distributions to shareholders | |||||||||||||||||||||||
| Net asset value, beginning of period | Net income1 | Net realized and unrealized gain (loss) | Total from investment operations | From net investment income | From net realized gains | ||||||||||||||||||
Balanced Fund | ||||||||||||||||||||||||
Individual Investor Class | ||||||||||||||||||||||||
Year Ended December 31, 2016 | $ | 21.76 | $ | 0.29 | $ | 0.97 | $ | 1.26 | $ | 0.29 | $ | 0.39 | ||||||||||||
Year Ended December 31, 2015 | 23.70 | 0.25 | (0.37 | ) | (0.12 | ) | 0.20 | 1.62 | ||||||||||||||||
Year Ended December 31, 2014 | 24.47 | 0.23 | 1.72 | 1.95 | 0.22 | 2.50 | ||||||||||||||||||
Year Ended December 31, 2013 | 23.73 | 0.28 | 3.54 | 3.82 | 0.21 | 2.87 | ||||||||||||||||||
Year Ended December 31, 2012 | 21.67 | 0.34 | 2.09 | 2.43 | 0.37 | — | ||||||||||||||||||
Institutional Class | ||||||||||||||||||||||||
Year Ended December 31, 2016 | $ | 22.04 | $ | 0.35 | $ | 0.98 | $ | 1.33 | $ | 0.35 | $ | 0.39 | ||||||||||||
Year Ended December 31, 2015 | 23.97 | 0.32 | (0.37 | ) | (0.05 | ) | 0.26 | 1.62 | ||||||||||||||||
Year Ended December 31, 2014 | 24.73 | 0.29 | 1.74 | 2.03 | 0.29 | 2.50 | ||||||||||||||||||
Year Ended December 31, 2013 | 23.94 | 0.35 | 3.58 | 3.93 | 0.27 | 2.87 | ||||||||||||||||||
Year Ended December 31, 2012 | 21.86 | 0.41 | 2.10 | 2.51 | 0.43 | — | ||||||||||||||||||
Class R | ||||||||||||||||||||||||
Year Ended December 31, 2016 | $ | 21.91 | $ | 0.24 | $ | 0.96 | $ | 1.20 | $ | 0.23 | $ | 0.39 | ||||||||||||
Year Ended December 31, 2015 | 23.84 | 0.20 | (0.36 | ) | (0.16 | ) | 0.15 | 1.62 | ||||||||||||||||
Year Ended December 31, 2014 | 24.62 | 0.17 | 1.72 | 1.89 | 0.17 | 2.50 | ||||||||||||||||||
Year Ended December 31, 2013 | 23.86 | 0.22 | 3.56 | 3.78 | 0.15 | 2.87 | ||||||||||||||||||
Year Ended December 31, 2012 | 21.79 | 0.29 | 2.10 | 2.39 | 0.32 | — | ||||||||||||||||||
1 | Based on average shares outstanding during the period. |
2 | Total return represents aggregate total return for the period indicated, includes reinvestment of all dividends and distributions, and does not reflect the deduction of any applicable sales charges. Total returns for periods of less than one year have not been annualized. |
SEE NOTES TO FINANCIAL STATEMENTS
140
December 31, 2016 |
Ratios to average net assets3 | ||||||||||||||||||||||||||||||
Total distributions | Net asset value, | Total return2 | Net assets (in $000’s) | Net expenses including reimbursements and waivers | Net income | Total expenses excluding reimbursements and waivers | Portfolio Turnover4 | |||||||||||||||||||||||
$ | 0.68 | $ | 22.34 | 5.81 | % | $ | 1,596,717 | 0.77 | % | 1.31 | % | 0.87 | % | 49 | % | |||||||||||||||
1.82 | 21.76 | (0.53 | %) | 1,596,682 | 0.87 | % | 1.08 | % | 0.90 | % | 61 | % | ||||||||||||||||||
2.72 | 23.70 | 8.00 | % | 1,740,414 | 0.91 | % | 0.91 | % | 0.92 | % | 52 | % | ||||||||||||||||||
3.08 | 24.47 | 16.34 | % | 1,771,519 | 0.91 | % | 1.12 | % | 0.92 | % | 62 | % | ||||||||||||||||||
0.37 | 23.73 | 11.28 | % | 1,685,217 | 0.94 | % | 1.50 | % | 0.94 | % | 31 | % | ||||||||||||||||||
$ | 0.74 | $ | 22.63 | 6.06 | % | $ | 279,574 | 0.52 | % | 1.56 | % | 0.62 | % | 49 | % | |||||||||||||||
1.88 | 22.04 | (0.23 | %) | 256,640 | 0.62 | % | 1.34 | % | 0.65 | % | 61 | % | ||||||||||||||||||
2.79 | 23.97 | 8.21 | % | 248,979 | 0.66 | % | 1.16 | % | 0.67 | % | 52 | % | ||||||||||||||||||
3.14 | 24.73 | 16.70 | % | 225,325 | 0.66 | % | 1.37 | % | 0.67 | % | 62 | % | ||||||||||||||||||
0.43 | 23.94 | 11.56 | % | 142,848 | 0.69 | % | 1.75 | % | 0.69 | % | 31 | % | ||||||||||||||||||
$ | 0.62 | $ | 22.49 | 5.50 | % | $ | 6,263 | 1.02 | % | 1.06 | % | 1.12 | % | 49 | % | |||||||||||||||
1.77 | 21.91 | (0.72 | %) | 6,087 | 1.12 | % | 0.84 | % | 1.15 | % | 61 | % | ||||||||||||||||||
2.67 | 23.84 | 7.68 | % | 5,328 | 1.16 | % | 0.66 | % | 1.17 | % | 52 | % | ||||||||||||||||||
3.02 | 24.62 | 16.09 | % | 4,548 | 1.16 | % | 0.86 | % | 1.17 | % | 62 | % | ||||||||||||||||||
0.32 | 23.86 | 11.02 | % | 3,341 | 1.19 | % | 1.25 | % | 1.19 | % | 31 | % | ||||||||||||||||||
3 | Ratios representing periods of less than one year have been annualized. |
4 | Not annualized |
SEE NOTES TO FINANCIAL STATEMENTS
141
December 31, 2016
|
Financial Highlights, continued |
Selected data for a share outstanding throughout each period. |
Income (loss) from investment operations | Distributions to shareholders | |||||||||||||||||||||||
| Net asset value, beginning of period | Net income1 | Net realized and unrealized gain (loss) | Total from investment operations | From net investment income | From net realized gains | ||||||||||||||||||
Capital Appreciation Fund | ||||||||||||||||||||||||
Individual Class | ||||||||||||||||||||||||
Period Ended December 31, 20165 | $ | 11.68 | $ | 0.16 | $ | 0.71 | $ | 0.87 | $ | — | $ | 0.18 | ||||||||||||
Class A | ||||||||||||||||||||||||
Year Ended December 31, 2016 | $ | 11.63 | $ | 0.13 | $ | 0.80 | $ | 0.93 | $ | 0.01 | $ | 0.18 | ||||||||||||
Year Ended December 31, 2015 | 12.49 | 0.15 | (0.60 | ) | (0.45 | ) | 0.13 | 0.28 | ||||||||||||||||
Year Ended December 31, 2014 | 12.13 | 0.20 | 0.62 | 0.82 | 0.16 | 0.30 | ||||||||||||||||||
Year Ended December 31, 2013 | 11.30 | 0.16 | 2.50 | 2.66 | 0.13 | 1.70 | ||||||||||||||||||
Year Ended December 31, 2012 | 10.38 | 0.18 | 0.91 | 1.09 | 0.17 | — | ||||||||||||||||||
Institutional Class | ||||||||||||||||||||||||
Year Ended December 31, 2016 | $ | 11.66 | $ | 0.17 | $ | 0.80 | $ | 0.97 | $ | 0.01 | $ | 0.18 | ||||||||||||
Year Ended December 31, 2015 | 12.52 | 0.17 | (0.59 | ) | (0.42 | ) | 0.16 | 0.28 | ||||||||||||||||
Year Ended December 31, 2014 | 12.15 | 0.24 | 0.62 | 0.86 | 0.19 | 0.30 | ||||||||||||||||||
Year Ended December 31, 2013 | 11.30 | 0.22 | 2.49 | 2.71 | 0.16 | 1.70 | ||||||||||||||||||
Year Ended December 31, 2012 | 10.37 | 0.20 | 0.93 | 1.13 | 0.20 | — | ||||||||||||||||||
Class C | ||||||||||||||||||||||||
Year Ended December 31, 2016 | $ | 11.56 | $ | 0.04 | $ | 0.79 | $ | 0.83 | $ | — | $ | 0.18 | ||||||||||||
Year Ended December 31, 2015 | 12.44 | 0.05 | (0.59 | ) | (0.54 | ) | 0.06 | 0.28 | ||||||||||||||||
Year Ended December 31, 2014 | 12.08 | 0.11 | 0.61 | 0.72 | 0.06 | 0.30 | ||||||||||||||||||
Year Ended December 31, 2013 | 11.27 | 0.06 | 2.50 | 2.56 | 0.05 | 1.70 | ||||||||||||||||||
Year Ended December 31, 2012 | 10.34 | 0.09 | 0.95 | 1.04 | 0.08 | — | ||||||||||||||||||
1 | Based on average shares outstanding during the period. |
2 | Total return represents aggregate total return for the period indicated, and does not reflect the deduction of any applicable sales charges. Total returns for periods of less than one year have not been annualized. |
3 | Ratios representing periods of less than one year have been annualized. |
4 | Not annualized. |
SEE NOTES TO FINANCIAL STATEMENTS
142
December 31, 2016 |
Ratios to average net assets3 | ||||||||||||||||||||||||||||||
Total distributions | Net asset value, | Total return2 | Net assets (in $000’s) | Net expenses including reimbursements and waivers | Net income | Total expenses excluding reimbursements and waivers | Portfolio Turnover4 | |||||||||||||||||||||||
$ | 0.18 | $ | 12.37 | 7.51 | % | $ | 55 | 0.95 | % | 1.75 | % | 1.52 | % | 38 | %6 | |||||||||||||||
$ | 0.19 | $ | 12.37 | 8.03 | % | $ | 16,758 | 0.94 | % | 1.08 | % | 1.49 | % | 38 | %6 | |||||||||||||||
0.41 | 11.63 | (3.75 | %) | 13,657 | 1.01 | % | 1.20 | % | 1.99 | % | 12 | % | ||||||||||||||||||
0.46 | 12.49 | 6.83 | % | 10,785 | 1.02 | % | 1.65 | % | 2.76 | % | 12 | % | ||||||||||||||||||
1.83 | 12.13 | 23.86 | % | 5,966 | 1.12 | % | 1.25 | % | 3.02 | % | 140 | % | ||||||||||||||||||
0.17 | 11.30 | 10.60 | % | 3,618 | 1.13 | % | 1.64 | % | 3.61 | % | 48 | % | ||||||||||||||||||
$ | 0.19 | $ | 12.44 | 8.38 | % | $ | 5,898 | 0.69 | % | 1.42 | % | 1.23 | % | 38 | %6 | |||||||||||||||
0.44 | 11.66 | (3.51 | %) | 2,525 | 0.76 | % | 1.35 | % | 1.74 | % | 12 | % | ||||||||||||||||||
0.49 | 12.52 | 7.13 | % | 2,525 | 0.77 | % | 1.96 | % | 2.52 | % | 12 | % | ||||||||||||||||||
1.86 | 12.15 | 24.32 | % | 1,487 | 0.87 | % | 1.77 | % | 2.77 | % | 140 | % | ||||||||||||||||||
0.20 | 11.30 | 10.96 | % | 5,286 | 0.88 | % | 1.86 | % | 3.36 | % | 48 | % | ||||||||||||||||||
$ | 0.18 | $ | 12.21 | 7.24 | % | $ | 5,275 | 1.69 | % | 0.33 | % | 2.24 | % | 38 | %6 | |||||||||||||||
0.34 | 11.56 | (4.49 | %) | 4,095 | 1.76 | % | 0.41 | % | 2.74 | % | 12 | % | ||||||||||||||||||
0.36 | 12.44 | 6.02 | % | 4,283 | 1.77 | % | 0.89 | % | 3.52 | % | 12 | % | ||||||||||||||||||
1.75 | 12.08 | 22.94 | % | 3,694 | 1.87 | % | 0.44 | % | 3.77 | % | 140 | % | ||||||||||||||||||
0.08 | 11.27 | 9.80 | % | 2,240 | 1.88 | % | 0.84 | % | 4.35 | % | 48 | % | ||||||||||||||||||
5 | Per share data is reflected from class inception date of April 1, 2016. |
6 | For the purposes of calculating the turnover ratio for the Capital Appreciation Fund, transactions related to the Reorganization have been excluded (Note A). |
SEE NOTES TO FINANCIAL STATEMENTS
143
December 31, 2016
|
Financial Highlights, continued |
Selected data for a share outstanding throughout each period. |
Income (loss) from investment operations | Distributions to shareholders | |||||||||||||||||||||||
| Net asset value, beginning of period | Net income1 | Net realized and unrealized gain(loss) | Total from investment operations | From net investment income | From net realized gains | ||||||||||||||||||
Total Return Fund | ||||||||||||||||||||||||
Individual Class | ||||||||||||||||||||||||
Period Ended December 31, 20165 | $ | 10.57 | $ | 0.16 | $ | 0.24 | $ | 0.40 | $ | 0.12 | $ | 0.04 | ||||||||||||
Class A | ||||||||||||||||||||||||
Year Ended December 31, 2016 | $ | 10.49 | $ | 0.20 | $ | 0.29 | $ | 0.49 | $ | 0.13 | $ | 0.04 | ||||||||||||
Year Ended December 31, 2015 | 11.04 | 0.23 | (0.37 | ) | (0.14 | ) | 0.20 | 0.21 | ||||||||||||||||
Year Ended December 31, 2014 | 10.72 | 0.25 | 0.44 | 0.69 | 0.22 | 0.15 | ||||||||||||||||||
Year Ended December 31, 2013 | 10.92 | 0.22 | 0.81 | 1.03 | 0.20 | 1.03 | ||||||||||||||||||
Year Ended December 31, 2012 | 10.51 | 0.22 | 0.51 | 0.73 | 0.22 | 0.10 | ||||||||||||||||||
Institutional Class | ||||||||||||||||||||||||
Year Ended December 31, 2016 | $ | 10.50 | $ | 0.23 | $ | 0.29 | $ | 0.52 | $ | 0.15 | $ | 0.04 | ||||||||||||
Year Ended December 31, 2015 | 11.06 | 0.24 | (0.37 | ) | (0.13 | ) | 0.22 | 0.21 | ||||||||||||||||
Year Ended December 31, 2014 | 10.73 | 0.28 | 0.44 | 0.72 | 0.24 | 0.15 | ||||||||||||||||||
Year Ended December 31, 2013 | 10.93 | 0.25 | 0.81 | 1.06 | 0.23 | 1.03 | ||||||||||||||||||
Year Ended December 31, 2012 | 10.52 | 0.24 | 0.52 | 0.76 | 0.25 | 0.10 | ||||||||||||||||||
Class C | ||||||||||||||||||||||||
Year Ended December 31, 2016 | $ | 10.34 | $ | 0.12 | $ | 0.28 | $ | 0.40 | $ | 0.05 | $ | 0.04 | ||||||||||||
Year Ended December 31, 2015 | 10.90 | 0.14 | (0.37 | ) | (0.23 | ) | 0.12 | 0.21 | ||||||||||||||||
Year Ended December 31, 2014 | 10.60 | 0.16 | 0.43 | 0.59 | 0.14 | 0.15 | ||||||||||||||||||
Year Ended December 31, 2013 | 10.82 | 0.13 | 0.81 | 0.94 | 0.13 | 1.03 | ||||||||||||||||||
Year Ended December 31, 2012 | 10.42 | 0.14 | 0.51 | 0.65 | 0.15 | 0.10 | ||||||||||||||||||
1 | Based on average shares outstanding during the period. |
2 | Total return represents aggregate total return for the period indicated, and does not reflect the deduction of any applicable sales charges. Total returns for periods of less than one year have not been annualized. |
3 | Ratios representing periods of less than one year have been annualized. |
4 | Not annualized. |
SEE NOTES TO FINANCIAL STATEMENTS
144
December 31, 2016 |
Ratios to average net assets3 | ||||||||||||||||||||||||||||||
Total distributions | Net asset value, | Total return2 | Net assets (in $000’s) | Net expenses including reimbursements and waivers | Net income | Total expenses excluding reimbursements and waivers | Portfolio Turnover4 | |||||||||||||||||||||||
$ | 0.16 | $ | 10.81 | 3.87 | % | $ | 88 | 0.89 | % | 1.91 | % | 1.45 | % | 27 | %6 | |||||||||||||||
$ | 0.17 | $ | 10.81 | 4.70 | % | $ | 15,252 | 0.88 | % | 1.86 | % | 1.49 | % | 27 | %6 | |||||||||||||||
0.41 | 10.49 | (1.40 | %) | 5,476 | 0.90 | % | 2.06 | % | 2.89 | % | 44 | % | ||||||||||||||||||
0.37 | 11.04 | 6.46 | % | 4,292 | 0.92 | % | 2.24 | % | 4.11 | % | 27 | % | ||||||||||||||||||
1.23 | 10.72 | 9.65 | % | 2,728 | 0.99 | % | 1.93 | % | 4.16 | % | 97 | % | ||||||||||||||||||
0.32 | 10.92 | 6.99 | % | 1,835 | 1.00 | % | 2.01 | % | 4.34 | % | 84 | % | ||||||||||||||||||
$ | 0.19 | $ | 10.83 | 5.06 | % | $ | 8,578 | 0.63 | % | 2.13 | % | 1.24 | % | 27 | %6 | |||||||||||||||
0.43 | 10.50 | (1.26 | %) | 2,760 | 0.65 | % | 2.20 | % | 2.64 | % | 44 | % | ||||||||||||||||||
0.39 | 11.06 | 6.80 | % | 2,525 | 0.67 | % | 2.54 | % | 3.86 | % | 27 | % | ||||||||||||||||||
1.26 | 10.73 | 9.89 | % | 2,168 | 0.74 | % | 2.17 | % | 3.91 | % | 97 | % | ||||||||||||||||||
0.35 | 10.93 | 7.23 | % | 4,761 | 0.75 | % | 2.25 | % | 4.08 | % | 84 | % | ||||||||||||||||||
$ | 0.09 | $ | 10.65 | 3.96 | % | $ | 7,668 | 1.63 | % | 1.11 | % | 2.23 | % | 27 | %6 | |||||||||||||||
0.33 | 10.34 | (2.20 | %) | 2,856 | 1.65 | % | 1.33 | % | 3.64 | % | 44 | % | ||||||||||||||||||
0.29 | 10.90 | 5.65 | % | 1,887 | 1.67 | % | 1.50 | % | 4.86 | % | 27 | % | ||||||||||||||||||
1.16 | 10.60 | 8.82 | % | 1,450 | 1.74 | % | 1.19 | % | 4.91 | % | 97 | % | ||||||||||||||||||
0.25 | 10.82 | 6.23 | % | 882 | 1.75 | % | 1.27 | % | 5.09 | % | 84 | % | ||||||||||||||||||
5 | Per share data is reflected from class inception date of April 1, 2016. |
6 | For the purposes of calculating the turnover ratio for the Total Return Fund, transactions related to the Reorganization have been excluded (Note A). |
SEE NOTES TO FINANCIAL STATEMENTS
145
December 31, 2016
|
Notes to Financial Statements |
Pax World Funds Series Trust I and Pax World Fund Series Trust III
NOTE A—Organization and Summary of Significant Accounting Policies
Organization Pax World Funds Series Trust I (“Trust I”), which is registered under the Investment Company Act of 1940, as amended (the “1940 Act”), is an open-end management investment company organized under the laws of the Commonwealth of Massachusetts on May 25, 2006. As of December 31, 2016, Trust I offered twelve investment funds: The Pax Large Cap Fund (the “Large Cap Fund”), Mid Cap Fund (the “Mid Cap Fund”), Pax Small Cap Fund (the “Small Cap Fund”), Pax ESG Beta Quality Fund (the “ESG Beta Quality Fund”), Pax ESG Beta Dividend Fund (the “ESG Beta Dividend Fund”), the Pax MSCI International ESG Index Fund (“International Index Fund”), Pax Global Environmental Markets Fund (the “Global Environmental Markets Fund”), Pax Core Bond Fund (the “Core Bond Fund”), Pax High Yield Bond Fund (the “High Yield Bond Fund”), Pax Balanced Fund (the “Balanced Fund”), Pax Sustainable Managers Capital Appreciation Fund (the “Capital Appreciation Fund”), and the Pax Sustainable Managers Total Return Fund (the “Total Return Fund”).
Pax World Funds Series Trust III (“Trust III”) is an open-end management investment company that was organized under the laws of the Commonwealth of Massachusetts on December 4, 2013 and registered under the 1940 Act. Pax Ellevate Global Women’s Index Fund (the “Global Women’s Index Fund”) is a diversified series of Trust III.
These financial statements relate to all funds (each a “Fund”, collectively, the “Funds”) offered under both Trust I and Trust III (each a “Trust”, collectively, the “Trusts”).
Effective June 30, 2016 Aperio Group LLC began serving as sub-adviser to the ESG Beta Quality Fund. The changes occurred pursuant to a shareholder meeting held June 15, 2016 where shareholders approved the changes.
Effective December 12, 2016, as a result of in-kind transfers, three new funds commenced operations, the Large Cap Fund, ESG Beta Dividend Fund and Core Bond Fund. The registration statement for these Funds became effective on December 16, the first day they were available for sale to the general public. Prior to December 16, 2016, the Funds were 100% owned by the Balanced Fund. Therefore, as referenced throughout the financial statements, the inception date of the Funds, used for performance reporting and per share data, is December 16, 2016; and the commencement of operations, the first day the Funds were fully invested, commenced income and expense accruals, and recognized market value changes in the Funds’ net asset values, is December 12, 2016.
146
December 31, 2016 |
Effective March 29, 2016 the Capital Appreciation Fund (formerly the ESG Managers Growth and Income Portfolio) and the Total Return Fund (formerly the ESG Managers Income Portfolio) (the “Acquiring Funds”) acquired the assets of ESG Managers Growth Portfolio and ESG Managers Balanced Portfolio, (the “Target Funds”, each a series of Trust I), respectively. The acquisitions were based on valuations as of the close of business on March 29, 2016, pursuant to an Agreement and Plan of Reorganization dated December 3, 2015 (“the Reorganizations”). The purpose of the Reorganizations was to enable shareholders to invest in a larger, potentially more efficient portfolio which would be expected to result in reduced operating expenses for shareholders. The Reorganizations were accomplished by tax-free exchanges of shares. For financial reporting purposes, assets received and shares issued by the Acquiring Funds were recorded at fair value; however, the cost basis of the investments received from the Target Funds were carried forward to align ongoing reporting of realized and unrealized gains and losses with amounts distributable to shareholders for tax purposes. Shares and net assets of the Target Funds and Acquiring Funds immediately prior to the Reorganizations were as follows:
ESG Managers Growth Portfolio | Shares | NAV | Total | |||||||||
Class A shares | 917,800 | $ | 11.41 | $ | 10,468,434 | |||||||
Institutional Class | 280,043 | $ | 11.47 | $ | 3,212,112 | |||||||
Class C shares | 235,680 | $ | 11.20 | $ | 2,639,824 | |||||||
ESG Managers Growth and Income Portfolio | Shares | NAV | Total | |||||||||
Class A shares | 1,228,813 | $ | 11.65 | $ | 14,314,148 | |||||||
Institutional Class | 249,833 | $ | 11.69 | $ | 2,919,750 | |||||||
Class C shares | 375,626 | $ | 11.56 | $ | 4,342,599 | |||||||
ESG Managers Balanced Portfolio | Shares | NAV | Total | |||||||||
Class A shares | 1,285,399 | $ | 10.91 | $ | 14,025,624 | |||||||
Institutional Class | 680,221 | $ | 10.94 | $ | 7,439,951 | |||||||
Class C shares | 742,796 | $ | 10.78 | $ | 8,010,086 | |||||||
ESG Managers Income Portfolio | Shares | NAV | Total | |||||||||
Class A shares | 558,472 | $ | 10.55 | $ | 5,891,246 | |||||||
Institutional Class | 279,421 | $ | 10.57 | $ | 2,954,175 | |||||||
Class C shares | 277,407 | $ | 10.38 | $ | 2,880,759 | |||||||
147
December 31, 2016
|
Notes to Financial Statements, continued |
Shares and net assets of the Acquiring Funds immediately after the Reorganizations were as follows:
Capital Appreciation Fund | Shares | NAV | Total | |||||||||
Class A shares | 2,127,390 | $ | 11.65 | $ | 24,782,582 | |||||||
Institutional Class | 524,608 | $ | 11.69 | $ | 6,131,862 | |||||||
Class C shares | 603,985 | $ | 11.56 | $ | 6,982,423 | |||||||
Total Return Fund | Shares | NAV | Total | |||||||||
Class A shares | 1,887,915 | $ | 10.55 | $ | 19,916,870 | |||||||
Institutional Class | 983,295 | $ | 10.57 | $ | 10,394,126 | |||||||
Class C shares | 1,049,092 | $ | 10.38 | $ | 10,890,845 | |||||||
The Large Cap Fund, Mid Cap Fund, ESG Beta Dividend Fund, Global Women’s Index Fund and Core Bond Fund each offer two classes of shares—Individual Investor Class shares and Institutional Class shares. The International Index Fund and Balanced Fund each offer three classes of shares—Individual Investor Class shares, Institutional Class shares and Class R shares. The Small Cap Fund, ESG Beta Quality Fund, Global Environmental Markets Fund and High Yield Bond Fund each offer four classes of shares—Individual Investor Class shares, Class A shares, Institutional Class shares and Class R shares. The Capital Appreciation Fund and Total Return Fund each have four classes of shares—Individual Investor Class Shares, Class A shares, Institutional Class shares and Class C shares. Although all share classes generally have identical voting, dividend and liquidation rights, each class votes separately when required by law. Different share classes pay different distribution amounts to the extent the expenses of such classes differ, and distributions in liquidation will be proportional to the net asset value of each share class. Each share class has its own expense structure and sales charges, as applicable.
The Funds seek to invest in forward-thinking companies with sustainable business models that meet positive environmental, social and governance standards. The Funds avoid investing in companies that their investment adviser determines are significantly involved in the manufacture of weapons or weapons-related products, manufacture tobacco products or engage in unethical business practices.
The Large Cap Fund’s investment objective is to seek long-term growth of capital. The Fund seeks to achieve this objective by investing, under normal market conditions, at least 80% of its assets in equity securities (such as common stocks, securities convertible into common or preferred stock and warrants) of companies that, when purchased, have market capitalizations within the range of the Standard & Poor’s 500 Index as measured by market capitalization.
148
December 31, 2016 |
The Mid Cap Fund’s investment objective is to seek long-term growth of capital. The Fund seeks to achieve this objective by investing, under normal market conditions, at least 80% of its assets in equity securities (such as common stocks, securities convertible into common or preferred stocks and warrants) of companies that, when purchased, have capitalizations within the range of the Russell Midcap Index as measured by market capitalization.
The Small Cap Fund’s investment objective is to seek long-term growth of capital. The Fund seeks to achieve this objective by investing, under normal market conditions, at least 80% of its assets in equity securities (such as common stocks, securities convertible into common or preferred stocks and warrants) of companies that, when purchased, have capitalizations within the range of the Russell 2000 Index as measured by market capitalization.
The ESG Beta Quality Fund’s investment objective is to seek long-term growth of capital. The Fund seeks to achieve this objective by investing, under normal market conditions, primarily in large-capitalization domestic equity securities of companies that the Adviser believes have strong Environmental, Social and Governance (ESG) profiles and that exhibit higher “quality” characteristics and reasonable valuations.
The ESG Beta Dividend Fund’s investment objective is income and capital appreciation. As a secondary objective and to the extent consistent with its primary investment objective, the ESG Beta Dividend Fund seeks capital preservation. The Fund seeks to achieve its investment objective by investing, under normal market conditions, at least 80% of its assets in equity securities that pay dividends.
The International Index Fund’s investment objective is to seek investment returns that closely correspond to the price and yield performance, before fees and expenses, of the MSCI EAFE ESG Index. The Fund seeks to achieve this objective by investing, under normal market conditions, more than 80% of its total assets in the component securities, or a representative sampling of the component securities of the MSCI EAFE ESG Index.
The Global Women’s Index Fund’s investment objective is to seek investment returns that closely correspond to or exceed the price and yield performance, before fees and expenses, of the Pax Global Women’s Leadership Index (the “Women’s Index”), while maintaining risk characteristics that the Adviser believes are generally similar to those of the Women’s Index. The Fund seeks to achieve this objective by investing, under normal market conditions, more than 80% of its total assets in the component securities, or an enhanced, optimized or representative sampling of the component securities, of the Women’s Index, including at least 40% of its net assets in the securities of non-U.S. issuers.
149
December 31, 2016
|
Notes to Financial Statements, continued |
The Global Environmental Markets Fund’s investment objective is to seek long term growth of capital by investing in innovative companies around the world whose businesses and technologies focus on environmental markets, including alternative energy and energy efficiency; water infrastructure technologies and pollution control; environmental support services and waste management technologies; and sustainable food, agriculture and forestry. Under normal market conditions the Fund will primarily invest in equity securities (such as common stocks, preferred stocks and securities convertible into common and preferred stocks) of companies located around the world including at least 40% of its net assets in the securities of non-U.S. issuers.
The Core Bond Fund’s investment objective is to seek income and conservation of principal. The Fund seeks to achieve this objective by investing, under normal market conditions, at least 80% of its assets in bonds, which include debt obligations such as mortgage-related securities, securities issued by the United States Government or its agencies and instrumentalities, municipal bonds, corporate bonds and high-impact bonds that, at the time of purchase, are rated at least investment grade (rated BBB- or higher by Standard and Poor’s Ratings Group or Baa or higher by Moody’s Investors Service) or unrated and determined by the Adviser to be of comparable quality.
The High Yield Bond Fund’s primary investment objective is to seek high current income. As a secondary objective, the High Yield Bond Fund seeks capital appreciation. The Fund seeks to achieve this objective by investing, under normal market conditions, at least 80% of its assets in high-yield, fixed income securities (such as bonds, notes and debentures) that are rated below BBB- by Standard & Poor’s Ratings Group or below Baa3 by Moody’s Investors Service and other fixed income securities that are determined by the High Yield Bond Fund’s investment adviser to be of comparable quality (commonly referred to as “junk bonds”).
The Balanced Fund’s primary investment objective is to seek income and conservation of principal. As a secondary investment objective, the Fund seeks long-term growth of capital. The Fund seeks to achieve its investment objective by investing (directly or indirectly through the use of Underlying Funds) approximately 60%-75% of its assets in equity securities (such as common stocks, preferred stocks and securities convertible into common or preferred stocks) and 25%-40% of its assets in debt securities (including but not limited to debt securities convertible into equity securities).
The Capital Appreciation Fund’s investment objective is to seek long-term capital appreciation. The Fund seeks to achieve this objective by investing (directly or indirectly through underlying funds), under normal market conditions, most of its
150
December 31, 2016 |
assets in equity securities, although it may invest a portion of its assets (generally less than twenty percent) in fixed income securities (e.g., corporate bonds, U.S. Treasury securities, agency securities and municipal bonds).
The Total Return Fund’s primary investment objective is to maximize current income while preserving capital. As a secondary objective and to the extent consistent with its primary investment objective, the Fund seeks capital appreciation. The Fund seeks to achieve this objective by investing (directly or indirectly through underlying funds), under normal market conditions, a majority of its assets in fixed income securities (e.g., corporate bonds, U.S. Treasury securities, agency securities and municipal bonds) although it may invest a portion of its assets in equity securities (e.g., stocks). The Fund may invest in securities of non-U.S. issuers, including investments in emerging markets.
Under the Trusts’ organizational documents, its officers and trustees are indemnified against certain liabilities arising out of the performance of their duties to the Trusts. Additionally, in the normal course of business, the Trusts enter into contracts with service providers that contain general indemnification clauses. The Trusts’ maximum exposure under these arrangements is unknown as this could involve future claims that may be made against the Trusts that have not yet occurred. However, based on experience, the Trusts expect this risk of loss to be remote.
Accounting Estimates The preparation of financial statements in conformity with U.S. generally accepted accounting principles (“GAAP”) requires management to make estimates and assumptions that affect the reported amounts of assets and liabilities and disclosure of contingent assets and liabilities at the date of the financial statements and the reported amounts of revenues and expenses during the reporting period. Actual results could differ from those estimates. The Funds apply Investment Company accounting and reporting guidance.
Valuation of Investments For purposes of calculating the net asset value (“NAV”), determined ordinarily as of the close of regular trading (normally 4:00 p.m. Eastern time) (the “NYSE Close”) on the New York Stock Exchange (“NYSE”) on each day that the NYSE is open for trading, the Funds normally use pricing data for domestic equity securities received shortly after the NYSE Close and do not normally take into account trading, clearances or settlements that take place after the NYSE Close. U.S. fixed income and non-U.S. securities are normally priced using data reflecting the earlier closing of the principal markets for those securities, subject to possible fair value adjustments. Information that becomes known to the Funds or their agents after NAV has been calculated on a particular day will not generally be used to retroactively adjust the price of a security or NAV determined earlier that day.
151
December 31, 2016
|
Notes to Financial Statements, continued |
For the purpose of these financial statements, fair values for various types of securities and other instruments are determined on the basis of closing prices or last sales prices on an exchange or other market, or based on quotes or other market information obtained from quotation reporting systems, established market makers or pricing services. Short-term investments having a maturity of 60 days or less are generally valued at amortized cost, which approximates fair value.
Investments denominated in currencies other than the U.S. dollar are converted to U.S. dollars using daily exchange rates obtained from pricing services. As a result, the NAV of a Fund’s shares may be affected by changes in the value of currencies in relation to the U.S. dollar.
If market quotations are not readily available (including in cases when available market quotations are deemed to be unreliable), the Funds’ investments will be valued as determined in good faith pursuant to policies and procedures approved by the Boards of Trustees (so called “evaluated pricing”). The Boards have delegated to the Advisers’ Best Execution and Valuation Committee the day-to-day responsibility for making evaluated pricing determinations with respect to Fund holdings. The Best Execution and Valuation Committee is comprised of representatives of the Advisers, including several members of the Portfolio Management team, the Director of Trading, the Chief Compliance Officer and the Chief Financial Officer. One of the functions of the Best Execution and Valuation Committee is to value securities where current and reliable market quotations are not readily available. The Committee meets periodically and reports to the Board at each quarterly meeting regarding any securities for which evaluated pricing was employed during the previous quarter. All actions taken by the Best Execution and Valuation Committee are reviewed and ratified by the Boards.
The Funds may determine that market quotations are not readily available due to events relating to a single issuer (e.g., corporate actions or announcements) or events relating to multiple issuers (e.g., governmental actions or natural disasters). The Funds may determine the fair value of investments based on information provided by pricing services and other third-party vendors, which may recommend fair value prices or adjustments with reference to other securities, indices or assets. Various factors may be considered in order to make a good faith determination of a security’s fair value. These factors include, but are not limited to, the type and cost of the security; contractual or legal restrictions on resale of the security; relevant financial or business developments of the issuer; actively traded similar or related securities; conversion or exchange rights on the security; related corporate actions; significant events (which may be considered to include changes in the value of U.S. securities or securities indices) that occur after the close of the relevant market and before the time at which Funds’ net asset value is determined;
152
December 31, 2016 |
and changes in overall market conditions. At December 31, 2016, three securities were fair valued in good faith pursuant to policies and procedures approved by the Boards of Trustees. The Core Bond Fund held one security fair valued at $265,516 representing 0.04% of the Fund’s net asset value, and the High Yield Bond Fund held two securities fair valued at $0, representing 0.00% of the Fund’s net asset value.
For those Funds that invest in non-U.S. securities, investors should be aware that many securities markets and exchanges outside the U.S. close prior to the close of the NYSE, and the closing prices for securities in such markets or on such exchanges may not fully reflect events that occur after such close but before the close of the NYSE. As a result, the Funds’ fair value pricing procedures require the Funds to consider changes in the fair value of non-U.S. securities between the time of the closing of the local market’s exchange and the close of the NYSE. Generally, if there has been a movement in the U.S. market that exceeds a specified threshold, the Funds will assess whether the closing price on the local exchange is still appropriate. Although the threshold may be revised from time to time and the number of days on which fair value prices will be used will depend on market activity, it is possible that fair value prices will be used by the Funds to a significant extent. The value determined for an investment using the Funds’ fair value pricing procedures may differ from recent market prices for the investment.
Fair Value Measurements Fair value is defined as the price that the Fund would receive upon selling an investment in an orderly transaction between market participants. The three-tier hierarchy of inputs is summarized in the three broad Levels listed below.
● Level 1 – | unadjusted quoted prices in active markets for identical investments |
● Level 2 – | other significant observable inputs (including quoted prices for similar securities, interest rates, prepayment speeds, credit risk, etc.) |
● Level 3 – | significant unobservable inputs (including the Funds’ own assumptions in determining the fair value of investments) |
Observable inputs are inputs that reflect the assumptions market participants would use in pricing the asset or liability developed based on market data obtained from sources independent of the reporting entity. Unobservable inputs are inputs that reflect the reporting entity’s own assumptions about the assumptions market participants would use in pricing the asset or liability developed based on the best information available in the circumstances. The inputs or methodology used
153
December 31, 2016
|
Notes to Financial Statements, continued |
for valuing securities are not necessarily an indication of the risk associated with investing in those securities. The following is a general summary of valuation inputs and classifications for different categories of securities.
Equity Securities Equity securities, including common stocks, preferred stocks and exchange-traded funds, for which market quotations are readily available, valued at the last reported sale price or official closing price as reported by an independent pricing service, are generally categorized as Level 1 in the hierarchy. Non-U.S. equity securities may also be valued at official close, or may be valued based on the fair value pricing procedures noted above. When third-party fair value pricing of foreign securities methods are applied, they are generally categorized as Level 2. To the extent that inputs for equity securities are unobservable, values are categorized as Level 3 in the hierarchy.
Fixed Income Securities Fixed income securities, including Corporate Bonds (both investment-grade and high-yield), U.S. Treasury Obligations, Government Bonds, Mortgage-Backed and Asset-Backed Securities, Bank Loans and Municipal Bonds, are valued at evaluated prices received from independent pricing services, which are evaluated using various inputs and techniques which may include trade activity, broker-dealer quotes, yield curves, coupon rates, default rates, cash flows, models and other inputs, and are generally categorized as Level 2 in the hierarchy. To the extent that inputs for fixed income securities are unobservable, values are categorized as Level 3 in the hierarchy.
Affiliated and Unaffiliated Investment Companies Investments in mutual funds are valued at the Funds’ closing net asset value and are generally categorized as Level 1.
Short-term Investments Short-term securities, including repurchase agreements, with remaining maturities of 60 days or less, which are valued at amortized cost, are generally categorized as Level 2 in the hierarchy.
The following is a summary of the inputs used to value the Funds’ net assets as of December 31, 2016:
Level 1 | Level 2 | Level 3* | Totals | |||||||||||||
Large Cap | ||||||||||||||||
Common Stocks | $ | 769,391,414 | $ | — | $ | — | $ | 769,391,414 | ||||||||
Exchange Traded Funds | 19,253,744 | — | — | 19,253,744 | ||||||||||||
Cash Equivalents | — | 1,142,000 | — | 1,142,000 | ||||||||||||
Total | $ | 788,645,158 | $ | 1,142,000 | $ | — | $ | 789,787,158 | ||||||||
154
December 31, 2016 |
| Level 1 | Level 2 | Level 3* | Totals | ||||||||||||
Mid Cap | ||||||||||||||||
Common Stocks | $ | 163,355,779 | $ | — | $ | — | $ | 163,355,779 | ||||||||
Cash Equivalents | — | 6,863,000 | — | 6,863,000 | ||||||||||||
Total | $ | 163,355,779 | $ | 6,863,000 | $ | — | $ | 170,218,779 | ||||||||
Small Cap | ||||||||||||||||
Common Stocks | $ | 777,905,591 | $ | — | $ | — | $ | 777,905,591 | ||||||||
Cash Equivalents | 18,992,177 | 16,776,000 | — | 35,768,177 | ||||||||||||
Total | $ | 796,897,768 | $ | 16,776,000 | $ | — | $ | 813,673,768 | ||||||||
ESG Beta Quality | ||||||||||||||||
Common Stocks | $ | 192,365,468 | $ | — | $ | — | $ | 192,365,468 | ||||||||
Cash Equivalents | 593,023 | 1,738,000 | — | 2,331,023 | ||||||||||||
Total | $ | 192,958,491 | $ | 1,738,000 | $ | — | $ | 194,696,491 | ||||||||
ESG Beta Dividend | ||||||||||||||||
Common Stocks | $ | 136,436,915 | $ | — | $ | — | $ | 136,436,915 | ||||||||
Total | $ | 136,436,915 | $ | — | $ | — | $ | 136,436,915 | ||||||||
International Index | ||||||||||||||||
Common Stocks | $ | 908,590 | $ | 497,071,916 | $ | — | $ | 497,980,506 | ||||||||
Preferred Stocks | — | 2,505,942 | — | 2,505,942 | ||||||||||||
Exchange Traded Funds | 1,418,137 | — | — | 1,418,137 | ||||||||||||
Total | $ | 2,326,727 | $ | 499,577,858 | $ | — | $ | 501,904,585 | ||||||||
Global Women’s Index | ||||||||||||||||
Common Stocks | $ | 73,323,402 | $ | 34,720,419 | $ | — | $ | 108,043,821 | ||||||||
Preferred Stocks | — | 165,945 | — | 165,945 | ||||||||||||
Exchange Traded Funds | 2,143,463 | — | — | 2,143,463 | ||||||||||||
Cash Equivalents | 125,132 | 635,000 | — | 760,132 | ||||||||||||
Total | $ | 75,591,997 | $ | 35,521,364 | $ | — | $ | 111,113,361 | ||||||||
Global Environmental Markets | ||||||||||||||||
Common Stocks | $ | 189,457,283 | $ | 148,204,888 | $ | — | $ | 337,662,171 | ||||||||
Cash Equivalents | — | 10,623,000 | — | 10,623,000 | ||||||||||||
Total | $ | 189,457,283 | $ | 158,827,888 | $ | — | $ | 348,285,171 | ||||||||
Core Bond | ||||||||||||||||
Community Investment Notes | $ | — | $ | 3,097,752 | $ | 265,516 | $ | 3,363,268 | ||||||||
Corporate Bonds | — | 168,899,077 | — | 168,899,077 | ||||||||||||
U.S. Gov't Agency Bonds | — | 19,784,746 | — | 19,784,746 | ||||||||||||
Government Bonds | — | 5,256,520 | — | 5,256,520 | ||||||||||||
Municipal Bonds | — | 31,356,481 | — | 31,356,481 | ||||||||||||
U.S. Treasury Notes | — | 186,816,646 | — | 186,816,646 | ||||||||||||
Mortgage-Backed Securities | — | 173,251,232 | — | 173,251,232 | ||||||||||||
Cash Equivalents | 422,388 | 9,887,000 | — | 10,309,388 | ||||||||||||
Total | $ | 422,388 | $ | 598,349,454 | $ | 265,516 | $ | 599,037,358 | ||||||||
155
December 31, 2016
|
Notes to Financial Statements, continued |
| Level 1 | Level 2 | Level 3* | Totals | ||||||||||||
High Yield Bond | ||||||||||||||||
Common Stocks | $ | 300,000 | $ | — | $ | 0 | $ | 300,000 | ||||||||
Preferred Stocks | — | — | 0 | 0 | ||||||||||||
Corporate Bonds | — | 364,662,430 | — | 364,662,430 | ||||||||||||
Loans | — | 14,811,351 | — | 14,811,351 | ||||||||||||
Cash Equivalents | 200,443 | 18,648,773 | — | 18,849,216 | ||||||||||||
Total | $ | 500,443 | $ | 398,122,554 | $ | 0 | $ | 398,622,997 | ||||||||
Balanced | ||||||||||||||||
Affiliated Investment Companies | $ | 1,862,224,890 | $ | — | $ | — | $ | 1,862,224,890 | ||||||||
Cash Equivalents | — | 17,769,000 | — | 17,769,000 | ||||||||||||
Total | $ | 1,862,224,890 | $ | 17,769,000 | $ | — | $ | 1,879,993,890 | ||||||||
Capital Appreciation | ||||||||||||||||
Affiliated Investment Companies | $ | 8,212,792 | $ | — | $ | — | $ | 8,212,792 | ||||||||
Non-affiliated Investment Companies | 19,848,859 | — | — | 19,848,859 | ||||||||||||
Total | $ | 28,061,651 | $ | — | $ | — | $ | 28,061,651 | ||||||||
Total Return | ||||||||||||||||
Affiliated Investment Companies | $ | 4,946,524 | $ | — | $ | — | $ | 4,946,524 | ||||||||
Non-affiliated Investment Companies | 26,773,493 | — | — | 26,773,493 | ||||||||||||
Total | $ | 31,720,017 | $ | — | $ | — | $ | 31,720,017 | ||||||||
* | Table includes securities valued at zero. |
See Schedules of Investments for additional detailed industry classifications.
The following is a reconciliation of Level 3 assets for which significant unobservable inputs were used to determine fair value:
| Core Bond Fund | |||
Bonds and Notes | ||||
Balance as of December 31, 2015 | $ | — | ||
Realized gain (loss) | — | |||
Amortization of premium | — | |||
Change in unrealized appreciation (depreciation) | 9,532 | |||
Purchases/Received in Exchange | 255,984 | |||
Sales/Maturities | — | |||
Transfers in to and/or out of Level Three | — | |||
Balance as of December 31, 2016 | $ | 265,516 | ||
156
December 31, 2016 |
|
| High Yield Bond | |||
Stocks | ||||
Balance as of December 31, 2015 | $ | 0 | ||
Realized gain (loss) | — | |||
Amortization of premium | — | |||
Change in unrealized appreciation (depreciation) | — | |||
Purchases/Received in Exchange | — | |||
Sales | — | |||
Transfers in to and/or out of Level Three | — | |||
Balance as of December 31, 2016 | $ | 0 | ||
| Balanced | |||
Bonds and Notes | ||||
Balance as of December 31, 2015 | $ | 260,445 | ||
Realized gain (loss) | — | |||
Amortization of premium | — | |||
Change in unrealized appreciation (depreciation) | (4,461 | ) | ||
Purchases | — | |||
Sales/Maturities/Delivered in Exchange | (255,984 | ) | ||
Transfers in to and/or out of Level Three | — | |||
Balance as of December 31, 2016 | $ | — | ||
Transfers in and out of Levels during the period are assumed to be transferred on the last day of the period at their current value. During the period, Level 1 to Level 2 transfers were: $12,091,218 for the International Index Fund and $797,591 for the Global Women’s Index Fund; and Level 2 to Level 1 transfers were: $908,590 for the International Index Fund and $4,023,568 for the Global Environmental Markets Fund. All such transfers were due to utilization of the pricing vendor’s fair value pricing of foreign securities.
Significant unobservable inputs were used by two Funds for Level 3 fair value measurements. The Core Bond Fund holds a position in a Community Investment note which is valued based on a general obligation by the parent entity to limit investment exposure on the note. The High Yield Bond Fund holds two securities of the same issuer which are deemed to be valued at zero based on company financial statements.
Investment Transactions Investment transactions are recorded as of the date of purchase, sale or maturity. Net realized gains and losses from the sale or disposition of securities are determined on the identified cost basis, which is also used for federal income tax purposes. Corporate actions (including cash dividends) are recorded net of foreign tax withholdings.
157
December 31, 2016
|
Notes to Financial Statements, continued |
Investment Income Dividend income is recorded on the ex-dividend date. Interest income is recorded on the accrual basis and includes accretion of discount and amortization of premiums, if any. The value of additional securities received as dividend payments is recorded as income and as an increase to the cost basis of such securities. The Funds amortize purchase price premium and accrete discount on bonds, if any, over the remaining life of the bonds using the effective interest method of amortization; for callable bonds, the amortization period is to the most likely call date.
Distributions to Shareholders Distributions to shareholders are recorded by each of the Funds on the ex-dividend dates. The Funds (except Core Bond Fund and High Yield Bond Fund) expect to pay dividends of net investment income, if any, semiannually and to make distributions of capital gains, if any, at least annually. The Core Bond Fund and High Yield Bond Fund expect to pay dividends of net investment income, if any, monthly and to make distributions of capital gains, if any, at least annually. A shareholder begins earning dividends on the Core Bond Fund and High Yield Bond Fund shares the day after the Funds receive his or her purchase payment. Income and capital gains distributions are determined in accordance with income tax regulations, which may differ from U.S. generally accepted accounting principles.
Class Accounting Expenses directly attributable to a class of shares, such as 12b-1 distribution fees, are charged to that class. Each Fund has adopted a 12b-1 plan, applicable to certain classes of each of the Funds. Expenses of the Funds that are directly identifiable to a specific Fund, such as transfer agent fees, custody fees and registration fees, are applied to that Fund. Expenses that are not readily identifiable to a specific Fund, such as printing expense, Trustees’ fees and legal fees, are allocated in such a manner as deemed equitable, taking into consideration the nature and type of expense and the relative net assets of the Funds. Investment income, realized and unrealized gains and losses are allocated based upon the relative daily net assets of each class of shares.
Federal Income Taxes Each of the Funds intends to elect to be treated and qualify each year as a regulated investment company under Subchapter M of the Internal Revenue Code of 1986, as amended (the “Code”). If a Fund so qualifies and satisfies certain distribution requirements, such Fund will ordinarily not be subject to federal income tax on its net investment income (which includes short-term capital gains) and net capital gains that it distributes to shareholders. Each Fund expects to distribute all or substantially all of its income and gains to shareholders every year. Therefore, no Federal income or excise tax provision is required. The Funds are treated as separate entities for U.S. Federal income tax purposes.
158
December 31, 2016
|
|
Foreign Currency Transactions The accounting records of the Funds are maintained in U.S. dollars. In addition, purchases and sales of investment securities, dividend and interest income, and certain expenses are translated at the rates of exchange prevailing on the respective dates of such transactions. Net realized and unrealized foreign currency exchange gains or losses occurring during the holding period of investment securities are a component of realized gain (loss) on investment transactions and unrealized appreciation (depreciation) on investments, respectively.
Non-U.S. Securities Non-U.S. markets can be significantly more volatile than domestic markets, causing the prices of some of the Fund’s investments to fluctuate significantly, rapidly and unpredictably. Non-U.S. securities may be less liquid than domestic securities; consequently, the Fund may at times be unable to sell non-U.S. securities at desirable times or prices. Other risks related to non-U.S. securities include delays in the settlement of transactions; less publicly available information about issuers; different reporting, accounting and auditing standards; the effect of political, social, diplomatic or economic events; seizure, expropriation or nationalization of the issuer or its assets; fluctuation in foreign currency exchange rates and the possible imposition of currency exchange controls. If the Fund invests substantially in securities of non-U.S. issuers tied economically to a particular country or geographic region, it will be subject to the risks associated with such country or geographic region to a greater extent than a fund that is more diversified across countries or geographic regions.
Securities Lending The Funds may lend their securities pursuant to a securities lending agreement (Lending Agreement) with State Street Bank and Trust Company. Initial security loans made pursuant to the Lending Agreement are required to be secured by collateral not less than the percentage specified in the agreement, ranging from 102% to 105%, depending on the types of securities. Cash collateral received is invested in the State Street Navigator Securities Lending Government Money Market Portfolio, a registered Rule 2a-7 money market fund. Borrowers may also pledge non-cash collateral within the guidelines for acceptable forms of non-cash collateral approved by the Boards of Trustees. At December 31, 2016, non-cash collateral consisted of U.S. Treasuries and short-term U.S. Government Agency obligations.
The Funds have the right under the Lending Agreement to recover the securities from the borrower on demand. The primary risk associated with securities lending is if the Borrower defaults on its obligation to return the securities loaned because of insolvency or other reasons. The Funds could experience delays and costs in recovering securities loaned or in gaining access to the collateral. In the event the borrower fails to return loaned securities and the collateral received is insufficient
159
December 31, 2016
|
Notes to Financial Statements, continued |
to cover the value of the loaned securities and provided such collateral shortfall is not the result of investment losses, the lending agent has agreed to pay the amount of the shortfall to the Funds, or at the discretion of the lending agent, replace the loaned securities.
A portion of the income generated upon investment of the collateral is remitted to the borrower and the remainder is allocated between the Funds and the lending agent. The Funds record security lending income net of such allocation. The Funds continue to receive dividends on the securities loaned, which are accounted for in the same manner as other dividend and interest income.
As of December 31, 2016, the value of securities loaned, payable for collateral due to brokers and non-cash collateral pledged by brokers were as follows:
Fund | Market Value of Securities Loaned | Payable on Collateral Due to Broker | Non-Cash Collateral Value* | Over (Under) Collateralized | ||||||||||||
Mid Cap | $ | 7,009,805 | $ | — | $ | 7,275,571 | $ | 265,766 | ||||||||
Small Cap | 66,548,299 | 18,992,177 | 49,166,795 | 1,610,673 | ||||||||||||
ESG Beta Quality | 50,372,954 | 593,023 | 51,145,733 | 1,365,802 | ||||||||||||
Global Women's Index | 20,493,636 | 125,132 | 20,945,770 | 577,266 | ||||||||||||
Global Environmental Markets | 13,243,117 | — | 13,525,263 | 282,146 | ||||||||||||
* | Non-cash collateral is not included in the financial statements. |
For the Mid Cap Fund, Small Cap Fund, ESG Beta Quality Fund, Women’s Index Fund and Global Environmental Markets Fund all of the securities on loan at December 31, 2016 are classified as Common Stocks in each Fund’s Schedule of Investments.
NOTE B—Investment Advisory Fee and Transactions with Affiliated and Other Parties
Trust I and Trust III have entered into Investment Advisory Contracts (the “Management Contracts”) with Pax World Management LLC and Pax Ellevate Management LLC, respectively (each, the “Adviser”, and collectively, the “Advisers”). Pursuant to the terms of the Management Contracts, the Advisers, subject to the supervision of the Boards of Trustees of the Trusts, are responsible for managing the assets of the Funds in accordance with the Funds’ investment objective, investment programs and policies.
Pursuant to the Management Contracts, the Advisers have contracted to furnish the Funds continuously with an investment program, determining what investments to purchase, sell and exchange for the Funds and what assets to hold uninvested. The Advisers also have contracted to provide office space and certain management
160
December 31, 2016 |
|
and administrative facilities for the Funds. In return for such services, the Funds pay an advisory fee to the Advisers at the following annual rates (expressed as a percentage of the average daily net assets of such Fund):
Average Net Asset Value of Fund | ||
Fund | Up to $25M | Over $25M |
Balanced (1/1/16-12/11/16) | 0.75% | 0.50% |
Balanced (12/12/16-12/31/16) | 0.05%1,2 | 0.05%1,2 |
Fund | Annual Rate |
Large Cap | 0.65% |
Mid Cap | 0.75% |
Small Cap | 0.75% |
ESG Beta Quality | 0.65%1,3 |
ESG Beta Dividend | 0.65%1 |
International Index | 0.55%1 |
Global Women's Index | 0.65%1,5 |
Global Environmental Markets | 0.80%4 |
Core Bond | 0.40% |
High Yield Bond | 0.50% |
Capital Appreciation | 0.45%6 |
Total Return | 0.45%6 |
1 | The management fee is a unified fee that includes all of the operating costs and expenses of the Fund (other than taxes, charges of interest, brokerage commissions incurred in connection with portfolio transactions, distribution and/or service fees payable under a plan pursuant to Rule 12b-1 under the Investment Company Act of 1940 and extraordinary expenses), including accounting expenses, administrator, transfer agent and custodian fees, Fund legal fees and other expenses. (For this purpose, The Advisers do not consider acquired fund fees and expenses to be operating costs and expenses of the Fund.) |
2 | Effective December 12, 2016, the Balanced Fund changed its expense structure to a unified fee. The Adviser has voluntarily agreed to waive 0.01% of the management fee, resulting in a net fee rate of 0.04%. This arrangement will continue in effect until at least December 31, 2017 unless modified or terminated by the Funds’ Trustees. |
3 | Effective June 30, 2016, the ESG Beta Quality Fund changed its expense structure to a unified fee. The ratio shown in the table above reflects the amount charged to the Fund after the change. The advisory fee prior to June 30, 2016 was 0.75%. |
4 | Effective June 30, 2016, the Global Environmental Markets Fund changed its advisory fee to 0.80%. Prior to June 30, 2016 the Fund’s advisory fee was 0.90%. |
5 | Effective April 1, 2016, the Global Women’s Index Fund changed its advisory fee to 0.65%. Prior to April 1, 2016 the Fund’s advisory fee was 0.74% |
6 | With respect to the portion of fund assets invested in mutual funds the Adviser was paid an advisory fee of 0.45%. The Adviser applied higher management fees to the portion of assets managed by a subadviser, resulting in annualized advisory fee ratios (expressed as a percentage of the average daily net assets of such Fund) for Capital Appreciation Fund and Total Return Fund of 0.46% and 0.45%, respectively. |
161
December 31, 2016
|
Notes to Financial Statements, continued |
For the period ended December 31, 2016, the Funds incurred the following advisory fees:
Fund | Amount | |||
Large Cap | $ | 283,565 | ||
Mid Cap | 938,887 | |||
Small Cap | 4,765,306 | |||
ESG Beta Quality | 1,384,180 | |||
ESG Beta Dividend | 49,002 | |||
International Index | 2,574,091 | |||
Global Women's Index | 645,392 | |||
Global Environmental Markets | 2,550,303 | |||
Core Bond | 130,828 | |||
High Yield Bond | 1,974,071 | |||
Balanced | 8,913,458 | |||
Capital Appreciation | 150,995 | |||
Total Return | 147,233 | |||
The Adviser has contractually agreed to reimburse the Funds to the extent that each Fund’s respective expenses exceed, on an annual basis, the following percentages of average daily net assets:
Expense Caps | |||||
Fund | Individual Investor | Class A | Institutional | Class R | Class C |
ESG Beta Quality 1,2 | 0.90% | 0.90% | 0.65% | 1.15% | |
International Index 1 | 0.80% | 0.55% | 1.05% | ||
Global Environmental Markets 2,3 | 1.23% | 1.23% | 0.98% | 1.48% | |
Global Women's Index 1,4 | 0.90% | 0.65% | |||
Balanced Fund 1,5 | 0.30% | 0.05% | 0.55% | ||
Capital Appreciation 3 | 1.04% | 1.04% | 0.79% | 1.79% | |
Total Return 3 | 0.94% | 0.94% | 0.69% | 1.69% | |
1 | Expense caps for funds represent their respective unified management fees plus distribution and/or service fees payable under a plan pursuant to Rule 12b-1, as applicable to particular classes of shares. |
2 | Represents reduced expense caps that became effective on June 30, 2016. For the period from January 1, 2016 through June 29, 2016, expenses were capped at 1.24%, 1.24% 0.99% and 1.49% for the Individual Investor Class shares, Class A shares, Institutional Class shares and Class R shares of the ESG Beta Quality Fund, respectively. And expenses of respective share classes of the Global Environmental Markets Fund were capped at 1.40%, 1.40%, 1.15% and 1.65%. respectively. |
3 | The Adviser has contractually agreed to reimburse expenses to the extent they exceed the expense caps indicated until at least December 31, 2017. |
4 | Effective April 1, 2016, the Global Women’s Index Fund changed its unified management fee to 0.65% (excluding distributor fees). Prior to April 1, 2016 the Fund’s unified management fee (excluding distributor fees) was 0.74%. |
5 | Represents reduced expense caps that became effective on December 12, 2016. For the period from January 1, 2016 through December 11, 2016, there were no expense cap limitations in place. |
162
December 31, 2016 |
Such expenses include (i) management and distribution fees; (ii) the fees of affiliated and unaffiliated Trustees; (iii) the fees of the Funds’ custodian and transfer agent; (iv) the fees of the Funds’ legal counsel and independent registered public accounting firm; (v) the reimbursement of organizational expenses; and (vi) expenses related to shareholder communications including all expenses of shareholders’ and Boards of Trustees’ meetings and of preparing, printing and mailing reports, proxy statements and prospectuses to shareholders.
For the year ended December 31, 2016, the dollar amount of expense reimbursements for each of the Funds were as follows:
Total Expenses Reimbursed by Adviser | ||||||||||||||||||||
Fund | Individual Investor | Class A | Institutional | Class R | Class C | |||||||||||||||
ESG Beta Quality | $ | 46,320 | $ | 1,149 | $ | 1,188 | $ | 468 | ||||||||||||
Global Environmental Markets | 50,915 | 5,570 | 83,641 | 1,149 | ||||||||||||||||
Capital Appreciation | 134 | 91,539 | 28,666 | $ | 27,923 | |||||||||||||||
Total Return | 494 | 89,467 | 44,465 | 44,826 | ||||||||||||||||
In addition, the Adviser voluntarily waived $1,796,652, $34,981, and $19,328 of its management fee from the Balanced Fund, Capital Appreciation Fund and Total Return Fund, respectively, related to each Fund’s investment in affiliates.
The Trusts have adopted a plan (“Plan”) pursuant to Rule 12b-1 under the 1940 Act that allows the Funds to pay distribution fees for the sale and distribution of certain shares as described below and for personal services rendered to the Fund shareholders in connection with the maintenance of shareholder accounts. Under the Plan, each Fund will pay its Distributor a distribution fee equal to 0.25% of the annual average daily net assets attributable to the Individual Investor Class shares and Class A shares, 0.50% of the annual average daily net assets attributable to the R Class shares, and 0.75% of the annual average daily net assets attributable to the Class C shares. The Distributor may pay all or any portion of the distribution fee to securities dealers or other organizations (including, but not limited to, any affiliate of the Distributor) as commissions, asset-based sales charges or other compensation with respect to the sale of indicated shares of such Fund, or for providing personal services to investors in the indicated shares of such Fund and/or the maintenance of shareholder accounts, and may retain all or any portion of the distribution fee as compensation for the Distributor’s services as principal underwriter of the indicated shares of such Fund.
In addition to the 12b-1 Plan, each Fund has adopted a shareholder services plan (a “Services Plan”) with respect to Class C shares. Under each Services Plan, up to 0.25% of the average daily net assets allocable to Class C shares of the
163
December 31, 2016
|
Notes to Financial Statements, continued |
Fund may be used to pay service fees to qualified dealers for providing certain shareholder services (e.g., personal services rendered to such shareholders and/or the maintenance of shareholder accounts).
Several individuals who are officers and/or Trustees of the Trusts are also employees of the Advisers.
NOTE C—Investment Information
Purchases and proceeds from sales of investments for the Funds for the period ended December 31, 2016 were as follows:
Purchases | Sales | |||||||||||||||
Fund | Investments1 | U.S. Gov’t Bonds | Investments1 | U.S. Gov’t Bonds | ||||||||||||
Large Cap2 | $ | 26,067,075 | $ | — | $ | 26,800,300 | $ | — | ||||||||
Mid Cap2 | 76,627,864 | — | 76,491,129 | — | ||||||||||||
Small Cap | 486,407,108 | — | 301,554,522 | — | ||||||||||||
ESG Beta Quality | 155,328,434 | — | 172,025,624 | — | ||||||||||||
ESG Beta Dividend2 | — | — | — | — | ||||||||||||
International Index | 326,699,590 | — | 203,174,520 | — | ||||||||||||
Global Women's Index | 68,241,211 | — | 46,866,061 | — | ||||||||||||
Global Environmental Markets | 147,518,186 | — | 89,166,677 | — | ||||||||||||
Core Bond2 | 3,008,440 | 3,183,708 | 5,981,870 | 223,183 | ||||||||||||
High Yield Bond | 416,598,574 | — | 459,212,035 | — | ||||||||||||
Balanced2 | 689,556,211 | 205,569,302 | 739,438,931 | 170,526,694 | ||||||||||||
Capital Appreciation2 | 12,539,866 | — | 22,971,304 | — | ||||||||||||
Total Return2 | 8,839,439 | — | 18,564,912 | — | ||||||||||||
1 | Excluding short-term investments and U.S. Government bonds. |
2 | Purchases and sales exclude in-kind transactions. |
164
December 31, 2016 |
For federal income tax purposes, the identified cost of investments owned at December 31, 2016 as well as the gross unrealized appreciation (depreciation) of investments and resulting net unrealized appreciation (depreciation) as of December 31, 2016 were as follows for the Funds:
Fund | Identified cost of investments for Federal income tax basis | Gross appreciation | Gross depreciation | Net unrealized appreciation (depreciation) | ||||||||||||
Large Cap | $ | 649,945,068 | $ | 141,216,181 | $ | 1,374,091 | $ | 139,842,090 | ||||||||
Mid Cap | 149,584,639 | 25,334,968 | 4,700,828 | 20,634,140 | ||||||||||||
Small Cap | 747,718,220 | 109,358,731 | 43,403,183 | 65,955,548 | ||||||||||||
ESG Beta Quality | 138,359,861 | 57,069,238 | 732,608 | 56,336,630 | ||||||||||||
ESG Beta Dividend | 129,942,149 | 7,849,693 | 1,354,927 | 6,494,766 | ||||||||||||
International Index | 523,092,064 | 24,607,217 | 45,794,696 | (21,187,479 | ) | |||||||||||
Global Women's Index | 107,242,389 | 10,671,561 | 6,800,589 | 3,870,972 | ||||||||||||
Global Environmental Markets | 302,813,893 | 52,163,540 | 6,692,262 | 45,471,278 | ||||||||||||
Core Bond | 601,960,957 | 4,172,317 | 7,095,916 | (2,923,599 | ) | |||||||||||
High Yield Bond | 397,588,006 | 12,566,616 | 11,531,625 | 1,034,991 | ||||||||||||
Balanced | 1,893,079,738 | 10,312,632 | 23,398,480 | (13,085,848 | ) | |||||||||||
Capital Appreciation | 26,308,390 | 1,788,679 | 35,418 | 1,753,261 | ||||||||||||
Total Return | 31,451,081 | 619,894 | 350,958 | 268,936 | ||||||||||||
At December 31, 2016 the Mid Cap Fund, Small Cap Fund, ESG Beta Quality Fund, International Index Fund, Global Women’s Fund, Global Environmental Markets Fund and Balanced Fund had unrealized foreign currency gains (losses) of $36; $153; ($2,383); ($40,231); ($3,633); ($3,816); and ($17,793), respectively.
Options Transactions The Funds may buy and sell put and call options, or write put and covered call options on portfolio securities in order to produce incremental earnings or protect against changes in the value of portfolio securities. The Funds generally purchase put options or write covered call options to hedge against adverse movements in the value of portfolio holdings. When an option is written, the Fund receives a premium and becomes obligated to sell or purchase the underlying security at a fixed price, upon the exercise of the option.
Options are valued daily based upon the last sale price of the principal exchange on which the option is traded and unrealized appreciation or depreciation is recorded. The Fund will realize a gain or loss upon the expiration or closing of the option transaction. When an option is exercised, the proceeds on sale for a written call option, the purchase cost for a written put option, or the cost of the security for a purchased put or call option is adjusted by the amount of premium received or paid.
165
December 31, 2016
|
Notes to Financial Statements, continued |
Securities designated to cover outstanding call or put options are noted in the Schedules of Investments. Contracts subject to call or put, expiration date, exercise price, premium received and market value are detailed in the notes to the Schedules of Investments. Options written are reported as a liability in the Statements of Assets and Liabilities. Realized gains and losses are reported in the Statements of Operations.
There are risks associated with transactions in options on securities. The risk in writing a call option is that the Fund gives up the opportunity for profit if the market price of the security increases above the exercise price and the option is exercised. The risk in writing a put option is that the Fund may incur a loss if the market price of the security continues to decrease after the option is exercised. The risk in buying an option is that the Funds pay a premium whether or not the option is exercised. The Funds also have the additional risk of not being able to enter into a closing transaction before the exercise date if a liquid secondary market does not exist.
There were no purchased options as of and during the year ended December 31, 2016. Written option activity for the year ended December 31, 2016 is as follows:
| Outstanding at 12/31/15 | Written | Closed | Expired | Exercised | Outstanding at 12/31/16 | ||||||||||||||||||
Balanced Fund | ||||||||||||||||||||||||
Call Options | ||||||||||||||||||||||||
Number of contracts | — | 4,000 | (156 | ) | — | (3,844 | ) | — | ||||||||||||||||
Premiums received | $ | — | $ | 463,991 | $ | (18,068 | ) | $ | — | $ | (445,923 | ) | $ | — | ||||||||||
The Funds did not hold any open written equity option contracts as of December 31, 2016.
Netting Agreements During the ordinary course of business, the Funds may enter into transactions subject to enforceable netting agreements or other similar arrangements (“netting agreements”). Generally, the right to offset in netting agreements allows a Fund to offset any exposure to a specific counterparty with any collateral received or delivered to that counterparty based on the terms of the agreement. Generally, a Fund manages its cash collateral and securities collateral on a counterparty basis. As of December 31, 2016, there is no collateral held at the counterparty for these positions that would be offset by a master netting agreement that the Funds have with the counterparty. The Funds did not hold any derivative instruments as of December 31, 2016.
166
December 31, 2016 |
Affiliated Investments The term “affiliated company” includes other investment companies that are managed by a Fund’s Adviser. At December 31, 2016, Funds held the following investments in affiliated Funds:
Fund | Shares Held at 12/31/16 | Value at 12/31/15 | Gross | Gross | Value at 12/31/16 | Income Distributions | ||||||||||||||||||
Balanced | ||||||||||||||||||||||||
International Index | 20,935,664 | $ | 151,361,028 | $ | 34,291,532 | $ | 20,000,000 | $ | 160,157,829 | $ | 4,291,532 | |||||||||||||
Core Bond | 60,156,106 | — | 601,561,790 | — | 602,162,621 | 730,919 | ||||||||||||||||||
ESG Beta Dividend | 13,854,711 | — | 138,546,311 | — | 136,607,447 | 158,371 | ||||||||||||||||||
Large Cap | 79,743,155 | — | 797,432,619 | — | 790,254,663 | 537,108 | ||||||||||||||||||
Mid Cap | 16,309,362 | — | 163,330,529 | — | 173,042,330 | 2,178,421 | ||||||||||||||||||
Total | $ | 151,361,028 | $ | 1,735,162,781 | $ | 20,000,000 | $ | 1,862,224,890 | $ | 7,896,351 | ||||||||||||||
Capital Appreciation | ||||||||||||||||||||||||
Global Environmental Markets | 52,484 | $ | 145,060 | $ | 624,130 | $ | 137,000 | $ | 694,892 | $ | 5,943 | |||||||||||||
High Yield Bond | 37,589 | 391,340 | 59,532 | 221,887 | 251,095 | 20,564 | ||||||||||||||||||
International Index | 713,533 | 2,700,308 | 4,550,734 | 1,671,725 | 5,458,531 | 177,818 | ||||||||||||||||||
Small Cap | 117,116 | 934,361 | 1,961,259 | 1,378,478 | 1,808,274 | 16,863 | ||||||||||||||||||
Total | $ | 4,171,069 | $ | 7,195,655 | $ | 3,409,090 | $ | 8,212,792 | $ | 221,188 | ||||||||||||||
Total Return | �� | |||||||||||||||||||||||
Global Environmental Markets | 31,486 | $ | 98,760 | $ | 319,658 | $ | 36,173 | $ | 416,872 | $ | 3,302 | |||||||||||||
High Yield Bond | 218,103 | 217,157 | 1,549,814 | 447,423 | 1,456,925 | 79,116 | ||||||||||||||||||
International Index | 313,271 | 846,505 | 3,180,672 | 1,580,542 | 2,396,520 | 81,960 | ||||||||||||||||||
Small Cap | 43,796 | 277,438 | 1,296,754 | 987,639 | 676,207 | 5,977 | ||||||||||||||||||
Total | $ | 1,439,860 | $ | 6,346,898 | $ | 3,051,777 | $ | 4,946,524 | $ | 170,355 | ||||||||||||||
Income distributions from affiliates are included as dividend income and capital gain dividends are included as realized gains on the Statement of Operations. Gross additions include reinvestment of dividends and value of in-kind transactions related to acquisitions or mergers.
The Funds are permitted to purchase and sell securities (“cross-trade”) from and to other Funds within the Trusts or other accounts managed by the Adviser pursuant to “Cross-Trading” Procedures adopted by the Trust’s Board of Trustees. These procedures have been designed to ensure that any cross-trade of securities by the respective fund from or to another fund or account that is or could be considered an affiliate of the fund under certain limited circumstances by virtue of having a common investment adviser complies with Rule 17a-7 of the 1940 Act. Further, as defined under these procedures, each cross-trade is effected at the current market price to save costs where allowed. Pursuant to these procedures, for the year ended December 31, 2016, the High Yield Bond Fund engaged in cross-trades with a
167
December 31, 2016
|
Notes to Financial Statements, continued |
high yield separate account managed by the Adviser with total sales of $894,500. There were no purchases. The Fund realized net losses of $11,880 as a result of the sales. The Balanced Fund engaged in cross trades with each of the Mid Cap Fund, Core Bond Fund, Large Cap Fund and ESG Beta Dividend Fund during the period ended December 31, 2016. See “In Kind Subscriptions” below for Additional Information.
In Kind Subscriptions On March 31, 2016, the Mid Cap Fund accepted securities in lieu of cash (“in kind subscriptions”) in exchange for shares issued to the Balanced Fund. The Balanced Fund delivered $151,884,355 in securities and $7,729,787 in cash in exchange for 15,961,414 shares of the Mid Cap Fund Institutional Share class valued at $159,614,142. On December 9, 2016, the Large Cap Fund, ESG Beta Dividend Fund and Core Bond Fund accepted securities in lieu of cash in exchange for shares issued to the Balanced Fund. The Balanced Fund delivered $796,895,502 in securities for 79,689,550 shares of the Large Cap Fund Institutional share class; $138,387,930 in securities for 13,838,793 shares of the ESG Beta Dividend Fund Institutional share class; and $591,573,597 in securities ($2,810,522 of which was attributable to accrued interest) and $9,257,263 in cash for 60,083,086 shares of the Core Bond Fund Institutional share class valued at $600,830,860. Each in kind subscription was a tax-free transaction for the participating funds.
Restricted and Illiquid Securities The Funds may purchase certain restricted securities and limited amounts of illiquid securities. The Funds may invest in securities exempt from registration under Rule 144A of the Securities Act of 1933 (“the Act”) which are restricted from sale to the public and may only be sold to a qualified institutional buyer. The Funds do not have the right to demand that such securities be registered. The value of such securities is determined by valuations supplied by a pricing service or, if not available, in good faith by or at the direction of the Boards of Trustees. At December 31, 2016, the Core Bond Fund held $23,271,339 or 3.86% of net assets and the High Yield Bond Fund held $190,997,491 or 47.58% of net assets in securities exempt from registration under Rule 144A of the Act.
At December 31, 2016, the Core Bond Fund held $265,516 of illiquid securities representing 0.04% of net assets and High Yield Bond Fund held $13,653,239 of illiquid securities, representing 3.40% of net assets. The Fund will classify as “illiquid” all securities that may no longer be disposed of within seven days in the ordinary course of business at approximately the amount at which the Fund has valued such security for the purpose of calculating the Fund’s net asset value. Illiquid investments may include restricted securities, repurchase agreements that mature in more than seven days or that have a notice or demand feature more than
168
December 31, 2016 |
seven days, certain over-the-counter option contracts and participation interests in loans. Because illiquid securities trade less frequently and in smaller volume than liquid securities, the Fund may experience difficulty in closing out positions at prevailing market prices.
Additional information on illiquid securities held at December 31, 2016 is as follows:
Security | Acquisition Date Range | Cost | Market Value | ||||||
Core Bond Fund | |||||||||
CINI Investment Note, 2.000%, 11/01/17 | 11/01/14 - 11/01/15 | $ | 265,516 | $ | 265,516 | ||||
High Yield Bond Fund | |||||||||
Charlotte Russe, Inc., Term B, 6.750%, 05/21/19 | 05/21/13 - 01/16/15 | 7,800,898 | 4,773,989 | ||||||
ION Geophysical Corp., 9.125%, 12/15/21 | 05/08/13 - 05/08/13 | 4,322,125 | 3,200,000 | ||||||
Interactive Health, Inc. | 03/19/04 - 10/01/13 | 178,981 | — | ||||||
Interactive Health, Inc., 0.000% | 03/19/04 - 10/01/13 | 357,962 | — | ||||||
Ormat Funding Corp., 8.250%, 12/30/20 | 02/06/04 - 10/07/16 | 682,332 | 679,801 | ||||||
PRWireless, Inc., 1.000%, 6/29/2020 | 06/27/14 - 06/27/14 | 2,890,817 | 2,120,625 | ||||||
TOMS Shoes LLC, 1.000%, 10/31/2020 | 10/31/14 - 10/31/14 | 3,630,949 | 2,878,824 | ||||||
NOTE D—Tax Information
The timing and characterization of certain income and capital gains distributions are determined annually in accordance with federal tax regulations, which may differ from GAAP. In addition to permanent differences previously noted, temporary differences may arise from recognition of certain items of income, expense, gain or loss in different periods for financial reporting and tax purposes. Such differences will reverse at some time in the future. As a result, net investment income (loss) and net realized gain (loss) on investment transactions for a reporting period may differ significantly from distributions during such period. For tax purposes, short-term capital gains are considered ordinary income.
169
December 31, 2016
|
Notes to Financial Statements, continued |
The tax character of distributions paid during 2016 and 2015 was as follows:
Distributions paid in 2016 | Distributions paid in 2015 | |||||||||||||||
Fund | Ordinary | Long-term | Ordinary | Long-term | ||||||||||||
Large Cap | $ | 537,108 | $ | — | $ | — | $ | — | ||||||||
Mid Cap | 3,723,298 | — | — | — | ||||||||||||
Small Cap | 15,321,236 | 2,787,597 | 3,532,907 | 28,068 | ||||||||||||
ESG Beta Quality | 1,774,751 | 16,990,724 | 582,709 | 11,917,060 | ||||||||||||
ESG Beta Dividend | 157,691 | 680 | — | — | ||||||||||||
International Index | 12,683,584 | — | 6,605,929 | 2,350 | ||||||||||||
Global Women's Index | 1,923,585 | — | 1,447,779 | 500,762 | ||||||||||||
Global Environmental Markets | 2,166,819 | — | 1,374,442 | 1,144,121 | ||||||||||||
Core Bond | 730,985 | — | — | — | ||||||||||||
High Yield Bond | 23,563,885 | — | 30,124,148 | — | ||||||||||||
Balanced | 24,752,936 | 32,192,195 | 17,125,033 | 129,992,528 | ||||||||||||
Capital Appreciation | 21,191 | 601,132 | 232,163 | 413,487 | ||||||||||||
Total Return | 381,523 | 172,061 | 225,244 | 146,235 | ||||||||||||
As of December 31, 2016, the components of distributable earnings on a tax basis are as follows:
Fund | Undistributed | Undistributed | Other | Net Unrealized | ||||||||||||
Large Cap | $ | 154,988 | $ | 4,597,959 | $ | — | $ | 139,842,090 | ||||||||
Mid Cap | — | — | (410,264 | ) | 20,634,176 | |||||||||||
Small Cap | 9,167,046 | 560,783 | — | 65,955,701 | ||||||||||||
ESG Beta Quality | 126,995 | 475,448 | — | 56,334,247 | ||||||||||||
ESG Beta Dividend | — | 1,883 | — | 6,494,766 | ||||||||||||
International Index | 287,248 | — | (16,250,507 | ) | (21,227,710 | ) | ||||||||||
Global Women's Index | 108,750 | — | — | 3,867,339 | ||||||||||||
Global Environmental Markets | — | — | (1,419,125 | ) | 45,467,462 | |||||||||||
Core Bond | 7 | — | (14,536 | ) | (2,923,599 | ) | ||||||||||
High Yield Bond | — | — | (60,278,963 | ) | 1,034,991 | |||||||||||
Balanced | 29,929,948 | 167,868,523 | — | (13,103,641 | ) | |||||||||||
Capital Appreciation | 360,016 | 143,763 | — | 1,753,261 | ||||||||||||
Total Return | 193,640 | — | (224,932 | ) | 268,936 | |||||||||||
During the period from November 1, 2016 through December 31, 2016, Global Environmental Markets incurred a qualified ordinary late-year loss of $76,594 and the Mid Cap Fund incurred a qualified capital late-year loss of $410,264. These losses are treated for federal income tax purposes as if they had occurred on January 1, 2017.
170
December 31, 2016 |
As of December 31, 2016, for federal income tax purposes, the following Funds had capital loss carryforwards available to offset future gains, if any, to the extent provided by the Treasury regulations:
No Expiration | ||||||||
Fund | Short-term | Long-term | ||||||
International Index | $ | 6,292,554 | $ | 9,957,953 | ||||
Global Environmental Markets | 597,892 | 744,639 | ||||||
Core Bond Fund | 14,536 | — | ||||||
High Yield Bond | 30,785,566 | 29,370,288 | ||||||
Total Return Fund | — | 224,932 | ||||||
For financial reporting purposes, the capital accounts are adjusted to reflect the tax character of permanent book/tax differences. Reclassifications are primarily due to tax treatment of gain (loss) on foreign currency transactions, tax treatment related to REITs, partnerships and PFICs, equalization adjustments and adjustments related to fund mergers.
For the year ended December 31, 2016, the Funds recorded the following reclassifications:
Fund | Undistributed Net Investment Income | Accumulated Net Realized Gain (Loss) | Paid in Capital | |||||||||
Large Cap | $ | (19,077 | ) | $ | (864,431 | ) | $ | 883,508 | ||||
Mid Cap | (7,754 | ) | 35,563 | (27,809 | ) | |||||||
Small Cap | (220,329 | ) | 220,329 | — | ||||||||
ESG Beta Quality | (86,154 | ) | 86,154 | — | ||||||||
ESG Beta Dividend | (5,640 | ) | (33,905 | ) | 39,545 | |||||||
International Index | (435,273 | ) | 435,274 | (1 | ) | |||||||
Global Women's Index | (15,661 | ) | 15,661 | — | ||||||||
Global Environmental Markets | (147,421 | ) | 150,536 | (3,115 | ) | |||||||
Core Bond | 7 | — | (7 | ) | ||||||||
High Yield Bond | (18,344 | ) | 18,344 | — | ||||||||
Balanced | (373,083 | ) | 1,296,135 | (923,052 | ) | |||||||
Capital Appreciation | (7,195 | ) | 235,275 | 242,470 | ||||||||
Total Return | (13,351 | ) | (229,133 | ) | 242,484 | |||||||
Uncertain Tax Positions Management has analyzed the Funds’ tax positions taken for all open tax years which remain subject to examination by the Funds’ major tax jurisdictions (years 2013 through 2016). The Funds recognize interest and penalties, if any, related to tax liabilities as income tax expense in the Statement of Operations. Management has concluded that, as of and during the year ended December 31, 2016, no provision for federal income tax is necessary and, therefore, the Funds did not have a liability for any unrecognized tax expenses.
171
December 31, 2016
|
Notes to Financial Statements, continued |
Recent Accounting Pronouncements In October 2016, the Commission issued Final Rule Release No. 33-10231, Investment Company Reporting Modernization. This final rule modernizes Investment Company reporting by requiring the filing of new forms N-PORT and N-CEN, and amends Regulation S-X disclosures related to derivatives and other disclosures in the financial statements and other filings. The requirements of this final rule in relation to forms N-PORT and N-CEN must be adopted by June 1, 2018, while the amended disclosures must be adopted by August 1, 2017. Management is currently assessing the impact of this rule to the Fund’s financial statements and other filings.
In October 2016, the Commission issued Final Rule Release No. 33-10233, Investment Company Liquidity Risk Management Programs. This final rule requires funds to establish a liquidity risk management program and enhances disclosures regarding funds liquidity. The requirements of this final rule must be adopted by December 1, 2018. Management is currently assessing the impact of this rule to the Fund’s financial statements and other filings.
In October 2016, the Commission issued Final Rule Release No. 33-10234, Investment Company Swing Pricing. This rule permits certain funds to use swing pricing during periods of heavy redemptions and requires certain disclosures regarding the use of swing pricing in forms filed with the SEC. The requirements of this final rule must be adopted 24 months after publication in the Federal Register. Management is currently assessing the impact of this rule to the Fund’s financial statements and other filings.
NOTE E—SUBSEQUENT EVENTS
On November 21, 2016, the Funds’ Board of Trustees of Trust I voted to liquidate the assets of the Pax Sustainable Managers Funds, effective February 15, 2017. Accordingly, as of the close of business on November 28, 2016, Pax Sustainable Managers Capital Appreciation Fund and Pax Sustainable Managers Total Return Fund were closed to new investments.
172
December 31, 2016
|
Report of Independent Registered Public Accounting Firm |
The Boards of Trustees and Shareholders of Pax World Funds Series Trust I and Pax World Funds Series Trust III:
We have audited the accompanying statements of assets and liabilities, including the schedules of investments, of Pax Balanced Fund (formerly: Pax World Balanced Fund), Pax ESG Beta Quality Fund (formerly: Pax Growth Fund), Pax Small Cap Fund (formerly: Pax World Small Cap Fund), Pax High Yield Bond Fund (formerly: Pax World High Yield Bond Fund), Pax Global Environmental Markets Fund (formerly: Pax World Global Environmental Markets Fund), Pax MSCI International ESG Index Fund, Pax Sustainable Managers Capital Appreciation Fund (formerly: ESG Managers® Growth and Income Portfolio), Pax Sustainable Managers Total Return Fund (formerly: ESG Managers® Income Portfolio), Pax Mid Cap Fund, Pax Core Bond Fund, Pax Large Cap Fund, Pax ESG Beta Dividend Fund, and Pax Ellevate Global Women’s Index Fund (collectively, the “Funds”) as of December 31, 2016, and the related statements of operations for the periods then ended, the statements of changes in net assets and the financial highlights for each of the periods indicated therein. These financial statements and financial highlights are the responsibility of the Funds’ management. Our responsibility is to express an opinion on these financial statements and financial highlights based on our audits.
We conducted our audits in accordance with the standards of the Public Company Accounting Oversight Board (United States). Those standards require that we plan and perform the audit to obtain reasonable assurance about whether the financial statements and financial highlights are free of material misstatement. We were not engaged to perform an audit of the Funds’ internal control over financial reporting. Our audits included consideration of internal control over financial reporting as a basis for designing audit procedures that are appropriate in the circumstances, but not for the purpose of expressing an opinion on the effectiveness of the Funds’ internal control over financial reporting. Accordingly, we express no such opinion. An audit also includes examining, on a test basis, evidence supporting the amounts and disclosures in the financial statements and financial highlights, assessing the accounting principles used and significant estimates made by management, and evaluating the overall financial statement presentation. Our procedures included confirmation of securities owned as of December 31, 2016, by correspondence with the custodian and others or by other appropriate auditing procedures where replies from others were not received. We believe that our audits provide a reasonable basis for our opinion.
In our opinion, the financial statements and financial highlights referred to above present fairly, in all material respects, the financial position of Pax Balanced Fund, Pax ESG Beta Quality Fund, Pax Small Cap Fund, Pax High Yield Bond Fund, Pax Global Environmental Markets Fund, Pax MSCI International ESG Index Fund, Pax Sustainable Managers Capital Appreciation Fund, Pax Sustainable Managers Total Return Fund, Pax Mid Cap Fund, Pax Core Bond Fund, Pax Large Cap Fund, Pax ESG Beta Dividend Fund, and Pax Ellevate Global Women’s Index Fund (collectively, the “Funds”) at December 31, 2016, the results of their operations for the periods then ended, the changes in their net assets and the financial highlights for each of the periods indicated therein, in conformity with U.S. generally accepted accounting principles.
|

Boston, Massachusetts
February 22, 2017
173
December 31, 2016 |
|
Proxy Voting (Unaudited)
You may obtain a description of the Funds’ policies and procedures that the Funds use to determine how to vote proxies relating to their portfolio securities, without charge, upon request by contacting the Funds at 800.767.1729 or on the SEC’s website at www.sec.gov.
The information regarding how the Funds voted proxies relating to portfolio securities during the most recent 12-month period ended June 30 is available without charge, upon request, by telephoning Pax World (toll-free) at 800.767.1729 or visiting Pax World’s website at www.paxworld.com and will be available without charge by visiting the SEC’s website at www.sec.gov.
Quarterly Portfolio Holdings Disclosure (Unaudited)
Each Fund files its complete schedule of portfolio holdings with the SEC for the first and third quarters of each fiscal year on Form N-Q. Each Fund’s Form N-Qs are available on the SEC website at www.sec.gov and may be reviewed and copied at the SEC’s Public Reference Room in Washington, DC. Information on the operation of the Public Reference Room may be obtained by calling 800.SEC.0330. Information contained in each Fund’s Form N-Qs may also be obtained by visiting Pax World’s website at www.paxworld.com or telephoning Pax World (toll-free) at 800.767.1729.
The Statement of Additional Information includes additional information about the trustees and is available upon request without charge by calling 800.767.1729 between the hours of 9:00 a.m. and 5:30 p.m. Eastern time or by visiting our website at www.paxworld.com.
174
December 31, 2016 |
|
Federal Tax Information (Unaudited)
The percentages of ordinary income distributed by each of the Funds that is Qualified Dividend Income (QDI) and that qualifies for corporate Dividends Received Deduction (DRD) are as follows:
| QDI% | DRD% |
Large Cap | 70.98% | 19.53% |
Mid Cap | 100.00% | 100.00% |
Small Cap | 100.00% | 100.00% |
ESG Beta Quality | 100.00% | 100.00% |
ESG Beta Dividend | 18.96% | 19.53% |
International Index | 100.00% | 0.00% |
Global Women's Index | 100.00% | 60.48% |
Global Environmental Markets | 100.00% | 98.35% |
Core Bond | 0.00% | 0.00% |
High Yield Bond | 1.19% | 1.10% |
Balanced | 91.19% | 81.61% |
Capital Appreciation | 100.00% | 100.00% |
Total Return | 46.52% | 64.98% |
For the fiscal year ended December 31, 2016, the Pax MSCI International ESG Index Fund earned foreign source income totaling $16,034,718 and paid $1,146,153 in foreign taxes which it intends to pass through its shareholders.
Board Considerations in Approving the New Advisory and Subadvisory Agreements (Unaudited)
Review Process. The Investment Company Act of 1940 (the “1940 Act”) requires that both the full Board of Trustees (the “Trustees”) of Pax World Funds Series Trust I (the “Trust”) and a majority of the Trustees who are not “interested persons” (as defined in Section 2(a)(19) of the 1940 Act) of the Trust (the “Independent Trustees”), voting separately, approve any new investment advisory contract or subadvisory contract, or any amendment thereof, for any series of the Trust.
The 1940 Act also requires that the Trustees request and evaluate, and that Pax World Management LLC (“PWM” or the “Adviser”) furnish, such information as may reasonably be necessary for the Trustees to evaluate the terms of the advisory contract between the Trust and the Adviser (the “Management Contract”) with respect to Pax Large Cap Fund (the “Large Cap Fund”), Pax Core Bond Fund (the “Core Bond Fund”), Pax ESG Beta Dividend Fund (the “ESG Beta Dividend Fund”) (together, the “New Funds”) and Pax Balanced Fund (the “Balanced Fund”) (together with the New Funds, the “Funds”). Similarly, the 1940 Act requires that the Trustees request and evaluate, and that Aperio Group LLC (“Aperio” or the “Subadviser”) furnish, such
175
December 31, 2016 |
information as may reasonably be necessary for the Trustees to evaluate the terms of the subadvisory contract between the Adviser and the Subadviser (the “Subadvisory Contract”) with respect to ESG Beta Dividend Fund. The Independent Trustees met via telephone on November 21, 2016 and in person on December 7-8, 2016 for the purpose of considering the approval of the Management Contract and the Subadvisory Contract (the “contract review meetings”). With respect to the New Funds, the Independent Trustees considered the initial approval of the Management Contract and the Subadvisory Contract. With respect to the Balanced Fund, the Independent Trustees considered an amendment to the Management Contract that would reduce the fees payable thereunder by the Balanced Fund in light of its restructuring as a “fund-of-funds” investing in other Pax Funds, including the New Funds.
During the contract review meetings, the Trustees met and discussed the Management Contract and the Subadvisory Contract with representatives of the Adviser. The Independent Trustees were assisted in their evaluation of the Management Contract and the Subadvisory Contract by independent legal counsel, from whom they received assistance and advice, including a review of the legal standards applicable to the consideration of advisory arrangements, and with whom they met separately from management. The Independent Trustees requested information and discussed with management information that was provided.
In their deliberations, the Trustees did not identify any particular information that was all-important or controlling. Some of the factors that figured particularly in the Trustees’ deliberations are described below, although individual Trustees may have evaluated the information presented differently from one another, or given different weights to various factors in reaching their unanimous conclusion. The Trustees’ conclusions were based, in part, on information they receive and consider throughout the year, both in connection with the general oversight of the Pax Funds and on the information they had obtained from the Adviser at other meetings, including in connection with their approval on June 8-9, 2016 of the continuation of the Management Contract for all of the other Pax Funds and the Subadvisory Contract with Aperio for Pax ESG Beta Quality Fund. The Trustees evaluated the information available to them on a Fund-by-Fund basis, and their determinations were made separately in respect of each applicable Fund. However, they also took into account the common interests of all the Funds in their review.
Nature, Extent and Quality of Services. In considering the Management Contract and the Subadvisory Contract, the Trustees, including the Independent Trustees, evaluated the nature, extent and quality of the advisory services provided and to be provided to the Funds by the Adviser and, with respect to the ESG Beta Dividend
176
December 31, 2016 |
Fund, the Subadviser. They considered the terms of the Management Contract and the Subadvisory Contract, as applicable, and received and considered information provided by management that described, among other matters:
● | the nature and scope of the advisory services provided and to be provided to the Funds and information regarding the experience, qualifications and adequacy of the personnel providing those services, |
● | the investment program used or to be used by the Adviser and the Subadviser to manage the Funds, |
● | possible conflicts of interest and fall-out benefits, |
● | brokerage practices, |
● | the compliance functions of the Adviser and Subadviser, and |
● | financial results, assets under management and other information relating to the financial resources of the Adviser. |
In addition to considering the Funds’ investment performance (see below), the Trustees considered, among other matters, the general oversight of the Trust by the Adviser. They also took into account information concerning the investment philosophies and investment processes used by the Adviser and Subadviser in managing the Funds as well as their in-house investment and sustainable research capabilities. They also considered various investment resources available to the Adviser and Subadviser, including research services acquired with “soft dollars” available to the Adviser and Subadviser as a result of securities transactions effected for the Funds.
The Trustees considered, among other matters, that the Adviser provides the Trust with office space and personnel, and provides oversight and coordination of the Funds’ third-party service providers. These services include accounting, bookkeeping, tax, legal, audit, custody and transfer agency services, and preparation of prospectuses, shareholder reports and other regulatory filings. They also took into account the Adviser’s compliance and operational functions, as well as the resources being devoted by the Adviser to such functions.
The Trustees concluded, within the context of their overall conclusions regarding the Management Contract and the Subadvisory Contract, that the scope of the services provided and to be provided to the Funds under the Management Contract, and to the ESG Beta Dividend Fund by the Subadviser, was consistent with such Fund’s operational requirements; that the Adviser has the capabilities, resources
177
December 31, 2016 |
|
and personnel necessary to provide the advisory services currently required by each Fund; and that, overall, the nature, extent and quality of the services provided and to be provided by the Adviser and the Subadviser to each Fund were sufficient to warrant approval of the Management Contract and the Subadvisory Contract.
Fund Performance. In connection with the contract review meetings, the Trustees, including the Independent Trustees, reviewed information prepared by the Adviser regarding the total return investment performance of the Balanced Fund, comparing such Fund’s investment results with those of the 30 largest mutual funds within the Lipper Mixed-Asset Target Allocation Growth Fund category over the 1-, 3-, 5- and 10-year periods ended September 30, 2016. The Independent Trustees considered that the Balanced Fund had outperformed its Broadridge Financial Solutions, Inc. (“Broadridge”) performance universe average for the 1-year period, but had underperformed its performance universe average for the 3-, 5- and 10-year periods.
The Independent Trustees considered historical performance information provided by the Adviser for the equity and bond portions of the Balanced Fund in connection with their consideration of the Management Contract for the Large Cap Fund and the Core Bond Fund. The Independent Trustees also considered certain hypothetical back-tested performance information provided by the Adviser for the ESG Beta Dividend Fund and discussed with the Adviser and the Subadviser the assumptions underlying such performance information.
In addition to the information reviewed by the Trustees at the contract review meetings, the Trustees received during the year detailed comparative performance information for the Balanced Fund including performance relative to selected securities indices or other benchmarks. The Trustees also considered the portfolio turnover rate of the Balanced Fund.
Based on this and other information, the Trustees concluded, within the context of their overall conclusions regarding the Management Contract and Subadvisory Contract, that the relevant performance record and process in managing each Fund were sufficient to support approval of the Management Contract and Subadvisory Contract.
Fees and Other Expenses. The Trustees, including the Independent Trustees, considered the proposed advisory fees to be paid by each Fund to the Adviser, and, with respect to Pax ESG Beta Dividend Fund, the proposed subadvisory fees to be paid to the Subadviser by PWM, as well as each Fund’s proposed distribution and service (Rule 12b-1) fees, “other expenses” and total expenses. In doing so, the Trustees reviewed both information provided by management and information
178
December 31, 2016 |
|
prepared by Broadridge regarding the proposed expenses of each Fund relative to those of its Broadridge peer group. The Independent Trustees considered that the total expenses of each of the Large Cap Fund, ESG Beta Dividend Fund and Balanced Fund (after giving effect to the expense reimbursements described below, if applicable) were below the median total expenses of its respective peer group. The Independent Trustees considered that the total expenses of the Core Bond Fund were above the median, though within the range of, total expenses of its peer group. The Independent Trustees also considered that the management fees of the Large Cap Fund were equal to the median management fees of its peer group, the management fees of the Balanced Fund (after giving effect to the expense reimbursements described below) were below the median management fees for its peer group, and the management fees of each of the ESG Beta Dividend Fund and the Core Bond Fund were above the median management fees of its respective peer group. In connection with their review, the Trustees considered PWM’s agreement to waive 0.01% of the advisory fee for the Balanced Fund (a unified fee that includes all of the operating costs and expenses of the Fund (other than taxes, charges of governmental agencies, interest, brokerage commissions incurred in connection with portfolio transactions, distribution and/or service fees payable under a plan pursuant to Rule 12b-1 under the 1940 Act, acquired fund fees and expenses and extraordinary expenses), including accounting expenses, administrator, transfer agent and custodian fees, Fund legal fees and other expenses) from December 12, 2016 through December 31, 2017.
The Independent Trustees noted that, under the Management Contract with respect to the ESG Beta Dividend Fund, the Adviser was obligated to pay all operating costs and expenses of the Fund (other than taxes, charges of governmental agencies, interest, brokerage commissions incurred in connection with portfolio transactions, distribution and/or service fees payable under a plan pursuant to Rule 12b-1 under the 1940 Act, acquired fund fees and expenses and extraordinary expenses), including accounting expenses, administrator, transfer agent and custodian fees, Fund legal fees and other expenses.
The Trustees considered the expenses indirectly borne by the Balanced Fund through its investment in other funds (including funds advised by PWM), and the extent to which the services provided by PWM to such funds afforded the Balanced Fund access to a more diversified investment portfolio than would otherwise have been practicable in light of the Balanced Fund’s current asset level.
The Trustees noted that the Adviser, at the time of the contract review meetings, did not have a significant institutional advisory business outside of the Funds, and considered the differences in the services provided and proposed to be provided to institutional clients and those provided and to be provided to the Funds, as well as
179
December 31, 2016 |
|
differences in the advisory fees charged and proposed to be charged to such clients and those charged and to be charged to the Funds. The Trustees observed that the Funds’ advisory fees and total expenses remained generally in line with those of other mutual funds identified by Broadridge.
Based on this and other information, the Trustees concluded, within the context of their overall conclusions regarding the Management Contract and the Subadvisory Contract, that the fees and expenses to be charged represented reasonable compensation to the Adviser and the Subadviser in light of the services provided and to be provided to the Funds.
Costs of Services Provided and Profitability. The Trustees, including the Independent Trustees, considered the cost of services provided and to be provided by the Adviser and the impact of the proposals on the anticipated profitability of the Adviser’s relationship with the Trust. The Trustees recognized that the Adviser should, in the abstract, be entitled to earn a reasonable level of profit for the services provided and to be provided to each Fund, and that it is difficult to make comparisons of profitability from mutual fund advisory contracts because comparative information is not generally available and is affected by numerous factors, including the structure of the particular adviser, the types of funds it manages, its business mix, numerous assumptions about cost allocations and the Adviser’s capital structure and cost of capital. The Trustees concluded that, taking all of the foregoing into account, they were satisfied that the Adviser’s level of profitability from its relationship with the Trust was not excessive. With respect to the ESG Beta Dividend Fund, the Trustees did not consider the profitability of the Subadvisory Contract to the Subadviser because the structure of the Subadvisory Contract is such that any profits to the Subadviser reduce the profitability of PWM, and the fees payable under the Subadvisory Contract are the product of arm’s-length bargaining between the Subadviser and PWM.
Possible Fall-Out Benefits. The Trustees, including the Independent Trustees, considered information regarding the direct and indirect benefits to PWM and the Subadviser from their relationships with the Funds, including reputational and other “fall out” benefits. During the course of the year, the Trustees received presentations from PWM about its trading practices and brokerage arrangements, including its policies with respect to research provided in connection with trade execution for the relevant Funds (soft dollar arrangements), and the Trustees accepted the representation of PWM that it fulfills its fiduciary obligation of seeking best execution when engaging in portfolio transactions for the Funds. The Trustees considered the receipt of these benefits in light of PWM’s estimated profitability, and concluded that such benefits were not excessive.
180
December 31, 2016 |
|
Possible Economies of Scale. The Trustees, including the Independent Trustees, considered the extent to which the Adviser and the Subadviser, as applicable, may realize economies of scale or other efficiencies in managing and supporting the Funds. They noted that as assets increase, certain fixed costs may be spread across a larger asset base, and it was noted that any economies of scale or other efficiencies might be realized (if at all) across a variety of products and services, including the Funds, and not only in respect of a single Fund.
The Trustees concluded that the Funds’ overall fee arrangements represent an appropriate sharing at the present time between Fund shareholders and the Adviser and Subadviser, as applicable, of any economies of scale or other efficiencies in the management of each Fund at current asset levels.
Conclusions. Based on their evaluation of factors that they deemed to be material, including those factors described above, the Trustees, including the Independent Trustees, unanimously concluded that the approval of the Management Contract with respect to each Fund and the entering into the Subadvisory Contract with respect to the ESG Beta Dividend Fund was in the best interests of the Funds and should be approved.
Management of the Funds (Unaudited)
The business of the Trust is managed under the direction of the Trust’s Board of Trustees. The Adviser serves as investment adviser to the Funds pursuant to an investment advisory agreement between the Adviser and the Trust. The Trust’s Board of Trustees oversees the Adviser and decides upon matters of general policy. The Board of Trustees meets at least four (4) times per year, and reviews the performance and operations of the Funds. The Adviser, either directly or through others selected by the Adviser, furnishes daily investment advisory services.
Officers/Trustees
The following table reflects the name and age, position(s) held with the Trust, the term of office and length of time served, the principal occupation(s) during the past five (5) years, other directorships held, and the number of portfolios overseen in the Pax World Fund Family of those persons who were the trustees and/or officers of the Funds on December 31, 2016. The trustees and officers set forth in the first table below (Interested Trustees and Officers) are considered interested persons under the 1940 Act by virtue of their position or affiliation with the Adviser. The trustees in the second table (Disinterested Trustees) are not considered interested persons and have no affiliation with the Adviser. The business address of each trustee and officer is 30 Penhallow Street, Suite 400, Portsmouth, NH 03801.
181
December 31, 2016 |
|
None of the officers or trustees of the Funds are related to one another by blood, marriage or adoption. The aggregate remuneration paid by each Fund during the period covered by the report to (i) all Trustees and all members of any advisory board for regular compensation; (ii) each Trustee and each member of an advisory board for special compensation; (iii) all officers; and (iv) each person of whom any officer or Trustee of the Fund is an affiliated person is as follows: Large Cap Fund, $0; Mid Cap Fund, $21,665; Small Cap Fund, $52,558; ESG Beta Quality Fund, $30,792; ESG Beta Dividend Fund, $0; International Index Fund, $44,407; Global Women’s Index Fund, $25,530; Global Environmental Markets Fund, $35,889; Core Bond Fund, $0; High Yield Bond Fund, $40,903; Pax Balanced Fund, $116,028; Capital Appreciation Fund, $22,325; Total Return Fund, $22,272; ESG Managers Growth and Income Portfolio, $5,272; and ESG Managers Balanced Portfolio, $5,465.
Interested Trustees and Officers
Name and Age | Position(s) Held With the Trust; Term of Office1; and Length of Time Served | Principal Occupation(s) During Past | Number of Funds in the Pax World Fund Family Overseen by Trustee |
Laurence A. Shadek (67) | Trust I: Trustee (since 2006) | Chair of PWM (1996-present); Executive Vice-President of Wellington Shields & Co. LLC or its predecessor organization (1986-present); Trustee of Pax World Funds Trust II (2008-2014); member of the Board of Trustees of Franklin & Marshall College (1998-present). | 12 |
Joseph Keefe | Trust I: Trustee, Chief Executive Officer
Trust III: Trustee, Chief Executive Officer | Chief Executive Officer (2005-present) and President (2006-present) of PWM; Chief Executive Officer of PEM (2014-present); Trustee and Chief Executive Officer of Pax World Funds Trust II (2008-2014); member of the Boards of Directors of On Belay (2006-2011), and Americans for Campaign Reform (2003-2014); member of the Board of Women Thrive Worldwide (2009-present); Co-Chair of the Leadership Group of the Women’s Empowerment Principles (2014-present). | 13 |
182
December 31, 2016 |
|
Interested Trustees and Officers, continued
Name and Age | Position(s) Held With the Trust; Term of Office1; and Length of Time Served | Principal Occupation(s) During Past | Number of Funds in the Pax World Fund Family Overseen by Trustee |
Sallie Krawcheck (52) | Trust III: Trustee (since 2014) | Chair of PEM (2014-present); Chief Executive Officer of Ellevest (2016-present); Owner, Ellevate Network (2013-present); Director, 2U (2014-present); Director, Motif Investing (2012-2014); President, Bank of America Wealth Management (2009-2011); Chief Executive Officer, Citi Wealth Management (2007-2008); Chief Financial Officer, Citi (2005-2007); Chief Executive Officer, Smith Barney (2002-2005); Chief Executive Officer, Sanford C. Bernstein & Co. (2001-2002). | 1 |
John Boese (53) | Trust I: Chief Compliance Officer (since 2006)
Trust III: Chief Compliance Officer (since 2013) | Chief Compliance Officer of PWM (2006-present) and of PEM (2014-present); Chief Compliance Officer of Pax World Funds Trust II (2008-2014). | N/A |
Maureen Conley (54) | Trust I: Secretary
Trust III: Secretary | Senior Vice President of Shareholder Services/Operations (2005-present) for PWM; Secretary of Pax World Funds Trust 11 (2008-2014). | N/A |
Alicia K. DuBois (57) | Trust I: Treasurer
Trust III: Treasurer | Chief Financial Officer for PWM (2006-present) and for PEM (2014-present); Treasurer for Pax World Funds Trust II (2008-2014). | N/A |
183
December 31, 2016 |
|
Interested Trustees and Officers, continued
Name and Age | Position(s) Held With the Trust; Term of Office1; and Length of Time Served | Principal Occupation(s) During Past | Number of Funds in the Pax World Fund Family Overseen by Trustee |
Robert Silva (50) | Trust I: Assistant Treasurer
Trust III: Assistant Treasurer (Since 2015) | Senior Vice President, Fund Accounting and Fund Administration, Huntington Asset Services, Inc. (September 2010 to August 2014); Treasurer and Chief Financial Officer, Unified Series Trust (June 2011 to August 2014); Treasurer and Chief Financial Officer, Capitol Series Trust (September 2013 to August 2014); Treasurer, The Huntington Funds Trust (November 2010 to November 2013); Treasurer, Huntington Strategy Shares (November 2010 to November 2013); Treasurer and Chief Financial Officer, Dreman Contrarian Funds (March 2011 to February 2013); Treasurer, Valued Advisers Trust (February 2013 to December 2013). | N/A |
Disinterested Trustees
Name and Age | Position(s) Held With the Trust; Term of Office1; and Length of Time Served | Principal Occupation(s) During Past | Number of Funds in the Pax World Fund Family Overseen by Trustee2 |
Adrian P. Anderson (62)2 | Trust I: Trustee
Trust III: Trustee | Trustee of Pax World Funds Trust II (2008-2014); Chief Executive Officer of North Point Advisers, LLC (2004-present). | 13 |
184
December 31, 2016 |
|
Disinterested Trustees, continued
Name and Age | Position(s) Held With the Trust; Term of Office1; and Length of Time Served | Principal Occupation(s) During Past | Number of Funds in the Pax World Fund Family Overseen by Trustee2 |
D’Anne Hurd (66)2 | Trust I: Trustee
Trust III: Trustee | Independent Governance Consultant and Private Investor (2010-present), Chairman of the Board — Monzite Corporation (2013-present), Member of the Board of Directors, Audit (Chair) and Compensation Committees — Peckham Industries, Inc. (2013-present), Member of the Board of Directors, Audit and Compensation Committees —Hiperos, LLC (2011-2014), Member of the Board of Directors, Governance (Chair), Audit and Compensation Committees, Micronetics, Inc. (Nasdaq: NOIZ) (2006-2012), Business Advisory Board Member - Myomo, Inc. (2012-present), Member of the Board of Directors — Women Empowered in Science and Technology (WEST) (2011-2015). | 13 |
Cynthia Hargadon (61)3 | Trust I: Trustee
Trust III: Trustee | Trustee of Pax World Funds Trust II (2008-2014); Senior Consultant and Partner of North Point Advisers, LLC (2010-present). | 13 |
Louis F. Laucirica (75)2 | Trust I: Trustee
Trust III: Trustee | Trustee of Pax World Funds Trust II (2008-2014); Associate Dean and Director of Undergraduate Studies of Stevens Institute of Technology, Howe School (1999-2010). | 13 |
185
December 31, 2016 |
|
Disinterested Trustees, continued
Name and Age | Position(s) Held With the Trust; Term of Office1; and Length of Time Served | Principal Occupation(s) During Past | Number of Funds in the Pax World Fund Family Overseen by Trustee2 |
John L. Liechty (62)3 | Trust I: Chairman of the Board of Trustees (since 2014); Trustee (since 2009) Trust III: Chairman of the Board of Trustees (since 2014); Trustee (since 2013) | Trustee of Pax World Funds Trust II (2009-2014); Principal, Integrated Investment Solutions (2009-present); Principal, Integrated Financial Planning (2010-present); President and CEO, MMA Praxis Mutual Funds (1997-2008). | 13 |
Nancy S. Taylor (61)3 | Trust I: Trustee
Trust III: Trustee | Trustee of Pax World Funds Trust II (2008-2014); Senior Minister & CEO, Old South Church in Boston. Advisory Board, Yale Divinity School (2010-present); Advisory Board, Idaho Human Rights Education Center (2009-present); Board of Managers, Old South Meeting House (2005-present); Trustee Emeritus, Benjamin Franklin Institute of Technology. | 13 |
1 | Trustees of the Funds hold office until a successor is chosen and qualifies. Officers of the Funds are appointed by the Board of Trustees and hold office until a successor is chosen and qualifies. |
2 | Designates a member of the Audit Committee. The Audit Committee has the responsibility of overseeing the establishment and maintenance of an effective financial control environment, for overseeing the procedures for evaluating the system of internal accounting control and for evaluating audit performance. The Audit Committee meets on at least a quarterly basis. |
3 | Designates a member of the Governance and Compliance Committee. The Governance and Compliance Committee is responsible for considering and recommending Board candidates, reviewing and recommending Board compensation, and overseeing regulatory and fiduciary compliance matters. The Governance and Compliance Committee meets on at least a quarterly basis. |
186
December 31, 2016
|
Account Options and Services |
At Pax World, we are pleased to offer a variety of account options and shareholder services to help meet your investment needs.
Types of Accounts | Services | |
Regular Accounts: Individual, business and trust accounts are available for all Pax World Funds.
Traditional IRA Contributions to an IRA may be tax-deductible. Taxes are paid only when funds are withdrawn, when investors may be in a lower tax bracket.
Roth IRA Contributions to a Roth IRA are not deductible, but after five years some types of withdrawals are tax-free.
SIMPLE IRA This is an easy-to maintain retirement plan designed for small businesses.
SEP IRA This is an employer funded retirement plan popular with small businesses and self-employed persons.
Education Savings Account & Uniform Gift to Minors Account (UGMA) These plans provide excellent ways to save for a child’s education. |
Automatic Investment Plan You may arrange to have a fixed amount automatically deducted from your checking or savings account and invested in your Pax World account on a monthly or quarterly basis. Automatic investment plans do not assure a profit and do not protect against loss in declining markets.
Online Account Access Utilizing a unique ID number and PIN, you can access your Pax World account balances or histories; purchase or redeem fund shares; or make exchanges between different Pax World Funds.
www.paxworld.com Learn all about Pax World through our web site! You can check Fund performance, read about our portfolio managers, view Connection—our quarterly newsletter, and see how Pax World voted on various proxies for the companies in our portfolios. |
Please note that the information contained herein does not constitute tax advice. Always consult your tax advisor before making any tax-related investment decisions.
This annual report is intended for shareholders of the Pax World Funds only, and is not authorized for distribution to other persons unless accompanied or preceded by a prospectus. Please consider the Funds’ investment objectives, risks and charges and expenses carefully before investing. The Funds’ prospectus contains this and other information about the Funds and may be obtained by calling 800.767.1729, emailing info@paxworld.com or visiting www.paxworld.com. The performance data quoted herein represents past performance, which does not guarantee future results. Investment return and principal value of an investment will fluctuate so that an investor’s shares, when redeemed, may be worth more or less than their original cost. In addition, current performance may be lower or higher than the performance data quoted herein. For more recent month-end performance information, please call 800.767.1729 or visit www.paxworld.com.
Distributor: ALPS Distributors, Inc. member of FINRA (2/17).
187
THIS PAGE INTENTIONALLY LEFT BLANK
THIS PAGE INTENTIONALLY LEFT BLANK

| Item 2. | Code of Ethics. |
| Item 3. | Audit Committee Financial Expert. |
| Item 4. | Principal Accountant Fees and Services. |
Item 5. | Audit Committee of Listed Registrants. |
| Item 6. | Schedule of Investments. |
| Item 7. | Disclosure of Proxy Voting Policies and Procedures for Closed-End Management Investment Companies. |
| Item 8. | Portfolio Managers of Closed-End Management Investment Companies. |
| Item 9. | Purchase of Equity Securities by Closed-End Management Investment Company and Affiliated Purchasers. |
| Item 10. | Submission of Matters to a Vote of Security Holders. |
| Item 11. | Controls and Procedures. |
| Item 12. | Exhibits. |
| (a) | (1) | The registrant's code of ethics pursuant to Item 2 of Form N-CSR is filed with the registrant's annual Form N-CSR. | ||
| (2) | Certifications of the principal executive officer and principal financial officer of the Registrant as required by Rule 30a-2(a) under the Investment Company Act of 1940, as amended, are attached. | |||
| (3) | Written solicitation to repurchase securities issued by closed-end companies: not applicable. | |||
| (b) | Certification of the principal executive officer and principal financial officer of the Registrant required by Rule 30a-2(b) under the Investment Company Act of 1940, as amended. | |||
| (Registrant) | Pax World Funds Series Trust III | ||
| By (Signature and Title) | /s/ Joseph F. Keefe | ||
| Joseph F. Keefe, President | |||
| Date | February 22, 2017 | ||
| By (Signature and Title) | /s/ Joseph F. Keefe | ||
| Joseph F. Keefe, President (Principal Executive Officer) | |||
| Date | February 22, 2017 | ||
| By (Signature and Title) | /s/ Alicia K. DuBois | ||
| Alicia K. DuBois, Treasurer (Principal Financial Officer) | |||
| Date | February 22, 2017 | ||