UNITED STATES
SECURITIES AND EXCHANGE COMMISSION
Washington, D.C. 20549
FORM N-CSR
CERTIFIED SHAREHOLDER REPORT OF REGISTERED
MANAGEMENT INVESTMENT COMPANIES
| Investment Company Act file number | 811-22935 | |
| IMPAX FUNDS SERIES TRUST III |
| (Exact name of Registrant as specified in charter) |
| |
| 30 Penhallow Street, Suite 400, Portsmouth, NH | 03801 |
| (Address of principal executive offices) | (Zip code) |
| |
Impax Asset Management LLC
30 Penhallow Street, Suite 400, Portsmouth, NH 03801
Attn.: Joseph Keefe |
| (Name and address of agent for service) |
| Registrant’s telephone number, including area code: | 800-767-1729 | |
| Date of fiscal year end: | December 31 | |
| Date of reporting period: | December 31, 2022 | |
Form N-CSR is to be used by management investment companies to file reports with the Commission not later than 10 days after the transmission to stockholders of any report that is required to be transmitted to stockholders under Rule 30e-1 under the Investment Company Act of 1940 (17 CFR 270.30e-1). The Commission may use the information provided on Form N-CSR in its regulatory, disclosure review, inspection, and policymaking roles.
A registrant is required to disclose the information specified by Form N-CSR, and the Commission will make this information public. A registrant is not required to respond to the collection of information contained in Form N-CSR unless the Form displays a currently valid Office of Management and Budget (“OMB”) control number. Please direct comments concerning the accuracy of the information collection burden estimate and any suggestions for reducing the burden to Secretary, Securities and Exchange Commission, 450 Fifth Street, NW, Washington, DC 20549-0609. The OMB has reviewed this collection of information under the clearance requirements of 44 U.S.C. §3507.
Item 1. Reports to Stockholders
IMPAX LARGE CAP FUND
IMPAX SMALL CAP FUND
IMPAX US SUSTAINABLE
ECONOMY FUND
IMPAX GLOBAL SUSTAINABLE
INFRASTRUCTURE FUND
IMPAX GLOBAL OPPORTUNITIES
FUND
IMPAX GLOBAL ENVIRONMENTAL MARKETS FUND
IMPAX ELLEVATE GLOBAL WOMEN’S LEADERSHIP FUND
IMPAX INTERNATIONAL
SUSTAINABLE ECONOMY FUND
IMPAX CORE BOND FUND
IMPAX HIGH YIELD BOND FUND
IMPAX SUSTAINABLE ALLOCATION FUND
ANNUAL
REPORT
December 31, 2022
GO PAPERLESS. SWITCH TO E-DELIVERY.

Impax direct shareholders: Login to the Impax Portal, Impaxam.com/account. E-delivery options can be updated in your Profile.
Advisor/Brokerage clients: Contact your financial intermediary.
REDUCES CLUTTER | FASTER DELIVERY | REDUCES COSTS | SAVES TREES
| | |
Glossary of Terms | 2 |
Letter to Shareholders | 6 |
Portfolio Manager Comments and Highlights | 9 |
Impax Large Cap Fund | 9 |
Impax Small Cap Fund | 13 |
Impax US Sustainable Economy Fund | 17 |
Impax Global Sustainable Infrastructure Fund | 21 |
Impax Global Opportunities Fund | 25 |
Impax Global Environmental Markets Fund | 29 |
Impax Ellevate Global Women’s Leadership Fund | 34 |
Impax International Sustainable Economy Fund | 38 |
Impax Core Bond Fund | 43 |
Impax High Yield Bond Fund | 47 |
Impax Sustainable Allocation Fund | 52 |
Shareholder Expense Examples | 56 |
Schedules of Investments | 59 |
Statements of Assets and Liabilities | 110 |
Statements of Operations | 114 |
Statements of Changes in Net Assets | 116 |
Financial Highlights | 122 |
Notes to Financial Statements | 134 |
Report of Independent Registered Public Accounting Firm | 157 |
Trustees and Officers | 161 |
Account Options and Services | 166 |
* | Effective December 31, 2022, the names of each Fund changed to replace “Pax” with the name “Impax”. |
For More Information |
General Fund Information 800.767.1729 Shareholder Account Information 800.372.7827 Account Inquiries Impax Funds
P.O. Box 534463
Pittsburgh, PA 15253-4463 Investment Adviser Impax Asset Management LLC
30 Penhallow Street, Suite 400
Portsmouth, NH 03801 | Transfer and Dividend Disbursing Agent BNY Mellon Investment
Servicing (U.S.) Inc.
P.O. Box 534463
Pittsburgh, PA 15253-4463 Custodian State Street Bank and Trust Company
1 Lincoln Street
Boston, MA 02111 |
Blended Index for the Impax Sustainable Allocation Fund is composed of 60% S&P 500 Index and 40% Bloomberg US Aggregate Bond Index.
Bloomberg US Aggregate Bond Index is a broad-based index, maintained by Bloomberg L.P. often used to represent investment grade bonds being traded in the United States.
FTSE Environmental Opportunities Index Series measures the performance of global companies that have significant involvement in environmental business activities, including renewable and alternative energy, energy efficiency, water technology, waste and pollution control and food, agriculture and forestry. The FTSE Environmental Opportunities Index Series requires companies to have at least 20% of their business derived from environmental markets and technologies. The FTSE Environmental Opportunities Index Series is published by a joint venture of Impax Asset Management, Ltd. (“Impax”) with FTSE International. Impax is also the sub-adviser to the Impax Global Environmental Markets Fund.
The FTSE Global Infrastructure Opportunities Index is designed to reflect the performance of infrastructure and infrastructure-related listed securities worldwide. Companies must derive a minimum of 20% of their revenue from either the core infrastructure activities or the infrastructure-related activities to be considered for index inclusion.
ICE BofA Merrill Lynch U.S. High Yield - Cash Pay - BB-B (Constrained 2%) Index tracks the performance of BB- and B rated fixed income securities publicly issued in the major domestic or Eurobond markets, with total index allocation to an individual issuer limited to 2%.
Impax Global Women’s Leadership Index is a customized market capitalization-weighted index created and licensed by Impax Asset Management (“IAM”) consisting of equity securities of issuers organized or operating in countries around the world that demonstrate a commitment to advancing and empowering women through gender diversity on their boards, in management and through other policies and programs, and an understanding of the potential business advantages associated with greater gender diversity, as rated by the IAM Gender Analytics team, with final approval by the IAM Women’s Index Committee. In addition, the companies comprising the Women’s Index meet certain environmental, social and governance (ESG) or sustainability thresholds, as rated by MSCI ESG Research.
Impax Sustainability Lens is a proprietary tool designed to facilitate a systematic review of the economic opportunities and risks associated with the transition to a more sustainable economy. The tool highlights sub-industries with transition tailwinds and headwinds, assisting the investment team in identifying companies that the Adviser believes present attractive opportunities and lower risks.
Impax Systematic ESG Rating is a proprietary ranking of companies’ environmental, social and governance (ESG). The rating framework is shaped on how sustainability impacts financial performance. The rating emphasizes a company’s management of ESG-related risks.
Lipper Core Bond Funds Index tracks the results of the 30 largest mutual funds in the Lipper Core Bond Funds Index Average. The Lipper Core Bond Funds Index Average is a total return performance average of mutual funds tracked by Lipper, Inc. that invest at least 85% in domestic investment-grade debt issues (rated in the top four grades) with any remaining investment in non-benchmark sectors such as high-yield, global and emerging market debt. These funds maintain dollar-weighted average maturities of five to ten years.
Lipper Global Infrastructure Funds Index tracks the results of the 10 largest mutual funds in the Lipper Global Infrastructure Fund Index Average. The Lipper Global Infrastructure Funds Index Average is a total return performance average of mutual funds tracked by Lipper, Inc. that, by portfolio practice, invest predominantly across energy, industrials, utilities and materials sectors.
Funds must contain a diverse mix of listed & liquid equities that reflect companies which engaged in core infrastructure activities. These generally include large geographic projects leading to the construction of energy supplies, utilities, education, health, social and transportation facilities.
Lipper Global Multi-Cap Core Funds Index tracks the results of the 30 largest mutual funds in the Global Multi-Cap Core Funds Index Average. The Global Multi-Cap Core Funds Index Average is a total return performance average of mutual funds tracked by Lipper, Inc. that, by portfolio practice, invest in a variety of market capitalization ranges without concentrating 75% of their equity assets in any one market capitalization range over an extended period of time. Global multi-cap core funds typically have average characteristics compared to the MSCI World Index.
Lipper Global Multi-Cap Growth Funds Index tracks the results of funds that invest in a variety of market capitalization ranges without concentrating 75% of their equity assets in any one market capitalization range over an extended period of time. Multi-cap funds typically have 25% to 75% of their assets invested in companies both inside and outside of the U.S. with market capitalizations (on a three-year weighted basis) above 400% of the 75th market capitalization Glossary of Terms 3 percentile of the S&P/Citigroup World Broad Market Index. Multi-cap growth funds typically have an above-average price-to-cash flow ratio, price-to-book ratio, and three-year sales-per-share growth value compared to the S&P/Citigroup BMI. One cannot invest directly in an index.
Lipper High Yield Bond Funds Index tracks the results of the 30 largest mutual funds in the Lipper High Yield Bond Funds Average. The Lipper High Yield Bond Funds Average is a total return performance average of mutual funds tracked by Lipper, Inc. that aim at high (relative) current yield from fixed income securities, have no quality or maturity restrictions and tend to invest in lower grade debt issues.
Lipper International Large-Cap Core Funds Index tracks the results of funds that, by portfolio practice, invest at least 75% of their equity assets in companies strictly outside of the U.S. with market capitalizations (on a three-year weighted basis) above Lipper’s international large-cap floor. International large-cap core funds typically have an average price-to-cash flow ratio, price-to-book ratio and three-year sales-per-share growth value compared to the S&P/Citigroup World ex-U.S. BMI.
Lipper Large-Cap Core Funds Index tracks the results of the 30 largest mutual funds in the Lipper Large Cap Core Funds Index Average. The Lipper Large Cap Core Funds Index Average is a total return performance average of mutual funds tracked by Lipper, Inc. that invest at least 75% of their equity assets in companies with market capitalizations (on a three-year weighted basis) above Lipper’s USDE large-cap floor. Large-cap core funds have more latitude in the companies in which they invest. These funds typically have average characteristics compared to the S&P 500 Index.
Lipper Multi-Cap Core Funds Index tracks the results of the 30 largest mutual funds in the Lipper Multi-Cap Core Funds Index Average. The Lipper Multi-Cap Core Funds Index Average is a total return performance average of mutual funds tracked by Lipper, Inc. that invest in a variety of market capitalization ranges without concentrating 75% of their equity assets in any one market capitalization range over an extended period of time. These funds typically have average characteristics compared to the S&P SuperComposite 1500 Index.
Lipper Small-Cap Core Funds Index tracks the results of the 30 largest mutual funds in the Lipper Small-Cap Core Funds Average. The Lipper Small-Cap Core Funds Average is a total return performance average of the mutual funds tracked by Lipper, Inc. that, by portfolio practice, invest at least 75% of their equity assets in companies with market capitalizations (on a three-year weighted basis) below Lipper’s USDE small-cap ceiling. Small-cap core funds have more latitude
Glossary of Terms, continued |
in the companies in which they invest. These funds typically have an average price-to-earnings ratio, price-to-book ratio, and three-year sales-per-share growth value, compared to the S&P SmallCap 600 Index.
Morningstar Allocation – 50% to 70% Equity seeks to provide both capital appreciation and income by investing in three major areas: stocks, bonds and cash. These portfolios tend to hold larger positions in stocks than conservative-allocation portfolios. These portfolios typically have 50% to 70% of assets in equities and the remainder in fixed income and cash.
MSCI All-Country World Index (“ACWI”) Index is a free float-adjusted market capitalization weighted index that is designed to measure the equity market performance of developed and emerging markets. The MSCI ACWI consists of 48 country indices comprising 23 developed and 24 emerging market country indices. The developed market country indices included are: Australia, Austria, Belgium, Canada, Denmark, Finland, France, Germany, Hong Kong, Ireland, Israel, Italy, Japan, Netherlands, New Zealand, Norway, Portugal, Singapore, Spain, Sweden, Switzerland, United Kingdom and United States. The emerging market country indices included are: Brazil, Chile, China, Colombia, Czech Republic, Egypt, Greece, Hungary, India, Indonesia, Korea, Kuwait, Malaysia, Mexico, Peru, Philippines, Poland, Qatar, Saudi Arabia, South Africa, Taiwan, Thailand, Turkey and United Arab Emirates.
MSCI EAFE (Europe, Australasia, Far East) Index is a free float-adjusted market capitalization index that is designed to measure the equity market performance of developed markets, excluding the U.S. and Canada. The MSCI EAFE (Net) Index consists of the following 21 developed market country indices: Australia, Austria, Belgium, Denmark, Finland, France, Germany, Hong Kong, Ireland, Israel, Italy, Japan, Netherlands, New Zealand, Norway, Portugal, Singapore, Spain, Sweden, Switzerland, and United Kingdom.
MSCI EAFE ESG Leaders Index is a free float-adjusted market capitalization weighted index designed to measure the performance of equity securities of issuers organized or operating in developed market countries around the world excluding the U.S. and Canada that have high environmental, social and governance (ESG) ratings relative to their sector and industry group peers, as rated by MSCI ESG Research annually. MSCI ESG Research evaluates companies’ ESG characteristics and derives corresponding ESG scores and ratings. Companies are ranked by ESG score against their sector peers to determine their eligibility for the MSCI ESG indices. MSCI ESG Research identifies the highest-rated companies in each peer group to meet the float-adjusted market capitalization sector targets. The rating system is based on general and industry-specific ESG criteria, assigning ratings on a 7-point scale from AAA (highest) to CCC (lowest).
MSCI World Index is a free float-adjusted market capitalization weighted index that is designed to measure the equity market performance of developed markets. The MSCI World Index consists of the following 23 developed market country indices: Australia, Austria, Belgium, Canada, Denmark, Finland, France, Germany, Hong Kong, Ireland, Israel, Italy, Japan, Netherlands, New Zealand, Norway, Portugal, Singapore, Spain, Sweden, Switzerland, the United Kingdom, and the United States.
Russell 1000 Index measures the performance of the 1,000 largest U.S. companies, as measured by market capitalization. It is a subset of the Russell 3000 Index, which measures the largest 3,000 companies. The Russell 1000 Index is comprised of over 90% of the total market capitalization of all listed U.S stocks.
Russell 2000 Index measures the performance of the small-cap segment of the U.S. equity universe. The Russell 2000 Index is a subset of the Russell 3000 Index representing approximately 10% of the total market capitalization of that index. It includes approximately 2,000 of the smallest securities based on a combination of their market cap and current index membership.
The S&P 500 Index is an unmanaged index of large capitalization common stocks.
The S&P Global Infrastructure Index is designed to track 75 companies from around the world chosen to represent the listed infrastructure industry while maintaining liquidity and tradability. To create diversified exposure, the index includes three distinct infrastructure clusters: energy, transportation, and utilities.
Performance for the MSCI ACWI Index, the MSCI EAFE Index, the MSCI EAFE ESG Leaders Index, the MSCI World Index, the S&P Global Infrastructure Index and the Impax Global Women’s Leadership Index are shown “net”, which includes dividend reinvestments after deduction of foreign withholding tax.
Securities Indices above assume reinvestment of all distributions and interest payments, have no policy of sustainable investing and do not take into account brokerage fees or expenses.
Lipper Indices above are not what are typically considered to be an “index” because they track the performance of other mutual funds rather than changes in the value of a group of securities, a securities index or some other traditional economic indicator.
Diversification does not eliminate the risk of experiencing investment losses.
One cannot invest directly in any index.
Letter to Shareholders |
by Joseph Keefe, President |
Dear fellow shareholders,
2022 was an exceptionally challenging year for global markets, and a challenging but energizing year for Impax mutual funds. Although US gross domestic product (GDP) grew at a surprisingly solid 2.9% annual rate in the fourth quarter, both equity and bond markets delivered negative returns as investors faced higher inflation, rising interest rates, heightened geopolitical tensions, supply chain disruptions and a slower outlook for growth. A market rotation away from higher quality companies and into more commodity-oriented sectors like energy created headwinds, as our funds tend to invest in higher quality securities and are fossil fuel-free.
As you review our portfolio managers’ report on how our funds have fared in this environment, I want to underscore why, notwithstanding volatile markets, we are optimistic about the future.
At Impax, we believe that short-term volatility can offer real opportunities for active management. The resulting market inefficiencies create more attractive entry points for longer-term investments, and we believe this is particularly true for Impax’s investments, which are focused on the opportunities and risks arising from the transition to a more sustainable economy.
For example, energy market upheaval and geopolitical tensions arising from the Russian invasion of Ukraine have underscored the risks, both political and economic, of over-dependence on fossil fuel imports. We anticipate that a defining characteristic of 2023 – aided by public policy tailwinds such as infrastructure legislation and the Inflation Reduction Act in the US – will be a significant expansion of investment in renewable electricity generation. Renewables have begun to play a major role in addressing energy costs and security issues while helping to reduce carbon emissions.
Few companies have been immune to rising costs, which will continue to crimp margins in the short term. Over the longer term, we believe the imperative to shift towards a more sustainable economic model creates vast opportunities for innovative businesses, irrespective of the macroeconomic picture. The healthcare sector is an example where quality companies can continue to enhance their competitive advantage through product innovation. We believe that the combination of aging populations, more stringent regulation and ever more specific diagnoses means that focused small and midsized biotech players can thrive in niches that didn’t previously exist.
Beyond identifying investable opportunities, we continue to support our clients and contribute to the development of a sustainable society through our engagement and advocacy activity, our research, and our impact reporting.
Just a few examples in the last year include groundbreaking research with the University of Oxford on pricing physical climate risk, a corporate engagement campaign on women’s health and wellness in response to the Dobbs decision, and progress in our engagement with Disney on equity and inclusion – after many conversations over the course of several years, the company published pay equity data for the first time in December 2022. We also voiced our support when the SEC signaled that ESG factors could be material to investors, for both investment and proxy voting, and we continue to hone our internal tools to ensure we price each of these factors accurately and consistently.
You may have noticed this is the first Annual Report since the Funds’ names changed from ’Pax’ to ’Impax’ to better reflect our unified global investment approach and brand. Since all Impax-managed strategies globally apply the same investment management philosophy, process and proprietary tools, we believe that this change provides greater clarity among investors and in the marketplace.
To honor the history and legacy of Pax World Funds, we have created the Pax Scholarship Program to award annual scholarships to three New Hampshire-based educational and non-profit institutions promoting sustainability, advancing gender equality, and fostering global peace.
Despite recent challenges, we remain focused on what we believe are promising investment opportunities ahead. Over the coming decades, businesses and capital markets will be profoundly re-shaped by global sustainability challenges. Certain sectors and industries will face headwinds while others will enjoy tailwinds. Some companies will be leaders, well-positioned to potentially benefit from the sustainability transition, while laggards that fail to adjust will be left behind. Impax will continue to invest in the leaders, working on your behalf with the goal to deliver competitive investment returns while building momentum toward a more sustainable future.
Sincerely,

Joseph F. Keefe
President
Commentary The portfolio manager commentaries in this report provide insight from the respective fund managers in an effort to help you examine your fund. The views expressed therein are those of the portfolio managers and are for the period covered by this report. Such commentary does not necessarily represent the views of the Board of Trustees of your fund. The views expressed herein are subject to change at any time based upon market and/or other conditions and Impax Asset Management LLC and the funds disclaim any responsibility to update such views. The commentaries should not be relied upon as investment advice.
Historical performance Historical performance can be evaluated in several ways. Each fund’s portfolio highlights provide total and average annual total returns. A comparison of this historical data to an appropriate benchmark is also provided. These performance figures include changes in a fund’s share price, plus reinvestment of any dividends (generally income) and any capital gains (generally profits the fund earns when it sells securities that have grown in value).
Performance data quoted represent past performance, which does not guarantee future results. Investment return and principal value of an investment will fluctuate so that an investor’s shares, when redeemed, may be worth more or less than their original cost. Current performance may be lower or higher than the performance data quoted. For most recent month-end performance information, visit www.impaxam.com
The Funds’ distributor, Foreside Financial Services, LLC, is not affiliated with Impax Asset Management LLC or Impax Asset Management, Ltd.
December 31, 2022 |
Impax Large Cap Fund |
Portfolio Managers’ Comments |
| | 
|
| | Portfolio Manager
Andrew Braun |
| | |
| | 
|
| | Portfolio Manager
Barbara Browning, CFA |
How did the Impax Large Cap Fund (the Fund) perform for the period?
For the one-year period ended December 31, 2022, the Institutional Class and Investor Class of the Fund had total returns of -19.77% and -19.99%, respectively, compared to -18.11% for the S&P 500 Index and -17.00% for the Lipper Large-Cap Core Funds Index.
What factors or portfolio holdings contributed to the Fund’s performance?
In 2022, the Fund posted negative returns in absolute terms and underperformed the S&P 500 Index on a relative basis, although the Fund’s negative performance was mitigated by strong stock selection in Health Care as several of the portfolio’s positions outperformed the strong relative returns of the Health Care sector. Communication Services and Information Technology were other sectors where the portfolio generated attractive stock selection, due to being underweight to the mega cap tech complex.
Relative performance was positive until late in February, when relative performance began to be more influenced by the macro environment, including the geopolitical events transpiring in Ukraine. The steepening of the yield curve and upward move in oil and commodity prices led to a rotation out of quality and growth and into more commodity-oriented sectors of the market such as Energy in the first half of 2022. The second half of 2022 was a tale of two quarters. We saw exuberance at the start of the third quarter, but this quickly dissipated as the Federal Reserve took action to manage inflation. This was followed by a potential bear market bounce in October and November as investors bet on central banks slowing the pace of interest rate hikes in the face of a potential recession in 2023.
Stocks supported by good earnings and those with good pricing power or better inflation resilience have tended to perform better over the year. Merck (Health Care), a diversified global health care company, benefited from strong results and the rotation into large cap pharmaceuticals. Merck’s diversified revenue base remains attractive, with a leading oncology business, paired with sizeable franchises in Animal Health and Vaccine categories which have been able to outgrow market expectations. Vertex Pharmaceuticals (Health Care), a drug development company,
December 31, 2022 |
Impax Large Cap Fund, continued |
has produced a series of strong financial results and benefitted from an improving outlook for pipeline assets, thus allowing for upgrades to earnings estimates. A better competitive outlook for its key cystic fibrosis franchise has also underpinned stock performance. T-Mobile (Communication Services) is the newly ranked number two cellular provider in the US. The stock has performed strongly in an uncertain environment. In our view, the firm’s competitive 5G position, limited exposure to inflation, and defensive business model should provide management with the flexibility to execute on a significant share repurchase program over the next 36 months.
What factors or portfolio holdings detracted from the Fund’s performance?
As mentioned above, US stocks in general were down for the year as investors adjusted to the end of quantitative easing, persistent inflation, heightened geo-political tensions, and a slower outlook for growth. Market volatility has been pronounced as investors weigh slower economic momentum against central bank actions to contain inflation.
The S&P 500 Energy sector saw its best return in the last 33 years, and as a result, the Fund’s lack of an Energy allocation was the largest detractor of returns, offsetting the benefits of positive stock selection. Stock selection was most challenged in Materials, Industrials, and Financials. In particular, the portfolio’s growth-oriented Materials and Industrials holdings struggled as investors rotated to cheaper stocks with more commodity exposure.
Market rotation away from Covid-19 beneficiaries and richly valued growth and quality names were among the biggest headwinds for performance. Stanley Black and Decker (Industrials), a manufacturer of hand and power tools, had disappointing results in the second quarter, and a significant negative revision, rebasing earnings as the company announced a major restructuring program to reduce inventories, take out layers of management, and reduce manufacturing complexity. The team sold out of the position over a lack of conviction in the new CEO. Lincoln National Corp (Financials) announced a significant GAAP charge to cover changes related to decreasing numbers of older policy holders dropping coverage. This has impacted the balance sheet, expectations on the buyback program, as well as base case revenue. The team exited the position as the expectations for the company have deteriorated as a result. Aptiv (Consumer Discretionary) has faced headwinds during the year due to continued supply chain issues and higher interest rates leading to ongoing reductions in market estimates for global automotive growth. However, the company recently announced quarterly earnings highlighting continued growth in vehicle content from the transition towards electric cars, while supply chain headwinds that have inhibited
auto production this year are beginning to abate. The investment team regards the company as a key beneficiary of electrification and automation of vehicles. Despite the share price weakness, the Investment Team maintains conviction in Aptiv as a key beneficiary of electrification and automation of vehicles.
Portfolio Highlights (Unaudited)
Since Inception Total Return—Historical Growth of $10,000

Returns—Year ended December 31, 2022
| | | | | Total
Return | Average Annual Return |
Share Class | Ticker
Symbol | | | 1 Year | 3 Years | 5 Years | Since
Inception1 |
Institutional Class2 | PXLIX | | | -19.77% | 9.20% | 10.88% | 12.26% |
Investor Class2 | PAXLX | | | -19.99% | 8.94% | 10.60% | 11.99% |
S&P 500 Index | | | | -18.11% | 7.66% | 9.42% | 11.17% |
Lipper Large-Cap Core Funds Index | | | -17.00% | 6.69% | 8.25% | 10.05% |
See ‘Glossary of Terms’ for descriptions of benchmarks.
These figures represent past performance, which is no guarantee of future results. Investment return and principal value of an investment will fluctuate so that an investor’s shares, when redeemed, may be worth more or less than their original cost. Current performance may be lower or higher than the performance data quoted. Total returns for periods of less than one year have not been annualized. For most recent month-end performance data, please visit www.impaxam.com or call 800.767.1729.
1 | The Fund’s inception date is December 16, 2016. |
2 | Total return figures include reinvested dividends and capital gains distributions, and changes in principal value, and do not reflect the taxes that a shareholder might pay on Fund distributions or on the redemption of Fund shares. |
December 31, 2022 |
Impax Large Cap Fund, continued |
Portfolio Highlights (Unaudited), continued |
Asset Allocation | Percent of Investments |
Foreign Stocks | 1.8% |
U.S. Stocks | 97.4% |
Cash & Cash Equivalents | 0.8% |
Total | 100.0% |
Top Ten Holdings
Company | Percent of Net Assets |
Microsoft Corp. | 6.4% |
Apple, Inc. | 4.6% |
Trane Technologies PLC | 3.0% |
Alphabet, Inc., Class A | 2.9% |
Merck & Co., Inc. | 2.7% |
Walt Disney Co., The | 2.6% |
Visa, Inc., Class A | 2.5% |
Aptiv PLC | 2.4% |
Lowe’s Cos., Inc. | 2.4% |
Citizens Financial Group, Inc. | 2.4% |
Total | 31.9% |
Ten largest holdings do not include money market securities, certificates of deposit, commercial paper or cash and equivalents, if applicable.
Holdings are subject to change.
Sector Diversification
Sector | Percent of Net Assets |
Information Technology | 26.2% |
Health Care | 15.5% |
Financials | 11.0% |
Communication Services | 9.8% |
Industrials | 9.1% |
Consumer Discretionary | 8.5% |
Consumer Staples | 7.4% |
Real Estate | 5.8% |
Materials | 4.8% |
Utilities | 1.0% |
Other assets and liabilities (net) | 0.9% |
Total | 100.0% |
May include companies representing multiple industries within a single “Sector”.
December 31, 2022 |
Impax Small Cap Fund |
| | 
|
| | Portfolio Manager
Nathan Moser, CFA |
| | |
| | 
|
| | Portfolio Manager
Diederik Basch, CFA |
| | |
| | 
|
| | Portfolio Manager
Curtis Kim, CFA |
How did the Impax Small Cap Fund (the Fund) perform for the period?
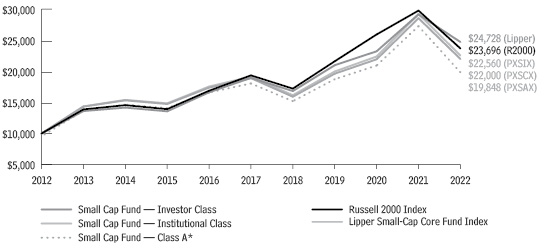
For the one-year period ended December 31, 2022, the Investor Class, Class A and Institutional Class shares of the Fund had total returns of -22.97%, -23.03% and -22.80%, respectively, compared to -20.44% for the Russell 2000 Index and -15.22% for the Lipper Small Cap Core Funds Index.
What factors or portfolio holdings contributed to the Fund’s performance?
In 2022, the Fund posted negative absolute returns and underperformed the Russell 2000 Index on a relative basis, although the Fund’s negative performance was mitigated by strong stock selection in Information Technology and Real Estate.
Relative performance was positive to begin the year, until late in February when the macroeconomic environment – including the war in Ukraine – weighed on performance. The steepening of the yield curve and an upward move in oil and commodity prices led to a rotation out of quality and growth and into more commodity-oriented sectors of the market such as Energy in the first half of 2022. The second half of 2022 was a tale of two quarters. We saw exuberance at the start of the third quarter, but this quickly dissipated as the Fed aggressively raised rates to fight inflation. This was followed by a potential bear market bounce in October and November as investors bet on central banks slowing the pace of interest rate hikes in the face of a potential recession in 2023.
The top contributors for the year were stock specific. Natus Medical (Health Care) is a neuro and newborn focused medical device company which was acquired by ArchiMed Group for a 29% premium. Karuna Therapeutics (Health Care) is a biotechnology company that develops therapies for the treatment of chronic mental health disorders. The company had positive clinical data for its schizophrenia drug in 2022. We believe that the significant unmet clinical need and better safety profile suggests this drug could have a multi-billion-dollar revenue potential. The team
December 31, 2022 |
Impax Small Cap Fund, continued |
exited the position during the period due to catalyst realization and valuation. The company was sold during the period after the share price reacted favorably to this announcement and reached the team’s intrinsic value estimate.
What factors or portfolio holdings detracted from the Fund’s performance?
As noted above, the portfolio’s performance was broadly down for the year as investors adjusted to the end of quantitative easing, persistent inflation, heightened geo-political tensions, and a slower outlook for growth. Market volatility has been pronounced as investors weigh slower economic momentum against central bank actions to contain inflation.
Energy was the only sector that delivered positive returns in the Russell 2000, as the sector saw one of its best returns in the last 25 years. The fossil fuel-free portfolio’s structural underweight to Energy and Utilities was a large detractor and offset the positive stock selection the team was able to generate for the year. Stock selection was weakest in Industrials and Financials.
Health Care names dominated the bottom contributors as the market rotated away from Covid-19 beneficiaries and names reliant on the biotech funding cycle. Health Catalyst (Health Care) lowered guidance as its core customers (hospitals and medical providers) are facing a difficult environment. Management has refocused on tangible return on investment (ROI) products, which gave our investment team the confidence to maintain and increase the position given the discounted valuation. Omnicell (Health Care) – a healthcare IT company – cited deteriorating financial health from large hospital systems and nurse staffing issues as they largely reset medium term growth targets. The stock was sold in the fourth quarter as fundamentals deteriorated.
Portfolio Highlights (Unaudited)
Since Inception Total Return—Historical Growth of $10,000
Returns—Year ended December 31, 2022
| | | | | Total
Return | Average Annual Return |
Share Class | Ticker
Symbol | | | 1 Year | 3 Years | 5 Years | 10 Years |
Investor Class1 | PXSCX | | | -22.97% | 3.88% | 3.07% | 8.20% |
Class A1,2,4 | PXSAX | NAV3 | | -23.03% | 3.87% | 3.06% | 8.19% |
| | | POP | | -27.25% | 1.93% | 1.90% | 7.58% |
Institutional Class1 | PXSIX | | | -22.80% | 4.14% | 3.32% | 8.47% |
Russell 2000 Index | | | | -20.44% | 3.10% | 4.13% | 9.01% |
Lipper Small-Cap Core Funds Index | | | -15.22% | 5.62% | 5.48% | 9.48% |
See ‘Glossary of Terms’ for descriptions of benchmarks.
These figures represent past performance, which is no guarantee of future results. Investment return and principal value of an investment will fluctuate so that an investor’s shares, when redeemed, may be worth more or less than their original cost. Current performance may be lower or higher than the performance data quoted. Total returns for periods of less than one year have not been annualized. For most recent month-end performance data, please visit www.impaxam.com or call 800.767.1729.
1 | The Fund’s investment adviser assumed certain expenses during the 10-year periods; total returns would have been lower had these expenses not been assumed. Total return figures include reinvested dividends and capital gains distributions, and changes in principal value, and do not reflect the taxes that a shareholder might pay on Fund distributions or on the redemption of Fund shares. |
2 | A 1.00% CDSC (contingent deferred sales charge) may be charged on any shares sold within 18 months of purchase over $1 million. POP (public offering price) reflects the maximum sales load for the Fund’s Class A Shares of 5.50%. NAV performance does not reflect the deduction of the sales load of the CDSC, which if reflected would reduce the performance shown. |
December 31, 2022 |
Impax Small Cap Fund, continued |
Portfolio Highlights (Unaudited), continued |
4 | Inception of Class A shares is May 1, 2013. The performance information shown for Class A shares includes the performance of Investor Class shares, adjusted to reflect the sales charge applicable to Class A shares, for the period prior to Class A inception. |
Asset Allocation | Percent of Investments |
Foreign Stocks | 2.5% |
U.S. Stocks | 96.8% |
Cash & Cash Equivalents | 0.7% |
Total | 100.0% |
Top Ten Holdings
Company | Percent of Net Assets |
Victory Capital Holdings, Inc., Class A | 4.4% |
Brightsphere Investment Group, Inc. | 3.9% |
Neurocrine Biosciences, Inc. | 3.6% |
Graphic Packaging Holding Co. | 3.2% |
Voya Financial, Inc. | 2.9% |
SI-BONE, Inc. | 2.8% |
Eastern Bankshares, Inc. | 2.7% |
Ligand Pharmaceuticals, Inc. | 2.7% |
Altus Group, Ltd. | 2.5% |
Healthcare Realty Trust, Inc., REIT | 2.5% |
Total | 31.2% |
Ten largest holdings do not include money market securities, certificates of deposit, commercial paper or cash and equivalents, if applicable.
Holdings are subject to change.
Sector Diversification
Sector | Percent of Net Assets |
Health Care | 21.8% |
Financials | 16.4% |
Information Technology | 16.0% |
Industrials | 15.5% |
Consumer Discretionary | 9.6% |
Real Estate | 7.0% |
Materials | 5.4% |
Consumer Staples | 4.7% |
Communication Services | 3.0% |
Other assets and liabilities (net) | 0.6% |
Total | 100.0% |
May include companies representing multiple industries within a single “Sector”.
December 31, 2022 |
Impax US Sustainable Economy Fund |
| | 
|
| | Portfolio Manager
Scott LaBreche |
| | |
| | 
|
| | Portfolio Manager
Christine Cappabianca |
How did the Impax US Sustainable Economy Fund (the Fund) perform for the period?
For the one-year period ended December 31, 2022, the Fund’s Investor Class, Class A, and Institutional Class shares had total returns of -18.25%, -18.24% and -18.01%, respectively, compared to -19.13% for the Russell 1000 Index and -17.99% for the Lipper Multi-Cap Core Funds Index.
What factors or portfolio holdings contributed to the Fund’s performance?
In calendar year 2022, the Fund outperformed the Russell 1000 Index. Although US Large Cap Stocks were down in 2022, the portfolio’s avoidance of stocks with low environmental, social, and governance (ESG) ratings, as determined by the Impax Systematic ESG Rating, was the key driver of outperformance for the reporting period.
The Fund is overweight to companies with favorable Impax Systematic ESG Ratings, relative to their sector and industry peers. Not owning companies with poor Systematic ESG scores, most notably Tesla and Meta, was additive to performance as those companies struggled in 2022.
The Fund’s underweight to Amazon, a company that also endured a challenging year, as well as its security selection within Healthcare and Insurance helped performance. MetLife (Insurance) and Bristol-Myers Squibb (Healthcare) were standout performers and contributed positively to performance over the reporting period.
What factors or portfolio holdings detracted from the Fund’s performance?
The portfolio’s underweight to industries that we consider higher risk, extractive sub-industries, as determined by the Impax Sustainability Lens1 was a large detractor to Fund performance. The Impax Sustainability Lens is a proprietary tool that helps the portfolio managers systematically overweight the portfolio toward sub-industries we identify as high opportunity in the context of the transition to a more sustainable economy, while removing exposure to sub-industries classified as low opportunity and high risk.
December 31, 2022 |
Impax US Sustainable Economy Fund, continued |
Additionally, the Fund’s lack of energy exposure, due to its fossil fuel-free profile, negatively impacted performance during the reporting period. The Energy sector performed well throughout the year and produced outsized returns, relative to other sectors. The Fund’s avoidance of traditional energy companies and subsequently, not owning large, diversified oil names, including ExxonMobil and Chevron, hurt performance.
Finally, while the portfolio’s overweight to companies with the highest ESG scores (ESG leaders), as determined by Impax Systematic ESG Rating, was a positive contributor to overall Fund performance, one of the portfolio’s ESG leaders, NVDIA, significantly underperformed during the reporting period. NVDIA, an industry leading semiconductor company that maintains a high ESG score as determined by the Systematic ESG Rating, was among the worst performers in the Russell 1000 Index.
1 | The portfolio integrates the Impax Sustainability Lens, a proprietary tool that helps the adviser systematically overweight the portfolio toward sub-industries we identify as high opportunity in the context of the transition to a more sustainable economy while removing exposure to sub-industries classified as low opportunity and high risk. |
Portfolio Highlights (Unaudited)
Since Inception Total Return—Historical Growth of $10,000

Returns—Year ended December 31, 2022
| | | | | Total
Return | Average Annual Return |
Share Class | Ticker
Symbol | | | 1 Year | 3 Years | 5 Years | 10 Years |
Investor Class1 | PXWGX | | | -18.25% | 6.41% | 7.91% | 10.86% |
Class A1,2,4 | PXGAX | NAV3 | | -18.24% | 6.40% | 7.90% | 10.86% |
| | | POP | | -22.75% | 4.42% | 6.69% | 10.23% |
Institutional Class1 | PWGIX | | | -18.01% | 6.67% | 8.18% | 11.14% |
Russell 1000 Index | | | | -19.13% | 7.35% | 9.13% | 12.37% |
Lipper Multi-Cap Core Funds Index | | | -17.99% | 7.01% | 7.89% | 11.02% |
See ‘Glossary of Terms’ for descriptions of benchmarks.
These figures represent past performance, which is no guarantee of future results. Investment return and principal value of an investment will fluctuate so that an investor’s shares, when redeemed, may be worth more or less than their original cost. Current performance may be lower or higher than the performance data quoted. Total returns for periods of less than one year have not been annualized. For most recent month-end performance data, please visit www.impaxam.com or call 800.767.1729.
1 | The Fund’s investment adviser assumed certain expenses or waived a portion of its fee during all periods shown; total returns would have been lower had these expenses not been assumed. Total return figures include reinvested dividends and capital gains distributions, and changes in principal value, and do not reflect the taxes that a shareholder might pay on Fund distributions or on the redemption of Fund shares. |
2 | A 1.00% CDSC (contingent deferred sales charge) may be charged on any shares sold within 18 months of purchase over $1 million. POP (public offering price) reflects the maximum sales load for the Fund’s Class A Shares of 5.50%. NAV performance does not reflect the deduction of the sales load of the CDSC, which if reflected would reduce the performance shown. |
4 | Inception of Class A shares is May 1, 2013. The performance information shown for Class A shares includes the performance of Investor Class shares, adjusted to reflect the sales charge applicable to Class A shares, for the period prior to Class A inception. |
Asset Allocation | Percent of Investments |
Foreign Stocks | 1.1% |
U.S. Stocks | 97.3% |
Cash & Cash Equivalents | 1.6% |
Total | 100.0% |
December 31, 2022 |
Impax US Sustainable Economy Fund, continued |
Portfolio Highlights (Unaudited), continued |
Top Ten Holdings
Company | Percent of Net Assets |
Apple, Inc. | 5.3% |
Microsoft Corp. | 4.5% |
Alphabet, Inc., Class A | 2.4% |
Johnson & Johnson | 2.3% |
NVIDIA Corp. | 2.0% |
Eli Lilly & Co. | 1.8% |
Texas Instruments, Inc. | 1.8% |
Home Depot, Inc., The | 1.8% |
Bristol-Myers Squibb Co. | 1.7% |
MetLife, Inc. | 1.7% |
Total | 25.3% |
Ten largest holdings do not include money market securities, certificates of deposit, commercial paper or cash and equivalents, if applicable.
Holdings are subject to change.
Sector Diversification
Sector | Percent of Net Assets |
Information Technology | 29.0% |
Health Care | 17.1% |
Industrials | 12.4% |
Consumer Discretionary | 7.2% |
Financials | 7.0% |
Communication Services | 6.2% |
Consumer Staples | 6.2% |
Real Estate | 6.1% |
Materials | 5.5% |
Utilities | 1.7% |
Other assets and liabilities (net) | 1.6% |
Total | 100.0% |
May include companies representing multiple industries within a single “Sector”.
December 31, 2022 |
Impax Global Sustainable Infrastructure Fund |
| | 
|
| | Portfolio Manager
Scott LaBreche |
| | |
| | 
|
| | Portfolio Manager
Christine Cappabianca |
How did the Impax Global Sustainable Infrastructure Fund (the Fund) perform for the period?
For the one-year period ended December 31, 2022, the Fund’s Institutional Class and Investor Class shares had total returns of -13.25% and -13.44%, respectively, compared to -9.04% for the FTSE Global Infrastructure Opportunities Index (FTSE IO) and -18.36% for the MSCI ACWI, -0.99% for the S&P Global Infrastructure Index and -6.80% for the Lipper Global Infrastructure Funds Index.
Effective November 15, 2022, the FTSE IO, a measure of traditional infrastructure performance, replaced the S&P Global Infrastructure Index as the primary benchmark for the Fund. As part of this change, the MSCI ACWI became the Fund’s secondary benchmark for a broad global market comparison.
What factors or portfolio holdings contributed to the Fund’s performance?
2022 was an exceptionally challenging year for global equities as higher inflation, rising interest rates and slower economic growth negatively impacted investor sentiment. The Fund’s underperformance relative to the FTSE IO was largely due to its avoidance of companies that fall outside of the sustainable infrastructure universe. Companies that fall outside of the Fund’s investment universe are generally more resource and carbon intensive.
The portfolio follows a sustainable investing approach, investing in companies that are representative of infrastructure essential for the transition to a more sustainable economy, while retaining the broad characteristics that investors expect from an infrastructure portfolio, high yields and defensive characteristics.
Impax classifies sustainable infrastructure into two broad categories:
| | 1. | Resource Infrastructure includes New Energy, Water, Waste & Resource Efficiency, and Food and Agriculture sub sectors. |
| | 2. | Social and Economic Infrastructure which includes Communications & Data, Buildings & Facilities, Transportation, Healthcare, Education, and Finance sub sectors. |
December 31, 2022 |
Impax Global Sustainable Infrastructure Fund, continued |
Although the Fund underperformed its primary benchmark during the reporting period, the Fund’s underperformance was mitigated by a few factors. Within Resource Infrastructure, Resource Efficiency & Waste Management, companies were positive contributors to the Fund’s relative performance. Ashtead and United Rentals, equipment rental companies, were standout performers during the year. Additionally, outperformance from Brambles, a provider of pallet and plastic container pooling services, helped performance.
Within Social and Economic Infrastructure, strong performance from Cigna benefitted the portfolio. Additionally, outperformance from railroad holdings, Union Pacific and MTR, was a boost to performance.
What factors or portfolio holdings detracted from the Fund’s performance?
The primary detractor to performance relative to the FTSE IO was the lack of exposure to companies that fall outside of the sustainable infrastructure universe. The portfolio’s avoidance of sectors that outperformed the broader market, such as traditional utility and steel companies, negatively impacted performance.
Within Resource Infrastructure, the portfolio suffered from its allocation to Water holdings, as water utility holdings (Veolia and Pennon) as well as water distribution holdings (Advanced Drainage) sold off in 2022.
Within the Social and Economic Infrastructure category, Communications & Data exposure detracted during the period, weighed down by Communication Services. Efficient IT exposure also detracted, given underperformance from Taiwan Semiconductor.
Portfolio Highlights (Unaudited)
Since Inception Total Return—Historical Growth of $10,000

Returns—Year ended December 31, 2022
| | | | Total
Return | Average Annual Return |
Share Class | Ticker
Symbol | | 1 Year | 3 Year | 5 Year | Since
Inception1 |
Institutional Class2 | PXDIX | | -13.25% | 4.29% | 6.59% | 8.41% |
Investor Class2 | PAXDX | | -13.44% | 4.04% | 6.30% | 8.14% |
FTSE Global Infrastructure Opportunities | | | -9.04% | 2.59% | 3.65% | 5.71% |
S&P Global Infrastructure Index | | | -0.99% | 0.93% | 2.99% | 5.54% |
Lipper Global Infrastructure Funds Index | | -6.80% | 1.55% | 4.02% | 6.73% |
MSCI ACWI (Net) Index | | -18.36% | 3.99% | 5.21% | 8.06% |
See ‘Glossary of Terms’ for descriptions of benchmarks.
These figures represent past performance, which is no guarantee of future results. Investment return and principal value of an investment will fluctuate so that an investor’s shares, when redeemed, may be worth more or less than their original cost. Current performance may be lower or higher than the performance data quoted. Total returns for periods of less than one year have not been annualized. For most recent month-end performance data, please visit www.impaxam.com or call 800.767.1729.
1 | The Fund’s inception date is December 16, 2016. |
2 | The Fund’s investment adviser waived a portion of its fee during all periods shown; total returns would have been lower had these waivers not taken place. Total return figures include reinvested dividends and capital gains distributions, and changes in principal value, and do not reflect the taxes that a shareholder might pay on Fund distributions or on the redemption of Fund shares. |
December 31, 2022 |
Impax Global Sustainable Infrastructure Fund, continued |
Portfolio Highlights (Unaudited), continued |
Asset Allocation | Percent of Investments |
Foreign Stocks | 55.4% |
U.S. Stocks | 43.4% |
Cash & Cash Equivalents | 1.2% |
Total | 100.0% |
Top Ten Holdings
Company | Percent of Net Assets |
Schneider Electric SE | 2.4% |
Iberdrola SA | 2.3% |
Waste Management, Inc. | 2.1% |
Enel SpA | 1.8% |
Canadian Pacific Railway, Ltd. | 1.7% |
American Water Works Co., Inc. | 1.5% |
Edison International | 1.4% |
SSE PLC | 1.4% |
Taiwan Semiconductor Manufacturing Co., Ltd., ADR | 1.4% |
AT&T, Inc. | 1.3% |
Total | 17.3% |
Ten largest holdings do not include money market securities, certificates of deposit, commercial paper or cash and equivalents, if applicable.
Holdings are subject to change.
Sector Diversification
Sector | Percent of Net Assets |
Industrials | 30.0% |
Utilities | 28.1% |
Communication Services | 14.7% |
Information Technology | 10.0% |
Health Care | 8.2% |
Real Estate | 5.0% |
Consumer Staples | 1.6% |
Materials | 0.5% |
Consumer Discretionary | 0.4% |
Other assets and liabilities (net) | 1.5% |
Total | 100.0% |
May include companies representing multiple industries within a single “Sector”.
December 31, 2022 |
Impax Global Opportunities Fund |
| | 
|
| | Portfolio Manager
Kirsteen Morrison |
| | |
| | 
|
| | Portfolio Manager
David Winborne Sub-Adviser
Impax Asset Management Ltd. |
How did the Impax Global Opportunities Fund (the Fund) perform for the period?
For the one-year period ended December 31, 2022, the Fund’s Institutional Class and Investor Class shares had total returns of -18.49% and -18.66%, respectively, compared to -18.36% for the MSCI All-Country World (Net) Index (“MSCI ACWI”) and -28.63% for the Lipper Global Multi-Cap Growth Funds Index.
What factors or portfolio holdings contributed to the Fund’s performance?
For the year ended December 31, 2022, the Fund was down in absolute terms, although the Fund’s negative performance was mitigated by a few factors. As the year progressed and investors focused more on the increasing risk of recession, investor appetite for companies with more predictable earnings and higher quality characteristics increased. We believe this helped the Fund to gain back some relative performance.
The Fund benefited from strong stock selection in Information Technology and Communications Services, where the portfolio’s lack of exposure to mega-cap technology companies helped on a relative basis. The sector allocation effect was positive overall, as the benefits from being underweight to Communication Services and Consumer Discretionary offset the drag from the lack of exposure to Energy.
Stocks supported by good earnings and those with good pricing power or better inflation resilience have tended to perform better over the year. Vertex Pharmaceuticals (Biotechnology, US), a drug development company, has produced a series of strong financial results and benefitted from an improving outlook for pipeline assets, thus allowing for upgrades to earnings estimates. A better competitive outlook for its key cystic fibrosis franchise has also underpinned stock performance. AIA (Life & Health Insurance, Hong Kong) has benefited from the relaxation of Covid-19 related mobility restrictions in China as the potential re-opening of the HK-China border allows for a more positive outlook on the value of new business growth. While the stock has experienced some volatility, the company has produced good results relative to peers and management remains focused on key targets such as mainland China expansion. The company also announced a well-received share buy-back earlier in the year, demonstrating, in our view, the firm’s resilience and balance sheet strength.
December 31, 2022 |
Impax Global Opportunities Fund, continued |
Finally, Hannover Reuck (Reinsurance, Germany) has benefitted from better sentiment towards the reinsurance market as investors anticipated a shift in the balance of power between primary insurers and reinsurers would lead to a strong pricing environment going into next year. This stronger pricing was realised at the start of 2023, and we believe this positions the company for strong earnings in years to come.
What factors or portfolio holdings detracted from the Fund’s performance?
Global stock markets have fallen as investors adjusted to the end of quantitative easing, persistent inflation, heightened geo-political tensions, and a slower outlook for global growth. Market volatility has been pronounced as investors weigh slower economic momentum against central bank actions to contain inflation.
On a relative basis the Fund slightly underperformed the MSCI All Country World Index. Relative performance was negatively impacted at the start of the year by the steepening yield curve and upward move in oil and commodity prices which led to a dramatic rotation out of quality and growth and into more value-oriented sectors of the market such as Energy. The portfolio has no exposure to Energy, and this has been a significant detractor to the Fund’s performance on a relative basis over the year.
Stock selection has been negative, particularly within the Materials and Health Care sectors where there has been a reversal of last year’s stronger performance. Health Care companies have been impacted by a combination of factors, including worsening sentiment towards indebted companies, concerns of a slowdown in biotech funding and valuation compression.
Market rotation away from Covid-19 beneficiaries and richly valued growth and quality names were among the biggest headwinds to performance. Evotec (Life Sciences Tools & Services, Germany) suffered from the market rotation away from highly valued growth orientated stocks and news that milestone payments would be less than expected following the decision by partner Bayer AG to return the rights to one of Evotec’s development assets. Recent results, which were below expectations, have left the market nervous about Evotec’s ability to meet unchanged full year estimates. Koninklijke DSM (Speciality Chemicals, Netherlands) has been hit by worsening sentiment towards the European chemicals sector, despite the company’s very high nutrition ingredients franchise. More recently the company sold off ahead of an earnings disappointment driven by higher raw material prices. The investment team remains positive on the stock as we believe Koninklijke DSM has a strong balance sheet and the proposed merger with Firmenich will move the company forward in its transformation towards a pure consumer and animal nutrition ingredients company. Aptiv (Auto Parts & Equipment, US) has faced headwinds during the year due to
continued supply chain issues and higher interest rates leading to ongoing reductions in market estimates for global automotive growth. However, the company recently announced quarterly earnings highlighting continued growth in vehicle content from the transition towards electric cars, while supply chain headwinds that have inhibited auto production this year are beginning to abate. The investment team regards the company as a key beneficiary of electrification and automation of vehicles.
Portfolio Highlights (Unaudited)
Since Inception Total Return—Historical Growth of $10,000

Returns—Year ended December 31, 2022
| | | | Total
Return | Average Annual Return |
Share Class | Ticker
Symbol | | 1 Year | 3 Year | Since
Inception1 |
Institutional Class2 | PXGOX | | -18.49% | 6.08% | 8.84% |
Investor Class2 | PAXGX | | -18.66% | 5.83% | 8.63% |
MSCI ACWI (Net) Index | | | -18.36% | 4.00% | 6.09% |
Lipper Global Multi-Cap Growth Funds Index | | -28.63% | 3.20% | 5.39% |
See ‘Glossary of Terms’ for descriptions of benchmarks.
These figures represent past performance, which is no guarantee of future results. Investment return and principal value of an investment will fluctuate so that an investor’s shares, when redeemed, may be worth more or less than their original cost. Current performance may be lower or higher than the performance data quoted. Total returns for periods of less than one year have not been annualized. For most recent month-end performance data, please visit www.impaxam.com or call 800.767.1729.
1 | The Fund’s inception date is June 27, 2018. |
December 31, 2022 |
Impax Global Opportunities Fund, continued |
Portfolio Highlights (Unaudited), continued |
2 | The Fund’s investment adviser assumed certain expenses during each period shown; total returns would have been lower had these expenses not been assumed. Total return figures include reinvested dividends and capital gains distributions, and changes in principal value, and do not reflect the taxes that a shareholder might pay on Fund distributions or on the redemption of Fund shares. |
Asset Allocation | Percent of Investments |
Foreign Stocks | 47.4% |
U.S. Stocks | 52.6% |
Total | 100.0% |
Top Ten Holdings
Company | Percent of Net Assets |
Microsoft Corp. | 4.3% |
Linde PLC | 3.9% |
MasterCard, Inc., Class A | 3.9% |
Thermo Fisher Scientific, Inc. | 3.5% |
IQVIA Holdings, Inc. | 3.5% |
Alcon, Inc. | 3.5% |
Boston Scientific Corp. | 3.5% |
Hannover Rueck SE | 3.4% |
HDFC Bank, Ltd., ADR | 3.3% |
Cintas Corp. | 3.2% |
Total | 36.0% |
Ten largest holdings do not include money market securities, certificates of deposit, commercial paper or cash and equivalents, if applicable.
Holdings are subject to change.
Sector Diversification
Sector | Percent of Net Assets |
Health Care | 25.4% |
Information Technology | 24.2% |
Industrials | 14.2% |
Financials | 14.1% |
Materials | 8.9% |
Consumer Staples | 4.3% |
Communication Services | 3.0% |
Real Estate | 2.2% |
Consumer Discretionary | 2.0% |
Other assets and liabilities (net) | 1.7% |
Total | 100.0% |
May include companies representing multiple industries within a single “Sector”.
December 31, 2022 |
Impax Global Environmental Markets Fund |
| | 
|
| | Portfolio Manager
Hubert Aarts |
| | |
| | 
|
| | Portfolio Manager
Siddharth Jha |
| | |
| | 
|
| | Portfolio Manager
David Winborne Sub-Adviser
Impax Asset Management Ltd. |
How did the Impax Global Environmental Markets Fund (the Fund) perform for the period?
For the one-year period ended December 31, 2022, the Investor Class, Class A, and Institutional Class of the Fund had total returns of -22.62%, -22.58%, and -22.39%, respectively, versus -18.36% for the MSCI All-Country World (Net) Index (“MSCI ACWI”) and -24.10% for the FTSE Environmental Opportunities Index Series (“FTSE EOAS”).
What factors or portfolio holdings contributed to the Fund’s performance?
The Fund underperformed during the reporting period, as concerns over inflation, rising interest rates and slowing economic growth negatively impacted performance. Although the Fund underperformed, the following companies were notable contributors and helped to offset drags to performance.
Hubbell (Smart & Efficient Grids, US) performed well over the balance of 2022. The company provided strong operational results, with their utility segment seeing a pick-up in demand, reflective of ongoing grid modernization initiatives and trends toward renewable energy. The company has also benefitted from industrial and residential end market demand. Elevated crop prices and low dealer inventories has supported persistently healthy demand for Deere (Technology & Logistics, US). Deere continued to overcome supply chain challenges and higher production costs with strong top line growth and pricing power to deliver strong financial results in 2022. This was underscored in the Q4 earnings release with EPS and revenue coming in above expectations. Fiscal year 2023 guidance was raised with expectations for another year of supportive farm fundamentals with increased pricing power and margin expansion.
United Rentals (Resource Circularity & Efficiency, US) delivered strong results operationally throughout 2022, which demonstrated the resilience of equipment rental demand in the US, driven by a range of factors including rising appreciation
December 31, 2022 |
Impax Global Environmental Markets Fund, continued |
of the benefits of rental vs. ownership, continued appetite for equipment to automate processes amid labor shortages, and the commencement of substantial infrastructure projects as part of the Inflation Reduction Act in the US.
What factors or portfolio holdings detracted from the Fund’s performance?
The portfolio’s bias to high quality growth exposure, and the market rotation away from quality and growth into value was a headwind during the year. Digital Infrastructure exposure was a leading detractor, as supply chain constraints, Covid-19 lockdowns in China, and weakening end market demand concerns led to underperformance for semiconductor holdings. Underperformance from holdings within Water Infrastructure & Technologies and Sustainable Food & Agriculture was a headwind to performance as well.
Royal DSM (Sustainable Agriculture, Netherlands) has been impacted by worsening sentiment towards the European chemicals sector, despite the company’s very high nutrition ingredients franchise. More recently the company sold off ahead of an earnings disappointment driven by higher raw material prices. The investment team remains positive on the stock as the company has a strong balance sheet and the proposed merger with Firmenich will move the company forward in its transformation towards a pure consumer and animal nutrition ingredients company.
MediaTek (Efficient IT, Taiwan) underperformed as the semiconductor industry was out of favor for much of 2022. MediaTek, along with other companies in the sector, suffered from production bottlenecks, revenue shortfalls associated with Covid-19 lockdowns in China, fears of slowing demand, and regulatory risk.
The share price of Ansys (Efficient IT, US) sold off in 2022 as the broader market rotation from growth and quality into value, as well as rising rate and recession concerns, created weakness for the software sector. Despite the underperformance, Ansys is trading at an attractive valuation and we believe it has a strong outlook for demand growth. The company’s industrial technology software provides cost, time, energy, and resource savings, tapping into demand from autonomous vehicle, electrification, industrial Internet of things (IoT), and 5G growth.
Portfolio Highlights (Unaudited)
Since Inception Total Return—Historical Growth of $10,000

Returns—Year ended December 31, 2022
| | | | Total
Return | Average Annual Return |
Share Class | Ticker
Symbol | | 1 Year | 3 Years | 5 Years | 10 Years |
Investor Class1 | PGRNX | | -22.62% | 5.86% | 5.36% | 8.67% |
Class A1,2,4 | PXEAX | NAV3 | -22.58% | 5.85% | 5.35% | 8.67% |
| | | POP | -26.83% | 3.87% | 4.16% | 8.06% |
Institutional Class1 | PGINX | | -22.39% | 6.13% | 5.62% | 8.95% |
MSCI ACWI (Net) Index | | -18.36% | 4.00% | 5.23% | 7.98% |
FTSE Environmental Opportunities Index Series | | -24.10% | 8.54% | 8.01% | 10.79% |
See ‘Glossary of Terms’ for descriptions of benchmarks.
These figures represent past performance, which is no guarantee of future results. Investment return and principal value of an investment will fluctuate so that an investor’s shares, when redeemed, may be worth more or less than their original cost. Current performance may be lower or higher than the performance data quoted. Total returns for periods of less than one year have not been annualized. For most recent month-end performance data, please visit www.impaxam.com or call 800.767.1729.
1 | The Fund’s investment adviser assumed certain expenses during the 5-year and 10-year periods; total returns would have been lower had these expenses not been assumed. Total return figures include reinvested dividends and capital gains distributions, and changes in principal value, and do not reflect the taxes that a shareholder might pay on Fund distributions or on the redemption of Fund shares. |
2 | A 1.00% CDSC (contingent deferred sales charge) may be charged on any shares sold within 18 months of purchase over $1 million. POP (public offering price) reflects the maximum sales load for the Fund’s Class A Shares of 5.50%. NAV performance does not reflect the deduction of the sales load of the CDSC, which if reflected would reduce the performance shown. |
December 31, 2022 |
Impax Global Environmental Markets Fund, continued |
Portfolio Highlights (Unaudited), continued |
4 | Inception of Class A shares is May 1, 2013. The performance information shown for Class A shares includes the performance of Investor Class shares, adjusted to reflect the sales charge applicable to Class A shares, for the period prior to Class A inception. |
Asset Allocation | Percent of Investments |
Foreign Stocks | 38.5% |
U.S. Stocks | 60.5% |
Cash & Cash Equivalents | 1.0% |
Total | 100.0% |
Top Ten Holdings
Company | Percent of Net Assets |
Linde PLC | 4.1% |
Waste Management, Inc. | 3.7% |
Agilent Technologies, Inc. | 3.6% |
Air Liquide SA | 3.2% |
Schneider Electric SE | 3.0% |
Republic Services, Inc. | 3.0% |
GEA Group AG | 2.9% |
ANSYS, Inc. | 2.7% |
Koninklijke DSM NV | 2.7% |
Veolia Environnement SA | 2.7% |
Total | 31.6% |
Ten largest holdings do not include money market securities, certificates of deposit, commercial paper or cash and equivalents, if applicable.
Holdings are subject to change.
Geographical Diversification
Country | Percent of Net Assets |
United States | 60.5% |
France | 11.3% |
Germany | 5.0% |
United Kingdom | 4.9% |
Netherlands | 4.3% |
Denmark | 4.2% |
Japan | 3.8% |
Taiwan | 3.3% |
Switzerland | 1.6% |
Other assets and liabilities (net) | 1.1% |
Total | 100.0% |
Sector Diversification
Sector | Sub Sector | Percent of Net Assets |
New Energy | | 21.4% |
| | Renewable Energy Developers & IPPs | 2.3% | |
| | Wind Power Generation Equipment | 1.9% | |
| | Smart & Efficient Grids | 5.0% | |
| | Industrial Energy Efficiency | 10.2% | |
| | Buildings Energy Efficiency | 2.0% | |
| | | | |
Clean and Efficient Transport | | 4.7% |
| | E-Bikes & Bicycles | 0.9% | |
| | Advanced Road Vehicles & Devices | 3.8% | |
| | | | |
Sustainable Food | | 18.1% |
| | Technology & Logistics | 6.9% | |
| | Food Safety & Packaging | 6.9% | |
| | Sustainable Agriculture | 4.3% | |
Water | | 17.6% |
| | Water Distribution & Infrastructure | 5.8% | |
| | Water Treatment | 6.6% | |
| | Water Utilities | 5.2% | |
Circular Economy | | 9.9% |
| | General Waste Management | 6.7% | |
| | Recycled, Recyclable Products & Biomaterials | 1.4% | |
| | Resource Circularity & Efficiency | 1.8% | |
Smart Environment | | 27.2% |
| | Environmental Testing & Monitoring | 7.0% | |
| | Efficient IT | 15.8% | |
| | Cloud Computing | 4.4% | |
Other assets and liabilities (net) | 1.1% | 1.1% |
Total | 100.0% | 100.0% |
May include companies representing multiple industries within a single “Sector”.
December 31, 2022 |
Impax Ellevate Global Women’s Leadership Fund |
| | 
|
| | Portfolio Manager
Scott LaBreche |
| | |
| | 
|
| | Portfolio Manager
Christine Cappabianca |
How did the Impax Ellevate Global Women’s Leadership Fund (the Fund) perform for the period?
For the one-year period ended December 31, 2022, the Investor and Institutional Class had total returns of –19.98% and –19.76%, respectively, compared to –20.57% for the Impax Global Women’s Leadership Index (Women’s Index), -18.14% for the MSCI World (Net) Index (World Index) and -17.88% for the Lipper Global Multi-Cap Core Funds Index.
What factors or portfolio holdings contributed to the Fund’s performance?
The Fund underperformed the World Index in calendar year 2022. Global developed market stocks endured a challenging year performance wise, and the Fund’s sector allocation was a headwind to performance, driven by the portfolio’s lack of exposure to the Energy sector.
Although the Fund underperformed during the reporting period, the Fund’s underperformance was mitigated by a few factors. The portfolio’s high conviction overweight to the highest rated gender leadership companies (gender leaders), as determined by the Impax Gender Score, was additive to performance. Gender leadership companies outperformed the World Index. The lowest rated gender leadership companies (gender laggards), as determined by the Impax Gender Score, underperformed the World Index, and the portfolio’s avoidance of those companies also contributed positively to performance. Additionally, not owing Tesla, a company in the bottom 25% of the MSCI World Index from a gender diversity perspective, was down significantly during the reporting period and the portfolio’s avoidance of this company was a boost to performance. Overweight positions in gender leadership companies, as determined by the Impax Gender Score, like, Ulta Beauty and Omnicom Group, also contributed positively to Fund performance.
What factors or portfolio holdings detracted from the Fund’s performance?
The Fund’s lack of energy exposure, due to its fossil fuel-free profile, was a key detractor to performance during the reporting period. The Energy sector had its best year for performance in the last three decades and produced outsized returns relative to other sectors. The Fund’s avoidance of traditional energy companies and subsequently, not owning ExxonMobil, which was one of the top performing stocks
in the World Index last year, hurt performance. While the portfolio’s overweight to gender leadership companies was additive to performance overall during the reporting period, two of the portfolio’s gender leaders, Koninklijke DSM N.V. and Amazon, detracted from performance. Both companies underperformed following a long period of outperformance for growth stocks.
Portfolio Highlights (Unaudited)
Since Inception Total Return—Historical Growth of $10,000

Returns—Year ended December 31, 2022
| | | | Total
Return | Average Annual Return |
Share Class | Ticker
Symbol | | 1 Year | 3 Years | 5 Years | 10 Years |
Investor Class1 | PXWEX | | -19.98% | 2.18% | 4.46% | 7.95% |
Institutional Class1 | PXWIX | | -19.76% | 2.43% | 4.73% | 8.22% |
Impax Global Women’s Leadership (Net) Index* | | -20.57% | 2.49% | 5.04% | |
MSCI World (Net) Index | | -18.14% | 4.94% | 6.14% | 8.85% |
Lipper Global Multi-Cap Core Funds Index | | -17.88% | 3.78% | 4.38% | 7.72% |
See ‘Glossary of Terms’ for descriptions of benchmarks.
These figures represent past performance, which is no guarantee of future results. Investment return and principal value of an investment will fluctuate so that an investor’s shares, when redeemed, may be worth more or less than their original cost. Current performance may be lower or higher than the performance data quoted. Total returns for periods of less than one year have not been annualized. For most recent month-end performance data, please visit www.impaxam.com or call 800.767.1729.
* | Inception date of Women’s Index is February 28, 2014. |
1 | On June 4, 2014 the Pax World Global Women’s Equality Fund merged into the Impax Ellevate Global Women’s Leadership Fund (the Fund), pursuant to an Agreement and Plan of Reorganization dated March 4, 2014 (the “Reorganization”). Because the Fund had no investment operations prior to the closing of the |
December 31, 2022 |
Impax Ellevate Global Women’s Leadership Fund, continued |
Portfolio Highlights (Unaudited), continued |
Reorganization, Pax World Global Women’s Equality Fund (the “Predecessor Fund”) is treated as the survivor of the Reorganization for account and performance reporting purposes. Accordingly, all performance and other information shown for the Fund for periods prior to June 4, 2014 is that of the Predecessor Fund. Total return figures include reinvested dividends and capital gains distributions, and changes in principal value, and do not reflect the taxes that a shareholder might pay on Fund distributions or on the redemption of Fund shares. |
Asset Allocation | Percent of Investments |
Foreign Stocks | 33.3% |
U.S. Stocks | 65.9% |
Cash & Cash Equivalents | 0.8% |
Total | 100.0% |
Top Ten Holdings
Company | Percent of Net Assets |
Apple, Inc. | 3.9% |
Microsoft Corp. | 3.4% |
Amazon.com, Inc. | 2.5% |
Coca-Cola Co., The | 2.0% |
Accenture PLC, Class A | 1.8% |
Elevance Health, Inc. | 1.8% |
Citigroup, Inc. | 1.7% |
Bristol-Myers Squibb Co. | 1.7% |
Diageo PLC | 1.7% |
Schneider Electric SE | 1.6% |
Total | 22.1% |
Ten largest holdings do not include money market securities, certificates of deposit, commercial paper or cash and equivalents, if applicable.
Holdings are subject to change.
Sector Diversification
Sector | Percent of Net Assets |
Information Technology | 18.4% |
Financials | 18.3% |
Health Care | 16.3% |
Consumer Discretionary | 12.9% |
Consumer Staples | 11.7% |
Materials | 5.8% |
Communication Services | 5.7% |
Utilities | 5.1% |
Industrials | 4.3% |
Real Estate | 0.8% |
Other assets and liabilities (net) | 0.7% |
Total | 100.0% |
May include companies representing multiple industries within a single “Sector”.
Geographical Diversification
Country | Percent of Net Assets |
United States | 65.9% |
United Kingdom | 8.0% |
France | 5.5% |
Norway | 4.7% |
Canada | 3.0% |
Australia | 2.7% |
Spain | 1.9% |
Netherlands | 1.9% |
Germany | 1.4% |
Switzerland | 1.2% |
Denmark | 1.0% |
Sweden | 0.8% |
Italy | 0.4% |
Hong Kong | 0.2% |
Finland | 0.1% |
Singapore | 0.1% |
New Zealand | 0.1% |
Israel | 0.1% |
Belgium | 0.1% |
Portugal | 0.1% |
Japan | 0.1% |
Other Assets and liabilities (net) | 0.7% |
Total | 100.0% |
December 31, 2022 |
Impax International Sustainable Economy Fund |
| | 
|
| | Portfolio Manager
Scott LaBreche |
| | |
| | 
|
| | Portfolio Manager
Christine Cappabianca |
How did the Impax International Sustainable Economy Fund (the Fund) perform for the period?
For the one-year period ended December 31, 2022, the Institutional Class and Investor Class had total returns of -17.80% and -18.00%, respectively, compared to -14.45% for the MSCI EAFE (Net) Index (EAFE Index), -16.99% for the MSCI EAFE ESG Leaders (Net) Index and -13.45% for the Lipper International Large-Cap Core Funds Index.
What factors or portfolio holdings contributed to the Fund’s performance?
The Fund underperformed the EAFE Index in calendar year 2022. International developed market stocks endured a challenging year performance wise, and the Fund’s sector allocation was a headwind to performance, primarily driven by the portfolio’s exposure to sub-industries and companies rated favorably by the Impax Sustainability Lens1, as well as the outperformance of several sub-industries we consider to be high risk and generally avoid investing in.
Although the Fund underperformed during the reporting period, the Fund’s underperformance was mitigated by a few factors. During the reporting period, the portfolio’s overweight towards higher opportunity sub-industries as identified by Impax Sustainability Lens, like Pharmaceuticals, was the largest contributor to performance. Within Pharmaceuticals, performance was led by AstraZeneca and Novo Nordisk. Insurance and reinsurance sub-industries also performed well, with Dai-ichi Life and Swiss Re significantly outperforming the EAFE Index during the reporting period.
What factors or portfolio holdings detracted from the Fund’s performance?
The portfolio’s underweight to sub-industries that we consider higher risk as determined by the Impax Sustainability Lens, including extractive sub-industries, was a large detractor to Fund performance.
Additionally, the Fund’s lack of energy exposure, due to its fossil fuel-free profile, negatively impacted performance during the reporting period. The Energy sector performed well throughout the year and produced outsized returns relative to other sectors. The Fund’s avoidance of traditional energy companies including Shell, Total, and BP, hurt performance.
Finally, while the portfolio’s overweight to companies with the highest ESG scores (ESG leaders), as determined by MSCI ESG Quality Score, was a positive contributor to overall Fund performance, one of the portfolio’s ESG leaders, ASML Holding, significantly underperformed during the reporting period. ASML Holding, a semiconductor equipment company that maintains a high ESG score as determined by MSCI ESG Quality Score, was among the worst performers in the EAFE Index, and the portfolio’s overweight to ASML was a drag on performance.
1 | The portfolio integrates the Impax Sustainability Lens, a proprietary tool that helps the adviser systematically overweight the portfolio toward sub-industries we identify as high opportunity in the context of the transition to a more sustainable economy while removing exposure to sub-industries classified as low opportunity and high risk. |
Portfolio Highlights (Unaudited)
Since Inception Total Return—Historical Growth of $10,000
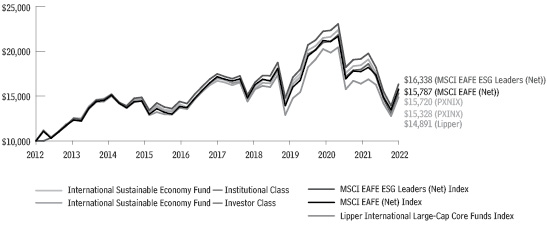
December 31, 2022 |
Impax International Sustainable Economy Fund, continued |
Portfolio Highlights (Unaudited), continued |
Returns—Year ended December 31, 2022
| | | | Total
Return | Average Annual Return |
Share Class | Ticker
Symbol | | 1 Year | 3 Years | 5 Years | 10 Years |
Institutional Class1 | PXNIX | | -17.80% | 0.42% | 1.64% | 4.63% |
Investor Class1,2 | PXINX | | -18.00% | 0.16% | 1.39% | 4.36% |
MSCI EAFE (Net) Index | | | -14.45% | 0.87% | 1.54% | 4.67% |
MSCI EAFE ESG Leaders (Net) Index | | | -16.99% | 0.67% | 1.82% | 5.03% |
Lipper International Large-Cap Core Funds Index | | -13.45% | 0.65% | 0.78% | 4.06% |
See ‘Glossary of Terms’ for descriptions of benchmarks.
These figures represent past performance, which is no guarantee of future results. Investment return and principal value of an investment will fluctuate so that an investor’s shares, when redeemed, may be worth more or less than their original cost. Current performance may be lower or higher than the performance data quoted. Total returns for periods of less than one year have not been annualized. For most recent month-end performance data, please visit www.impaxam.com or call 800.767.1729.
1 | Prior to March 31, 2021, Impax International Sustainable Economy Fund was known as Pax MSCI EAFE ESG Leaders Index Fund (the “EAFE ESG Index Fund”) and the strategy of the Fund differed from its current strategy. Accordingly, performance of the Fund for periods prior to March 31, 2021 may not be representative of the performance the Fund would have achieved had the Fund been following its current strategy. Effective March 31, 2014, the EAFE ESG Index Fund acquired the assets of Pax World International Fund, a series of Pax World Funds Series Trust I, and of Pax MSCI EAFE ESG Index ETF, a series of Pax World Funds Trust II, pursuant to an Agreement and Plan of Reorganization dated December 13, 2013 (the “Reorganizations”). Because the EAFE ESG Index Fund had no investment operations prior to the closing of the Reorganizations, and based on the similarity of the EAFE ESG Index Fund to Pax MSCI EAFE ESG Index ETF, Pax MSCI EAFE ESG Index ETF (the “Predecessor Fund”) is treated as the survivor of the Reorganizations for accounting and performance reporting purposes. Accordingly, all performance and other information shown for the International Sustainable Economy Fund for periods prior to March 31, 2014 is that of the Predecessor Fund. Total return figures include reinvested dividends and capital gains distributions, and changes in principal value, and do not reflect the taxes that a shareholder might pay on Fund distributions or on the redemption of Fund shares. |
2 | Inception of the Investor Class is March 31, 2014. The performance information shown for the Investor Class shares for periods prior to March 31, 2014 includes the performance of the Predecessor Fund. These returns have been adjusted to reflect the expenses allocable to Investor Class. |
Asset Allocation | Percent of Investments |
Foreign Stocks | 99.5% |
Cash & Cash Equivalents | 0.5% |
Total | 100.0% |
Top Ten Holdings
Company | Percent of Net Assets |
AstraZeneca PLC | 2.9% |
Novo Nordisk A/S, Class B | 2.8% |
Roche Holding AG | 2.8% |
ASML Holding NV | 2.8% |
AIA Group, Ltd. | 2.4% |
HSBC Holdings PLC | 2.3% |
SAP SE | 2.2% |
Allianz SE | 1.9% |
BNP Paribas SA | 1.8% |
ANZ Group Holdings, Ltd. | 1.7% |
Total | 23.6% |
Ten largest holdings do not include money market securities, certificates of deposit, commercial paper or cash and equivalents, if applicable.
Holdings are subject to change.
Sector Diversification
Sector | Percent of Net Assets |
Financials | 23.5% |
Industrials | 17.0% |
Health Care | 16.9% |
Information Technology | 10.1% |
Consumer Staples | 6.7% |
Materials | 6.5% |
Communication Services | 6.4% |
Consumer Discretionary | 6.2% |
Real Estate | 3.3% |
Utilities | 2.5% |
Other assets and liabilities (net) | 0.9% |
Total | 100.0% |
May include companies representing multiple industries within a single “Sector”.
December 31, 2022 |
Impax International Sustainable Economy Fund, continued |
Portfolio Highlights (Unaudited), continued |
Geographical Diversification
Country | Percent of Net Assets | |
Japan | 21.4% | |
United Kingdom | 15.0% | |
France | 11.8% | |
Switzerland | 10.0% | |
Germany | 8.2% | |
Australia | 7.7% | |
Netherlands | 4.1% | |
Hong Kong | 3.6% | |
Sweden | 3.2% | |
Denmark | 3.2% | |
Spain | 2.6% | |
Italy | 2.1% | |
Singapore | 1.5% | |
Finland | 1.0% | |
Belgium | 0.9% | |
Norway | 0.8% | |
Israel | 0.7% | |
Ireland | 0.6% | |
New Zealand | 0.2% | |
Chile | 0.2% | |
Austria | 0.2% | |
Poland | 0.1% | |
Portugal | 0.0% | * |
South Korea | 0.0% | * |
Other assets and liabilities (net) | 0.9% | |
Total | 100.0% | |
* Rounds to less than 0.05%
December 31, 2022 |
Impax Core Bond Fund |
| | 
|
| | Portfolio Manager
Tony Trzcinka,
CFA |
How did the Impax Core Bond Fund (the Fund) perform for the period?
For the one-year period ended December 31, 2022, the Institutional Class and Investor Class shares of the Fund had total returns of -12.94% and -13.16%, respectively, compared to -13.01% for the Bloomberg US Aggregate Bond Index and -13.39% for the Lipper Core Bond Funds Index.
What factors or portfolio holdings contributed to the Fund’s performance?
While the Fund’s performance was generally in-line with benchmark performance, the areas of underperformance were mitigated by a few factors, including positive performance across the Corporate Bonds, Government Related and Asset Backed Securities (ABS) asset classes.
Most government-related holdings are short dated, including the highly rated Supranationals. Shorter maturity issues from the European Investment Bank, World Bank Group and Inter-American Development Bank were impacted far less by rising rates and widening spreads than other securities during the period, which contributed positively to the Fund’s performance.
ABS holdings also benefited from a shorter duration. ABS was one of the few sectors that had a positive excess return during the reporting period. Like Supranationals, these securities were less impacted by rising rates on a relative basis.
Within Corporate Bonds, security selection drove outperformance, led by securities within the Information Technology and Financial sectors. Issues like Hewlett Packard Enterprise Company, Analog Devices, NetApp and Microsoft were standout performers within this asset class.
Lastly, despite a rise in energy prices during the year, the portfolio’s lack of exposure to the Energy sector was a positive contributor to performance. The energy sector has a higher duration than the benchmark and holds many long term (20-year, 30-year) bonds, which were hurt by rising interest rates. The higher duration coupled with bonds that mature out, negatively impacted the energy sector’s performance and resulted in a boost to performance for the Fund.
What factors or portfolio holdings detracted from the Fund’s performance?
Detractors included the Fund’s Treasury positioning, long-dated Investment Grade Corporates and a few High Yield securities.
December 31, 2022 |
Impax Core Bond Fund, continued |
Treasuries outperformed the benchmark because, unlike other credit sectors which experienced high rates, they did not experience spread widening. The Fund’s underweight positioning to this asset class detracted from performance.
Within Corporates, long-dated Investment Grade issuers and High Yield Issuers were among the largest detractors to performance. Specifically, long-dated holdings such as Starbucks 4.45% 2049, Ford 3.25% 2032 and Altice Holdings 10.5% 2027, were the largest detractors.
Portfolio Highlights (Unaudited)
Since Inception Total Return—Historical Growth of $10,000

Returns—Year ended December 31, 2022
| | | | Total
Return | Average Annual Return |
Share Class | Ticker
Symbol | | 1 Year | 3 Years | 5 Years | Since
Inception1 |
Institutional Class2 | PXBIX | | -12.94% | -2.74% | -0.12% | 0.51% |
Investor Class2 | PAXBX | | -13.16% | -2.98% | -0.36% | 0.26% |
Bloomberg US Aggregate Bond Index | | -13.01% | -2.71% | 0.02% | 0.78% |
Lipper Core Bond Funds Index | | -13.39% | -2.40% | 0.24% | 1.00% |
See ‘Glossary of Terms’ for descriptions of benchmarks.
These figures represent past performance, which is no guarantee of future results. Investment return and principal value of an investment will fluctuate so that an investor’s shares, when redeemed, may be worth more or less than their original cost. Current performance may be lower or higher than the performance data quoted. Total returns for periods of less than one year have not been annualized. For most recent month-end performance data, please visit www.impaxam.com or call 800.767.1729.
1 | The Fund’s inception date is December 16, 2016. |
2 | Total return figures include reinvested dividends and capital gains distributions, and changes in principal value, and do not reflect the taxes that a shareholder might pay on Fund distributions or on the redemption of Fund shares. |
Asset Allocation | Percent of Investments |
U.S. Bonds | 69.2% |
Foreign Bonds | 17.8% |
Supranational Bonds | 12.3% |
Cash & Cash Equivalents | 0.7% |
Total | 100.0% |
Top Ten Holdings
Company | Percent of Net Assets |
United States Treasury Note, 4.000%, 11/15/42 | 4.4% |
United States Treasury Note, 3.875%, 11/30/27 | 3.5% |
United States Treasury Note, 4.000%, 11/15/52 | 2.7% |
United States Treasury Note, 4.125%, 11/15/32 | 1.1% |
European Investment Bank, 3.250%, 01/29/24 | 1.0% |
International Bank for Reconstruction & Development, 1.625%, 01/15/25 | 0.9% |
European Investment Bank, 2.500%, 03/15/23 | 0.6% |
Kreditanstalt fuer Wiederaufbau, 2.625%, 02/28/24 | 0.6% |
United States Treasury Note (TIPS), 0.125%, 07/15/24 | 0.6% |
United States Treasury Note (TIPS), 0.375%, 07/15/27 | 0.6% |
Total | 16.0% |
Ten largest holdings do not include money market securities, certificates of deposit, commercial paper or cash and equivalents, if applicable.
Holdings are subject to change.
Fixed Income Sector Diversification
Sector | Percent of Net Assets |
Corporate Bonds | 37.1% |
Mortgage-Backed Bonds | 25.1% |
Treasury Bonds | 14.9% |
Supranational Bonds | 11.4% |
Asset-Backed Securities | 6.2% |
Municipal Bonds | 2.1% |
Agency/Gov’t Related Bonds | 1.9% |
Community Investment Notes | 0.1% |
Other assets and liabilities (net) | 1.2% |
Total | 100.0% |
December 31, 2022 |
Impax Core Bond Fund, continued |
Portfolio Highlights (Unaudited), continued |
Credit Quality*
Bond Rating | Percent of Bonds | |
U.S. Government | 39.5% | |
AAA | 18.1% | |
AA+ | 1.7% | |
AA | 1.9% | |
AA- | 2.4% | |
A+ | 1.7% | |
A | 5.3% | |
A- | 6.5% | |
BBB+ | 5.0% | |
BBB | 5.5% | |
BBB- | 3.4% | |
BB+ | 1.6% | |
BB | 1.2% | |
BB- | 0.8% | |
B+ | 0.3% | |
B | 0.2% | |
B- | 0.0% | 1 |
CCC+ | 0.1% | |
Not Rated | 4.8% | |
Total | 100.0% | |
* | Credit quality ratings by Standard & Poor’s assist investors by evaluating the credit worthiness of many bond issues. AAA: An obligation rated ‘AAA’ has the highest rating assigned by S&P Global Ratings. The obligor’s capacity to meet its financial commitment on the obligation is extremely strong. AA: An obligation rated ‘AA’ differs from the highest-rated obligations only to a small degree. The obligor’s capacity to meet its financial commitment on the obligation is very strong. A: An obligation rated ‘A’ is somewhat more susceptible to the adverse effects of changes in circumstances and economic conditions than obligations in higher-rated categories. However, the obligor’s capacity to meet its financial commitment on the obligation is still strong. BBB: An obligation rated ‘BBB’ exhibits adequate protection parameters. However, adverse economic conditions or changing circumstances are more likely to lead to a weakened capacity of the obligor to meet its financial commitment on the obligation. BB: An obligation rated ‘BB’ is less vulnerable to nonpayment than other speculative issues. However, it faces major ongoing uncertainties or exposure to adverse business, financial, or economic conditions which could lead to the obligor’s inadequate capacity to meet its financial commitment on the obligation. Not Rated: This indicates that no rating has been requested, or that there is insufficient information on which to base a rating, or that Standard & Poor’s does not rate a particular obligation as a matter of policy, |
1 | Rounds to less than 0.05%. |
December 31, 2022 |
Impax High Yield Bond Fund |
| | 
|
| | Portfolio Manager
Peter Schwab, CFA |
| | |
| | 
|
| | Portfolio Manager
Kent Siefers |
How did the Impax High Yield Bond Fund (the Fund) perform for the period?
For the one-year period ended December 31, 2022, the Investor Class, Class A, and Institutional Class shares of the Fund had total returns of -12.89%, -12.99%, and -12.72% respectively, compared to -10.59% for the ICE BofA Merrill Lynch U.S. High Yield—Cash Pay—BB-B (Constrained 2%) Index (the Index) and -10.28% for the Lipper High Yield Bond Funds Index.
What factors or portfolio holdings contributed to the Fund’s performance?
Although the Fund underperformed during the reporting period, the Fund’s underperformance was partially offset by a few factors. Positive selection in the Consumer Goods, Retail and Transportation sectors contributed to performance during the year. In Consumer Goods, food manufacturers Del Monte and Whole Earth Brands performed well. In Retail, supermarket Southeastern Grocers outperformed and in Transportation, selection of United and Delta frequent flier airline miles securitizations also buoyed results.
In terms of sector allocation, the Portfolio Managers found several companies in the Services sector that are well positioned for the transition to a sustainable economy. The overweight to this sector contributed to performance as did a lack of exposure to the Banking sector. Banking is a relatively small sector and mostly populated with junior capital from European banks that underperformed this year.
Lastly, the Fund benefited from a merger and acquisition event which resulted in material outperformance in the bonds of auto & truck supplier Meritor Inc., which was purchased by Cummins, Inc.
What factors or portfolio holdings detracted from the Fund’s performance?
The majority of the Fund’s underperformance was driven by negative credit selection in the Media, Technology and Capital Goods sectors. In Media, Cable TV exposure weighed heavily as both Altice USA and VTR (a Chilean company) underperformed on competitive challenges. In Technology, several lower rated companies performed poorly. Cision Ltd. underperformed due to secular headwinds
December 31, 2022 |
Impax High Yield Bond Fund, continued |
requiring material re-investment, and Rackspace detracted as they are undergoing a strategic review. Finally, in Capital Goods, global beverage packaging company Ardagh came under pressure given their high leverage profile.
The portfolio’s defensive characteristics did not hold during a period of rapidly rising interest rates and unilateral widening of credit spreads. Several defensive sectors of focus for the Portfolio Managers carry higher duration risk, which proved to be a headwind. The team’s selective approach to lower-rated and shorter-dated CCC names underperformed as investors de-risked with minimal differentiation.
The Fund’s exposure to CCC-rated companies, which underperformed relative to BB and B-rated companies detracted. The Fund’s approximate 9% weighting in this segment of the market hurt performance as the market reduced exposure aggressively, showing little regard for company-specific fundamentals.
Sector allocation was a headwind due to the relative outperformance of the Energy sector for the second year. High energy prices have buoyed this sector, which would, in our view, normally underperform in difficult market conditions. An underweight in the Leisure sector was also a headwind for the period. Many sub-sectors like Gaming, Lodging and Cruise Lines performed well as they normalized post-COVID.
The Portfolio Managers’ approach has remained consistent, emphasizing sectors that are aligned with the transition to a more sustainable economy, and selecting companies that are best positioned to capture the opportunities arising from that transition. The team continues to de-emphasize sectors and companies that are less likely to thrive in this new, more circular economy. From a sector perspective, recent market conditions have been a headwind for this long-term investment approach, but the Portfolio Managers have strong conviction about the secular changes underway and will continue to position the portfolio to capture opportunities related to those changes.
December 31, 2022 |
Portfolio Highlights (Unaudited) |
Since Inception Total Return—Historical Growth of $10,000
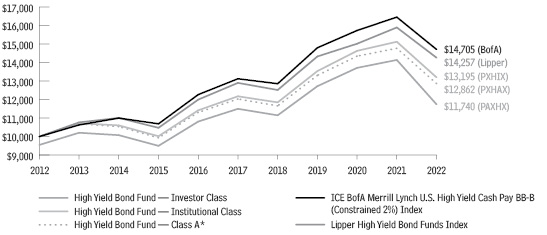
Returns—Year ended December 31, 2022
| | | | Total
Return | Average Annual Return |
Share Class | Ticker
Symbol | | 1 Year | 3 Years | 5 Years | 10 Years |
Investor Class | PAXHX | | -12.89% | -1.12% | 1.35% | 2.55% |
Class A1,3 | PXHAX | NAV2 | -12.99% | -1.11% | 1.36% | 2.56% |
| | | POP | -16.95% | -2.61% | 0.43% | 2.10% |
Institutional Class | PXHIX | | -12.72% | -0.84% | 1.62% | 2.81% |
ICE BofA Merrill Lynch U.S. High Yield - Cash Pay - BB-B (Constrained 2%) Index | -10.59% | -0.20% | 2.31% | 3.93% |
Lipper High Yield Bond Funds Index | | -10.28% | -0.15% | 1.99% | 3.59% |
See ‘Glossary of Terms’ for descriptions of benchmarks.
These figures represent past performance, which is no guarantee of future results. Investment return and principal value of an investment will fluctuate so that an investor’s shares, when redeemed, may be worth more or less than their original cost. Current performance may be lower or higher than the performance data quoted. Total returns for periods of less than one year have not been annualized. For most recent month-end performance data, please visit www.impaxam.com or call 800.767.1729.
1 | A 1.00% CDSC (contingent deferred sales charge) may be charged on any shares sold within 18 months of purchase over $1 million. POP (public offering price) reflects the maximum sales load for the Fund’s Class A Shares of 4.50%. NAV performance does not reflect the deduction of the sales load of the CDSC, which if reflected would reduce the performance shown. |
3 | Inception of Class A shares is May 1, 2013. The performance information shown for Class A shares includes the performance of Investor Class shares, adjusted to reflect the sales charge applicable to Class A shares, for the period prior to Class A inception. |
December 31, 2022 |
Impax High Yield Bond Fund, continued |
Portfolio Highlights (Unaudited) |
Asset Allocation | Percent of Investments |
U.S. Bonds | 84.6% |
Foreign Bonds | 9.9% |
Loans | 2.9% |
U.S. Stocks | 0.2% |
Cash & Cash Equivalents | 2.4% |
Total | 100.0% |
Top Ten Holdings
Company | Percent of Net Assets |
CCO Holdings, LLC/Capital Corp., 4.750%, 03/01/30 | 1.2% |
Centene Corp., 4.625%, 12/15/29 | 1.1% |
Prime Security Services Borrower, LLC/Finance, Inc., 6.250%, 01/15/28 | 1.0% |
Darling Ingredients, Inc., 6.000%, 06/15/30 | 1.0% |
United Natural Foods, Inc., 6.750%, 10/15/28 | 0.9% |
Standard Industries, Inc., 4.375%, 07/15/30 | 0.9% |
Avantor Funding, Inc., 4.625%, 07/15/28 | 0.9% |
NCR Corp., 5.125%, 04/15/29 | 0.8% |
Tenet Healthcare Corp., 5.125%, 11/01/27 | 0.8% |
Graphic Packaging International, LLC, 3.750%, 02/01/30 | 0.8% |
Total | 9.4% |
Ten largest holdings do not include money market securities, certificates of deposit, commercial paper or cash and equivalents, if applicable.
Holdings are subject to change.
Sector Diversification
Sector | Percent of Net Assets |
Media | 10.9% |
Health Care | 9.5% |
Services | 9.4% |
Telecommunications | 9.2% |
Technology & Electronics | 8.2% |
Consumer Goods | 8.1% |
Basic Industry | 7.8% |
Capital Goods | 7.3% |
Retail | 6.7% |
Automotive | 5.4% |
Real Estate | 4.3% |
Utility | 2.7% |
Financial Services | 2.7% |
Leisure | 2.2% |
Transportation | 0.9% |
Insurance | 0.5% |
Community Investment Notes | 0.2% |
Other assets and liabilities (net) | 4.0% |
Total | 100.0% |
May include companies representing multiple industries within a single “Sector”.
Credit Quality*
Bond Rating | Percent of Bonds |
BBB+ | 0.5% |
BBB- | 3.8% |
BB+ | 10.7% |
BB | 14.2% |
BB- | 18.7% |
B+ | 16.0% |
B | 15.7% |
B- | 13.2% |
CCC+ | 5.4% |
CCC | 1.1% |
CCC- | 0.2% |
NR | 0.5% |
Total | 100.0% |
* | See bond rating descriptions on page 46. |
December 31, 2022 |
Impax Sustainable Allocation Fund |
| | 
|
| | Portfolio Manager
Andrew Braun |
| | |
| | 
|
| | Portfolio Manager
Nathan Moser, CFA |
| | |
| | 
|
| | Portfolio Manager
Tony Trzcinka, CFA |
| | |
| | 
|
| | Portfolio Manager
Peter Schwab, CFA |
| | |
| | 
|
| | Portfolio Manager
Kirsteen Morrison |
How did the Impax Sustainable Allocation Fund (the Fund) perform for the period?
For the one-year period ended December 31, 2022, the Investor Class and Institutional Class shares of the Fund had total returns of -16.42% and -16.22%, respectively, compared to -18.11% for the S&P 500 Index, -15.79% for the 60% S&P 500/40% Bloomberg US Aggregate Bond Index blend (the Blended Index), and -13.64% for the Morningstar Allocation – 50% to 70% Equity category average.
Effective November 15, 2022, Kirsteen Morrison was added to the Portfolio Management team of the Fund, alongside Andy Braun, Peter Schwab, Nathan Moser and Tony Trzcinka.
What factors or portfolio holdings contributed to the Fund’s performance?
2022 was an exceptionally hard year for multi-asset investors, as both equity and bond markets delivered negative returns. Throughout the year, equity and bond markets were challenged as investors adjusted to persistent levels of inflation, central bank activity, rising interest rates, heightened geopolitical tensions, and a slower outlook for growth.
Although the Fund underperformed during the reporting period, the Fund’s underperformance was mitigated by its allocations to international equities, sustainable infrastructure equities and cash.
The Fund’s allocation to international equities, through its exposure to non-US securities in four of the underlying strategies (Impax Global Environmental Markets Fund, Impax Global Opportunities Fund, Impax Ellevate Global Women’s Leadership Fund and Impax International Sustainable Economy Fund), contributed positively to
relative performance, as non-US equities significantly outperformed US equities in 2022, as measured by the MSCI EAFE Index and the S&P 500 Index, which returned -14.45% and -18.11%, respectively.
The Fund’s allocation to Impax Global Sustainable Infrastructure Fund was also a boost to performance. The Global Sustainable Infrastructure Fund’s more defensive characteristics, including a significant weight in the Utilities sector, dividend yield and a low beta1, helped to mitigate some of the losses within the Sustainable Allocation Fund’s overall equity allocation.
Additionally, the portfolio’s cash allocation contributed to performance, in a year where both equity and bond markets had negative returns.
What factors or portfolio holdings detracted from the Fund’s performance?
The Fund’s largest detractor to performance was primarily due to the fossil fuel-free nature of its holdings, in a year when Energy outperformed other sectors. Impax Large Cap Fund, the Fund’s largest equity holding, and Impax International Sustainable Economy Fund both weighed notably on performance. These Funds underperformed their respective benchmarks, largely due to sector allocation and the lack of Energy exposure mentioned above.
The possibility of a recession in 2023 remains, as expectations around peak inflation and related central bank policy decisions continue to dominate investors’ thinking. In our view, sustained deterioration of earnings expectations and higher discount rates will likely provide a challenging environment in the short term. Despite the unpredictable outlook, we continue to believe that companies with long-term structural growth opportunities and innovative solutions will present attractive investment opportunities. Additionally, we’ve seen supportive policies broadly related to sustainability gaining traction globally, and we believe that higher energy prices and a renewed focus on energy security will support opportunities across a wide range of sustainable solutions. The Fund remains focused on managing risk, and the investment managers for its underlying strategies remain focused on finding companies with strong pricing protection and attractive valuations that we believe are aligned to benefit from the transition to a more sustainable economy.
1 | A beta greater than 1.0 suggests that a stock is more volatile than the broader market, and a beta less than 1.0 indicates a stock with lower volatility. |
December 31, 2022 |
Impax Sustainable Allocation Fund, continued |
Portfolio Highlights (Unaudited)
Since Inception Total Return—Historical Growth of $10,000
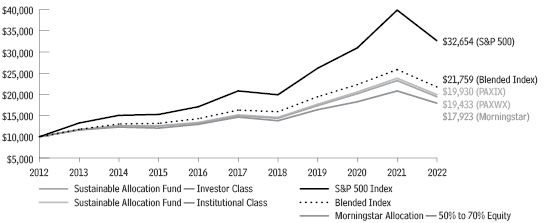
Returns—Year ended December 31, 2022
| | | | Total
Return | Average Annual Return |
Share Class | Ticker
Symbol | | 1 Year | 3 Years | 5 Years | 10 Years |
Investor Class1 | PAXWX | | -16.42% | 3.86% | 5.36% | 6.87% |
Institutional Class1 | PAXIX | | -16.22% | 4.12% | 5.62% | 7.14% |
S&P 500 Index | | | -18.11% | 7.66% | 9.42% | 12.56% |
Blended Index | | | -15.79% | 3.83% | 5.96% | 8.08% |
Morningstar Allocation — 50% to 70% Equity | | -13.64% | 2.89% | 4.13% | 6.21% |
See ‘Glossary of Terms’ for descriptions of benchmarks.
These figures represent past performance, which is no guarantee of future results. Investment return and principal value of an investment will fluctuate so that an investor’s shares, when redeemed, may be worth more or less than their original cost. Current performance may be lower or higher than the performance data quoted. Total returns for periods of less than one year have not been annualized. For most recent month-end performance data, please visit www.impaxam.com or call 800.767.1729.
1 | Total return figures include reinvested dividends and capital gains distributions, and changes in principal value, and do not reflect the taxes that a shareholder might pay on Fund distributions or on the redemption of Fund shares. |
Manager Allocations
Fund Allocation | Percent of Net Assets |
Equity | |
Large-Cap/Multi-Cap Core Strategies | |
Impax Large Cap Fund | 40.6% |
Small Cap Core Strategies | |
Impax Small Cap Fund | 2.8% |
Foreign Strategies | |
Impax Ellevate Global Women’s Leadership Fund | 2.6% |
Impax Global Environmental Markets Fund | 2.4% |
Impax Global Opportunities Fund | 2.6% |
Impax Global Sustainable Infrastructure Fund | 3.2% |
Impax International Sustainable Economy Fund | 4.7% |
Total Equity | 58.9% |
| | |
Fixed Income | |
Investment Grade/Intermediate | |
Impax Core Bond Fund | 34.5% |
High Yield Strategies | |
Impax High Yield Bond Fund | 4.3% |
Total Fixed Income | 38.8% |
| | |
Cash & Cash Equivalents | 2.3% |
Total | 100.0% |
December 31, 2022 |
Shareholder Expense Examples (Unaudited) |
Examples As a shareholder of the Funds, you incur ongoing costs, including management fees, distribution and/or service (12b-1) fees, and other Fund expenses. The examples on the next page are intended to help you understand your ongoing costs (in dollars) of investing in each of the Funds and compare these costs with the ongoing costs of investing in other mutual funds. For more information, see the relevant Fund’s prospectus or talk to your financial adviser.
The examples are based on an investment of $1,000 invested at the beginning of the period and held for the entire period beginning on July 1, 2022 and ending on December 31, 2022.
Please note that Individual Retirement Account (IRA), Coverdell Education Savings, Roth IRA, SEP-IRA, SIMPLE IRA, and 403(b)(7) accounts are charged an annual custodial fee of twenty dollars. If you are invested in one of these account types, you should add an additional $10.00 to the estimated expenses paid during the period.
Actual Expenses For each Fund, the first table on the next page provides information about actual account values and actual expenses. You may use the information in this table, together with the amount you invested, to estimate the expenses that you paid over the period. For the Fund, simply divide your account value by $1,000 (for example, an $8,600 account value divided by $1,000 = 8.6), then multiply the result by the number under the heading entitled “Expenses Paid During Period” to estimate the expenses you paid on your account during this period.
Hypothetical Examples for Comparison Purposes For each Fund, the second table on the following pages provides information about hypothetical account values and hypothetical expenses based on each Fund’s actual expense ratio and an assumed rate of return of 5% per year before expenses, which is not each Fund’s actual return. The hypothetical account values and expenses may not be used to estimate the actual ending account balance or expenses you paid for the period. You may use this information to compare the ongoing costs of investing in the Funds and other funds. To do so, compare these 5% hypothetical examples with the 5% hypothetical examples that appear in the shareholder reports of the other funds.
Please note that the expenses shown in the tables are meant to highlight your ongoing costs only and do not reflect any transactional costs. Therefore, the second table is useful in comparing ongoing costs only, and will not help you determine the relative total costs of owning different funds. In addition, if these transactional costs were included, our costs would have been higher.
December 31, 2022 |
Shareholder Expense Examples (Unaudited), continued |
Based on Actual Fund Return | | | | |
| Beginning
Account Value
7/1/2022 | Ending
Account Value
12/31/2022 | Annualized
Expense
Ratio | Expenses
Paid During
Period1 |
Large Cap Fund - Investor | $ 1,000.00 | $ 997.60 | 0.97% | $ 4.88 |
Large Cap Fund - Institutional | 1,000.00 | 998.90 | 0.72% | 3.63 |
Small Cap Fund - Investor | 1,000.00 | 1,042.80 | 1.16% | 5.97 |
Small Cap Fund - Class A | 1,000.00 | 1,042.20 | 1.16% | 5.97 |
Small Cap Fund - Institutional | 1,000.00 | 1,043.70 | 0.91% | 4.69 |
US Sustainable Economy Fund - Investor | 1,000.00 | 1,020.30 | 0.70% | 3.56 |
US Sustainable Economy Fund - Class A | 1,000.00 | 1,020.50 | 0.70% | 3.56 |
US Sustainable Economy Fund - Institutional | 1,000.00 | 1,021.90 | 0.45% | 2.29 |
Global Sustainable Infrastructure Fund - Investor | 1,000.00 | 996.70 | 0.80% | 4.03 |
Global Sustainable Infrastructure Fund - Institutional | 1,000.00 | 998.10 | 0.55% | 2.77 |
Global Opportunities Fund - Investor | 1,000.00 | 1,063.50 | 1.23% | 6.40 |
Global Opportunities Fund - Institutional | 1,000.00 | 1,064.00 | 0.98% | 5.10 |
Global Environmental Markets Fund - Investor | 1,000.00 | 1,091.70 | 1.17% | 6.17 |
Global Environmental Markets Fund - Class A | 1,000.00 | 1,091.80 | 1.17% | 6.17 |
Global Environmental Markets Fund - Institutional | 1,000.00 | 1,093.20 | 0.92% | 4.85 |
Global Women’s Leadership Fund - Investor | 1,000.00 | 1,025.60 | 0.77% | 3.93 |
Global Women’s Leadership Fund - Institutional | 1,000.00 | 1,027.30 | 0.52% | 2.66 |
International Sustainable Economy Fund - Investor | 1,000.00 | 1,041.40 | 0.72% | 3.70 |
International Sustainable Economy Fund - Institutional | 1,000.00 | 1,042.40 | 0.47% | 2.42 |
Core Bond Fund - Investor | 1,000.00 | 968.80 | 0.71% | 3.52 |
Core Bond Fund - Institutional | 1,000.00 | 970.00 | 0.46% | 2.28 |
High Yield Bond Fund - Investor | 1,000.00 | 1,026.60 | 0.93% | 4.75 |
High Yield Bond Fund - Class A | 1,000.00 | 1,024.80 | 0.93% | 4.75 |
High Yield Bond Fund - Institutional | 1,000.00 | 1,027.90 | 0.68% | 3.48 |
Sustainable Allocation Fund - Investor | 1,000.00 | 999.30 | 0.30% | 1.51 |
Sustainable Allocation Fund - Institutional | 1,000.00 | 1,000.60 | 0.05% | 0.25 |
1 | Expenses are equal to each Funds’ annualized expense ratio, multiplied by the average account value over the period, multiplied by 184/365 (to reflect the one-half year period beginning on July 1, 2022 and ending on December 31, 2022). |
December 31, 2022 |
Shareholder Expense Examples (Unaudited), continued |
Based on Hypothetical 5% Return (before expenses) |
| Beginning
Account Value
7/1/2022 | Ending
Account Value
12/31/2022 | Annualized
Expense
Ratio | Expenses
Paid During
Period1 |
Large Cap Fund - Investor | $ 1,000.00 | $ 1,020.32 | 0.97% | $ 4.94 |
Large Cap Fund - Institutional | 1,000.00 | 1,021.58 | 0.72% | 3.67 |
Small Cap Fund - Investor | 1,000.00 | 1,019.36 | 1.16% | 5.90 |
Small Cap Fund - Class A | 1,000.00 | 1,019.36 | 1.16% | 5.90 |
Small Cap Fund - Institutional | 1,000.00 | 1,020.62 | 0.91% | 4.63 |
US Sustainable Economy Fund - Investor | 1,000.00 | 1,021.68 | 0.70% | 3.57 |
US Sustainable Economy Fund - Class A | 1,000.00 | 1,021.68 | 0.70% | 3.57 |
US Sustainable Economy Fund - Institutional | 1,000.00 | 1,022.94 | 0.45% | 2.29 |
Global Sustainable Infrastructure Fund - Investor | 1,000.00 | 1,021.17 | 0.80% | 4.08 |
Global Sustainable Infrastructure Fund - Institutional | 1,000.00 | 1,022.43 | 0.55% | 2.80 |
Global Opportunities Fund - Investor | 1,000.00 | 1,019.00 | 1.23% | 6.26 |
Global Opportunities Fund - Institutional | 1,000.00 | 1,020.27 | 0.98% | 4.99 |
Global Environmental Markets Fund - Investor | 1,000.00 | 1,019.31 | 1.17% | 5.96 |
Global Environmental Markets Fund - Class A | 1,000.00 | 1,019.31 | 1.17% | 5.96 |
Global Environmental Markets Fund - Institutional | 1,000.00 | 1,020.57 | 0.92% | 4.69 |
Global Women’s Leadership Fund - Investor | 1,000.00 | 1,021.32 | 0.77% | 3.92 |
Global Women’s Leadership Fund - Institutional | 1,000.00 | 1,022.58 | 0.52% | 2.65 |
International Sustainable Economy Fund - Investor | 1,000.00 | 1,021.58 | 0.72% | 3.67 |
International Sustainable Economy Fund - Institutional | 1,000.00 | 1,022.84 | 0.47% | 2.40 |
Core Bond Fund- Investor | 1,000.00 | 1,021.63 | 0.71% | 3.62 |
Core Bond Fund - Institutional | 1,000.00 | 1,022.82 | 0.46% | 2.35 |
High Yield Bond Fund - Investor | 1,000.00 | 1,020.52 | 0.93% | 4.74 |
High Yield Bond Fund - Class A | 1,000.00 | 1,020.52 | 0.93% | 4.74 |
High Yield Bond Fund - Institutional | 1,000.00 | 1,021.78 | 0.68% | 3.47 |
Sustainable Allocation Fund - Investor | 1,000.00 | 1,023.69 | 0.30% | 1.53 |
Sustainable Allocation Fund - Institutional | 1,000.00 | 1,024.95 | 0.05% | 0.26 |
1 | Expenses are equal to each Funds’ annualized expense ratio, multiplied by the average account value over the period, multiplied by 184/365 (to reflect the one-half year period beginning on July 1, 2022 and ending on December 31, 2022). |
December 31, 2022 |
Schedules of Investments |
Impax Large Cap Fund
Percent of Net Assets
Name of Issuer and
Title of Issue | | Shares/
Principal | | | Value | |
COMMON STOCKS: 99.1% |
Communication Services: 9.8% |
Alphabet, Inc., Class A (a) | | | 443,160 | | | $ | 39,100,007 | |
Alphabet, Inc., Class C (a) | | | 285,060 | | | | 25,293,374 | |
T-Mobile US, Inc. (a) | | | 228,108 | | | | 31,935,120 | |
Walt Disney Co., The (a) | | | 409,592 | | | | 35,585,353 | |
| | | | | | | | 131,913,854 | |
Consumer Discretionary: 8.5% |
Amazon.com, Inc. (a) | | | 295,470 | | | | 24,819,480 | |
Aptiv PLC (a) | | | 354,100 | | | | 32,977,333 | |
Lowe’s Cos., Inc. | | | 164,210 | | | | 32,717,200 | |
Target Corp. | | | 165,273 | | | | 24,632,288 | |
| | | | | | | | 115,146,301 | |
Consumer Staples: 7.4% |
Estee Lauder Cos, Inc., The, Class A | | | 94,600 | | | | 23,471,206 | |
McCormick & Co., Inc. | | | 246,055 | | | | 20,395,499 | |
Procter & Gamble Co., The | | | 192,655 | | | | 29,198,792 | |
Sysco Corp. | | | 343,395 | | | | 26,252,548 | |
| | | | | | | | 99,318,045 | |
Financials: 11.0% |
BlackRock, Inc. | | | 29,236 | | | | 20,717,507 | |
Citizens Financial Group, Inc. | | | 823,868 | | | | 32,435,683 | |
JPMorgan Chase & Co. | | | 237,247 | | | | 31,814,823 | |
PNC Financial Services Group, Inc., The | | | 197,934 | | | | 31,261,696 | |
Voya Financial, Inc. | | | 525,711 | | | | 32,325,969 | |
| | | | | | | | 148,555,678 | |
Health Care: 15.5% |
Avantor, Inc. (a) | | | 986,987 | | | | 20,815,556 | |
Baxter International, Inc. | | | 320,700 | | | | 16,346,079 | |
Bristol-Myers Squibb Co. | | | 236,839 | | | | 17,040,566 | |
CVS Health Corp. | | | 323,260 | | | | 30,124,599 | |
Danaher Corp. | | | 68,400 | | | | 18,154,728 | |
IQVIA Holdings, Inc. (a) | | | 112,715 | | | | 23,094,176 | |
Merck & Co., Inc. | | | 328,968 | | | | 36,499,001 | |
Organon & Co. | | | 901,841 | | | | 25,188,419 | |
Vertex Pharmaceuticals, Inc. (a) | | | 75,058 | | | | 21,675,249 | |
| | | | | | | | 208,938,373 | |
Industrials: 9.1% |
Ferguson PLC (b) | | | 151,400 | | | | 19,223,258 | |
Otis Worldwide Corp. | | | 227,334 | | | | 17,802,526 | |
Trane Technologies PLC | | | 242,603 | | | | 40,779,138 | |
United Parcel Service, Inc., Class B | | | 160,197 | | | | 27,848,646 | |
Xylem, Inc. | | | 160,350 | | | | 17,729,900 | |
| | | | | | | | 123,383,468 | |
Percent of Net Assets
Name of Issuer and
Title of Issue | | Shares/
Principal | | | Value | |
COMMON STOCKS, continued |
Information Technology: 26.2% (c) |
Accenture PLC, Class A | | | 84,100 | | | $ | 22,441,244 | |
Apple, Inc. | | | 481,912 | | | | 62,614,826 | |
Applied Materials, Inc. | | | 329,982 | | | | 32,133,647 | |
Fiserv, Inc. (a) | | | 252,992 | | | | 25,569,901 | |
Gen Digital, Inc. | | | 1,049,995 | | | | 22,501,393 | |
Microsoft Corp. | | | 361,450 | | | | 86,682,939 | |
salesforce.com, Inc. (a) | | | 188,154 | | | | 24,947,339 | |
TE Connectivity, Ltd. | | | 217,097 | | | | 24,922,736 | |
Trimble, Inc. (a) | | | 341,022 | | | | 17,242,072 | |
Visa, Inc., Class A | | | 162,654 | | | | 33,792,995 | |
| | | | | | | | 352,849,092 | |
Materials: 4.8% |
Crown Holdings, Inc. | | | 265,147 | | | | 21,797,735 | |
International Flavors & Fragrances, Inc. | | | 207,535 | | | | 21,757,969 | |
PPG Industries, Inc. | | | 168,392 | | | | 21,173,610 | |
| | | | | | | | 64,729,314 | |
Real Estate: 5.8% |
Alexandria Real Estate Equities, Inc., REIT | | | 138,963 | | | | 20,242,740 | |
Equinix, Inc., REIT | | | 27,442 | | | | 17,975,333 | |
Prologis, Inc., REIT | | | 226,763 | | | | 25,562,994 | |
Weyerhaeuser Co., REIT | | | 479,100 | | | | 14,852,100 | |
| | | | | | | | 78,633,167 | |
Utilities: 1.0% |
American Water Works Co., Inc. | | | 89,229 | | | | 13,600,284 | |
| | | | | | | | | |
| | | | | | | | | |
TOTAL COMMON STOCKS |
(Cost $1,067,597,875) | | | 1,337,067,576 | |
| | | | | | | | | |
Money Market: 0.8% |
State Street Institutional U.S. Government Money Market Fund, 4.120% (d)(e) | | | 10,527,669 | | | | 10,527,669 | |
(Cost $10,527,669) |
| | | | | | | | | |
| | 59 | SEE NOTES TO FINANCIAL STATEMENTS |
December 31, 2022 |
Schedules of Investments, continued |
Impax Large Cap Fund, continued
Percent of Net Assets
Name of Issuer and
Title of Issue | | Shares/
Principal | | | Value | |
SECURITIES PURCHASED WITH CASH COLLATERAL FROM SECURITIES LENDING: 0.0% (f) |
State Street Navigator Securities Lending Government Money Market Portfolio, 4.333% (d)(e) | | | 192,900 | | | $ | 192,900 | |
(Cost $192,900) |
| | | | | | | | | |
TOTAL INVESTMENTS: 99.9% |
(Cost $1,078,318,444) | | | 1,347,788,145 | |
| | | | | | | | | |
PAYABLE UPON RETURN OF SECURITIES LOANED: 0.0% (f) | | | (192,900 | ) |
| | | | | | | | | |
Other assets and liabilities — (NET): 0.1% | | | 866,299 | |
| | | | | | | | | |
NET ASSETS: 100.0% | | $ | 1,348,654,444 | |
(a) | Non-income producing security. |
(b) | Security or partial position of this security was on loan as of December 31, 2022. The total market value of securities on loan as of December 31, 2022 was $188,043. |
(c) | Broad industry sectors used for financial reporting. |
(d) | Rate shown represents annualized 7-day yield as of December 31, 2022. |
(f) | Rounds to less than 0.05% |
REIT - Real Estate Investment Trust
SEE NOTES TO FINANCIAL STATEMENTS | 60 | |
December 31, 2022 |
Schedules of Investments, continued |
Impax Small Cap Fund
Percent of Net Assets
Name of Issuer and
Title of Issue | | Shares/
Principal | | | Value | |
COMMON STOCKS: 99.4% |
Communication Services: 3.0% |
QuinStreet, Inc. (a) | | | 790,395 | | | $ | 11,342,168 | |
TechTarget, Inc. (a) | | | 142,583 | | | | 6,282,207 | |
| | | | | | | | 17,624,375 | |
Consumer Discretionary: 9.6% |
Carter’s, Inc. (b) | | | 69,826 | | | | 5,209,718 | |
Columbia Sportswear Co. | | | 75,515 | | | | 6,613,604 | |
Deckers Outdoor Corp. (a) | | | 19,557 | | | | 7,806,372 | |
Fox Factory Holding Corp. (a) | | | 83,331 | | | | 7,602,287 | |
Leslie’s, Inc. (a) | | | 247,284 | | | | 3,019,338 | |
National Vision Holdings, Inc. (a) | | | 255,669 | | | | 9,909,730 | |
Planet Fitness, Inc., Class A (a) | | | 134,271 | | | | 10,580,555 | |
Visteon Corp. (a) | | | 42,500 | | | | 5,560,275 | |
| | | | | | | | 56,301,879 | |
Consumer Staples: 4.7% |
BJ’s Wholesale Club Holdings, Inc. (a) | | | 94,955 | | | | 6,282,223 | |
Darling Ingredients, Inc. (a) | | | 183,294 | | | | 11,472,371 | |
Simply Good Foods Co., The (a) | | | 258,620 | | | | 9,835,319 | |
| | | | | | | | 27,589,913 | |
Financials: 16.4% |
Brightsphere Investment Group, Inc. (b) | | | 1,123,745 | | | | 23,126,672 | |
Eastern Bankshares, Inc. | | | 915,000 | | | | 15,783,750 | |
Independent Bank Corp. | | | 150,000 | | | | 12,664,500 | |
SuRo Capital Corp. (b) | | | 508,398 | | | | 1,931,912 | |
Victory Capital Holdings, Inc., Class A | | | 972,198 | | | | 26,084,072 | |
Voya Financial, Inc. | | | 281,040 | | | | 17,281,150 | |
| | | | | | | | 96,872,056 | |
Health Care: 21.8% |
Amedisys, Inc. (a) | | | 115,000 | | | | 9,607,100 | |
CryoPort, Inc. (a)(b) | | | 487,375 | | | | 8,455,956 | |
Enovis Corp. (a) | | | 185,630 | | | | 9,934,918 | |
Health Catalyst, Inc. (a) | | | 1,204,475 | | | | 12,803,569 | |
Ligand Pharmaceuticals, Inc. (a) | | | 234,320 | | | | 15,652,576 | |
Neurocrine Biosciences, Inc. (a) | | | 175,000 | | | | 20,902,001 | |
OmniAb, Inc. (a) | | | 1,148,184 | | | | 4,133,462 | |
Option Care Health, Inc. (a) | | | 400,000 | | | | 12,036,000 | |
Pacira BioSciences, Inc. (a) | | | 200,027 | | | | 7,723,042 | |
Prestige Consumer Healthcare, Inc. (a) | | | 170,000 | | | | 10,642,000 | |
Percent of Net Assets
Name of Issuer and
Title of Issue | | Shares/
Principal | | | Value | |
COMMON STOCKS, continued |
Health Care, continued |
SI-BONE, Inc. (a) | | | 1,200,343 | | | $ | 16,324,665 | |
| | | | | | | | 128,215,289 | |
Industrials: 15.5% |
Advanced Drainage Systems, Inc. | | | 49,433 | | | | 4,052,023 | |
AZEK Co Inc., The (a) | | | 419,349 | | | | 8,521,172 | |
EnPro Industries, Inc. | | | 120,000 | | | | 13,042,800 | |
Evoqua Water Technologies Corp. (a) | | | 314,343 | | | | 12,447,983 | |
Gates Industrial Corp PLC (a) | | | 1,052,713 | | | | 12,011,455 | |
Herc Holdings, Inc. | | | 45,000 | | | | 5,920,650 | |
Huron Consulting Group, Inc. (a) | | | 125,000 | | | | 9,075,000 | |
MSA Safety, Inc. | | | 60,089 | | | | 8,664,233 | |
Stericycle, Inc. (a) | | | 202,906 | | | | 10,122,980 | |
Vertiv Holdings Co. | | | 561,461 | | | | 7,669,557 | |
| | | | | | | | 91,527,853 | |
Information Technology: 16.0% |
A10 Networks, Inc. | | | 815,000 | | | | 13,553,450 | |
Belden, Inc. | | | 190,000 | | | | 13,661,000 | |
Ciena Corp. (a) | | | 253,064 | | | | 12,901,203 | |
Extreme Networks, Inc. (a) | | | 630,178 | | | | 11,538,559 | |
Napco Security Technologies, Inc. (a) | | | 255,000 | | | | 7,007,400 | |
Onto Innovation, Inc. (a) | | | 137,557 | | | | 9,366,256 | |
Sprout Social, Inc., Class A (a) | | | 113,724 | | | | 6,420,857 | |
Verra Mobility Corp. (a) | | | 448,661 | | | | 6,204,982 | |
Workiva, Inc. (a) | | | 158,586 | | | | 13,316,466 | |
| | | | | | | | 93,970,173 | |
Materials: 5.4% |
Element Solutions, Inc. | | | 736,946 | | | | 13,405,048 | |
Graphic Packaging Holding Co. | | | 833,585 | | | | 18,547,266 | |
| | | | | | | | 31,952,314 | |
Real Estate: 7.0% |
Altus Group, Ltd. | | | 367,910 | | | | 14,683,794 | |
Healthcare Realty Trust, Inc., REIT | | | 756,352 | | | | 14,574,903 | |
Rayonier, Inc., REIT | | | 361,676 | | | | 11,920,841 | |
| | | | | | | | 41,179,538 | |
TOTAL COMMON STOCKS |
(Cost $591,170,330) | | | 585,233,390 | |
| | | | | | | | | |
| | 61 | SEE NOTES TO FINANCIAL STATEMENTS |
December 31, 2022 |
Schedules of Investments, continued |
Impax Small Cap Fund, continued
Percent of Net Assets
Name of Issuer and
Title of Issue | | Shares/
Principal | | | Value | |
Money Market: 0.7% |
State Street Institutional U.S. Government Money Market Fund, 4.120% (c)(d) | | | 3,883,966 | | | $ | 3,883,966 | |
(Cost $3,883,966) |
| |
SECURITIES PURCHASED WITH CASH COLLATERAL FROM SECURITIES LENDING: 0.0% (e) |
State Street Navigator Securities Lending Government Money Market Portfolio, 4.333% (c)(d) | | | 45,060 | | | | 45,060 | |
(Cost $45,060) |
| | | | | | | | | |
TOTAL INVESTMENTS: 100.1% |
(Cost $595,099,356) | | | 589,162,416 | |
| | | | | | | | | |
PAYABLE UPON RETURN OF SECURITIES LOANED: 0.0% (e) | | | (45,060 | ) |
| | | | | | | | | |
OTHER ASSETS AND LIABILITIES — (NET): -0.1% | | | (634,954 | ) |
| | | | | | | | | |
NET ASSETS: 100.0% | | $ | 588,482,402 | |
(a) | Non-income producing security. |
(b) | Security or partial position of this security was on loan as of December 31, 2022. The total market value of securities on loan as of December 31, 2022 was $13,786,178. |
(c) | Rate shown represents annualized 7-day yield as of December 31, 2022. |
(e) | Rounds to less than 0.05% |
REIT - Real Estate Investment Trust
SEE NOTES TO FINANCIAL STATEMENTS | 62 | |
December 31, 2022 |
Schedules of Investments, continued |
Impax US Sustainable Economy Fund
Percent of Net Assets
Name of Issuer and
Title of Issue | | Shares/
Principal | | | Value | |
COMMON STOCKS: 98.4% |
Communication Services: 6.2% |
Alphabet, Inc., Class A (a) | | | 67,023 | | | $ | 5,913,440 | |
Alphabet, Inc., Class C (a) | | | 26,036 | | | | 2,310,174 | |
AT&T, Inc. | | | 73 | | | | 1,344 | |
Cable One, Inc. | | | 140 | | | | 99,660 | |
Electronic Arts, Inc. | | | 4,061 | | | | 496,173 | |
Interpublic Group of Cos Inc., The | | | 22,208 | | | | 739,748 | |
Paramount Global, Class B | | | 66,833 | | | | 1,128,141 | |
Take-Two Interactive Software, Inc. (a) | | | 5,519 | | | | 574,693 | |
T-Mobile US, Inc. (a) | | | 1,978 | | | | 276,920 | |
Verizon Communications, Inc. | | | 88,773 | | | | 3,497,657 | |
Warner Bros. Discovery, Inc. (a) | | | 1,343 | | | | 12,732 | |
ZoomInfo Technologies, Inc. (a) | | | 15,364 | | | | 462,610 | |
| | | | | | | | 15,513,292 | |
Consumer Discretionary: 7.2% |
Aptiv PLC (a) | | | 5,697 | | | | 530,562 | |
Bath & Body Works, Inc. | | | 34,254 | | | | 1,443,464 | |
Best Buy Co., Inc. | | | 14,790 | | | | 1,186,306 | |
BorgWarner, Inc. | | | 17,354 | | | | 698,499 | |
DR Horton, Inc. | | | 1,363 | | | | 121,498 | |
eBay, Inc. | | | 62,786 | | | | 2,603,735 | |
Grand Canyon Education, Inc. (a) | | | 13,505 | | | | 1,426,938 | |
Harley-Davidson, Inc. | | | 6,631 | | | | 275,850 | |
Hasbro, Inc. | | | 2,498 | | | | 152,403 | |
Home Depot, Inc., The | | | 13,812 | | | | 4,362,657 | |
Lear Corp. | | | 1,423 | | | | 176,480 | |
Lowe’s Cos., Inc. | | | 5,521 | | | | 1,100,004 | |
MGM Resorts International | | | 6,483 | | | | 217,375 | |
Nordstrom, Inc. (b) | | | 6,279 | | | | 101,343 | |
NVR, Inc. (a) | | | 61 | | | | 281,367 | |
Planet Fitness, Inc., Class A (a) | | | 31,306 | | | | 2,466,913 | |
PulteGroup, Inc. | | | 96 | | | | 4,371 | |
Tractor Supply Co. | | | 709 | | | | 159,504 | |
Vail Resorts, Inc. | | | 877 | | | | 209,033 | |
Whirlpool Corp. | | | 1,150 | | | | 162,679 | |
Williams-Sonoma, Inc. | | | 1,646 | | | | 189,158 | |
| | | | | | | | 17,870,139 | |
Consumer Staples: 6.2% |
Clorox Co., The | | | 3,670 | | | | 515,011 | |
Colgate-Palmolive Co. | | | 13,965 | | | | 1,100,302 | |
Estee Lauder Cos, Inc., The, Class A | | | 1,356 | | | | 336,437 | |
Percent of Net Assets
Name of Issuer and
Title of Issue | | Shares/
Principal | | | Value | |
COMMON STOCKS, continued |
Consumer Staples, continued |
General Mills, Inc. | | | 25,583 | | | $ | 2,145,135 | |
Hershey Co., The | | | 93 | | | | 21,536 | |
Ingredion, Inc. | | | 2,886 | | | | 282,626 | |
J.M. Smucker Co., The | | | 27 | | | | 4,278 | |
Kimberly-Clark Corp. | | | 15,616 | | | | 2,119,872 | |
Kroger Co., The | | | 51,105 | | | | 2,278,262 | |
PepsiCo, Inc. | | | 18,561 | | | | 3,353,230 | |
Procter & Gamble Co., The | | | 18,030 | | | | 2,732,626 | |
Walgreens Boots Alliance, Inc. | | | 13,070 | | | | 488,295 | |
| | | | | | | | 15,377,610 | |
Financials: 7.0% |
Affiliated Managers Group, Inc. | | | 3,860 | | | | 611,540 | |
Aflac, Inc. | | | 446 | | | | 32,085 | |
Allstate Corp., The | | | 29,129 | | | | 3,949,893 | |
Ally Financial, Inc. | | | 5,369 | | | | 131,272 | |
American Express Co. | | | 1,610 | | | | 237,878 | |
Ameriprise Financial, Inc. | | | 4,714 | | | | 1,467,798 | |
Bank of New York Mellon Corp., The | | | 42,323 | | | | 1,926,543 | |
FactSet Research Systems, Inc. | | | 336 | | | | 134,807 | |
Hartford Financial Services Group, Inc., The | | | 18,116 | | | | 1,373,736 | |
Huntington Bancshares, Inc. | | | 15,039 | | | | 212,050 | |
MarketAxess Holdings, Inc. | | | 978 | | | | 272,754 | |
MetLife, Inc. | | | 59,529 | | | | 4,308,115 | |
PNC Financial Services Group, Inc., The | | | 1,752 | | | | 276,711 | |
Progressive Corp., The | | | 10,437 | | | | 1,353,783 | |
Prudential Financial, Inc. | | | 2,685 | | | | 267,050 | |
Regions Financial Corp. | | | 13,870 | | | | 299,037 | |
Reinsurance Group of America, Inc. | | | 2,326 | | | | 330,501 | |
Synchrony Financial | | | 5,727 | | | | 188,189 | |
| | | | | | | | 17,373,742 | |
Health Care: 17.1% |
AbbVie, Inc. | | | 20,871 | | | | 3,372,962 | |
Agilent Technologies, Inc. | | | 17,916 | | | | 2,681,129 | |
Amgen, Inc. | | | 7,539 | | | | 1,980,043 | |
Baxter International, Inc. | | | 2,829 | | | | 144,194 | |
Bio-Rad Laboratories, Inc., Class A (a) | | | 1,079 | | | | 453,709 | |
Bristol-Myers Squibb Co. | | | 59,988 | | | | 4,316,137 | |
| | 63 | SEE NOTES TO FINANCIAL STATEMENTS |
December 31, 2022 |
Schedules of Investments, continued |
Impax US Sustainable Economy Fund, continued
Percent of Net Assets
Name of Issuer and
Title of Issue | | Shares/
Principal | | | Value | |
COMMON STOCKS, continued |
Health Care, continued |
Charles River Laboratories International, Inc. (a) | | | 873 | | | $ | 190,227 | |
CVS Health Corp. | | | 11,847 | | | | 1,104,022 | |
Elevance Health, Inc. | | | 1,527 | | | | 783,305 | |
Eli Lilly & Co. | | | 12,274 | | | | 4,490,321 | |
Encompass Health Corp. | | | 25,188 | | | | 1,506,494 | |
Hologic, Inc. (a) | | | 3,333 | | | | 249,342 | |
Humana, Inc. | | | 627 | | | | 321,143 | |
IDEXX Laboratories, Inc. (a) | | | 528 | | | | 215,403 | |
Illumina, Inc. (a) | | | 6,582 | | | | 1,330,880 | |
Johnson & Johnson | | | 32,236 | | | | 5,694,490 | |
Merck & Co., Inc. | | | 30,894 | | | | 3,427,689 | |
Mettler-Toledo International, Inc. (a) | | | 2,758 | | | | 3,986,551 | |
Organon & Co. | | | 2,170 | | | | 60,608 | |
QuidelOrtho Corp. (a) | | | 142 | | | | 12,165 | |
West Pharmaceutical Services, Inc. | | | 11,909 | | | | 2,802,783 | |
Zoetis, Inc. | | | 22,564 | | | | 3,306,754 | |
| | | | | | | | 42,430,351 | |
Industrials: 12.4% |
A.O. Smith Corp. | | | 3,940 | | | | 225,526 | |
Acuity Brands, Inc. | | | 2,680 | | | | 443,835 | |
Booz Allen Hamilton Holding Corp. | | | 2,214 | | | | 231,407 | |
C.H. Robinson Worldwide, Inc. | | | 7,935 | | | | 726,529 | |
Carrier Global Corp. | | | 35,859 | | | | 1,479,184 | |
CSX Corp. | | | 7,485 | | | | 231,885 | |
Cummins, Inc. | | | 6,493 | | | | 1,573,189 | |
Dover Corp. | | | 6,457 | | | | 874,342 | |
Emerson Electric Co. | | | 17,588 | | | | 1,689,503 | |
Expeditors International of Washington, Inc. | | | 1,175 | | | | 122,106 | |
Flowserve Corp. | | | 13,691 | | | | 420,040 | |
GXO Logistics, Inc. (a) | | | 6,630 | | | | 283,035 | |
IDEX Corp. | | | 1,245 | | | | 284,271 | |
Illinois Tool Works, Inc. | | | 1,065 | | | | 234,620 | |
Ingersoll Rand, Inc. | | | 17,300 | | | | 903,925 | |
Johnson Controls International PLC | | | 24,558 | | | | 1,571,712 | |
Lennox International, Inc. | | | 1,010 | | | | 241,622 | |
Norfolk Southern Corp. | | | 16,299 | | | | 4,016,400 | |
nVent Electric PLC | | | 12,327 | | | | 474,220 | |
Otis Worldwide Corp. | | | 19,330 | | | | 1,513,732 | |
Owens Corning | | | 6,319 | | | | 539,011 | |
Regal Rexnord Corp. | | | 3,668 | | | | 440,087 | |
Percent of Net Assets
Name of Issuer and
Title of Issue | | Shares/
Principal | | | Value | |
COMMON STOCKS, continued |
Industrials, continued |
Republic Services, Inc. | | | 26,099 | | | $ | 3,366,509 | |
Rockwell Automation, Inc. | | | 4,845 | | | | 1,247,927 | |
Trane Technologies PLC | | | 8,131 | | | | 1,366,740 | |
United Parcel Service, Inc., Class B | | | 12,394 | | | | 2,154,573 | |
United Rentals, Inc. (a) | | | 41 | | | | 14,572 | |
W.W. Grainger, Inc. | | | 755 | | | | 419,969 | |
Waste Management, Inc. | | | 23,648 | | | | 3,709,897 | |
| | | | | | | | 30,800,368 | |
Information Technology: 29.0% (c) |
Accenture PLC, Class A | | | 5,882 | | | | 1,569,553 | |
Adobe, Inc. (a) | | | 1,442 | | | | 485,276 | |
Analog Devices, Inc. | | | 12,785 | | | | 2,097,124 | |
ANSYS, Inc. (a) | | | 8,282 | | | | 2,000,848 | |
Apple, Inc. | | | 101,461 | | | | 13,182,827 | |
Applied Materials, Inc. | | | 18,444 | | | | 1,796,077 | |
Autodesk, Inc. (a) | | | 5,664 | | | | 1,058,432 | |
Automatic Data Processing, Inc. | | | 5,699 | | | | 1,361,263 | |
Cadence Design Systems, Inc. (a) | | | 7,361 | | | | 1,182,471 | |
Cisco Systems, Inc. | | | 29,758 | | | | 1,417,671 | |
Cognex Corp. | | | 10,884 | | | | 512,745 | |
Corning, Inc. | | | 5,607 | | | | 179,088 | |
Dell Technologies, Inc., Class C | | | 3,094 | | | | 124,441 | |
F5, Inc. (a) | | | 138 | | | | 19,804 | |
First Solar, Inc. (a) | | | 2,883 | | | | 431,845 | |
Gen Digital, Inc. | | | 46,844 | | | | 1,003,867 | |
HP, Inc. | | | 43,759 | | | | 1,175,804 | |
HubSpot, Inc. (a) | | | 4,777 | | | | 1,381,174 | |
IBM | | | 10,567 | | | | 1,488,785 | |
Intel Corp. | | | 53,622 | | | | 1,417,229 | |
Intuit, Inc. | | | 1,801 | | | | 700,985 | |
Keysight Technologies, Inc. (a) | | | 8,093 | | | | 1,384,470 | |
Lam Research Corp. | | | 8,660 | | | | 3,639,798 | |
Lumentum Holdings, Inc. (a) | | | 5,481 | | | | 285,944 | |
MasterCard, Inc., Class A | | | 9,770 | | | | 3,397,322 | |
Microsoft Corp. | | | 46,381 | | | | 11,123,092 | |
National Instruments Corp. | | | 5,720 | | | | 211,068 | |
New Relic, Inc. (a) | | | 5,505 | | | | 310,757 | |
NVIDIA Corp. | | | 33,477 | | | | 4,892,329 | |
PayPal Holdings, Inc. (a) | | | 1,718 | | | | 122,356 | |
PTC, Inc. (a) | | | 2,840 | | | | 340,914 | |
QUALCOMM, Inc. | | | 1,849 | | | | 203,279 | |
salesforce.com, Inc. (a) | | | 7,993 | | | | 1,059,792 | |
SEE NOTES TO FINANCIAL STATEMENTS | 64 | |
December 31, 2022 |
Schedules of Investments, continued |
Impax US Sustainable Economy Fund, continued
Percent of Net Assets
Name of Issuer and
Title of Issue | | Shares/
Principal | | | Value | |
COMMON STOCKS, continued |
Information Technology, continued |
ServiceNow, Inc. (a) | | | 4,009 | | | $ | 1,556,574 | |
Splunk, Inc. (a) | | | 1,854 | | | | 159,611 | |
Synopsys, Inc. (a) | | | 4,705 | | | | 1,502,259 | |
Texas Instruments, Inc. | | | 26,744 | | | | 4,418,644 | |
Trimble, Inc. (a) | | | 3,274 | | | | 165,533 | |
Universal Display Corp. | | | 3,506 | | | | 378,788 | |
Visa, Inc., Class A | | | 6,750 | | | | 1,402,380 | |
VMware, Inc., Class A (a) | | | 6,628 | | | | 813,653 | |
Western Digital Corp. (a) | | | 3,624 | | | | 114,337 | |
| | | | | | | | 72,070,209 | |
Materials: 5.5% |
Amcor PLC | | | 20,473 | | | | 243,833 | |
Axalta Coating Systems, Ltd. (a) | | | 8,184 | | | | 208,446 | |
Celanese Corp. | | | 1,612 | | | | 164,811 | |
Chemours Co., The | | | 70,085 | | | | 2,146,003 | |
Ecolab, Inc. | | | 23,808 | | | | 3,465,491 | |
Graphic Packaging Holding Co. | | | 14,914 | | | | 331,837 | |
International Flavors & Fragrances, Inc. | | | 17,051 | | | | 1,787,627 | |
International Paper Co. | | | 4,433 | | | | 153,515 | |
Linde PLC | | | 8,165 | | | | 2,663,260 | |
Martin Marietta Materials, Inc. | | | 1,482 | | | | 500,872 | |
Nucor Corp. | | | 2,213 | | | | 291,696 | |
PPG Industries, Inc. | | | 8,148 | | | | 1,024,530 | |
Sherwin-Williams Co., The | | | 1,063 | | | | 252,282 | |
Steel Dynamics, Inc. | | | 3,271 | | | | 319,577 | |
WestRock Co. | | | 4,504 | | | | 158,361 | |
| | | | | | | | 13,712,141 | |
Real Estate: 6.1% |
Alexandria Real Estate Equities, Inc., REIT | | | 6,721 | | | | 979,048 | |
AvalonBay Communities, Inc., REIT | | | 5,598 | | | | 904,189 | |
Boston Properties, Inc., REIT | | | 7,807 | | | | 527,597 | |
CBRE Group, Inc., Class A (a) | | | 39,853 | | | | 3,067,087 | |
Equinix, Inc., REIT | | | 3,249 | | | | 2,128,192 | |
Equity Residential, REIT | | | 59 | | | | 3,481 | |
Healthpeak Properties, Inc., REIT | | | 48,186 | | | | 1,208,023 | |
Prologis, Inc., REIT | | | 16,904 | | | | 1,905,588 | |
Rayonier, Inc., REIT | | | 27,365 | | | | 901,950 | |
Ventas, Inc., REIT | | | 52,314 | | | | 2,356,745 | |
Welltower, Inc., REIT | | | 14,084 | | | | 923,206 | |
Percent of Net Assets
Name of Issuer and
Title of Issue | | Shares/
Principal | | | Value | |
COMMON STOCKS, continued |
Real Estate, continued |
Weyerhaeuser Co., REIT | | | 6,890 | | | $ | 213,590 | |
| | | | | | | | 15,118,696 | |
Utilities: 1.7% |
American Water Works Co., Inc. | | | 24,210 | | | | 3,690,088 | |
Avangrid, Inc. (b) | | | 4,856 | | | | 208,711 | |
Edison International | | | 3,985 | | | | 253,526 | |
| | | | | | | | 4,152,325 | |
TOTAL COMMON STOCKS |
(Cost $175,413,356) | | | 244,418,873 | |
| | | | | | | | | |
Money Market: 1.5% |
State Street Institutional U.S. Government Money Market Fund, 4.120% (d)(e) | | | 3,830,080 | | | | 3,830,080 | |
(Cost $3,830,080) |
| | | | | | | | | |
SECURITIES PURCHASED WITH CASH COLLATERAL FROM SECURITIES LENDING: 0.1% |
State Street Navigator Securities Lending Government Money Market Portfolio, 4.333% (d)(e) | | | 216,092 | | | | 216,092 | |
(Cost $216,092) |
| | | | | | | | | |
TOTAL INVESTMENTS: 100.0% |
(Cost $179,459,528) | | | 248,465,045 | |
| | | | | | | | | |
PAYABLE UPON RETURN OF SECURITIES LOANED: -0.1% | | | (216,092 | ) |
| | | | | | | | | |
Other assets and liabilities — (NET): 0.1% | | | 287,213 | |
| | | | | | | | | |
NET ASSETS: 100.0% | | $ | 248,536,166 | |
(a) | Non-income producing security. |
(b) | Security or partial position of this security was on loan as of December 31, 2022. The total market value of securities on loan as of December 31, 2022 was $309,740. |
(c) | Broad industry sectors used for financial reporting. |
(d) | Rate shown represents annualized 7-day yield as of December 31, 2022. |
| | 65 | SEE NOTES TO FINANCIAL STATEMENTS |
December 31, 2022 |
Schedules of Investments, continued |
Impax Global Sustainable Infrastructure Fund
Percent of Net Assets
Name of Issuer and
Title of Issue | | Shares/
Principal | | | Value | |
COMMON STOCKS: 98.5% |
Communication Services: 14.7% |
AT&T, Inc. | | | 78,135 | | | $ | 1,438,465 | |
BCE, Inc. | | | 25,451 | | | | 1,118,227 | |
Globe Telecom, Inc. | | | 6,695 | | | | 262,636 | |
HKT Trust & HKT, Ltd. | | | 826,000 | | | | 1,011,126 | |
Koninklijke KPN NV | | | 61,421 | | | | 190,114 | |
Lumen Technologies, Inc. | | | 149,093 | | | | 778,265 | |
Nippon Telegraph & Telephone Corp. | | | 19,300 | | | | 550,407 | |
Orange SA | | | 104,571 | | | | 1,037,566 | |
PCCW, Ltd. | | | 1,389,000 | | | | 625,786 | |
Singapore Telecommunications, Ltd. | | | 126,500 | | | | 242,537 | |
SK Telecom Co., Ltd. | | | 26,185 | | | | 982,300 | |
SoftBank Corp. | | | 101,400 | | | | 1,147,206 | |
Swisscom AG | | | 783 | | | | 428,936 | |
Tele2 AB, Class B | | | 95,962 | | | | 782,842 | |
Telefonica SA | | | 253,958 | | | | 919,355 | |
Telenor ASA | | | 85,444 | | | | 798,301 | |
Telia Company AB | | | 294,939 | | | | 753,648 | |
Telstra Corp., Ltd. | | | 131,804 | | | | 356,456 | |
Verizon Communications, Inc. | | | 35,949 | | | | 1,416,391 | |
Vodafone Group PLC | | | 888,490 | | | | 899,789 | |
| | | | | | | | 15,740,353 | |
Consumer Discretionary: 0.4% |
Sekisui Chemical Co., Ltd. | | | 29,700 | | | | 413,967 | |
| | | | | | | | | |
Consumer Staples: 1.6% |
Darling Ingredients, Inc. (a) | | | 7,355 | | | | 460,349 | |
Sysco Corp. | | | 15,955 | | | | 1,219,760 | |
| | | | | | | | 1,680,109 | |
Health Care: 8.2% |
AmerisourceBergen Corp. | | | 3,120 | | | | 517,015 | |
Cardinal Health, Inc. | | | 7,175 | | | | 551,541 | |
Cigna Corp. | | | 2,369 | | | | 784,944 | |
CVS Health Corp. | | | 13,055 | | | | 1,216,595 | |
Encompass Health Corp. | | | 9,311 | | | | 556,891 | |
HCA Healthcare, Inc. | | | 4,860 | | | | 1,166,206 | |
Henry Schein, Inc. (a) | | | 6,542 | | | | 522,510 | |
IDEXX Laboratories, Inc. (a) | | | 1,286 | | | | 524,637 | |
McKesson Corp. | | | 1,768 | | | | 663,212 | |
Mettler-Toledo International, Inc. (a) | | | 347 | | | | 501,571 | |
Premier, Inc., Class A | | | 14,917 | | | | 521,797 | |
Quest Diagnostics, Inc. | | | 3,665 | | | | 573,353 | |
Select Medical Holdings Corp. | | | 5,986 | | | | 148,632 | |
Percent of Net Assets
Name of Issuer and
Title of Issue | | Shares/
Principal | | | Value | |
COMMON STOCKS, continued |
Health Care, continued |
Sonic Healthcare, Ltd. | | | 27,615 | | | $ | 561,994 | |
| | | | | | | | 8,810,898 | |
Industrials: 30.0% (b) |
A.O. Smith Corp. | | | 4,575 | | | | 261,873 | |
Advanced Drainage Systems, Inc. | | | 5,396 | | | | 442,310 | |
Andritz AG | | | 13,872 | | | | 794,062 | |
Ashtead Group PLC | | | 22,724 | | | | 1,290,831 | |
Bloom Energy Corp., Class A (a) | | | 22,945 | | | | 438,708 | |
Brambles, Ltd. | | | 92,708 | | | | 760,262 | |
Canadian Pacific Railway, Ltd. | | | 23,965 | | | | 1,786,755 | |
Carlisle Companies, Inc. | | | 1,919 | | | | 452,212 | |
China Conch Venture Holdings, Ltd. | | | 253,500 | | | | 549,924 | |
Clean Harbors, Inc. (a) | | | 4,413 | | | | 503,612 | |
CSX Corp. | | | 39,616 | | | | 1,227,304 | |
East Japan Railway Co. | | | 3,700 | | | | 210,744 | |
Ferguson PLC | | | 8,214 | | | | 1,031,217 | |
Geberit AG | | | 1,822 | | | | 860,130 | |
Generac Holdings, Inc. (a) | | | 5,901 | | | | 593,995 | |
Herc Holdings, Inc. | | | 100 | | | | 13,157 | |
Hubbell, Inc. | | | 5,524 | | | | 1,296,372 | |
Kurita Water Industries, Ltd. | | | 18,700 | | | | 772,398 | |
Lennox International, Inc. | | | 2,184 | | | | 522,478 | |
Masco Corp. | | | 14,760 | | | | 688,849 | |
Miura Co., Ltd. | | | 18,700 | | | | 428,838 | |
MTR Corp., Ltd. | | | 103,346 | | | | 546,582 | |
NARI Technology Co., Ltd., Class A | | | 143,070 | | | | 499,999 | |
Norfolk Southern Corp. | | | 4,962 | | | | 1,222,736 | |
Otis Worldwide Corp. | | | 1,664 | | | | 130,308 | |
Pentair PLC | | | 15,256 | | | | 686,215 | |
Plug Power, Inc. (a)(c) | | | 40,016 | | | | 494,998 | |
Prysmian SpA | | | 15,611 | | | | 580,035 | |
Quanta Services, Inc. | | | 6,561 | | | | 934,943 | |
Schneider Electric SE | | | 18,628 | | | | 2,616,015 | |
Shimizu Corp. | | | 149,700 | | | | 798,788 | |
Sunrun, Inc. (a) | | | 10,265 | | | | 246,565 | |
Union Pacific Corp. | | | 6,608 | | | | 1,368,319 | |
United Rentals, Inc. (a) | | | 1,506 | | | | 535,263 | |
Vertiv Holdings Co. | | | 29,191 | | | | 398,749 | |
Voltronic Power Technology Corp. | | | 11,000 | | | | 551,889 | |
Waste Management, Inc. | | | 14,385 | | | | 2,256,719 | |
Watsco, Inc. | | | 2,184 | | | | 544,690 | |
SEE NOTES TO FINANCIAL STATEMENTS | 66 | |
December 31, 2022 |
Schedules of Investments, continued |
Impax Global Sustainable Infrastructure Fund, continued
Percent of Net Assets
Name of Issuer and
Title of Issue | | Shares/
Principal | | | Value | |
COMMON STOCKS, continued |
Industrials, continued |
Watts Water Technologies, Inc., Class A | | | 3,621 | | | $ | 529,499 | |
West Japan Railway Co. | | | 14,200 | | | | 616,554 | |
Xinjiang Goldwind Science & Technology Co., Ltd., Class H | | | 707,000 | | | | 626,725 | |
Xylem, Inc. | | | 8,476 | | | | 937,191 | |
| | | | | | | | 32,048,813 | |
Information Technology: 10.0% |
ASML Holding NV | | | 947 | | | | 516,353 | |
Cadence Design Systems, Inc. (a) | | | 2,996 | | | | 481,277 | |
Check Point Software Technologies, Ltd. (a) | | | 4,098 | | | | 517,004 | |
China Railway Signal & Communication Corp., Ltd., Class H | | | 1,703,000 | | | | 555,360 | |
Cisco Systems, Inc. | | | 21,196 | | | | 1,009,777 | |
Enphase Energy, Inc. (a) | | | 1,717 | | | | 454,936 | |
First Solar, Inc. (a) | | | 1,752 | | | | 262,432 | |
Jack Henry & Associates, Inc. | | | 3,108 | | | | 545,640 | |
Juniper Networks, Inc. | | | 17,453 | | | | 557,798 | |
MasterCard, Inc., Class A | | | 3,733 | | | | 1,298,076 | |
Motorola Solutions, Inc. | | | 2,411 | | | | 621,339 | |
SolarEdge Technologies, Inc. (a) | | | 1,649 | | | | 467,112 | |
Taiwan Semiconductor Manufacturing Co., Ltd., ADR | | | 19,485 | | | | 1,451,439 | |
TE Connectivity, Ltd. | | | 3,811 | | | | 437,503 | |
Visa, Inc., Class A | | | 832 | | | | 172,856 | |
VMware, Inc., Class A (a) | | | 2,080 | | | | 255,341 | |
Xinyi Solar Holdings, Ltd. | | | 1,027,389 | | | | 1,130,482 | |
| | | | | | | | 10,734,725 | |
Materials: 0.5% |
Elkem ASA (a) | | | 140,967 | | | | 507,384 | |
| |
Real Estate: 5.0% |
Boston Properties, Inc., REIT | | | 1,879 | | | | 126,983 | |
Cousins Properties, Inc., REIT | | | 5,541 | | | | 140,132 | |
Douglas Emmett, Inc., REIT | | | 6,100 | | | | 95,648 | |
Healthpeak Properties, Inc., REIT | | | 35,230 | | | | 883,216 | |
Japan Real Estate Investment Corp. | | | 69 | | | | 303,068 | |
Percent of Net Assets
Name of Issuer and
Title of Issue | | Shares/
Principal | | | Value | |
COMMON STOCKS, continued |
Real Estate, continued |
Medical Properties Trust, Inc. (c) | | | 62,550 | | | $ | 696,807 | |
Omega Healthcare Investors, Inc., REIT | | | 34,116 | | | | 953,542 | |
Orix JREIT, Inc. | | | 296 | | | | 419,921 | |
SL Green Realty Corp., REIT (c) | | | 11,183 | | | | 377,091 | |
Ventas, Inc., REIT | | | 18,260 | | | | 822,613 | |
Welltower, Inc., REIT | | | 7,354 | | | | 482,055 | |
| | | | | | | | 5,301,076 | |
Utilities: 28.1% (b) |
Acciona SA | | | 5,710 | | | | 1,050,821 | |
Adani Green Energy, Ltd. (a) | | | 22,329 | | | | 517,586 | |
American Water Works Co., Inc. | | | 10,681 | | | | 1,627,998 | |
Beijing Enterprises Water Group, Ltd. | | | 662,000 | | | | 169,277 | |
Boralex, Inc., Class A | | | 15,689 | | | | 463,718 | |
Brookfield Renewable Partners, LP | | | 28,507 | | | | 721,728 | |
Edison International | | | 23,995 | | | | 1,526,562 | |
EDP - Energias de Portugal SA | | | 264,475 | | | | 1,318,356 | |
EDP Renovaveis SA | | | 52,407 | | | | 1,154,816 | |
Encavis AG | | | 22,854 | | | | 451,917 | |
Enel Americas SA | | | 8,660,717 | | | | 1,158,846 | |
Enel Chile SA | | | 10,423,231 | | | | 479,106 | |
Enel SpA | | | 353,407 | | | | 1,900,672 | |
Engie Brasil Energia SA | | | 104,100 | | | | 746,874 | |
Guangdong Investment, Ltd. | | | 1,110,000 | | | | 1,133,365 | |
Iberdrola SA | | | 214,667 | | | | 2,505,912 | |
Innergex Renewable Energy, Inc. | | | 39,335 | | | | 470,626 | |
Mercury NZ, Ltd. | | | 63,084 | | | | 222,859 | |
Meridian Energy, Ltd. | | | 362,751 | | | | 1,206,578 | |
Neoen SA | | | 8,225 | | | | 332,609 | |
Ormat Technologies, Inc. (c) | | | 8,371 | | | | 723,924 | |
Orsted A/S | | | 15,630 | | | | 1,413,040 | |
Pennon Group PLC | | | 46,057 | | | | 495,186 | |
Power Grid Corp of India, Ltd. | | | 455,260 | | | | 1,175,126 | |
Severn Trent PLC | | | 38,131 | | | | 1,218,214 | |
Solaria Energia y Medio Ambiente SA (a) | | | 28,258 | | | | 518,026 | |
SSE PLC | | | 72,764 | | | | 1,496,534 | |
Sunnova Energy International, Inc. (a)(c) | | | 15,658 | | | | 282,001 | |
| | 67 | SEE NOTES TO FINANCIAL STATEMENTS |
December 31, 2022 |
Schedules of Investments, continued |
Impax Global Sustainable Infrastructure Fund, continued
Percent of Net Assets
Name of Issuer and
Title of Issue | | Shares/
Principal | | | Value | |
COMMON STOCKS, continued |
Utilities, continued |
United Utilities Group PLC | | | 100,603 | | | $ | 1,202,038 | |
Veolia Environnement SA | | | 45,511 | | | | 1,169,378 | |
Verbund AG | | | 13,840 | | | | 1,163,387 | |
| | | | | | | | 30,017,080 | |
TOTAL COMMON STOCKS |
(Cost $112,114,113) | | | 105,254,405 | |
| | | | | | | | | |
Money Market: 1.2% |
State Street Institutional U.S. Government Money Market Fund, 4.120% (d)(e) | | | 1,279,340 | | | | 1,279,340 | |
(Cost $1,279,340) |
| |
SECURITIES PURCHASED WITH CASH COLLATERAL FROM SECURITIES LENDING: 1.0% |
State Street Navigator Securities Lending Government Money Market Portfolio, 4.333% (d)(e) | | | 1,035,336 | | | | 1,035,336 | |
(Cost $1,035,336) |
| | | | | | | | | |
TOTAL INVESTMENTS: 100.7% |
(Cost $114,428,789) | | | 107,569,081 | |
| | | | | | | | | |
PAYABLE UPON RETURN OF SECURITIES LOANED: -1.0% | | | (1,035,336 | ) |
| | | | | | | | | |
Other assets and liabilities — (NET): 0.3% | | | 304,063 | |
| | | | | | | | | |
NET ASSETS: 100.0% | | $ | 106,837,808 | |
(a) | Non-income producing security. |
(b) | Broad industry sectors used for financial reporting. |
(c) | Security or partial position of this security was on loan as of December 31, 2022. The total market value of securities on loan as of December 31, 2022 was $2,263,989. |
(d) | Rate shown represents annualized 7-day yield as of December 31, 2022. |
ADR - American Depositary Receipt
REIT - Real Estate Investment Trust
SUMMARY OF INVESTMENTS BY COUNTRY
Country | | Value | | | Percent Of
Net Assets | |
Australia | | $ | 1,678,711 | | | | 1.6 | % |
Austria | | | 1,957,449 | | | | 1.8 | % |
Brazil | | | 746,874 | | | | 0.7 | % |
Canada | | | 4,561,054 | | | | 4.3 | % |
Chile | | | 1,637,952 | | | | 1.5 | % |
China | | | 4,665,133 | | | | 4.4 | % |
Denmark | | | 1,413,040 | | | | 1.3 | % |
France | | | 5,155,568 | | | | 4.8 | % |
Germany | | | 451,917 | | | | 0.4 | % |
Hong Kong | | | 2,183,493 | | | | 2.1 | % |
India | | | 1,692,713 | | | | 1.6 | % |
Israel | | | 517,004 | | | | 0.5 | % |
Italy | | | 2,480,707 | | | | 2.3 | % |
Japan | | | 5,661,892 | | | | 5.3 | % |
Netherlands | | | 706,467 | | | | 0.7 | % |
New Zealand | | | 1,429,437 | | | | 1.3 | % |
Norway | | | 1,305,684 | | | | 1.2 | % |
Philippines | | | 262,636 | | | | 0.3 | % |
Portugal | | | 1,318,356 | | | | 1.2 | % |
Singapore | | | 242,537 | | | | 0.2 | % |
South Korea | | | 982,300 | | | | 0.9 | % |
Spain | | | 6,148,930 | | | | 5.8 | % |
Sweden | | | 1,536,490 | | | | 1.4 | % |
Switzerland | | | 1,726,569 | | | | 1.6 | % |
Taiwan | | | 2,003,326 | | | | 1.9 | % |
United Kingdom | | | 6,602,591 | | | | 6.2 | % |
United States | | | 46,185,574 | | | | 43.2 | % |
Money Market | | | 1,279,340 | | | | 1.2 | % |
Other assets and liabilities (net) | | | 304,064 | | | | 0.3 | % |
| | | $ | 106,837,808 | | | | 100.0 | % |
SEE NOTES TO FINANCIAL STATEMENTS | 68 | |
December 31, 2022 |
Schedules of Investments, continued |
Impax Global Opportunities Fund
Percent of Net Assets
Name of Issuer and
Title of Issue | | Shares/
Principal | | | Value | |
COMMON STOCKS: 96.6% |
Communication Services: 3.0% |
KDDI Corp. | | | 103,900 | | | $ | 3,150,963 | |
| | | | | | | | | |
Consumer Discretionary: 2.0% |
Aptiv PLC (a) | | | 22,258 | | | | 2,072,888 | |
| | | | | | | | | |
Consumer Staples: 4.3% |
Jeronimo Martins SGPS SA | | | 99,138 | | | | 2,144,898 | |
Unilever PLC | | | 47,827 | | | | 2,399,802 | |
| | | | | | | | 4,544,700 | |
Financials: 14.1% |
AIA Group, Ltd. | | | 280,200 | | | | 3,094,355 | |
Globe Life, Inc. | | | 12,934 | | | | 1,559,194 | |
Hannover Rueck SE | | | 18,312 | | | | 3,613,098 | |
HDFC Bank, Ltd., ADR | | | 49,916 | | | | 3,414,754 | |
Legal & General Group PLC | | | 679,833 | | | | 2,038,229 | |
Partners Group Holding AG | | | 1,155 | | | | 1,022,733 | |
| | | | | | | | 14,742,363 | |
Health Care: 23.7% |
Alcon, Inc. | | | 53,434 | | | | 3,666,585 | |
Becton Dickinson & Co. | | | 4,077 | | | | 1,036,781 | |
Boston Scientific Corp. (a) | | | 78,774 | | | | 3,644,873 | |
Cooper Cos, Inc., The | | | 5,562 | | | | 1,839,187 | |
Danaher Corp. | | | 7,979 | | | | 2,117,786 | |
Evotec SE (a) | | | 24,172 | | | | 393,233 | |
IQVIA Holdings, Inc. (a) | | | 17,949 | | | | 3,677,570 | |
Lonza Group AG | | | 5,313 | | | | 2,608,021 | |
Thermo Fisher Scientific, Inc. | | | 6,679 | | | | 3,678,059 | |
Vertex Pharmaceuticals, Inc. (a) | | | 7,602 | | | | 2,195,306 | |
| | | | | | | | 24,857,401 | |
Industrials: 14.2% |
Ashtead Group PLC | | | 18,680 | | | | 1,061,113 | |
Cintas Corp. | | | 7,369 | | | | 3,327,987 | |
Kubota Corp. | | | 157,400 | | | | 2,150,310 | |
Schneider Electric SE | | | 22,104 | | | | 3,104,166 | |
United Rentals, Inc. (a) | | | 5,078 | | | | 1,804,823 | |
Vestas Wind Systems A/S | | | 36,376 | | | | 1,061,111 | |
Wolters Kluwer NV | | | 22,066 | | | | 2,308,881 | |
| | | | | | | | 14,818,391 | |
Information Technology: 24.2% |
Analog Devices, Inc. | | | 19,249 | | | | 3,157,413 | |
Applied Materials, Inc. | | | 21,832 | | | | 2,126,000 | |
ASML Holding NV | | | 3,446 | | | | 1,878,937 | |
Cadence Design Systems, Inc. (a) | | | 16,391 | | | | 2,633,050 | |
Keyence Corp. | | | 7,050 | | | | 2,737,124 | |
Percent of Net Assets
Name of Issuer and
Title of Issue | | Shares/
Principal | | | Value | |
COMMON STOCKS, continued |
Information Technology, continued |
MasterCard, Inc., Class A | | | 11,844 | | | $ | 4,118,514 | |
Microsoft Corp. | | | 18,666 | | | | 4,476,481 | |
TE Connectivity, Ltd. | | | 18,281 | | | | 2,098,659 | |
Visa, Inc., Class A | | | 10,090 | | | | 2,096,298 | |
| | | | | | | | 25,322,476 | |
Materials: 8.9% |
Croda International PLC | | | 25,700 | | | | 2,045,169 | |
Koninklijke DSM NV | | | 25,191 | | | | 3,093,318 | |
Linde PLC | | | 12,655 | | | | 4,127,807 | |
| | | | | | | | 9,266,294 | |
Real Estate: 2.2% |
Equinix, Inc., REIT | | | 3,578 | | | | 2,343,697 | |
| | | | | | | | | |
TOTAL COMMON STOCKS |
(Cost $89,744,656) | | | 101,119,173 | |
| | | | | | | | | |
Preferred Stocks: 1.7% |
Health Care: 1.7% |
Sartorius AG | | | 1,634,098 | | | | 1,775,756 | |
(Cost $1,634,098) |
| | | | | | | | | |
TOTAL INVESTMENTS: 98.3% |
(Cost $91,378,754) | | | 102,894,929 | |
| | | | | | | | | |
Other assets and liabilities — (NET): 1.7% | | | 1,845,330 | |
| | | | | | | | | |
NET ASSETS: 100.0% | | $ | 104,740,259 | |
(a) | Non-income producing security. |
ADR - American Depositary Receipt
REIT - Real Estate Investment Trust
| | 69 | SEE NOTES TO FINANCIAL STATEMENTS |
December 31, 2022 |
Schedules of Investments, continued |
Impax Global Opportunities Fund, continued
SUMMARY OF INVESTMENTS BY COUNTRY
Country | | Value | | | Percent Of
Net Assets | |
Denmark | | $ | 1,061,111 | | | | 1.0 | % |
France | | | 3,104,166 | | | | 3.0 | % |
Germany | | | 5,782,087 | | | | 5.5 | % |
Hong Kong | | | 3,094,355 | | | | 3.0 | % |
India | | | 3,414,754 | | | | 3.3 | % |
Japan | | | 8,038,397 | | | | 7.7 | % |
Netherlands | | | 7,281,135 | | | | 6.9 | % |
Portugal | | | 2,144,898 | | | | 2.0 | % |
Switzerland | | | 7,297,339 | | | | 7.0 | % |
United Kingdom | | | 7,544,313 | | | | 7.2 | % |
United States | | | 54,132,374 | | | | 51.7 | % |
Other assets and liabilities (net) | | | 1,845,330 | | | | 1.7 | % |
TOTAL | | $ | 104,740,259 | | | | 100.0 | % |
SEE NOTES TO FINANCIAL STATEMENTS | 70 | |
December 31, 2022 |
Schedules of Investments, continued |
Impax Global Environmental Markets Fund
Percent of Net Assets
Name of Issuer and
Title of Issue | | Shares/
Principal | | | Value | |
COMMON STOCKS: 98.9% |
NEW ENERGY: 21.4% |
Renewable Energy Developers & IPPs 2.3% |
Orsted A/S | | | 562,394 | | | $ | 50,843,587 | |
| |
Wind Power Generation Equipment: 1.9% |
Vestas Wind Systems A/S | | | 1,404,469 | | | | 40,969,267 | |
| |
Smart & Efficient Grids: 5.0% |
Hubbell, Inc. | | | 183,826 | | | | 43,140,286 | |
Schneider Electric SE | | | 472,850 | | | | 66,404,491 | |
| | | | | | | | 109,544,777 | |
| |
Industrial Energy Efficiency: 10.2% |
Air Liquide SA | | | 498,027 | | | | 70,687,603 | |
Delta Electronics, Inc. | | | 3,589,475 | | | | 33,274,384 | |
Keyence Corp. | | | 54,300 | | | | 21,081,677 | |
Rockwell Automation, Inc. | | | 130,858 | | | | 33,705,095 | |
Siemens AG | | | 327,551 | | | | 45,153,299 | |
Spirax-Sarco Engineering, PLC | | | 167,070 | | | | 21,339,934 | |
| | | | | | | | 225,241,992 | |
Building Energy Efficiency: 2.0% |
Trane Technologies PLC | | | 266,198 | | | | 44,745,222 | |
| |
CLEAN & EFFICIENT TRANSPORT: 4.7% |
E-Bikes & Bicycles: 0.9% |
Shimano, Inc. | | | 125,300 | | | | 19,799,762 | |
Advanced Road Vehicles & Devices: 3.8% |
Aptiv PLC (a) | | | 483,315 | | | | 45,011,126 | |
TE Connectivity, Ltd. | | | 346,850 | | | | 39,818,380 | |
| | | | | | | | 84,829,506 | |
SUSTAINABLE FOOD: 18.1% |
Technology & Logistics: 6.9% |
Deere & Co. | | | 102,049 | | | | 43,754,529 | |
GEA Group AG | | | 1,592,190 | | | | 64,750,445 | |
Kubota Corp. | | | 3,179,000 | | | | 43,429,698 | |
| | | | | | | | 151,934,672 | |
Food Safety & Packaging: 6.9% |
Crown Holdings, Inc. | | | 358,273 | | | | 29,453,623 | |
Eurofins Scientific SE | | | 760,923 | | | | 54,632,844 | |
Mettler-Toledo International, Inc. (a) | | | 20,697 | | | | 29,916,479 | |
WestRock Co. | | | 1,108,002 | | | | 38,957,350 | |
| | | | | | | | 152,960,296 | |
Percent of Net Assets
Name of Issuer and
Title of Issue | | Shares/
Principal | | | Value | |
COMMON STOCKS, continued |
SUSTAINABLE FOOD, continued |
Sustainable Agriculture: 4.3% |
International Flavors & Fragrances, Inc. | | | 330,031 | | | $ | 34,600,450 | |
Koninklijke DSM NV | | | 486,198 | | | | 59,702,469 | |
| | | | | | | | 94,302,919 | |
WATER: 17.6% |
Water Distribution & Infrastructure: 5.8% |
Ferguson PLC | | | 285,199 | | | | 35,804,970 | |
Georg Fischer AG | | | 594,032 | | | | 36,391,730 | |
IDEX Corp. | | | 241,767 | | | | 55,202,659 | |
| | | | | | | | 127,399,359 | |
Water Treatment: 6.6% |
Linde PLC | | | 276,473 | | | | 90,179,964 | |
Pentair PLC | | | 1,247,030 | | | | 56,091,409 | |
| | | | | | | | 146,271,373 | |
Water Utilities: 5.2% |
American Water Works Co., Inc. | | | 369,590 | | | | 56,332,908 | |
Veolia Environnement SA | | | 2,292,897 | | | | 58,914,636 | |
| | | | | | | | 115,247,544 | |
CIRCULAR ECONOMY: 9.9% |
General Waste Management: 6.7% |
Republic Services, Inc. | | | 507,947 | | | | 65,520,084 | |
Waste Management, Inc. | | | 526,162 | | | | 82,544,294 | |
| | | | | | | | 148,064,378 | |
Recycled, Recyclable Products & Biomaterials: 1.4% |
Croda International PLC | | | 385,422 | | | | 30,671,323 | |
| |
Resource Circularity & Efficiency: 1.8% |
United Rentals, Inc. (a) | | | 115,338 | | | | 40,993,432 | |
| |
SMART ENVIRONMENT: 27.2% |
Environmental Testing & Monitoring: 7.0% |
Agilent Technologies, Inc. | | | 532,756 | | | | 79,726,936 | |
Halma PLC | | | 842,497 | | | | 20,064,015 | |
Waters Corp. (a) | | | 163,629 | | | | 56,056,023 | |
| | | | | | | | 155,846,974 | |
Efficient IT: 15.8% |
ANSYS, Inc. (a) | | | 249,118 | | | | 60,184,418 | |
Applied Materials, Inc. | | | 361,263 | | | | 35,179,791 | |
ASML Holding NV | | | 65,813 | | | | 35,884,646 | |
Autodesk, Inc. (a) | | | 284,321 | | | | 53,131,065 | |
MediaTek, Inc. | | | 2,001,000 | | | | 40,458,068 | |
PTC, Inc. (a) | | | 276,719 | | | | 33,217,349 | |
| | 71 | SEE NOTES TO FINANCIAL STATEMENTS |
December 31, 2022 |
Schedules of Investments, continued |
Impax Global Environmental Markets Fund, continued
Percent of Net Assets
Name of Issuer and
Title of Issue | | Shares/
Principal | | | Value | |
COMMON STOCKS, continued |
SMART ENVIRONMENT, continued |
Efficient IT, continued |
Texas Instruments, Inc. | | | 330,467 | | | $ | 54,599,757 | |
Trimble, Inc. (a) | | | 701,984 | | | | 35,492,311 | |
| | | | | | | | 348,147,405 | |
Cloud Computing: 4.4% |
Equinix, Inc., REIT | | | 70,128 | | | | 45,935,944 | |
Microsoft Corp. | | | 209,303 | | | | 50,195,045 | |
| | | | | | | | 96,130,989 | |
Total Common Stocks |
(Cost $1,888,678,785) | | | 2,183,944,777 | |
| | | | | | | | | |
MONEY MARKET: 1.0% |
State Street Institutional U.S. Government Money Market Fund, 4.120% (b)(c) | | | 22,131,588 | | | | 22,131,588 | |
(Cost $22,131,588) |
| | | | | | | | | |
TOTAL INVESTMENTS: 99.9% |
(Cost $1,910,810,373) | | | 2,206,076,365 | |
| | | | | | | | | |
Other assets and liabilities — (NET): 0.1% | | | 2,600,307 | |
| | | | | | | | | |
NET ASSETS: 100.0% | | $ | 2,208,676,672 | |
(a) | Non-income producing security. |
(b) | Rate shown represents annualized 7-day yield as of December 31, 2022. |
REIT - Real Estate Investment Trust
SUMMARY OF INVESTMENTS BY COUNTRY
Country | | Value | | | Percent Of
Net Assets | |
Denmark | | $ | 91,812,854 | | | | 4.2 | % |
France | | | 250,639,577 | | | | 11.4 | % |
Germany | | | 109,903,744 | | | | 5.0 | % |
Japan | | | 84,311,136 | | | | 3.8 | % |
Netherlands | | | 95,587,115 | | | | 4.3 | % |
Switzerland | | | 36,391,730 | | | | 1.6 | % |
Taiwan | | | 73,732,451 | | | | 3.3 | % |
United Kingdom | | | 107,880,243 | | | | 4.9 | % |
United States | | | 1,333,685,927 | | | | 60.4 | % |
Money Market | | | 22,131,588 | | | | 1.0 | % |
Other assets and liabilities (net) | | | 2,600,307 | | | | 0.1 | % |
Total | | $ | 2,208,676,672 | | | | 100.0 | % |
SEE NOTES TO FINANCIAL STATEMENTS | 72 | |
December 31, 2022 |
Schedules of Investments, continued |
Impax Ellevate Global Women’s Leadership Fund
Percent of Net Assets
Name of Issuer and
Title of Issue | | Shares/
Principal | | | Value | |
COMMON STOCKS: 99.3% |
Communication Services: 5.7% |
Adevinta ASA (a) | | | 7,472 | | | $ | 49,477 | |
Auto Trader Group PLC | | | 1,831,988 | | | | 11,408,429 | |
BCE, Inc. | | | 1,800 | | | | 79,086 | |
BT Group PLC | | | 166,931 | | | | 225,403 | |
Deutsche Telekom AG | | | 100,084 | | | | 1,991,328 | |
Interpublic Group of Cos Inc., The | | | 9,407 | | | | 313,347 | |
Koninklijke KPN NV | | | 73,158 | | | | 226,443 | |
Match Group, Inc. (a) | | | 8,214 | | | | 340,799 | |
Netflix, Inc. (a) | | | 10,485 | | | | 3,091,817 | |
News Corp. | | | 9,600 | | | | 174,720 | |
Omnicom Group, Inc. | | | 4,811 | | | | 392,433 | |
Orange SA | | | 46,714 | | | | 463,502 | |
Paramount Global, Class B | | | 21,041 | | | | 355,172 | |
Pinterest, Inc., Class A (a) | | | 13,295 | | | | 322,803 | |
Publicis Groupe SA | | | 6,700 | | | | 428,011 | |
REA Group, Ltd. | | | 1,337 | | | | 100,551 | |
SEEK, Ltd. | | | 8,258 | | | | 117,402 | |
Singapore Telecommunications, Ltd. | | | 197,481 | | | | 378,629 | |
Snap, Inc., Class A (a) | | | 30,383 | | | | 271,928 | |
Spark New Zealand, Ltd. | | | 59,688 | | | | 204,358 | |
Tele2 AB, Class B | | | 19,519 | | | | 159,233 | |
Telenor ASA | | | 1,280,463 | | | | 11,963,327 | |
Telia Company AB | | | 63,512 | | | | 162,290 | |
Telstra Corp., Ltd. | | | 91,586 | | | | 247,689 | |
TELUS Corp. | | | 11,409 | | | | 220,175 | |
Verizon Communications, Inc. | | | 99,276 | | | | 3,911,474 | |
Vivendi SA | | | 15,250 | | | | 145,682 | |
Vodafone Group PLC | | | 652,145 | | | | 660,438 | |
Walt Disney Co., The (a) | | | 59,914 | | | | 5,205,328 | |
WPP PLC | | | 25,866 | | | | 255,556 | |
| | | | | | | | 43,866,830 | |
Consumer Discretionary: 12.9% |
Accor SA (a) | | | 3,932 | | | | 98,094 | |
Amazon.com, Inc. (a) | | | 233,075 | | | | 19,578,299 | |
Aristocrat Leisure, Ltd. | | | 15,563 | | | | 320,688 | |
Barratt Developments PLC | | | 22,442 | | | | 107,190 | |
Bath & Body Works, Inc. | | | 8,027 | | | | 338,258 | |
Best Buy Co., Inc. | | | 140,392 | | | | 11,260,842 | |
Burberry Group PLC | | | 9,565 | | | | 232,546 | |
Burlington Stores, Inc. (a) | | | 1,570 | | | | 318,333 | |
Cie Generale des Etablissements Michelin SCA | | | 15,232 | | | | 424,322 | |
Compass Group PLC | | | 39,054 | | | | 901,836 | |
Percent of Net Assets
Name of Issuer and
Title of Issue | | Shares/
Principal | | | Value | |
COMMON STOCKS, continued |
Consumer Discretionary, continued |
Dollar General Corp. | | | 5,504 | | | $ | 1,355,360 | |
Domino’s Pizza, Inc. | | | 900 | | | | 311,760 | |
eBay, Inc. | | | 14,140 | | | | 586,386 | |
Electrolux AB, Class B | | | 5,221 | | | | 70,541 | |
Etsy, Inc. (a) | | | 3,729 | | | | 446,660 | |
Expedia Group, Inc. (a) | | | 4,304 | | | | 377,030 | |
General Motors Co. | | | 35,906 | | | | 1,207,878 | |
H & M Hennes & Mauritz AB, Class B | | | 51,536 | | | | 555,374 | |
Hasbro, Inc. | | | 3,437 | | | | 209,691 | |
Hermes International | | | 724 | | | | 1,120,644 | |
Hilton Worldwide Holdings, Inc. | | | 7,194 | | | | 909,034 | |
Industria de Diseno Textil SA | | | 23,936 | | | | 635,765 | |
InterContinental Hotels Group PLC | | | 4,130 | | | | 236,974 | |
Kering SA | | | 1,954 | | | | 994,444 | |
Kingfisher PLC | | | 46,788 | | | | 132,935 | |
La Francaise des Jeux SAEM | | | 2,321 | | | | 93,394 | |
lululemon athletica, Inc. (a) | | | 38,269 | | | | 12,260,622 | |
LVMH Moet Hennessy Louis Vuitton SE | | | 6,558 | | | | 4,772,206 | |
Marriott International, Inc., Class A | | | 7,080 | | | | 1,054,141 | |
McDonald’s Corp. | | | 17,200 | | | | 4,532,716 | |
Mercedes-Benz Group AG | | | 18,212 | | | | 1,190,971 | |
Moncler SpA | | | 4,561 | | | | 242,357 | |
Next PLC | | | 4,413 | | | | 309,222 | |
Pearson PLC | | | 21,122 | | | | 238,506 | |
Renault SA (a) | | | 4,574 | | | | 152,628 | |
Rivian Automotive, Inc., Class A (a)(b) | | | 11,721 | | | | 216,018 | |
Ross Stores, Inc. | | | 8,269 | | | | 959,783 | |
SEB SA | | | 538 | | | | 45,139 | |
Starbucks Corp. | | | 108,698 | | | | 10,782,842 | |
Target Corp. | | | 12,451 | | | | 1,855,697 | |
Taylor Wimpey PLC | | | 80,545 | | | | 98,643 | |
TJX Cos., Inc., The | | | 27,315 | | | | 2,174,274 | |
Tractor Supply Co. | | | 2,781 | | | | 625,642 | |
Ulta Beauty, Inc. (a) | | | 26,448 | | | | 12,405,963 | |
Vail Resorts, Inc. | | | 1,016 | | | | 242,164 | |
VF Corp. | | | 9,707 | | | | 268,010 | |
Wesfarmers, Ltd. | | | 27,392 | | | | 854,282 | |
Whirlpool Corp. | | | 1,400 | | | | 198,044 | |
Yum! Brands, Inc. | | | 6,551 | | | | 839,052 | |
| | 73 | SEE NOTES TO FINANCIAL STATEMENTS |
December 31, 2022 |
Schedules of Investments, continued |
Impax Ellevate Global Women’s Leadership Fund, continued
Percent of Net Assets
Name of Issuer and
Title of Issue | | Shares/
Principal | | | Value | |
COMMON STOCKS, continued |
Consumer Discretionary, continued |
Zalando SE (a) | | | 4,451 | | | $ | 156,697 | |
| | | | | | | | 99,299,897 | |
Consumer Staples: 11.7% |
Alimentation Couche-Tard, Inc. | | | 18,827 | | | | 827,331 | |
Beiersdorf AG | | | 2,157 | | | | 246,484 | |
Carrefour SA | | | 13,804 | | | | 230,885 | |
Clorox Co., The | | | 81,455 | | | | 11,430,580 | |
Coca-Cola Co., The | | | 241,270 | | | | 15,347,184 | |
Coles Group, Ltd. | | | 30,437 | | | | 345,023 | |
Colgate-Palmolive Co. | | | 18,000 | | | | 1,418,221 | |
Conagra Brands, Inc. | | | 10,800 | | | | 417,960 | |
Danone SA | | | 14,331 | | | | 755,325 | |
Diageo PLC | | | 292,417 | | | | 12,799,634 | |
Empire Co., Ltd., Class A | | | 3,935 | | | | 103,635 | |
Essity AB, Class B | | | 12,590 | | | | 329,697 | |
Estee Lauder Cos, Inc., The, Class A | | | 47,148 | | | | 11,697,890 | |
General Mills, Inc. | | | 28,123 | | | | 2,358,114 | |
Heineken Holding NV | | | 2,196 | | | | 169,598 | |
Heineken NV | | | 5,675 | | | | 534,541 | |
Henkel AG & Co. KGaA | | | 2,387 | | | | 153,400 | |
Hershey Co., The | | | 3,356 | | | | 777,149 | |
J Sainsbury PLC | | | 40,558 | | | | 106,376 | |
J.M. Smucker Co., The | | | 2,497 | | | | 395,675 | |
Jeronimo Martins SGPS SA | | | 6,457 | | | | 139,700 | |
Kellogg Co. | | | 5,893 | | | | 419,817 | |
Kimberly-Clark Corp. | | | 7,658 | | | | 1,039,574 | |
Kroger Co., The | | | 17,395 | | | | 775,469 | |
Loblaw Cos, Ltd. | | | 3,776 | | | | 333,872 | |
L’Oreal SA | | | 5,578 | | | | 1,997,468 | |
McCormick & Co., Inc. | | | 5,850 | | | | 484,907 | |
Metro, Inc. | | | 5,629 | | | | 311,674 | |
Mondelez International, Inc., Class A | | | 32,000 | | | | 2,132,800 | |
Mowi ASA | | | 8,643 | | | | 147,279 | |
Orkla ASA | | | 16,735 | | | | 120,782 | |
Pernod Ricard SA | | | 4,686 | | | | 921,841 | |
Procter & Gamble Co., The | | | 53,891 | | | | 8,167,720 | |
Remy Cointreau SA | | | 522 | | | | 88,016 | |
Saputo, Inc. | | | 5,808 | | | | 143,784 | |
Shiseido Co., Ltd. | | | 8,300 | | | | 406,814 | |
Tesco PLC | | | 169,994 | | | | 458,111 | |
Treasury Wine Estates, Ltd. | | | 16,563 | | | | 153,016 | |
Unilever PLC | | | 56,215 | | | | 2,838,172 | |
Percent of Net Assets
Name of Issuer and
Title of Issue | | Shares/
Principal | | | Value | |
COMMON STOCKS, continued |
Consumer Staples, continued |
Walgreens Boots Alliance, Inc. | | | 100,531 | | | $ | 3,755,838 | |
Woolworths Group, Ltd. | | | 226,010 | | | | 5,161,032 | |
| | | | | | | | 90,442,388 | |
Financials: 18.3% |
ABN AMRO Bank NV | | | 8,673 | | | | 120,103 | |
Abrdn PLC | | | 49,837 | | | | 113,249 | |
Admiral Group PLC | | | 461,935 | | | | 11,858,288 | |
Aegon NV | | | 38,254 | | | | 193,820 | |
Aflac, Inc. | | | 14,100 | | | | 1,014,354 | |
Allianz SE | | | 9,078 | | | | 1,938,676 | |
Ally Financial, Inc. | | | 8,312 | | | | 203,228 | |
American Express Co. | | | 15,762 | | | | 2,328,836 | |
Amundi SA | | | 1,355 | | | | 76,841 | |
Annaly Capital Management, Inc., REIT (b) | | | 9,715 | | | | 204,792 | |
ANZ Group Holdings, Ltd. | | | 70,601 | | | | 1,137,305 | |
Aon PLC, Class A | | | 5,077 | | | | 1,523,811 | |
Assicurazioni Generali SpA | | | 24,547 | | | | 436,507 | |
ASX, Ltd. | | | 4,658 | | | | 214,530 | |
Aviva PLC | | | 62,835 | | | | 333,317 | |
AXA SA | | | 41,911 | | | | 1,167,452 | |
Banco Bilbao Vizcaya Argentaria SA | | | 145,774 | | | | 878,035 | |
Banco Santander SA | | | 378,675 | | | | 1,132,281 | |
Bank Hapoalim BM | | | 30,188 | | | | 271,810 | |
Bank Leumi Le-Israel BM | | | 36,926 | | | | 307,549 | |
Bank of America Corp. | | | 191,577 | | | | 6,345,031 | |
Bank of Montreal | | | 16,451 | | | | 1,490,310 | |
Bank of New York Mellon Corp., The | | | 18,000 | | | | 819,360 | |
Bank of Nova Scotia, The | | | 29,182 | | | | 1,429,789 | |
BNP Paribas SA | | | 24,343 | | | | 1,386,069 | |
Canadian Imperial Bank of Commerce | | | 169,048 | | | | 6,838,080 | |
Citigroup, Inc. | | | 288,711 | | | | 13,058,400 | |
CME Group, Inc. | | | 8,503 | | | | 1,429,864 | |
Commerzbank AG (a) | | | 21,224 | | | | 198,436 | |
Commonwealth Bank of Australia | | | 54,177 | | | | 3,762,853 | |
Credit Agricole SA | | | 26,495 | | | | 278,710 | |
Credit Suisse Group AG | | | 75,745 | | | | 226,133 | |
Danske Bank A/S | | | 14,522 | | | | 286,419 | |
Discover Financial Services | | | 7,185 | | | | 702,909 | |
DNB Bank ASA | | | 612,590 | | | | 12,098,720 | |
Eurazeo SA | | | 984 | | | | 61,261 | |
SEE NOTES TO FINANCIAL STATEMENTS | 74 | |
December 31, 2022 |
Schedules of Investments, continued |
Impax Ellevate Global Women’s Leadership Fund, continued
Percent of Net Assets
Name of Issuer and
Title of Issue | | Shares/
Principal | | | Value | |
COMMON STOCKS, continued |
Financials, continued |
FactSet Research Systems, Inc. | | | 1,057 | | | $ | 424,079 | |
Fifth Third Bancorp | | | 17,742 | | | | 582,115 | |
FinecoBank Banca Fineco SpA | | | 13,605 | | | | 225,926 | |
First Republic Bank | | | 4,419 | | | | 538,632 | |
Gjensidige Forsikring ASA | | | 4,491 | | | | 88,086 | |
Globe Life, Inc. | | | 2,195 | | | | 264,607 | |
Goldman Sachs Group, Inc., The | | | 8,692 | | | | 2,984,659 | |
Groupe Bruxelles Lambert SA | | | 2,229 | | | | 178,136 | |
Hang Seng Bank, Ltd. | | | 25,700 | | | | 426,271 | |
Hargreaves Lansdown PLC | | | 7,876 | | | | 81,107 | |
Hartford Financial Services Group, Inc., The | | | 7,565 | | | | 573,654 | |
Hong Kong Exchanges and Clearing, Ltd. | | | 25,700 | | | | 1,104,335 | |
Huntington Bancshares, Inc. | | | 36,389 | | | | 513,085 | |
IGM Financial, Inc. | | | 2,000 | | | | 55,835 | |
Industrivarden AB, Class A | | | 3,010 | | | | 73,212 | |
Industrivarden AB, Class C | | | 3,539 | | | | 85,865 | |
Insurance Australia Group, Ltd. | | | 56,507 | | | | 181,651 | |
Intact Financial Corp. | | | 4,157 | | | | 598,405 | |
Intercontinental Exchange, Inc. | | | 13,597 | | | | 1,394,916 | |
Investor AB | | | 11,332 | | | | 210,828 | |
Investor AB, Class B | | | 41,079 | | | | 743,569 | |
JPMorgan Chase & Co. | | | 70,036 | | | | 9,391,829 | |
KeyCorp. | | | 23,692 | | | | 412,715 | |
Kinnevik AB, Class B (a) | | | 5,910 | | | | 81,346 | |
Legal & General Group PLC | | | 133,352 | | | | 399,807 | |
Lincoln National Corp. | | | 4,949 | | | | 152,033 | |
Lloyds Banking Group, PLC | | | 1,586,374 | | | | 865,705 | |
London Stock Exchange Group PLC | | | 8,534 | | | | 733,251 | |
M&G PLC | | | 59,449 | | | | 134,430 | |
Macquarie Group, Ltd. | | | 8,844 | | | | 998,385 | |
Manulife Financial Corp. | | | 44,732 | | | | 797,842 | |
Medibank Pvt, Ltd. | | | 63,602 | | | | 126,888 | |
Mediobanca Banca di Credito Finanziario SpA | | | 13,539 | | | | 130,097 | |
MetLife, Inc. | | | 16,673 | | | | 1,206,625 | |
Moody’s Corp. | | | 4,064 | | | | 1,132,312 | |
Nasdaq, Inc. | | | 8,810 | | | | 540,494 | |
National Australia Bank, Ltd. | | | 76,211 | | | | 1,547,358 | |
National Bank of Canada | | | 8,001 | | | | 539,092 | |
Percent of Net Assets
Name of Issuer and
Title of Issue | | Shares/
Principal | | | Value | |
COMMON STOCKS, continued |
Financials, continued |
NatWest Group PLC | | | 118,714 | | | $ | 378,606 | |
NN Group NV | | | 6,061 | | | | 247,848 | |
Nordea Bank Apb | | | 75,345 | | | | 807,092 | |
Onex Corp. | | | 1,856 | | | | 89,496 | |
PNC Financial Services Group, Inc., The | | | 10,349 | | | | 1,634,521 | |
Principal Financial Group, Inc. | | | 8,192 | | | | 687,473 | |
Progressive Corp., The | | | 17,437 | | | | 2,261,753 | |
Prudential Financial, Inc. | | | 9,300 | | | | 924,978 | |
QBE Insurance Group, Ltd. | | | 33,018 | | | | 299,529 | |
Royal Bank of Canada | | | 33,867 | | | | 3,184,098 | |
S&P Global, Inc. | | | 8,355 | | | | 2,798,424 | |
Schroders PLC | | | 16,409 | | | | 86,221 | |
Skandinaviska Enskilda Banken AB, Class A | | | 36,353 | | | | 418,527 | |
Societe Generale SA | | | 17,948 | | | | 450,201 | |
Standard Chartered PLC | | | 55,897 | | | | 416,909 | |
State Street Corp. | | | 8,446 | | | | 655,156 | |
Sun Life Financial, Inc. | | | 13,526 | | | | 627,850 | |
Suncorp Group, Ltd. | | | 28,380 | | | | 231,263 | |
Svenska Handelsbanken AB, Class A | | | 33,123 | | | | 333,482 | |
Swedbank AB, Class A | | | 19,351 | | | | 329,142 | |
T Rowe Price Group, Inc. | | | 5,841 | | | | 637,019 | |
Toronto-Dominion Bank, The | | | 42,540 | | | | 2,754,418 | |
Travelers Cos., Inc., The | | | 5,611 | | | | 1,052,006 | |
Tryg A/S | | | 8,027 | | | | 190,766 | |
U.S. Bancorp | | | 34,253 | | | | 1,493,773 | |
UBS Group AG | | | 77,913 | | | | 1,448,108 | |
UniCredit SpA | | | 44,684 | | | | 634,046 | |
Wendel SA | | | 52,835 | | | | 4,935,260 | |
Westpac Banking Corp. | | | 83,361 | | | | 1,319,730 | |
Willis Towers Watson PLC | | | 2,664 | | | | 651,561 | |
Zurich Insurance Group AG | | | 3,406 | | | | 1,628,331 | |
| | | | | | | | 139,993,897 | |
Health Care: 16.3% |
Abbott Laboratories | | | 39,865 | | | | 4,376,778 | |
AbbVie, Inc. | | | 40,305 | | | | 6,513,691 | |
Alcon, Inc. | | | 11,217 | | | | 769,699 | |
Alnylam Pharmaceuticals, Inc. (a) | | | 2,549 | | | | 605,770 | |
AmerisourceBergen Corp. | | | 3,709 | | | | 614,618 | |
AstraZeneca PLC | | | 34,559 | | | | 4,676,501 | |
Baxter International, Inc. | | | 13,100 | | | | 667,707 | |
Biogen, Inc. (a) | | | 3,600 | | | | 996,912 | |
Bristol-Myers Squibb Co. | | | 179,305 | | | | 12,900,995 | |
| | 75 | SEE NOTES TO FINANCIAL STATEMENTS |
December 31, 2022 |
Schedules of Investments, continued |
Impax Ellevate Global Women’s Leadership Fund, continued
Percent of Net Assets
Name of Issuer and
Title of Issue | | Shares/
Principal | | | Value | |
COMMON STOCKS, continued |
Health Care, continued |
Cardinal Health, Inc. | | | 147,898 | | | $ | 11,368,919 | |
Charles River Laboratories International, Inc. (a) | | | 1,208 | | | | 263,223 | |
Cigna Corp. | | | 7,300 | | | | 2,418,782 | |
CSL, Ltd. | | | 11,462 | | | | 2,235,023 | |
CVS Health Corp. | | | 32,401 | | | | 3,019,449 | |
DENTSPLY SIRONA, Inc. | | | 4,800 | | | | 152,832 | |
Elevance Health, Inc. | | | 26,412 | | | | 13,548,565 | |
Eli Lilly & Co. | | | 18,623 | | | | 6,813,038 | |
Exact Sciences Corp (a) | | | 3,480 | | | | 172,295 | |
Fresenius Medical Care AG & Co KGaA | | | 4,540 | | | | 148,288 | |
Genmab A/S (a) | | | 1,586 | | | | 670,553 | |
Gilead Sciences, Inc. | | | 37,199 | | | | 3,193,534 | |
GSK PLC | | | 88,430 | | | | 1,528,356 | |
Hologic, Inc. (a) | | | 5,777 | | | | 432,177 | |
Illumina, Inc. (a) | | | 4,008 | | | | 810,418 | |
Insulet Corp. (a) | | | 1,622 | | | | 477,501 | |
Ipsen SA | | | 908 | | | | 97,665 | |
Jazz Pharmaceuticals PLC (a) | | | 1,434 | | | | 228,451 | |
Johnson & Johnson | | | 60,362 | | | | 10,662,947 | |
Koninklijke Philips NV | | | 21,189 | | | | 318,835 | |
Lonza Group AG | | | 1,801 | | | | 884,067 | |
McKesson Corp. | | | 3,405 | | | | 1,277,284 | |
Merck & Co., Inc. | | | 57,402 | | | | 6,368,752 | |
Merck KGaA | | | 2,766 | | | | 533,673 | |
Novartis AG | | | 47,445 | | | | 4,293,650 | |
Novo Nordisk A/S, Class B | | | 35,045 | | | | 4,759,656 | |
Orion OYJ, Class B | | | 2,246 | | | | 123,132 | |
Pfizer, Inc. | | | 124,183 | | | | 6,363,137 | |
Quest Diagnostics, Inc. | | | 2,669 | | | | 417,538 | |
Ramsay Health Care, Ltd. | | | 4,273 | | | | 187,632 | |
Ryman Healthcare, Ltd. | | | 410 | | | | 1,387 | |
Sanofi | | | 23,951 | | | | 2,309,512 | |
Smith & Nephew PLC | | | 19,441 | | | | 259,631 | |
Stryker Corp. | | | 7,617 | | | | 1,862,280 | |
UCB SA | | | 2,863 | | | | 225,586 | |
Vertex Pharmaceuticals, Inc. (a) | | | 6,394 | | | | 1,846,459 | |
Waters Corp. (a) | | | 1,484 | | | | 508,389 | |
Zimmer Biomet Holdings, Inc. | | | 4,544 | | | | 579,360 | |
Zoetis, Inc. | | | 14,037 | | | | 2,057,122 | |
| | | | | | | | 125,541,769 | |
Industrials: 4.3% |
Adecco Group AG | | | 3,731 | | | | 122,731 | |
Aena SME SA (a) | | | 1,716 | | | | 215,115 | |
Percent of Net Assets
Name of Issuer and
Title of Issue | | Shares/
Principal | | | Value | |
COMMON STOCKS, continued |
Industrials, continued |
Aeroports de Paris (a) | | | 778 | | | $ | 104,230 | |
Air Canada (a) | | | 3,963 | | | | 56,752 | |
Alstom SA | | | 7,589 | | | | 185,677 | |
AP Moller - Maersk A/S | | | 68 | | | | 149,862 | |
AP Moller - Maersk A/S, Class B | | | 111 | | | | 248,485 | |
Assa Abloy AB, Class B | | | 23,269 | | | | 500,499 | |
Auckland International Airport, Ltd. (a) | | | 28,545 | | | | 141,572 | |
Booz Allen Hamilton Holding Corp. | | | 4,530 | | | | 473,476 | |
Brambles, Ltd. | | | 32,569 | | | | 267,085 | |
Bunzl PLC | | | 8,270 | | | | 275,144 | |
Bureau Veritas SA | | | 6,620 | | | | 174,463 | |
CAE, Inc. (a) | | | 8,000 | | | | 154,742 | |
Canadian National Railway Co. | | | 14,208 | | | | 1,687,750 | |
Cie de Saint-Gobain | | | 19,071 | | | | 932,969 | |
Cummins, Inc. | | | 3,503 | | | | 848,742 | |
Emerson Electric Co. | | | 13,500 | | | | 1,296,810 | |
Epiroc AB, Class A | | | 15,124 | | | | 275,395 | |
Epiroc AB, Class B | | | 8,758 | | | | 140,892 | |
Equifax, Inc. | | | 2,854 | | | | 554,703 | |
Experian PLC | | | 21,199 | | | | 717,975 | |
Getlink SE | | | 15,085 | | | | 241,558 | |
Legrand SA | | | 5,989 | | | | 480,208 | |
Otis Worldwide Corp. | | | 9,621 | | | | 753,421 | |
Qantas Airways, Ltd. (a) | | | 21,570 | | | | 87,309 | |
Randstad NV | | | 2,526 | | | | 154,345 | |
RELX PLC | | | 43,254 | | | | 1,195,888 | |
Republic Services, Inc. | | | 5,455 | | | | 703,640 | |
Ritchie Bros Auctioneers, Inc. | | | 3,124 | | | | 180,449 | |
Schneider Electric SE | | | 89,291 | | | | 12,539,543 | |
Skanska AB, Class B | | | 7,728 | | | | 122,508 | |
Smiths Group PLC | | | 8,315 | | | | 159,582 | |
Teleperformance | | | 1,276 | | | | 305,047 | |
Transurban Group | | | 73,013 | | | | 642,358 | |
United Parcel Service, Inc., Class B | | | 18,086 | | | | 3,144,069 | |
Verisk Analytics, Inc. | | | 3,822 | | | | 674,277 | |
Vestas Wind Systems A/S | | | 20,719 | | | | 604,387 | |
W.W. Grainger, Inc. | | | 1,200 | | | | 667,500 | |
Wartsila OYJ Abp | | | 10,813 | | | | 91,176 | |
Wolters Kluwer NV | | | 6,076 | | | | 635,764 | |
WSP Global, Inc. | | | 3,036 | | | | 352,234 | |
| | | | | | | | 33,260,332 | |
SEE NOTES TO FINANCIAL STATEMENTS | 76 | |
December 31, 2022 |
Schedules of Investments, continued |
Impax Ellevate Global Women’s Leadership Fund, continued
Percent of Net Assets
Name of Issuer and
Title of Issue | | Shares/
Principal | | | Value | |
COMMON STOCKS, continued |
Information Technology: 18.4% |
Accenture PLC, Class A | | | 51,755 | | | $ | 13,810,304 | |
Adobe, Inc. (a) | | | 10,924 | | | | 3,676,254 | |
Affirm Holdings, Inc. (a)(b) | | | 6,461 | | | | 62,478 | |
ANSYS, Inc. (a) | | | 2,171 | | | | 524,492 | |
Apple, Inc. | | | 232,391 | | | | 30,194,563 | |
Arista Networks, Inc. (a) | | | 6,445 | | | | 782,101 | |
Autodesk, Inc. (a) | | | 63,544 | | | | 11,874,467 | |
AVEVA Group PLC | | | 2,683 | | | | 103,851 | |
Block, Inc., Class A (a) | | | 12,805 | | | | 804,666 | |
Broadcom, Inc. | | | 9,203 | | | | 5,145,673 | |
Capgemini SE | | | 3,940 | | | | 658,673 | |
CDW Corp. | | | 3,219 | | | | 574,849 | |
Ceridian HCM Holding, Inc. (a) | | | 3,357 | | | | 215,352 | |
Cisco Systems, Inc. | | | 109,483 | | | | 5,215,770 | |
Dassault Systemes SE | | | 15,344 | | | | 551,765 | |
DocuSign,Inc. (a) | | | 3,945 | | | | 218,632 | |
Dropbox, Inc., Class A (a) | | | 6,933 | | | | 155,161 | |
F5, Inc. (a) | | | 1,531 | | | | 219,714 | |
Gen Digital, Inc. | | | 14,585 | | | | 312,557 | |
Halma PLC | | | 252,948 | | | | 6,023,941 | |
Hexagon AB, Class B | | | 45,972 | | | | 482,020 | |
HP, Inc. | | | 36,148 | | | | 971,297 | |
HubSpot, Inc. (a) | | | 1,141 | | | | 329,897 | |
Intel Corp. | | | 104,805 | | | | 2,769,996 | |
Intuit, Inc. | | | 6,420 | | | | 2,498,792 | |
Lam Research Corp. | | | 3,424 | | | | 1,439,107 | |
Microsoft Corp. | | | 109,639 | | | | 26,293,625 | |
Nokia OYJ | | | 127,301 | | | | 591,402 | |
Okta, Inc. (a) | | | 2,777 | | | | 189,752 | |
Palo Alto Networks, Inc. (a) | | | 8,000 | | | | 1,116,320 | |
PayPal Holdings, Inc. (a) | | | 28,374 | | | | 2,020,796 | |
Sage Group PLC, The | | | 23,956 | | | | 215,717 | |
salesforce.com, Inc. (a) | | | 27,719 | | | | 3,675,262 | |
SAP SE | | | 24,337 | | | | 2,512,568 | |
ServiceNow, Inc. (a) | | | 4,900 | | | | 1,902,523 | |
Texas Instruments, Inc. | | | 22,747 | | | | 3,758,259 | |
Trimble, Inc. (a) | | | 6,900 | | | | 348,864 | |
Twilio, Inc., Class A (a) | | | 4,234 | | | | 207,297 | |
Visa, Inc., Class A | | | 39,543 | | | | 8,215,454 | |
Western Union Co., The | | | 9,468 | | | | 130,374 | |
WiseTech Global, Ltd. | | | 3,633 | | | | 124,948 | |
Workday, Inc., Class A (a) | | | 4,478 | | | | 749,304 | |
Worldline SA (a) | | | 6,381 | | | | 249,896 | |
Xero, Ltd. (a) | | | 3,083 | | | | 147,009 | |
| | | | | | | | 142,065,742 | |
Percent of Net Assets
Name of Issuer and
Title of Issue | | Shares/
Principal | | | Value | |
COMMON STOCKS, continued |
Materials: 5.8% |
Air Liquide SA | | | 11,818 | | | $ | 1,677,391 | |
Akzo Nobel NV | | | 4,304 | | | | 288,809 | |
Arkema SA | | | 1,282 | | | | 115,309 | |
BASF SE | | | 21,230 | | | | 1,045,335 | |
BlueScope Steel, Ltd. | | | 14,643 | | | | 166,890 | |
Celanese Corp. | | | 112,821 | | | | 11,534,819 | |
Chr. Hansen Holding A/S | | | 2,009 | | | | 144,513 | |
Covestro AG | | | 4,474 | | | | 174,289 | |
Croda International PLC | | | 3,202 | | | | 254,811 | |
Dow, Inc. | | | 16,763 | | | | 844,688 | |
Ecolab, Inc. | | | 6,150 | | | | 895,194 | |
Evonik Industries AG | | | 4,835 | | | | 92,222 | |
Fortescue Metals Group, Ltd. | | | 36,414 | | | | 508,964 | |
Johnson Matthey PLC | | | 4,029 | | | | 102,970 | |
Koninklijke DSM NV | | | 94,958 | | | | 11,660,326 | |
Mondi PLC | | | 11,809 | | | | 199,701 | |
Newcrest Mining, Ltd. | | | 18,886 | | | | 264,825 | |
Newmont Corp. | | | 18,058 | | | | 852,338 | |
Norsk Hydro ASA | | | 30,383 | | | | 227,033 | |
Novozymes A/S, Class B | | | 5,203 | | | | 263,967 | |
Nutrien, Ltd. | | | 13,515 | | | | 986,675 | |
Orica, Ltd. | | | 9,733 | | | | 99,514 | |
Smurfit Kappa Group, PLC | | | 5,337 | | | | 197,791 | |
Solvay SA | | | 1,597 | | | | 161,466 | |
Stora Enso OYJ, Class R | | | 12,645 | | | | 178,288 | |
Yara International ASA | | | 267,526 | | | | 11,748,927 | |
| | | | | | | | 44,687,055 | |
Real Estate: 0.8% |
Azrieli Group, Ltd. | | | 978 | | | | 65,221 | |
British Land Co. PLC, The, REIT | | | 19,836 | | | | 94,177 | |
Canadian Apartment Properties, REIT | | | 2,126 | | | | 67,015 | |
CapitaLand Integrated Commercial Trust, REIT | | | 123,000 | | | | 187,601 | |
City Developments, Ltd. | | | 9,300 | | | | 57,170 | |
Covivio, REIT | | | 1,054 | | | | 62,564 | |
Dexus, REIT | | | 24,288 | | | | 127,514 | |
Essex Property Trust, Inc., REIT | | | 1,600 | | | | 339,072 | |
Gecina SA, REIT | | | 1,494 | | | | 152,209 | |
GPT Group, The, REIT | | | 45,356 | | | | 129,356 | |
Klepierre SA, REIT (a) | | | 4,815 | | | | 111,133 | |
Land Securities Group PLC, REIT | | | 15,699 | | | | 117,290 | |
LendLease Corp., Ltd. | | | 15,923 | | | | 84,521 | |
| | 77 | SEE NOTES TO FINANCIAL STATEMENTS |
December 31, 2022 |
Schedules of Investments, continued |
Impax Ellevate Global Women’s Leadership Fund, continued
Percent of Net Assets
Name of Issuer and
Title of Issue | | Shares/
Principal | | | Value | |
COMMON STOCKS, continued |
Real Estate, continued |
Link, REIT | | | 1,946 | | | $ | 14,240 | |
Mapletree Logistics Trust, REIT | | | 76,100 | | | | 90,491 | |
Mirvac Group, REIT | | | 92,303 | | | | 133,537 | |
Realty Income Corp., REIT | | | 13,475 | | | | 854,718 | |
RioCan Real Estate Investment Trust, REIT | | | 3,509 | | | | 54,760 | |
Scentre Group, REIT | | | 122,779 | | | | 238,997 | |
Stockland, REIT | | | 55,104 | | | | 135,713 | |
Swire Properties, Ltd. | | | 24,200 | | | | 61,296 | |
Unibail-Rodamco-Westfield, REIT (a) | | | 2,662 | | | | 139,159 | |
Ventas, Inc., REIT | | | 9,447 | | | | 425,587 | |
VICI Properties, Inc., REIT | | | 22,785 | | | | 738,233 | |
Vicinity, Ltd., REIT | | | 90,368 | | | | 122,024 | |
Vonovia SE | | | 17,115 | | | | 403,168 | |
Welltower, Inc., REIT | | | 11,380 | | | | 745,958 | |
Weyerhaeuser Co., REIT | | | 17,801 | | | | 551,831 | |
Zillow Group, Inc., Class C (a) | | | 4,117 | | | | 132,609 | |
| | | | | | | | 6,437,164 | |
Utilities: 5.1% |
American Water Works Co., Inc. | | | 78,678 | | | | 11,992,100 | |
Edison International | | | 182,644 | | | | 11,619,811 | |
EDP - Energias de Portugal SA | | | 58,856 | | | | 293,386 | |
Electricite de France SA | | | 12,414 | | | | 159,375 | |
Elia Group SA | | | 736 | | | | 104,632 | |
Enel SpA | | | 180,328 | | | | 969,830 | |
Hydro One, Ltd. | | | 7,850 | | | | 210,280 | |
Iberdrola SA | | | 130,112 | | | | 1,518,861 | |
Mercury NZ, Ltd. | | | 15,702 | | | | 55,471 | |
Meridian Energy, Ltd. | | | 40,047 | | | | 133,204 | |
Orsted A/S | | | 4,150 | | | | 375,183 | |
Red Electrica Corp. SA | | | 607,778 | | | | 10,568,138 | |
Severn Trent PLC | | | 5,715 | | | | 182,584 | |
SSE PLC | | | 23,875 | | | | 491,036 | |
Terna - Rete Elettrica Nazionale | | | 31,736 | | | | 234,376 | |
United Utilities Group PLC | | | 15,405 | | | | 184,064 | |
Veolia Environnement SA | | | 14,933 | | | | 383,695 | |
| | | | | | | | 39,476,026 | |
TOTAL COMMON STOCKS |
(Cost $693,147,166) | | | 765,071,100 | |
| | | | | | | | | |
Percent of Net Assets
Name of Issuer and
Title of Issue | | Shares/
Principal | | | Value | |
PREFERRED STOCKS: 0.0% (c) |
Consumer Staples: 0.0% (c) |
Henkel AG & Co. KGaA | | | 4,060 | | | $ | 281,410 | |
(Cost $346,022) |
| |
MONEY MARKET: 0.8% |
State Street Institutional U.S. Government Money Market Fund, 4.120% (d)(e) | | | 6,433,972 | | | | 6,433,972 | |
(Cost $6,433,972) |
| |
SECURITIES PURCHASED WITH CASH COLLATERAL FROM SECURITIES LENDING: 0.0% (c) |
State Street Navigator Securities Lending Government Money Market Portfolio, 4.333% (d)(e) | | | 231,470 | | | | 231,470 | |
(Cost $231,470) |
| | | | | | | | | |
TOTAL INVESTMENTS: 100.1% |
(Cost $700,158,630) | | | 772,017,952 | |
| | | | | | | | | |
PAYABLE UPON RETURN OF SECURITIES LOANED: 0.0% (c) | | | (231,470 | ) |
| | | | | | | | | |
Other assets and liabilities — (NET): -0.1% | | | (689,504 | ) |
| | | | | | | | | |
NET ASSETS: 100.0% | | $ | 771,096,978 | |
(a) | Non-income producing security. |
(b) | Security or partial position of this security was on loan as of December 31, 2022. The total market value of securities on loan as of December 31, 2022 was $359,169. |
(c) | Rounds to less than 0.05%. |
(d) | Rate shown represents annualized 7-day yield as of December 31, 2022. |
REIT - Real Estate Investment Trust
SEE NOTES TO FINANCIAL STATEMENTS | 78 | |
December 31, 2022 |
Schedules of Investments, continued |
Impax Ellevate Global Women’s Leadership Fund, continued
SUMMARY OF INVESTMENTS BY COUNTRY
Country | | Value | | | Percent Of
Net Assets | |
Australia | | $ | 20,440,362 | | | | 2.7 | % |
Belgium | | | 565,188 | | | | 0.1 | % |
Canada | | | 23,348,099 | | | | 3.0 | % |
Denmark | | | 7,693,792 | | | | 1.0 | % |
Finland | | | 983,998 | | | | 0.1 | % |
France | | | 42,768,915 | | | | 5.5 | % |
Germany | | | 11,171,577 | | | | 1.4 | % |
Hong Kong | | | 1,606,142 | | | | 0.2 | % |
Ireland | | | 197,791 | | | | 0.0 | % |
Israel | | | 644,581 | | | | 0.1 | % |
Italy | | | 2,873,139 | | | | 0.4 | % |
Japan | | | 406,814 | | | | 0.1 | % |
Netherlands | | | 14,550,431 | | | | 1.9 | % |
New Zealand | | | 683,001 | | | | 0.1 | % |
Norway | | | 36,394,154 | | | | 4.7 | % |
Poland | | | 199,701 | | | | 0.0 | % |
Portugal | | | 433,086 | | | | 0.1 | % |
Singapore | | | 713,891 | | | | 0.1 | % |
Spain | | | 14,948,195 | | | | 1.9 | % |
Sweden | | | 5,881,512 | | | | 0.8 | % |
Switzerland | | | 9,372,718 | | | | 1.2 | % |
United Kingdom | | | 61,466,019 | | | | 8.0 | % |
United States | | | 508,009,404 | | | | 65.9 | % |
Money Market | | | 6,433,972 | | | | 0.8 | % |
Other assets and liabilities (net) | | | (689,504 | ) | | | -0.1 | % |
TOTAL | | $ | 771,096,978 | | | | 100.0 | % |
| | 79 | SEE NOTES TO FINANCIAL STATEMENTS |
December 31, 2022 |
Schedules of Investments, continued |
Impax International Sustainable Economy Fund
Percent of Net Assets
Name of Issuer and
Title of Issue | | Shares/
Principal | | | Value | |
COMMON STOCKS: 99.0% |
Australia: 7.7% |
ANZ Group Holdings, Ltd. | | | 894,737 | | | $ | 14,413,242 | |
Aristocrat Leisure, Ltd. | | | 219,294 | | | | 4,518,730 | |
ASX, Ltd. (a) | | | 22,390 | | | | 1,031,198 | |
Brambles, Ltd. | | | 88,207 | | | | 723,351 | |
Cochlear, Ltd. | | | 6,088 | | | | 840,798 | |
Coles Group, Ltd. | | | 439,318 | | | | 4,979,945 | |
Commonwealth Bank of Australia | | | 192,858 | | | | 13,394,915 | |
Computershare, Ltd. | | | 258,624 | | | | 4,555,927 | |
Dexus, REIT | | | 459,425 | | | | 2,412,010 | |
Goodman Group, REIT | | | 6,465 | | | | 76,031 | |
Mineral Resources, Ltd. | | | 29,918 | | | | 1,569,392 | |
Mirvac Group, REIT | | | 78,032 | | | | 112,891 | |
QBE Insurance Group, Ltd. | | | 138,669 | | | | 1,257,962 | |
Ramsay Health Care, Ltd. | | | 13,589 | | | | 596,708 | |
REA Group, Ltd. (a) | | | 11,471 | | | | 862,694 | |
SEEK, Ltd. | | | 40,700 | | | | 578,621 | |
Telstra Corp., Ltd. | | | 1,999,308 | | | | 5,407,009 | |
Transurban Group | | | 673,806 | | | | 5,928,045 | |
Vicinity Centres, REIT | | | 371,712 | | | | 501,922 | |
| | | | | | | | 63,761,391 | |
Austria: 0.2% |
Verbund AG | | | 17,497 | | | | 1,470,794 | |
| | | | | | | | | |
Belgium: 0.9% |
KBC Group NV | | | 105,932 | | | | 6,820,461 | |
Solvay SA | | | 5,631 | | | | 569,328 | |
Umicore SA | | | 1,448 | | | | 53,257 | |
| | | | | | | | 7,443,046 | |
Chile: 0.2% |
Antofagasta PLC | | | 71,911 | | | | 1,342,406 | |
| | | | | | | | | |
Denmark: 3.2% |
AP Moller - Maersk A/S, Class B | | | 267 | | | | 597,707 | |
Genmab A/S (b) | | | 6 | | | | 2,537 | |
Novo Nordisk A/S, Class B | | | 170,792 | | | | 23,196,212 | |
Orsted A/S | | | 25,921 | | | | 2,343,404 | |
| | | | | | | | 26,139,860 | |
Finland: 1.0% |
Elisa OYJ | | | 12,991 | | | | 688,589 | |
Kesko Oyj, Class B | | | 3,159 | | | | 69,802 | |
Stora Enso OYJ, Class R | | | 16,308 | | | | 229,935 | |
UPM-Kymmene OYJ | | | 148,894 | | | | 5,571,814 | |
Wartsila OYJ Abp | | | 205,873 | | | | 1,735,931 | |
| | | | | | | | 8,296,071 | |
Percent of Net Assets
Name of Issuer and
Title of Issue | | Shares/
Principal | | | Value | |
COMMON STOCKS, continued |
France: 11.8% |
Air Liquide SA | | | 85,925 | | | $ | 12,195,789 | |
AXA SA | | | 212,300 | | | | 5,913,723 | |
BioMerieux | | | 102 | | | | 10,716 | |
BNP Paribas SA | | | 262,903 | | | | 14,969,469 | |
Bouygues SA (a) | | | 136,062 | | | | 4,080,738 | |
Bureau Veritas SA | | | 965 | | | | 25,432 | |
Carrefour SA | | | 87,413 | | | | 1,462,065 | |
Cie Generale des Etablissements Michelin SCA | | | 451,839 | | | | 12,587,001 | |
Danone SA | | | 73,738 | | | | 3,886,410 | |
Eiffage SA | | | 98,300 | | | | 9,669,184 | |
EssilorLuxottica SA | | | 12,461 | | | | 2,254,606 | |
Gecina SA, REIT | | | 546 | | | | 55,626 | |
L’Oreal SA | | | 10,949 | | | | 3,920,810 | |
Orange SA | | | 203,085 | | | | 2,015,033 | |
Schneider Electric SE | | | 87,178 | | | | 12,242,806 | |
SEB SA | | | 9 | | | | 755 | |
Societe Generale SA | | | 258,779 | | | | 6,491,118 | |
Teleperformance | | | 6,862 | | | | 1,640,465 | |
Unibail-Rodamco-Westfield, REIT (b) | | | 69,586 | | | | 3,637,688 | |
Valeo SA | | | 3,617 | | | | 64,628 | |
| | | | | | | | 97,124,062 | |
Germany: 8.1% |
Allianz SE | | | 72,718 | | | | 15,529,482 | |
Beiersdorf AG | | | 35 | | | | 4,000 | |
Brenntag SE | | | 59 | | | | 3,763 | |
Commerzbank AG (b) | | | 397,807 | | | | 3,719,342 | |
Deutsche Boerse AG | | | 35,198 | | | | 6,060,745 | |
HeidelbergCement AG | | | 95,204 | | | | 5,394,734 | |
HelloFresh SE (b) | | | 15,194 | | | | 331,607 | |
Henkel AG & Co. KGaA | | | 64 | | | | 4,113 | |
LEG Immobilien SE | | | 47,097 | | | | 3,071,605 | |
Merck KGaA | | | 71,011 | | | | 13,700,878 | |
Puma SE | | | 19,504 | | | | 1,178,886 | |
SAP SE | | | 175,216 | | | | 18,089,417 | |
| | | | | | | | 67,088,572 | |
Hong Kong: 3.6% |
AIA Group, Ltd. | | | 1,784,600 | | | | 19,708,018 | |
BOC Hong Kong Holdings, Ltd. | | | 310,057 | | | | 1,052,580 | |
Hang Seng Bank, Ltd. | | | 3,900 | | | | 64,687 | |
MTR Corp., Ltd. | | | 171,915 | | | | 909,233 | |
Prudential PLC | | | 296,834 | | | | 4,047,416 | |
Sino Land Co., Ltd. | | | 1,708,762 | | | | 2,131,313 | |
Swire Pacific, Ltd., Class A | | | 210,000 | | | | 1,840,835 | |
SEE NOTES TO FINANCIAL STATEMENTS | 80 | |
December 31, 2022 |
Schedules of Investments, continued |
Impax International Sustainable Economy Fund, continued
Percent of Net Assets
Name of Issuer and
Title of Issue | | Shares/
Principal | | | Value | |
COMMON STOCKS, continued |
Hong Kong, continued |
Swire Properties, Ltd. | | | 200 | | | $ | 507 | |
| | | | | | | | 29,754,589 | |
Ireland: 0.6% |
CRH PLC | | | 60,656 | | | | 2,412,298 | |
Kerry Group PLC, Class A | | | 561 | | | | 50,675 | |
Kingspan Group PLC | | | 44,928 | | | | 2,432,576 | |
| | | | | | | | 4,895,549 | |
Israel: 0.7% |
Bank Leumi Le-Israel BM | | | 689,832 | | | | 5,745,477 | |
| |
Italy: 2.1% |
Coca-Cola HBC AG (b) | | | 20,664 | | | | 488,472 | |
Enel SpA | | | 626,099 | | | | 3,367,249 | |
Intesa Sanpaolo SpA | | | 4,551,142 | | | | 10,082,640 | |
Prysmian SpA | | | 81,016 | | | | 3,010,190 | |
| | | | | | | | 16,948,551 | |
Japan: 21.4% |
Ajinomoto Co., Inc. | | | 41,500 | | | | 1,268,378 | |
Astellas Pharma, Inc. | | | 755,700 | | | | 11,490,892 | |
Azbil Corp. | | | 52,700 | | | | 1,323,152 | |
Bridgestone Corp. (a) | | | 298,000 | | | | 10,551,309 | |
Chugai Pharmaceutical Co., Ltd. | | | 136,100 | | | | 3,471,469 | |
Daifuku Co, Ltd. | | | 35,300 | | | | 1,645,479 | |
Dai-ichi Life Holdings, Inc. | | | 284,200 | | | | 6,418,194 | |
Daiichi Sankyo Co., Ltd. | | | 900 | | | | 28,968 | |
Denso Corp. | | | 15,600 | | | | 765,021 | |
Eisai Co., Ltd. | | | 48,800 | | | | 3,218,459 | |
FANUC Corp. | | | 46,700 | | | | 6,988,491 | |
FUJIFILM Holdings Corp | | | 300 | | | | 15,000 | |
Fujitsu, Ltd. | | | 22,100 | | | | 2,946,317 | |
Hankyu Hanshin Holdings, Inc. | | | 2,300 | | | | 68,143 | |
Hitachi Construction Machinery Co., Ltd. | | | 38,500 | | | | 858,028 | |
Hoya Corp. | | | 49,100 | | | | 4,702,725 | |
Hulic Co., Ltd. (a) | | | 154,800 | | | | 1,215,575 | |
Kajima Corp. | | | 774,300 | | | | 9,010,767 | |
Kao Corp. | | | 2,000 | | | | 79,401 | |
KDDI Corp. | | | 435,300 | | | | 13,201,293 | |
Keio Corp. | | | 200 | | | | 7,326 | |
Kikkoman Corp. | | | 18,900 | | | | 994,832 | |
Komatsu, Ltd. | | | 105,600 | | | | 2,282,450 | |
Kubota Corp. | | | 15,100 | | | | 206,288 | |
Lixil Corp. | | | 14,500 | | | | 218,603 | |
Mitsubishi Chemical Holdings Corp. | | | 149,200 | | | | 772,411 | |
Percent of Net Assets
Name of Issuer and
Title of Issue | | Shares/
Principal | | | Value | |
COMMON STOCKS, continued |
Japan, continued |
MS&AD Insurance Group Holdings, Inc. | | | 36,200 | | | $ | 1,157,308 | |
Murata Manufacturing Co., Ltd. | | | 127,200 | | | | 6,272,890 | |
Nintendo Co., Ltd. | | | 137,500 | | | | 5,781,404 | |
Nippon Express Holdings, Inc. (a) | | | 200 | | | | 11,422 | |
Nippon Paint Holdings Co., Ltd. (a) | | | 285,200 | | | | 2,239,987 | |
Nippon Yusen KK (a) | | | 92,500 | | | | 2,181,210 | |
Nitto Denko Corp. | | | 49,700 | | | | 2,862,456 | |
Nomura Research Institute, Ltd. | | | 71,100 | | | | 1,690,326 | |
NTT Data Corp. | | | 250,800 | | | | 3,654,841 | |
Obayashi Corp. | | �� | 476,300 | | | | 3,597,776 | |
Odakyu Electric Railway Co., Ltd. | | | 100 | | | | 1,295 | |
Omron Corp. | | | 62,400 | | | | 3,015,654 | |
Oriental Land Co., Ltd. | | | 40,000 | | | | 5,820,967 | |
Recruit Holdings Co, Ltd. | | | 152,600 | | | | 4,776,681 | |
Rohm Co., Ltd. | | | 30,200 | | | | 2,165,019 | |
SCSK Corp. | | | 39,700 | | | | 600,928 | |
Sekisui Chemical Co., Ltd. | | | 154,700 | | | | 2,156,255 | |
Sekisui House, Ltd. | | | 209,900 | | | | 3,721,328 | |
Shimizu Corp. | | | 54,800 | | | | 292,409 | |
Shionogi & Co., Ltd. | | | 32,300 | | | | 1,611,548 | |
SoftBank Corp. | | | 651,300 | | | | 7,368,589 | |
Sompo Holdings, Inc. | | | 28,700 | | | | 1,269,777 | |
Sumitomo Chemical Co., Ltd. | | | 132,300 | | | | 474,378 | |
Sumitomo Metal Mining Co., Ltd. | | | 300 | | | | 10,542 | |
Suntory Beverage & Food, Ltd. | | | 34,200 | | | | 1,164,585 | |
TDK Corp. | | | 46,900 | | | | 1,525,825 | |
Tobu Railway Co., Ltd. | | | 100 | | | | 2,333 | |
Tokyo Electron, Ltd. | | | 42,000 | | | | 12,340,804 | |
Tokyu Corp. | | | 4,800 | | | | 60,451 | |
TOTO, Ltd. | | | 31,000 | | | | 1,051,503 | |
West Japan Railway Co. | | | 200 | | | | 8,684 | |
Yamaha Corp. | | | 22,300 | | | | 827,504 | |
Yamaha Motor Co., Ltd. | | | 239,400 | | | | 5,410,742 | |
Yaskawa Electric Corp. | | | 78,700 | | | | 2,510,956 | |
Yokogawa Electric Corp. | | | 104,200 | | | | 1,653,755 | |
Z Holdings Corp. | | | 1,559,600 | | | | 3,895,126 | |
| | | | | | | | 176,936,229 | |
| | 81 | SEE NOTES TO FINANCIAL STATEMENTS |
December 31, 2022 |
Schedules of Investments, continued |
Impax International Sustainable Economy Fund, continued
Percent of Net Assets
Name of Issuer and
Title of Issue | | Shares/
Principal | | | Value | |
COMMON STOCKS, continued |
Netherlands: 4.1% |
Akzo Nobel NV | | | 52,117 | | | $ | 3,497,182 | |
ASML Holding NV | | | 42,247 | | | | 23,035,246 | |
Koninklijke Ahold Delhaize NV | | | 219,898 | | | | 6,322,345 | |
NN Group NV | | | 811 | | | | 33,164 | |
Prosus NV (b) | | | 13,824 | | | | 954,456 | |
Wolters Kluwer NV | | | 183 | | | | 19,148 | |
| | | | | | | | 33,861,541 | |
New Zealand: 0.2% |
Auckland International Airport, Ltd. (b) | | | 211,266 | | | | 1,047,792 | |
Fisher & Paykel Healthcare Corp., Ltd. | | | 17 | | | | 259 | |
Mercury NZ, Ltd. | | | 143,879 | | | | 508,287 | |
Spark New Zealand, Ltd. | | | 113,446 | | | | 388,413 | |
| | | | | | | | 1,944,751 | |
Norway: 0.8% |
DNB Bank ASA | | | 9,240 | | | | 182,491 | |
Mowi ASA | | | 6,156 | | | | 104,900 | |
Norsk Hydro ASA | | | 522,729 | | | | 3,906,021 | |
Orkla ASA | | | 62,229 | | | | 449,127 | |
Telenor ASA | | | 216,126 | | | | 2,019,259 | |
| | | | | | | | 6,661,798 | |
Poland: 0.1% |
Mondi PLC | | | 68,437 | | | | 1,157,331 | |
| | | | | | | | | |
Portugal: 0.0% (c) |
Jeronimo Martins SGPS SA | | | 152 | | | | 3,289 | |
| | | | | | | | | |
Singapore: 1.5% |
CapitaLand Integrated Commercial Trust, REIT | | | 202,511 | | | | 308,872 | |
CapitaLand Investment, Ltd. | | | 2,480,726 | | | | 6,855,965 | |
City Developments, Ltd. | | | 653,100 | | | | 4,014,814 | |
Keppel Corp., Ltd. | | | 132,800 | | | | 720,198 | |
Singapore Exchange, Ltd. | | | 93,200 | | | | 623,217 | |
UOL Group, Ltd. | | | 30,200 | | | | 151,839 | |
| | | | | | | | 12,674,905 | |
South Korea: 0.0% (c) |
Delivery Hero SE (b) | | | 34 | | | | 1,632 | |
| | | | | | | | | |
Spain: 2.6% |
Banco Bilbao Vizcaya Argentaria SA | | | 1,431,674 | | | | 8,623,352 | |
Iberdrola SA | | | 956,389 | | | | 11,164,396 | |
Red Electrica Corp. SA (a) | | | 103,042 | | | | 1,791,710 | |
| | | | | | | | 21,579,458 | |
Percent of Net Assets
Name of Issuer and
Title of Issue | | Shares/
Principal | | | Value | |
COMMON STOCKS, continued |
Sweden: 3.2% |
Assa Abloy AB, Class B | | | 206,495 | | | $ | 4,441,553 | |
Atlas Copco AB, Class A | | | 587,871 | | | | 6,965,327 | |
Atlas Copco AB, Class B | | | 428,447 | | | | 4,571,380 | |
Boliden AB | | | 558 | | | | 20,960 | |
Electrolux AB, Class B (a) | | | 23,712 | | | | 320,371 | |
Epiroc AB, Class A | | | 536 | | | | 9,760 | |
Epiroc AB, Class B | | | 611 | | | | 9,829 | |
Holmen AB, Class B | | | 117 | | | | 4,650 | |
Husqvarna AB, Class B (a) | | | 192,166 | | | | 1,349,664 | |
Nibe Industrier AB, Class B | | | 419,296 | | | | 3,913,614 | |
Sandvik AB | | | 130,260 | | | | 2,354,005 | |
Svenska Cellulosa AB SCA, Class B | | | 22,459 | | | | 284,436 | |
Tele2 AB, Class B | | | 36,489 | | | | 297,671 | |
Telefonaktiebolaget LM Ericsson, Class B | | | 92,056 | | | | 539,394 | |
Telia Company AB (a) | | | 569,215 | | | | 1,454,497 | |
| | | | | | | | 26,537,111 | |
Switzerland: 10.0% |
ABB, Ltd. | | | 309,255 | | | | 9,425,320 | |
Chocoladefabriken Lindt & Spruengli AG-PC | | | 121 | | | | 1,232,995 | |
Chocoladefabriken Lindt & Spruengli AG-Reg | | | 36 | | | | 3,703,805 | |
Geberit AG | | | 1,549 | | | | 731,252 | |
Givaudan SA | | | 670 | | | | 2,052,147 | |
Kuehne & Nagel International AG | | | 10,897 | | | | 2,533,362 | |
Lonza Group AG | | | 11,337 | | | | 5,565,054 | |
Roche Holding AG | | | 73,475 | | | | 23,088,589 | |
SGS SA | | | 1,120 | | | | 2,608,859 | |
Sika AG | | | 30,158 | | | | 7,250,080 | |
Sonova Holding AG | | | 15,668 | | | | 3,721,128 | |
Straumann Holding AG | | | 63,832 | | | | 7,319,686 | |
Swiss Life Holding AG | | | 6,477 | | | | 3,338,626 | |
Swiss Re AG | | | 104,256 | | | | 9,748,079 | |
| | | | | | | | 82,318,982 | |
United Kingdom: 15.0% |
Ashtead Group PLC | | | 21,082 | | | | 1,197,558 | |
Associated British Foods PLC | | | 70,064 | | | | 1,328,327 | |
AstraZeneca PLC | | | 177,718 | | | | 24,048,685 | |
BT Group PLC | | | 1,928,670 | | | | 2,604,233 | |
Bunzl PLC | | | 3,999 | | | | 133,047 | |
CNH Industrial NV | | | 240,571 | | | | 3,859,238 | |
GSK PLC | | | 627,405 | | | | 10,843,587 | |
HSBC Holdings PLC | | | 3,063,508 | | | | 18,986,196 | |
SEE NOTES TO FINANCIAL STATEMENTS | 82 | |
December 31, 2022 |
Schedules of Investments, continued |
Impax International Sustainable Economy Fund, continued
Percent of Net Assets
Name of Issuer and
Title of Issue | | Shares/
Principal | | | Value | |
COMMON STOCKS, continued |
United Kingdom, continued |
Informa PLC | | | 141,652 | | | $ | 1,056,690 | |
J Sainsbury PLC | | | 465,957 | | | | 1,222,120 | |
Kingfisher PLC | | | 8,451 | | | | 24,011 | |
Legal & General Group PLC | | | 1,843,265 | | | | 5,526,352 | |
Lloyds Banking Group, PLC | | | 9,136,744 | | | | 4,986,038 | |
Next PLC | | | 4,376 | | | | 306,629 | |
Ocado Group PLC (b) | | | 227 | | | | 1,685 | |
Persimmon PLC | | | 110,995 | | | | 1,627,477 | |
Reckitt Benckiser Group PLC | | | 62,744 | | | | 4,349,183 | |
RELX PLC | | | 407,594 | | | | 11,269,170 | |
Rentokil Initial, PLC | | | 296,173 | | | | 1,819,617 | |
Schroders PLC | | | 15,503 | | | | 81,460 | |
Segro PLC, REIT | | | 105,524 | | | | 972,114 | |
Spirax-Sarco Engineering, PLC | | | 23,703 | | | | 3,027,596 | |
St James’s Place, PLC | | | 200,006 | | | | 2,634,751 | |
Tesco PLC | | | 1,934,321 | | | | 5,212,738 | |
Unilever PLC | | | 230,223 | | | | 11,623,456 | |
Vodafone Group PLC | | | 5,332,473 | | | | 5,400,286 | |
| | | | | | | | 124,142,244 | |
Total Common Stocks |
(Cost $783,739,500) | | | 817,829,639 | |
| | | | | | | | | |
PREFERRED STOCKS: 0.1% |
Germany: 0.1% |
Henkel AG & Co. KGaA | | | 6,074 | | | | 421,005 | |
(Cost $582,317) |
| |
MONEY MARKET: 0.5% |
State Street Institutional U.S. Government Money Market Fund, 4.120% (d)(e) | | | 4,112,932 | | | | 4,112,932 | |
(Cost $4,112,932) |
| | | | | | | | | |
Percent of Net Assets
Name of Issuer and
Title of Issue | | Shares/
Principal | | | Value | |
SECURITIES PURCHASED WITH CASH COLLATERAL FROM SECURITIES LENDING: 0.6% |
State Street Navigator Securities Lending Government Money Market Portfolio, 4.333% (d)(e) | | | 5,213,817 | | | $ | 5,213,817 | |
(Cost $5,213,817) |
| | | | | | | | | |
TOTAL INVESTMENTS: 100.2% |
(Cost $793,648,566) | | | 827,577,393 | |
| | | | | | | | | |
PAYABLE UPON RETURN OF SECURITIES LOANED (NET):- 0.6% | | | (5,213,817 | ) |
| | | | | | | | | |
Other assets and liabilities — (NET): 0.4% | | | 3,521,316 | |
| | | | | | | | | |
NET ASSETS: 100.0% | | $ | 825,884,892 | |
(a) | Security or partial position of this security was on loan as of December 31, 2022. The total market value of securities on loan as of December 31, 2022 was $18,582,768. |
(b) | Non-income producing security. |
(c) | Rounds to less than 0.05% |
(d) | Rate shown represents annualized 7-day yield as of December 31, 2022 |
REIT - Real Estate Investment Trust
SUMMARY OF INVESTMENTS BY SECTOR
Sector | | Value | | | Percent Of
Net Assets | |
Communication Services | | $ | 53,019,407 | | | | 6.4 | % |
Consumer Discretionary | | | 50,837,701 | | | | 6.2 | % |
Consumer Staples | | | 54,680,067 | | | | 6.7 | % |
Financials | | | 193,911,482 | | | | 23.5 | % |
Health Care | | | 139,713,503 | | | | 16.9 | % |
Industrials | | | 140,787,004 | | | | 17.0 | % |
Information Technology | | | 83,424,499 | | | | 10.1 | % |
Materials | | | 53,871,535 | | | | 6.5 | % |
Real Estate | | | 27,359,606 | | | | 3.3 | % |
Utilities | | | 20,645,840 | | | | 2.5 | % |
Money Market | | | 4,112,932 | | | | 0.5 | % |
Other assets and liabilities (net) | | | 3,521,316 | | | | 0.4 | % |
Total | | $ | 825,884,892 | | | | 100.0 | % |
| | 83 | SEE NOTES TO FINANCIAL STATEMENTS |
December 31, 2022 |
Schedules of Investments, continued |
Impax Core Bond Fund
Percent of Net Assets
Name of Issuer and
Title of Issue | | Shares/
Principal | | | Value | |
BONDS: 98.8% |
Community Investment Notes: 0.1% |
CEI Investment Note, 2.000%, 11/03/23 (a)(b) | | $ | 304,521 | | | $ | 304,521 | |
Envest Microfinance Fund, LLC, 4.000%, 04/20/26 (a) | | | 250,000 | | | | 240,088 | |
Envest Microfinance Fund, LLC, 4.380%, 10/25/23 (a)(b) | | | 150,000 | | | | 150,000 | |
(Cost $704,521) | | | 694,609 | |
| | | | | | | | | |
CORPORATE BONDS: 37.1% |
Communication Services: 2.9% |
Alphabet, Inc., 1.900%, 08/15/40 | | | 700,000 | | | | 467,256 | |
Altice France Holding SA, 144A, 10.500%, 05/15/27 (c) | | | 1,000,000 | | | | 764,650 | |
AT&T, Inc., 0.900%, 03/25/24 | | | 1,500,000 | | | | 1,425,137 | |
AT&T, Inc., 4.300%, 02/15/30 | | | 1,000,000 | | | | 943,964 | |
AT&T, Inc., 2.750%, 06/01/31 | | | 2,000,000 | | | | 1,662,467 | |
AT&T, Inc., 3.500%, 09/15/53 | | | 1,000,000 | | | | 679,435 | |
CCO Holdings, LLC/Capital Corp., 144A, 4.750%, 03/01/30 (c) | | | 1,000,000 | | | | 864,700 | |
Charter Communications Operating, LLC/Capital, 5.050%, 03/30/29 | | | 1,000,000 | | | | 942,898 | |
Cogent Communications Group, Inc., 144A, 7.000%, 06/15/27 (c) | | | 1,000,000 | | | | 981,178 | |
Discovery Communications, LLC, 3.950%, 03/20/28 | | | 1,500,000 | | | | 1,333,929 | |
Level 3 Financing, Inc., 144A, 3.750%, 07/15/29 (c) | | | 1,000,000 | | | | 720,700 | |
Level 3 Financing, Inc., 144A, 3.875%, 11/15/29 (c) | | | 1,000,000 | | | | 790,935 | |
Sprint Corp., 7.875%, 09/15/23 | | | 2,000,000 | | | | 2,032,372 | |
T-Mobile USA, Inc., 4.750%, 02/01/28 | | | 1,000,000 | | | | 974,493 | |
T-Mobile USA, Inc., 3.500%, 04/15/31 | | | 1,500,000 | | | | 1,298,587 | |
Percent of Net Assets
Name of Issuer and
Title of Issue | | Shares/
Principal | | | Value | |
BONDS, continued |
CORPORATE BONDS, continued |
Communication Services, continued |
T-Mobile USA, Inc., 3.000%, 02/15/41 | | $ | 1,000,000 | | | $ | 709,413 | |
Verizon Communications, Inc., 2.355%, 03/15/32 | | | 1,011,000 | | | | 804,096 | |
Verizon Communications, Inc., 3.400%, 03/22/41 | | | 1,500,000 | | | | 1,133,787 | |
Verizon Communications, Inc., 3.875%, 03/01/52 (d) | | | 1,000,000 | | | | 763,282 | |
Walt Disney Co., The, 3.350%, 03/24/25 | | | 1,000,000 | | | | 969,441 | |
Warnermedia Holdings, Inc., 144A, 3.638%, 03/15/25 (c) | | | 1,750,000 | | | | 1,665,622 | |
Warnermedia Holdings, Inc., 144A, 4.054%, 03/15/29 (c) | | | 1,000,000 | | | | 867,040 | |
| | | | | | | | 22,795,382 | |
Consumer Discretionary: 3.0% |
Amazon.com, Inc., 2.730%, 04/13/24 | | | 500,000 | | | | 487,380 | |
Amazon.com, Inc., 3.450%, 04/13/29 | | | 2,500,000 | | | | 2,340,578 | |
Amazon.com, Inc., 2.875%, 05/12/41 | | | 800,000 | | | | 600,135 | |
Amazon.com, Inc., 2.500%, 06/03/50 | | | 1,000,000 | | | | 634,783 | |
American Museum of Natural History, The, 3.121%, 07/15/52 | | | 750,000 | | | | 491,789 | |
American University, The, 3.672%, 04/01/49 | | | 1,000,000 | | | | 771,516 | |
Aptiv, PLC/Corp., 3.250%, 03/01/32 | | | 750,000 | | | | 615,425 | |
California Endowment, The, 2.498%, 04/01/51 | | | 1,000,000 | | | | 619,514 | |
Doris Duke Charitable Foundation, The, 2.345%, 07/01/50 | | | 2,000,000 | | | | 1,179,057 | |
Expedia Group, Inc., 144A, 6.250%, 05/01/25 (c) | | | 1,000,000 | | | | 1,009,288 | |
Ford Foundation, The, 2.415%, 06/01/50 | | | 750,000 | | | | 475,283 | |
SEE NOTES TO FINANCIAL STATEMENTS | 84 | |
December 31, 2022 |
Schedules of Investments, continued |
Impax Core Bond Fund, continued
Percent of Net Assets
Name of Issuer and
Title of Issue | | Shares/
Principal | | | Value | |
BONDS, continued |
CORPORATE BONDS, continued |
Consumer Discretionary, continued |
Ford Motor Co., 3.250%, 02/12/32 | | $ | 2,350,000 | | | $ | 1,766,545 | |
Ford Motor Co., 4.750%, 01/15/43 | | | 1,000,000 | | | | 720,048 | |
Ford Motor Credit Co., LLC, 4.950%, 05/28/27 | | | 500,000 | | | | 467,385 | |
General Motors Co., 5.400%, 10/15/29 | | | 1,000,000 | | | | 956,519 | |
Home Depot Inc., The, 4.500%, 09/15/32 (d) | | | 1,000,000 | | | | 979,569 | |
Home Depot, Inc., The, 2.875%, 04/15/27 | | | 750,000 | | | | 700,691 | |
IHO Verwaltungs GmbH, 144A, 6.375%, 05/15/29 (c) | | | 1,000,000 | | | | 846,825 | |
Local Initiatives Support Corp., 1.000%, 11/15/25 (a) | | | 1,000,000 | | | | 883,312 | |
Lowe’s Cos., Inc., 5.000%, 04/15/33 (d) | | | 1,000,000 | | | | 979,448 | |
Lowe’s Cos., Inc., 2.800%, 09/15/41 | | | 750,000 | | | | 513,214 | |
Lowe’s Cos., Inc., 3.000%, 10/15/50 (d) | | | 250,000 | | | | 160,106 | |
Macy’s Retail Holdings, LLC, 5.125%, 01/15/42 | | | 1,000,000 | | | | 655,230 | |
Massachusetts Institute of Technology, 3.067%, 04/01/52 | | | 700,000 | | | | 516,241 | |
Nature Conservancy, The, 1.861%, 07/01/33 | | | 266,000 | | | | 198,339 | |
Nature Conservancy, The, 3.957%, 03/01/52 | | | 750,000 | | | | 600,676 | |
Starbucks Corp., 2.250%, 03/12/30 | | | 1,000,000 | | | | 832,979 | |
Starbucks Corp., 4.450%, 08/15/49 | | | 2,000,000 | | | | 1,710,200 | |
Whirlpool Corp., 2.400%, 05/15/31 | | | 1,000,000 | | | | 794,524 | |
WK Kellogg Foundation Trust, 144A, 2.443%, 10/01/50 (c) | | | 1,000,000 | | | | 607,166 | |
| | | | | | | | 24,113,765 | |
Percent of Net Assets
Name of Issuer and
Title of Issue | | Shares/
Principal | | | Value | |
BONDS, continued |
CORPORATE BONDS, continued |
Consumer Staples: 2.5% |
Albertsons Cos., Inc./Safeway, Inc./New Albertsons, LP/Albertsons, LLC, 144A, 3.250%, 03/15/26 (c) | | $ | 1,000,000 | | | $ | 913,630 | |
Albertsons Cos., Inc./Safeway, Inc./New Albertsons, LP/Albertsons, LLC, 144A, 4.625%, 01/15/27 (c) | | | 1,000,000 | | | | 931,070 | |
Campbell Soup Co., 2.375%, 04/24/30 | | | 1,000,000 | | | | 834,438 | |
Capital Impact Partners, 2.300%, 10/15/24 (a) | | | 500,000 | | | | 459,396 | |
Clorox Co., The, 1.800%, 05/15/30 | | | 1,500,000 | | | | 1,197,594 | |
CVS Health Corp., 4.300%, 03/25/28 | | | 219,000 | | | | 212,234 | |
CVS Health Corp., 2.125%, 09/15/31 | | | 2,000,000 | | | | 1,590,837 | |
CVS Health Corp., 5.125%, 07/20/45 | | | 1,000,000 | | | | 916,293 | |
CVS Health Corp., 5.050%, 03/25/48 | | | 1,000,000 | | | | 902,635 | |
Darling Ingredients, Inc., 144A, 6.000%, 06/15/30 (c) | | | 1,500,000 | | | | 1,468,276 | |
General Mills, Inc., 2.875%, 04/15/30 | | | 1,000,000 | | | | 866,236 | |
General Mills, Inc., 2.250%, 10/14/31 | | | 750,000 | | | | 605,168 | |
Kellogg Co., 2.100%, 06/01/30 | | | 1,000,000 | | | | 815,285 | |
Keurig Dr Pepper, Inc., 0.750%, 03/15/24 | | | 1,000,000 | | | | 949,719 | |
Keurig Dr Pepper, Inc., 3.200%, 05/01/30 | | | 1,000,000 | | | | 873,761 | |
Keurig Dr Pepper, Inc., 4.050%, 04/15/32 | | | 1,250,000 | | | | 1,140,651 | |
Keurig Dr Pepper, Inc., 3.350%, 03/15/51 | | | 250,000 | | | | 172,819 | |
Kraft Heinz Foods Co., 4.250%, 03/01/31 | | | 1,000,000 | | | | 937,620 | |
| | 85 | SEE NOTES TO FINANCIAL STATEMENTS |
December 31, 2022 |
Schedules of Investments, continued |
Impax Core Bond Fund, continued
Percent of Net Assets
Name of Issuer and
Title of Issue | | Shares/
Principal | | | Value | |
BONDS, continued |
CORPORATE BONDS, continued |
Consumer Staples, continued |
Kraft Heinz Foods Co., 4.375%, 06/01/46 | | $ | 1,000,000 | | | $ | 817,191 | |
PepsiCo., Inc., 3.900%, 07/18/32 | | | 1,000,000 | | | | 945,975 | |
PepsiCo., Inc., 2.875%, 10/15/49 | | | 1,000,000 | | | | 719,468 | |
Raza Development Fund, Inc., 3.534%, 07/01/34 | | | 1,000,000 | | | | 840,636 | |
Sysco Corp., 5.950%, 04/01/30 | | | 995,000 | | | | 1,032,232 | |
| | | | | | | | 20,143,164 | |
Energy: 0.2% |
MidAmerican Energy Co., 3.100%, 05/01/27 | | | 1,000,000 | | | | 937,982 | |
MidAmerican Energy Co., 3.650%, 04/15/29 | | | 1,000,000 | | | | 937,118 | |
| | | | | | | | 1,875,100 | |
Financials: 11.4% |
Aflac, Inc., 1.125%, 03/15/26 | | | 1,500,000 | | | | 1,330,659 | |
Aflac, Inc., 3.600%, 04/01/30 | | | 1,000,000 | | | | 907,472 | |
Allstate Corp., The, 1.450%, 12/15/30 | | | 2,000,000 | | | | 1,536,445 | |
Allstate Corp., The, 3.850%, 08/10/49 | | | 1,000,000 | | | | 778,961 | |
Assured Guaranty US Holdings, Inc., 3.150%, 06/15/31 | | | 1,000,000 | | | | 844,168 | |
Astrazeneca Finance, LLC, 1.750%, 05/28/28 | | | 1,000,000 | | | | 860,154 | |
Bank of America Corp., 1.486%, 05/19/24 (e) | | | 1,650,000 | | | | 1,624,371 | |
Bank of America Corp., 0.981%, 09/25/25 (e) | | | 2,000,000 | | | | 1,842,032 | |
Bank of America Corp., 3.559%, 04/23/27 (e) | | | 1,000,000 | | | | 938,066 | |
Bank of America Corp., 6.204%, 11/10/28 (e) | | | 2,000,000 | | | | 2,068,537 | |
Bank of America Corp., 2.572%, 10/20/32 (e) | | | 1,000,000 | | | | 785,682 | |
Bank of America Corp., 4.083%, 03/20/51 (e) | | | 1,000,000 | | | | 787,414 | |
Bank of Montreal, 1.250%, 09/15/26 | | | 2,000,000 | | | | 1,750,109 | |
Percent of Net Assets
Name of Issuer and
Title of Issue | | Shares/
Principal | | | Value | |
BONDS, continued |
CORPORATE BONDS, continued |
Financials, continued |
Bank of New York Mellon Corp., The, 3.400%, 01/29/28 | | $ | 1,000,000 | | | $ | 930,938 | |
Bank of New York Mellon Corp., The, 5.834%, 10/25/33 (e) | | | 1,000,000 | | | | 1,039,826 | |
BlueHub Loan Fund, Inc., 2.890%, 01/01/27 | | | 1,000,000 | | | | 872,698 | |
BNG Bank NV, 144A, 0.500%, 11/24/25 (c) | | | 250,000 | | | | 223,529 | |
Calvert Impact Capital, Inc., 3.000%, 03/14/25 (a) | | | 1,000,000 | | | | 1,028,380 | |
Century Housing Corp., 0.950%, 02/15/23 | | | 1,000,000 | | | | 994,705 | |
Chubb INA Holdings, Inc., 1.375%, 09/15/30 (d) | | | 2,000,000 | | | | 1,557,101 | |
Chubb INA Holdings, Inc., 2.850%, 12/15/51 (d) | | | 250,000 | | | | 166,387 | |
Citigroup, Inc., 1.281%, 11/03/25 (e) | | | 1,500,000 | | | | 1,383,173 | |
Citigroup, Inc., 2.014%, 01/25/26 (e) | | | 2,000,000 | | | | 1,855,060 | |
Goldman Sachs Group Inc., The, 0.855%, 02/12/26 (e) | | | 2,500,000 | | | | 2,262,478 | |
Goldman Sachs Group, Inc., The, 3.210%, 04/22/42 (e) | | | 750,000 | | | | 543,102 | |
ING Groep NV, 3.869%, 03/28/26 (e) | | | 1,500,000 | | | | 1,444,667 | |
JPMorgan Chase & Co., 0.653%, 09/16/24 (e) | | | 3,000,000 | | | | 2,893,867 | |
JPMorgan Chase & Co., 0.563%, 02/16/25 (e) | | | 2,000,000 | | | | 1,887,014 | |
JPMorgan Chase & Co., 0.768%, 08/09/25 (e) | | | 2,000,000 | | | | 1,847,086 | |
JPMorgan Chase & Co., 2.947%, 02/24/28 (e) | | | 1,000,000 | | | | 906,037 | |
JPMorgan Chase & Co., 3.964%, 11/15/48 (e) | | | 1,000,000 | | | | 784,693 | |
Kreditanstalt fuer Wiederaufbau, 2.625%, 02/28/24 | | | 5,000,000 | | | | 4,879,582 | |
SEE NOTES TO FINANCIAL STATEMENTS | 86 | |
December 31, 2022 |
Schedules of Investments, continued |
Impax Core Bond Fund, continued
Percent of Net Assets
Name of Issuer and
Title of Issue | | Shares/
Principal | | | Value | |
BONDS, continued |
CORPORATE BONDS, continued |
Financials, continued |
Kreditanstalt fuer Wiederaufbau, 0.500%, 09/20/24 (d) | | $ | 1,000,000 | | | $ | 932,427 | |
Kreditanstalt fuer Wiederaufbau, 2.000%, 05/02/25 | | | 3,000,000 | | | | 2,841,250 | |
Kreditanstalt fuer Wiederaufbau, 3.125%, 06/10/25 | | | 2,000,000 | | | | 1,942,492 | |
Kreditanstalt fuer Wiederaufbau, 0.375%, 07/18/25 | | | 1,000,000 | | | | 904,889 | |
Kreditanstalt fuer Wiederaufbau, 0.625%, 01/22/26 | | | 5,000,000 | | | | 4,480,586 | |
Kreditanstalt fuer Wiederaufbau, 1.000%, 10/01/26 (d) | | | 1,500,000 | | | | 1,333,917 | |
Kreditanstalt fuer Wiederaufbau, 1.750%, 09/14/29 | | | 4,000,000 | | | | 3,457,611 | |
MetLife, Inc., 4.875%, 11/13/43 | | | 1,000,000 | | | | 939,328 | |
Metropolitan Life Global Funding I, 144A, 0.950%, 07/02/25 (c)(d) | | | 3,000,000 | | | | 2,720,773 | |
Morgan Stanley, 4.602%, 11/10/23 (e) | | | 3,000,000 | | | | 2,992,046 | |
Morgan Stanley, 3.625%, 01/20/27 | | | 2,000,000 | | | | 1,888,941 | |
Morgan Stanley, 4.457%, 04/22/39 (e) | | | 1,000,000 | | | | 881,791 | |
Morgan Stanley, 6.375%, 07/24/42 | | | 1,000,000 | | | | 1,089,835 | |
National Bank of Canada, 0.550%, 11/15/24 (d)(e) | | | 1,600,000 | | | | 1,531,906 | |
NatWest Group, PLC, 2.359%, 05/22/24 (e) | | | 2,000,000 | | | | 1,971,665 | |
OneMain Finance Corp., 3.500%, 01/15/27 | | | 1,000,000 | | | | 829,220 | |
PNC Financial Services Group Inc., The, 1.150%, 08/13/26 | | | 1,000,000 | | | | 879,042 | |
Percent of Net Assets
Name of Issuer and
Title of Issue | | Shares/
Principal | | | Value | |
BONDS, continued |
CORPORATE BONDS, continued |
Financials, continued |
PNC Financial Services Group, Inc., The, 3.450%, 04/23/29 | | $ | 500,000 | | | $ | 458,093 | |
Progressive Corp., The, 3.200%, 03/26/30 | | | 1,500,000 | | | | 1,349,657 | |
Prudential Financial, Inc., 1.500%, 03/10/26 | | | 250,000 | | | | 225,381 | |
Prudential Financial, Inc., 4.350%, 02/25/50 | | | 1,000,000 | | | | 852,066 | |
Royal Bank of Canada, 3.970%, 07/26/24 | | | 1,000,000 | | | | 986,070 | |
Royal Bank of Canada, 1.150%, 06/10/25 | | | 2,000,000 | | | | 1,832,461 | |
Sumitomo Mitsui Financial Group, Inc., 0.508%, 01/12/24 | | | 2,000,000 | | | | 1,904,754 | |
Toronto-Dominion Bank, The, 2.650%, 06/12/24 | | | 1,000,000 | | | | 967,922 | |
Toronto-Dominion Bank, The, 2.800%, 03/10/27 | | | 750,000 | | | | 688,936 | |
Toronto-Dominion Bank, The, 4.456%, 06/08/32 | | | 800,000 | | | | 764,948 | |
Travelers Cos, Inc., The, 4.100%, 03/04/49 | | | 1,000,000 | | | | 818,908 | |
Travelers Cos. Inc., The, 6.250%, 06/15/37 | | | 1,000,000 | | | | 1,084,574 | |
Truist Financial Corp., 1.267%, 03/02/27 (e) | | | 2,500,000 | | | | 2,217,777 | |
USAA Capital Corp., 144A, 2.125%, 05/01/30 (c) | | | 1,000,000 | | | | 821,903 | |
VZ Secured Financing BV, 144A, 5.000%, 01/15/32 (c) | | | 1,000,000 | | | | 814,431 | |
| | | | | | | | 90,959,993 | |
Health Care: 3.5% |
AbbVie, Inc., 3.600%, 05/14/25 | | | 1,000,000 | | | | 970,049 | |
AbbVie, Inc., 3.200%, 11/21/29 | | | 1,000,000 | | | | 903,751 | |
AbbVie, Inc., 4.250%, 11/21/49 | | | 1,000,000 | | | | 835,026 | |
Agilent Technologies, Inc., 2.300%, 03/12/31 | | | 2,000,000 | | | | 1,617,564 | |
| | 87 | SEE NOTES TO FINANCIAL STATEMENTS |
December 31, 2022 |
Schedules of Investments, continued |
Impax Core Bond Fund, continued
Percent of Net Assets
Name of Issuer and
Title of Issue | | Shares/
Principal | | | Value | |
BONDS, continued |
CORPORATE BONDS, continued |
Health Care, continued |
Amgen, Inc., 3.000%, 02/22/29 | | $ | 750,000 | | | $ | 665,645 | |
Amgen, Inc., 4.200%, 03/01/33 | | | 500,000 | | | | 464,128 | |
Avantor Funding, Inc., 144A, 4.625%, 07/15/28 (c) | | | 1,000,000 | | | | 910,720 | |
Becton Dickinson & Co., 3.700%, 06/06/27 (d) | | | 1,000,000 | | | | 946,408 | |
Becton Dickinson & Co., 4.298%, 08/22/32 | | | 750,000 | | | | 704,285 | |
Becton Dickinson & Co., 4.669%, 06/06/47 | | | 1,000,000 | | | | 885,038 | |
Bristol-Myers Squibb Co., 3.550%, 03/15/42 | | | 1,000,000 | | | | 816,099 | |
Elevance Health, Inc., 2.375%, 01/15/25 | | | 1,000,000 | | | | 950,033 | |
Elevance Health, Inc., 1.500%, 03/15/26 | | | 500,000 | | | | 449,965 | |
Elevance Health, Inc., 4.101%, 03/01/28 | | | 1,000,000 | | | | 960,156 | |
Elevance Health, Inc., 2.250%, 05/15/30 | | | 1,000,000 | | | | 829,525 | |
HealthEquity, Inc., 144A, 4.500%, 10/01/29 (c) | | | 1,000,000 | | | | 875,150 | |
Kaiser Foundation Hospitals, 2.810%, 06/01/41 | | | 1,000,000 | | | | 728,610 | |
Kaiser Foundation Hospitals, 3.266%, 11/01/49 | | | 1,000,000 | | | | 727,044 | |
Laboratory Corp of America Holdings, 3.600%, 02/01/25 | | | 1,000,000 | | | | 969,211 | |
Laboratory Corp of America Holdings, 1.550%, 06/01/26 | | | 1,000,000 | | | | 886,928 | |
Merck & Co., Inc., 2.350%, 06/24/40 | | | 1,000,000 | | | | 699,541 | |
Novant Health, Inc., 2.637%, 11/01/36 | | | 1,500,000 | | | | 1,110,637 | |
Pfizer, Inc., 1.750%, 08/18/31 | | | 2,250,000 | | | | 1,812,067 | |
Quest Diagnostics, Inc., 3.450%, 06/01/26 | | | 1,000,000 | | | | 954,936 | |
Seattle Children’s Hospital, 1.208%, 10/01/27 | | | 1,000,000 | | | | 812,715 | |
Percent of Net Assets
Name of Issuer and
Title of Issue | | Shares/
Principal | | | Value | |
BONDS, continued |
CORPORATE BONDS, continued |
Health Care, continued |
Thermo Fisher Scientific, Inc., 1.750%, 10/15/28 | | $ | 500,000 | | | $ | 424,401 | |
Thermo Fisher Scientific, Inc., 2.000%, 10/15/31 | | | 1,500,000 | | | | 1,218,776 | |
UnitedHealth Group, Inc., 3.700%, 05/15/27 (d) | | | 750,000 | | | | 726,688 | |
UnitedHealth Group, Inc., 5.250%, 02/15/28 | | | 500,000 | | | | 512,053 | |
UnitedHealth Group, Inc., 2.750%, 05/15/40 | | | 500,000 | | | | 364,696 | |
UnitedHealth Group, Inc., 3.050%, 05/15/41 | | | 750,000 | | | | 566,660 | |
Zoetis, Inc., 3.000%, 09/12/27 | | | 1,000,000 | | | | 926,147 | |
Zoetis, Inc., 3.900%, 08/20/28 | | | 1,000,000 | | | | 951,858 | |
| | | | | | | | 28,176,510 | |
Industrials: 2.7% |
Ashtead Capital, Inc., 144A, 5.500%, 08/11/32 (c) | | | 2,000,000 | | | | 1,918,790 | |
Burlington Northern Santa Fe, LLC, 3.550%, 02/15/50 | | | 1,000,000 | | | | 770,703 | |
Caterpillar, Inc., 2.600%, 04/09/30 | | | 1,000,000 | | | | 871,711 | |
Cummins, Inc., 7.125%, 03/01/28 | | | 1,000,000 | | | | 1,096,096 | |
Johnson Controls International PLC/Tyco Fire & Security Finance SCA, 1.750%, 09/15/30 | | | 1,000,000 | | | | 801,112 | |
Masco Corp., 1.500%, 02/15/28 (d) | | | 1,000,000 | | | | 829,551 | |
Norfolk Southern Corp., 2.300%, 05/15/31 | | | 2,500,000 | | | | 2,061,325 | |
Norfolk Southern Corp., 2.900%, 08/25/51 | | | 1,500,000 | | | | 975,939 | |
Republic Services, Inc., 1.450%, 02/15/31 | | | 2,000,000 | | | | 1,546,630 | |
Roper Technologies, Inc., 2.000%, 06/30/30 | | | 1,500,000 | | | | 1,205,482 | |
Standard Industries, Inc., 144A, 4.750%, 01/15/28 (c) | | | 1,000,000 | | | | 901,350 | |
SEE NOTES TO FINANCIAL STATEMENTS | 88 | |
December 31, 2022 |
Schedules of Investments, continued |
Impax Core Bond Fund, continued
Percent of Net Assets
Name of Issuer and
Title of Issue | | Shares/
Principal | | | Value | |
BONDS, continued |
CORPORATE BONDS, continued |
Industrials, continued |
Tesla Energy Operations, Inc., 4.700%, 05/29/25 (a) | | $ | 2,000,000 | | | $ | 1,843,064 | |
Union Pacific Corp., 2.400%, 02/05/30 | | | 500,000 | | | | 428,878 | |
Union Pacific Corp., 3.200%, 05/20/41 | | | 1,000,000 | | | | 788,851 | |
United Rentals North America, Inc., 5.250%, 01/15/30 | | | 2,000,000 | | | | 1,882,710 | |
Waste Management, Inc., 3.150%, 11/15/27 (d) | | | 2,500,000 | | | | 2,336,340 | |
Waste Management, Inc., 2.500%, 11/15/50 | | | 350,000 | | | | 219,636 | |
Xylem, Inc., 1.950%, 01/30/28 | | | 1,500,000 | | | | 1,292,490 | |
| | | | | | | | 21,770,658 | |
Information Technology: 4.3% |
Analog Devices, Inc., 2.950%, 04/01/25 | | | 1,000,000 | | | | 962,653 | |
Analog Devices, Inc., 1.700%, 10/01/28 | | | 750,000 | | | | 636,909 | |
Apple, Inc., 3.350%, 02/09/27 | | | 2,500,000 | | | | 2,394,069 | |
Apple, Inc., 2.375%, 02/08/41 | | | 1,000,000 | | | | 710,759 | |
Apple, Inc., 2.400%, 08/20/50 | | | 1,000,000 | | | | 626,568 | |
Apple, Inc., 3.950%, 08/08/52 | | | 750,000 | | | | 641,614 | |
Block, Inc., 3.500%, 06/01/31 (d) | | | 2,000,000 | | | | 1,598,400 | |
Broadcom Inc, 144A, 4.926%, 05/15/37 (c) | | | 2,000,000 | | | | 1,751,914 | |
Broadcom, Inc., 144A, 3.500%, 02/15/41 (c) | | | 1,000,000 | | | | 713,656 | |
CDW, LLC/Finance Corp., 3.276%, 12/01/28 | | | 2,000,000 | | | | 1,716,070 | |
Dell International, LLC/EMC Corp., 6.020%, 06/15/26 | | | 1,000,000 | | | | 1,021,385 | |
Fiserv, Inc., 3.500%, 07/01/29 | | | 1,500,000 | | | | 1,354,582 | |
Gen Digital, Inc., 144A, 6.750%, 09/30/27 (c) | | | 600,000 | | | | 588,780 | |
Gen Digital, Inc., 144A, 7.125%, 09/30/30 (c)(d) | | | 550,000 | | | | 541,118 | |
Hewlett Packard Enterprise Co., 1.450%, 04/01/24 | | | 2,500,000 | | | | 2,387,028 | |
Percent of Net Assets
Name of Issuer and
Title of Issue | | Shares/
Principal | | | Value | |
BONDS, continued |
CORPORATE BONDS, continued |
Information Technology, continued |
HP, Inc., 2.650%, 06/17/31 | | $ | 1,500,000 | | | $ | 1,172,177 | |
KLA Corp., 4.950%, 07/15/52 | | | 2,000,000 | | | | 1,869,117 | |
MasterCard, Inc., 2.950%, 06/01/29 | | | 500,000 | | | | 452,412 | |
MasterCard, Inc., 2.950%, 03/15/51 | | | 1,000,000 | | | | 712,830 | |
Microchip Technology, Inc., 0.972%, 02/15/24 | | | 1,000,000 | | | | 950,056 | |
Microsoft Corp., 2.921%, 03/17/52 | | | 1,000,000 | | | | 712,672 | |
NetApp, Inc., 1.875%, 06/22/25 | | | 1,000,000 | | | | 919,373 | |
NXP BV/Funding, LLC/USA, Inc., 2.500%, 05/11/31 | | | 1,500,000 | | | | 1,198,472 | |
NXP BV/Funding, LLC/USA, Inc., 5.000%, 01/15/33 | | | 800,000 | | | | 757,952 | |
Open Text Corp., 144A, 6.900%, 12/01/27 (c) | | | 1,000,000 | | | | 1,001,300 | |
QUALCOMM, Inc., 6.000%, 05/20/53 | | | 2,000,000 | | | | 2,136,858 | |
Texas Instruments, Inc., 4.600%, 02/15/28 | | | 1,500,000 | | | | 1,500,819 | |
TSMC Global, Ltd., 144A, 1.250%, 04/23/26 (c) | | | 1,000,000 | | | | 896,811 | |
Visa, Inc., 3.650%, 09/15/47 | | | 2,000,000 | | | | 1,648,406 | |
Western Digital Corp., 2.850%, 02/01/29 | | | 1,000,000 | | | | 775,115 | |
| | | | | | | | 34,349,875 | |
Materials: 0.6% |
Ardagh Metal Packaging Finance USA, LLC/Finance PLC, 144A, 4.000%, 09/01/29 (c) | | | 1,000,000 | | | | 794,402 | |
Ball Corp., 6.875%, 03/15/28 | | | 1,000,000 | | | | 1,028,470 | |
Ecolab, Inc., 5.250%, 01/15/28 | | | 1,000,000 | | | | 1,020,699 | |
Ecolab, Inc., 2.125%, 08/15/50 | | | 500,000 | | | | 280,972 | |
Ecolab, Inc., 2.750%, 08/18/55 | | | 950,000 | | | | 571,108 | |
Graphic Packaging International, LLC, 144A, 3.750%, 02/01/30 (c) | | | 1,000,000 | | | | 851,254 | |
| | | | | | | | 4,546,905 | |
| | 89 | SEE NOTES TO FINANCIAL STATEMENTS |
December 31, 2022 |
Schedules of Investments, continued |
Impax Core Bond Fund, continued
Percent of Net Assets
Name of Issuer and
Title of Issue | | Shares/
Principal | | | Value | |
BONDS, continued |
CORPORATE BONDS, continued |
Real Estate: 2.7% |
Alexandria Real Estate Equities, Inc., 2.000%, 05/18/32 | | $ | 500,000 | | | $ | 384,175 | |
Alexandria Real Estate Equities, Inc., 1.875%, 02/01/33 | | | 1,000,000 | | | | 746,295 | |
American Tower Corp., 1.600%, 04/15/26 | | | 500,000 | | | | 445,124 | |
American Tower Corp., 3.650%, 03/15/27 | | | 500,000 | | | | 467,735 | |
American Tower Corp., 2.100%, 06/15/30 | | | 250,000 | | | | 198,438 | |
American Tower Corp., 2.950%, 01/15/51 | | | 500,000 | | | | 311,645 | |
Brandywine Operating Partnership, LP, 7.550%, 03/15/28 | | | 2,000,000 | | | | 1,964,812 | |
Brixmor Operating Partnership, LP, 4.125%, 06/15/26 | | | 2,500,000 | | | | 2,360,459 | |
Crown Castle, Inc., 1.050%, 07/15/26 | | | 1,000,000 | | | | 865,224 | |
Crown Castle, Inc., 3.300%, 07/01/30 | | | 500,000 | | | | 438,578 | |
Crown Castle, Inc., 2.500%, 07/15/31 | | | 500,000 | | | | 404,179 | |
Equinix, Inc., 1.000%, 09/15/25 | | | 1,000,000 | | | | 895,242 | |
Equinix, Inc., 3.900%, 04/15/32 | | | 1,250,000 | | | | 1,114,069 | |
HAT Holdings I ,LLC/HAT Holdings II, LLC, 144A, 3.375%, 06/15/26 (c) | | | 850,000 | | | | 739,662 | |
HAT Holdings I, LLC/HAT Holdings II, LLC, 144A, 3.750%, 09/15/30 (c) | | | 1,000,000 | | | | 736,616 | |
Mid-America Apartments, LP, 3.950%, 03/15/29 | | | 2,000,000 | | | | 1,881,417 | |
Prologis, LP, 1.250%, 10/15/30 | | | 500,000 | | | | 380,174 | |
Prologis, LP, 1.625%, 03/15/31 (d) | | | 1,000,000 | | | | 775,256 | |
Percent of Net Assets
Name of Issuer and
Title of Issue | | Shares/
Principal | | | Value | |
BONDS, continued |
CORPORATE BONDS, continued |
Real Estate, continued |
Regency Centers, LP, 2.950%, 09/15/29 | | $ | 1,500,000 | | | $ | 1,262,074 | |
Regency Centers, LP, 3.700%, 06/15/30 | | | 570,000 | | | | 498,540 | |
SBA Tower Trust, 144A, 1.631%, 11/15/26 (c) | | | 1,000,000 | | | | 850,779 | |
SBA Tower Trust, 144A, 1.840%, 04/15/27 (c) | | | 2,000,000 | | | | 1,697,294 | |
Welltower, Inc., 3.850%, 06/15/32 | | | 1,500,000 | | | | 1,276,934 | |
Welltower, Inc., 6.500%, 03/15/41 | | | 1,000,000 | | | | 1,000,507 | |
| | | | | | | | 21,695,228 | |
Utilities: 3.3% |
AES Corp., The, 1.375%, 01/15/26 | | | 2,000,000 | | | | 1,778,126 | |
AES Corp., The, 2.450%, 01/15/31 | | | 1,000,000 | | | | 797,861 | |
American Water Capital Corp., 2.800%, 05/01/30 | | | 3,000,000 | | | | 2,601,035 | |
Avangrid, Inc., 3.200%, 04/15/25 | | | 1,000,000 | | | | 956,496 | |
Clearway Energy Operating, LLC, 144A, 3.750%, 02/15/31 (c) | | | 2,000,000 | | | | 1,663,048 | |
Consolitated Edison Co. of New York, Inc., 3.350%, 04/01/30 | | | 1,000,000 | | | | 901,726 | |
DTE Electric Co., 1.900%, 04/01/28 | | | 1,500,000 | | | | 1,306,176 | |
DTE Electric Co., 3.950%, 03/01/49 | | | 1,000,000 | | | | 824,691 | |
Georgia Power Co., 3.250%, 03/15/51 | | | 1,000,000 | | | | 692,814 | |
Leeward Renewable Energy Operations, LLC, 144A, 4.250%, 07/01/29 (c) | | | 1,500,000 | | | | 1,283,502 | |
Niagara Mohawk Power Corp., 144A, 1.960%, 06/27/30 (c) | | | 2,000,000 | | | | 1,585,425 | |
NSTAR Electric Co., 3.250%, 05/15/29 | | | 3,000,000 | | | | 2,737,194 | |
SEE NOTES TO FINANCIAL STATEMENTS | 90 | |
December 31, 2022 |
Schedules of Investments, continued |
Impax Core Bond Fund, continued
Percent of Net Assets
Name of Issuer and
Title of Issue | | Shares/
Principal | | | Value | |
BONDS, continued |
CORPORATE BONDS, continued |
Utilities, continued |
Pattern Energy Operations, LP/Inc., 144A, 4.500%, 08/15/28 (c) | | $ | 1,000,000 | | | $ | 898,404 | |
PG&E Energy Recovery Funding, LLC, 2.822%, 07/15/46 | | | 750,000 | | | | 526,046 | |
PG&E Recovery Funding, LLC, 5.536%, 07/15/47 | | | 2,625,000 | | | | 2,672,676 | |
SCE Recovery Funding, LLC, 2.943%, 11/15/42 | | | 1,250,000 | | | | 982,015 | |
Southern Power Co., 4.150%, 12/01/25 | | | 1,000,000 | | | | 981,181 | |
Southern Power Co., 0.900%, 01/15/26 | | | 500,000 | | | | 440,693 | |
Southwestern Public Service Co., 3.150%, 05/01/50 | | | 1,500,000 | | | | 1,042,137 | |
Sunnova Energy Corp., 144A, 5.875%, 09/01/26 (c)(d) | | | 750,000 | | | | 670,980 | |
Union Electric Co., 2.150%, 03/15/32 | | | 1,000,000 | | | | 793,130 | |
| | | | | | | | 26,135,356 | |
Total Corporate Bonds |
(Cost $337,841,927) | | | 296,561,936 | |
| | | | | | | | | |
U.S. GOVERNMENT AGENCY BONDS: 1.1% |
Federal Farm Credit Bank (Agency): 0.3% |
Federal Farm Credit Banks Funding Corp., 2.500%, 04/14/36 | | | 3,000,000 | | | | 2,279,938 | |
| |
US International Development Finance Corp. (Agency): 0.8% |
United States International Development Finance Corp., 4.460%, 09/15/26 (e) | | | 1,250,000 | | | | 1,250,000 | |
United States International Development Finance Corp., 3.130%, 04/15/28 | | | 1,000,000 | | | | 936,843 | |
United States International Development Finance Corp., 1.650%, 04/15/28 | | | 500,000 | | | | 438,519 | |
Percent of Net Assets
Name of Issuer and
Title of Issue | | Shares/
Principal | | | Value | |
BONDS, continued |
U.S. GOVERNMENT AGENCY BONDS, continued |
US International Development Finance Corp., continued |
United States International Development Finance Corp., 1.440%, 04/15/28 | | $ | 1,000,000 | | | $ | 868,716 | |
United States International Development Finance Corp., 4.420%, 03/15/30 (e) | | | 2,000,000 | | | | 2,000,000 | |
United States International Development Finance Corp., 3.520%, 09/20/32 | | | 1,392,857 | | | | 1,323,606 | |
| | | | | | | | 6,817,684 | |
TOTAL U.S. GOVERNMENT AGENCY BONDS |
(Cost $9,476,089) | | | 9,097,622 | |
| | | | | | | | | |
GOVERNMENT BONDS: 0.8% |
Caisse d’Amortissement de la Dette Sociale, 144A, 1.375%, 01/20/31 (c) | | | 3,000,000 | | | | 2,420,029 | |
Kommunalbanken AS, 144A, 0.500%, 10/21/24 (c) | | | 500,000 | | | | 464,138 | |
Kommunalbanken AS, 144A, 4.625%, 10/24/25 (c) | | | 500,000 | | | | 502,209 | |
Kommunalbanken AS, 144A, 1.125%, 10/26/26 (c) | | | 1,500,000 | | | | 1,329,166 | |
Kommunalbanken AS, 144A, 1.125%, 06/14/30 (c) | | | 1,000,000 | | | | 801,908 | |
Ontario Teachers’ Finance Trust, 144A, 1.250%, 09/27/30 (c) | | | 1,000,000 | | | | 784,343 | |
TOTAL GOVERNMENT BONDS |
(Cost $7,085,261) | | | 6,301,793 | |
| | | | | | | | | |
SUPRANATIONAL BONDS: 11.4% |
Council of Europe Development Bank, 3.000%, 06/16/25 (d) | | | 1,000,000 | | | | 966,356 | |
European Bank for Reconstruction & Development, 0.250%, 07/10/23 | | | 3,000,000 | | | | 2,928,437 | |
| | 91 | SEE NOTES TO FINANCIAL STATEMENTS |
December 31, 2022 |
Schedules of Investments, continued |
Impax Core Bond Fund, continued
Percent of Net Assets
Name of Issuer and
Title of Issue | | Shares/
Principal | | | Value | |
BONDS, continued |
SUPRANATIONAL BONDS, continued |
European Bank for Reconstruction & Development, 1.625%, 09/27/24 | | $ | 3,000,000 | | | $ | 2,849,944 | |
European Bank for Reconstruction & Development, 0.500%, 11/25/25 | | | 3,000,000 | | | | 2,683,270 | |
European Investment Bank, 2.500%, 03/15/23 | | | 5,000,000 | | | | 4,979,307 | |
European Investment Bank, 3.125%, 12/14/23 | | | 3,000,000 | | | | 2,953,196 | |
European Investment Bank, 3.250%, 01/29/24 | | | 8,000,000 | | | | 7,870,266 | |
European Investment Bank, 2.750%, 08/15/25 (d) | | | 2,000,000 | | | | 1,922,101 | |
European Investment Bank, 1.375%, 03/15/27 (d) | | | 2,000,000 | | | | 1,789,872 | |
European Investment Bank, 1.750%, 03/15/29 (d) | | | 800,000 | | | | 696,866 | |
European Investment Bank, 0.750%, 09/23/30 | | | 1,000,000 | | | | 785,808 | |
European Investment Bank, 1.250%, 02/14/31 (d) | | | 2,000,000 | | | | 1,628,122 | |
Inter-American Development Bank, 0.250%, 11/15/23 (d) | | | 4,000,000 | | | | 3,843,101 | |
Inter-American Development Bank, 2.625%, 01/16/24 | | | 3,000,000 | | | | 2,931,633 | |
Inter-American Development Bank, 0.340%, 10/15/24 | | | 4,000,000 | | | | 3,696,573 | |
Inter-American Development Bank, 1.750%, 03/14/25 (d) | | | 3,000,000 | | | | 2,829,345 | |
Inter-American Development Bank, 0.625%, 07/15/25 | | | 3,000,000 | | | | 2,731,999 | |
Inter-American Development Bank, 0.875%, 04/20/26 | | | 2,000,000 | | | | 1,790,251 | |
Percent of Net Assets
Name of Issuer and
Title of Issue | | Shares/
Principal | | | Value | |
BONDS, continued |
SUPRANATIONAL BONDS, continued |
Inter-American Development Bank, 1.500%, 01/13/27 | | $ | 2,000,000 | | | $ | 1,800,862 | |
Inter-American Development Bank, 0.625%, 09/16/27 | | | 600,000 | | | | 509,503 | |
Inter-American Development Bank, 3.500%, 09/14/29 | | | 4,500,000 | | | | 4,328,167 | |
Inter-American Development Bank, 1.125%, 01/13/31 | | | 3,250,000 | | | | 2,598,988 | |
Inter-American Investment Corp., 2.625%, 04/22/25 | | | 1,000,000 | | | | 957,951 | |
International Bank for Reconstruction & Development, 1.625%, 01/15/25 | | | 8,000,000 | | | | 7,558,708 | |
International Bank for Reconstruction & Development, 0.625%, 04/22/25 | | | 5,000,000 | | | | 4,588,290 | |
International Bank for Reconstruction & Development, 0.500%, 10/28/25 (d) | | | 500,000 | | | | 449,375 | |
International Bank for Reconstruction & Development, 3.125%, 06/15/27 | | | 2,000,000 | | | | 1,912,058 | |
International Bank for Reconstruction & Development, 0.750%, 11/24/27 (d) | | | 1,000,000 | | | | 850,290 | |
International Bank for Reconstruction & Development, 1.375%, 04/20/28 | | | 1,500,000 | | | | 1,303,998 | |
International Bank for Reconstruction & Development, 4.477%, 02/11/31 (e) | | | 2,000,000 | | | | 1,984,085 | |
SEE NOTES TO FINANCIAL STATEMENTS | 92 | |
December 31, 2022 |
Schedules of Investments, continued |
Impax Core Bond Fund, continued
Percent of Net Assets
Name of Issuer and
Title of Issue | | Shares/
Principal | | | Value | |
BONDS, continued |
SUPRANATIONAL BONDS, continued |
International Bank for Reconstruction & Development, 1.625%, 11/03/31 | | $ | 1,500,000 | | | $ | 1,229,242 | |
International Bank for Reconstruction & Development, 2.750%, 05/31/36 | | | 2,000,000 | | | | 1,630,436 | |
International Development Association, 144A, 0.375%, 09/23/25 (c) | | | 3,200,000 | | | | 2,869,318 | |
International Finance Corp., 0.375%, 07/16/25 | | | 1,000,000 | | | | 904,718 | |
International Finance Corp., 0.750%, 10/08/26 | | | 2,250,000 | | | | 1,973,107 | |
Nordic Investment Bank, 0.375%, 09/20/24 | | | 1,500,000 | | | | 1,395,375 | |
Nordic Investment Bank, 0.375%, 09/11/25 | | | 3,000,000 | | | | 2,695,756 | |
TOTAL SUPRANATIONAL BONDS |
(Cost $98,634,833) | | | 91,416,674 | |
| | | | | | | | | |
MUNICIPAL BONDS: 2.1% |
California Health Facilities Financing Authority, 1.970%, 06/01/23 | | | 500,000 | | | | 495,174 | |
California Health Facilities Financing Authority, 4.190%, 06/01/37 | | | 1,750,000 | | | | 1,566,398 | |
California State University, 2.795%, 11/01/41 | | | 500,000 | | | | 356,163 | |
California State University, 2.939%, 11/01/52 | | | 905,000 | | | | 614,085 | |
City of Los Angeles CA Wastewater System Revenue, 4.029%, 06/01/39 | | | 1,020,000 | | | | 898,504 | |
City of San Francisco CA Public Utilities Commission Water Revenue, 3.303%, 11/01/39 | | | 2,000,000 | | | | 1,638,008 | |
Percent of Net Assets
Name of Issuer and
Title of Issue | | Shares/
Principal | | | Value | |
BONDS, continued |
MUNICIPAL BONDS, continued |
Commonwealth of Massachusetts, 3.881%, 01/15/31 | | $ | 2,000,000 | | | $ | 1,860,248 | |
Commonwealth of Massachusetts, 3.277%, 06/01/46 | | | 2,000,000 | | | | 1,524,363 | |
Massachusetts School Building Authority, 3.395%, 10/15/40 | | | 1,000,000 | | | | 808,816 | |
Santa Clara Valley Water District, 3.369%, 06/01/27 | | | 1,305,000 | | | | 1,232,664 | |
State of California, 7.550%, 04/01/39 | | | 2,000,000 | | | | 2,508,324 | |
State of Oregon, 4.721%, 05/01/42 | | | 2,000,000 | | | | 1,891,669 | |
University of Massachusetts Building Authority, 6.573%, 05/01/39 | | | 125,000 | | | | 125,104 | |
University of Massachusetts Building Authority, 5.450%, 11/01/40 | | | 1,225,000 | | | | 1,254,941 | |
TOTAL MUNICIPAL BONDS |
(Cost $19,268,884) | | | 16,774,461 | |
| | | | | | | | | |
U.S. TREASURY NOTES: 14.9% |
0.125%, 07/15/24 (TIPS) | | | 5,019,640 | | | | 4,858,415 | |
4.500%, 11/15/25 | | | 4,000,000 | | | | 4,024,688 | |
0.625%, 01/15/26 (TIPS) | | | 3,762,120 | | | | 3,612,264 | |
0.375%, 07/15/27 (TIPS) | | | 4,872,440 | | | | 4,593,963 | |
3.875%, 11/30/27 (d) | | | 28,000,000 | | | | 27,851,250 | |
4.000%, 10/31/29 | | | 3,000,000 | | | | 3,001,641 | |
0.875%, 11/15/30 | | | 2,000,000 | | | | 1,599,063 | |
4.125%, 11/15/32 | | | 9,000,000 | | | | 9,186,328 | |
5.000%, 05/15/37 | | | 2,000,000 | | | | 2,235,234 | |
4.000%, 11/15/42 (d) | | | 36,000,000 | | | | 35,257,499 | |
1.000%, 02/15/48 (TIPS) | | | 1,208,340 | | | | 1,018,245 | |
4.000%, 11/15/52 | | | 21,750,000 | | | | 21,787,383 | |
TOTAL U.S. TREASURY NOTES |
(Cost $122,467,123) | | | 119,025,973 | |
| | | | | | | | | |
ASSET-BACKED SECURITIES: 6.2% |
CarMax Auto Owner Trust 2019-4, 2.800%, 04/15/26 | | | 2,000,000 | | | | 1,922,048 | |
CarMax Auto Owner Trust 2020-3, 2.530%, 01/15/27 | | | 2,000,000 | | | | 1,875,340 | |
| | 93 | SEE NOTES TO FINANCIAL STATEMENTS |
December 31, 2022 |
Schedules of Investments, continued |
Impax Core Bond Fund, continued
Percent of Net Assets
Name of Issuer and
Title of Issue | | Shares/
Principal | | | Value | |
BONDS, continued |
ASSET-BACKED SECURITIES, continued |
College Avenue Student Loans 2021-B, LLC, 144A, 1.760%, 06/25/52 (c) | | $ | 382,404 | | | $ | 318,110 | |
Commonbond Student Loan Trust 2018-C-GS, 144A, 3.870%, 02/25/46 (c) | | | 554,297 | | | | 531,457 | |
Commonbond Student Loan Trust 2019-A-GS, 144A, 2.540%, 01/25/47 (c) | | | 606,397 | | | | 545,692 | |
Commonbond Student Loan Trust 2020-A-GS, 144A, 1.980%, 08/25/50 (c) | | | 532,803 | | | | 454,246 | |
Commonbond Student Loan Trust 2021-A-GS, 144A, 1.200%, 03/25/52 (c) | | | 289,619 | | | | 234,762 | |
Commonbond Student Loan Trust 2021-B-GS, 144A, 1.170%, 09/25/51 (c) | | | 372,700 | | | | 302,935 | |
Foundation Finance Trust 2019-1, 144A, 3.860%, 11/15/34 (c) | | | 1,141,312 | | | | 1,117,915 | |
Foundation Finance Trust 2021-1, 144A, 1.270%, 05/15/41 (c) | | | 1,254,322 | | | | 1,122,704 | |
Foundation Finance Trust 2021-2, 144A, 2.190%, 01/15/42 (c) | | | 511,206 | | | | 467,606 | |
FRTKL 2021-SFR1, 144A, 1.571%, 09/17/38 (c) | | | 1,000,000 | | | | 855,785 | |
GoodLeap Sustainable Home Solutions Trust 2022-2, 144A, 4.000%, 04/20/49 (c) | | | 2,480,054 | | | | 2,022,012 | |
Loanpal Solar Loan 2021-1, Ltd., 144A, 2.290%, 01/20/48 (c) | | | 894,016 | | | | 682,295 | |
Loanpal Solar Loan 2021-2 Ltd, 144A, 2.220%, 03/20/48 (c) | | | 572,543 | | | | 420,279 | |
Mill City Solar Loan 2019-1, Ltd., 144A, 4.340%, 03/20/43 (c) | | | 478,575 | | | | 448,994 | |
Percent of Net Assets
Name of Issuer and
Title of Issue | | Shares/
Principal | | | Value | |
BONDS, continued |
ASSET-BACKED SECURITIES, continued |
Mill City Solar Loan 2019-2, Ltd., 144A, 3.690%, 07/20/43 (c) | | $ | 518,055 | | | $ | 465,859 | |
Mosaic Solar Loan Trust 2018-1, 144A, 4.010%, 06/22/43 (c) | | | 1,342,998 | | | | 1,241,192 | |
Mosaic Solar Loan Trust 2019-2, 144A, 2.880%, 09/20/40 (c) | | | 397,730 | | | | 342,520 | |
Mosaic Solar Loan Trust 2020-1, 144A, 2.100%, 04/20/46 (c) | | | 447,267 | | | | 389,098 | |
Mosaic Solar Loan Trust 2020-2, 144A, 3.000%, 08/20/46 (c) | | | 799,908 | | | | 725,871 | |
Mosaic Solar Loan Trust 2020-2, 144A, 1.440%, 08/20/46 (c) | | | 923,074 | | | | 771,753 | |
Mosaic Solar Loan Trust 2021-1, 144A, 1.510%, 12/20/46 (c) | | | 849,288 | | | | 669,336 | |
Mosaic Solar Loan Trust 2022-3, 144A, 6.160%, 06/20/53 (c) | | | 750,000 | | | | 749,774 | |
Mosaic Solar Loans 2017-1 LLC, 144A, 4.450%, 06/20/42 (c) | | | 423,444 | | | | 405,676 | |
Mosaic Solar Loans 2017-2 LLC, 144A, 3.820%, 06/22/43 (c) | | | 510,853 | | | | 474,091 | |
Mosaic Solar Loans 2017-2 LLC, 144A, 2.000%, 06/22/43 (c) | | | 282,923 | | | | 273,356 | |
Mosaic Solar Loans Trust 2021-2, 144A, 2.090%, 04/22/47 (c) | | | 771,594 | | | | 624,954 | |
OneMain Financial Issuance Trust 2022-3, 144A, 5.940%, 05/15/34 (c) | | | 1,750,000 | | | | 1,744,551 | |
OneMain Financial Issuance Trust 2022-S1, 144A, 4.130%, 05/14/35 (c) | | | 2,520,000 | | | | 2,379,696 | |
PACEWell 5 Trust, 144A, 2.628%, 10/10/59 (c) | | | 1,084,288 | | | | 860,556 | |
SEE NOTES TO FINANCIAL STATEMENTS | 94 | |
December 31, 2022 |
Schedules of Investments, continued |
Impax Core Bond Fund, continued
Percent of Net Assets
Name of Issuer and
Title of Issue | | Shares/
Principal | | | Value | |
BONDS, continued |
ASSET-BACKED SECURITIES, continued |
Progress Residential 2022-SFR1 Trust, 144A, 2.709%, 02/17/41 (c) | | $ | 1,497,147 | | | $ | 1,257,173 | |
Service Experts Issuer 2021-1, LLC, 144A, 2.670%, 02/02/32 (c) | | | 1,132,623 | | | | 1,030,048 | |
SoFi Professional Loan Program 2017-B, LLC, 144A, 3.700%, 05/25/40 (c)(e) | | | 1,900,000 | | | | 1,810,868 | |
SoFi Professional Loan Program 2017-D, LLC, 144A, 3.610%, 09/25/40 (c) | | | 1,500,000 | | | | 1,304,828 | |
SoFi Professional Loan Program 2017-E, LLC, 144A, 3.490%, 11/26/40 (c) | | | 750,000 | | | | 713,042 | |
SoFi Professional Loan Program 2017-F, LLC, 144A, 3.620%, 01/25/41 (c) | | | 1,800,000 | | | | 1,558,393 | |
SoFi Professional Loan Program 2018-B Trust, 144A, 3.830%, 08/25/47 (c) | | | 500,000 | | | | 449,350 | |
Sofi Professional Loan Program 2019-C, LLC, 144A, 2.370%, 11/16/48 (c) | | | 1,430,119 | | | | 1,328,994 | |
Sunnova Helios II Issuer, LLC 2019-A, 144A, 3.750%, 06/20/46 (c) | | | 1,561,262 | | | | 1,392,042 | |
Sunnova Helios II Issuer, LLC 2021-B, 144A, 1.620%, 07/20/48 (c) | | | 2,170,893 | | | | 1,781,320 | |
Sunnova Helios IV Issuer, LLC, 144A, 2.980%, 06/20/47 (c) | | | 754,658 | | | | 645,932 | |
Sunnova Helios V Issuer, LLC, 144A, 1.800%, 02/20/48 (c) | | | 424,442 | | | | 346,263 | |
Percent of Net Assets
Name of Issuer and
Title of Issue | | Shares/
Principal | | | Value | |
BONDS, continued |
ASSET-BACKED SECURITIES, continued |
Sunnova Helios VII Issuer, LLC, 144A, 2.330%, 10/20/48 (c) | | $ | 917,295 | | | $ | 738,120 | |
Sunnova Sol Issuer, LLC, 144A, 3.350%, 02/01/55 (c) | | | 918,078 | | | | 765,050 | |
Sunrun Athena Issuer 2018-1, LLC, 144A, 5.310%, 04/30/49 (c) | | | 906,790 | | | | 833,214 | |
Sunrun Atlas Issuer 2019-2, LLC, 144A, 3.610%, 02/01/55 (c) | | | 915,453 | | | | 807,477 | |
Tesla Auto Lease Trust 2020-A, 144A, 4.640%, 08/20/24 (c) | | | 1,000,000 | | | | 993,047 | |
Tesla Auto Lease Trust 2021-A, 144A, 1.340%, 03/20/25 (c) | | | 500,000 | | | | 473,659 | |
Tesla Auto Lease Trust 2021-A, 144A, 1.180%, 03/20/25 (c) | | | 750,000 | | | | 712,812 | |
Tesla Auto Lease Trust 2021-B, 144A, 1.120%, 09/22/25 (c) | | | 500,000 | | | | 463,606 | |
Towd Point Mortgage Trust 2015-2, 144A, 3.436%, 11/25/60 (c)(e) | | | 1,688,417 | | | | 1,652,114 | |
Tricon American Homes 2020-SFR2 Trust, 144A, 1.482%, 11/17/39 (c) | | | 1,410,893 | | | | 1,169,643 | |
Triumph Rail Holdings, LLC, 144A, 2.150%, 06/19/51 (c) | | | 930,369 | | | | 794,251 | |
TRP 2021, LLC, 144A, 2.070%, 06/19/51 (c) | | | 976,066 | | | | 819,693 | |
Vivint Solar Financing V, LLC, 144A, 4.730%, 04/30/48 (c) | | | 915,144 | | | | 812,911 | |
TOTAL ASSET-BACKED SECURITIES |
(Cost $56,387,352) | | | 50,094,313 | |
| | | | | | | | | |
| | 95 | SEE NOTES TO FINANCIAL STATEMENTS |
December 31, 2022 |
Schedules of Investments, continued |
Impax Core Bond Fund, continued
Percent of Net Assets
Name of Issuer and
Title of Issue | | Shares/
Principal | | | Value | |
BONDS, continued |
MORTGAGE-BACKED SECURITIES: 25.1% |
Ginnie Mae (Mortgage-Backed): 0.4% |
3.020%, 09/15/41 | | $ | 1,643,612 | | | $ | 1,538,230 | |
2.846%, 09/16/50 (e) | | | 825,806 | | | | 800,299 | |
3.099%, 03/16/55 (e) | | | 592,064 | | | | 528,122 | |
| | | | | | | | 2,866,651 | |
Freddie Mac (Mortgage-Backed): 6.1% |
2.939%, 04/25/29 | | | 3,000,000 | | | | 2,742,655 | |
0.704%, 04/25/29 (e) | | | 486,575 | | | | 423,675 | |
2.412%, 08/25/29 | | | 2,000,000 | | | | 1,765,588 | |
1.503%, 09/25/30 | | | 651,000 | | | | 527,193 | |
1.487%, 11/25/30 | | | 2,000,000 | | | | 1,608,334 | |
1.132%, 01/25/31 | | | 1,365,785 | | | | 1,167,862 | |
1.204%, 09/25/31 | | | 600,251 | | | | 517,541 | |
3.400%, 08/25/32 (e) | | | 2,000,000 | | | | 1,826,673 | |
3.123%, 08/25/32 (e) | | | 1,750,000 | | | | 1,563,497 | |
4.500%, 01/01/34 | | | 507,444 | | | | 508,222 | |
5.170%, 01/25/34, 144A (c)(e) | | | 405,547 | | | | 400,155 | |
3.000%, 03/01/35 | | | 2,981,375 | | | | 2,801,576 | |
4.000%, 10/01/35 | | | 924,542 | | | | 891,085 | |
2.500%, 11/01/36 | | | 1,379,193 | | | | 1,243,460 | |
4.000%, 07/01/37 | | | 1,860,648 | | | | 1,817,672 | |
5.370%, 01/25/42, 144A (c)(e) | | | 1,100,000 | | | | 1,045,362 | |
3.500%, 01/01/44 | | | 916,250 | | | | 857,936 | |
3.000%, 06/01/46 | | | 1,204,129 | | | | 1,082,098 | |
3.000%, 01/01/47 | | | 1,348,898 | | | | 1,209,925 | |
3.000%, 12/01/49 | | | 1,811,246 | | | | 1,606,242 | |
3.000%, 02/01/50 | | | 1,291,325 | | | | 1,156,051 | |
7.120%, 03/25/50, 144A (c)(e) | | | 831,612 | | | | 843,737 | |
2.500%, 05/01/50 | | | 1,484,117 | | | | 1,269,330 | |
2.000%, 02/01/51 | | | 2,559,650 | | | | 2,106,210 | |
4.000%, 08/01/51 | | | 3,542,656 | | | | 3,333,099 | |
3.000%, 04/01/52 | | | 4,853,937 | | | | 4,275,299 | |
4.500%, 08/01/52 | | | 1,937,713 | | | | 1,874,554 | |
5.500%, 09/01/52 | | | 3,982,102 | | | | 4,021,317 | |
5.500%, 11/01/52 | | | 3,975,378 | | | | 4,015,336 | |
| | | | | | | | 48,501,684 | |
Fannie Mae (Mortgage-Backed): 16.9% |
2.759%, 02/25/27 (e) | | | 2,044,403 | | | | 1,925,099 | |
2.905%, 01/25/28 (e) | | | 1,812,548 | | | | 1,688,977 | |
3.056%, 03/25/28 (e) | | | 1,254,516 | | | | 1,168,758 | |
3.302%, 06/25/28 (e) | | | 1,816,946 | | | | 1,727,211 | |
3.547%, 09/25/28 (e) | | | 1,828,782 | | | | 1,756,874 | |
Percent of Net Assets
Name of Issuer and
Title of Issue | | Shares/
Principal | | | Value | |
BONDS, continued |
MORTGAGE-BACKED SECURITIES, continued |
Fannie Mae (Mortgage-Backed), continued |
2.937%, 06/25/29 | | $ | 1,757,226 | | | $ | 1,608,255 | |
1.383%, 12/25/30 (e) | | | 2,700,000 | | | | 2,149,800 | |
2.000%, 03/01/36 | | | 2,371,399 | | | | 2,117,984 | |
4.000%, 08/01/37 | | | 1,903,623 | | | | 1,859,655 | |
2.000%, 11/01/40 | | | 1,699,711 | | | | 1,449,552 | |
2.500%, 12/01/40 | | | 2,547,636 | | | | 2,243,688 | |
2.000%, 12/01/40 | | | 4,122,401 | | | | 3,515,660 | |
4.000%, 02/01/41 | | | 1,484,598 | | | | 1,427,141 | |
5.520%, 11/25/41, 144A (c)(e) | | | 1,500,000 | | | | 1,398,257 | |
4.000%, 01/01/42 | | | 1,330,790 | | | | 1,279,281 | |
3.000%, 01/01/42 | | | 2,701,033 | | | | 2,429,756 | |
3.500%, 01/01/43 | | | 1,330,149 | | | | 1,243,889 | |
3.000%, 02/01/43 | | | 971,514 | | | | 884,970 | |
3.500%, 07/01/43 | | | 3,609,151 | | | | 3,368,612 | |
3.500%, 08/01/45 | | | 935,153 | | | | 871,031 | |
3.000%, 06/01/46 | | | 1,222,612 | | | | 1,088,637 | |
3.000%, 11/01/46 | | | 2,850,624 | | | | 2,557,112 | |
4.000%, 05/01/47 | | | 913,343 | | | | 874,937 | |
4.000%, 01/01/48 | | | 875,974 | | | | 836,605 | |
3.500%, 04/01/48 | | | 1,654,970 | | | | 1,551,071 | |
3.500%, 06/01/48 | | | 1,129,312 | | | | 1,047,303 | |
3.500%, 09/01/49 | | | 4,482,466 | | | | 4,124,958 | |
3.000%, 10/01/49 | | | 1,360,153 | | | | 1,208,758 | |
3.500%, 01/01/50 | | | 2,674,677 | | | | 2,476,917 | |
3.000%, 03/01/50 | | | 894,792 | | | | 795,191 | |
2.500%, 03/01/50 | | | 1,770,619 | | | | 1,516,037 | |
2.500%, 08/01/50 | | | 1,761,069 | | | | 1,520,419 | |
2.500%, 09/01/50 | | | 5,952,511 | | | | 5,072,595 | |
2.000%, 10/01/50 | | | 3,334,528 | | | | 2,744,755 | |
3.000%, 11/01/50 | | | 1,383,151 | | | | 1,220,910 | |
2.500%, 11/01/50 | | | 1,774,594 | | | | 1,517,651 | |
1.500%, 11/01/50 | | | 2,443,568 | | | | 1,895,431 | |
2.500%, 12/01/50 | | | 3,724,223 | | | | 3,168,192 | |
2.000%, 12/01/50 | | | 1,607,227 | | | | 1,321,028 | |
2.500%, 01/01/51 | | | 1,632,235 | | | | 1,388,411 | |
1.500%, 02/01/51 | | | 1,745,594 | | | | 1,308,680 | |
2.500%, 05/01/51 | | | 1,579,227 | | | | 1,342,880 | |
2.500%, 07/01/51 | | | 8,112,046 | | | | 6,896,501 | |
2.000%, 09/01/51 | | | 2,785,713 | | | | 2,274,081 | |
2.500%, 10/01/51 | | | 2,715,083 | | | | 2,307,738 | |
2.000%, 10/01/51 | | | 2,824,269 | | | | 2,305,121 | |
2.500%, 11/01/51 | | | 2,878,102 | | | | 2,445,029 | |
3.500%, 01/01/52 | | | 2,536,935 | | | | 2,311,260 | |
SEE NOTES TO FINANCIAL STATEMENTS | 96 | |
December 31, 2022 |
Schedules of Investments, continued |
Impax Core Bond Fund, continued
Percent of Net Assets
Name of Issuer and
Title of Issue | | Shares/
Principal | | | Value | |
BONDS, continued |
MORTGAGE-BACKED SECURITIES, continued |
Fannie Mae (Mortgage-Backed), continued |
3.000%, 02/01/52 | | $ | 2,804,701 | | | $ | 2,465,858 | |
2.500%, 02/01/52 | | | 3,680,929 | | | | 3,126,336 | |
3.500%, 03/01/52 | | | 2,936,720 | | | | 2,674,027 | |
3.500%, 04/01/52 | | | 6,655,927 | | | | 6,058,514 | |
3.500%, 06/01/52 | | | 7,740,952 | | | | 7,059,645 | |
4.500%, 07/01/52 | | | 2,955,790 | | | | 2,850,077 | |
4.000%, 07/01/52 | | | 3,889,496 | | | | 3,659,539 | |
3.500%, 07/01/52 | | | 3,938,693 | | | | 3,620,684 | |
5.000%, 09/01/52 | | | 2,990,114 | | | | 2,951,567 | |
4.500%, 10/01/52 | | | 2,906,802 | | | | 2,815,966 | |
6.000%, 11/01/52 | | | 2,986,313 | | | | 3,044,714 | |
| | | | | | | | 135,559,585 | |
Commercial Mortgage-Backed: 1.7% |
Angel Oak Mortgage Trust 2022-2, 144A, 3.353%, 01/25/67 (c)(e) | | | 1,785,215 | | | | 1,619,586 | |
Angel Oak Mortgage Trust 2022-5, 144A, 4.500%, 05/25/67 (c) | | | 1,681,721 | | | | 1,609,475 | |
Connecticut Avenue Securities Trust 2021-R01, 144A, 5.070%, 10/25/41 (c)(e) | | | 645,000 | | | | 629,033 | |
Connecticut Avenue Securities Trust 2022-R08, 144A, 6.070%, 07/25/42 (c)(e) | | | 1,624,496 | | | | 1,630,748 | |
Flagstar Mortgage Trust 2021-5INV, 144A, 2.500%, 07/25/51 (c)(e) | | | 781,140 | | | | 671,392 | |
Flagstar Mortgage Trust 2021-6INV, 144A, 2.500%, 08/25/51 (c)(e) | | | 1,583,343 | | | | 1,374,006 | |
Mello Mortgage Capital Acceptance 2021-INV1, 144A, 2.500%, 06/25/51 (c)(e) | | | 805,775 | | | | 692,566 | |
New Residential Mortgage Loan Trust 2019-2, 144A, 4.250%, 12/25/57 (c)(e) | | | 931,666 | | | | 884,464 | |
New Residential Mortgage Loan Trust 2019-4, 144A, 3.500%, 12/25/58 (c)(e) | | | 392,471 | | | | 355,310 | |
Percent of Net Assets
Name of Issuer and
Title of Issue | | Shares/
Principal | | | Value | |
BONDS, continued |
MORTGAGE-BACKED SECURITIES, continued |
Commercial Mortgage-Backed, continued |
New Residential Mortgage Loan Trust 2019-5, 144A, 3.500%, 08/25/59 (c)(e) | | $ | 545,594 | | | $ | 506,709 | |
New Residential Mortgage Loan Trust 2019-RPL3, 144A, 2.750%, 07/25/59 (c)(e) | | | 1,166,488 | | | | 1,089,290 | |
Sequoia Mortgage Trust 2018-CH1, 144A, 4.000%, 03/25/48 (c)(e) | | | 89,664 | | | | 83,053 | |
Sequoia Mortgage Trust 2021-4, 144A, 2.500%, 06/25/51 (c)(e) | | | 1,730,311 | | | | 1,493,584 | |
SLG Office Trust 2021-OVA, 144A, 2.585%, 07/15/41 (c) | | | 750,000 | | | | 600,168 | |
| | | | | | | | 13,239,384 | |
TOTAL MORTGAGE-BACKED SECURITIES |
(Cost $224,300,534) | | | 200,167,304 | |
| | | | | | | | | |
TOTAL BONDS |
(Cost $876,166,524) | | | 790,134,685 | |
| |
MONEY MARKET: 0.7% |
State Street Institutional U.S. Government Money Market Fund, 4.120% (f)(g) | | | 5,358,793 | | | | 5,358,793 | |
(Cost $5,358,793) |
| |
| | 97 | SEE NOTES TO FINANCIAL STATEMENTS |
December 31, 2022 |
Schedules of Investments, continued |
Impax Core Bond Fund, continued
Percent of Net Assets
Name of Issuer and
Title of Issue | | Shares/
Principal | | | Value | |
SECURITIES PURCHASED WITH CASH COLLATERAL FROM SECURITIES LENDING: 6.9% |
State Street Navigator Securities Lending Government Money Market Portfolio, 4.333% (f)(g) | | $ | 54,944,336 | | | $ | 54,944,336 | |
(Cost $54,944,336) |
| | | | | | | | | |
TOTAL INVESTMENTS: 106.4% |
(Cost $936,469,653) | | | 850,437,814 | |
| | | | | | | | | |
PAYABLE UPON RETURN OF SECURITIES LOANED (NET):- 6.9% | | | (54,944,336 | ) |
| | | | | | | | | |
OTHER ASSETS AND LIABILITIES — (NET): 0.5% | | | 4,155,882 | |
| | | | | | | | | |
NET ASSETS: 100.0% | | $ | 799,649,360 | |
(b) | Security valued using significant unobservable inputs. |
(c) | Security purchased pursuant to Rule 144A of the Securities Act of 1933 and may be resold only to qualified institutional buyers. |
(d) | Security of partial position of this security was on loan as of December 31, 2022. The total market value of securities on loan as of December 31, 2022 was $66,355,545. |
(e) | Rate shown reflects the accrual rate as of December 31, 2022 on securities with variable or step rates. |
(f) | Rate shown represents annualized 7-day yield as of December 31, 2022. |
LP - Limited Partnership
TIPS - Treasury Inflation Protected Securities
SEE NOTES TO FINANCIAL STATEMENTS | 98 | |
December 31, 2022 |
Schedules of Investments, continued |
Impax High Yield Bond Fund
Percent of Net Assets
Name of Issuer and
Title of Issue | | Shares/
Principal/
Contracts | | | Value | |
COMMON STOCKS: 0.2% |
Health Care: 0.2% |
Avantor, Inc. | | | 60,790 | | | $ | 1,282,061 | |
Interactive Health, Inc. (a)(b)(c) | | | 706 | | | | 0 | |
| | | | | | | | | |
TOTAL COMMON STOCKS |
(Cost $1,179,359) | | | 1,282,061 | |
| | | | | | | | | |
PREFERRED STOCKS: 0.0% |
Health Care: 0.0% |
Interactive Health, Inc., 0.000% (a)(b)(c) | | | 1,412 | | | | 0 | |
(Cost $357,962) |
| |
BONDS: 95.8% |
Community Investment Notes: 0.2% |
CEI Investment Note, 2.000%, 09/30/23 (b)(c) | | $ | 521,055 | | | | 521,055 | |
Envest Microfinance Fund, LLC, 4.380%, 10/25/23 (b)(c) | | | 150,000 | | | | 150,000 | |
Envest Microfinance Fund, LLC, 4.000%, 04/20/26 (b) | | | 250,000 | | | | 240,088 | |
(Cost $921,055) | | | 911,143 | |
| | | | | | | | | |
CORPORATE BONDS: 92.8% |
Automotive: 5.4% |
Allison Transmission, Inc., 144A, 4.750%, 10/01/27 (d) | | | 2,575,000 | | | | 2,392,327 | |
Allison Transmission, Inc., 144A, 5.875%, 06/01/29 (d) | | | 1,925,000 | | | | 1,811,184 | |
Allison Transmission, Inc., 144A, 3.750%, 01/30/31 (d) | | | 2,475,000 | | | | 2,038,781 | |
Dana, Inc., 4.500%, 02/15/32 | | | 3,900,000 | | | | 3,124,248 | |
Ford Motor Co., 3.250%, 02/12/32 | | | 3,850,000 | | | | 2,894,129 | |
Ford Motor Co., 4.750%, 01/15/43 | | | 2,450,000 | | | | 1,764,117 | |
Ford Motor Credit Co., LLC, 3.810%, 01/09/24 | | | 1,025,000 | | | | 998,363 | |
Percent of Net Assets
Name of Issuer and
Title of Issue | | Shares/
Principal/
Contracts | | | Value | |
CORPORATE BONDS, continued |
Automotive, continued |
Ford Motor Credit Co., LLC, 3.664%, 09/08/24 | | $ | 2,075,000 | | | $ | 1,980,058 | |
Ford Motor Credit Co., LLC, 5.125%, 06/16/25 | | | 3,750,000 | | | | 3,613,281 | |
Ford Motor Credit Co., LLC, 2.700%, 08/10/26 | | | 1,850,000 | | | | 1,608,853 | |
Ford Motor Credit Co., LLC, 4.000%, 11/13/30 | | | 3,800,000 | | | | 3,126,659 | |
Gates Global, LLC/Corp., 144A, 6.250%, 01/15/26 (d) | | | 3,075,000 | | | | 2,972,141 | |
IHO Verwaltungs GmbH, 144A, 6.375%, 05/15/29 (d) | | | 3,750,000 | | | | 3,175,594 | |
| | | | | | | | 31,499,735 | |
Basic Industry: 7.2% |
Advanced Drainage Systems, Inc., 144A, 5.000%, 09/30/27 (d) | | | 1,600,000 | | | | 1,494,520 | |
Advanced Drainage Systems, Inc., 144A, 6.375%, 06/15/30 (d) | | | 2,450,000 | | | | 2,383,875 | |
ASP Unifrax Holdings, Inc., 144A, 7.500%, 09/30/29 (d) | | | 1,875,000 | | | | 1,192,500 | |
ATI, Inc., 4.875%, 10/01/29 | | | 950,000 | | | | 840,755 | |
ATI, Inc., 5.125%, 10/01/31 | | | 950,000 | | | | 841,177 | |
Avient Corp., 144A, 7.125%, 08/01/30 (d) | | | 3,000,000 | | | | 2,936,646 | |
CVR Partners, LP/CVR Nitrogen Finance Corp., 144A, 6.125%, 06/15/28 (d) | | | 2,800,000 | | | | 2,515,543 | |
Great Lakes Dredge & Dock Corp., 144A, 5.250%, 06/01/29 (d) | | | 3,150,000 | | | | 2,452,905 | |
Interface, Inc., 144A, 5.500%, 12/01/28 (d) | | | 4,275,000 | | | | 3,535,581 | |
Koppers, Inc., 144A, 6.000%, 02/15/25 (d) | | | 3,472,000 | | | | 3,303,886 | |
MDC Holdings, Inc., 3.850%, 01/15/30 | | | 250,000 | | | | 204,025 | |
Mercer International, Inc., 5.500%, 01/15/26 | | | 1,075,000 | | | | 1,020,077 | |
| | 99 | SEE NOTES TO FINANCIAL STATEMENTS |
December 31, 2022 |
Schedules of Investments, continued |
Impax High Yield Bond Fund, continued
Percent of Net Assets
Name of Issuer and
Title of Issue | | Shares/
Principal/
Contracts | | | Value | |
CORPORATE BONDS, continued |
Basic Industry, continued |
Mercer International, Inc., 5.125%, 02/01/29 | | $ | 1,825,000 | | | $ | 1,528,401 | |
Novelis Corp., 144A, 4.750%, 01/30/30 (d) | | | 3,450,000 | | | | 3,066,429 | |
Olympus Water US Holding Corp., 144A, 4.250%, 10/01/28 (d) | | | 1,975,000 | | | | 1,605,978 | |
Olympus Water US Holding Corp., 144A, 6.250%, 10/01/29 (d) | | | 1,800,000 | | | | 1,368,911 | |
Shea Homes, LP/Funding Corp., 4.750%, 02/15/28 | | | 2,100,000 | | | | 1,836,844 | |
Shea Homes, LP/Funding Corp., 4.750%, 04/01/29 | | | 1,075,000 | | | | 905,628 | |
Standard Industries, Inc., 144A, 5.000%, 02/15/27 (d) | | | 2,700,000 | | | | 2,495,389 | |
Standard Industries, Inc., 144A, 4.375%, 07/15/30 (d) | | | 6,300,000 | | | | 5,147,159 | |
Taseko Mines, Ltd., 144A, 7.000%, 02/15/26 (d) | | | 1,650,000 | | | | 1,452,972 | |
| | | | | | | | 42,129,201 | |
Capital Goods: 7.3% |
ARD Finance SA, 144A, 6.500%, 06/30/27 (d) | | | 3,075,000 | | | | 2,143,621 | |
Ardagh Metal Packaging Finance USA, LLC/Finance PLC, 144A, 6.000%, 06/15/27 (d) | | | 875,000 | | | | 857,666 | |
Ardagh Metal Packaging Finance USA, LLC/Finance PLC, 144A, 3.250%, 09/01/28 (d) | | | 1,075,000 | | | | 914,519 | |
Ardagh Metal Packaging Finance USA, LLC/Finance PLC, 144A, 4.000%, 09/01/29 (d) | | | 1,275,000 | | | | 1,012,863 | |
Ardagh Packaging Finance, PLC/Holdings USA, Inc., 144A, 4.125%, 08/15/26 (d) | | | 1,600,000 | | | | 1,389,221 | |
Percent of Net Assets
Name of Issuer and
Title of Issue | | Shares/
Principal/
Contracts | | | Value | |
CORPORATE BONDS, continued |
Capital Goods, continued |
Ardagh Packaging Finance, PLC/Holdings USA, Inc., 144A, 5.250%, 08/15/27 (d) | | $ | 4,525,000 | | | $ | 3,390,682 | |
ATS Corp., 144A, 4.125%, 12/15/28 (d) | | | 3,150,000 | | | | 2,721,411 | |
Ball Corp., 6.875%, 03/15/28 | | | 2,000,000 | | | | 2,056,940 | |
Chart Industries, Inc., 144A, 7.500%, 01/01/30 (d) | | | 2,000,000 | | | | 2,013,080 | |
Chart Industries, Inc., 144A, 9.500%, 01/01/31 (d) | | | 1,300,000 | | | | 1,334,860 | |
Clydesdale Acquisition Holdings, Inc., 144A, 8.750%, 04/15/30 (d) | | | 1,800,000 | | | | 1,544,124 | |
GrafTech Finance, Inc., 144A, 4.625%, 12/15/28 (d) | | | 2,850,000 | | | | 2,344,674 | |
Graphic Packaging International, LLC, 144A, 3.750%, 02/01/30 (d) | | | 5,400,000 | | | | 4,596,772 | |
Howmet Aerospace, Inc., 5.900%, 02/01/27 | | | 1,075,000 | | | | 1,070,711 | |
Howmet Aerospace, Inc., 6.750%, 01/15/28 | | | 2,025,000 | | | | 2,055,628 | |
Howmet Aerospace, Inc., 5.950%, 02/01/37 | | | 2,000,000 | | | | 1,944,854 | |
Manitowoc Co, Inc., The, 144A, 9.000%, 04/01/26 (d) | | | 4,175,000 | | | | 3,930,316 | |
OI European Group BV, 144A, 4.750%, 02/15/30 (d) | | | 2,100,000 | | | | 1,842,005 | |
Owens-Brockway Glass Container, Inc., 144A, 6.375%, 08/15/25 (d) | | | 1,075,000 | | | | 1,055,048 | |
Owens-Brockway Glass Container, Inc., 144A, 6.625%, 05/13/27 (d) | | | 1,875,000 | | | | 1,822,045 | |
Terex Corp., 144A, 5.000%, 05/15/29 (d) | | | 3,150,000 | | | | 2,835,079 | |
| | | | | | | | 42,876,119 | |
Consumer Goods: 7.3% |
BellRing Brands, Inc., 144A, 7.000%, 03/15/30 (d) | | | 2,025,000 | | | | 1,951,138 | |
SEE NOTES TO FINANCIAL STATEMENTS | 100 | |
December 31, 2022 |
Schedules of Investments, continued |
Impax High Yield Bond Fund, continued
Percent of Net Assets
Name of Issuer and
Title of Issue | | Shares/
Principal/
Contracts | | | Value | |
CORPORATE BONDS, continued |
Consumer Goods, continued |
Darling Ingredients, Inc., 144A, 6.000%, 06/15/30 (d) | | $ | 5,800,000 | | | $ | 5,677,330 | |
Diamond BC BV, 144A, 4.625%, 10/01/29 (d) | | | 4,000,000 | | | | 3,215,200 | |
Lamb Weston Holdings, Inc., 144A, 4.125%, 01/31/30 (d) | | | 2,100,000 | | | | 1,857,555 | |
Lamb Weston Holdings, Inc., 144A, 4.375%, 01/31/32 (d) | | | 2,100,000 | | | | 1,837,805 | |
Land O’ Lakes, Inc., 144A, 7.000%, 09/18/28 (d) | | | 1,685,000 | | | | 1,485,538 | |
MajorDrive Holdings IV, LLC, 144A, 6.375%, 06/01/29 (d) | | | 1,100,000 | | | | 822,240 | |
Natura Cosmeticos SA, 144A, 4.125%, 05/03/28 (d) | | | 2,900,000 | | | | 2,369,924 | |
Newell Brands, Inc., 6.375%, 09/15/27 | | | 1,775,000 | | | | 1,763,995 | |
Newell Brands, Inc., 6.625%, 09/15/29 | | | 1,775,000 | | | | 1,756,735 | |
Performance Food Group, Inc., 144A, 5.500%, 10/15/27 (d) | | | 2,150,000 | | | | 2,032,374 | |
Performance Food Group, Inc., 144A, 4.250%, 08/01/29 (d) | | | 4,075,000 | | | | 3,536,285 | |
Post Holdings, Inc., 144A, 5.750%, 03/01/27 (d) | | | 758,000 | | | | 734,153 | |
Post Holdings, Inc., 144A, 5.500%, 12/15/29 (d) | | | 3,500,000 | | | | 3,174,500 | |
Post Holdings, Inc., 144A, 4.500%, 09/15/31 (d) | | | 3,075,000 | | | | 2,590,705 | |
Spectrum Brands, Inc., 144A, 5.000%, 10/01/29 (d) | | | 1,075,000 | | | | 932,085 | |
Spectrum Brands, Inc., 144A, 5.500%, 07/15/30 (d) | | | 1,075,000 | | | | 950,476 | |
Percent of Net Assets
Name of Issuer and
Title of Issue | | Shares/
Principal/
Contracts | | | Value | |
CORPORATE BONDS, continued |
Consumer Goods, continued |
Spectrum Brands, Inc., 144A, 3.875%, 03/15/31 (d) | | $ | 1,075,000 | | | $ | 837,462 | |
United Natural Foods, Inc., 144A, 6.750%, 10/15/28 (d) | | | 5,375,000 | | | | 5,173,061 | |
| | | | | | | | 42,698,561 | |
Financial Services: 2.7% |
Ally Financial, Inc., 5.750%, 11/20/25 | | | 1,700,000 | | | | 1,648,661 | |
Armor Holdco, Inc., 144A, 8.500%, 11/15/29 (d) | | | 1,575,000 | | | | 1,184,924 | |
Block, Inc., 2.750%, 06/01/26 | | | 1,075,000 | | | | 961,717 | |
Block, Inc., 3.500%, 06/01/31 | | | 3,800,000 | | | | 3,036,959 | |
OneMain Finance Corp., 6.875%, 03/15/25 | | | 525,000 | | | | 505,525 | |
OneMain Finance Corp., 3.500%, 01/15/27 | | | 2,850,000 | | | | 2,363,277 | |
OneMain Finance Corp., 6.625%, 01/15/28 | | | 1,975,000 | | | | 1,822,096 | |
OneMain Finance Corp., 5.375%, 11/15/29 | | | 1,825,000 | | | | 1,495,698 | |
PennyMac Financial Services, Inc., 144A, 4.250%, 02/15/29 (d) | | | 1,075,000 | | | | 839,982 | |
PennyMac Financial Services, Inc., 144A, 5.750%, 09/15/31 (d) | | | 2,600,000 | | | | 2,065,661 | |
| | | | | | | | 15,924,500 | |
Health Care: 8.8% |
AdaptHealth, LLC, 144A, 6.125%, 08/01/28 (d) | | | 2,075,000 | | | | 1,910,440 | |
AdaptHealth, LLC, 144A, 4.625%, 08/01/29 (d) | | | 1,075,000 | | | | 901,441 | |
Akumin Escrow, Inc., 144A, 7.500%, 08/01/28 (d) | | | 950,000 | | | | 579,952 | |
Akumin, Inc., 144A, 7.000%, 11/01/25 (d) | | | 1,275,000 | | | | 914,746 | |
Avantor Funding, Inc., 144A, 4.625%, 07/15/28 (d) | | | 5,600,000 | | | | 5,100,031 | |
Avantor Funding, Inc., 144A, 3.875%, 11/01/29 (d) | | | 2,100,000 | | | | 1,766,153 | |
Bausch Health Cos., Inc., 144A, 6.125%, 02/01/27 (d) | | | 1,900,000 | | | | 1,312,672 | |
| | 101 | SEE NOTES TO FINANCIAL STATEMENTS |
December 31, 2022 |
Schedules of Investments, continued |
Impax High Yield Bond Fund, continued
Percent of Net Assets
Name of Issuer and
Title of Issue | | Shares/
Principal/
Contracts | | | Value | |
CORPORATE BONDS, continued |
Health Care, continued |
Centene Corp., 4.250%, 12/15/27 | | $ | 1,075,000 | | | $ | 1,010,573 | |
Centene Corp., 4.625%, 12/15/29 | | | 7,125,000 | | | | 6,527,146 | |
Cheplapharm Arzneimittel GmbH, 144A, 5.500%, 01/15/28 (d) | | | 2,525,000 | | | | 2,115,395 | |
Encompass Health Corp., 4.750%, 02/01/30 | | | 2,875,000 | | | | 2,529,273 | |
Garden Spinco Corp., 144A, 8.625%, 07/20/30 (d) | | | 2,800,000 | | | | 2,972,046 | |
HealthEquity, Inc., 144A, 4.500%, 10/01/29 (d) | | | 2,050,000 | | | | 1,794,058 | |
IQVIA, Inc., 144A, 5.000%, 05/15/27 (d) | | | 3,350,000 | | | | 3,200,925 | |
Medline Borrower, LP, 144A, 5.250%, 10/01/29 (d) | | | 2,525,000 | | | | 2,010,039 | |
Organon & Co./Foreign Debt Co-Issuer BV, 144A, 4.125%, 04/30/28 (d) | | | 1,425,000 | | | | 1,264,189 | |
Organon & Co./Foreign Debt Co-Issuer BV, 144A, 5.125%, 04/30/31 (d) | | | 2,750,000 | | | | 2,385,997 | |
Prestige Brands, Inc., 144A, 5.125%, 01/15/28 (d) | | | 2,175,000 | | | | 2,045,113 | |
Prestige Brands, Inc., 144A, 3.750%, 04/01/31 (d) | | | 900,000 | | | | 743,351 | |
Tenet Healthcare Corp., 144A, 5.125%, 11/01/27 (d) | | | 5,000,000 | | | | 4,661,350 | |
Tenet Healthcare Corp., 144A, 6.125%, 10/01/28 (d) | | | 3,875,000 | | | | 3,477,541 | |
Tenet Healthcare Corp., 144A, 6.125%, 06/15/30 (d) | | | 2,450,000 | | | | 2,338,660 | |
| | | | | | | | 51,561,091 | |
Insurance: 0.5% |
GTCR AP Finance, Inc., 144A, 8.000%, 05/15/27 (d) | | | 3,150,000 | | | | 3,022,299 | |
| | | | | | | | | |
Percent of Net Assets
Name of Issuer and
Title of Issue | | Shares/
Principal/
Contracts | | | Value | |
CORPORATE BONDS, continued |
Leisure: 2.2% |
Lindblad Expeditions, LLC, 144A, 6.750%, 02/15/27 (d) | | $ | 3,025,000 | | | $ | 2,747,971 | |
MGM Resorts International, 6.750%, 05/01/25 | | | 1,075,000 | | | | 1,082,171 | |
MGM Resorts International, 5.500%, 04/15/27 | | | 2,475,000 | | | | 2,305,881 | |
Park Intermediate Holdings, LLC/PK Domestic Property, LLC/PK Finance Co-Issuer, 144A, 5.875%, 10/01/28 (d) | | | 1,050,000 | | | | 953,501 | |
Park Intermediate Holdings, LLC/PK Domestic Property, LLC/PK Finance Co-Issuer, 144A, 4.875%, 05/15/29 (d) | | | 3,600,000 | | | | 3,052,080 | |
Viking Ocean Cruises Ship VII, Ltd., 144A, 5.625%, 02/15/29 (d) | | | 3,150,000 | | | | 2,539,845 | |
| | | | | | | | 12,681,449 | |
Media: 10.9% |
Arches Buyer, Inc., 144A, 4.250%, 06/01/28 (d) | | | 3,550,000 | | | | 2,781,217 | |
Cars.com, Inc., 144A, 6.375%, 11/01/28 (d) | | | 3,750,000 | | | | 3,335,578 | |
CCO Holdings, LLC/Capital Corp., 144A, 5.125%, 05/01/27 (d) | | | 1,075,000 | | | | 1,004,340 | |
CCO Holdings, LLC/Capital Corp., 144A, 5.375%, 06/01/29 (d) | | | 3,275,000 | | | | 2,968,869 | |
CCO Holdings, LLC/Capital Corp., 144A, 4.750%, 03/01/30 (d) | | | 8,375,000 | | | | 7,241,862 | |
CCO Holdings, LLC/Capital Corp., 4.500%, 05/01/32 | | | 3,925,000 | | | | 3,131,856 | |
Cimpress, PLC, 144A, 7.000%, 06/15/26 (d) | | | 3,150,000 | | | | 2,182,572 | |
Clear Channel International BV, 144A, 6.625%, 08/01/25 (d) | | | 1,000,000 | | | | 955,784 | |
SEE NOTES TO FINANCIAL STATEMENTS | 102 | |
December 31, 2022 |
Schedules of Investments, continued |
Impax High Yield Bond Fund, continued
Percent of Net Assets
Name of Issuer and
Title of Issue | | Shares/
Principal/
Contracts | | | Value | |
CORPORATE BONDS, continued |
Media, continued |
Clear Channel Outdoor Holdings, Inc., 144A, 7.750%, 04/15/28 (d) | | $ | 2,500,000 | | | $ | 1,828,261 | |
CSC Holdings, LLC, 144A, 7.500%, 04/01/28 (d) | | | 2,175,000 | | | | 1,483,785 | |
CSC Holdings, LLC, 144A, 6.500%, 02/01/29 (d) | | | 800,000 | | | | 655,692 | |
CSC Holdings, LLC, 144A, 5.750%, 01/15/30 (d) | | | 2,725,000 | | | | 1,542,881 | |
CSC Holdings, LLC, 144A, 4.625%, 12/01/30 (d) | | | 2,725,000 | | | | 1,511,936 | |
CSC Holdings, LLC, 144A, 4.125%, 12/01/30 (d) | | | 2,025,000 | | | | 1,433,771 | |
DIRECTV Holdings, LLC/Financing Co.-Obligor, Inc., 144A, 5.875%, 08/15/27 (d) | | | 2,950,000 | | | | 2,644,852 | |
DISH DBS Corp., 5.875%, 11/15/24 | | | 2,375,000 | | | | 2,211,823 | |
DISH DBS Corp., 7.375%, 07/01/28 | | | 2,025,000 | | | | 1,435,978 | |
DISH DBS Corp., 5.125%, 06/01/29 | | | 925,000 | | | | 598,461 | |
Gray Escrow II, Inc., 144A, 5.375%, 11/15/31 (d) | | | 2,875,000 | | | | 2,077,001 | |
Gray Television, Inc., 144A, 4.750%, 10/15/30 (d) | | | 3,175,000 | | | | 2,301,875 | |
iHeartCommunications, Inc., 8.375%, 05/01/27 | | | 1,900,000 | | | | 1,619,726 | |
iHeartCommunications, Inc., 144A, 5.250%, 08/15/27 (d) | | | 1,675,000 | | | | 1,421,511 | |
iHeartCommunications, Inc., 144A, 4.750%, 01/15/28 (d) | | | 2,025,000 | | | | 1,652,238 | |
Nexstar Media, Inc., 144A, 5.625%, 07/15/27 (d) | | | 2,725,000 | | | | 2,505,331 | |
Nexstar Media, Inc., 144A, 4.750%, 11/01/28 (d) | | | 3,050,000 | | | | 2,642,856 | |
Sirius XM Radio, Inc., 144A, 4.000%, 07/15/28 (d) | | | 3,400,000 | | | | 2,965,548 | |
Sirius XM Radio, Inc., 144A, 5.500%, 07/01/29 (d) | | | 1,175,000 | | | | 1,075,166 | |
Percent of Net Assets
Name of Issuer and
Title of Issue | | Shares/
Principal/
Contracts | | | Value | |
CORPORATE BONDS, continued |
Media, continued |
Sirius XM Radio, Inc., 144A, 4.125%, 07/01/30 (d) | | $ | 2,025,000 | | | $ | 1,675,617 | |
Univision Communications, Inc., 144A, 4.500%, 05/01/29 (d) | | | 4,575,000 | | | | 3,834,468 | |
VTR Comunicaciones SpA, 144A, 5.125%, 01/15/28 (d) | | | 1,803,000 | | | | 1,122,606 | |
VTR Finance NV, 144A, 6.375%, 07/15/28 (d) | | | 1,175,000 | | | | 455,660 | |
| | | | | | | | 64,299,121 | |
Real Estate: 4.3% |
Five Point Operating Co., LP/Capital Corp., 144A, 7.875%, 11/15/25 (d) | | | 3,595,000 | | | | 3,027,713 | |
HAT Holdings I, LLC/HAT Holdings II, LLC, 144A, 6.000%, 04/15/25 (d) | | | 1,475,000 | | | | 1,430,750 | |
HAT Holdings I ,LLC/HAT Holdings II, LLC, 144A, 3.375%, 06/15/26 (d) | | | 4,150,000 | | | | 3,611,289 | |
Iron Mountain, Inc., 144A, 5.000%, 07/15/28 (d) | | | 1,075,000 | | | | 967,447 | |
Iron Mountain, Inc., 144A, 4.875%, 09/15/29 (d) | | | 5,050,000 | | | | 4,413,093 | |
Kennedy-Wilson, Inc., 4.750%, 02/01/30 | | | 1,925,000 | | | | 1,470,315 | |
Kennedy-Wilson, Inc., 5.000%, 03/01/31 | | | 2,175,000 | | | | 1,640,108 | |
Rithm Capital Corp., 144A, 6.250%, 10/15/25 (d) | | | 2,175,000 | | | | 1,955,063 | |
Uniti Group, LP/Finance, Inc./CSL Capital, LLC, 144A, 4.750%, 04/15/28 (d) | | | 3,075,000 | | | | 2,464,505 | |
Uniti Group, LP/Finance, Inc./CSL Capital, LLC, 144A, 6.500%, 02/15/29 (d) | | | 2,075,000 | | | | 1,378,568 | |
VICI Properties, LP/VICI Note Co., Inc., 144A, 4.625%, 12/01/29 (d) | | | 3,250,000 | | | | 2,962,960 | |
| | | | | | | | 25,321,811 | |
| | 103 | SEE NOTES TO FINANCIAL STATEMENTS |
December 31, 2022 |
Schedules of Investments, continued |
Impax High Yield Bond Fund, continued
Percent of Net Assets
Name of Issuer and
Title of Issue | | Shares/
Principal/
Contracts | | | Value | |
CORPORATE BONDS, continued |
Retail: 6.7% |
Albertsons Cos., Inc./Safeway, Inc./New Albertsons, LP/Albertsons, LLC, 144A, 4.625%, 01/15/27 (d) | | $ | 2,200,000 | | | $ | 2,048,354 | |
Albertsons Cos., Inc./Safeway, Inc./New Albertsons, LP/Albertsons, LLC, 144A, 3.500%, 03/15/29 (d) | | | 1,175,000 | | | | 988,398 | |
Bath & Body Works, Inc., 144A, 6.625%, 10/01/30 (d) | | | 2,750,000 | | | | 2,585,311 | |
Bath & Body Works, Inc., 6.950%, 03/01/33 | | | 2,400,000 | | | | 2,109,613 | |
Crocs, Inc., 144A, 4.250%, 03/15/29 (d) | | | 2,600,000 | | | | 2,205,775 | |
Crocs, Inc., 144A, 4.125%, 08/15/31 (d) | | | 3,050,000 | | | | 2,489,486 | |
Macy’s Retail Holdings, LLC, 144A, 5.875%, 04/01/29 (d) | | | 825,000 | | | | 731,670 | |
Macy’s Retail Holdings, LLC, 144A, 6.125%, 03/15/32 (d) | | | 1,525,000 | | | | 1,284,050 | |
Macy’s Retail Holdings, LLC, 144A, 6.700%, 07/15/34 (d) | | | 2,700,000 | | | | 2,259,252 | |
Macy’s Retail Holdings, LLC, 5.125%, 01/15/42 | | | 1,000,000 | | | | 655,230 | |
Michaels Cos., Inc., The, 144A, 5.250%, 05/01/28 (d) | | | 3,250,000 | | | | 2,618,641 | |
Michaels Cos., Inc., The, 144A, 7.875%, 05/01/29 (d) | | | 2,075,000 | | | | 1,390,143 | |
New Albertsons, LP, 7.750%, 06/15/26 | | | 1,025,000 | | | | 1,047,694 | |
NMG Holding Co., Inc./Neiman Marcus Group, LLC, 144A, 7.125%, 04/01/26 (d) | | | 4,100,000 | | | | 3,850,259 | |
Percent of Net Assets
Name of Issuer and
Title of Issue | | Shares/
Principal/
Contracts | | | Value | |
CORPORATE BONDS, continued |
Retail, continued |
PetSmart, Inc./Finance Corp., 144A, 4.750%, 02/15/28 (d) | | $ | 1,850,000 | | | $ | 1,678,342 | |
PetSmart, Inc./Finance Corp., 144A, 7.750%, 02/15/29 (d) | | | 2,075,000 | | | | 1,952,715 | |
Safeway, Inc., 7.250%, 02/01/31 | | | 2,925,000 | | | | 2,913,549 | |
SEG Holding, LLC/Finance Corp., 144A, 5.625%, 10/15/28 (d) | | | 3,800,000 | | | | 3,583,476 | |
Victoria’s Secret & Co., 144A, 4.625%, 07/15/29 (d) | | | 3,775,000 | | | | 2,968,660 | |
| | | | | | | | 39,360,618 | |
Services: 9.4% |
Albion Financing 1 SARL/Aggreko Holdings, Inc., 144A, 6.125%, 10/15/26 (d) | | | 1,825,000 | | | | 1,630,145 | |
Albion Financing 2 SARL, 144A, 8.750%, 04/15/27 (d) | | | 950,000 | | | | 813,717 | |
BCPE Ulysses Intermediate, Inc., 144A, 7.750%, 04/01/27 (d) | | | 575,000 | | | | 356,017 | |
Camelot Finance SA, 144A, 4.500%, 11/01/26 (d) | | | 2,175,000 | | | | 2,041,891 | |
Clarivate Science Holdings Corp., 144A, 3.875%, 07/01/28 (d) | | | 2,425,000 | | | | 2,103,872 | |
Dycom Industries, Inc., 144A, 4.500%, 04/15/29 (d) | | | 3,250,000 | | | | 2,833,478 | |
GFL Environmental, Inc., 144A, 4.000%, 08/01/28 (d) | | | 2,925,000 | | | | 2,504,721 | |
GPD Cos., Inc., 144A, 10.125%, 04/01/26 (d) | | | 3,725,000 | | | | 3,181,448 | |
GYP Holdings III Corp., 144A, 4.625%, 05/01/29 (d) | | | 4,450,000 | | | | 3,639,067 | |
Hertz Corp, The, 144A, 5.000%, 12/01/29 (d) | | | 3,475,000 | | | | 2,640,653 | |
SEE NOTES TO FINANCIAL STATEMENTS | 104 | |
December 31, 2022 |
Schedules of Investments, continued |
Impax High Yield Bond Fund, continued
Percent of Net Assets
Name of Issuer and
Title of Issue | | Shares/
Principal/
Contracts | | | Value | |
CORPORATE BONDS, continued |
Services, continued |
LBM Acquisition, LLC, 144A, 6.250%, 01/15/29 (d) | | $ | 2,125,000 | | | $ | 1,355,010 | |
Maxim Crane Works Holdings Capital, LLC, 144A, 10.125%, 08/01/24 (d) | | | 3,633,000 | | | | 3,534,944 | |
NESCO Holdings II, Inc., 144A, 5.500%, 04/15/29 (d) | | | 2,975,000 | | | | 2,606,993 | |
Prime Security Services Borrower, LLC/Finance, Inc., 144A, 5.750%, 04/15/26 (d) | | | 2,050,000 | | | | 1,977,635 | |
Prime Security Services Borrower, LLC/Finance, Inc., 144A, 6.250%, 01/15/28 (d) | | | 6,600,000 | | | | 6,020,651 | |
Staples, Inc., 144A, 7.500%, 04/15/26 (d) | | | 3,325,000 | | | | 2,868,611 | |
Staples, Inc., 144A, 10.750%, 04/15/27 (d) | | | 2,925,000 | | | | 2,110,914 | |
United Rentals North America, Inc., 5.250%, 01/15/30 | | | 2,550,000 | | | | 2,400,455 | |
WASH Multifamily Acquisition, Inc., 144A, 5.750%, 04/15/26 (d) | | | 3,150,000 | | | | 2,972,513 | |
White Cap Buyer, LLC, 144A, 6.875%, 10/15/28 (d) | | | 1,800,000 | | | | 1,559,959 | |
Williams Scotsman International, Inc., 144A, 4.625%, 08/15/28 (d) | | | 2,450,000 | | | | 2,215,045 | |
WW International, Inc., 144A, 4.500%, 04/15/29 (d) | | | 3,250,000 | | | | 1,627,893 | |
ZipRecruiter, Inc., 144A, 5.000%, 01/15/30 (d) | | | 2,625,000 | | | | 2,167,515 | |
| | | | | | | | 55,163,147 | |
Technology & Electronics: 7.9% |
Castle US Holding Corp., 144A, 9.500%, 02/15/28 (d) | | | 1,625,000 | | | | 646,953 | |
Ciena Corp., 144A, 4.000%, 01/31/30 (d) | | | 1,625,000 | | | | 1,432,251 | |
Percent of Net Assets
Name of Issuer and
Title of Issue | | Shares/
Principal/
Contracts | | | Value | |
CORPORATE BONDS, continued |
Technology & Electronics, continued |
Coherent Corp., 144A, 5.000%, 12/15/29 (d) | | $ | 3,625,000 | | | $ | 3,131,021 | |
CommScope, Inc., 144A, 6.000%, 03/01/26 (d) | | | 1,850,000 | | | | 1,711,158 | |
CommScope, Inc., 144A, 8.250%, 03/01/27 (d) | | | 2,225,000 | | | | 1,727,891 | |
CommScope, Inc., 144A, 7.125%, 07/01/28 (d) | | | 2,400,000 | | | | 1,719,585 | |
Condor Merger Sub, Inc., 144A, 7.375%, 02/15/30 (d) | | | 1,650,000 | | | | 1,329,596 | |
Diebold Nixdorf, Inc., 144A, 9.375%, 07/15/25 (d) | | | 2,652,000 | | | | 1,896,578 | |
Endurance International Group Holdings, Inc., 144A, 6.000%, 02/15/29 (d) | | | 4,175,000 | | | | 2,875,323 | |
Entegris Escrow Corp., 144A, 5.950%, 06/15/30 (d) | | | 2,125,000 | | | | 1,962,438 | |
GoTo Group, Inc., 144A, 5.500%, 09/01/27 (d) | | | 3,750,000 | | | | 2,022,757 | |
Imola Merger Corp., 144A, 4.750%, 05/15/29 (d) | | | 3,625,000 | | | | 3,152,403 | |
NCR Corp., 144A, 5.125%, 04/15/29 (d) | | | 5,675,000 | | | | 4,756,263 | |
Nokia Oyj, 6.625%, 05/15/39 | | | 1,450,000 | | | | 1,378,858 | |
NortonLifeLock, Inc., 144A, 6.750%, 09/30/27 (d) | | | 2,000,000 | | | | 1,962,600 | |
NortonLifeLock, Inc., 144A, 7.125%, 09/30/30 (d) | | | 1,150,000 | | | | 1,131,428 | |
Open Text Corp., 144A, 6.900%, 12/01/27 (d) | | | 2,000,000 | | | | 2,002,600 | |
PTC, Inc., 144A, 4.000%, 02/15/28 (d) | | | 1,675,000 | | | | 1,510,436 | |
Rackspace Technology Global, Inc., 144A, 5.375%, 12/01/28 (d) | | | 1,350,000 | | | | 590,593 | |
Sensata Technologies BV, 144A, 5.875%, 09/01/30 (d) | | | 3,325,000 | | | | 3,155,991 | |
VM Consolidated, Inc., 144A, 5.500%, 04/15/29 (d) | | | 3,850,000 | | | | 3,395,931 | |
| | 105 | SEE NOTES TO FINANCIAL STATEMENTS |
December 31, 2022 |
Schedules of Investments, continued |
Impax High Yield Bond Fund, continued
Percent of Net Assets
Name of Issuer and
Title of Issue | | Shares/
Principal/
Contracts | | | Value | |
CORPORATE BONDS, continued |
Technology & Electronics, continued |
ZoomInfo Technologies, LLC/Finance Corp., 144A, 3.875%, 02/01/29 (d) | | $ | 3,225,000 | | | $ | 2,714,345 | |
| | | | | | | | 46,206,999 | |
Telecommunications: 9.1% |
Altice Financing SA, 144A, 5.750%, 08/15/29 (d) | | | 2,100,000 | | | | 1,655,720 | |
Altice France Holding SA, 144A, 10.500%, 05/15/27 (d) | | | 4,200,000 | | | | 3,211,530 | |
Altice France Holding SA, 144A, 6.000%, 02/15/28 (d) | | | 1,025,000 | | | | 607,253 | |
Altice France SA, 144A, 5.500%, 01/15/28 (d) | | | 3,275,000 | | | | 2,571,759 | |
Altice France SA, 144A, 5.125%, 07/15/29 (d) | | | 2,850,000 | | | | 2,141,855 | |
Cogent Communications Group, Inc., 144A, 7.000%, 06/15/27 (d) | | | 3,450,000 | | | | 3,385,063 | |
Digicel International Finance, Ltd./Holdings, Ltd., 144A, 8.750%, 05/25/24 (d) | | | 1,000,000 | | | | 861,580 | |
Digicel, Ltd., 144A, 6.750%, 03/01/23 (d) | | | 900,000 | | | | 346,122 | |
Frontier Communications Holdings, LLC, 144A, 5.000%, 05/01/28 (d) | | | 2,150,000 | | | | 1,879,122 | |
Frontier Communications Holdings, LLC, 144A, 6.750%, 05/01/29 (d) | | | 1,075,000 | | | | 890,777 | |
Frontier Communications Holdings, LLC, 144A, 8.750%, 05/15/30 (d) | | | 900,000 | | | | 916,825 | |
LCPR Senior Secured Financing DAC, 144A, 6.750%, 10/15/27 (d) | | | 1,255,000 | | | | 1,176,337 | |
LCPR Senior Secured Financing DAC, 144A, 5.125%, 07/15/29 (d) | | | 2,450,000 | | | | 2,033,201 | |
Level 3 Financing, Inc., 144A, 4.625%, 09/15/27 (d) | | | 1,925,000 | | | | 1,605,931 | |
Percent of Net Assets
Name of Issuer and
Title of Issue | | Shares/
Principal/
Contracts | | | Value | |
CORPORATE BONDS, continued |
Telecommunications, continued |
Ligado Networks, LLC, 144A, 15.500%, 11/01/23 (d) | | $ | 2,816,499 | | | $ | 846,171 | |
Lumen Technologies, Inc., 144A, 5.125%, 12/15/26 (d) | | | 3,075,000 | | | | 2,678,033 | |
Lumen Technologies, Inc., 144A, 4.000%, 02/15/27 (d) | | | 900,000 | | | | 764,714 | |
Lumen Technologies, Inc., 144A, 5.375%, 06/15/29 (d) | | | 2,000,000 | | | | 1,442,526 | |
Sable International Finance, Ltd., 144A, 5.750%, 09/07/27 (d) | | | 2,464,000 | | | | 2,277,352 | |
Sprint Capital Corp., 6.875%, 11/15/28 | | | 2,025,000 | | | | 2,106,395 | |
Sprint Capital Corp., 8.750%, 03/15/32 | | | 1,950,000 | | | | 2,325,092 | |
Sprint, LLC, 7.125%, 06/15/24 | | | 3,725,000 | | | | 3,805,981 | |
Telecom Italia Capital SA, 7.200%, 07/18/36 | | | 1,625,000 | | | | 1,322,035 | |
Telecom Italia SpA, 144A, 5.303%, 05/30/24 (d) | | | 1,225,000 | | | | 1,163,138 | |
T-Mobile USA, Inc., 4.750%, 02/01/28 | | | 2,200,000 | | | | 2,143,884 | |
T-Mobile USA, Inc., 3.375%, 04/15/29 | | | 3,100,000 | | | | 2,736,353 | |
Virgin Media Finance, PLC, 144A, 5.000%, 07/15/30 (d) | | | 925,000 | | | | 743,418 | |
Virgin Media Secured Finance, PLC, 144A, 5.500%, 05/15/29 (d) | | | 1,625,000 | | | | 1,459,356 | |
Vmed O2 UK Financing I, PLC, 144A, 4.750%, 07/15/31 (d) | | | 2,100,000 | | | | 1,710,041 | |
VZ Secured Financing BV, 144A, 5.000%, 01/15/32 (d) | | | 3,250,000 | | | | 2,646,902 | |
| | | | | | | | 53,454,466 | |
Transportation: 0.4% |
Promontoria Holding 264 BV, 144A, 7.875%, 03/01/27 (d) | | | 2,600,000 | | | | 2,411,569 | |
SEE NOTES TO FINANCIAL STATEMENTS | 106 | |
December 31, 2022 |
Schedules of Investments, continued |
Impax High Yield Bond Fund, continued
Percent of Net Assets
Name of Issuer and
Title of Issue | | Shares/
Principal/
Contracts | | | Value | |
CORPORATE BONDS, continued |
Utility: 2.7% |
Clearway Energy Operating, LLC, 144A, 4.750%, 03/15/28 (d) | | $ | 2,175,000 | | | $ | 2,010,778 | |
Clearway Energy Operating, LLC, 144A, 3.750%, 02/15/31 (d) | | | 1,925,000 | | | | 1,600,684 | |
Clearway Energy Operating, LLC, 144A, 3.750%, 01/15/32 (d) | | | 1,150,000 | | | | 926,159 | |
Leeward Renewable Energy Operations, LLC, 144A, 4.250%, 07/01/29 (d) | | | 4,500,000 | | | | 3,850,505 | |
Pattern Energy Operations, LP/Inc., 144A, 4.500%, 08/15/28 (d) | | | 2,650,000 | | | | 2,380,772 | |
Sunnova Energy Corp., 144A, 5.875%, 09/01/26 (d) | | | 2,900,000 | | | | 2,594,456 | |
TerraForm Power Operating, LLC, 144A, 5.000%, 01/31/28 (d) | | | 1,075,000 | | | | 969,338 | |
TerraForm Power Operating, LLC, 144A, 4.750%, 01/15/30 (d) | | | 2,025,000 | | | | 1,765,341 | |
| | | | | | | | 16,098,033 | |
TOTAL CORPORATE BONDS |
(Cost $635,159,310) | | | 544,708,719 | |
| | | | | | | | | |
LOANS: 2.8% |
Basic Industry: 0.6% |
Aruba Investments Holdings, LLC, aka Angus Chemical, 8.387%, 11/24/27 (e) | | | 1,790,932 | | | | 1,744,672 | |
ASP Unifrax Holdings, Inc., 8.486%, 12/12/25 (e) | | | 1,989,637 | | | | 1,775,135 | |
| | | | | | | | 3,519,807 | |
Consumer Goods: 0.8% |
AI Aqua Merger Sub, Inc., aka Culligan, 8.323%, 07/30/28 (e) | | | 1,990,000 | | | | 1,879,306 | |
Whole Earth Brands, Inc., 8.720%, 02/05/28 (e) | | | 3,023,835 | | | | 2,793,267 | |
| | | | | | | | 4,672,573 | |
Percent of Net Assets
Name of Issuer and
Title of Issue | | Shares/
Principal/
Contracts | | | Value | |
LOANS, continued |
Health Care: 0.5% |
Medline Borrower, LP, 7.636%, 10/21/28 (e) | | $ | 3,000,000 | | | $ | 2,856,315 | |
| |
Technology & Electronics: 0.3% |
McAfee Corp., 8.108%, 03/01/29 (e) | | | 1,741,250 | | | | 1,625,579 | |
| |
Telecommunications: 0.1% |
Digicel International Finance, Ltd., 7.690%, 05/27/24 (e) | | | 979,333 | | | | 828,271 | |
| |
Transportation: 0.5% |
SkyMiles IP, Ltd., aka Delta Airlines, Inc., 8.476%, 10/20/27 (e) | | | 3,000,000 | | | | 3,063,570 | |
| | | | | | | | | |
TOTAL LOANS |
(Cost $17,216,374) | | | 16,566,115 | |
| | | | | | | | | |
TOTAL BONDS |
(Cost $653,296,739) | | | 562,185,977 | |
| | | | | | | | | |
CERTIFICATES OF DEPOSIT: 0.1% |
Shared Interest, Inc., 0.550%, 09/30/24 (b) | | | 500,000 | | | | 500,000 | |
(Cost $500,000) |
| |
MONEY MARKET: 2.2% |
State Street Institutional U.S. Government Money Market Fund, 4.120% (f)(g) | | | 12,713,034 | | | | 12,713,034 | |
(Cost $12,713,034) |
| | | | | | | | | |
TOTAL INVESTMENTS: 98.3% |
(Cost $668,047,094) | | | 576,681,072 | |
| | | | | | | | | |
Other assets and liabilities — (NET): 1.7% | | | 9,910,582 | |
| | | | | | | | | |
NET ASSETS: 100.0% | | $ | 586,591,654 | |
(a) | Non-income producing security. |
(c) | Security valued using significant unobservable inputs. |
| | 107 | SEE NOTES TO FINANCIAL STATEMENTS |
December 31, 2022 |
Schedules of Investments, continued |
Impax High Yield Bond Fund, continued
(d) | Security purchased pursuant to Rule 144A of the Securities Act of 1933 and may be resold only to qualified institutional buyers. |
(e) | Rate shown reflects the accrual rate as of December 31, 2022 on securities with variable or step rates. |
(f) | Rate shown represents annualized 7-day yield as of December 31, 2022. |
LP-Limited Partnership
SEE NOTES TO FINANCIAL STATEMENTS | 108 | |
December 31, 2022 |
Schedules of Investments, continued |
Impax Sustainable Allocation Fund
Percent of Net Assets
Name of Issuer and
Title of Issue | | Shares/
Principal | | | Value | |
Affiliated Investment Companies: 97.7% |
Impax Core Bond Fund (a) | | $ | 85,316,699 | | | $ | 740,548,945 | |
Impax Ellevate Global Women’s Leadership Fund (a) | | | 2,057,973 | | | | 56,491,351 | |
Impax Global Environmental Markets Fund (a) | | | 2,635,835 | | | | 51,609,644 | |
Impax Global Opportunities Fund (a) | | | 4,082,111 | | | | 56,129,027 | |
Impax Global Sustainable Infrastructure Fund (a) | | | 7,971,319 | | | | 68,314,199 | |
Impax High Yield Bond Fund (a) | | | 16,220,310 | | | | 92,617,968 | |
Impax International Sustainable Economy Fund (a) | | | 11,578,384 | | | | 99,689,886 | |
Impax Large Cap Fund (a) | | | 75,268,533 | | | | 870,104,236 | |
Impax Small Cap Fund (a) | | | 4,176,980 | | | | 59,689,044 | |
| |
TOTAL AFFILIATED INVESTMENT COMPANIES |
(Cost $2,054,120,702) | | | 2,095,194,300 | |
| | | | | | | | | |
MONEY MARKET: 2.2% |
State Street Institutional U.S. Government Money Market Fund, 4.120% (b)(c) | | | 47,588,604 | | | | 47,588,604 | |
(Cost $47,588,604) |
| | | | | | | | | |
TOTAL INVESTMENTS: 99.9% |
(Cost $2,101,709,306) | | | 2,142,782,904 | |
| | | | | | | | | |
Other assets and liabilities — (NET): 0.1% | | | 2,147,867 | |
| | | | | | | | | |
NET ASSETS: 100.0% | | $ | 2,144,930,771 | |
(a) | Institutional Class shares |
(b) | Rate shown represents annualized 7-day yield as of December 31, 2022. |
| | 109 | SEE NOTES TO FINANCIAL STATEMENTS |
December 31, 2022 |
Statements of Assets and Liabilities |
| | Large Cap
Fund | | | Small Cap
Fund | | | US
Sustainable
Economy
Fund | | | Global
Sustainable
Infrastructure
Fund | |
ASSETS | | | | | | | | | | | | | | | | |
Investments, at cost - Note A | | $ | 1,078,318,444 | | | $ | 595,099,356 | | | $ | 179,459,528 | | | $ | 114,428,789 | |
| | | | | | | | | | | | | | | | | |
Investments in unaffiliated issuers, at value | | $ | 1,347,788,145 | | | $ | 589,162,416 | | | $ | 248,465,045 | | | $ | 107,569,081 | |
Investments in affiliated issuers, at value | | | — | | | | — | | | | — | | | | — | |
Total investments, at value - Note A1 | | | 1,347,788,145 | | | | 589,162,416 | | | | 248,465,045 | | | | 107,569,081 | |
Cash | | | 163,326 | | | | — | | | | 5,565 | | | | 5 | |
Foreign currency at value (cost $38,476; $1,144,228; and $251,201, respectively) | | | — | | | | — | | | | — | | | | 38,476 | |
Prepaid expenses | | | 17,875 | | | | 10,480 | | | | — | | | | — | |
Receivables: | | | | | | | | | | | | | | | | |
Capital stock sold | | | 1,350,465 | | | | 5,273,773 | | | | 166,091 | | | | 142,256 | |
Dividends and interest - Note A | | | 937,881 | | | | 271,166 | | | | 306,869 | | | | 192,735 | |
Investment securities sold | | | — | | | | — | | | | — | | | | — | |
Investment Adviser reimbursement | | | — | | | | — | | | | — | | | | — | |
Other | | | 979 | | | | 2,021 | | | | 30 | | | | 73,768 | |
Total Assets | | | 1,350,258,671 | | | | 594,719,856 | | | | 248,943,600 | | | | 108,016,321 | |
| | | | | | | | | | | | | | | | | |
LIABILITIES | | | | | | | | | | | | | | | | |
Collateral on securities loaned, at value | | | 192,900 | | | | 45,060 | | | | 216,092 | | | | 1,035,336 | |
Payables: | | | | | | | | | | | | | | | | |
Capital stock reacquired | | | 467,251 | | | | 5,235,514 | | | | 57,723 | | | | 43,899 | |
Investment securities purchased | | | — | | | | 330,781 | | | | — | | | | 48,464 | |
Dividend payable - Note A | | | — | | | | — | | | | — | | | | — | |
Payable to bank | | | — | | | | — | | | | — | | | | — | |
Payable to foreign banks (cost $33) | | | — | | | | — | | | | — | | | | — | |
Accrued expenses: | | | | | | | | | | | | | | | | |
Investment advisory fees - Note B | | | 760,888 | | | | 385,154 | | | | 97,278 | | | | 49,534 | |
Distribution expense | | | 12,992 | | | | 22,931 | | | | 36,341 | | | | 1,280 | |
Transfer agent fees | | | 78,537 | | | | 114,589 | | | | — | | | | — | |
Printing and other shareholder communication fees | | | — | | | | — | | | | — | | | | — | |
Custodian fees | | | 17,699 | | | | 9,710 | | | | — | | | | — | |
Legal and audit fees | | | 42,252 | | | | 34,195 | | | | — | | | | — | |
Other accrued expenses | | | 31,708 | | | | 59,520 | | | | — | | | | — | |
Total Liabilities | | | 1,604,227 | | | | 6,237,454 | | | | 407,434 | | | | 1,178,513 | |
NET ASSETS | | $ | 1,348,654,444 | | | $ | 588,482,402 | | | $ | 248,536,166 | | | $ | 106,837,808 | |
1 | Investments at market value include securities loaned. At December 31, 2022, the Large Cap Fund, Small Cap Fund, US Sustainable Economy Fund, Global Sustainable Infrastructure Fund, Global Women’s Leadership Fund, International Sustainable Economy Fund and Core Bond Fund had total market values of securities on loan of $188,043; $13,786,178; $309,740; $2,263,989; $359,169; $18,582,768 and $66,355,545, respectively. |
SEE NOTES TO FINANCIAL STATEMENTS | 110 | |
| | Global
Opportunities
Fund | | | Global
Environmental
Markets Fund | | | Global
Women’s
Leadership
Fund | | | International
Sustainable
Economy
Fund | | | Core Bond
Fund | | | High Yield
Bond Fund | | | Sustainable
Allocation
Fund | |
| | | | | | | | | | | | | | | | | | | | | | | | | | | | |
| | $ | 91,378,754 | | | $ | 1,910,810,373 | | | $ | 700,158,630 | | | $ | 793,648,566 | | | $ | 936,469,653 | | | $ | 668,047,094 | | | $ | 2,101,709,306 | |
| | | | | | | | | | | | | | | | | | | | | | | | | | | | |
| | $ | 102,894,929 | | | $ | 2,206,076,365 | | | $ | 772,017,952 | | | $ | 827,577,393 | | | $ | 850,437,814 | | | $ | 576,681,072 | | | $ | 47,588,604 | |
| | | — | | | | — | | | | — | | | | — | | | | — | | | | — | | | | 2,095,194,300 | |
| | | 102,894,929 | | | | 2,206,076,365 | | | | 772,017,952 | | | | 827,577,393 | | | | 850,437,814 | | | | 576,681,072 | | | | 2,142,782,904 | |
| | | — | | | | 178,353 | | | | 3 | | | | — | | | | 8,511 | | | | 621,839 | | | | — | |
| | | 1,141,802 | | | | — | | | | 252,295 | | | | — | | | | — | | | | — | | | | — | |
| | | 1,544 | | | | 10,876 | | | | — | | | | — | | | | 4,182 | | | | 2,045 | | | | — | |
| | | | | | | | | | | | | | | | | | | | | | | | | | | | |
| | | 838,412 | | | | 3,477,410 | | | | 1,461,811 | | | | 1,330,664 | | | | 65,002 | | | | 1,082,786 | | | | 3,120,583 | |
| | | 32,156 | | | | 1,693,263 | | | | 1,000,443 | | | | 922,181 | | | | 4,564,674 | | | | 9,510,920 | | | | 160,472 | |
| | | 343,787 | | | | — | | | | 316,306 | | | | — | | | | — | | | | 4,171,500 | | | | — | |
| | | 11,460 | | | | — | | | | — | | | | — | | | | — | | | | — | | | | — | |
| | | 35,139 | | | | 1,349,458 | | | | 433,355 | | | | 2,483,791 | | | | 52,344 | | | | — | | | | — | |
| | | 105,299,229 | | | | 2,212,785,725 | | | | 775,482,165 | | | | 832,314,029 | | | | 855,132,527 | | | | 592,070,162 | | | | 2,146,063,959 | |
| | | | | | | | | | | | | | | | | | | | | | | | | | | | |
| | | | | | | | | | | | | | | | | | | | | | | | | | | | |
| | | — | | | | — | | | | 231,470 | | | | 5,213,817 | | | | 54,944,336 | | | | — | | | | — | |
| | | | | | | | | | | | | | | | | | | | | | | | | | | | |
| | | 142,051 | | | | 1,791,111 | | | | 525,947 | | | | 864,560 | | | | 148,160 | | | | 1,337,310 | | | | 758,420 | |
| | | 179,795 | | | | — | | | | 3,250,040 | | | | — | | | | — | | | | 3,304,545 | | | | — | |
| | | — | | | | — | | | | — | | | | — | | | | 6,849 | | | | 295,883 | | | | — | |
| | | 82,053 | | | | — | | | | — | | | | — | | | | — | | | | — | | | | — | |
| | | — | | | | — | | | | — | | | | 33 | | | | — | | | | — | | | | — | |
| | | | | | | | | | | | | | | | | | | | | | | | | | | | |
| | | 76,112 | | | | 1,452,206 | | | | 350,962 | | | | 333,230 | | | | 275,933 | | | | 253,324 | | | | 92,575 | |
| | | 1,132 | | | | 40,064 | | | | 26,768 | | | | 17,497 | | | | 2,622 | | | | 30,768 | | | | 282,193 | |
| | | 16,180 | | | | 575,858 | | | | — | | | | — | | | | 9,116 | | | | 144,089 | | | | — | |
| | | 1,010 | | | | — | | | | — | | | | — | | | | 2,275 | | | | 20,243 | | | | — | |
| | | 16,076 | | | | 82,084 | | | | — | | | | — | | | | 25,101 | | | | 19,522 | | | | — | |
| | | 34,729 | | | | 60,667 | | | | — | | | | — | | | | 42,163 | | | | 41,715 | | | | — | |
| | | 9,832 | | | | 107,063 | | | | — | | | | — | | | | 26,612 | | | | 31,109 | | | | — | |
| | | 558,970 | | | | 4,109,053 | | | | 4,385,187 | | | | 6,429,137 | | | | 55,483,167 | | | | 5,478,508 | | | | 1,133,188 | |
| | $ | 104,740,259 | | | $ | 2,208,676,672 | | | $ | 771,096,978 | | | $ | 825,884,892 | | | $ | 799,649,360 | | | $ | 586,591,654 | | | $ | 2,144,930,771 | |
| | 111 | SEE NOTES TO FINANCIAL STATEMENTS |
December 31, 2022 |
Statements of Assets and Liabilities, continued |
| | Large Cap
Fund | | | Small Cap
Fund | | | US
Sustainable
Economy
Fund | | | Global
Sustainable
Infrastructure
Fund | |
NET ASSETS REPRESENTED BY: | | | | | | | | | | | | | | | | |
Paid in Capital | | $ | 1,077,897,932 | | | $ | 606,660,419 | | | $ | 179,664,570 | | | $ | 120,182,011 | |
Total distributable earnings | | | 270,756,512 | | | | (18,178,017 | ) | | | 68,871,596 | | | | (13,344,203 | ) |
NET ASSETS | | $ | 1,348,654,444 | | | $ | 588,482,402 | | | $ | 248,536,166 | | | $ | 106,837,808 | |
| | | | | | | | | | | | | | | | | |
Investor Class | | | | | | | | | | | | | | | | |
Net assets | | $ | 56,666,543 | | | $ | 93,089,514 | | | $ | 159,821,741 | | | $ | 5,816,194 | |
Capital Shares Outstanding (unlimited/authorized) | | | 4,916,932 | | | | 6,620,353 | | | | 8,326,608 | | | | 681,784 | |
Net asset value per share | | $ | 11.52 | | | $ | 14.06 | | | $ | 19.19 | | | $ | 8.53 | |
Class A | | | | | | | | | | | | | | | | |
Net assets | | | | | | $ | 10,895,279 | | | $ | 8,142,081 | | | | | |
Capital Shares Outstanding (unlimited/authorized) | | | | | | | 777,522 | | | | 425,978 | | | | | |
Net asset value per share | | | | | | $ | 14.01 | | | $ | 19.11 | | | | | |
Institutional Class | | | | | | | | | | | | | | | | |
Net assets | | $ | 1,291,987,900 | | | $ | 484,497,609 | | | $ | 80,572,344 | | | $ | 101,021,614 | |
Capital Shares Outstanding (unlimited/authorized) | | | 111,743,672 | | | | 33,911,665 | | | | 4,030,728 | | | | 11,781,641 | |
Net asset value per share | | $ | 11.56 | | | $ | 14.29 | | | $ | 19.99 | | | $ | 8.57 | |
SEE NOTES TO FINANCIAL STATEMENTS | 112 | |
| | Global
Opportunities
Fund | | | Global
Environmental
Markets Fund | | | Global
Women’s
Leadership
Fund | | | International
Sustainable
Economy
Fund | | | Core Bond
Fund | | | High Yield
Bond Fund | | | Sustainable
Allocation
Fund | |
| | | | | | | | | | | | | | | | | | | | | | | | | | | | |
| | $ | 98,624,490 | | | $ | 2,000,003,189 | | | $ | 723,481,612 | | | $ | 838,125,178 | | | $ | 916,573,768 | | | $ | 760,857,193 | | | $ | 1,966,488,921 | |
| | | 6,115,769 | | | | 208,673,483 | | | | 47,615,366 | | | | (12,240,286 | ) | | | (116,924,408 | ) | | | (174,265,539 | ) | | | 178,441,850 | |
| | $ | 104,740,259 | | | $ | 2,208,676,672 | | | $ | 771,096,978 | | | $ | 825,884,892 | | | $ | 799,649,360 | | | $ | 586,591,654 | | | $ | 2,144,930,771 | |
| | | | | | | | | | | | | | | | | | | | | | | | | | | | |
| | | | | | | | | | | | | | | | | | | | | | | | | | | | |
| | $ | 5,260,341 | | | $ | 167,290,140 | | | $ | 123,060,144 | | | $ | 81,938,959 | | | $ | 12,029,232 | | | $ | 137,689,323 | | | $ | 1,299,467,428 | |
| | | 384,344 | | | | 8,616,671 | | | | 4,513,914 | | | | 9,310,552 | | | | 1,386,564 | | | | 24,022,979 | | | | 57,044,698 | |
| | $ | 13.69 | | | $ | 19.41 | | | $ | 27.26 | | | $ | 8.80 | | | $ | 8.68 | | | $ | 5.73 | | | $ | 22.78 | |
| | | | | | | | | | | | | | | | | | | | | | | | | | | | |
| | | | | | $ | 17,291,687 | | | | | | | | | | | | | | | $ | 5,011,121 | | | | | |
| | | | | | | 892,061 | | | | | | | | | | | | | | | | 872,426 | | | | | |
| | | | | | $ | 19.38 | | | | | | | | | | | | | | | $ | 5.74 | | | | | |
| | | | | | | | | | | | | | | | | | | | | | | | | | | | |
| | $ | 99,479,918 | | | $ | 2,024,094,845 | | | $ | 648,036,834 | | | $ | 743,945,933 | | | $ | 787,620,128 | | | $ | 443,891,210 | | | $ | 845,463,343 | |
| | | 7,232,600 | | | | 103,368,547 | | | | 23,611,266 | | | | 86,416,866 | | | | 90,755,392 | | | | 77,699,044 | | | | 36,382,052 | |
| | $ | 13.75 | | | $ | 19.58 | | | $ | 27.45 | | | $ | 8.61 | | | $ | 8.68 | | | $ | 5.71 | | | $ | 23.24 | |
| | 113 | SEE NOTES TO FINANCIAL STATEMENTS |
For the Year Ended December 31, 2022 |
Statements of Operations |
| | Large Cap
Fund | | | Small Cap
Fund | | | US
Sustainable
Economy
Fund | | | Global
Sustainable
Infrastructure
Fund | |
INVESTMENT INCOME | | | | | | | | | | | | | | | | |
Income | | | | | | | | | | | | | | | | |
Dividends (net of foreign withholding tax of $0; $20,809; $2,136; $217,684;$97,540; $2,397,430; $636,671; $1,815,747; $0; $0 and $0 respectively) | | $ | 19,771,119 | | | $ | 5,469,035 | | | $ | 4,752,491 | | | $ | 3,428,150 | |
Dividends from affiliates - Note C | | | — | | | | — | | | | — | | | | — | |
Interest | | | 467,184 | | | | 372,465 | | | | 24,397 | | | | 16,021 | |
Income from securities lending - Note A | | | 5,038 | | | | 36,146 | | | | 1,313 | | | | 3,683 | |
Other income - Note B | | | 170,180 | | | | 167,118 | | | | — | | | | — | |
Total Income | | | 20,413,521 | | | | 6,044,764 | | | | 4,778,201 | | | | 3,447,854 | |
| | | | | | | | | | | | | | | | | |
Expenses | | | | | | | | | | | | | | | | |
Investment advisory fees - Note B | | | 9,154,782 | | | | 4,838,122 | | | | 1,758,688 | | | | 652,135 | |
Distribution expenses - Investor (Note B) | | | 141,179 | | | | 255,497 | | | | 457,126 | | | | 14,139 | |
Distribution expenses - Class A (Note B) | | | — | | | | 29,299 | | | | 21,787 | | | | — | |
Transfer agent fees - Note A | | | 474,724 | | | | 582,754 | | | | — | | | | — | |
Printing and other shareholder communication fees | | | 33,809 | | | | 63,342 | | | | — | | | | — | |
Custodian fees | | | 107,573 | | | | 57,862 | | | | — | | | | — | |
Legal fees and related expenses | | | 89,196 | | | | 60,259 | | | | — | | | | — | |
Trustees’ fees and expenses - Note B | | | 72,131 | | | | 48,771 | | | | — | | | | — | |
Compliance expense | | | 25,134 | | | �� | 23,474 | | | | — | | | | — | |
Audit fees | | | 52,228 | | | | 41,228 | | | | — | | | | — | |
Registration fees | | | 47,712 | | | | 96,805 | | | | — | | | | — | |
Other expenses | | | 52,652 | | | | 30,481 | | | | — | | | | — | |
Total Expenses | | | 10,251,120 | | | | 6,127,894 | | | | 2,237,601 | | | | 666,274 | |
Less: Advisory fee waiver - Note B | | | — | | | | — | | | | (503,852 | ) | | | (100,329 | ) |
Expenses assumed by Adviser - Note B | | | — | | | | — | | | | — | | | | — | |
Net expenses | | | 10,251,120 | | | | 6,127,894 | | | | 1,733,749 | | | | 565,945 | |
Net investment income | | | 10,162,401 | | | | (83,130 | ) | | | 3,044,452 | | | | 2,881,909 | |
REALIZED AND UNREALIZED GAIN (LOSS) - Notes A and C | | | | | | | | | | | | | | | | |
Net realized gain (loss) on: | | | | | | | | | | | | | | | | |
Investments in unaffiliated issuers | | | 9,818,008 | | | | (5,938,306 | ) | | | 12,250,731 | | | | (6,424,868 | ) |
Investment in affiliated issuers | | | — | | | | — | | | | — | | | | — | |
Foreign currency transactions | | | — | | | | (6,650 | ) | | | — | | | | (49,357 | ) |
Change in unrealized appreciation (depreciation) on: | | | | | | | | | | | | | | | | |
Investments in unaffiliated issuers | | | (339,483,402 | ) | | | (170,469,418 | ) | | | (75,585,662 | ) | | | (11,309,984 | ) |
Investment in affiliated issuers | | | — | | | | — | | | | — | | | | — | |
Foreign currency translation | | | — | | | | 73 | | | | — | | | | (4,603 | ) |
Net realized and unrealized gain (loss) on investments and foreign currency | | | (329,665,394 | ) | | | (176,414,301 | ) | | | (63,334,931 | ) | | | (17,788,812 | ) |
| | | | | | | | | | | | | | | | | |
Net decrease in net assets resulting from operations | | $ | (319,502,993 | ) | | $ | (176,497,431 | ) | | $ | (60,290,479 | ) | | $ | (14,906,903 | ) |
SEE NOTES TO FINANCIAL STATEMENTS | 114 | |
For the Year Ended December 31, 2022 |
|
| | Global
Opportunities
Fund | | | Global
Environmental
Markets Fund | | | Global
Women’s
Leadership
Fund | | | International
Sustainable
Economy
Fund | | | Core Bond
Fund | | | High Yield
Bond Fund | | | Sustainable
Allocation
Fund | |
| | | | | | | | | | | | | | | | | | | | | | | | | | | | |
| | | | | | | | | | | | | | | | | | | | | | | | | | | | |
| | $ | 1,510,661 | | | $ | 34,488,865 | | | $ | 18,358,280 | | | $ | 24,282,313 | | | $ | — | | | $ | 44,416 | | | $ | — | |
| | | — | | | | — | | | | — | | | | — | | | | — | | | | — | | | | 35,260,235 | |
| | | 28,423 | | | | 454,754 | | | | 71,328 | | | | 75,356 | | | | 20,881,766 | | | | 35,671,279 | | | | 1,306,107 | |
| | | — | | | | — | | | | 7,232 | | | | 131,465 | | | | 82,624 | | | | — | | | | — | |
| | | 28,855 | | | | 678,023 | | | | 14 | | | | 89 | | | | — | | | | 39,874 | | | | — | |
| | | 1,567,939 | | | | 35,621,642 | | | | 18,436,854 | | | | 24,489,223 | | | | 20,964,390 | | | | 35,755,569 | | | | 36,566,342 | |
| | | | | | | | | | | | | | | | | | | | | | | | | | | | |
| | | | | | | | | | | | | | | | | | | | | | | | | | | | |
| | | 949,748 | | | | 17,344,209 | | | | 4,356,425 | | | | 3,778,761 | | | | 3,078,831 | | | | 3,182,451 | | | | 1,144,717 | |
| | | 13,151 | | | | 439,183 | | | | 332,511 | | | | 201,615 | | | | 32,627 | | | | 375,121 | | | | 3,537,575 | |
| | | — | | | | 44,732 | | | | — | | | | — | | | | — | | | | 15,015 | | | | — | |
| | | 84,108 | | | | 2,604,646 | | | | — | | | | — | | | | 52,478 | | | | 640,924 | | | | — | |
| | | 7,823 | | | | 192,156 | | | | — | | | | — | | | | 9,935 | | | | 69,547 | | | | — | |
| | | 53,910 | | | | 427,631 | | | | — | | | | — | | | | 140,180 | | | | 104,737 | | | | — | |
| | | 40,080 | | | | 125,158 | | | | — | | | | — | | | | 63,046 | | | | 60,429 | | | | — | |
| | | 32,439 | | | | 101,251 | | | | — | | | | — | | | | 51,063 | | | | 48,880 | | | | — | |
| | | 22,309 | | | | 27,142 | | | | — | | | | — | | | | 23,707 | | | | 23,454 | | | | — | |
| | | 40,760 | | | | 75,251 | | | | — | | | | — | | | | 51,017 | | | | 50,420 | | | | — | |
| | | 45,466 | | | | 125,552 | | | | — | | | | — | | | | 44,324 | | | | 77,687 | | | | — | |
| | | 6,955 | | | | 89,820 | | | | — | | | | — | | | | 31,007 | | | | 22,037 | | | | — | |
| | | 1,296,749 | | | | 21,596,731 | | | | 4,688,936 | | | | 3,980,376 | | | | 3,578,215 | | | | 4,670,702 | | | | 4,682,292 | |
| | | — | | | | — | | | | — | | | | — | | | | — | | | | — | | | | — | |
| | | (120,158 | ) | | | — | | | | — | | | | — | | | | — | | | | — | | | | — | |
| | | 1,176,591 | | | | 21,596,731 | | | | 4,688,936 | | | | 3,980,376 | | | | 3,578,215 | | | | 4,670,702 | | | | 4,682,292 | |
| | | 391,348 | | | | 14,024,911 | | | | 13,747,918 | | | | 20,508,847 | | | | 17,386,175 | | | | 31,084,867 | | | | 31,884,050 | |
| | | | | | | | | | | | | | | | | | | | | | | | | | | | |
| | | | | | | | | | | | | | | | | | | | | | | | | | | | |
| | | (4,410,412 | ) | | | (88,219,761 | ) | | | (28,422,358 | ) | | | (41,067,895 | ) | | | (26,235,729 | ) | | | (22,250,165 | ) | | | — | |
| | | — | | | | — | | | | — | | | | — | | | | — | | | | — | | | | 18,864,766 | |
| | | (31,612 | ) | | | (232,506 | ) | | | (201,385 | ) | | | (729,803 | ) | | | — | | | | — | | | | — | |
| | | | | | | | | | | | | | | | | | | | | | | | | | | | |
| | | (23,280,586 | ) | | | (564,664,246 | ) | | | (184,727,157 | ) | | | (141,342,692 | ) | | | (95,344,171 | ) | | | (101,192,976 | ) | | | — | |
| | | — | | | | — | | | | — | | | | — | | | | — | | | | — | | | | (480,948,513 | ) |
| | | (3,185 | ) | | | (79,816 | ) | | | (22,994 | ) | | | (135,727 | ) | | | — | | | | — | | | | — | |
| | | (27,725,795 | ) | | | (653,196,329 | ) | | | (213,373,894 | ) | | | (183,276,117 | ) | | | (121,579,900 | ) | | | (123,443,141 | ) | | | (462,083,747 | ) |
| | | | | | | | | | | | | | | | | | | | | | | | | | | | |
| | $ | (27,334,447 | ) | | $ | (639,171,418 | ) | | $ | (199,625,976 | ) | | $ | (162,767,270 | ) | | $ | (104,193,725 | ) | | $ | (92,358,274 | ) | | $ | (430,199,697 | ) |
| | 115 | SEE NOTES TO FINANCIAL STATEMENTS |
| |
Statements of Changes in Net Assets |
| | | Large Cap Fund | |
| | Year Ended
12/31/2022 | | | Year Ended
12/31/2021 | |
Increase (Decrease) in Net Assets | | | | | | | | |
Operations | | | | | | | | |
Investment income, net | | $ | 10,162,401 | | | $ | 6,248,333 | |
Net realized gain (loss) on investments and foreign currency transactions | | | 9,818,008 | | | | 102,690,737 | |
Change in unrealized appreciation (depreciation) on investments and foreign currency translations | | | (339,483,402 | ) | | | 239,900,456 | |
Net increase (decrease) in net assets resulting from operations | | | (319,502,993 | ) | | | 348,839,526 | |
Distributions from distributable earnings - Investor Class | | | (1,624,855 | ) | | | (3,158,195 | ) |
Distributions from distributable earnings - Class A | | | | | | | | |
Distributions from distributable earnings - Institutional Class | | | (39,685,066 | ) | | | (85,170,435 | ) |
Tax return of capital | | | — | | | | — | |
Total distributions to shareholders | | | (41,309,921 | ) | | | (88,328,630 | ) |
From capital share transactions: | | | | | | | | |
Investor Class | | | | | | | | |
Proceeds from shares sold | | | 35,079,963 | | | | 37,427,614 | |
Proceeds from reinvestment of distributions | | | 1,590,612 | | | | 3,142,083 | |
Cost of shares redeemed | | | (23,827,505 | ) | | | (10,546,023 | ) |
Net increase (decrease) from Investor Class transactions | | | 12,843,070 | | | | 30,023,674 | |
Class A | | | | | | | | |
Proceeds from shares sold | | | | | | | | |
Proceeds from reinvestment of distributions | | | | | | | | |
Cost of shares redeemed | | | | | | | | |
Net increase (decrease) from Class A transactions | | | | | | | | |
Institutional Class | | | | | | | | |
Proceeds from shares sold | | | 252,224,020 | | | | 230,237,473 | |
Proceeds from reinvestment of distributions | | | 39,561,810 | | | | 85,078,019 | |
Cost of shares redeemed | | | (164,673,972 | ) | | | (77,930,857 | ) |
Net increase (decrease) from Institutional Class transactions | | | 127,111,858 | | | | 237,384,635 | |
Net increase (decrease) from capital share transactions | | | 139,954,928 | | | | 267,408,309 | |
Net increase (decrease) in net assets | | | (220,857,986 | ) | | | 527,919,205 | |
Net assets | | | | | | | | |
Beginning of period | | | 1,569,512,430 | | | | 1,041,593,225 | |
End of period | | $ | 1,348,654,444 | | | $ | 1,569,512,430 | |
| | | | | | | | | |
Shares of Beneficial Interest: | | | | | | | | |
Investor Class | | | | | | | | |
Shares sold | | | 2,758,340 | | | | 2,648,428 | |
Shares issued in reinvestment of distributions | | | 138,587 | | | | 215,464 | |
Shares redeemed | | | (1,891,104 | ) | | | (728,765 | ) |
Net increase (decrease) in shares outstanding | | | 1,005,823 | | | | 2,135,127 | |
| | | | | | | | | |
Class A | | | | | | | | |
Shares sold | | | | | | | | |
Shares issued in reinvestment of distributions | | | | | | | | |
Shares redeemed | | | | | | | | |
Net increase (decrease) in shares outstanding | | | | | | | | |
| | | | | | | | | |
Institutional Class | | | | | | | | |
Shares sold | | | 19,455,111 | | | | 16,533,881 | |
Shares issued in reinvestment of distributions | | | 3,434,297 | | | | 5,817,100 | |
Shares redeemed | | | (12,797,000 | ) | | | (5,336,882 | ) |
Net increase (decrease) in shares outstanding | | | 10,092,408 | | | | 17,014,099 | |
SEE NOTES TO FINANCIAL STATEMENTS | 116 | |
| | | Small Cap Fund | | | US Sustainable
Economy Fund | | | Global
Sustainable
Infrastructure
Fund | | |
| | Year Ended
12/31/2022 | | | Year Ended
12/31/2021 | | | Year Ended
12/31/2022 | | | Year Ended
12/31/2021 | | | Year Ended
12/31/2022 | | | Year Ended
12/31/2021 | | |
| | | | | | | | | | | | | | | | | | | | | | | | | | |
| | | | | | | | | | | | | | | | | | | | | | | | | | |
| | | $ | (83,130 | ) | | $ | 4,211,415 | | | $ | 3,044,452 | | | $ | 2,384,230 | | | $ | 2,881,909 | | | $ | 3,038,214 | | |
| | | | (5,944,956 | ) | | | 61,648,514 | | | | 12,250,731 | | | | 61,651,876 | | | | (6,474,225 | ) | | | 65,896,357 | | |
| | | | (170,469,345 | ) | | | 86,201,524 | | | | (75,585,662 | ) | | | 11,974,854 | | | | (11,314,587 | ) | | | (53,322,851 | ) | |
| | | | (176,497,431 | ) | | | 152,061,453 | | | | (60,290,479 | ) | | | 76,010,960 | | | | (14,906,903 | ) | | | 15,611,720 | | |
| | | | (2,258,603 | ) | | | (11,054,274 | ) | | | (11,406,855 | ) | | | (37,377,935 | ) | | | (138,197 | ) | | | (2,102,512 | ) | |
| | | | (265,354 | ) | | | (1,256,019 | ) | | | (576,187 | ) | | | (1,896,075 | ) | | | | | | | | | |
| | | | (12,229,968 | ) | | | (53,205,792 | ) | | | (5,457,784 | ) | | | (18,599,306 | ) | | | (2,544,699 | ) | | | (35,014,441 | ) | |
| | | | — | | | | — | | | | (555,114 | ) | | | — | | | | — | | | | — | | |
| | | | (14,753,925 | ) | | | (65,516,085 | ) | | | (17,995,940 | ) | | | (57,873,316 | ) | | | (2,682,896 | ) | | | (37,116,953 | ) | |
| | | | | | | | | | | | | | | | | | | | | | | | | | |
| | | | | | | | | | | | | | | | | | | | | | | | | | |
| | | | 20,887,577 | | | | 19,724,514 | | | | 26,380,744 | | | | 7,930,403 | | | | 2,477,502 | | | | 2,320,098 | | |
| | | | 2,221,222 | | | | 10,830,710 | | | | 11,379,743 | | | | 36,657,331 | | | | 136,160 | | | | 2,086,262 | | |
| | | | (24,024,883 | ) | | | (26,908,980 | ) | | | (31,596,635 | ) | | | (21,477,707 | ) | | | (1,262,312 | ) | | | (1,474,622 | ) | |
| | | | (916,084 | ) | | | 3,646,244 | | | | 6,163,852 | | | | 23,110,027 | | | | 1,351,350 | | | | 2,931,738 | | |
| | | | | | | | | | | | | | | | | | | | | | | | | | |
| | | | 2,055,790 | | | | 2,806,783 | | | | 744,849 | | | | 2,451,108 | | | | | | | | | | |
| | | | 224,899 | | | | 1,216,828 | | | | 488,387 | | | | 1,497,802 | | | | | | | | | | |
| | | | (2,089,013 | ) | | | (2,605,612 | ) | | | (778,875 | ) | | | (613,410 | ) | | | | | | | | | |
| | | | 191,676 | | | | 1,417,999 | | | | 454,361 | | | | 3,335,500 | | | | | | | | | | |
| | | | | | | | | | | | | | | | | | | | | | | | | | |
| | | | 190,835,373 | | | | 234,543,988 | | | | 16,392,140 | | | | 16,372,652 | | | | 30,908,252 | | | | 13,549,347 | | |
| | | | 10,984,541 | | | | 45,032,698 | | | | 5,652,540 | | | | 17,620,167 | | | | 2,482,803 | | | | 33,960,664 | | |
| | | | (164,023,672 | ) | | | (94,763,563 | ) | | | (16,263,073 | ) | | | (20,367,981 | ) | | | (7,991,437 | ) | | | (71,310,028 | ) | |
| | | | 37,796,242 | | | | 184,813,123 | | | | 5,781,607 | | | | 13,624,838 | | | | 25,399,618 | | | | (23,800,017 | ) | |
| | | | 37,071,834 | | | | 189,877,366 | | | | 12,399,820 | | | | 40,070,365 | | | | 26,750,968 | | | | (20,868,279 | ) | |
| | | | (154,179,522 | ) | | | 276,422,734 | | | | (65,886,599 | ) | | | 58,208,009 | | | | 9,161,169 | | | | (42,373,512 | ) | |
| | | | | | | | | | | | | | | | | | | | | | | | | | |
| | | | 742,661,924 | | | | 466,239,190 | | | | 314,422,765 | | | | 256,214,756 | | | | 97,676,639 | | | | 140,050,151 | | |
| | | $ | 588,482,402 | | | $ | 742,661,924 | | | $ | 248,536,166 | | | $ | 314,422,765 | | | $ | 106,837,808 | | | $ | 97,676,639 | | |
| | | | | | | | | | | | | | | | | | | | | | | | | | |
| | | | | | | | | | | | | | | | | | | | | | | | | | |
| | | | | | | | | | | | | | | | | | | | | | | | | | |
| | | | 1,377,700 | | | | 1,024,793 | | | | 1,101,442 | | | | 294,876 | | | | 269,858 | | | | 155,708 | | |
| | | | 159,915 | | | | 590,205 | | | | 592,510 | | | | 1,474,216 | | | | 15,940 | | | | 206,837 | | |
| | | | (1,608,290 | ) | | | (1,425,595 | ) | | | (1,493,537 | ) | | | (805,594 | ) | | | (141,454 | ) | | | (108,422 | ) | |
| | | | (70,675 | ) | | | 189,403 | | | | 200,415 | | | | 963,498 | | | | 144,344 | | | | 254,123 | | |
| | | | | | | | | | | | | | | | | | | | | | | | | | |
| | | | | | | | | | | | | | | | | | | | | | | | | | |
| | | | 131,236 | | | | 145,066 | | | | 34,614 | | | | 87,078 | | | | | | | | | | |
| | | | 16,250 | | | | 66,493 | | | | 25,542 | | | | 60,453 | | | | | | | | | | |
| | | | (136,615 | ) | | | (140,698 | ) | | | (37,278 | ) | | | (22,759 | ) | | | | | | | | | |
| | | | 10,871 | | | | 70,861 | | | | 22,878 | | | | 124,772 | | | | | | | | | | |
| | | | | | | | | | | | | | | | | | | | | | | | | | |
| | | | | | | | | | | | | | | | | | | | | | | | | | |
| | | | 12,039,723 | | | | 12,184,778 | | | | 720,020 | | | | 583,840 | | | | 3,300,040 | | | | 893,052 | | |
| | | | 779,169 | | | | 2,417,012 | | | | 282,484 | | | | 682,021 | | | | 289,325 | | | | 3,342,614 | | |
| | | | (10,662,371 | ) | | | (4,906,483 | ) | | | (737,747 | ) | | | (733,389 | ) | | | (888,264 | ) | | | (4,729,359 | ) | |
| | | | 2,156,521 | | | | 9,695,307 | | | | 264,757 | | | | 532,472 | | | | 2,701,101 | | | | (493,693 | ) | |
| | 117 | SEE NOTES TO FINANCIAL STATEMENTS |
| |
Statements of Changes in Net Assets, continued |
| | | Global
Opportunities
Fund | |
| | Year Ended
12/31/2022 | | | Year Ended
12/31/2021 | |
Increase (Decrease) in Net Assets | | | | | | | | |
Operations | | | | | | | | |
Investment income, net | | $ | 391,348 | | | $ | 120,644 | |
Net realized gain (loss) on investments and foreign currency transactions | | | (4,442,024 | ) | | | 3,512,728 | |
Change in unrealized appreciation (depreciation) on investments and foreign currency translations | | | (23,283,771 | ) | | | 16,402,428 | |
Net increase (decrease) in net assets resulting from operations | | | (27,334,447 | ) | | | 20,035,800 | |
Distributions from Investor Class | | | (78,939 | ) | | | (102,606 | ) |
Distributions from Class A | | | | | | | | |
Distributions from Institutional Class | | | (1,741,689 | ) | | | (2,448,591 | ) |
Total distributions to shareholders | | | (1,820,628 | ) | | | (2,551,197 | ) |
From capital share transactions: | | | | | | | | |
Investor Class | | | | | | | | |
Proceeds from shares sold | | | 1,743,714 | | | | 2,781,513 | |
Proceeds from reinvestment of distributions | | | 78,806 | | | | 102,525 | |
Cost of shares redeemed | | | (1,136,800 | ) | | | (1,203,824 | ) |
Net increase (decrease) from Investor Class transactions | | | 685,720 | | | | 1,680,214 | |
Class A | | | | | | | | |
Proceeds from shares sold | | | | | | | | |
Proceeds from reinvestment of distributions | | | | | | | | |
Cost of shares redeemed | | | | | | | | |
Net increase (decrease) from Class A transactions | | | | | | | | |
Institutional Class | | | | | | | | |
Proceeds from shares sold | | | 10,568,072 | | | | 57,255,548 | |
Proceeds from reinvestment of distributions | | | 1,738,877 | | | | 2,448,160 | |
Cost of shares redeemed | | | (22,117,641 | ) | | | (4,893,683 | ) |
Net increase (decrease) from Institutional Class transactions | | | (9,810,692 | ) | | | 54,810,025 | |
Net increase (decrease) from capital share transactions | | | (9,124,972 | ) | | | 56,490,239 | |
Net increase (decrease) in net assets | | | (38,280,047 | ) | | | 73,974,842 | |
Net assets | | | | | | | | |
Beginning of period | | | 143,020,306 | | | | 69,045,464 | |
End of period | | $ | 104,740,259 | | | $ | 143,020,306 | |
| | | | | | | | | |
Shares of Beneficial Interest: | | | | | | | | |
Investor Class | | | | | | | | |
Shares sold | | | 120,850 | | | | 175,949 | |
Shares issued in reinvestment of distributions | | | 5,834 | | | | 6,103 | |
Shares redeemed | | | (80,825 | ) | | | (75,576 | ) |
Net increase (decrease) in shares outstanding | | | 45,859 | | | | 106,476 | |
| | | | | | | | | |
Class A | | | | | | | | |
Shares sold | | | | | | | | |
Shares issued in reinvestment of distributions | | | | | | | | |
Shares redeemed | | | | | | | | |
Net increase (decrease) in shares outstanding | | | | | | | | |
| | | | | | | | | |
Institutional Class | | | | | | | | |
Shares sold | | | 749,658 | | | | 3,682,281 | |
Shares issued in reinvestment of distributions | | | 128,727 | | | | 145,508 | |
Shares redeemed | | | (1,647,543 | ) | | | (295,346 | ) |
Net increase in shares outstanding | | | (769,158 | ) | | | 3,532,443 | |
SEE NOTES TO FINANCIAL STATEMENTS | 118 | |
| | | | | | Global
Environmental
Markets Fund | | | Global Women’s
Leadership Fund | | |
| | | | | Year Ended
12/31/2022 | | | Year Ended
12/31/2021 | | | Year Ended
12/31/2022 | | | Year Ended
12/31/2021 | | |
| | | | | | | | | | | | | | | | | | | | | |
| | | | | | | | | | | | | | | | | | | | | |
| | | | | | $ | 14,024,911 | | | $ | 18,868,155 | | | $ | 13,747,918 | | | $ | 12,452,447 | | |
| | | | | | | (88,452,267 | ) | | | 66,160,711 | | | | (28,623,743 | ) | | | 26,620,196 | | |
| | | | | | | (564,744,062 | ) | | | 353,325,091 | | | | (184,750,151 | ) | | | 101,030,287 | | |
| | | | | | | (639,171,418 | ) | | | 438,353,957 | | | | (199,625,976 | ) | | | 140,102,930 | | |
| | | | | | | (884,132 | ) | | | (4,204,981 | ) | | | (3,796,956 | ) | | | (1,906,707 | ) | |
| | | | | | | (91,597 | ) | | | (419,080 | ) | | | | | | | | | |
| | | | | | | (13,471,376 | ) | | | (49,912,206 | ) | | | (20,881,054 | ) | | | (11,700,153 | ) | |
| | | | | | | (14,447,105 | ) | | | (54,536,267 | ) | | | (24,678,010 | ) | | | (13,606,860 | ) | |
| | | | | | | | | | | | | | | | | | | | | |
| | | | | | | | | | | | | | | | | | | | | |
| | | | | | | 18,478,332 | | | | 43,946,672 | | | | 13,860,135 | | | | 25,410,536 | | |
| | | | | | | 819,259 | | | | 3,911,624 | | | | 3,616,455 | | | | 1,804,274 | | |
| | | | | | | (27,243,819 | ) | | | (30,289,911 | ) | | | (19,592,466 | ) | | | (17,875,127 | ) | |
| | | | | | | (7,946,228 | ) | | | 17,568,385 | | | | (2,115,876 | ) | | | 9,339,683 | | |
| | | | | | | | | | | | | | | | | | | | | |
| | | | | | | 2,197,608 | | | | 4,181,876 | | | | | | | | | | |
| | | | | | | 82,093 | | | | 376,219 | | | | | | | | | | |
| | | | | | | (2,443,229 | ) | | | (1,983,282 | ) | | | | | | | | | |
| | | | | | | (163.528 | ) | | | 2,574,813 | | | | | | | | | | |
| | | | | | | | | | | | | | | | | | | | | |
| | | | | | | 640,483,732 | | | | 1,047,193,335 | | | | 130,719,126 | | | | 211,284,728 | | |
| | | | | | | 12,586,265 | | | | 46,824,725 | | | | 18,997,728 | | | | 10,594,606 | | |
| | | | | | | (528,185,435 | ) | | | (382,102,159 | ) | | | (167,489,766 | ) | | | (91,848,437 | ) | |
| | | | | | | 124,884,562 | | | | 711,915,901 | | | | (17,772,912 | ) | | | 130,030,897 | | |
| | | | | | | 116,774,806 | | | | 732,059,099 | | | | (19,888,788 | ) | | | 139,370,580 | | |
| | | | | | | (536,843,717 | ) | | | 1,115,876,789 | | | | (244,192,774 | ) | | | 265,866,650 | | |
| | | | | | | | | | | | | | | | | | | | | |
| | | | | | | 2,745,520,389 | | | | 1,629,643,600 | | | | 1,015,289,752 | | | | 749,423,102 | | |
| | | | | | $ | 2,208,676,672 | | | $ | 2,745,520,389 | | | $ | 771,096,978 | | | $ | 1,015,289,752 | | |
| | | | | | | | | | | | | | | | | | | | | |
| | | | | | | | | | | | | | | | | | | | | |
| | | | | | | | | | | | | | | | | | | | | |
| | | | | | | 909,155 | | | | 1,863,872 | | | | 467,839 | | | | 767,077 | | |
| | | | | | | 43,766 | | | | 158,973 | | | | 133,178 | | | | 52,934 | | |
| | | | | | | (1,374,237 | ) | | | (1,287,937 | ) | | | (662,214 | ) | | | (538,370 | ) | |
| | | | | | | (421,316 | ) | | | 734,908 | | | | (61,197 | ) | | | 281,641 | | |
| | | | | | | | | | | | | | | | | | | | | |
| | | | | | | | | | | | | | | | | | | | | |
| | | | | | | 110,666 | | | | 178,593 | | | | | | | | | | |
| | | | | | | 4,392 | | | | 15,313 | | | | | | | | | | |
| | | | | | | (121,276 | ) | | | (86,749 | ) | | | | | | | | | |
| | | | | | | (6,218 | ) | | | 107,157 | | | | | | | | | | |
| | | | | | | | | | | | | | | | | | | | | |
| | | | | | | | | | | | | | | | | | | | | |
| | | | | | | 31,262,433 | | | | 44,675,996 | | | | 4,409,462 | | | | 6,326,440 | | |
| | | | | | | 674,932 | | | | 1,892,866 | | | | 695,522 | | | | 308,961 | | |
| | | | | | | (26,798,106 | ) | | | (16,074,933 | ) | | | (5,684,147 | ) | | | (2,747,111 | ) | |
| | | | | | | 5,139,259 | | | | 30,493,929 | | | | (579,163 | ) | | | 3,888,290 | | |
| | 119 | SEE NOTES TO FINANCIAL STATEMENTS |
| |
Statements of Changes in Net Assets, continued |
| | | International
Sustainable
Economy Fund | |
| | Year Ended
12/31/2022 | | | Year Ended
12/31/2021 | |
Increase (Decrease) in Net Assets | | | | | | | | |
Operations | | | | | | | | |
Investment income, net | | $ | 20,508,847 | | | $ | 17,371,583 | |
Net realized gain (loss) on investments and foreign currency transactions | | | (41,797,698 | ) | | | 53,172,708 | |
Change in unrealized appreciation (depreciation) on investments and foreign currency translations | | | (141,478,419 | ) | | | 11,392,121 | |
Net increase (decrease) in net assets resulting from operations | | | (162,767,270 | ) | | | 81,936,412 | |
Distributions from Investor Class | | | (18,425,963 | ) | | | (3,798,028 | ) |
Distributions from Class A | | | | | | | | |
Distributions from Institutional Class | | | (1,816,628 | ) | | | (34,244,201 | ) |
Total distributions to shareholders | | | (20,242,591 | ) | | | (38,042,229 | ) |
From capital share transactions: | | | | | | | | |
Investor Class | | | | | | | | |
Proceeds from shares sold | | | 28,293,125 | | | | 24,094,242 | |
Proceeds from reinvestment of distributions | | | 1,744,202 | | | | 3,642,036 | |
Cost of shares redeemed | | | (20,696,957 | ) | | | (19,788,569 | ) |
Net increase (decrease) from Investor Class transactions | | | 9,340,370 | | | | 7,947,709 | |
Class A | | | | | | | | |
Proceeds from shares sold | | | | | | | | |
Proceeds from reinvestment of distributions | | | | | | | | |
Cost of shares redeemed | | | | | | | | |
Net increase (decrease) from Class A transactions | | | | | | | | |
Institutional Class | | | | | | | | |
Proceeds from shares sold | | | 380,863,836 | | | | 203,918,580 | |
Proceeds from reinvestment of distributions | | | 17,330,565 | | | | 32,538,625 | |
Cost of shares redeemed | | | (277,461,615 | ) | | | (110,454,092 | ) |
Net increase (decrease) from Institutional Class transactions | | | 120,732,786 | | | | 126,003,113 | |
Net increase (decrease) from capital share transactions | | | 130,073,156 | | | | 133,950,822 | |
Net increase (decrease) in net assets | | | (52,936,705 | ) | | | 177,845,005 | |
Net assets | | | | | | | | |
Beginning of period | | | 878,821,597 | | | | 700,976,592 | |
End of period | | $ | 825,884,892 | | | $ | 878,821,597 | |
| | | | | | | | | |
Shares of Beneficial Interest: | | | | | | | | |
Investor Class | | | | | | | | |
Shares sold | | | 3,134,424 | | | | 2,206,790 | |
Shares issued in reinvestment of distributions | | | 203,533 | | | | 334,417 | |
Shares redeemed | | | (2,306,219 | ) | | | (1,794,688 | ) |
Net increase (decrease) in shares outstanding | | | 1,031,738 | | | | 746,519 | |
| | | | | | | | | |
Class A | | | | | | | | |
Shares sold | | | | | | | | |
Shares issued in reinvestment of distributions | | | | | | | | |
Shares redeemed | | | | | | | | |
Net increase (decrease) in shares outstanding | | | | | | | | |
| | | | | | | | | |
Institutional Class | | | | | | | | |
Shares sold | | | 43,151,395 | | | | 18,999,876 | |
Shares issued in reinvestment of distributions | | | 2,066,544 | | | | 3,052,283 | |
Shares redeemed | | | (32,026,455 | ) | | | (10,262,675 | ) |
Net increase in shares outstanding | | | 13,191,484 | | | | 11,789,484 | |
SEE NOTES TO FINANCIAL STATEMENTS | 120 | |
| | | | | | Core Bond Fund | | | High Yield Bond
Fund | | | Sustainable
Allocation Fund | | | | | |
| | | | | Year Ended
12/31/2022 | | | Year Ended
12/31/2021 | | | Year Ended
12/31/2022 | | | Year Ended
12/31/2021 | | | Year Ended
12/31/2022 | | | Year Ended
12/31/2021 | | | | |
| | | | | | | | | | | | | | | | | | | | | | | | | | | | | | | | |
| | | | | | | | | | | | | | | | | | | | | | | | | | | | | | | | |
| | | | | | $ | 17,386,175 | | | $ | 12,233,124 | | | $ | 31,084,867 | | | $ | 24,659,833 | | | $ | 31,884,050 | | | $ | 21,874,329 | | | | | |
| | | | | | | (26,235,729 | ) | | | (1,691,566 | ) | | | (22,250,165 | ) | | | 9,454,171 | | | | 18,864,766 | | | | 126,292,168 | | | | | |
| | | | | | | (95,344,171 | ) | | | (21,701,087 | ) | | | (101,192,976 | ) | | | (14,422,227 | ) | | | (480,948,513 | ) | | | 194,765,601 | | | | | |
| | | | | | | (104,193,725 | ) | | | (11,159,529 | ) | | | (92,358,274 | ) | | | 19,691,777 | | | | (430,199,697 | ) | | | 342,932,098 | | | | | |
| | | | | | | (277,229 | ) | | | (251,624 | ) | | | (7,128,777 | ) | | | (6,714,467 | ) | | | (77,576,893 | ) | | | (77,305,027 | ) | | | | |
| | | | | | | | | | | | | | | (284,310 | ) | | | (260,354 | ) | | | | | | | | | | | | |
| | | | | | | (18,136,145 | ) | | | (14,904,140 | ) | | | (24,025,716 | ) | | | (17,999,748 | ) | | | (51,407,181 | ) | | | (45,499,761 | ) | | | | |
| | | | | | | (18,413,374 | ) | | | (15,155,764 | ) | | | (31,438,803 | ) | | | (24,974,569 | ) | | | (128,984,074 | ) | | | (122,804,788 | ) | | | | |
| | | | | | | | | | | | | | | | | | | | | | | | | | | | | | | | |
| | | | | | | | | | | | | | | | | | | | | | | | | | | | | | | | |
| | | | | | | 2,800,266 | | | | 5,000,323 | | | | 48,483,220 | | | | 43,776,751 | | | | 43,097,484 | | | | 63,840,958 | | | | | |
| | | | | | | 273,296 | | | | 248,993 | | | | 6,860,327 | | | | 6,365,147 | | | | 75,295,459 | | | | 74,966,361 | | | | | |
| | | | | | | (2,955,504 | ) | | | (4,764,721 | ) | | | (61,398,692 | ) | | | (47,483,859 | ) | | | (125,510,966 | ) | | | (155,485,810 | ) | | | | |
| | | | | | | 118,058 | | | | 484,595 | | | | (6,055,145 | ) | | | 2,658,039 | | | | (7,118,023 | ) | | | (16,678,491 | ) | | | | |
| | | | | | | | | | | | | | | | | | | | | | | | | | | | | | | | |
| | | | | | | | | | | | | | | 1,166,696 | | | | 1,892,599 | | | | | | | | | | | | | |
| | | | | | | | | | | | | | | 265,145 | | | | 245,113 | | | | | | | | | | | | | |
| | | | | | | | | | | | | | | (2,302,526 | ) | | | (1,150,616 | ) | | | | | | | | | | | | |
| | | | | | | | | | | | | | | (870,685 | ) | | | 987,096 | | | | | | | | | | | | | |
| | | | | | | | | | | | | | | | | | | | | | | | | | | | | | | | |
| | | | | | | 139,199,981 | | | | 53,513,717 | | | | 153,216,115 | | | | 329,580,029 | | | | 150,575,027 | | | | 275,253,593 | | | | | |
| | | | | | | 18,068,571 | | | | 14,858,521 | | | | 21,278,544 | | | | 15,644,178 | | | | 49,510,911 | | | | 43,658,795 | | | | | |
| | | | | | | (20,700,204 | ) | | | (17,687,292 | ) | | | (197,631,679 | ) | | | (75,462,199 | ) | | | (116,685,155 | ) | | | (71,401,231 | ) | | | | |
| | | | | | | 136,568,348 | | | | 50,684,946 | | | | (23,137,020 | ) | | | 269,762,008 | | | | 83,400,783 | | | | 247,511,157 | | | | | |
| | | | | | | 136,686,406 | | | | 51,169,541 | | | | (30,062,850 | ) | | | 273,407,143 | | | | 76,282,760 | | | | 230,832,666 | | | | | |
| | | | | | | 14,079,307 | | | | 24,854,248 | | | | (153,859,927 | ) | | | 268,124,351 | | | | (482,901,011 | ) | | | 450,959,976 | | | | | |
| | | | | | | | | | | | | | | | | | | | | | | | | | | | | | | | |
| | | | | | | 785,570,053 | | | | 760,715,805 | | | | 740,451,581 | | | | 472,327,230 | | | | 2,627,831,782 | | | | 2,176,871,806 | | | | | |
| | | | | | $ | 799,649,360 | | | $ | 785,570,053 | | | $ | 586,591,654 | | | $ | 740,451,581 | | | $ | 2,144,930,771 | | | $ | 2,627,831,782 | | | | | |
| | | | | | | | | | | | | | | | | | | | | | | | | | | | | | | | |
| | | | | | | | | | | | | | | | | | | | | | | | | | | | | | | | |
| | | | | | | | | | | | | | | | | | | | | | | | | | | | | | | | |
| | | | | | | 298,337 | | | | 481,933 | | | | 7,898,910 | | | | 6,311,673 | | | | 1,672,468 | | | | 2,244,186 | | | | | |
| | | | | | | 30,114 | | | | 24,206 | | | | 1,140,479 | | | | 920,172 | | | | 3,299,131 | | | | 2,590,484 | | | | | |
| | | | | | | (320,857 | ) | | | (462,723 | ) | | | (10,061,413 | ) | | | (6,851,331 | ) | | | (4,957,116 | ) | | | (5,432,950 | ) | | | | |
| | | | | | | 7,594 | | | | 43,416 | | | | (1,022,024 | ) | | | 380,514 | | | | 14,483 | | | | (598,280 | ) | | | | |
| | | | | | | | | | | | | | | | | | | | | | | | | | | | | | | | |
| | | | | | | | | | | | | | | | | | | | | | | | | | | | | | | | |
| | | | | | | | | | | | | | | 188,283 | | | | 272,513 | | | | | | | | | | | | | |
| | | | | | | | | | | | | | | 43,958 | | | | 35,365 | | | | | | | | | | | | | |
| | | | | | | | | | | | | | | (386,408 | ) | | | (165,892 | ) | | | | | | | | | | | | |
| | | | | | | | | | | | | | | (154,167 | ) | | | 141,986 | | | | | | | | | | | | | |
| | | | | | | | | | | | | | | | | | | | | | | | | | | | | | | | |
| | | | | | | | | | | | | | | | | | | | | | | | | | | | | | | | |
| | | | | | | 15,490,699 | | | | 5,158,690 | | | | 25,212,241 | | | | 47,772,061 | | | | 5,818,763 | | | | 9,469,106 | | | | | |
| | | | | | | 1,994,294 | | | | 1,444,328 | | | | 3,547,269 | | | | 2,270,613 | | | | 2,125,887 | | | | 1,480,365 | | | | | |
| | | | | | | (2,317,016 | ) | | | (1,724,911 | ) | | | (32,543,839 | ) | | | (10,952,441 | ) | | | (4,569,864 | ) | | | (2,459,967 | ) | | | | |
| | | | | | | 15,167,977 | | | | 4,878,107 | | | | (3,784,329 | ) | | | 39,090,233 | | | | 3,374,786 | | | | 8,489,504 | | | | | |
| | 121 | SEE NOTES TO FINANCIAL STATEMENTS |
December 31, 2022 |
Financial Highlights |
Selected data for a share outstanding throughout each period. |
| | | | | | | Income
(loss) from
investment
operations | | | | | | | Distributions to
shareholders | |
| | Net asset
value,
beginning of
period | | | Net
investment
income1 | | | Net
realized and
unrealized
gain (loss) | | | Total from
investment
operations | | | From net
investment
income | | | From net
realized
gains | |
Large Cap Fund | | | | | | | | | | | | | | | | | | | | | | | | |
Investor Class | | | | | | | | | | | | | | | | | | | | | | | | |
Year Ended December 31, 2022 | | $ | 14.82 | | | $ | 0.06 | | | $ | (3.02 | ) | | $ | (2.96 | ) | | $ | 0.08 | | | $ | 0.26 | |
Year Ended December 31, 2021 | | | 12.02 | | | | 0.03 | | | | 3.63 | | | | 3.66 | | | | 0.03 | | | | 0.83 | |
Year Ended December 31, 2020 | | | 10.38 | | | | 0.06 | | | | 2.38 | | | | 2.44 | | | | 0.07 | | | | 0.73 | |
Year Ended December 31, 2019 | | | 7.97 | | | | 0.07 | | | | 2.71 | | | | 2.78 | | | | 0.07 | | | | 0.30 | |
Year Ended December 31, 2018 | | | 10.56 | | | | 0.07 | | | | (0.63 | ) | | | (0.56 | ) | | | 0.07 | | | | 1.96 | |
Institutional Class | | | | | | | | | | | | | | | | | | | | | | | | |
Year Ended December 31, 2022 | | $ | 14.87 | | | $ | 0.09 | | | $ | (3.03 | ) | | $ | (2.94 | ) | | $ | 0.11 | | | $ | 0.26 | |
Year Ended December 31, 2021 | | | 12.05 | | | | 0.07 | | | | 3.64 | | | | 3.71 | | | | 0.06 | | | | 0.83 | |
Year Ended December 31, 2020 | | | 10.40 | | | | 0.09 | | | | 2.38 | | | | 2.47 | | | | 0.09 | | | | 0.73 | |
Year Ended December 31, 2019 | | | 7.98 | | | | 0.09 | | | | 2.72 | | | | 2.81 | | | | 0.09 | | | | 0.30 | |
Year Ended December 31, 2018 | | | 10.57 | | | | 0.10 | | | | (0.63 | ) | | | (0.53 | ) | | | 0.10 | | | | 1.96 | |
| | | | | | | | | | | | | | | | | | | | | | | | | |
Small Cap Fund | | | | | | | | | | | | | | | | | | | | | | | | |
Investor Class | | | | | | | | | | | | | | | | | | | | | | | | |
Year Ended December 31, 2022 | | $ | 18.72 | | | $ | (0.03 | ) | | $ | (4.28 | ) | | $ | (4.31 | ) | | $ | — | | | $ | 0.35 | |
Year Ended December 31, 2021 | | | 15.78 | | | | 0.08 | | | | 4.66 | | | | 4.74 | | | | 0.04 | | | | 1.76 | |
Year Ended December 31, 2020 | | | 14.67 | | | | (0.03 | ) | | | 1.75 | | | | 1.72 | | | | — | | | | 0.61 | |
Year Ended December 31, 2019 | | | 12.01 | | | | 0.13 | | | | 2.66 | | | | 2.79 | | | | 0.13 | | | | — | |
Year Ended December 31, 2018 | | | 16.41 | | | | 0.00 | 6 | | | (2.64 | ) | | | (2.64 | ) | | | 0.00 | 6 | | | 1.76 | |
Class A | | | | | | | | | | | | | | | | | | | | | | | | |
Year Ended December 31, 2022 | | $ | 18.66 | | | $ | (0.03 | ) | | $ | (4.27 | ) | | $ | (4.30 | ) | | $ | — | | | $ | 0.35 | |
Year Ended December 31, 2021 | | | 15.73 | | | | 0.08 | | | | 4.65 | | | | 4.73 | | | | 0.04 | | | | 1.76 | |
Year Ended December 31, 2020 | | | 14.63 | | | | (0.03 | ) | | | 1.74 | | | | 1.71 | | | | — | | | | 0.61 | |
Year Ended December 31, 2019 | | | 11.98 | | | | 0.12 | | | | 2.66 | | | | 2.78 | | | | 0.13 | | | | — | |
Year Ended December 31, 2018 | | | 16.38 | | | | 0.00 | 6 | | | (2.63 | ) | | | (2.63 | ) | | | 0.01 | | | | 1.76 | |
Institutional Class | | | | | | | | | | | | | | | | | | | | | | | | |
Year Ended December 31, 2022 | | $ | 18.99 | | | $ | 0.01 | | | $ | (4.34 | ) | | $ | (4.33 | ) | | $ | 0.02 | | | $ | 0.35 | |
Year Ended December 31, 2021 | | | 15.99 | | | | 0.14 | | | | 4.71 | | | | 4.85 | | | | 0.09 | | | | 1.76 | |
Year Ended December 31, 2020 | | | 14.82 | | | | 0.00 | 6 | | | 1.78 | | | | 1.78 | | | | — | | | | 0.61 | |
Year Ended December 31, 2019 | | | 12.12 | | | | 0.15 | | | | 2.70 | | | | 2.85 | | | | 0.15 | | | | — | |
Year Ended December 31, 2018 | | | 16.53 | | | | 0.05 | | | | (2.67 | ) | | | (2.62 | ) | | | 0.03 | | | | 1.76 | |
1 | Based on average shares outstanding during the period. |
2 | Total return represents aggregate total return for the period indicated, includes reinvestment of all dividends and distributions, and does not reflect the deduction of any applicable sales charges. Total returns for periods of less than one year have not been annualized. |
3 | Ratios representing periods of less than one year have been annualized. |
SEE NOTES TO FINANCIAL STATEMENTS | 122 | |
| | | | | | | | | | | | | | | | | Ratios to
average net
assets3 | | | | | | | | | |
| | Total
distributions | | | Net asset
value,
end of
period | | | Total return2 | | | Net assets
end of period
(in $000’s) | | | Net
expenses
including
reimbursements
and waivers | | | Net
investment
income | | | Total
expenses
excluding
reimbursements
and waivers | | | Portfolio
Turnover4 | | | | |
| | | | | | | | | | | | | | | | | | | | | | | | | | | | | | | | | | | | |
| | | | | | | | | | | | | | | | | | | | | | | | | | | | | | | | | | | | |
| | $ | 0.34 | | | $ | 11.52 | | | | (19.99 | %) | | $ | 56,667 | | | | 0.97 | % | | | 0.49 | % | | | 0.97 | % | | | 34 | % | | | | |
| | | 0.86 | | | | 14.82 | | | | 30.57 | % | | | 57,965 | | | | 0.97 | % | | | 0.22 | % | | | 0.97 | % | | | 25 | % | | | | |
| | | 0.80 | | | | 12.02 | | | | 23.75 | % | | | 21,351 | | | | 0.95 | % | | | 0.51 | % | | | 0.95 | % | | | 43 | % | | | | |
| | | 0.37 | | | | 10.38 | | | | 34.85 | % | | | 3,271 | | | | 0.95 | % | | | 0.74 | % | | | 0.95 | % | | | 37 | % | | | | |
| | | 2.03 | | | | 7.97 | | | | (5.01 | %) | | | 1,975 | | | | 0.96 | % | | | 0.67 | % | | | 0.96 | % | | | 54 | % | | | | |
| | | | | | | | | | | | | | | | | | | | | | | | | | | | | | | | | | | | |
| | $ | 0.37 | | | $ | 11.56 | | | | (19.77 | %) | | $ | 1,291,988 | | | | 0.72 | % | | | 0.73 | % | | | 0.72 | % | | | 34 | % | | | | |
| | | 0.89 | | | | 14.87 | | | | 30.92 | % | | | 1,511,547 | | | | 0.71 | % | | | 0.47 | % | | | 0.71 | % | | | 25 | % | | | | |
| | | 0.82 | | | | 12.05 | | | | 23.99 | % | | | 1,020,242 | | | | 0.70 | % | | | 0.84 | % | | | 0.70 | % | | | 43 | % | | | | |
| | | 0.39 | | | | 10.40 | | | | 35.23 | % | | | 763,004 | | | | 0.70 | % | | | 1.00 | % | | | 0.70 | % | | | 37 | % | | | | |
| | | 2.06 | | | | 7.98 | | | | (4.79 | %) | | | 590,664 | | | | 0.70 | % | | | 0.85 | % | | | 0.70 | % | | | 54 | % | | | | |
| | | | | | | | | | | | | | | | | | | | | | | | | | | | | | | | | | | | |
| | | | | | | | | | | | | | | | | | | | | | | | | | | | | | | | | | | | |
| | | | | | | | | | | | | | | | | | | | | | | | | | | | | | | | | | | | |
| | $ | 0.35 | | | $ | 14.06 | | | | (22.97 | %) | | $ | 93,090 | | | | 1.16 | % | | | (0.23 | %)5 | | | 1.16 | % | | | 38 | % | | | | |
| | | 1.80 | | | | 18.72 | | | | 30.26 | % | | | 125,234 | | | | 1.15 | % | | | 0.44 | % | | | 1.15 | % | | | 44 | % | | | | |
| | | 0.61 | | | | 15.78 | | | | 11.77 | % | | | 102,582 | | | | 1.19 | % | | | (0.23 | %) | | | 1.19 | % | | | 73 | % | | | | |
| | | 0.13 | | | | 14.67 | | | | 23.29 | % | | | 110,520 | | | | 1.20 | % | | | 0.93 | % | | | 1.20 | % | | | 78 | % | | | | |
| | | 1.76 | | | | 12.01 | | | | (15.80 | %) | | | 116,887 | | | | 1.18 | % | | | 0.03 | % | | | 1.18 | % | | | 57 | % | | | | |
| | | | | | | | | | | | | | | | | | | | | | | | | | | | | | | | | | | | |
| | $ | 0.35 | | | $ | 14.01 | | | | (23.03 | %) | | $ | 10,895 | | | | 1.16 | % | | | (0.23 | %)5 | | | 1.16 | % | | | 38 | % | | | | |
| | | 1.80 | | | | 18.66 | | | | 30.29 | % | | | 14,305 | | | | 1.15 | % | | | 0.44 | % | | | 1.15 | % | | | 44 | % | | | | |
| | | 0.61 | | | | 15.73 | | | | 11.73 | % | | | 10,948 | | | | 1.19 | % | | | (0.23 | %) | | | 1.19 | % | | | 73 | % | | | | |
| | | 0.13 | | | | 14.63 | | | | 23.27 | % | | | 12,445 | | | | 1.20 | % | | | 0.90 | % | | | 1.20 | % | | | 78 | % | | | | |
| | | 1.77 | | | | 11.98 | | | | (15.82 | %) | | | 12,290 | | | | 1.18 | % | | | 0.02 | % | | | 1.18 | % | | | 57 | % | | | | |
| | | | | | | | | | | | | | | | | | | | | | | | | | | | | | | | | | | | |
| | $ | 0.37 | | | $ | 14.29 | | | | (22.80 | %) | | $ | 484,498 | | | | 0.91 | % | | | 0.03 | %5 | | | 0.91 | % | | | 38 | % | | | | |
| | | 1.85 | | | | 18.99 | | | | 30.54 | % | | | 603,123 | | | | 0.90 | % | | | 0.73 | % | | | 0.90 | % | | | 44 | % | | | | |
| | | 0.61 | | | | 15.99 | | | | 12.06 | % | | | 352,709 | | | | 0.94 | % | | | 0.02 | % | | | 0.94 | % | | | 73 | % | | | | |
| | | 0.15 | | | | 14.82 | | | | 23.56 | % | | | 308,145 | | | | 0.95 | % | | | 1.08 | % | | | 0.95 | % | | | 78 | % | | | | |
| | | 1.79 | | | | 12.12 | | | | (15.59 | %) | | | 317,417 | | | | 0.93 | % | | | 0.29 | % | | | 0.93 | % | | | 57 | % | | | | |
5 | In 2022 the Adviser reimbursed the Fund losses related to a trading error in the amount of $63,091. Before the reimbursement by the Adviser, total returns for Investor Class, Class A and Institutional Class shares would have remained the same at (22.97%), (23.03%) and (22.80%), respectively. The Net Investment Income for Investor Class, Class A and Institutional Class shares would have been (0.24%), (0.22%) and 0.02%, respectively. |
6 | Rounds to less than $0.01 |
| | 123 | SEE NOTES TO FINANCIAL STATEMENTS |
December 31, 2022 |
Financial Highlights, continued |
Selected data for a share outstanding throughout each period. |
| | | | | | | Income
(loss) from
investment
operations | | | | | | | Distributions to
shareholders | |
| | Net asset
value,
beginning of
period | | | Net
investment
income1 | | | Net
realized and
unrealized
gain (loss) | | | Total from
investment
operations | | | From net
investment
income | | | From net
realized
gains | |
US Sustainable Economy Fund | | | | | | | | | | | | | | | | | | | | | | | | |
Investor Class | | | | | | | | | | | | | | | | | | | | | | | | |
Year Ended December 31, 2022 | | $ | 25.28 | | | $ | 0.22 | | | $ | (4.84 | ) | | $ | (4.62 | ) | | $ | 0.37 | | | $ | 1.06 | |
Year Ended December 31, 2021 | | | 23.78 | | | | 0.20 | | | | 6.83 | | | | 7.03 | | | | 0.20 | | | | 5.33 | |
Year Ended December 31, 2020 | | | 21.41 | | | | 0.23 | | | | 2.60 | | | | 2.83 | | | | 0.22 | | | | 0.24 | |
Year Ended December 31, 2019 | | | 17.42 | | | | 0.28 | | | | 4.43 | | | | 4.71 | | | | 0.28 | | | | 0.44 | |
Year Ended December 31, 2018 | | | 19.69 | | | | 0.32 | | | | (1.20 | ) | | | (0.88 | ) | | | 0.32 | | | | 1.07 | |
Class A | | | | | | | | | | | | | | | | | | | | | | | | |
Year Ended December 31, 2022 | | $ | 25.18 | | | $ | 0.22 | | | $ | (4.82 | ) | | $ | (4.60 | ) | | $ | 0.37 | | | $ | 1.06 | |
Year Ended December 31, 2021 | | | 23.71 | | | | 0.20 | | | | 6.80 | | | | 7.00 | | | | 0.20 | | | | 5.33 | |
Year Ended December 31, 2020 | | | 21.35 | | | | 0.23 | | | | 2.59 | | | | 2.82 | | | | 0.22 | | | | 0.24 | |
Year Ended December 31, 2019 | | | 17.38 | | | | 0.28 | | | | 4.41 | | | | 4.69 | | | | 0.28 | | | | 0.44 | |
Year Ended December 31, 2018 | | | 19.65 | | | | 0.32 | | | | (1.20 | ) | | | (0.88 | ) | | | 0.32 | | | | 1.07 | |
Institutional Class | | | | | | | | | | | | | | | | | | | | | | | | |
Year Ended December 31, 2022 | | $ | 26.25 | | | $ | 0.28 | | | $ | (5.02 | ) | | $ | (4.74 | ) | | $ | 0.42 | | | $ | 1.06 | |
Year Ended December 31, 2021 | | | 24.52 | | | | 0.28 | | | | 7.05 | | | | 7.33 | | | | 0.27 | | | | 5.33 | |
Year Ended December 31, 2020 | | | 22.07 | | | | 0.29 | | | | 2.67 | | | | 2.96 | | | | 0.27 | | | | 0.24 | |
Year Ended December 31, 2019 | | | 17.94 | | | | 0.34 | | | | 4.56 | | | | 4.90 | | | | 0.33 | | | | 0.44 | |
Year Ended December 31, 2018 | | | 20.23 | | | | 0.38 | | | | (1.23 | ) | | | (0.85 | ) | | | 0.37 | | | | 1.07 | |
| | | | | | | | | | | | | | | | | | | | | | | | | |
Global Sustainable Infrastructure Fund | | | | | | | | | | | | | | | | | | | | | | | | |
Investor Class | | | | | | | | | | | | | | | | | | | | | | | | |
Year Ended December 31, 2022 | | $ | 10.11 | | | $ | 0.24 | | | $ | (1.61 | ) | | $ | (1.37 | ) | | $ | 0.21 | | | $ | — | |
Year Ended December 31, 2021 | | | 14.17 | | | | 0.41 | | | | 1.48 | | | | 1.89 | | | | 0.32 | | | | 5.63 | |
Year Ended December 31, 2020 | | | 12.78 | | | | 0.23 | | | | 1.56 | | | | 1.79 | | | | 0.21 | | | | 0.19 | |
Year Ended December 31, 2019 | | | 10.64 | | | | 0.25 | | | | 2.49 | | | | 2.74 | | | | 0.25 | | | | 0.35 | |
Year Ended December 31, 2018 | | | 11.50 | | | | 0.24 | | | | (0.73 | ) | | | (0.49 | ) | | | 0.24 | | | | 0.13 | |
Institutional Class | | | | | | | | | | | | | | | | | | | | | | | | |
Year Ended December 31, 2022 | | $ | 10.16 | | | $ | 0.26 | | | $ | (1.62 | ) | | $ | (1.36 | ) | | $ | 0.23 | | | $ | — | |
Year Ended December 31, 2021 | | | 14.21 | | | | 0.43 | | | | 1.51 | | | | 1.94 | | | | 0.36 | | | | 5.63 | |
Year Ended December 31, 2020 | | | 12.81 | | | | 0.26 | | | | 1.57 | | | | 1.83 | | | | 0.24 | | | | 0.19 | |
Year Ended December 31, 2019 | | | 10.66 | | | | 0.28 | | | | 2.50 | | | | 2.78 | | | | 0.28 | | | | 0.35 | |
Year Ended December 31, 2018 | | | 11.50 | | | | 0.26 | | | | (0.70 | ) | | | (0.44 | ) | | | 0.27 | | | | 0.13 | |
1 | Based on average shares outstanding during the period. |
2 | Total return represents aggregate total return for the period indicated, includes reinvestment of all dividends and distributions, and does not reflect the deduction of any applicable sales charges. Total returns for periods of less than one year have not been annualized. |
3 | Ratios representing periods of less than one year have been annualized. |
SEE NOTES TO FINANCIAL STATEMENTS | 124 | |
| | | | | | | | | | | | | | | | | | | | Ratios to
average net
assets3 | | | | | |
| | Tax return
of capital | | | Total
distributions | | | Net asset
value,
end of
period | | | Total return2 | | | Net assets
end of period
(in $000’s) | | | Net
expenses
including
reimbursements
and waivers | | | Net
investment
income | | | Total
expenses
excluding
reimbursements
and waivers | | | Portfolio
Turnover4 | |
| | | | | | | | | | | | | | | | | | | | | | | | | | | | | | | | | | | | |
| | | | | | | | | | | | | | | | | | | | | | | | | | | | | | | | | | | | |
| | $ | 0.04 | | | $ | 1.47 | | | $ | 19.19 | | | | (18.25 | %) | | $ | 159,822 | | | | 0.70 | % | | | 1.01 | % | | | 0.88 | % | | | 37 | % |
| | | — | | | | 5.53 | | | | 25.28 | | | | 30.02 | % | | | 205,407 | | | | 0.74 | % | | | 0.74 | % | | | 0.88 | % | | | 47 | % |
| | | — | | | | 0.46 | | | | 23.78 | | | | 13.34 | % | | | 170,315 | | | | 0.90 | % | | | 1.10 | % | | | 0.90 | % | | | 65 | % |
| | | — | | | | 0.72 | | | | 21.41 | | | | 27.13 | % | | | 161,021 | | | | 0.90 | % | | | 1.43 | % | | | 0.90 | % | | | 49 | % |
| | | — | | | | 1.39 | | | | 17.42 | | | | (4.43 | %) | | | 134,435 | | | | 0.90 | % | | | 1.59 | % | | | 0.90 | % | | | 55 | % |
| | | | | | | | | | | | | | | | | | | | | | | | | | | | | | | | | | | | |
| | $ | 0.04 | | | $ | 1.47 | | | $ | 19.11 | | | | (18.24 | %) | | $ | 8,142 | | | | 0.70 | % | | | 1.01 | % | | | 0.88 | % | | | 37 | % |
| | | — | | | | 5.53 | | | | 25.18 | | | | 29.99 | % | | | 10,150 | | | | 0.74 | % | | | 0.74 | % | | | 0.88 | % | | | 47 | % |
| | | — | | | | 0.46 | | | | 23.71 | | | | 13.33 | % | | | 6,599 | | | | 0.90 | % | | | 1.11 | % | | | 0.90 | % | | | 65 | % |
| | | — | | | | 0.72 | | | | 21.35 | | | | 27.08 | % | | | 6,659 | | | | 0.90 | % | | | 1.43 | % | | | 0.90 | % | | | 49 | % |
| | | — | | | | 1.39 | | | | 17.38 | | | | (4.43 | %) | | | 5,417 | | | | 0.90 | % | | | 1.59 | % | | | 0.90 | % | | | 55 | % |
| | | | | | | | | | | | | | | | | | | | | | | | | | | | | | | | | | | | |
| | $ | 0.04 | | | $ | 1.52 | | | $ | 19.99 | | | | (18.01 | %) | | $ | 80,572 | | | | 0.45 | % | | | 1.27 | % | | | 0.63 | % | | | 37 | % |
| | | — | | | | 5.60 | | | | 26.25 | | | | 30.35 | % | | | 98,866 | | | | 0.49 | % | | | 0.99 | % | | | 0.63 | % | | | 47 | % |
| | | — | | | | 0.51 | | | | 24.52 | | | | 13.57 | % | | | 79,301 | | | | 0.65 | % | | | 1.35 | % | | | 0.65 | % | | | 65 | % |
| | | — | | | | 0.77 | | | | 22.07 | | | | 27.42 | % | | | 72,736 | | | | 0.65 | % | | | 1.68 | % | | | 0.65 | % | | | 49 | % |
| | | — | | | | 1.44 | | | | 17.94 | | | | (4.16 | %) | | | 54,131 | | | | 0.65 | % | | | 1.84 | % | | | 0.65 | % | | | 55 | % |
| | | | | | | | | | | | | | | | | | | | | | | | | | | | | | | | | | | | |
| | | | | | | | | | | | | | | | | | | | | | | | | | | | | | | | | | | | |
| | | | | | | | | | | | | | | | | | | | | | | | | | | | | | | | | | | | |
| | $ | — | | | $ | 0.21 | | | $ | 8.53 | | | | (13.44 | %) | | $ | 5,816 | | | | 0.80 | % | | | 2.64 | % | | | 0.90 | % | | | 54 | % |
| | | — | | | | 5.95 | | | | 10.11 | | | | 13.98 | % | | | 5,432 | | | | 0.83 | % | | | 2.70 | % | | | 0.90 | % | | | 127 | % |
| | | — | | | | 0.40 | | | | 14.17 | | | | 14.25 | % | | | 4,014 | | | | 0.90 | % | | | 1.80 | % | | | 0.90 | % | | | 93 | % |
| | | — | | | | 0.60 | | | | 12.78 | | | | 25.85 | % | | | 2,859 | | | | 0.90 | % | | | 2.03 | % | | | 0.90 | % | | | 50 | % |
| | | — | | | | 0.37 | | | | 10.64 | | | | (4.21 | %) | | | 1,846 | | | | 0.90 | % | | | 2.11 | % | | | 0.90 | % | | | 52 | % |
| | | | | | | | | | | | | | | | | | | | | | | | | | | | | | | | | | | | |
| | $ | — | | | $ | 0.23 | | | $ | 8.57 | | | | (13.25 | %) | | $ | 101,022 | | | | 0.55 | % | | | 2.89 | % | | | 0.65 | % | | | 54 | % |
| | | — | | | | 5.99 | | | | 10.16 | | | | 14.27 | % | | | 92,244 | | | | 0.58 | % | | | 2.81 | % | | | 0.65 | % | | | 127 | % |
| | | — | | | | 0.43 | | | | 14.21 | | | | 14.54 | % | | | 136,036 | | | | 0.65 | % | | | 2.06 | % | | | 0.65 | % | | | 93 | % |
| | | — | | | | 0.63 | | | | 12.81 | | | | 26.18 | % | | | 130,001 | | | | 0.65 | % | | | 2.28 | % | | | 0.65 | % | | | 50 | % |
| | | — | | | | 0.40 | | | | 10.66 | | | | (3.84 | %) | | | 115,362 | | | | 0.65 | % | | | 2.24 | % | | | 0.65 | % | | | 52 | % |
| | 125 | SEE NOTES TO FINANCIAL STATEMENTS |
December 31, 2022 |
Financial Highlights, continued |
Selected data for a share outstanding throughout each period. |
| | | | | | | Income
(loss) from
investment
operations | | | | | | | Distributions to
shareholders | |
| | Net asset
value,
beginning of
period | | | Net
investment
income1 | | | Net
realized and
unrealized
gain (loss) | | | Total from
investment
operations | | | From net
investment
income | | | From net
realized
gains | |
Global Opportunities Fund | | | | | | | | | | | | | | | | | | | | | | | | |
Investor Class | | | | | | | | | | | | | | | | | | | | | | | | |
Year Ended December 31, 2022 | | $ | 17.09 | | | $ | 0.01 | | | $ | (3.20 | ) | | $ | (3.19 | ) | | $ | 0.03 | | | $ | 0.18 | |
Year Ended December 31, 2021 | | | 14.66 | | | | (0.02 | ) | | | 2.76 | | | | 2.74 | | | | — | | | | 0.31 | |
Year Ended December 31, 2020 | | | 12.04 | | | | (0.01 | ) | | | 2.75 | | | | 2.74 | | | | — | | | | 0.12 | |
Year Ended December 31, 2019 | | | 9.18 | | | | 0.02 | | | | 3.05 | | | | 3.07 | | | | 0.03 | | | | 0.18 | |
Period Ended December 31, 20185 | | | 10.00 | | | | (0.01 | ) | | | (0.81 | ) | | | (0.82 | ) | | | — | | | | — | |
Institutional Class | | | | | | | | | | | | | | | | | | | | | | | | |
Year Ended December 31, 2022 | | $ | 17.15 | | | $ | 0.05 | | | $ | (3.22 | ) | | $ | (3.17 | ) | | $ | 0.05 | | | $ | 0.18 | |
Year Ended December 31, 2021 | | | 14.69 | | | | 0.02 | | | | 2.76 | | | | 2.78 | | | | 0.01 | | | | 0.31 | |
Year Ended December 31, 2020 | | | 12.04 | | | | 0.02 | | | | 2.76 | | | | 2.78 | | | | 0.01 | | | | 0.12 | |
Year Ended December 31, 2019 | | | 9.18 | | | | 0.06 | | | | 3.03 | | | | 3.09 | | | | 0.05 | | | | 0.18 | |
Period Ended December 31, 20185 | | | 10.00 | | | | 0.00 | 6 | | | (0.82 | ) | | | (0.82 | ) | | | — | | | | — | |
| | | | | | | | | | | | | | | | | | | | | |
Global Environmental Markets Fund | | | | | | | | | | | | | | | | | | | | |
Investor Class | | | | | | | | | | | | | | | | | | | | | | | | |
Year Ended December 31, 2022 | | $ | 25.22 | | | $ | 0.07 | | | $ | (5.78 | ) | | $ | (5.71 | ) | | $ | 0.04 | | | $ | 0.06 | |
Year Ended December 31, 2021 | | | 21.08 | | | | 0.14 | | | | 4.48 | | | | 4.62 | | | | 0.13 | | | | 0.35 | |
Year Ended December 31, 2020 | | | 16.85 | | | | 0.09 | | | | 4.22 | | | | 4.31 | | | | 0.08 | | | | — | |
Year Ended December 31, 2019 | | | 13.28 | | | | 0.12 | | | | 3.56 | | | | 3.68 | | | | 0.11 | | | | — | |
Year Ended December 31, 2018 | | | 16.11 | | | | 0.13 | | | | (2.43 | ) | | | (2.30 | ) | | | 0.12 | | | | 0.41 | |
Class A | | | | | | | | | | | | | | | | | | | | | | | | |
Year Ended December 31, 2022 | | $ | 25.17 | | | $ | 0.07 | | | $ | (5.76 | ) | | $ | (5.69 | ) | | $ | 0.04 | | | $ | 0.06 | |
Year Ended December 31, 2021 | | | 21.05 | | | | 0.14 | | | | 4.46 | | | | 4.60 | | | | 0.13 | | | | 0.35 | |
Year Ended December 31, 2020 | | | 16.83 | | | | 0.09 | | | | 4.21 | | | | 4.30 | | | | 0.08 | | | | — | |
Year Ended December 31, 2019 | | | 13.26 | | | | 0.12 | | | | 3.56 | | | | 3.68 | | | | 0.11 | | | | — | |
Year Ended December 31, 2018 | | | 16.09 | | | | 0.13 | | | | (2.43 | ) | | | (2.30 | ) | | | 0.12 | | | | 0.41 | |
Institutional Class | | | | | | | | | | | | | | | | | | | | | | | | |
Year Ended December 31, 2022 | | $ | 25.40 | | | $ | 0.12 | | | $ | (5.82 | ) | | $ | (5.70 | ) | | $ | 0.06 | | | $ | 0.06 | |
Year Ended December 31, 2021 | | | 21.23 | | | | 0.21 | | | | 4.49 | | | | 4.70 | | | | 0.18 | | | | 0.35 | |
Year Ended December 31, 2020 | | | 16.97 | | | | 0.14 | | | | 4.25 | | | | 4.39 | | | | 0.13 | | | | — | |
Year Ended December 31, 2019 | | | 13.36 | | | | 0.16 | | | | 3.60 | | | | 3.76 | | | | 0.15 | | | | — | |
Year Ended December 31, 2018 | | | 16.22 | | | | 0.17 | | | | (2.46 | ) | | | (2.29 | ) | | | 0.16 | | | | 0.41 | |
1 | Based on average shares outstanding during the period. |
2 | Total return represents aggregate total return for the period indicated, includes reinvestment of all dividends and distributions, and does not reflect the deduction of any applicable sales charges. Total returns for periods of less than one year have not been annualized. |
3 | Ratios representing periods of less than one year have been annualized. |
SEE NOTES TO FINANCIAL STATEMENTS | 126 | |
| | | | | | | | | | | | | | | | | Ratios to
average net
assets3 | | | | | | | | | |
| | Total
distributions | | | Net asset
value,
end of
period | | | Total return2 | | | Net assets
end of period
(in $000’s) | | | Net
expenses
including
reimbursements
and waivers | | | Net
investment
income | | | Total
expenses
excluding
reimbursements
and waivers | | | Portfolio
Turnover4 | | | | |
| | | | | | | | | | | | | | | | | | | | | | | | | | | | | | | | | | | | |
| | | | | | | | | | | | | | | | | | | | | | | | | | | | | | | | | | | | |
| | $ | 0.21 | | | $ | 13.69 | | | | (18.66 | %) | | $ | 5,260 | | | | 1.23 | % | | | 0.09 | % | | | 1.33 | % | | | 38 | % | | | | |
| | | 0.31 | | | | 17.09 | | | | 18.69 | % | | | 5,784 | | | | 1.21 | % | | | (0.15 | %) | | | 1.32 | % | | | 30 | % | | | | |
| | | 0.12 | | | | 14.66 | | | | 22.76 | % | | | 3,401 | | | | 1.18 | % | | | (0.06 | %) | | | 1.56 | % | | | 34 | % | | | | |
| | | 0.21 | | | | 12.04 | | | | 33.51 | % | | | 1,683 | | | | 1.19 | % | | | 0.17 | % | | | 1.68 | % | | | 29 | % | | | | |
| | | — | | | | 9.18 | | | | (8.20 | %) | | | 126 | | | | 1.16 | % | | | (0.14 | %) | | | 2.06 | % | | | 17 | % | | | | |
| | | | | | | | | | | | | | | | | | | | | | | | | | | | | | | | | | | | |
| | $ | 0.23 | | | $ | 13.75 | | | | (18.49 | %) | | $ | 99,480 | | | | 0.98 | % | | | 0.34 | % | | | 1.08 | % | | | 38 | % | | | | |
| | | 0.32 | | | | 17.15 | | | | 18.96 | % | | | 137,236 | | | | 0.96 | % | | | 0.11 | % | | | 1.07 | % | | | 30 | % | | | | |
| | | 0.13 | | | | 14.69 | | | | 23.12 | % | | | 65,644 | | | | 0.94 | % | | | 0.17 | % | | | 1.31 | % | | | 34 | % | | | | |
| | | 0.23 | | | | 12.04 | | | | 33.72 | % | | | 40,392 | | | | 0.92 | % | | | 0.51 | % | | | 1.42 | % | | | 29 | % | | | | |
| | | — | | | | 9.18 | | | | (8.20 | %) | | | 24,816 | | | | 0.92 | % | | | 0.01 | % | | | 1.81 | % | | | 17 | % | | | | |
| | | | | | | | | | | | | | | | | | | | | | | | | | | | | | | | | | | | |
| | | | | | | | | | | | | | | | | | | | | | | | | | | | | | | | | | | | |
| | | | | | | | | | | | | | | | | | | | | | | | | | | | | | | | | | | | |
| | $ | 0.10 | | | $ | 19.41 | | | | (22.62 | %) | | $ | 167,290 | | | | 1.16 | % | | | 0.37 | % | | | 1.16 | % | | | 35 | % | | | | |
| | | 0.48 | | | | 25.22 | | | | 21.95 | % | | | 227,902 | | | | 1.15 | % | | | 0.61 | % | | | 1.15 | % | | | 18 | % | | | | |
| | | 0.08 | | | | 21.08 | | | | 25.71 | % | | | 175,040 | | | | 1.20 | % | | | 0.55 | % | | | 1.20 | % | | | 25 | % | | | | |
| | | 0.11 | | | | 16.85 | | | | 27.75 | % | | | 152,209 | | | | 1.22 | % | | | 0.78 | % | | | 1.22 | % | | | 14 | % | | | | |
| | | 0.53 | | | | 13.28 | | | | (14.31 | %) | | | 118,980 | | | | 1.22 | % | | | 0.83 | % | | | 1.24 | % | | | 26 | % | | | | |
| | | | | | | | | | | | | | | | | | | | | | | | | | | | | | | | | | | | |
| | $ | 0.10 | | | $ | 19.38 | | | | (22.58 | %) | | $ | 17,292 | | | | 1.16 | % | | | 0.36 | % | | | 1.16 | % | | | 35 | % | | | | |
| | | 0.48 | | | | 25.17 | | | | 21.89 | % | | | 22,613 | | | | 1.15 | % | | | 0.61 | % | | | 1.15 | % | | | 18 | % | | | | |
| | | 0.08 | | | | 21.05 | | | | 25.68 | % | | | 16,651 | | | | 1.20 | % | | | 0.54 | % | | | 1.20 | % | | | 25 | % | | | | |
| | | 0.11 | | | | 16.83 | | | | 27.77 | % | | | 13,700 | | | | 1.22 | % | | | 0.78 | % | | | 1.22 | % | | | 14 | % | | | | |
| | | 0.53 | | | | 13.26 | | | | (14.33 | %) | | | 12,766 | | | | 1.22 | % | | | 0.86 | % | | | 1.24 | % | | | 26 | % | | | | |
| | | | | | | | | | | | | | | | | | | | | | | | | | | | | | | | | | | | |
| | $ | 0.12 | | | $ | 19.58 | | | | (22.39 | %) | | $ | 2,024,095 | | | | 0.91 | % | | | 0.63 | % | | | 0.91 | % | | | 35 | % | | | | |
| | | 0.53 | | | | 25.40 | | | | 22.23 | % | | | 2,495,005 | | | | 0.90 | % | | | 0.87 | % | | | 0.90 | % | | | 18 | % | | | | |
| | | 0.13 | | | | 21.23 | | | | 26.00 | % | | | 1,437,952 | | | | 0.95 | % | | | 0.78 | % | | | 0.95 | % | | | 25 | % | | | | |
| | | 0.15 | | | | 16.97 | | | | 28.17 | % | | | 802,292 | | | | 0.97 | % | | | 1.01 | % | | | 0.97 | % | | | 14 | % | | | | |
| | | 0.44 | | | | 13.36 | | | | (14.17 | %) | | | 459,354 | | | | 0.97 | % | | | 1.10 | % | | | 0.99 | % | | | 26 | % | | | | |
5 | Per share data is reflected from the Fund’s inception date of June 27, 2018. |
6 | Rounds to less than $0.01 |
| | 127 | SEE NOTES TO FINANCIAL STATEMENTS |
December 31, 2022 |
Financial Highlights, continued |
Selected data for a share outstanding throughout each period. |
| | | | | | | Income
(loss) from
investment
operations | | | | | | | Distributions to
shareholders | |
| | Net asset
value,
beginning of
period | | | Net
investment
income1 | | | Net
realized and
unrealized
gain (loss) | | | Total from
investment
operations | | | From net
investment
income | | | From net
realized
gains | |
Global Women’s Leadership Fund | | | | | | | | | | | | | | | | | | | | |
Investor Class | | | | | | | | | | | | | | | | | | | | | | | | |
Year Ended December 31, 2022 | | $ | 35.14 | | | $ | 0.42 | | | $ | (7.45 | ) | | $ | (7.03 | ) | | $ | 0.24 | | | $ | 0.61 | |
Year Ended December 31, 2021 | | | 30.34 | | | | 0.39 | | | | 4.84 | | | | 5.23 | | | | 0.43 | | | | — | |
Year Ended December 31, 2020 | | | 27.00 | | | | 0.33 | | | | 3.32 | | | | 3.65 | | | | 0.31 | | | | — | |
Year Ended December 31, 2019 | | | 22.02 | | | | 0.47 | | | | 5.33 | | | | 5.80 | | | | 0.44 | | | | 0.38 | |
Year Ended December 31, 2018 | | | 25.02 | | | | 0.47 | | | | (2.39 | ) | | | (1.92 | ) | | | 0.44 | | | | 0.64 | |
Institutional Class | | | | | | | | | | | | | | | | | | | | | | | | |
Year Ended December 31, 2022 | | $ | 35.33 | | | $ | 0.49 | | | $ | (7.48 | ) | | $ | (6.99 | ) | | $ | 0.28 | | | $ | 0.61 | |
Year Ended December 31, 2021 | | | 30.50 | | | | 0.48 | | | | 4.86 | | | | 5.34 | | | | 0.51 | | | | — | |
Year Ended December 31, 2020 | | | 27.14 | | | | 0.40 | | | | 3.34 | | | | 3.74 | | | | 0.38 | | | | — | |
Year Ended December 31, 2019 | | | 22.12 | | | | 0.53 | | | | 5.37 | | | | 5.90 | | | | 0.50 | | | | 0.38 | |
Year Ended December 31, 2018 | | | 25.13 | | | | 0.53 | | | | (2.40 | ) | | | (1.87 | ) | | | 0.50 | | | | 0.64 | |
| | | | | | | | | | | | | | | | | | | | | |
International Sustainable Economy Fund | | | | | | | | | | | | | | | | | | | | |
Investor Class | | | | | | | | | | | | | | | | | | | | | | | | |
Year Ended December 31, 2022 | | $ | 10.99 | | | $ | 0.21 | | | $ | (2.19 | ) | | $ | (1.98 | ) | | $ | 0.21 | | | $ | — | |
Year Ended December 31, 2021 | | | 10.35 | | | | 0.22 | | | | 0.90 | | | | 1.12 | | | | 0.23 | | | | 0.25 | |
Year Ended December 31, 2020 | | | 9.53 | | | | 0.17 | | | | 0.81 | | | | 0.98 | | | | 0.16 | | | | — | |
Year Ended December 31, 2019 | | | 7.95 | | | | 0.21 | | | | 1.59 | | | | 1.80 | | | | 0.22 | | | | — | |
Year Ended December 31, 2018 | | | 9.36 | | | | 0.22 | | | | (1.43 | ) | | | (1.21 | ) | | | 0.20 | | | | — | |
Institutional Class | | | | | | | | | | | | | | | | | | | | | | | | |
Year Ended December 31, 2022 | | $ | 10.76 | | | $ | 0.23 | | | $ | (2.15 | ) | | $ | (1.92 | ) | | $ | 0.23 | | | $ | — | |
Year Ended December 31, 2021 | | | 10.14 | | | | 0.24 | | | | 0.89 | | | | 1.13 | | | | 0.26 | | | | 0.25 | |
Year Ended December 31, 2020 | | | 9.34 | | | | 0.19 | | | | 0.79 | | | | 0.98 | | | | 0.18 | | | | — | |
Year Ended December 31, 2019 | | | 7.80 | | | | 0.23 | | | | 1.55 | | | | 1.78 | | | | 0.24 | | | | — | |
Year Ended December 31, 2018 | | | 9.19 | | | | 0.23 | | | | (1.40 | ) | | | (1.17 | ) | | | 0.22 | | | | — | |
1 | Based on average shares outstanding during the period. |
2 | Total return represents aggregate total return for the period indicated, includes reinvestment of all dividends and distributions, and does not reflect the deduction of any applicable sales charges. Total returns for periods of less than one year have not been annualized. |
3 | Ratios representing periods of less than one year have been annualized. |
5 | To manage cash flows, minimize trading costs and equitize cash balances in between trading blocks of securities, the Global Women’s Leadership Fund utilized one or more exchange-traded funds (ETFs), the combination of which is intended to track the Fund’s broad-based benchmark. These investments are frequent and short-term, however, the Fund is required to include such ETF investment activity in the calculation of its portfolio turnover. Had such transactions been excluded, the portfolio turnover would have been 26% for the year ended December 31, 2021, 37% for the year ended December 31, 2020, 25% for the year ended December 31, 2019, and 47% for the year ended December 31, 2018. |
SEE NOTES TO FINANCIAL STATEMENTS | 128 | |
| | | | | | | | | | | | | | | | | Ratios to
average net
assets3 | | | | | | | | | |
| | Total
distributions | | | Net asset
value,
end of
period | | | Total return2 | | | Net assets
end of period
(in $000’s) | | | Net
expenses
including
reimbursements
and waivers | | | Net
investment
income | | | Total
expenses
excluding
reimbursements
and waivers | | | Portfolio
Turnover4 | | | | |
| | | | | | | | | | | | | | | | | | | | | | | | | | | | | | | | | | | | |
| | | | | | | | | | | | | | | | | | | | | | | | | | | | | | | | | | | | |
| | $ | 0.85 | | | $ | 27.26 | | | | (19.98 | %) | | $ | 123,060 | | | | 0.77 | % | | | 1.42 | % | | | 0.77 | % | | | 45 | % | | | | |
| | | 0.43 | | | | 35.14 | | | | 17.27 | % | | | 160,749 | | | | 0.76 | % | | | 1.18 | % | | | 0.76 | % | | | 43 | %5 | | | | |
| | | 0.31 | | | | 30.34 | | | | 13.67 | % | | | 130,255 | | | | 0.78 | % | | | 1.27 | % | | | 0.78 | % | | | 69 | %5 | | | | |
| | | 0.82 | | | | 27.00 | | | | 26.42 | % | | | 118,713 | | | | 0.80 | % | | | 1.87 | % | | | 0.80 | % | | | 66 | %5 | | | | |
| | | 1.08 | | | | 22.02 | | | | (7.74 | %) | | | 86,727 | | | | 0.81 | % | | | 1.88 | % | | | 0.83 | % | | | 67 | %5 | | | | |
| | | | | | | | | | | | | | | | | | | | | | | | | | | | | | | | | | | | |
| | $ | 0.89 | | | $ | 27.45 | | | | (19.76 | %) | | $ | 648,037 | | | | 0.52 | % | | | 1.67 | % | | | 0.52 | % | | | 45 | % | | | | |
| | | 0.51 | | | | 35.33 | | | | 17.56 | % | | | 854,540 | | | | 0.51 | % | | | 1.43 | % | | | 0.51 | % | | | 43 | %5 | | | | |
| | | 0.38 | | | | 30.50 | | | | 13.94 | % | | | 619,168 | | | | 0.53 | % | | | 1.52 | % | | | 0.53 | % | | | 69 | %5 | | | | |
| | | 0.88 | | | | 27.14 | | | | 26.77 | % | | | 346,142 | | | | 0.55 | % | | | 2.07 | % | | | 0.55 | % | | | 66 | %5 | | | | |
| | | 1.14 | | | | 22.12 | | | | (7.51 | %) | | | 156,960 | | | | 0.56 | % | | | 2.09 | % | | | 0.58 | % | | | 67 | %5 | | | | |
| | | | | | | | | | | | | | | | | | | | | | | | | | | | | | | | | | | | |
| | | | | | | | | | | | | | | | | | | | | | | | | | | | | | | | | | | | |
| | | | | | | | | | | | | | | | | | | | | | | | | | | | | | | | | | | | |
| | $ | 0.21 | | | $ | 8.80 | | | | (18.00 | %) | | $ | 81,939 | | | | 0.72 | % | | | 2.30 | % | | | 0.72 | % | | | 51 | % | | | | |
| | | 0.48 | | | | 10.99 | | | | 10.88 | % | | | 90,993 | | | | 0.72 | % | | | 1.98 | % | | | 0.72 | % | | | 55 | %6 | | | | |
| | | 0.16 | | | | 10.35 | | | | 10.51 | % | | | 77,963 | | | | 0.75 | % | | | 1.91 | % | | | 0.75 | % | | | 43 | %6 | | | | |
| | | 0.22 | | | | 9.53 | | | | 22.78 | % | | | 84,855 | | | | 0.80 | % | | | 2.40 | % | | | 0.80 | % | | | 31 | %6 | | | | |
| | | 0.20 | | | | 7.95 | | | | (13.15 | %) | | | 77,880 | | | | 0.80 | % | | | 2.46 | % | | | 0.80 | % | | | 30 | %6 | | | | |
| | | | | | | | | | | | | | | | | | | | | | | | | | | | | | | | | | | | |
| | $ | 0.23 | | | $ | 8.61 | | | | (17.80 | %) | | $ | 743,946 | | | | 0.47 | % | | | 2.57 | % | | | 0.47 | % | | | 51 | % | | | | |
| | | 0.51 | | | | 10.76 | | | | 11.19 | % | | | 787,829 | | | | 0.47 | % | | | 2.22 | % | | | 0.47 | % | | | 55 | %6 | | | | |
| | | 0.18 | | | | 10.14 | | | | 10.78 | % | | | 623,014 | | | | 0.50 | % | | | 2.15 | % | | | 0.50 | % | | | 43 | %6 | | | | |
| | | 0.24 | | | | 9.34 | | | | 23.01 | % | | | 559,939 | | | | 0.55 | % | | | 2.63 | % | | | 0.55 | % | | | 31 | %6 | | | | |
| | | 0.22 | | | | 7.80 | | | | (12.90 | %) | | | 437,907 | | | | 0.55 | % | | | 2.55 | % | | | 0.55 | % | | | 30 | %6 | | | | |
6 | To manage cash flows, minimize trading costs and equitize cash balances in between trading blocks of securities, the International Sustainable Economy Fund utilized one or more exchange-traded funds (ETFs) which have an investment objective that tracks the Fund’s broad-based benchmark. These investments are frequent and short-term, however, the Fund is required to include such ETF investment activity in the calculation of its portfolio turnover. Had such transactions been excluded, the portfolio turnover would have been 41% for the year ended December 31, 2021, 27% for the year ended December 31, 2020, 19% for the year ended December 31, 2019, and 18% for the year ended December 31, 2018. |
| | 129 | SEE NOTES TO FINANCIAL STATEMENTS |
December 31, 2022 |
Financial Highlights, continued |
Selected data for a share outstanding throughout each period. |
| | | | | | | Income
(loss) from
investment
operations | | | | | | | Distributions to
shareholders | |
| | Net asset
value,
beginning of
period | | | Net
investment
income1 | | | Net
realized and
unrealized
gain (loss) | | | Total from
investment
operations | | | From net
investment
income | | | From net
realized
gains | |
Core Bond Fund | | | | | | | | | | | | | | | | | | | | | | | | |
Investor Class | | | | | | | | | | | | | | | | | | | | | | | | |
Year Ended December 31, 2022 | | $ | 10.21 | | | $ | 0.18 | | | $ | (1.52 | ) | | $ | (1.34 | ) | | $ | 0.19 | | | $ | — | |
Year Ended December 31, 2021 | | | 10.56 | | | | 0.14 | | | | (0.31 | ) | | | (0.17 | ) | | | 0.16 | | | | 0.02 | |
Year Ended December 31, 2020 | | | 10.29 | | | | 0.17 | | | | 0.53 | | | | 0.70 | | | | 0.19 | | | | 0.24 | |
Year Ended December 31, 2019 | | | 9.78 | | | | 0.23 | | | | 0.53 | | | | 0.76 | | | | 0.25 | | | | — | |
Year Ended December 31, 2018 | | | 10.04 | | | | 0.22 | | | | (0.25 | ) | | | (0.03 | ) | | | 0.23 | | | | — | |
Institutional Class | | | | | | | | | | | | | | | | | | | | | | | | |
Year Ended December 31, 2022 | | $ | 10.21 | | | $ | 0.21 | | | $ | (1.52 | ) | | $ | (1.31 | ) | | $ | 0.22 | | | $ | — | |
Year Ended December 31, 2021 | | | 10.56 | | | | 0.16 | | | | (0.30 | ) | | | (0.14 | ) | | | 0.19 | | | | 0.02 | |
Year Ended December 31, 2020 | | | 10.29 | | | | 0.20 | | | | 0.53 | | | | 0.73 | | | | 0.22 | | | | 0.24 | |
Year Ended December 31, 2019 | | | 9.78 | | | | 0.26 | | | | 0.52 | | | | 0.78 | | | | 0.27 | | | | — | |
Year Ended December 31, 2018 | | | 10.04 | | | | 0.24 | | | | (0.24 | ) | | | — | | | | 0.26 | | | | — | |
| | | | | | | | | | | | | | | | | | | | | | | | | |
High Yield Bond Fund | | | | | | | | | | | | | | | | | | | | | | | | |
Investor Class | | | | | | | | | | | | | | | | | | | | | | | | |
Year Ended December 31, 2022 | | $ | 6.90 | | | $ | 0.29 | | | $ | (1.17 | ) | | $ | (0.88 | ) | | $ | 0.29 | | | $ | — | |
Year Ended December 31, 2021 | | | 6.97 | | | | 0.27 | | | | (0.07 | ) | | | 0.20 | | | | 0.27 | | | | — | |
Year Ended December 31, 2020 | | | 6.79 | | | | 0.32 | | | | 0.18 | | | | 0.50 | | | | 0.32 | | | | — | |
Year Ended December 31, 2019 | | | 6.25 | | | | 0.33 | | | | 0.54 | | | | 0.87 | | | | 0.33 | | | | — | |
Year Ended December 31, 2018 | | | 6.78 | | | | 0.33 | | | | (0.53 | ) | | | (0.20 | ) | | | 0.33 | | | | — | |
Class A | | | | | | | | | | | | | | | | | | | | | | | | |
Year Ended December 31, 2022 | | $ | 6.92 | | | $ | 0.29 | | | $ | (1.18 | ) | | $ | (0.89 | ) | | $ | 0.29 | | | $ | — | |
Year Ended December 31, 2021 | | | 6.98 | | | | 0.27 | | | | (0.06 | ) | | | 0.21 | | | | 0.27 | | | | — | |
Year Ended December 31, 2020 | | | 6.80 | | | | 0.32 | | | | 0.19 | | | | 0.51 | | | | 0.33 | | | | — | |
Year Ended December 31, 2019 | | | 6.26 | | | | 0.33 | | | | 0.54 | | | | 0.87 | | | | 0.33 | | | | — | |
Year Ended December 31, 2018 | | | 6.79 | | | | 0.33 | | | | (0.53 | ) | | | (0.20 | ) | | | 0.33 | | | | — | |
Institutional Class | | | | | | | | | | | | | | | | | | | | | | | | |
Year Ended December 31, 2022 | | $ | 6.88 | | | $ | 0.30 | | | $ | (1.17 | ) | | $ | (0.87 | ) | | $ | 0.30 | | | $ | — | |
Year Ended December 31, 2021 | | | 6.94 | | | | 0.28 | | | | (0.04 | ) | | | 0.24 | | | | 0.30 | | | | — | |
Year Ended December 31, 2020 | | | 6.76 | | | | 0.33 | | | | 0.19 | | | | 0.52 | | | | 0.34 | | | | — | |
Year Ended December 31, 2019 | | | 6.23 | | | | 0.34 | | | | 0.53 | | | | 0.87 | | | | 0.34 | | | | — | |
Year Ended December 31, 2018 | | | 6.75 | | | | 0.35 | | | | (0.52 | ) | | | (0.17 | ) | | | 0.35 | | | | — | |
1 | Based on average shares outstanding during the period. |
2 | Total return represents aggregate total return for the period indicated, includes reinvestment of all dividends and distributions, and does not reflect the deduction of any applicable sales charges. Total returns for periods of less than one year have not been annualized. |
3 | Ratios representing periods of less than one year have been annualized. |
SEE NOTES TO FINANCIAL STATEMENTS | 130 | |
| | | | | | | | | | | | | | | | | Ratios to
average net
assets3 | | | | | | | | | |
| | Total
distributions | | | Net asset
value,
end of
period | | | Total return2 | | | Net assets
end of period
(in $000’s) | | | Net
expenses
including
reimbursements
and waivers | | | Net
investment
income | | | Total
expenses
excluding
reimbursements
and waivers | | | Portfolio
Turnover4 | | | | |
| | | | | | | | | | | | | | | | | | | | | | | | | | | | | | | | | | | | |
| | | | | | | | | | | | | | | | | | | | | | | | | | | | | | | | | | | | |
| | $ | 0.19 | | | $ | 8.68 | | | | (13.16 | %) | | $ | 12,029 | | | | 0.71 | % | | | 1.99 | % | | | 0.71 | % | | | 70 | % | | | | |
| | | 0.18 | | | | 10.21 | | | | (1.63 | %) | | | 14,076 | | | | 0.71 | % | | | 1.35 | % | | | 0.71 | % | | | 48 | % | | | | |
| | | 0.43 | | | | 10.56 | | | | 6.89 | % | | | 14,101 | | | | 0.72 | % | | | 1.58 | % | | | 0.72 | % | | | 79 | % | | | | |
| | | 0.25 | | | | 10.29 | | | | 7.78 | % | | | 7,401 | | | | 0.71 | % | | | 2.30 | % | | | 0.71 | % | | | 63 | % | | | | |
| | | 0.23 | | | | 9.78 | | | | (0.24 | %) | | | 4,277 | | | | 0.71 | % | | | 2.23 | % | | | 0.71 | % | | | 62 | % | | | | |
| | | | | | | | | | | | | | | | | | | | | | | | | | | | | | | | | | | | |
| | $ | 0.22 | | | $ | 8.68 | | | | (12.94 | %) | | $ | 787,620 | | | | 0.46 | % | | | 2.26 | % | | | 0.46 | % | | | 70 | % | | | | |
| | | 0.21 | | | | 10.21 | | | | (1.38 | %) | | | 771,495 | | | | 0.46 | % | | | 1.60 | % | | | 0.46 | % | | | 48 | % | | | | |
| | | 0.46 | | | | 10.56 | | | | 7.16 | % | | | 746,615 | | | | 0.46 | % | | | 1.86 | % | | | 0.46 | % | | | 79 | % | | | | |
| | | 0.27 | | | | 10.29 | | | | 8.04 | % | | | 702,291 | | | | 0.46 | % | | | 2.55 | % | | | 0.46 | % | | | 63 | % | | | | |
| | | 0.26 | | | | 9.78 | | | | 0.01 | % | | | 682,201 | | | | 0.46 | % | | | 2.50 | % | | | 0.46 | % | | | 62 | % | | | | |
| | | | | | | | | | | | | | | | | | | | | | | | | | | | | | | | | | | | |
| | | | | | | | | | | | | | | | | | | | | | | | | | | | | | | | | | | | |
| | | | | | | | | | | | | | | | | | | | | | | | | | | | | | | | | | | | |
| | $ | 0.29 | | | $ | 5.73 | | | | (12.89 | %) | | $ | 137,689 | | | | 0.92 | % | | | 4.70 | % | | | 0.92 | % | | | 35 | % | | | | |
| | | 0.27 | | | | 6.90 | | | | 2.96 | % | | | 172,881 | | | | 0.93 | % | | | 3.86 | % | | | 0.93 | % | | | 51 | % | | | | |
| | | 0.32 | | | | 6.97 | | | | 7.80 | % | | | 171,838 | | | | 0.96 | % | | | 4.87 | % | | | 0.96 | % | | | 97 | % | | | | |
| | | 0.33 | | | | 6.79 | | | | 14.11 | % | | | 183,631 | | | | 0.96 | % | | | 4.94 | % | | | 0.96 | % | | | 90 | % | | | | |
| | | 0.33 | | | | 6.25 | | | | (3.07 | %) | | | 162,841 | | | | 0.97 | % | | | 5.01 | % | | | 0.97 | % | | | 57 | % | | | | |
| | | | | | | | | | | | | | | | | | | | | | | | | | | | | | | | | | | | |
| | $ | 0.29 | | | $ | 5.74 | | | | (12.99 | %) | | $ | 5,011 | | | | 0.92 | % | | | 4.68 | % | | | 0.92 | % | | | 35 | % | | | | |
| | | 0.27 | | | | 6.92 | | | | 3.11 | % | | | 7,102 | | | | 0.93 | % | | | 3.85 | % | | | 0.93 | % | | | 51 | % | | | | |
| | | 0.33 | | | | 6.98 | | | | 7.79 | % | | | 6,177 | | | | 0.96 | % | | | 4.87 | % | | | 0.96 | % | | | 97 | % | | | | |
| | | 0.33 | | | | 6.80 | | | | 14.10 | % | | | 5,827 | | | | 0.96 | % | | | 4.95 | % | | | 0.96 | % | | | 90 | % | | | | |
| | | 0.33 | | | | 6.26 | | | | (3.05 | %) | | | 5,747 | | | | 0.97 | % | | | 5.01 | % | | | 0.97 | % | | | 57 | % | | | | |
| | | | | | | | | | | | | | | | | | | | | | | | | | | | | | | | | | | | |
| | $ | 0.30 | | | $ | 5.71 | | | | (12.72 | %) | | $ | 443,891 | | | | 0.67 | % | | | 4.95 | % | | | 0.67 | % | | | 35 | % | | | | |
| | | 0.30 | | | | 6.88 | | | | 3.36 | % | | | 560,469 | | | | 0.69 | % | | | 4.08 | % | | | 0.69 | % | | | 51 | % | | | | |
| | | 0.34 | | | | 6.94 | | | | 8.08 | % | | | 294,313 | | | | 0.72 | % | | | 5.07 | % | | | 0.72 | % | | | 97 | % | | | | |
| | | 0.34 | | | | 6.76 | | | | 14.26 | % | | | 186,350 | | | | 0.71 | % | | | 5.21 | % | | | 0.71 | % | | | 90 | % | | | | |
| | | 0.35 | | | | 6.23 | | | | (2.70 | %) | | | 188,333 | | | | 0.72 | % | | | 5.26 | % | | | 0.72 | % | | | 57 | % | | | | |
| | 131 | SEE NOTES TO FINANCIAL STATEMENTS |
December 31, 2022 |
Financial Highlights, continued |
Selected data for a share outstanding throughout each period. |
| | | | | | | Income
(loss) from
investment
operations | | | | | | | Distributions to
shareholders | |
| | Net asset
value,
beginning of
period | | | Net
investment
income1 | | | Net
realized and
unrealized
gain (loss) | | | Total from
investment
operations | | | From net
investment
income | | | From net
realized
gains | |
Sustainable Allocation Fund | | | | | | | | | | | | | | | | | | | | | | | | |
Investor Class | | | | | | | | | | | | | | | | | | | | | | | | |
Year Ended December 31, 2022 | | $ | 28.98 | | | $ | 0.33 | | | $ | (5.11 | ) | | $ | (4.78 | ) | | $ | 0.29 | | | $ | 1.13 | |
Year Ended December 31, 2021 | | | 26.36 | | | | 0.23 | | | | 3.79 | | | | 4.02 | | | | 0.23 | | | | 1.17 | |
Year Ended December 31, 2020 | | | 23.35 | | | | 0.26 | | | | 3.49 | | | | 3.75 | | | | 0.26 | | | | 0.48 | |
Year Ended December 31, 2019 | | | 21.14 | | | | 0.36 | | | | 4.02 | | | | 4.38 | | | | 0.37 | | | | 1.80 | |
Year Ended December 31, 2018 | | | 22.66 | | | | 0.33 | | | | (1.23 | ) | | | (0.90 | ) | | | 0.47 | | | | 0.15 | |
Institutional Class | | | | | | | | | | | | | | | | | | | | | | | | |
Year Ended December 31, 2022 | | $ | 29.54 | | | $ | 0.40 | | | $ | (5.22 | ) | | $ | (4.82 | ) | | $ | 0.35 | | | $ | 1.13 | |
Year Ended December 31, 2021 | | | 26.83 | | | | 0.32 | | | | 3.86 | | | | 4.18 | | | | 0.30 | | | | 1.17 | |
Year Ended December 31, 2020 | | | 23.76 | | | | 0.33 | | | | 3.54 | | | | 3.87 | | | | 0.32 | | | | 0.48 | |
Year Ended December 31, 2019 | | | 21.47 | | | | 0.43 | | | | 4.09 | | | | 4.52 | | | | 0.43 | | | | 1.80 | |
Year Ended December 31, 2018 | | | 23.01 | | | | 0.38 | | | | (1.24 | ) | | | (0.86 | ) | | | 0.53 | | | | 0.15 | |
1 | Based on average shares outstanding during the period. |
2 | Total return represents aggregate total return for the period indicated, includes reinvestment of all dividends and distributions, and does not reflect the deduction of any applicable sales charges. Total returns for periods of less than one year have not been annualized. |
3 | Ratios representing periods of less than one year have been annualized. |
SEE NOTES TO FINANCIAL STATEMENTS | 132 | |
| | | | | | | | | | | | | | | | | Ratios to
average net
assets3 | | | | | | | | | |
| | Total
distributions | | | Net asset
value,
end of
period | | | Total return2 | | | Net assets
end of period
(in $000’s) | | | Net
expenses
including
reimbursements
and waivers | | | Net
investment
income | | | Total
expenses
excluding
reimbursements
and waivers | | | Portfolio
Turnover4 | | | | |
| | | | | | | | | | | | | | | | | | | | | | | | | | | | | | | | | | | | |
| | | | | | | | | | | | | | | | | | | | | | | | | | | | | | | | | | | | |
| | $ | 1.42 | | | $ | 22.78 | | | | (16.42 | %) | | $ | 1,299,467 | | | | 0.30 | %5 | | | 1.29 | % | | | 0.30 | %5 | | | 4 | % | | | | |
| | | 1.40 | | | | 28.98 | | | | 15.31 | % | | | 1,652,892 | | | | 0.30 | %5 | | | 0.80 | % | | | 0.30 | %5 | | | 4 | % | | | | |
| | | 0.74 | | | | 26.36 | | | | 16.24 | % | | | 1,518,966 | | | | 0.30 | %5 | | | 1.08 | % | | | 0.30 | %5 | | | 13 | % | | | | |
| | | 2.17 | | | | 23.35 | | | | 20.83 | % | | | 1,523,009 | | | | 0.30 | %5 | | | 1.56 | % | | | 0.30 | %5 | | | 8 | % | | | | |
| | | 0.62 | | | | 21.14 | | | | (4.08 | %) | | | 1,324,582 | | | | 0.30 | %5 | | | 1.44 | %6 | | | 0.30 | %5 | | | 12 | % | | | | |
| | | | | | | | | | | | | | | | | | | | | | | | | | | | | | | | | | | | |
| | $ | 1.48 | | | $ | 23.24 | | | | (16.22 | %) | | $ | 845,463 | | | | 0.05 | %5 | | | 1.56 | % | | | 0.05 | %5 | | | 4 | % | | | | |
| | | 1.47 | | | | 29.54 | | | | 15.64 | % | | | 974,940 | | | | 0.05 | %5 | | | 1.10 | % | | | 0.05 | %5 | | | 4 | % | | | | |
| | | 0.80 | | | | 26.83 | | | | 16.49 | % | | | 657,906 | | | | 0.05 | %5 | | | 1.36 | % | | | 0.05 | %5 | | | 13 | % | | | | |
| | | 2.23 | | | | 23.76 | | | | 21.17 | % | | | 374,838 | | | | 0.05 | %5 | | | 1.80 | % | | | 0.05 | %5 | | | 8 | % | | | | |
| | | 0.68 | | | | 21.47 | | | | (3.85 | %) | | | 365,079 | | | | 0.05 | %5 | | | 1.64 | %6 | | | 0.05 | %5 | | | 12 | % | | | | |
5 | The expense ratio of the Sustainable Allocation Fund does not include indirect expenses of the underlying funds the Fund invests in. Indirect expenses of the underlying funds were 0.60% for the year ended December 31, 2022, 0.59% for the year ended December 31, 2021, 0.57% for the year ended December 31, 2020, 0.62% for the year ended December 31, 2019, and 0.61% for the year ended December 31, 2018. |
6 | In 2018, the Adviser reimbursed the Fund for expense overpayments related to transfer agent fees in the amount of $223,088. Before the reimbursement by the adviser, the difference in total returns for Investor Class and Institutional Class would have remained the same at (4.08)% and (3.85)%, respectively. The Net Investment Income for Investor Class and Institutional Class would have been 1.42% and 1.62%, respectively. |
| | 133 | SEE NOTES TO FINANCIAL STATEMENTS |
December 31, 2022 |
Notes to Financial Statements |
Impax Funds Series Trust I and Impax Funds Series Trust III
NOTE A—Organization and Summary of Significant Accounting Policies
Organization Impax Funds Series Trust I (“Trust I”), which is registered under the Investment Company Act of 1940, as amended (the “1940 Act”), is an open-end management investment company organized under the laws of the Commonwealth of Massachusetts on May 25, 2006. As of December 31, 2022, Trust I offered ten investment funds: Impax Large Cap Fund (the “Large Cap Fund”), Impax Small Cap Fund (the “Small Cap Fund”), Impax US Sustainable Economy Fund (the “US Sustainable Economy Fund”, Impax Global Sustainable Infrastructure Fund (the “Global Sustainable Infrastructure Fund”, Impax Global Opportunities Fund (the “Global Opportunities Fund”), Impax Global Environmental Markets Fund (the “Global Environmental Markets Fund”), Impax International Sustainable Economy Fund (the “International Sustainable Economy Fund”), Impax Core Bond Fund (the “Core Bond Fund”), Impax High Yield Bond Fund (the “High Yield Bond Fund”), and Impax Sustainable Allocation Fund (the “Sustainable Allocation Fund”).
Impax Funds Series Trust III (“Trust III”) is an open-end management investment company that was organized under the laws of the Commonwealth of Massachusetts on December 4, 2013 and registered under the 1940 Act. Impax Ellevate Global Women’s Leadership Fund (the “Global Women’s Leadership Fund”) is a diversified series of Trust III.
These financial statements relate to all funds (each a “Fund”, collectively, the “Funds”) offered under both Trust I and Trust III (each a “Trust”, collectively, the “Trusts”).
The Large Cap Fund, Global Sustainable Infrastructure Fund, Global Opportunities Fund, Global Women’s Leadership Fund, International Sustainable Economy Fund, Core Bond Fund and Sustainable Allocation Fund each offer two classes of shares—Investor Class shares and Institutional Class shares. The Small Cap Fund, US Sustainable Economy Fund, Global Environmental Markets Fund and High Yield Bond Fund each offer three classes of shares—Investor Class shares, Class A shares and Institutional Class shares. Although all share classes generally have identical voting, dividend and liquidation rights, each class votes separately when required by law. Different share classes pay different distribution amounts to the extent the expenses of such classes differ, and distributions in liquidation will be proportional to the net asset value of each share class. Each share class has its own expense structure and sales charges, as applicable.
The Funds seek to avoid investing in issuers that their investment adviser has determined are involved in the manufacture or sale of weapons or manufacture of tobacco products or engage in business practices that their investment adviser determines to be sub-standard from an Environmental, Social and Governance (ESG) or sustainability perspective in relation to their industry, sector, asset class or universe peers.
The Large Cap Fund’s investment objective is to seek long-term growth of capital. The Fund seeks to achieve this objective by investing, under normal market conditions, at least 80% of its assets in equity securities (such as common stocks, securities convertible into common or preferred stocks and warrants) of companies that, when purchased, have capitalizations within the range of the Standard & Poor’s 500 Index as measured by market capitalization.
The Small Cap Fund’s investment objective is to seek long-term growth of capital. The Fund seeks to achieve this objective by investing, under normal market conditions, at least 80% of its assets in equity securities (such as common stocks, securities convertible into common or preferred stocks and warrants) of companies that, when purchased, have capitalizations within the range of the Russell 2000 Index as measured by market capitalization.
The US Sustainable Economy Fund’s investment objective is to seek long-term growth of capital. The Fund seeks to achieve this objective by investing, under normal market conditions, at least 80% of its assets in large-capitalization U.S. equity securities.
The Global Sustainable Infrastructure Fund’s investment objective is capital appreciation and income. The Fund seeks to achieve its investment objective by investing, under normal market conditions, at least 80% of its assets in equity securities of companies that the Adviser determines derive significant revenues (i.e., at least 20% of revenues) from owning, operating, developing or distributing sustainable infrastructure-related goods, services or assets.
The Global Opportunities Fund’s investment objective is to seek long-term growth of capital by investing in companies benefiting from the transition to a more sustainable global economy. The Fund seeks to achieve this objective by investing, under normal market conditions, at least 80% of its net assets in companies that its Adviser or Sub-Adviser believe will benefit from the transition to a more sustainable global economy - the shift away from a depletive economy to one that preserves ecological and societal balance for the benefit of future generations. The Fund seeks to invest in companies with durable business models that are well-positioned to benefit from or avoid the risks associated with this transition. Under
December 31, 2022 |
Notes to Financial Statements, continued |
normal market conditions, the Global Opportunities Fund will invest primarily in equity securities (such as common stocks, preferred stocks and securities convertible into common or preferred stocks) of companies located around the world, including at least 40% of its net assets in securities of companies organized or located outside the United States or doing a substantial amount of business outside the United States, including those located in emerging markets.
The Global Environmental Markets Fund’s investment objective is to seek long-term growth of capital by investing in innovative companies around the world whose businesses and technologies focus on environmental markets, including alternative energy and energy management & efficiency; transportation solutions; water infrastructure & technologies; environmental services & resources; resource efficiency & waste management; digital infrastructure; and sustainable food & agriculture. The Fund seeks to achieve this objective by investing, under normal market conditions, at least 80% of its net assets in the foregoing companies and will invest primarily in equity securities (such as common stocks, preferred stocks and securities convertible into common and preferred stocks) of companies located around the world, including at least 40% of its net assets in securities of non-U.S. issuers, including those located in emerging markets.
The Global Women’s Leadership Fund’s investment objective is to seek investment returns that closely correspond to or exceed the price and yield performance, before fees and expenses, of the Impax Global Women’s Leadership Index (the “Women’s Index”), while maintaining risk characteristics that the Adviser believes are generally similar to those of the Women’s Index. The Fund seeks to achieve this objective by investing, under normal market conditions, more than 80% of its total assets in the component securities of the Women’s Index and in American depositary receipts, global depositary receipts and European depositary receipts representing the component securities of the Women’s Index, including at least 40% of its net assets (unless market conditions are not deemed favorable, in which case the Global Women’s Leadership Fund would normally invest at least 30% of its assets) in securities of companies organized or located outside the U.S. or doing a substantial amount of business outside the U.S.
The International Sustainable Economy Fund’s investment objective is to seek long-term growth of capital. The Fund seeks to achieve this objective by investing, under normal circumstances, more than 80% of its assets in large-capitalization equity securities in non-U.S. developed markets, including American Depositary Receipts, Global Depositary Receipts and Euro Depositary Receipts. The Fund may take significant positions in one or more non-U.S. developed markets, including the Asia and Pacific region and the European Union.
The Core Bond Fund’s investment objective is to seek income and conservation of principal. The Fund seeks to achieve this objective by investing, under normal market conditions, at least 80% of its assets in bonds, which include debt obligations such as mortgage-related securities, securities issued by the United States government or its agencies and instrumentalities, municipal bonds, corporate bonds and high-impact bonds (which provide financing to support solutions to global sustainability challenges) across the spectrum of issuers, each of which is, at the time of purchase, rated at least investment grade (rated BBB- or higher by Standard & Poor’s Ratings Group or Baa3 or higher by Moody’s Investors Service) or unrated and determined by the Adviser to be of comparable quality.
The High Yield Bond Fund’s primary investment objective is to seek high current income. As a secondary investment objective, the High Yield Bond Fund seeks capital appreciation. The Fund seeks to achieve this objective by investing, under normal market conditions, at least 80% of its assets in high-yield, fixed income securities (such as bonds, notes or debentures) that are rated below BBB- by Standard & Poor’s Ratings Group or below Baa3 by Moody’s Investors Service, similarly rated by another major rating service, or unrated and determined by the High Yield Bond Fund’s investment adviser to be of comparable quality. These fixed income securities are commonly referred to as “junk bonds.”
The Sustainable Allocation Fund’s primary investment objective is to seek income and conservation of principal. As a secondary investment objective, the Fund seeks long-term growth of capital. The Fund uses a team approach to allocate among multiple funds managed by the Adviser (“Underlying Funds”) in order to seek to achieve its investment objectives. The Adviser will allocate the Fund’s assets among Underlying Funds in its sole discretion. The Fund seeks to achieve its investment objectives, under normal market conditions, by investing (indirectly through the use of Underlying Funds) approximately 50%-75% of its assets in equity securities (such as common stocks, preferred stocks and securities convertible into common or preferred stocks) and 25%-50% of its assets in debt securities (including but not limited to debt securities convertible into equity securities).
Under the Trusts’ organizational documents, its officers and trustees are indemnified against certain liabilities arising out of the performance of their duties to the Trusts. Additionally, in the normal course of business, the Trusts enter into contracts with service providers that contain general indemnification clauses. The Trusts’ maximum exposure under these arrangements is unknown as this could involve future claims that may be made against the Trusts that have not yet occurred. However, based on experience, the Trusts expect this risk of loss to be remote.
December 31, 2022 |
Notes to Financial Statements, continued |
Accounting Estimates The preparation of financial statements in conformity with U.S. generally accepted accounting principles (“GAAP”) requires management to make estimates and assumptions that affect the reported amounts of assets and liabilities and disclosure of contingent assets and liabilities at the date of the financial statements and the reported amounts of revenues and expenses during the reporting period. Actual results could differ from those estimates. The Funds apply Investment Company accounting and reporting guidance.
Valuation of Investments For purposes of calculating the net asset value (“NAV”), determined ordinarily as of the close of regular trading (normally 4:00 p.m. Eastern time) (the “NYSE Close”) on the New York Stock Exchange (“NYSE”) on each day that the NYSE is open for trading, the Funds normally use pricing data for domestic equity securities received shortly after the NYSE Close and do not normally take into account trading, clearances or settlements that take place after the NYSE Close. U.S. fixed income and non-U.S. securities are normally priced using data reflecting the earlier closing of the principal markets for those securities, subject to possible fair value adjustments. Information that becomes known to the Funds or their agents after NAV has been calculated on a particular day will not generally be used to retroactively adjust the price of a security or NAV determined earlier that day.
For the purpose of these financial statements, fair values for various types of securities and other instruments are determined on the basis of closing prices or last sales prices on an exchange or other market, or based on quotes or other market information obtained from quotation reporting systems, established market makers or pricing services. Short-term investments having a maturity of 60 days or less are generally valued at amortized cost, which approximates fair value.
Investments denominated in currencies other than the U.S. dollar are converted to U.S. dollars using exchange rates obtained from pricing services. As a result, the NAV of a Fund’s shares may be affected by changes in the value of currencies in relation to the U.S. dollar.
If market quotations are not readily available (including in cases when available market quotations are deemed to be unreliable), the Funds’ investments will be valued as determined in good faith pursuant to policies and procedures approved by the Boards of Trustees of the Trusts (the “Boards” or “Boards of Trustees”) (so called “fair value pricing”). Fair value pricing may require subjective determinations about the value of a security or other asset, and fair values used to determine a Fund’s NAV may differ from quoted or published prices, or from prices that are used by others, for the same investments. Also, the use of fair value pricing may not always result in adjustments to the prices of securities or other assets held
by a Fund. The Boards have designated the Adviser, through its Best Execution and Valuation Committee, to manage and implement the day-to-day valuation of the Funds’ portfolio investments, in accordance with policies and procedures approved by the Boards. In addition, pursuant to Rule 2a-5 under the 1940 Act, the Board has designated the Adviser, through its Best Execution and Valuation Committee, as the “valuation designee” to make fair value determinations for all of the Funds’ investments for which market quotations are not readily available.
The Funds may determine that market quotations are not readily available due to events relating to a single issuer (e.g., corporate actions or announcements) or events relating to multiple issuers (e.g., governmental actions or natural disasters). The Funds may determine the fair value of investments based on information provided by pricing services and other third-party vendors, which may recommend fair value prices or adjustments with reference to other securities, indices or assets. In considering whether fair value pricing is required and in determining fair values, the Funds may, among other things, consider significant events (which may be considered to include changes in the value of U.S. securities or securities indices) that occur after the close of the relevant market and the usual time of valuation. At December 31, 2022, three securities were fair valued in good faith pursuant to policies and procedures approved by the Boards of Trustees. The Core Bond Fund held one security fair valued at $454,521, representing 0.06% of the Fund’s net asset value and the High Yield Bond Fund held three securities fair valued at $671,055, representing 0.11% of the Fund’s net asset value.
For those Funds that invest in non-U.S. securities, investors should be aware that many securities markets and exchanges outside the U.S. close prior to the close of the NYSE, and the closing prices for securities in such markets or on such exchanges may not fully reflect events that occur after such close but before the close of the NYSE. As a result, the Funds’ fair value pricing procedures require the Funds to consider changes in the fair value of non-U.S. securities between the time of the closing of the local market’s exchange and the close of the NYSE. Generally, if there has been a movement in the U.S. market that exceeds a specified threshold, the Funds will assess whether the closing price on the local exchange is still appropriate. Although the threshold may be revised from time to time and the number of days on which fair value prices will be used will depend on market activity, it is possible that fair value prices will be used by the Funds to a significant extent. The value determined for an investment using the Funds’ fair value pricing procedures may differ from recent market prices for the investment.
December 31, 2022 |
Notes to Financial Statements, continued |
Fair Value Measurements Fair value is defined as the price that the Fund would receive upon selling an investment in an orderly transaction between market participants. The three-tier hierarchy of inputs is summarized in the three broad Levels listed below.
| | ● | Level 1 – unadjusted quoted prices in active markets for identical investments |
| | ● | Level 2 – other significant observable inputs (including quoted prices for similar securities, interest rates, prepayment speeds, credit risk, etc.) |
| | ● | Level 3 – significant unobservable inputs (including the Funds’ own assumptions in determining the fair value of investments) |
Observable inputs are inputs that reflect the assumptions market participants would use in pricing the asset or liability developed based on market data obtained from sources independent of the reporting entity. Unobservable inputs are inputs that reflect the reporting entity’s own assumptions about the assumptions market participants would use in pricing the asset or liability developed based on the best information available in the circumstances. The inputs or methodology used for valuing securities are not necessarily an indication of the risk associated with investing in those securities. The following is a general summary of valuation inputs and classifications for different categories of securities.
Equity Securities Equity securities, including common stocks, preferred stocks and exchange-traded funds for which market quotations are readily available, are generally categorized as Level 1 in the hierarchy. Non-U.S. equity securities may also be valued at official close, or may be valued based on the fair value pricing procedures noted above. When third-party fair value pricing of foreign securities methods are applied, they are generally categorized as Level 2. To the extent that inputs for equity securities are unobservable, values are categorized as Level 3 in the hierarchy.
Fixed Income Securities Fixed income securities, including Corporate Bonds (both investment-grade and high-yield), U.S. Treasury Obligations, Government Bonds, Mortgage-Backed and Asset-Backed Securities, Bank Loans and Municipal Bonds, are valued at evaluated prices received from independent pricing services, which are evaluated using various inputs and techniques which may include trade activity, broker-dealer quotes, yield curves, coupon rates, default rates, cash flows, models and other inputs, and are generally categorized as Level 2 in the hierarchy. To the extent that inputs for fixed income securities are unobservable, values are categorized as Level 3 in the hierarchy.
Affiliated and Unaffiliated Investment Companies Investments in mutual funds are valued at the Funds’ closing net asset value and are generally categorized as Level 1.
Short-term Investments Short-term securities, including repurchase agreements, with remaining maturities of 60 days or less, which are valued at amortized cost, are generally categorized as Level 2 in the hierarchy.
The following is a summary of the inputs used to value the Funds’ net assets as of December 31, 2022:
| | Level 1 | | | Level 2 | | | Level 3* | | | Totals | |
Large Cap | | | | | | | | | | | | | | | | |
Common Stocks | | $ | 1,337,067,576 | | | $ | — | | | $ | — | | | $ | 1,337,067,576 | |
Cash Equivalents | | | 10,720,569 | | | | — | | | | — | | | | 10,720,569 | |
Total | | $ | 1,347,788,145 | | | $ | — | | | $ | — | | | $ | 1,347,788,145 | |
Small Cap | | | | | | | | | | | | | | | | |
Common Stocks | | $ | 585,233,390 | | | $ | — | | | $ | — | | | $ | 585,233,390 | |
Cash Equivalents | | | 3,929,026 | | | | — | | | | — | | | | 3,929,026 | |
Total | | $ | 589,162,416 | | | $ | — | | | $ | — | | | $ | 589,162,416 | |
US Sustainable Economy | | | | | | | | | | | | | | | | |
Common Stocks | | $ | 244,418,873 | | | $ | — | | | $ | — | | | $ | 244,418,873 | |
Cash Equivalents | | | 4,046,172 | | | | — | | | | — | | | | 4,046,172 | |
Total | | $ | 248,465,045 | | | $ | — | | | $ | — | | | $ | 248,465,045 | |
Global Sustainable Infrastructure | | | | | | | | | | | | | | | | |
Common Stocks | | $ | 54,506,181 | | | $ | 50,748,224 | | | $ | — | | | $ | 105,254,405 | |
Cash Equivalents | | | 2,314,676 | | | | — | | | | — | | | | 2,314,676 | |
Total | | $ | 56,820,857 | | | $ | 50,748,224 | | | $ | — | | | $ | 107,569,081 | |
Global Opportunities | | | | | | | | | | | | | | | | |
Common Stocks | | $ | 57,547,127 | | | $ | 43,572,046 | | | $ | — | | | $ | 101,119,173 | |
Preferred Stocks | | | — | | | | 1,775,756 | | | | — | | | | 1,775,756 | |
Total | | $ | 57,547,127 | | | $ | 45,347,802 | | | $ | — | | | $ | 102,894,929 | |
Global Environmental Markets | | | | | | | | | | | | | | | | |
Common Stocks | | $ | 1,333,685,929 | | | $ | 850,258,848 | | | $ | — | | | $ | 2,183,944,777 | |
Cash Equivalents | | | 22,131,588 | | | | — | | | | — | | | | 22,131,588 | |
Total | | $ | 1,355,817,517 | | | $ | 850,258,848 | | | $ | — | | | $ | 2,206,076,365 | |
Global Women’s Leadership | | | | | | | | | | | | | | | | |
Common Stocks | | $ | 528,731,427 | | | $ | 236,339,673 | | | $ | — | | | $ | 765,071,100 | |
Preferred Stocks | | | — | | | | 281,410 | | | | — | | | | 281,410 | |
Cash Equivalents | | | 6,665,442 | | | | — | | | | — | | | | 6,665,442 | |
Total | | $ | 535,396,869 | | | $ | 236,621,083 | | | $ | — | | | $ | 772,017,952 | |
December 31, 2022 |
Notes to Financial Statements, continued |
| | Level 1 | | | Level 2 | | | Level 3* | | | Totals | |
International Sustainable Economy | | | | | | | | | | | | | | | | |
Common Stocks | | $ | 14,413,501 | | | $ | 803,416,138 | | | $ | — | | | $ | 817,829,639 | |
Preferred Stocks | | | — | | | | 421,005 | | | | — | | | | 421,005 | |
Cash Equivalents | | | 9,326,749 | | | | — | | | | — | | | | 9,326,749 | |
Total | | $ | 23,740,250 | | | $ | 803,837,143 | | | $ | — | | | $ | 827,577,393 | |
Core Bond | | | | | | | | | | | | | | | | |
Community Investment Notes | | $ | — | | | $ | 240,088 | | | $ | 454,521 | | | $ | 694,609 | |
Corporate Bonds | | | — | | | | 296,561,936 | | | | — | | | | 296,561,936 | |
U.S. Gov’t Agency Bonds | | | — | | | | 9,097,622 | | | | — | | | | 9,097,622 | |
Government Bonds | | | — | | | | 6,301,793 | | | | — | | | | 6,301,793 | |
Supranational Bonds | | | — | | | | 91,416,674 | | | | — | | | | 91,416,674 | |
Municipal Bonds | | | — | | | | 16,774,461 | | | | — | | | | 16,774,461 | |
U.S. Treasury Notes | | | — | | | | 119,025,973 | | | | — | | | | 119,025,973 | |
Asset-Backed Securities | | | — | | | | 50,094,313 | | | | — | | | | 50,094,313 | |
Mortgage-Backed Securities | | | — | | | | 200,167,304 | | | | — | | | | 200,167,304 | |
Cash Equivalents | | | 60,303,129 | | | | — | | | | — | | | | 60,303,129 | |
Total | | $ | 60,303,129 | | | $ | 789,680,164 | | | $ | 454,521 | | | $ | 850,437,814 | |
High Yield Bond | | | | | | | | | | | | | | | | |
Community Investment Notes | | $ | — | | | $ | 240,088 | | | $ | 671,055 | | | $ | 911,143 | |
Common Stocks | | | 1,282,061 | | | | — | | | | 0 | | | | 1,282,061 | |
Preferred Stocks | | | — | | | | — | | | | 0 | | | | — | |
Corporate Bonds | | | — | | | | 544,708,719 | | | | — | | | | 544,708,719 | |
Loans | | | — | | | | 16,566,115 | | | | — | | | | 16,566,115 | |
Medium Term Certificates of Deposit | | | — | | | | 500,000 | | | | — | | | | 500,000 | |
Cash Equivalents | | | 12,713,034 | | | | — | | | | — | | | | 12,713,034 | |
Total | | $ | 13,995,095 | | | $ | 562,014,922 | | | $ | 671,055 | | | $ | 576,681,072 | |
Sustainable Allocation | | | | | | | | | | | | | | | | |
Affiliated Investment Companies | | $ | 2,095,194,300 | | | $ | — | | | $ | — | | | $ | 2,095,194,300 | |
Cash Equivalents | | | 47,588,604 | | | | — | | | | — | | | | 47,588,604 | |
Total | | $ | 2,142,782,904 | | | $ | — | | | $ | — | | | $ | 2,142,782,904 | |
* | Table includes securities valued at zero. |
See Schedules of Investments for additional detailed industry classifications.
Significant unobservable inputs were used by two Funds for Level 3 fair value measurements. The High Yield Bond Fund holds two securities of the same issuer which are deemed to be valued at zero based on company financial statements, and one security based on broker valuation levels. The Core Bond Fund and High Yield Bond Fund each hold a position in the same promissory note and community investment note, which are both valued a par.
Investment Transactions Investment transactions are recorded as of the date of purchase, sale or maturity. Net realized gains and losses from the sale or disposition of securities are determined on the identified cost basis, which is also used for federal income tax purposes. Corporate actions (including cash dividends) are recorded net of foreign tax withholdings.
Investment Income Dividend income is recorded on the ex-dividend date. Interest income is recorded on the accrual basis and includes accretion of discount and amortization of premiums, if any. The value of additional securities received as dividend payments is recorded as income and as an increase to the cost basis of such securities. The Funds amortize purchase price premium and accrete discount on bonds, if any, over the remaining life of the bonds using the effective interest method of amortization; for callable bonds, the premium amortization period is to the earliest call date.
Distributions to Shareholders Distributions to shareholders are recorded by each of the Funds on the ex-dividend dates. The Funds (except Core Bond Fund and High Yield Bond Fund) expect to pay dividends of net investment income, if any, semiannually and to make distributions of capital gains, if any, at least annually.
The Core Bond Fund and High Yield Bond Fund expect to pay dividends of net investment income, if any, monthly and to make distributions of capital gains, if any, at least annually. A shareholder begins earning dividends on the Core Bond Fund and High Yield Bond Fund shares the day after the Funds receive his or her purchase payment. Income and capital gains distributions are determined in accordance with income tax regulations, which may differ from U.S. generally accepted accounting principles.
Class Accounting Expenses directly attributable to a class of shares, such as 12b-1 distribution fees, are charged to that class. Each Fund has adopted a 12b-1 plan, applicable to certain classes of each of the Funds. Expenses of the Funds that are directly identifiable to a specific Fund, such as transfer agent fees, custody fees and registration fees, are applied to that Fund. Expenses that are not readily identifiable to a specific Fund, such as printing expense, Trustees’ fees and legal fees, are allocated in such a manner as deemed equitable, taking into consideration the nature and type of expense and the relative net assets of the Funds. Investment income, realized and unrealized gains and losses are allocated based upon the relative daily net assets of each class of shares.
Federal Income Taxes Each of the Funds has elected to be treated and intends to qualify each year as a regulated investment company under Subchapter M of the Internal Revenue Code of 1986, as amended. If a Fund so qualifies and satisfies
December 31, 2022 |
Notes to Financial Statements, continued |
certain distribution requirements, such Fund will ordinarily not be subject to federal income tax on its net investment income (which includes short-term capital gains) and net capital gains that it distributes to shareholders. Each Fund expects to distribute all or substantially all of its income and gains to shareholders every year. Therefore, no federal income or excise tax provision is required. The Funds are treated as separate entities for federal income tax purposes.
Foreign Currency Transactions The accounting records of the Funds are maintained in U.S. dollars. In addition, purchases and sales of investment securities, dividend and interest income, and certain expenses are translated at the rates of exchange prevailing on the respective dates of such transactions. Net realized and unrealized foreign currency exchange gains or losses occurring during the holding period of investment securities are a component of realized gain (loss) on investment transactions and unrealized appreciation (depreciation) on investments, respectively.
Non-U.S. Securities Non-U.S. markets can be significantly more volatile than domestic markets, causing the prices of some Fund investments to fluctuate significantly, rapidly and unpredictably. Non-U.S. securities may be less liquid than domestic securities; consequently, a Fund may at times be unable to sell non-U.S. securities at desirable times or prices. Other risks related to non-U.S. securities include delays in the settlement of transactions; less publicly available information about issuers; different reporting, accounting and auditing standards; the effect of political, social, diplomatic or economic events; seizure, expropriation or nationalization of the issuer or its assets; fluctuation in foreign currency exchange rates and the possible imposition of currency exchange controls. If a Fund invests substantially in securities of non-U.S. issuers tied economically to a particular country or geographic region, it will be subject to the risks associated with such country or geographic region to a greater extent than a fund that is more diversified across countries or geographic regions.
Securities Lending The Funds may lend their securities pursuant to a securities lending agreement (Lending Agreement) with State Street Bank and Trust Company. Initial security loans made pursuant to the Lending Agreement are required to be secured by collateral not less than the percentage specified in the agreement, ranging from 102% to 105%, depending on the types of securities. Cash collateral received is invested in the State Street Navigator Securities Lending Government Money Market Portfolio, a registered Rule 2a-7 money market fund. Borrowers may also pledge non-cash collateral within the guidelines for acceptable forms of non-cash collateral approved by the Boards of Trustees. At December 31, 2022, non-cash collateral consisted of U.S. Treasuries, short-term U.S. Government agency obligations and sovereign debt.
The Funds have the right under the Lending Agreement to recover the securities from the borrower on demand. The primary risk associated with securities lending is if the borrower defaults on its obligation to return the securities loaned because of insolvency or other reasons. The Funds could experience delays and costs in recovering securities loaned or in gaining access to the collateral. In the event the borrower fails to return loaned securities and the collateral received is insufficient to cover the value of the loaned securities and provided such collateral shortfall is not the result of investment losses, the lending agent has agreed to pay the amount of the shortfall to the Funds, or at the discretion of the lending agent, replace the loaned securities.
A portion of the income generated upon investment of the collateral is remitted to the borrower and the remainder is allocated between the Funds and the lending agent. The Funds record security lending income net of such allocation. The Funds continue to receive dividends on the securities loaned, which are accounted for in the same manner as other dividend and interest income.
As of December 31, 2022, the value of securities loaned, payable for collateral due to brokers and non-cash collateral pledged by brokers were as follows:
Fund | | Market Value
of Securities
Loaned | | | Payable on
Collateral Due to
Broker | | | Non-Cash
Collateral Value * | | | Over (Under)
Collateralized | |
Large Cap | | $ | 188,043 | | | $ | 192,900 | | | $ | — | | | $ | 4,857 | |
Small Cap | | | 13,786,178 | | | | 45,060 | | | | 14,340,230 | | | | 599,112 | |
US Sustainable Economy | | | 309,740 | | | | 216,092 | | | | 103,752 | | | | 10,104 | |
Global Sustainable Infrastructure | | | 2,263,989 | | | | 1,035,336 | | | | 1,293,980 | | | | 65,327 | |
Global Women’s Leadership | | | 359,169 | | | | 231,470 | | | | 140,616 | | | | 12,917 | |
International Sustainable Economy | | | 18,582,768 | | | | 5,213,817 | | | | 14,216,433 | | | | 847,482 | |
Core Bond | | | 66,355,545 | | | | 54,944,336 | | | | 12,817,555 | | | | 1,406,346 | |
* | Non-cash collateral is not included in the financial statements. |
For the Small Cap Fund, US Sustainable Economy Fund, Global Sustainable Infrastructure Fund, Global Women’s Leadership Fund and International Sustainable Economy Fund all of the securities on loan at December 31, 2022 are classified as Common Stocks in each Fund’s Schedule of Investments.
December 31, 2022 |
Notes to Financial Statements, continued |
For the Core Bond Fund, the following table displays a breakdown of transactions accounted for as secured borrowings, the gross obligation by class of collateral pledged, and the remaining contractual maturity of those transactions as of December 31, 2022.
| | | Remaining Contractual Maturity of the Agreements | |
Securities Lending Transactions | | Overnight
and
Continuous | | | Up to 30
days | | | 30-90 days | | | Greater than
90 days | | | Total | |
Core Bond Fund | | | | | | | | | | | | | | | | | | | | |
U.S. Treasury and Agency Securities | | $ | 45,502,066 | | | $ | — | | | $ | — | | | $ | — | | | $ | 45,502,066 | |
Corporate Debt | | | 9,442,270 | | | | — | | | | — | | | | — | | | | 9,442,270 | |
Total Borrowings | | $ | 54,944,336 | | | $ | — | | | $ | — | | | $ | — | | | $ | 54,944,336 | |
| | | | | | | | | | | | | | | | | | | | | |
Gross amount of recognized liabilities for securities lending transactions | | $ | 54,944,336 | |
NOTE B—Investment Advisory Fee and Transactions with Affiliated and Other Parties
Each of Trust I and Trust III have entered into an Investment Advisory Contract (the “Management Contract”) with Impax Asset Management LLC (“IAM”) (the “Adviser”). Pursuant to the terms of the Management Contract, the Adviser, subject to the supervision of the Boards of Trustees of the Trusts, is responsible for managing the assets of the Funds in accordance with the Funds’ investment objectives, investment programs and policies.
Pursuant to the Management Contract, the Adviser has contracted to furnish the Funds continuously with an investment program, determining what investments to purchase, sell and exchange for the Funds and what assets to hold uninvested. The Adviser also has contracted to provide office space and certain management and
administrative facilities for the Funds. In return for such services, the Funds pay an advisory fee to the Adviser at the following annual rates (expressed as a percentage of the average daily net assets of such Fund):
Fund | | Annual Rate | |
Large Cap1 | | | 0.65 | % |
Small Cap | | | 0.75 | % |
US Sustainable Economy2 | | | 0.45 | %* |
Global Sustainable Infrastructure3 | | | 0.55 | %* |
Global Opportunities | | | 0.80 | % |
Global Environmental Markets4 | | | 0.75 | % |
Global Women’s Leadership5 | | | 0.52 | %* |
International Sustainable Economy6 | | | 0.47 | %* |
Core Bond | | | 0.40 | % |
High Yield Bond | | | 0.50 | % |
Sustainable Allocation | | | 0.05 | %* |
* | The management fee is a unified fee that includes all of the operating costs and expenses of the Fund (other than taxes, charges of governmental agencies, interest, brokerage commissions incurred in connection with portfolio transactions, distribution and/or service fees payable under a plan pursuant to Rule 12b-1 under the Investment Company Act of 1940, acquired fund fees and expenses and extraordinary expenses), including accounting expenses, administrator, transfer agent, custodian fees, legal fees and other expenses. |
1 | Effective November 15, 2022, the management fee is 0.65% based on average net assets up to $2 billion; 0.62% for assets of $2 billion to $3 billion; 0.58% for assets of $3 billion to $4 billion; and 0.55% for assets over $4 billion. |
2 | Management contractually agreed to waive a portion of its management fee not to exceed 0.45% of average daily net assets. This fee waiver may not be amended or terminated without the approval of the Fund’s Board of Trustees before April 30, 2024. The gross management fee (before waiver) is 0.65% based on average net assets up to $225 million; 0.55% for assets of $225 million to $375 million; 0.50% for assets of $375 million to $500 million; and 0.45% for assets over $500 million. |
3 | Management contractually agreed to waive a portion of its management fee not to exceed 0.55% of average daily net assets. This fee waiver may not be amended or terminated without the approval of the Fund’s Board of Trustees before May 1, 2024. The gross management fee (before waiver) is 0.65% based on average net assets up to $150 million; 0.55% for assets of $150 million to $375 million; 0.50% for assets of $375 million to $500 million; and 0.45% for assets over $500 million. |
4 | The management fee is 0.80% based on average net assets up to $1 billion; 0.75% for assets of $1 billion to $1.5 billion; 0.70% for assets of $1.5 billion to $2 billion; 0.65% for assets of $2 billion to $3 billion; and 0.60% for assets over $3 billion. |
5 | The management fee is 0.55% based on average net assets up to $375 million; 0.50% for assets of $375 million to $750 million; and 0.45% for assets over $750 million. |
6 | Effective May 1, 2021, the management fee changed to 0.48% based on average net assets up to $600 million; 0.45% for assets of $600 million to $750 million; and 0.40% for assets over $750 million. |
December 31, 2022 |
Notes to Financial Statements, continued |
For the year ended December 31, 2022, the Funds incurred the following advisory fees:
Fund | | Amount | |
Large Cap | | $ | 9,154,782 | |
Small Cap | | | 4,838,122 | |
US Sustainable Economy | | | 1,758,688 | |
Global Sustainable Infrastructure | | | 652,135 | |
Global Opportunities | | | 949,748 | |
Global Environmental Markets | | | 17,344,209 | |
Global Women’s Leadership | | | 4,356,425 | |
International Sustainable Economy | | | 3,778,761 | |
Core Bond | | | 3,078,831 | |
High Yield Bond | | | 3,182,451 | |
Sustainable Allocation | | | 1,144,717 | |
The Adviser has contractually agreed to reimburse the Funds or limit expenses of the Funds to the extent that each Fund’s respective expenses exceed, on an annual basis, the following percentages of average daily net assets:
| | | Expense Caps | |
Fund | | Individual
Investor | | | Class A | | | Institutional | |
US Sustainable Economy 1,2 | | | 0.70 | % | | | 0.70 | % | | | 0.45 | % |
Global Sustainable Infrastructure 1,2 | | | 0.80 | % | | | | | | | 0.55 | % |
Global Opportunities 3 | | | 1.23 | % | | | | | | | 0.98 | % |
Global Women’s Leadership 1 | | | 0.80 | % | | | | | | | 0.55 | % |
International Sustainable Economy 1 | | | 0.73 | % | | | | | | | 0.48 | % |
Sustainable Allocation 1 | | | 0.30 | % | | | | | | | 0.05 | % |
1 | Expense caps for funds represent their respective unified management fees plus distribution and/or service fees payable under a plan pursuant to Rule 12b-1, as applicable to particular classes of shares. |
2 | The Adviser has contractually agreed to waive a portion of its management fee. This fee waiver may not be amended or terminated without the approval of the Funds’ Board of Trustees before May 1, 2024. |
3 | The Adviser has contractually agreed to reimburse expenses (other than interest, commissions, taxes, extraordinary expenses and acquired fund fees and expenses, if any) to the extent that they exceed the expense caps indicated. The reimbursement arrangement may not be amended or terminated without the approval of the Funds’ Board of Trustees before May 2, 2023. |
Such expenses include (i) management and distribution fees; (ii) the fees of affiliated and unaffiliated Trustees; (iii) the fees of the Funds’ custodian and transfer agent; (iv) the fees of the Funds’ legal counsel and independent registered public accounting firm; (v) the reimbursement of organizational expenses; and
(vi) expenses related to shareholder communications including all expenses of shareholders’ and Boards of Trustees’ meetings and of preparing, printing and mailing reports, proxy statements and prospectuses to shareholders.
For the year ended December 31, 2022, the dollar amounts of expense reimbursements were as follows:
| | | Total Expenses Reimbursed by Adviser | |
Fund | | Individual Investor | | | Institutional | |
Global Opportunities | | $ | 5,458 | | | $ | 114,700 | |
In addition, the Adviser waived $503,852 and $100,329 of its management fee from the US Sustainable Economy Fund and Global Sustainable Infrastructure Fund, respectively.
Pursuant to a sub-advisory agreement, Impax Asset Management Ltd. (the “Sub-Adviser”) assists in the management of the Global Environmental Markets Fund’s and Global Opportunities Fund’s portfolios of securities. The Sub-Adviser makes decisions with respect to the purchase and sale of investments, subject to the general control of the Board of the Fund and the determination of IAM that the contemplated investments satisfy the sustainable investing criteria applied to the Funds. As compensation for its sub-advisory services, the Sub-Adviser receives a fee from the Adviser, computed separately for the applicable Fund, stated as an annual percentage of the Fund’s net assets.
The Trusts have adopted a plan (“Plan”) pursuant to Rule 12b-1 under the 1940 Act that allows the Funds to pay distribution fees for the sale and distribution of certain shares as described below and for personal services rendered to the Fund shareholders in connection with the maintenance of shareholder accounts. Under the Plan, each Fund will pay its Distributor a distribution fee equal to 0.25% of the annual average daily net assets attributable to the Investor Class shares and Class A shares. The Distributor may pay all or any portion of the distribution fee to securities dealers or other organizations (including, but not limited to, any affiliate of the Distributor) as commissions, asset-based sales charges or other compensation with respect to the sale of indicated shares of such Fund, or for providing personal services to investors in the indicated shares of such Fund and/or the maintenance of shareholder accounts, and may retain all or any portion of the distribution fee as compensation for the Distributor’s services as principal underwriter of the indicated shares of such Fund.
Several individuals who are officers and/or Trustees of the Trusts are also employees of the Adviser.
December 31, 2022 |
Notes to Financial Statements, continued |
NOTE C—Investment Information
Purchases and proceeds from sales of investments for the Funds for the year ended December 31, 2022 were as follows:
| | | Purchases | | | Sales | |
Fund | | Investments1 | | | U.S. Gov’t Bonds | | | Investments1 | | | U.S. Gov’t Bonds | |
Large Cap | | $ | 600,971,872 | | | $ | — | | | $ | 465,797,754 | | | $ | — | |
Small Cap | | | 292,701,276 | | | | — | | | | 234,502,309 | | | | — | |
US Sustainable Economy | | | 104,198,983 | | | | — | | | | 107,900,438 | | | | — | |
Global Sustainable Infrastructure | | | 80,328,892 | | | | — | | | | 53,627,889 | | | | — | |
Global Opportunities | | | 44,434,242 | | | | — | | | | 54,442,529 | | | | — | |
Global Environmental Markets | | | 973,172,191 | | | | — | | | | 798,353,370 | | | | — | |
Global Women’s Leadership | | | 379,456,487 | | | | — | | | | 405,589,978 | | | | — | |
International Sustainable Economy | | | 533,822,515 | | | | — | | | | 405,234,563 | | | | — | |
Core Bond | | | 152,340,935 | | | | 567,979,807 | | | | 65,715,095 | | | | 460,213,962 | |
High Yield | | | 216,707,231 | | | | — | | | | 243,570,863 | | | | — | |
Sustainable Allocation | | | 180,857,259 | | | | — | | | | 96,000,000 | | | | — | |
1 | Excluding short-term investments and U.S. Government bonds. |
For federal income tax purposes, the identified cost of investments owned at December 31, 2022 as well as the gross unrealized appreciation (depreciation) of investments and resulting net unrealized appreciation (depreciation) as of December 31, 2022 were as follows for the Funds:
Fund | | Identified cost of
investments for
Federal income
tax basis | | | Gross unrealized
appreciation | | | Gross unrealized
depreciation | | | Net unrealized
appreciation
(depreciation) | |
Large Cap | | $ | 1,080,965,642 | | | $ | 339,769,685 | | | | 72,947,182 | | | $ | 266,822,503 | |
Small Cap | | | 595,624,510 | | | | 86,167,512 | | | | 92,629,606 | | | | (6,462,094 | ) |
US Sustainable Economy | | | 179,593,449 | | | | 86,912,673 | | | | 18,041,077 | | | | 68,871,596 | |
Global Sustainable Infrastructure | | | 114,990,502 | | | | 6,581,862 | | | | 14,003,283 | | | | (7,421,421 | ) |
Global Opportunities | | | 92,439,208 | | | | 15,665,158 | | | | 5,209,437 | | | | 10,455,721 | |
Global Environmental Markets | | | 1,927,762,037 | | | | 443,499,768 | | | | 165,185,440 | | | | 278,314,328 | |
Global Women’s Leadership | | | 701,782,011 | | | | 141,909,894 | | | | 71,673,953 | | | | 70,235,941 | |
International Sustainable Economy | | | 797,184,698 | | | | 107,730,129 | | | | 77,337,434 | | | | 30,392,695 | |
Core Bond | | | 936,484,025 | | | | 1,129,360 | | | | 87,175,571 | | | | (86,046,211 | ) |
High Yield | | | 669,083,896 | | | | 561,437 | | | | 92,964,261 | | | | (92,402,824 | ) |
Sustainable Allocation | | | 1,994,564,528 | | | | 288,454,597 | | | | 140,236,221 | | | | 148,218,376 | |
At December 31, 2022 the Small Cap Fund, Global Sustainable Infrastructure Fund, Global Opportunities Fund, Global Environmental Markets Fund, Global Women’s Leadership Fund and International Sustainable Economy Fund had unrealized foreign currency gains (losses) of $73; $(4,603); $(3,185); $(79,816); $(22,994);and $(135,727), respectively.
Netting Agreements During the ordinary course of business, the Funds may enter into transactions subject to enforceable netting agreements or other similar arrangements (“netting agreements”). Generally, the right to offset in netting agreements allows a Fund to offset any exposure to a specific counterparty with any collateral received or delivered to that counterparty based on the terms of the agreement. Generally, a Fund manages its cash collateral and securities collateral on a counterparty basis. As of December 31, 2022, there is no collateral held at the counterparty that would be offset by a master netting agreement that the Funds have with the counterparty. The Funds did not hold any derivative instruments as of December 31, 2022.
Affiliated Investments The term “affiliated company” includes other investment companies that are managed by a Fund’s Adviser. At December 31, 2022, the Sustainable Allocation Fund held the following investments in affiliated Funds:
Fund | | Shares
Held at
12/31/21 | | | Gross
Additions | | | Gross
Reductions | | | Shares
Held at
12/31/22 | |
Sustainable Allocation | | | | | | | | | | | | | | | | |
Large Cap | | | 76,137,343 | | | | 2,337,867 | | | | 3,206,677 | | | | 75,268,533 | |
Small Cap | | | 4,377,966 | | | | 105,387 | | | | 306,373 | | | | 4,176,980 | |
Global Sustainable Infrastructure | | | 7,758,860 | | | | 212,459 | | | | — | | | | 7,971,319 | |
Global Opportunities | | | 4,015,222 | | | | 66,889 | | | | — | | | | 4,082,111 | |
Global Environmental Markets | | | 2,851,724 | | | | 17,865 | | | | 233,754 | | | | 2,635,835 | |
Global Women’s Leadership | | | 1,992,667 | | | | 65,306 | | | | — | | | | 2,057,973 | |
International Sustainable Economy | | | 15,930,405 | | | | 356,678 | | | | 4,708,699 | | | | 11,578,384 | |
Core Bond | | | 71,152,536 | | | | 14,164,162 | | | | — | | | | 85,316,699 | |
High Yield | | | 13,284,046 | | | | 2,936,263 | | | | — | | | | 16,220,310 | |
Fund | | Value at
12/31/21 | | | Dividend
Income | | | Realized
Gains/
Losses1 | | | Net change in
Unrealized
Appreciation/
Depreciation | | | Value at
12/31/22 | |
Sustainable Allocation | | | | | | | | | | | | | | | | | | | | |
Large Cap | | $ | 1,132,162,284 | | | $ | 7,874,995 | | | $ | 15,114,034 | | | $ | (174,284,842 | ) | | $ | 870,104,236 | |
Small Cap | | | 83,137,569 | | | | 69,363 | | | | 643,013 | | | | (9,616,936 | ) | | | 59,689,044 | |
Global Sustainable Infrastructure | | | 78,752,429 | | | | 1,823,346 | | | | — | | | | (10,399,449 | ) | | | 68,314,199 | |
Global Opportunities | | | 68,861,063 | | | | 189,165 | | | | 715,055 | | | | (6,408,856 | ) | | | 56,129,027 | |
Global Environmental Markets | | | 72,433,778 | | | | 163,139 | | | | (654,502 | ) | | | (4,724,359 | ) | | | 51,609,644 | |
Global Women’s Leadership | | | 70,400,912 | | | | 548,462 | | | | 1,235,467 | | | | (10,333,216 | ) | | | 56,491,351 | |
International Sustainable Economy | | | 171,411,156 | | | | 2,984,685 | | | | 1,808,689 | | | | (19,655,191 | ) | | | 99,689,886 | |
Core Bond | | | 726,467,396 | | | | 17,036,553 | | | | — | | | | (68,057,034 | ) | | | 740,548,945 | |
High Yield | | | 91,394,238 | | | | 4,570,527 | | | | — | | | | (10,753,669 | ) | | | 92,617,968 | |
Total | | $ | 2,495,020,825 | | | $ | 35,260,235 | | | $ | 18,861,756 | | | $ | (314,233,552 | ) | | $ | 2,095,194,300 | |
1 | Includes realized capital gain distributions from an affiliated fund, if any. |
December 31, 2022 |
Notes to Financial Statements, continued |
The Funds are permitted to purchase and sell securities (“cross-trade”) from and to other Funds within the Trusts or other accounts managed by the Adviser pursuant to “Cross-Trading” Procedures adopted by the Trusts’ Boards of Trustees. These procedures have been designed to ensure that any cross-trade of securities by the respective Fund from or to another Fund or account that is or could be considered an affiliate of the Fund under certain limited circumstances by virtue of having a common investment adviser complies with Rule 17a-7 of the 1940 Act. Further, as defined under these procedures, each cross-trade is effected at the current market price to save costs where allowed. The Funds did not engage in cross trades during the year ended December 31, 2022.
Restricted and Illiquid Securities The Funds may purchase certain restricted securities and limited amounts of illiquid securities. The Funds may invest in securities exempt from registration under Rule 144A of the Securities Act of 1933 (“the Act”) which are restricted from sale to the public and may only be sold to a qualified institutional buyer. The Funds do not have the right to demand that such securities be registered. The value of such securities is determined by valuations supplied by a pricing service or, if not available, in good faith pursuant to policies and procedures approved by the Boards. At December 31, 2022, the Core Bond Fund held $111,277,602 or 13.92% of net assets and the High Yield Bond Fund held $445,430,858 or 75.94% of net assets in securities exempt from registration under Rule 144A of the Act.
At December 31, 2022 the Core Bond Fund held $4,908,761 of illiquid securities representing 0.61% of net assets and High Yield Bond Fund held $1,411,143 of illiquid securities, representing 0.24% of net assets. The Fund will classify as “illiquid” all securities that the Fund reasonably expects cannot be sold or disposed of in current market conditions in seven calendar days or less without the sale or disposition significantly changing the market value of the investment. Illiquid investments may include restricted securities, repurchase agreements that mature in more than seven days or that have a notice or demand feature more than seven days, certain over-the-counter option contracts and participation interests in loans. Because illiquid securities trade less frequently and in smaller volume than liquid securities, the Fund may experience difficulty in closing out positions at prevailing market prices.
Security | | Acquisition Date Range | | | Cost | | | Market Value | |
Core Bond | | | | | | | | | | | | |
Calvert Impact Capital, Inc., 3.000%, 03/14/25 | 03/13/20 - 03/13/20 | | $ | 1,000,000 | | | $ | 1,028,380 | |
Capital Impact Partners, 2.300%, 10/15/24 | 10/21/19 - 10/21/19 | | | 500,000 | | | | 459,396 | |
CEI Investment Note, 2.000%, 10/31/23 | 11/03/20 - 10/01/21 | | | 304,521 | | | | 304,521 | |
Envest Microfinance Fund, LLC, 4.380%, 10/25/23 | 10/25/22 - 10/25/22 | | | 150,000 | | | | 150,000 | |
Envest Microfinance Fund, LLC, 4.000%, 04/20/26 | 04/20/22 - 04/20/22 | | | 250,000 | | | | 240,088 | |
Local Initiatives Support Corp., 1.000%, 11/15/25 | 11/23/20 - 11/23/20 | | | 1,000,000 | | | | 883,312 | |
Tesla Energy Operations, Inc., 4.700%, 05/29/25 | 05/26/15 - 05/26/15 | | | 1,993,849 | | | | 1,843,064 | |
| | | | | | | | | | | | | |
High Yield Bond | | | | | | | | | | | | |
CEI Investment Note, 2.000%, 09/30/23 | 09/01/20 - 09/30/22 | | | 521,055 | | | | 521,055 | |
Envest Microfinance Fund, LLC, 4.380%, 10/25/23 | 10/25/22 - 10/25/22 | | | 150,000 | | | | 150,000 | |
Envest Microfinance Fund, LLC, 4.000%, 04/20/26 | 04/20/22 - 04/20/22 | | | 250,000 | | | | 240,088 | |
Interactive Health, Inc. | 03/19/04 - 10/01/13 | | | 178,981 | | | | 0 | |
Interactive Health, Inc., 0.000% | 03/19/04 - 10/01/13 | | | 357,962 | | | | 0 | |
Shared Interest, Inc., 0.550%, 09/30/24 | 09/30/21 - 09/30/21 | | | 500,000 | | | | 500,000 | |
NOTE D—Tax Information
The timing and characterization of certain income and capital gains distributions are determined annually in accordance with federal tax regulations, which may differ from GAAP. In addition to permanent differences previously noted, temporary differences may arise from recognition of certain items of income, expense, gain or loss in different periods for financial reporting and tax purposes. Such differences will reverse at some time in the future. As a result, net investment income (loss) and net realized gain (loss) on investment transactions for a reporting period may differ significantly from distributions during such period. For tax purposes, short-term capital gains are considered ordinary income.
December 31, 2022 |
Notes to Financial Statements, continued |
The tax character of distributions paid during 2022 and 2021 was as follows:
| | | Distributions paid in 2022 | | | Distributions paid in 2021 | |
Fund | | Ordinary
income | | | Tax return
of capital | | | Long-term
capital gains | | | Ordinary
income | | | Long-term
capital gains | |
Large Cap | | $ | 20,762,518 | | | $ | — | | | $ | 20,547,403 | | | $ | 52,345,561 | | | $ | 35,983,069 | |
Small Cap | | | 2,438,717 | | | | — | | | | 12,315,208 | | | | 25,885,304 | | | | 39,630,781 | |
US Sustainable Economy | | | 3,602,628 | | | | 555,114 | | | | 13,838,198 | | | | 18,509,486 | | | | 39,363,830 | |
Global Sustainable Infrastructure | | | 2,682,896 | | | | — | | | | — | | | | 8,250,932 | | | | 28,866,021 | |
Global Opportunities | | | 601,915 | | | | — | | | | 1,218,713 | | | | 1,646,662 | | | | 904,535 | |
Global Environmental Markets | | | 8,106,782 | | | | — | | | | 6,340,323 | | | | 31,220,367 | | | | 23,315,900 | |
Global Women’s Leadership | | | 7,633,503 | | | | — | | | | 17,044,507 | | | | 13,606,860 | | | | — | |
International Sustainable Economy | | | 20,242,591 | | | | — | | | | — | | | | 24,509,409 | | | | 13,532,820 | |
Core Bond | | | 18,413,374 | | | | — | | | | — | | | | 13,865,738 | | | | 1,290,026 | |
High Yield Bond | | | 31,438,803 | | | | — | | | | — | | | | 24,974,569 | | | | — | |
Sustainable Allocation | | | 70,922,055 | | | | — | | | | 58,062,019 | | | | 50,575,753 | | | | 72,229,035 | |
For the year ended December 31, 2022, the components of distributable earnings on a tax basis are as follows:
Fund | | Undistributed
Ordinary
Income | | | Undistributed
Long-Term
Capital Gain | | | Other
Temporary
Differences | | | Net Unrealized
Appreciation
(Depreciation) | |
Large Cap | | $ | — | | | $ | 3,934,009 | | | $ | — | | | $ | 266,822,503 | |
Small Cap | | | — | | | | — | | | | (11,715,996 | ) | | | (6,462,021 | ) |
US Sustainable Economy | | | — | | | | — | | | | — | | | | 68,871,596 | |
Global Sustainable Infrastructure | | | 56,084 | | | | — | | | | (5,973,192 | ) | | | (7,427,095 | ) |
Global Opportunities | | | — | | | | — | | | | (4,337,008 | ) | | | 10,452,777 | |
Global Environmental Markets | | | 6,649,113 | | | | — | | | | (76,210,142 | ) | | | 278,234,512 | |
Global Women’s Leadership | | | 5,468,741 | | | | — | | | | (28,059,690 | ) | | | 70,206,315 | |
International Sustainable Economy | | | — | | | | — | | | | (42,513,842 | ) | | | 30,273,556 | |
Core Bond | | | 71,773 | | | | — | | | | (30,949,970 | ) | | | (86,046,211 | ) |
High Yield | | | — | | | | — | | | | (81,862,715 | ) | | | (92,402,824 | ) |
Sustainable Allocation | | | 12,751,031 | | | | 17,472,443 | | | | — | | | | 148,218,376 | |
As of December 31, 2022, for federal income tax purposes, the following Funds had capital loss carryforwards available to offset future gains, if any, to the extent provided by the Treasury regulations:
| | | No Expiration | |
Fund | | Short-term | | | Long-term | |
Global Sustainable Infrastructure | | $ | 2,563,501 | | | $ | 3,409,691 | |
Global Opportunities | | | 1,968,815 | | | | 2,368,193 | |
Global Environmental Markets | | | 49,794,234 | | | | 26,415,908 | |
Global Women’s Leadership | | | 28,059,690 | | | | — | |
International Sustainable Economy | | | 21,519,947 | | | | 20,693,135 | |
Core Bond | | | 26,328,461 | | | | 4,621,510 | |
High Yield | | | 31,639,596 | | | | 50,069,892 | |
The Small Cap Fund elected to defer $11,709,293 of capital losses recognized between November 1, 2022 and December 31, 2022 for the Funds’ fiscal year ending December 2022. In addition, the Small Cap Fund and International Sustainable Economy Fund incurred late-year ordinary losses of $6,703 and $300,760, respectively. These losses are treated for federal income tax purposes as if they had occurred on
January 1, 2023.
For the year ended December 31, 2022, the Funds recorded the following reclassifications:
Fund | | Undistributed
Net Investment
Income | | | Accumulated Net
Realized Gain/
(Loss) | | | Paid In
Capital | |
Large Cap | | $ | 1,616,732 | | | $ | (1,616,732 | ) | | $ | — | |
Small Cap | | | 130,713 | | | | 1,459,053 | | | | (1,589,766 | ) |
US Sustainable Economy | | | 2,124,461 | | | | (1,569,347 | ) | | | (555,114 | ) |
Global Sustainable Infrastructure | | | (119,903 | ) | | | 120,158 | | | | (255 | ) |
Global Opportunities | | | 9,492 | | | | 31,612 | | | | (41,104 | ) |
Global Environmental Markets | | | (232,506 | ) | | | 232,506 | | | | — | |
Global Women’s Leadership | | | (228,729 | ) | | | 228,729 | | | | — | |
International Sustainable Economy | | | (558,173 | ) | | | 628,129 | | | | (69,956 | ) |
Core Bond | | | 948,155 | | | | (948,155 | ) | | | — | |
High Yield | | | 336,227 | | | | (336,227 | ) | | | — | |
Sustainable Allocation | | | — | | | | — | | | | — | |
For financial reporting purposes, the capital accounts are adjusted to reflect the tax character of permanent book/tax differences. Reclassifications are primarily due to tax treatment of gain (loss) on foreign currency transactions and tax treatment related to REITs, PFICs, paydowns and bond amortization adjustments. Distributions received from REITs may be classified as dividends, capital gains and/or return of capital.
December 31, 2022 |
Notes to Financial Statements, continued |
Uncertain Tax Positions Management has analyzed the Funds’ tax positions taken for all open tax years which remain subject to examination by the Funds’ major tax jurisdictions (years 2019 through 2022). The Funds recognize interest and penalties, if any, related to tax liabilities as income tax expense in the Statement of Operations. Management has concluded that, as of and during the year ended December 31, 2022, no provision for federal income tax is necessary and, therefore, the Funds did not have a liability for any unrecognized tax expenses.
Note E—Other Matters
The impact of the COVID-19 pandemic has led, and in the future may lead, to increased short-term market volatility and may have adverse long-term effects on U.S. and world economies, markets generally, and a Fund’s ability to achieve its investment objective.
Note F—Recent Accounting Pronouncements
In March 2020, the FASB issued Accounting Standards Update (ASU) 2020-04, Reference Rate Reform (Topic 848) “Facilitation of the Effects of Reference Rate Reform on Financial Reporting” (“ASU 2020-04”), which provides optional temporary financial reporting relief from the effect of certain types of contract modifications due to the planned discontinuation of the LIBOR and other interbank-offered based reference rates as of the end of 2021. The new guidance is effective for certain reference rate-related contract modifications that occurred up through the period ended December 31, 2022, and the adoption of ASU 2020- 04 is elective. Management believes the adoption of ASU 2020-04 did not have a material impact on the financial statements.
Effective September 8, 2022, the Funds were required to comply with Rule 2a-5, Good Faith Determinations of Fair Value, under the 1940 Act, which is intended to address valuation practices and the role of the board of directors with respect to the fair value of the investments of a registered investment company. Management believes the adoption of Rule 2a-5 did not have a material impact on the financial statements.
Note G—Subsequent Events
The Company evaluated all subsequent events for potential recognition or disclosure in these financial statements through February 22, 2023, the date the financial statements were available to be issued. No subsequent events were identified.
December 31, 2022 |
Report of Independent Registered Public Accounting Firm |
To the Boards of Trustees and Shareholders of Impax Funds Series Trust I (formerly, Pax World Funds Series Trust I) and Impax Funds Series Trust III (formerly, Pax World Funds Series Trust III):
Opinion on the Financial Statements
We have audited the accompanying statements of assets and liabilities of Impax Funds Series Trust I (“Trust I”) (comprising Impax Sustainable Allocation Fund (formerly, Pax Sustainable Allocation Fund), Impax US Sustainable Economy Fund (formerly, Pax US Sustainable Economy Fund), Impax Small Cap Fund (formerly, Pax Small Cap Fund), Impax High Yield Bond Fund (formerly, Pax High Yield Bond Fund), Impax Global Environmental Markets Fund (formerly, Pax Global Environmental Markets Fund), Impax International Sustainable Economy Fund (formerly, Pax International Sustainable Economy Fund), Impax Core Bond Fund (formerly, Pax Core Bond Fund), Impax Large Cap Fund (formerly, Pax Large Cap Fund), Impax Global Opportunities Fund (formerly, Pax Global Opportunities Fund), and Impax Global Sustainable Infrastructure Fund (formerly, Pax Global Sustainable Infrastructure Fund)(collectively, with Impax Ellevate Global Women’s Leadership Fund (formerly, Pax Ellevate Global Women’s Leadership Fund), the “Funds”)), and Impax Funds Series Trust III (“Trust III” and collectively with Trust I, the “Trusts”) (comprising Impax Ellevate Global Women’s Leadership Fund), including the schedules of investments, as of December 31, 2022, and the related statements of operations, changes in net assets, and the financial highlights for each of the periods indicated in the table below and the related notes (collectively referred to as the “financial statements”). In our opinion, the financial statements present fairly, in all material respects, the financial position of the Funds at December 31, 2022, the results of their operations, changes in net assets and financial highlights for each of the periods indicated in the table below, in conformity with U.S. generally accepted accounting principles.
Funds comprising Trust I | Statement of
Operations | Statements of
Changes in Net
Assets | Financial highlights |
Impax Sustainable Allocation Fund Impax US Sustainable Economy Fund Impax Small Cap Fund Impax High Yield Bond Fund Impax Global Environmental Markets Fund Impax International Sustainable Economy Fund Impax Large Cap Fund Impax Global Sustainable Infrastructure Fund Impax Core Bond Fund | For the year ended December 31, 2022 | For each of the two years in the period ended December 31, 2022 | For each of the five years in the period ended December 31, 2022 |
Impax Global Opportunities Fund | For the year ended December 31, 2022 | For each of the two years in the period ended December 31, 2022 | For each of the four years in the period ended December 31, 2022 and the period from June 27, 2018 (commencement of operations) through December 31, 2018 |
Fund comprising Trust III | Statement of
Operations | Statements of
Changes in Net
Assets | Financial highlights |
Impax Ellevate Global Women’s Leadership Fund | For the year ended December 31, 2022 | For each of the two years in the period ended December 31, 2022 | For each of the five years in the period ended December 31, 2022 |
Basis for Opinion
These financial statements are the responsibility of the Trusts’ management. Our responsibility is to express an opinion on each of the Funds’ financial statements based on our audits. We are a public accounting firm registered with the Public Company Accounting Oversight Board (United States) (“PCAOB”) and are required to be independent with respect to the Trusts in accordance with the U.S. federal securities laws and the applicable rules and regulations of the Securities and Exchange Commission and the PCAOB.
We conducted our audits in accordance with the standards of the PCAOB. Those standards require that we plan and perform the audit to obtain reasonable assurance about whether the financial statements are free of material misstatement, whether due to error or fraud. The Trusts are not required to have, nor were we engaged to perform, an audit of the Trusts’ internal control over financial reporting. As part of our audits, we are required to obtain an understanding of internal control over financial reporting but not for the purpose of expressing an opinion on the effectiveness of the Trusts’ internal control over financial reporting. Accordingly, we express no such opinion.
Our audits included performing procedures to assess the risks of material misstatement of the financial statements, whether due to error or fraud, and performing procedures that respond to those risks. Such procedures included examining, on a test basis, evidence regarding the amounts and disclosures in the financial statements. Our procedures included confirmation of securities owned as of December 31, 2022, by correspondence with the custodian, brokers and others; when replies were not received from brokers and others, we performed other auditing procedures. Our audits also included evaluating the accounting principles used and significant estimates made by management, as well as evaluating the overall presentation of the financial statements. We believe that our audits provide a reasonable basis for our opinion.

We have served as the auditor of the Impax Funds Series Trust I and Impax Funds Series Trust III since 2003.
Boston, Massachusetts
February 22, 2023
Proxy Voting (Unaudited)
You may obtain a description of the Funds’ policies and procedures that the Funds use to determine how to vote proxies relating to their portfolio securities, without charge, upon request by contacting the Funds at 800.767.1729 or on the SEC’s website at www.sec.gov.
The information regarding how the Funds voted proxies relating to portfolio securities during the most recent 12-month period ended June 30 is available without charge, upon request, by telephoning Impax(toll-free) at 800.767.1729 or visiting Impax’s website at www.impaxam.com and will be available without charge by visiting the SEC’s website at www.sec.gov.
Portfolio Holdings (Unaudited)
Each Fund files its complete schedule of portfolio holdings with the U.S. Securities and Exchange Commission (“SEC”) for the first and third quarters of each fiscal year (or as an exhibit to its reports Form N-PORT). Each Fund’s Forms N-PORT are available on the SEC’s web site at www.sec.gov.
Board Considerations in Approving the Amended and Restated Advisory Agreement
Review Process. The Investment Company Act of 1940, as amended (the “1940 Act”), requires that both the full Board of Trustees (the “Trustees”) of Pax World Funds Series Trust I (“Trust I”) and a majority of the Trustees who are not “interested persons” (as defined in Section 2(a)(19) of the 1940 Act) of Trust I (the “Independent Trustees”), voting separately, approve any new advisory agreement, or any amendment thereof, for any series of Trust I.
The 1940 Act also requires that the Trustees of Trust I request and evaluate, and that Impax Asset Management LLC (“IAM”) furnish, such information as may reasonably be necessary for the Trustees of Trust I to evaluate the terms of the amended and restated advisory agreement (the “Amended and Restated Advisory Agreement”) by and between IAM and Trust I, on behalf of Pax Large Cap Fund (the “Fund”).
At a meeting held on September 14-15, 2022 (the “Meeting”), the Trustees, including a majority of the Independent Trustees, approved the Amended and Restated Advisory Agreement. The Trustees took such action after discussion among themselves and with representatives of IAM of the information provided to them by IAM relating to the proposed introduction of breakpoints in the fee schedule of the Fund.
The Independent Trustees were assisted in their evaluation of the Amended and Restated Advisory Agreement by independent legal counsel, from whom they received assistance and advice, including a review of the legal standards applicable to the consideration of advisory arrangements, and with whom they met separately from management. The Independent Trustees requested information and discussed with IAM the information that was provided.
The Independent Trustees considered that the only effect of the Amended and Restated Advisory Agreement was to reduce the fees payable by the Fund thereunder above certain asset levels.
The Trustees, including the Independent Trustees, also considered their deliberations and conclusions in connection with their recent approval of the advisory agreement, including with respect to (i) the nature, extent and quality of IAM’s services; (ii) the investment performance of the Fund; (iii) the advisory fees paid by the Fund to IAM relative to the Fund’s Broadridge peer group; (iv) the costs of the services provided by IAM and the estimated profitability of IAM’s relationship with the Fund; (v) the direct and indirect benefits to IAM from its relationship with the Fund, including reputational and other “fall out” benefits; and (vi) the extent to which IAM may realize economies of scale or other efficiencies in managing and supporting the Fund. The Trustees noted that they had approved the continuation of the then-current advisory agreement for the Fund at their June 8-9, 2022 meeting, after evaluating materials provided in connection with the contract review process at their March and June 2022 meetings.
Conclusions. Based on the foregoing and other relevant considerations, the Trustees, including a majority of the Independent Trustees, voted to approve the Amended and Restated Advisory Agreement. Based on their evaluation of factors that they deemed to be material, including those factors described above, the Trustees, including the Independent Trustees, unanimously concluded that approval of the Amended and Restated Advisory Agreement would be in the best interests of shareholders of the Fund.
Management of the Funds (Unaudited)
Interested Trustees and Officers
Name and Age | Position(s) Held With the
Trust; Term of Office1; and
Length of Time Served | Principal Occupation(s) During Past
Five Years and Other Directorships
Held by Trustee or Officer | Number of
Funds in the
Pax World
Fund Family
Overseen by
Trustee |
Joseph Keefe (69) | Trust I: Trustee, President
(since 2006) Trust III: Trustee, President
(since 2013) | President (2006-present) and Chief Executive Officer (2005-2018) of IAM; Chief Executive Officer of Pax Ellevate Management LLC (“PEM”) (2014-2020); member of the Boards of Directors of Women Thrive Alliance (2009-2018) and New Hampshire Public Radio (2017-present); Co-Chair of the Leadership Group of the Women’s Empowerment Principles (2014-2018). | 11 |
Lindsey Brace Martinez
(55) | Trust I: Trustee
(since 2018) Trust III: Trustee
(since 2019) | Chair, People & Culture Committee, Onward Energy LLC (2021-present); Director, Seven Islands Management Co. (2018-present); Founder and Managing Member, Starpoint Advisors, LLC (2015-present); Director, Impax Asset Management Group plc (2015-present); Chair of the Board of Directors, Novatus Energy, LLC (2016-present); Board Member, Yale Center for Business and Environment (2014-present); Investment Sub-Committee Member, National Geographic Society (2015-present); Member, Advisory Council, Quebec Labrador Foundation (2012-present). | 11 |
John Boese
(59) | Trust I: Chief Compliance Officer
(since 2006) and Secretary (since 2023) Trust III: Chief Compliance Officer
(since 2013) and Secretary (since 2023) | Chief Compliance Officer of IAM (2006-present), Pax Ellevate Management LLC (2014-2020), Impax Asset Management Ltd (2020-present) and Impax Asset Management (AIFM) Ltd (2020-present). | N/A |
Interested Trustees and Officers, continued
Name and Age | Position(s) Held With the
Trust; Term of Office1; and
Length of Time Served | Principal Occupation(s) During Past
Five Years and Other Directorships
Held by Trustee or Officer | Number of
Funds in the
Pax World
Fund Family
Overseen by
Trustee |
Alicia K. DuBois (63) | Trust I: Treasurer
(since 2006) Trust III: Treasurer
(since 2013) | Chief Financial Officer for IAM (2006-present) and for PEM (2014-2021). Director of Impax Asset Management LLC and Director of IAM Holdco, Inc. (December 2021-present). | N/A |
Robert Silva (56) | Trust I: Assistant Treasurer (Since 2015) Trust III: Assistant Treasurer (Since 2015) | Director of Fund Administration for IAM (2014-present) and for PEM (2014-2021). | N/A |
Disinterested Trustees
Name and Age | Position(s) Held With the
Trust; Term of Office1; and
Length of Time Served | Principal Occupation(s) During Past
Five Years and Other Directorships
Held by Trustee or Officer | Number of
Funds in the
Pax World
Fund Family
Overseen by
Trustee |
Adrian P. Anderson
(68)2,3 | Trust I: Trustee
(since 2007) Trust III: Trustee
(since 2013) | Tax Advisor at Block Advisors (November 2022 - Present); Chief Executive Officer, North Point Advisors, LLC (2004 - present); Director of Finance at Choice in Aging (July 2022 - September 2022); Tax Director at Blue Sky Utility, a renewable energy finance firm (2022-present); Chair of Investment Committee, Zanick Advisors, a real estate advisory firm (2020-2021); Tax Associate at H+R Block (2020-2021); Tax Accountant at Shwiff, Levy & Polo, LLP (2018-2019); Tax Accountant at Watson Tax CPA (November 2021 - January 2022). | 11 |
Anne M. Goggin (73)3,4 | Trust I and Trust III: Vice Chairperson of the Board of Trustees
(since 2019) Trust I and Trust III: Trustee
(since 2017) | Trustee of RS Investment Trust and RS Variable Products Trust (2006-2016); attorney; Retired, Chief Counsel, Metropolitan Life Insurance Company, an insurance company; Member, Governing Council of the Independent Directors Council (2012-2020) | 11 |
D’Anne Hurd (72)2,3 | Trust I: Trustee
(since 2015) Trust III: Trustee
(since 2015) | Independent Member of and Independent Advisor to Corporate Boards of Directors (1993 to present). Private investor (2011– present); member of the Board of Directors, Audit (Chair) and Nominating and Governance Committees, Peckham Industries, Inc. (2013–present); member of the Board of Directors and Audit (Chair) Committee of Martin Engineering, Inc. (2019-present); Chief Executive Officer of Crawford Consulting LLC (2011-present). | 11 |
Disinterested Trustees, continued
Name and Age | Position(s) Held With the
Trust; Term of Office1; and
Length of Time Served | Principal Occupation(s) During Past
Five Years and Other Directorships
Held by Trustee or Officer | Number of
Funds in the
Pax World
Fund Family
Overseen by
Trustee |
John L. Liechty (68)3,5 | Trust I: Chairman of the Board of Trustees (since 2014); Trustee (since 2009) Trust III: Chairman of the Board of Trustees (since 2014); Trustee (since 2013) | Founder and Principal, Integrated Investment Solutions (2009-present); Founder and Partner, Integrated Financial Planning Solutions, LLC (2010-2021). Board member and Investment Committee Chair, Community Foundation of Elkhart County (IN) (2014-present). | 11 |
Gregory D. Sheehan
(67)6 | Trust I and Trust III: Trustee (since 2023) | Adjunct Professor at Boston College Law School (2022-Present); Partner of Ropes & Gray LLP (law firm) (1989-2020). | 11 |
Nancy S. Taylor (67)3,4 | Trust I: Trustee
(since 2006) Trust III: Trustee
(since 2013) | Senior Minister Emeritus, Old South Church in Boston (2005-2022); Advisory Board, Yale Divinity School (2010-present); Advisory Board, Idaho Human Rights Education Center (2009-present); Trustee Emeritus, Benjamin Franklin Institute of Technology (2011-present). | 11 |
1 | A Trustee of the Funds holds office until a successor is chosen and qualified. An Officer of the Funds is appointed by the respective Board of Trustees and holds office until a successor is chosen and qualified. The business address of each Trustee and officer is 30 Penhallow Street, Suite 400, Portsmouth, NH 03801. |
2 | Designates a member of the Audit Committee. The Audit Committee has the responsibility of overseeing the establishment and maintenance of an effective financial control environment, for overseeing the procedures for evaluating the system of internal accounting control and for evaluating audit performance. The committee met four times in 2022. |
3 | Designates a member of the Governance and Nomination Committee and Compliance Committee. The Governance and Nomination Committee is responsible for recommending Board candidates, reviewing and recommending Board compensation. The committee met four times in 2022. |
4 | Designates a member of the Compliance Committee. The Compliance Committee is responsible for overseeing regulatory and compliance matters, as well as Fund-related compliance activities of the Funds’ service providers. The committee met four times in 2022. |
5 | Designates a floating member of each of the Audit Committee and the Compliance Committee, and, as such, will attend meetings of the committees based upon the matters to be discussed at each meeting or as otherwise determined by the Board or the committees. |
6 | Mr. Sheehan was appointed as a Trustee of the Trusts effective January 1, 2023. |
Federal Tax Information (Unaudited)
The percentages of ordinary income distributed by each of the Funds that is Qualified Dividend Income (QDI) and that qualifies for corporate Dividends Received Deduction (DRD) are as follows:
Fund | | QDI% | | | DRD% | |
Large Cap | | | 100.00 | % | | | 100.00 | % |
Small Cap | | | 100.00 | % | | | 100.00 | % |
US Sustainable Economy | | | 100.00 | % | | | 100.00 | % |
Global Sustainable Infrastructure | | | 88.59 | % | | | 100.00 | % |
Global Opportunities | | | 100.00 | % | | | 100.00 | % |
Global Environmental Markets | | | 100.00 | % | | | 100.00 | % |
Global Women’s Leadership | | | 100.00 | % | | | 100.00 | % |
International Sustainable Economy | | | 100.00 | % | | | 100.00 | % |
Core Bond | | | 0.68 | % | | | 100.00 | % |
High Yield Bond | | | 0.14 | % | | | 100.00 | % |
Sustainable Allocation | | | 99.99 | % | | | 100.00 | % |
For the fiscal year ended December 31, 2022 the International Sustainable Economy Fund earned foreign source income totaling $26,049,524 and paid $1,983,217 foreign taxes which it intends to pass through to its shareholders.
December 31, 2022 |
Account Options and Services |
At Impax, we are pleased to offer a variety of account options and shareholder services to help meet your investment needs.
Types of Accounts | Services |
Regular Accounts: Individual, business and trust accounts are available for all Impax Funds. Traditional IRA Contributions to an IRA may be tax-deductible. Taxes are paid only when funds are withdrawn, when investors may be in a lower tax bracket. Roth IRA Contributions to a Roth IRA are not deductible, but after five years some types of withdrawals are tax-free. SIMPLE IRA This is an easy-to maintain retirement plan designed for small businesses. SEP IRA This is an employer funded retirement plan popular with small businesses and self-employed persons. Education Savings Account & Uniform Gift to Minors Account (UGMA) These plans provide excellent ways to save for a child’s education. | Automatic Investment Plan You may arrange to have a fixed amount automatically deducted from your checking or savings account and invested in your Impax account on a monthly or quarterly basis. Automatic investment plans do not assure a profit and do not protect against loss in declining markets. Online Account Access Utilizing a unique ID number and PIN, you can access your Impax account balances or histories; purchase or redeem fund shares; or make exchanges between different Impax Funds. www.impaxam.com Learn all about Impax Funds through our web site. You can check Fund performance, read about our portfolio managers, view Connection—our quarterly newsletter, and see how we voted on various proxies for the companies in our portfolios. |
Please note that the information contained herein does not constitute tax advice. Always consult your tax advisor before making any tax-related investment decisions.
This annual report is intended for shareholders of the Impax Funds only, and is not authorized for distribution to other persons unless accompanied or preceded by a prospectus. Please consider the Funds’ investment objectives, risks and charges and expenses carefully before investing. The Funds’ prospectus contains this and other information about the Funds and may be obtained by calling 800.767.1729, emailing impaxfunds@impaxam.com or visiting www.impaxam.com.
Distributor: Foreside Financial Services, LLC Member of FINRA 2/23.
THIS PAGE INTENTIONALLY LEFT BLANK
THIS PAGE INTENTIONALLY LEFT BLANK
THIS PAGE INTENTIONALLY LEFT BLANK

Printed on recycled paper using soy-based inks.
30 Penhallow Street, Suite 400
Portsmouth NH 03801
800.767.1729
www.impaxam.com

Item 2. Code of Ethics.
As of December 31, 2022, the Registrant has adopted a “code of ethics,” as such term is defined in paragraph (b) of this Item 2, that applies to all officers of the Registrant, including Registrant’s principal executive officer, principal financial officer, principal accounting officer or controller, or persons performing similar functions, regardless of whether these individuals are employed by the Registrant or by a third party. A copy of the code of ethics is filed as an exhibit to this Form N-CSR.
Item 3. Audit Committee Financial Expert.
The Registrant’s Board of Trustees has determined that Adrian Anderson and Dorothy Ann Hurd, who serve on the Board’s Audit Committee, qualify as “audit committee financial experts,” as such term is defined in paragraph (b) of this Item 3. The Board also has determined that Mr. Anderson and Ms. Hurd are “independent,” as such term is interpreted by subparagraph (a)(2) of this Item 3. The Securities and Exchange Commission has stated that the designation of a person as an audit committee financial expert pursuant to this Item 3 of the Form N-CSR does not impose on such a person any duties, obligations or liability that are greater than the duties, obligations or liability imposed on such person as a member of the Audit Committee and the Board of Trustees in the absence of such designation or identification.
Item 4. Principal Accountant Fees and Services.
(a) Audit Fees. The aggregate fees billed for each of the last two fiscal years for professional services rendered by the principal accountant for the audit of the Registrant’s annual financial statements or services that are normally provided by the accountant in connection with statutory and regulatory filings or engagements were $23,945 and $23,248 for the fiscal years ended December 31, 2022 and 2021, respectively.
(b) Audit-Related Fees. The aggregate fees billed in each of the last two fiscal years for assurance and related services by the principal accountant that are reasonably related to the performance of the audit of the Registrant’s financial statements and are not reported under paragraph (a) of this Item were $0 and $0 for the fiscal years ended December 31, 2022 and 2021, respectively.
(c) Tax Fees. The aggregate fees billed in each of the last two fiscal years for professional services rendered by the principal accountant for tax compliance, tax advice and tax planning were $17,000 and $12,190 for the fiscal years ended December 31, 2022 and 2021, respectively. Fees disclosed under this category are for professional services related to review and execution of federal, state and excise tax returns and advice concerning tax compliance and planning.
(d) All Other Fees. The aggregate fees billed in each of the last two fiscal years for products and services provided by the principal accountant, other than the services reported in paragraphs (a) through (c) of this Item, are $10,216 and $9,495 for the fiscal years ended December 31, 2022 and 2021, respectively.
(e) (1) To the extent required by applicable regulations, the Audit Committee approves in advance all audit and non-audit services rendered to the Registrant by the independent registered public accounting firm and all non-audit services to the Registrant’s investment adviser and any entity controlling, controlled by or under common control with the Registrant’s investment adviser that provide ongoing services to the Registrant, if the engagement relates directly to the operations and financial reporting of the Registrant.
(2) With respect to the services described in paragraphs (b) through (d) of this Item, no amount was approved by the Audit Committee pursuant to paragraph (c)(7)(i)(C) of Rule 2-01 of Regulation S-X and no amount was required to be approved pursuant to paragraph (c)(7)(ii) of Rule 2-01 of Regulation S-X.
(f) Not applicable.
(g) The aggregate non-audit fees billed by the Registrant’s accountant for services rendered to the Registrant, or to the Registrant’s investment adviser, or to any entity controlling, controlled by or under common control with the adviser that provides ongoing services to the Registrant totaled $0 and $0, for the fiscal years ended December 31, 2022 and 2021, respectively.
(h) Not applicable.
Item 5. Audit Committee of Listed Registrants.
Not applicable.
Item 6. Schedule of Investments.
A complete series of schedules of investments is included as part of the report to shareholders filed under Item 1.
Item 7. Disclosure of Proxy Voting Policies and Procedures for Closed-End Management Investment Companies.
Not applicable.
Item 8. Portfolio Managers of Closed-End Management Investment Companies.
Not applicable.
Item 9. Purchase of Equity Securities by Closed-End Management Investment Company and Affiliated Purchasers.
Not applicable.
Item 10. Submission of Matters to a Vote of Security Holders.
There have been no material changes to the procedures by which shareholders may recommend nominees to the Registrant’s Board of Trustees that have been implemented since the Registrant last provided disclosure in response to the requirements of this Item.
Item 11. Controls and Procedures.
(a) It is the conclusion of the Registrant’s principal executive officer and principal financial officer (or persons performing similar functions), based on an evaluation of the effectiveness of the design and operation of the Registrant’s disclosure controls and procedures (as defined in Rule 30a-3(c) under the Investment Company Act of 1940, as amended) (the “Disclosure Controls”) as of a date within 90 days of the filing date of this report on Form N-CSR, that the design and operation of the Disclosure Controls are effective to reasonably ensure that information required to be disclosed by the Registrant in this report on Form N-CSR has been recorded, processed, summarized and reported within the time periods specified in the rules and forms of the Securities and Exchange Commission.
(b) There has been no change in the Registrant’s internal control over financial reporting (as defined in Rule 30a-3(d) under the Investment Company Act of 1940, as amended) that occurred during the period covered by this report on Form N-CSR that has materially affected, or is reasonably likely to materially affect, the Registrant’s internal control over financial reporting.
Item 12. Disclosure of Securities Lending Activities for Closed-End Management Companies
Not applicable.
Item 13. Exhibits.
SIGNATURES
Pursuant to the requirements of the Securities Exchange Act of 1934 and the Investment Company Act of 1940, the Registrant has duly caused this report to be signed on its behalf by the undersigned, thereunto duly authorized.
| (Registrant) | Impax Funds Series Trust III | |
| By (Signature and Title) | /s/ Joseph F. Keefe | |
| | Joseph F. Keefe, President | |
Pursuant to the requirements of the Securities Exchange Act of 1934 and the Investment Company Act of 1940, this report has been signed below by the following persons on behalf of the Registrant and in the capacities and on the dates indicated.
| By (Signature and Title) | /s/ Joseph F. Keefe | |
| | Joseph F. Keefe, President (Principal Executive Officer) | |
| By (Signature and Title) | /s/ Alicia K. DuBois | |
| | Alicia K. DuBois, Treasurer (Principal Financial Officer) | |
