SCHEDULE 14A
Proxy Statement Pursuant to Section 14(a)
of the Securities Exchange Act of 1934
Filed by the Registrant ¨
Filed by a Party other than the Registrant ý
Check the appropriate box:
| ¨ | Preliminary Proxy Statement |
| ¨ | Confidential, for Use of the Commission Only (as permitted by Rule 14a-6(e)(2)) |
| ¨ | Definitive Proxy Statement |
| ¨ | Definitive Additional Materials |
| ý | Soliciting Material Under Rule 14a-12 |
Nielsen Holdings plc
(Name of Registrant as Specified in Its Charter)
The WindAcre Partnership LLC
The WindAcre Partnership Master Fund LP
Snehal Amin
Rachel Foley
Chris Smith
(Name of Person(s) Filing Proxy Statement, if other than the Registrant)
Payment of Filing Fee (check the appropriate box):
| ý | No fee required. |
| | |
| ¨ | Fee computed on table below per Exchange Act Rule 14a-6(i)(4) and 0-11. |
| | 1) | Title of each class of securities to which transaction applies: |
| | | |
| | 2) | Aggregate number of securities to which transaction applies: |
| | 3) | Per unit price or other underlying value of transaction computed pursuant to Exchange Act Rule 0-11 (set forth the amount on which the filing fee is calculated and state how it was determined): |
| | 4) | Proposed maximum aggregate value of transaction: |
| | | |
| | 5) | Total fee paid: |
| | | |
| ¨ | Fee paid previously with preliminary materials. |
| ¨ | Check box if any part of the fee is offset as provided by Exchange Act Rule 0-11(a)(2) and identify the filing for which the offsetting fee was paid previously. Identify the previous filing by registration statement number, or the Form or Schedule and the date of its filing. |
| | 1) | Amount Previously Paid: |
| | | |
| | 2) | Form, Schedule or Registration Statement No.: |
| | | |
| | 3) | Filing Party: |
| | | |
| | 4) | Date Filed: |
On April 26, 2022, The WindAcre Partnership LLC (“WindAcre”) hosted an investor webcast to outline the business and valuation case for Nielsen Holdings plc (the “Company”) and why it opposes the proposed acquisition of the Company by a private equity consortium led by Evergreen Coast Capital Corporation, an affiliate of Elliott Investment Management L.P., and Brookfield Business Partners L.P. for $28 per share (the “Webcast”). During the Webcast, Snehal Amin, Managing Member of WindAcre, made a presentation with respect to the foregoing (the “Presentation”). The Presentation and Webcast are available at the following website (the “Website”): https://event.on24.com/wcc/r/3763862/A9FF9B8E9397CE3F9CA44284EFB69E0D. A copy of each of the Presentation, the transcript of the Webcast and the material posted to the Website is filed herewith as Exhibit 1, Exhibit 2 and Exhibit 3, respectively.
In addition, on April 26, 2022, WindAcre filed a Schedule 13D/A regarding the Presentation and Webcast, the relevant text of which is filed herewith as Exhibit 4.
Information regarding the Participants (as defined in Exhibit 5) in any future solicitation of proxies regarding the Company is filed herewith as Exhibit 5.
Exhibit 1


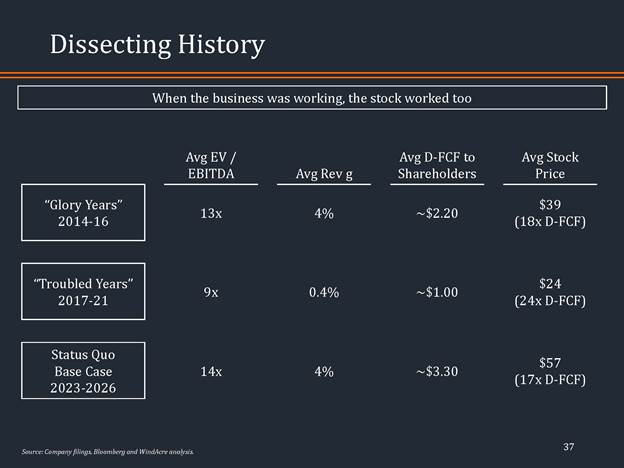


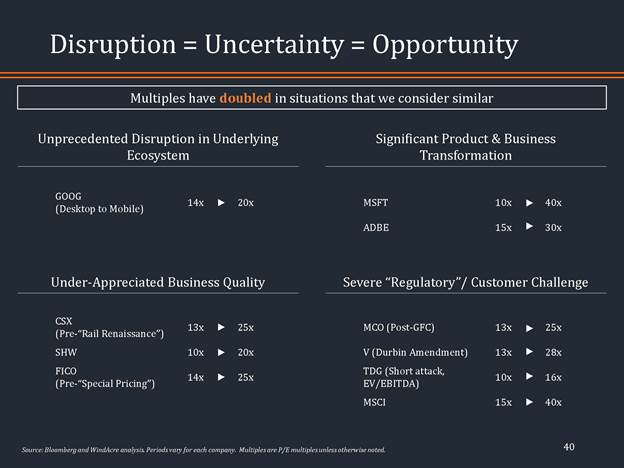


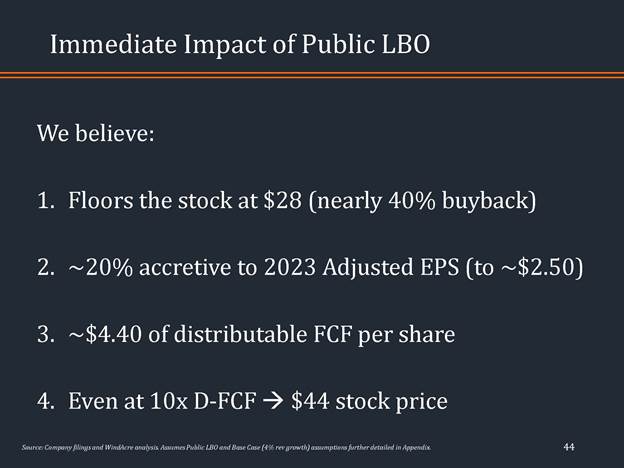

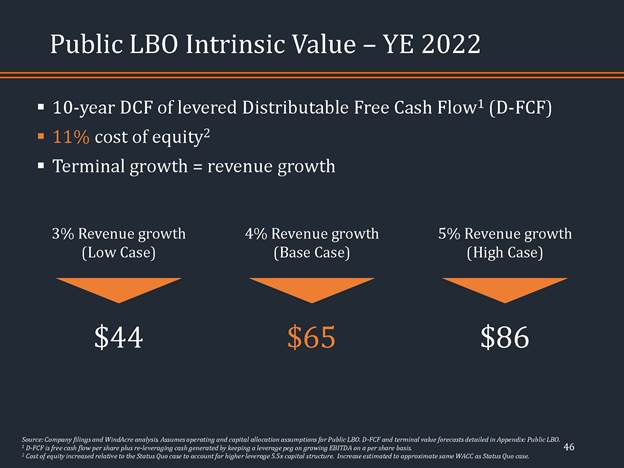

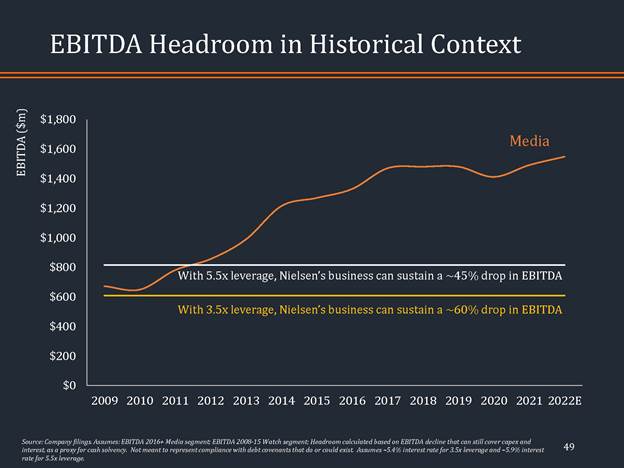

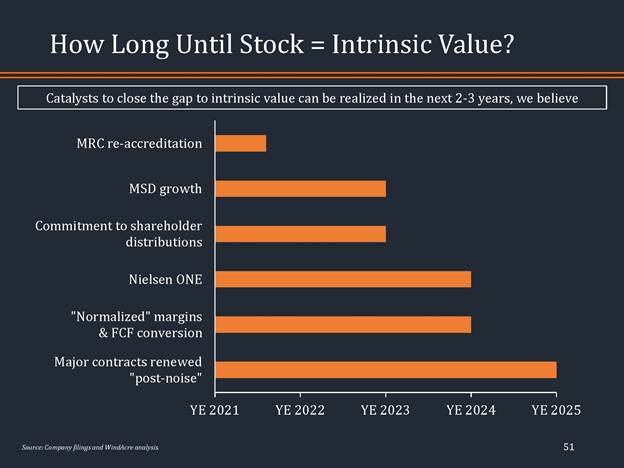


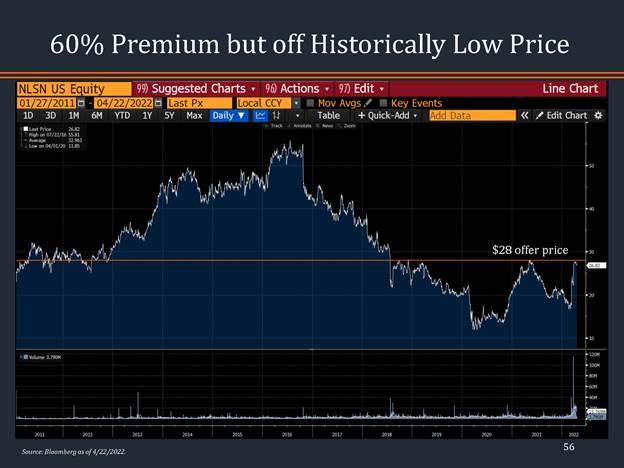

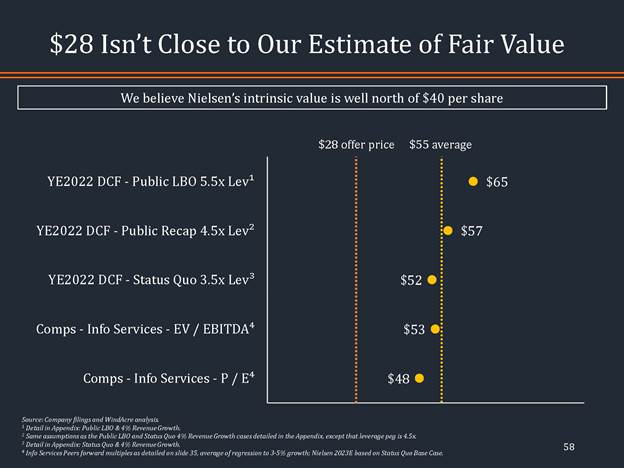


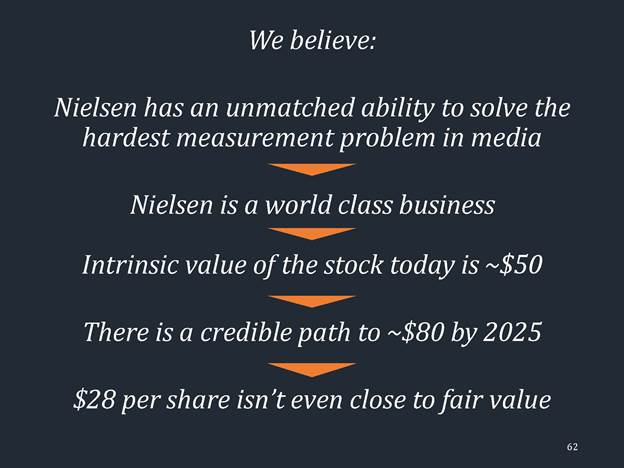


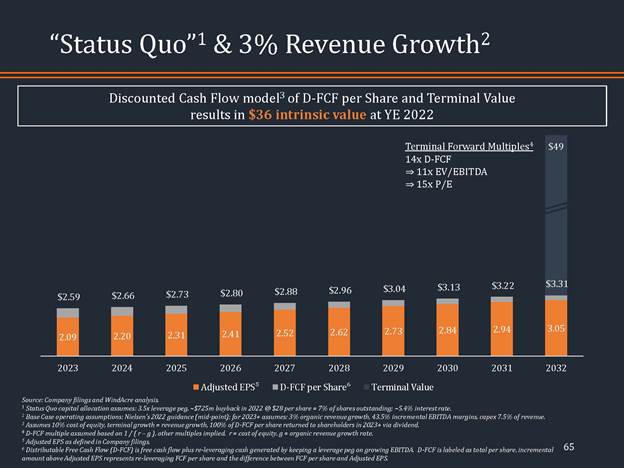
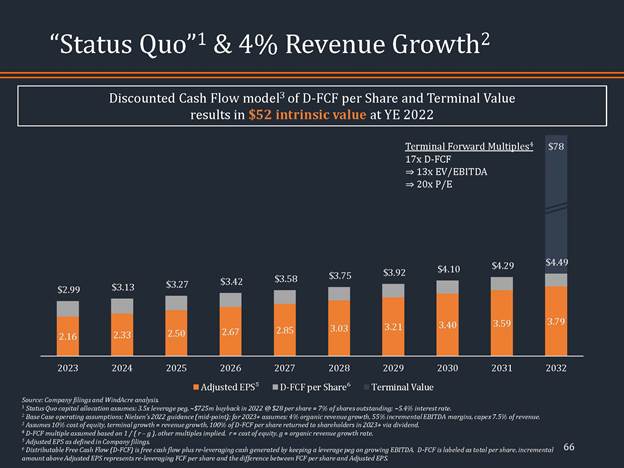
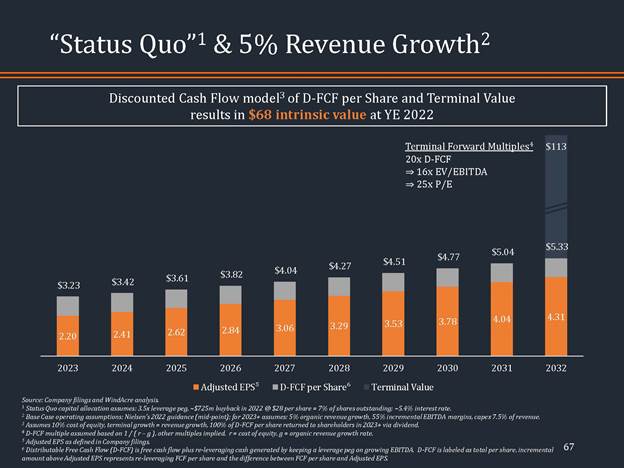


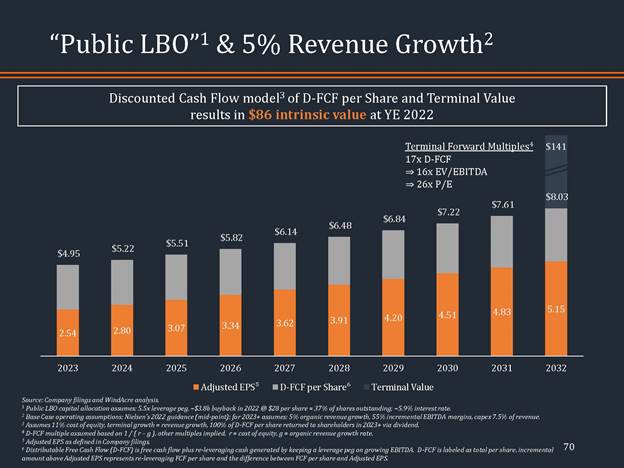
Exhibit 2
The WindAcre Partnership LLC April 26, 2022 |
Corporate Speakers:
- Snehal Amin; The WindAcre Partnership LLC; Founder
Snehal Amin: Good morning, everyone. And thank you for joining. I'm Snehal Amin, founder of The WindAcre Partnership and I welcome the chance to share our view of Nielsen and its intrinsic value with you.
Before I begin, I'd encourage you to read our full disclaimers, which will be available in our presentation on this same webcast link after my webcast. I would stress, these are strictly our views and beliefs and because intrinsic value is inherently future-looking, most of what we discuss is forward-looking with all the risks and uncertainties associated with that.
Who are we? We're a concentrated long-only firm focused primarily on owning world-class businesses. We are purely intrinsic value-based investors. Not relative-value or not thematic. I recognize intrinsic value may seem like an academic concept, but I would say over my multi-decade career I've found no better way, no more reliable way, of predicting where share prices will be long-term than estimating intrinsic value.
And we operate with the mindset of a true long-term owner. When we make an investment we assume we're going to own that investment for 10 years plus. We're not an activist firm, we've never desired to be public or to be known. And with respect to Nielsen, we first invested in Nielsen in 2013. We currently own 27%, making us Nielsen's largest shareholder and we oppose the take private of Nielsen at $28 per share.
Why? Because we believe Nielsen has an unmatched ability to solve the hardest measurement problem in media. This, to us, makes Nielsen a world-class business. We estimate its intrinsic value today at around $50 per share and we believe there's a credible path to an $80 stock value by 2025. So, 3X in three years. And $28 per share isn't even close to recognizing that value.
Why is Nielsen a world-class business? The reason we start here is because we believe the business is totally misunderstood. The narrative around the business is that it's going to be disintermediated, that we're moving from a -- moving to a competitive multi-currency future and the business has been valued as such. We totally disagree. And because the quality of the business is central to our thesis, we're going to spend a good 20 or 30 minutes diving deeply into question.
When we're trying to evaluate whether something's a world-class business ourselves, we typically ask a few questions. First, how difficult is the problem this business is trying to solve? Second, at what scale can it solve that problem? Those two questions together can give us a sense for how much value is being created by this business. And then third, how uniquely does the business solve the problem?
Airlines, for example, solve an incredibly difficult problem at huge scale, but make no money. Google Search, on the other hand, solves an incredibly difficult problem at scale, but does it uniquely. And as a result, it's one of the world's most valuable businesses.
So what is the measurement problem here and why is it so hard? It's hard because of the sheer scale of these numbers, 300 million people in the U.S. watching video across 900 million screens for nearly 600 billion hours a year. And it's hard because what you want to measure at the end of the day is not the machines, it's the people. And it's not the machines that make the purchases, it's not the machines that buy the soap, it's the people.
And as we've studied this problem it's become clear to us and I think the industry as a whole that it requires big data and a panel. Why big data? Because it's impossible to measure 300 million people and 900 million screens with a panel alone. So, you need the big data input, but you also need the panel, because again, the big data just measures machines. At some point you have to translate that machine data into what actual people are doing.
And the analogy we draw here is trying to measure the U.S. population. There's plenty of big data available, credit card data, banking data, mobile phone data, that might be able to give you a sense for the size of the U.S. population, but each one of those data sets has inherent selection problems with it. Not everyone has a phone, not everyone has a bank account, et cetera.
And so, we still rely, as antiquated as it may seem, we still rely on people going door-to-door every 10 years to figure out what the true population of the country is. If you're going to make a decision as important as how many elected officials should a state or a locality have you want to make sure you get that right. And the panel is the equivalent of that census. It may seem antiquated, but it's absolutely essential for decisions that are as big as how do you spend $100 billion on advertising a year and where should it go.
And since we studied Nielsen over the past few years, it's become clear to us that in order to evaluate the competitive landscape we really need to do it along these two axis. How robust is the panel and what is the big data coverage? And so, we've taken a shot here putting the competitive landscape together, showing where we believe, and this is inherently subjective, but where we believe the primary competitors to Nielsen sit, both along the big data coverage axis and along the panel axis.
And two things become clear to us. First, the big data axis is relatively competitive. We believe Nielsen is the leader. We believe Nielsen has the most coverage of big data. But, it's not alone on this axis and others are close.
The other thing that becomes clear is on the panel axis no one is close. Nielsen sits in a position by itself. And this leads to a very common critique, which is, who cares about the panel access, right.
The panel was the way to measure TV effectively in the 1980s, but it's antiquated. There's no way that you can measure, again, 300 million people watching across 900 million screens with a panel of 41,000 households.
And so, who cares about that axis? The future is the big data axis and you can see that that axis is competitive. And that leads to the common critique of Nielsen, which is we are moving into a multi-currency world where there are several big datas that are -- big data players that are viable, and so Nielsen's market position is going to erode.
We agree, actually, on both of these points that the panel itself is outdated and we agree big data is fairly competitive, but we think what all of this misses, again, is that you need to combine the two to be an effective measurement player in this ecosystem.
And this isn't just WindAcre’s supposition. You'll see on this next chart that all of the major big data players have either developed their own panel or teamed up with a third-party panel provider like TVision, so that they can complete their measurement offering.
So, at the end of the day measurement isn't about machines, it's about people. We aren't measuring this ecosystem for kicks. We're measuring so advertisers know who is watching so they know where to advertise. And we have to remember at all times that measuring machines can be a proxy for measuring people, but it's not the same thing.
And so, when you look at Nielsen One and its potential, which is the combination of Nielsen's big data assets and Nielsen's panel, you see that Nielsen sits alone in this competitive landscape. And it sits alone, again, not because of its big data asset, which we think is the leading asset in this ecosystem, buy it sits alone mostly because its panel is unmatched.
I want to spend a minute on why Nielsen's panel is so robust and why it's so hard to compete with. Look, from our work we believe Nielsen's panel is probably the most robust panel in the world. The numbers are clear, how Nielsen stacks up versus the competitor that's most often cited as a panel competitor, TVision.
And we'd say is, with TVision has cool technology, it's an interesting business, but the technology that it uses, which is a camera that points out from the TV to you in your living room so it can track who's watching, that inherently has scale limitations. It inherently has selection bias issues, right?
Not every demographic is going to be comfortable with a camera pointed out from their TV into their living room. Not many people are going to be comfortable with the camera pointed out from their TV to their master bedroom or a camera pointed out from their TV into their kids’ rooms or into guest rooms.
And this is clear, right, in TVision’s own data they have a panel size that’s 5,000 households, which on its face is one-eighth the size of Nielsen. It’s a respectable size for a panel. When you look at the comparable size, right, Nielsen measures in the 41,000 households all the TVs in those households. TVision has only gotten acceptance to measure all the TVs in 5% of its panel households for reasons that we think are obvious. Again, not everyone wants a camera pointed out from their TV into their master bedroom.
TVision’s panel is also not designed to be representative of the population, and Nielsen’s panel is, right? Nielsen takes the census data and creates a panel that’s reflective of the total US population by demographic.
And so, the punch line is Nielsen’s panel ends up costing hundreds of millions of dollars a year to maintain and TVision’s panel we estimate costs about a million dollars a year to maintain, so TVision’s biggest advantage is its low cost position, but as we’ll discuss further in the presentation the Foundational Currencies that exist in different ecosystems don’t exist because of the lowest cost player. They exist because they're the most universally accepted because they have the most capability. This is not a low cost game. This is a capability game.
What we’d say is on the cost side one analogy might be to think of a bicycle versus a car, a bicycle is 95% cheaper than a car. In spirit it does essentially the same thing, which is get you from point A to point B but it’d be a mistake to confuse a bicycle for a car.
This chart highlights this issue in kind of a different way, which is if you want to go down the big data coverage axis, that’s relatively cheap, right? We estimate it’s tens of millions of dollars a year to be competitive in the big data sphere, and that’s part of the reason that we saw there were a bunch of competitors clumped up against Nielsen in the big data axis.
The panel axis is very hard and very expensive to climb, right, and that’s why we think you don't see any competitors anywhere near Nielsen, right? It would be an investment of hundreds of millions of dollars a year to try to compete with Nielsen. And so, we’d say here is data is easy, but panel is hard, but both are required, right?
Again, if you want to reach that holy grail spot which is have big data coverage but be able to translate that into what actual humans are doing, you have to get down both of these axis and only Nielsen can do that.
And so, we’d say is the big data is where the battles are that we hear about, right? iSpot, VideoAmp, et cetera, but it’s our contention that the world will be won here by whoever has the best panel.
Of course, this is a static look at the ecosystem and the question that we always ask is what about the future? Can others close the gap? And we’d say is, look, it seems very, very hard for that to be the case, right? So we’ve put on this chart the resources to find differently revenues, headcounts, the right headcount like data scientists, market value to give a sense of what resources can the competitors throw against this problem to try to be effective measurement players, to try to compete against Nielsen.
And what’s clear to us is Nielsen dwarfs the competitors and the resources available to solve this problem, and then as we mentioned there are fundamental limitations of the technologies that other people are using, which are going to create sample set issues or going to create sample bias issues as we discussed.
Now, of course, we’re talking about Nielsen ONE and Nielsen ONE isn’t even out yet, right? So there’s always the question of how can we get comfortable with the potential of Nielsen ONE when we haven’t even seen it, right, and certainly not in its full form.
I’d say this is true. We haven’t seen it, but sometimes logic can foretell the answer. For example, if Amazon enters a new vertical you can analyze actually the scale that Amazon brings with the competitive advantages that it has, with the resources that it has, whether it can or cannot be effective wherever it’s going next, and we think the same is true here, right?
So again, advertisers care about people, not machines, and Nielsen’s panel provides an unmatched ability to translate from those machines to people, and the example I’ll use is the classic big data problem here, which is set-top box data, right? Again, if you are an advertiser you care about who is watching programming. And so, let’s think about how you translate set-top box data into that.
The set-top box may be on, right, so that’s sending you a signal that someone is watching X, Y – or X or Y programming, right? The set-top box may be on but the TV may not be on, right? So it could be in reality no one is watching, or the set-top box could be on and the TV could be on but there’s no one in the room, right? Or there could be someone in the room, but you don't know who it is. And, of course, a 13-year-old girl versus her mother have two very different values to an advertiser, right?
This problem, this translation problem between the data the set-top box is sending back, which is I am streaming X programming right now versus who in the room is actually watching, that’s a problem that Nielsen’s panel solves and it has an unmatched ability to do that.
Advertisers care about reach and frequency across the entire ecosystem, and again, only Nielsen’s panel is representative of the entire population demographic of the US. You also want to be able to measure over the air households, right, which are 20% of consumption and growing. Again, only Nielsen’s panel allows you to do that. We don't think anyone has more trust and more partnerships in this ecosystem than Nielsen, and that’s essential to de-duplicate, and then there are other assets like an ID backbone, for example, that you need, which Nielsen has with Nielsen ID.
Then we contend that you have to be an independent third party to be the Foundational Currency for this ecosystem. This ecosystem is $100 billion and it’s not going to transact off of people’s own designed currencies because the problems with that are obvious. It’s somewhat akin to degrading your own homework.
And I wouldn’t underestimate the fact that Nielsen has been the currency in this ecosystem for decades and what that means in terms of it being the trusted provider of this data for this ecosystem.
Now, of course, this is WindAcre’s view, but WindAcre doesn’t get to decide who the current will be. So who will decide? The advertisers, right? The advertisers sit at the top of this ecosystem. And here is a comment from the Association of National Advertisers. It’s a trade group of advertisers that we think sums up very clearly what advertisers want, right?
They want to understand reach and frequency, right? That is the foundational metric that they want to understand, and they want to understand it not within a silo, not within a platform, and not within a TV network. They want to understand it across all of media.
Now, of course, that isn’t what we hear most commonly today. That isn’t the critique of Nielsen. And so, we’d highlight that most often the critique of Nielsen comes from people that are not the advertisers, right? It’s coming from the people that don't get to decide who the currency is. It’s coming largely from media companies and largely a subset of media companies that are legacy media companies that may not be that well positioned for the future of where this ecosystem is going.
As we highlight here a few areas, and I’m going to spend time on two in particular where we think the media companies and advertisers are in direct conflict with what they want and what they need. And that’s why they lead to two very different narratives about how the future of this ecosystem should evolve.
Whether we should have a multicurrency world or a single Foundational Currency system. So one is deduplication. All right, what is deduplication? Again, advertiser does not want to hit you eight times with the same commercial because it’s annoying for you and it destroys brand value for them, right.
They would much rather hit four people twice than one person eight times. And so that’s deduplication, the ability that to deduplicate how many people have been reached with a single advertisement. Now, that’s what an advertiser wants, but, of course, deduplication is revenue for the media company, right.
So any ad that gets paid for is revenue for the media company. And so an advertisers waste is a media companies’ revenue. And so you could see how those two would be at odds with each other, right, in terms of how much do you want a currency system that allows deduplication.
There’s also the special snowflake syndrome, right, which is media companies want their content to seem unique, for their audiences to seem unique, their audiences are undervalued, et cetera. And advertisers want the ability to compare across the entire ecosystem, right.
You could imagine how an advertisers not that interested in NBC coming to them saying, here’s how special our audience is, and then CBS coming and saying the same thing. And then ABC coming and saying the same thing, et cetera.
Makes it very hard to transact, you need a common set of standards that you can compare across all these different ecosystems, right. It’s the reason we have standardized tests and a wide variety of different ecosystems across academics, et cetera.
You need some basis to be able to compare on a standard basis across the entire ecosystem. And so, that’s why we believe the advertisers want a foundational system wide currency with additional analytics, additional data that’ll help them make better decisions.
That’s a very different picture from what the media companies are talking about, which is pick your own currency essentially.
I don’t want to get too deep into the semantics here of whether we’re going to have a single currency or multicurrency future. By some definition, we will have a multicurrency future.
And what do I mean by that? There will be some contracts somewhere that use someone other than Nielsen as the currency, right. So by that definition, we will end up in a multicurrency future. But I think it’s important to keep in context what that means, right.
If we asked people what is the currency in the U.S. I think everyone would say it’s the dollar. But technically the U.S. is also a multicurrency system, right, there are a wide variety, probably hundreds of different ways that you can transact in the U.S. outside of dollars, right.
There’s cryptocurrency, bitcoin, Starbucks points, Amex points, the different community currencies, airlines miles to buy tickets. So in these niche use cases, you actually do have a variety of different ways that you can make purchases outside of the dollar. But what’s clear is these niche use cases, these other currencies don’t just intermediate the dollar.
In fact, most of these end up being translated back to dollars in the first place, right, how do you know the value of a bitcoin? We quote it in dollars, right. And that back-testing phenomenon is also happening in the media ecosystem. People might be trialing other currencies but they back-test against Nielsen, right.
And the reason they back-test against Nielsen is Nielsen is the trusted provider of this data. And so, I’d say even though people may talk about a multicurrency future, even though people may be trialing different currencies in different niche use cases it’s very important to understand that in the U.S. the dollar is still the true Foundational Currency of our economy.
And we with Nielsen will still be the true Foundational Currency in the media ecosystem.
Now, why do we have a Foundational Currency? I think this quote from Group M makes it very clear why certain ecosystems evolve to having Foundational Currencies. That which is,
“You can’t have six different currencies making these decisions, right.”
We can imagine a world where if every time you made a purchase you have to choose between one of six different currencies, right. Each one of those different currencies has a different economic effect for you and for the seller of the product. That would be an incredibly inefficient and impractical ecosystem to try to operate in, right.
There’s a reason that the U.S. went to a single currency instead of different state currencies. There’s a reason why Europe went to the Euro instead of different country currencies. Right, you need a Foundational currency that everyone uses, everyone transacts on, that everyone accepts the value for, for an ecosystem to operate efficiently, right. And that has been Nielsen, and, again, we think we’ll continue to be Nielsen.
Now, because the market has struggled we think with this concept, and with understanding the distinction in this ecosystem between a Foundational Currency and someone that provides data and analytics, we’ve taken a shot here at what we view as analogies of Foundational currency type of market positions in other ecosystems, right.
In the equity market, the bond markets, and the credit score market, economic data, right. And what you’ll see for all of these is there’s a universal acceptance, a single source of truth for what is a Foundational Currency, right. So when we talk about the U.S. equity market by in large we’re talking about the S&P 500, right.
That doesn’t mean that there aren’t research providers that can help you make better decisions about what stocks to own, et cetera. But when we talk about the market it’s important that we’re all talking generally about the same thing, right, which is what did the S&P 500 do? In the bond market, again, it would be some S&P ratings, right.
It’s important that people are able to talk about credit risk across the entire economy in a common language. And that’s what the S&P and Moody’s bond ratings do, right. Same for credit scores, right, we use FICO scores as -- to give us a sense, again, across a wide range of credit, what someone’s credit score is, what their credit risk is.
Economic data, the official GDP data, right, imagine a world where we didn’t have official GDP data where hundreds of different economic houses, research providers were each providing their own distinct view of what the U.S. economy was doing. It would be chaos.
Now, that doesn’t mean that for some niche application there aren’t other data sets in addition to GDP data that might be valuable for you, right. So if you were invested in an apparel retailer and you want to know week to week how consumers were spending on apparel, buying credit card data might really be valuable, right.
And it might be more valuable in short periods of time actually than GDP data but one shouldn’t confuse the two, right. You’re not going to be able over time to get a sense for what’s happening from the U.S. economy from credit card data, right. Not all consumers have a credit card, and not all GDP is consumer.
And so, the same thing applies we think in media, you need one foundational system to be able to say how wide was the reach for this programming and how many distinct people did this programming hit?
And then you have a bunch of other data and analytics providers that will help advertisers the same way credit card data or sell-side research helps investors make decisions, that does not -- does not, again, disintermediate the Foundational Currency in the ecosystem.
In summary, I’d say -- we believe Nielsen has an unmatched capability here to solve the hardest problem in media. We believe the advertisers know that, that’s what they want. And at the end of the day, they are the ones that will decide. We think this results in Nielsen ONE being the Foundational Currency for this ecosystem, and that to us, again, makes Nielsen a world-class business.
When you solve a really difficult problem and you solve it at scale and you solve it uniquely, to us, that has all the hallmarks of being a world-class business.
All right, what is Nielsen worth? So we’re going to start with what we call the status quo case. This is 3.5 times net debt to EBITDA leverage, which is the current leverage of that the business has.
It allows for a buyback of about $725 million, well within the range of the billion dollars that the company has already announced. We then keep leverage pegged at that 3.5 times level. The only comment I’d make here is keeping leverage pegged is essentially keeping the financial risk profile of the business constant.
We assume in all of the analysis that we’re going to share with you today that the future distributions to shareholders, so from 2023 on are all in the form of dividends. To be clear, we think it’s almost a certainty that buybacks would be preferable -- would create more intrinsic value than dividends but for the sake of simplicity for this presentation, all future distributions to shareholders are assumed to be dividends here.
And then in terms of operating assumptions, we start in 2022 using the mid-point of the company’s guidance. And then we grow revenue in a range of 3% to 5% so we run different scenarios which we’ll share with you.
We have incremental margins of 55% except in the 3% revenue growth case we keep margins flat, and we have CAPEX -- the capital intensity of the business, so CAPEX to revenue declining to 7.5%, which is what the company has said publicly should happen longer term.
The one thing I would stress here is the midpoint of our operating assumptions to the 4% organic revenue growth, 55% of grown margins, and against CAPEX fading to 7.5% of revenue. Those are the same assumptions that we used internally pre-deal, right. So we are not embellishing in any way the presentation here from what we believed and continue to believe about this business and believed even before we had any knowledge of this transaction.
So we then put those numbers into a DCF framework, it’s a 10-year DCF of distributable free cash flow, distributable free cash flow is the cash the business generates that it can distribute to shareholders including the cash from keeping the leverage pegged at 3.5 times, right.
So when EBITDA grows, and you keep the leverage pegged that that gives you additional cash that you can distribute to shareholders. We use a 10% cost of equity, in a terminal growth rate we use the revenue growth rate, which we think is a particularly conservative assumption. Because cash flow should grow faster than revenue because of future operating leverage. And because of the financial leverage that for conservatism we assume terminal growth, i.e. the growth in 10 years of the business to be equal to the revenue growth in these various cases. And the result is in what we call we call our base case, 4% revenue growth, an intrinsic value of $52 a share.
Now, we recognize $52 a share may sound crazy, right, this stock was at $17.51 not that long ago. And so, we lay out here exactly what the cash flows are that are being discounted.
And I’d note, we have a similar slide to this in the appendix of the presentation for all of the scenarios that we discuss, so you’ll be able to see exactly what the cash flows are, and you’ll be able to reconcile to those numbers yourself. Now, we show the adjusted earning per share as company defined.
I want to make very clear that that’s not the number that we end up discounting, actually. We make adjustments to the company-defined adjusted EPS. For example, we treat stock comp even though it’s non-cash we treat it as a cash expense, we treat restructuring as a cash expense.
We then add -- once we convert adjusted EPS to a true cash flow per share, we then add the debt capacity that the business has that grows, keeping leverage pegged, right. So for those familiar with TransDigm or John Malone or Charter, this is the capital structure model that they use.
And what you can see here is in 2023 this business has the ability to distribute $3 of cash per share to shareholders in this case, and that grows over the next decade to $4.50.
So now I want to drill further into what I believe is the most significant operating assumption that we use. And then spend some time on the multiple, right, because the analysis here does imply a re-rating of the business and we think it’s worth discussing how we get comfortable with that.
So why do we believe in our base case that revenue here should grow 4%? I would actually say that we believe revenue growth should be north of 4%.
And I think one way to frame that is how should revenue growth look relative to GDP. So we assume long-term in the U.S. nominal GDP growth of 4%, essentially 2% real and 2% inflation. And as we look at the various puts and takes we think there are more puts than takes. i.e. more things that should cause Nielsen to outgrow nominal GDP than to undergrow nominal GDP. And the things that would cause it to undergrow, right, the areas of the media ecosystem that are losing viewership, that are in decline, or at best flat, audio, long-tail cable, local, these have been drags on growth, and will continue for some period to be drags on growth.
But we note that they are diminishing, right, as those underlying parts of the media ecosystem decline, right, they will diminish as a drag over time. And so, again, as we look at the puts and takes here, to use it seems like this is a north of 4% organic grower.
We’d also note that relative to history, 4% seems relatively conservative. This business has grown pre-COVID in average of over 4%, and here we’re looking at the media business, right. Or what used to be the legacy watch business, and we’ve tried to back out the major acquisitions that we could identify, right. So we’re trying to get this as close to an organic growth rate as we can do from the reported data.
We’d also note here that we are including in this the performance of the business all the way to 2019, right. So this is a growth rate pre-COVID. But even in 2017, 2018, and 2019 you can see there were very specific we think revenue quality-related issues, GDPR-related issues, right, the privacy regulation that caused this business to suffer.
And we’re including that and even with that to us looks like this business has grown north of 4% historically. I think another way to look at this would be to say the business is essentially a toll taker of sorts. On the TV and the video -- the premium video ad ecosystem, right, and this is one view of that ad ecosystem from e-marketer, right.
And we can see this ad ecosystem is expected to grow, again, north of 4% in the future. And it’s actually an acceleration versus history. The last thing I would note here is 4% would be the low end of management’s stated view, right, that this business should grow mid-single-digit, right, which is organic growth of 4% to 6%.
So our base case of 4% we view as being at the low end of what management is communicating as the growth potential of this business.
So now moving to the multiple. We don’t input a terminal multiple into our DCF. The terminal multiple is derived by our cost of equity assumption, which again is 10%. And the terminal growth rate, which we sensitize between 3% and 5%. So here we’re showing the base case which is the 4% terminal revenue growth rate. That implies that the fair multiple is 17 times the cash flow that the business can distribute to shareholders. And that’s what leads to the $52 value.
Now, one can look and say, okay that makes sense but that implies a 24 times PE multiple and a 14 times EBITDA multiple. And aren’t those high? Right, so I want to spend a minute on this topic. Look we’d say, the reason those multiples seem high is they reflect the enormous cash generating power of this business, right. So, as we’ve said, this business we think starting in 2023 can distribute $3 growing to $4.50 over the next decade of cash to shareholders.
Right, that’s the cash flow stream that we are entitled to, that’s the cash flow stream that we should discount. And so we wanted to stress test this against different prices that are relevant here, right. So let’s stress test it against the $18 unaffected price, right, pre the deal leak. So if the business distributes $3 per share and it does it in the form of a dividend, right, which, as we said, that’s our assumption here for the sake of simplicity.
We think a buyback would be even more valuable. But the business started distributing $3 in -- $3 per share in cash next year and the stock went back to $18, that would be a 17% dividend yield. We simply don’t believe Nielsen is going to trade at a 17% dividend yield.
Take today’s price or take private price of $28 per share, that would imply an 11% dividend yield. Again, we simply don’t believe Nielsen is going to trade at 11% dividend yield. This is a growing business, right, where that dividend is going to grow from $3 to $4.50 over the next decade. We don’t know of another in the market that has that growth dynamic that’s trading at 11% dividend yield.
In fact we’d say it’s worth looking at it the other way which is how much higher can the share price get, right. In a market where the S&P is offering sub 2% dividend yield, it’s not implausible that Nielsen trades to a 5% dividend yield, right. Which again, $3 per share would be the dividend. And that implies a $60 share price. I’d say to us it seems far more likely that Nielsen trades at 5% dividend yield than Nielsen trades at a 17% dividend yield or even an 11% dividend yield.
Now as we stated upfront, we are not relative value investors but we understand a lot of people are and so we took a shot at looking at what the relative values imply for Nielsen.
So we put together a set of info services peers because we firmly believe that’s the peer set for Nielsen and what we observed is they grow at a faster rate on average than Nielsen, right. So this peer group grows from 2022 to 2025 based on consensus numbers, grow 7%. So we ran a regression, so that we would be able to adjust the multiples down for the growth rate that we used, the growth rate range of 3% to 5% that we use in the case of Nielsen.
And what that implies, again using the 4% base case, 4% revenue growth base case, is that the PE multiple should be in the low 20’s and the EBITDA multiple should be in the mid-teens. This is the same conclusion from our intrinsic value work, right, which says the EBITDA multiple should be in the mid-teens and the PE in the low 20’s, right.
So we look at this and say both the intrinsic value work that we do and the relative value work as indicated by the info services peer group. Both point to the same thing which is this is a business that deserves to trade in the mid-teens on an EV/EBITDA multiple and 20 plus times on a PE basis.
Now a common rebuttal to this would be, well, that’s all great but that’s not how this business is traded, right. And to some extent that’s true, right. We note though that Nielsen did historically trade pretty much in line with the info services peers. As we said, it does under grow and so it does deserve to trade and did deserve to trade historically at a slight discount to those info services peers.
You can see that it was pretty close to trading in-line with info services peers until Nielsen started having company specific issues, right. It started with GDPR and there were other revenue quality issues that the business started to face in that 2017, 2018 timeframe. All of which we believe are resolved. This business is now back to growing mid single digit.
You can see as a result of those issues and as a result of this narrative that the business is going to get this intermediated Nielsen decoupled from info services at the same time unfortunately that the info services peer rerated up and now trades in-line with ad agencies, right. Which do have true long-term terminal risk issues, right, which, again, we believe Nielsen doesn’t.
Now we’ve been an investor in Nielsen for many years and so we dissected this history even further, right. So the glory years and what we’re going to call the troubled years, right. So during the glory years what you see is this business actually did trade at a fairly healthy EV EBITDA multiple, 13 times, right. The business was performing, the average growth rate in that period, this is 2014 to 2016, was 4%. It distributed a fair amount of cash to shareholders, right, on average over that period $2.20 a share. And the average stock price during that time was $39, it’s not bad, right.
And then you hit the troubled years, right, 2017 to 2021. And yes the business derated but the business performance was pretty poor, right. So the average growth rate in there was very close to zero, right. The business did not distribute much cash to shareholders and as a result the stock derated, right, from an average of 13 times to nine times.
Now it is our contention that those problems have been fixed and our status quo looks much more like the glory years, right. Average revenue growth of 4%, we believe, as we said, the business can start distributing to shareholders north of $3 per share. That implies to us that the stock on average over the next few years should trade at a $57 share price for 14 times EV/EBITDA.
Again, if you look at our base case versus the glory years they’re not that dissimilar. When the business was working the stock worked also.
We took a further look at history because the business, as it stands today, is actually not the business that was trading publicly in the markets historically, right. For those that are familiar this used to – Nielsen used to have two businesses; what used to be called Buy and Watch and it divested that Buy business a couple of years ago. And so we thought it would be interesting to try to remove that Buy business which got sold at six times EV/EBITDA.
So if we remove that and look at what was the implied multiple of the media business, which is all of what Nielsen is today, historically again what you see is that media business did seem to trade on an implied basis, did seem to trade close to 15 to 16 times EV/EBITDA.
So all of this; the intrinsic value work, the relative value work, looking at when the business was performing and how the stock traded, what EV/EBITDA multiple it’s traded at historically, when it was a clean media business. All this to us says, this business has traded at a reasonable multiple, it should trade at a reasonable multiple, it can trade at a reasonable multiple and we think it will actually trade at a reasonable multiple.
And what is a reasonable multiple here? Like a mid-teens EV/EBITDA multiple, right, all the intrinsic value and the relative work, value work points to that and at 20 plus times PE multiple.
Now why doesn’t it trade like that today? This business is undergoing kind of several different angles of disruption. That disruption does lead to uncertainty. But we’d argue that uncertainty leads to a low valuation but it’s also the opportunity, right. So the different sources of disruption here, I mean obviously the underlying ecosystem is going through an unprecedented disruption as our viewership is fragmenting as the models are moving from the classic linear TV model to over-the-top models to non-ad supported models like Netflix.
The business is undergoing the most significant product and business transformation probably in its history, right, as it moves its currency from the legacy C3, C7 to Nielsen ONE and as it divested its legacy Buy business. I’d say in general, this has been an underappreciated business in terms of business quality.
And then it’s facing a severe regulatory and customer challenge, right, and by regulatory challenge here I’m referring to the MRC accreditation, right, the MRC has been the kind of quasi regulator for Nielsen. And the customer challenge, as we well know, right, from the likes of NBC and Discovery who have been very vocal as critics of Nielsen.
So we understand the disruption here and we understand the uncertainty. Well what we’ve observed though, is that there have been situations similar to this for other companies. And in general as that disruption has clarified, right, as people have gotten comfortable with the quality of the underlying businesses the stocks in general have rerated, right. So Google had derated when there was concern about Google Search’s role in the new mobile ecosystem. Microsoft and Adobe derated as people were concerned about what the transition to a cloud business model would mean, right.
Moody’s derated post global financial crisis when people were concerned about whether the issuer pay model would survive, right, or whether that would get regulated away. Similarly with Visa, with the Durbin Amendment, where there was concern about whether the economics of the card networks were going to get regulated. Or TransDigm during the short attack a few years ago, right.
So all these businesses have derated but they rerated back up once it became clear what the quality of the business was. Once it became clear that these businesses were not going to get disintermediated. And we believe the exact same is true for Nielsen. So we wouldn’t be surprised if the Nielsen multiple doubled over the next few years. Actually probably shocked if it didn’t.
So we would summarize this as saying, look the status quo case is status quo and what we mean by that is there is nothing particularly bold or inspiring about this case. It is literally running at what we think is the low end of what management is saying this business can perform at on a revenue growth basis. And distributing and keeping the leverage pegged at 3.5 times which is where the leverage is today and distributing that cash out to shareholders. That results in intrinsic value of about $50 per share.
As we have said, it allows the business to start distributing $3 growing to $4.50 over the next decade. And so all of that leads us to the conclusion, why would we sell this at 28.
I’m going to move forward and present a bolder and even more compelling case. This is the public LBO case, right. And the primary difference here is this has a significant recap to 5.5 times net debt to EBITDA. That allows together with the 2022 free cash flow for $3.8 billion to be redeployed which at $28 would be a 37% buyback.
Similar to the status quo case we then keep leverage pegged and all the other assumptions here are the same as the status quo case, right; future distributions beyond the 2022 buyback in the form of dividend and the same operating assumptions that we use in a status quo case.
Now what is the immediate impact of a public LBO? Look, first we think it floors that stock at $28 because you’re buying back nearly 40% of the market cap at $28. That’s 20% accretive to 2023 EPS, adjusted EPS company defined, and it would allow you to distribute starting in 2023 $4.40 of distributable free cash flow, right. So on the status quo case this was $3 a share with this massive recap this business could start distributing $4.40 of distributable free cash flow in 2023 and that number grows from there.
So even if you were to say immediately the stock would trade at just 10 times distributable free cash flow, right, or a 10% dividend yield if that was paid in the form of a dividend. That would imply a $44 stock price and we think this is all possible by the end of this year, right. So there is a credible path here for this to be a $44 stock in 2022.
Now that $4.40 number will seem high I think to people in the context of what is commonly thought of as the earning power or the cash distribution power of this business, right, which people commonly think of is around $2. And so we wanted to bridge how you get from a $2 EPS to the ability to distribute $4.40 of earnings in 2023, right.
So status quo we think the adjusted EPS here is around $2, right, we make the adjustment for the buyback that obviously results in a higher interest expense because you have more debt but you have a much lower share count because of the 2022 buyback, right, buying back 37% of the shares outstanding. But we’re again using $28 as a price for that because that’s the transaction price. That results in an EPS of nearly $2.50.
And then you have a lot of releveraging free cash flow, right. And again the releveraging free cash flow is the amount of debt capacity that the business has that grows because EBITDA grows, right. So very simply, EBITDA here from 2022 to 2023 is growing by $80 million and because every dollar of EBITDA growth allows $5.50 of debt capacity at the 5.5 leverage peg that results in an incremental $440 million of cash that can be distributed to shareholders.
And, again, there’s nothing particularly novel about a leverage peg, right. Lots of companies do it, right, TransDigm, Charter, et cetera. All it’s saying is we are going to keep the financial risk profile of the business constant. Which to us it seems perfectly plausible.
So moving to the intrinsic value, here what does this result in terms of intrinsic value? We note we use a higher cost of equity in this case. We’re trying to approximate the same WACC, right, and because it’s a more leveraged case it does imply a higher cost of equity. So it’s an 11% cost of equity here instead 10% in the status quo case.
And you can see here using the same revenue growth rate sensitivities as we’ve used before, 3%, 4% and 5% -- what the intrinsic value of this business is in 2022. And you can see in the base case it’s $65. Right, that would compare to the $52 in the status quo case.
Now we don't think the stock is going to rerate to intrinsic value immediately, right? We do think there’s a very, very high likelihood that the stock rerates to at least 10 times distributable free cash flow, so the stock can end up in the 40s. But the intrinsic value here is $65, right, and we don't think it’s going to rerate to $65 immediately, but I think it is worth spending some time on when that might occur.
And we think the business can rerate to intrinsic value in about three years. And so, we rolled forward this analysis to show what that might look like. So we estimate an intrinsic value at year end 2024, so not quite three years, but we estimate the base case intrinsic value of $80 per share. Now, that includes the stock price then and the dividends between now and then. So $80 per share by year end 2023. That’s 3x within three years.
So I want to drive in to the two key drivers of this public LBO case, which are leverage and timing. So on leverage we recognize that 5.5 times seems out of the ordinary for a public company, but there's nothing ordinary here, right? It’s not ordinary how dislocated the stock is from intrinsic value even today. It’s not ordinary how misunderstood this business is. It’s not ordinary how the business has agreed to take private transaction.
Right, so rather than focusing on what’s ordinary versus not ordinary, again, nothing seems ordinary to us in this situation, we’d rather just focus on the fundamentals. Can the business support 5.5 times leverage. And here what’d we say is look in the take private transaction that’s been announced, it looks like 7 times leverage to us, right? That’s the committed financing that they have in the take private. And so, we say if the business can support 7 times leverage as a private LBO we don't understand why it would not be able to support 5.5 times leverage in a public LBO.
We also analyzed ourselves how much EBITDA headroom exists with 5.5 times leverage and does that seem comfortable? And we’d say it seems more than comfortable, right? At 5.5 times leverage EBITDA can drop 45% from current levels, which means EBITDA falling back to where it was 10 years ago. And so, all of this points to us as this business having more than adequate ability to be levered at 5.5 times net debt to EBITDA.
Then on timing, why do we say that we believe this stock can reach its intrinsic value within three years? We look at this and think there are a number of catalyst events that will provide clarity on the future of Nielsen, and we’ve tried to lay out the most important ones here, right?
Obviously MRC reaccreditation, continuous growth in the mid single-digit range, right, a commitment to shareholder distributions, right? The Company has talked about a buyback, but that cash hasn’t been returned to shareholders yet. Of course, and probably most importantly, Nielsen ONE, right, continuing to execute on Nielsen ONE, continuing to stay on time for that transition in 2024, showing what the normalized free cash flow and margin power is of this business, and then having major contracts renewed post this period of kind of high noise and what seems like relatively high animosity between some of the legacy media players and Nielsen.
As we look at the timing for these, right, we believe all of these or almost all of them kind of get realized within the next two to three years, and that’s what gives us comfort that this stock can reach intrinsic value within three years, right, and that intrinsic value in our base case is $80 per share, and that’s a 3x from $28 within three years.
So I wanted to note here a few considerations for the public LBO model. One, of course, the higher leverage, is the higher financial risk, right? That goes without saying, but again, we note it’s less financial risk than the private LBO at 7 times EBITDA.
There are UK statutory limitations on distribution that likely require some procedural steps here, right? A capital reduction, possibly a scheme of arrangement. We’d say all of this to us from our work is achievable. Seems to us far less disruptive than a private – a full private takeover. And it seems to us far better for shareholders as a whole.
So we’d summarize this public LBO as following. Right, this allows for a nearly 40% buyback at $28 per share. It allows the business to distribute to shareholders $4.40 starting next year, and that grows over the next decade. That to us implies this stock could be close to $45 within a year and close to $80 – around $80 in three years. Again 3x in three years. And again, leads to us the same conclusion which is why in the world would we want to sell at $28?
Let me share a few further thoughts on this $28 transaction price. I started my career in private equity. I think we’re somewhat adept at understanding private equity returns, so we’ve took a shot at trying to estimate what the private equity returns look like here for the buying consortium.
And we understand, right, that the base private equity model is exit at the same multiple that you enter, right? Not a particularly sophisticated way we think of understanding multiples, but we understand that’s how private equity firms at a base level look at this. And we would say even in that case, right, the entry multiple and exit multiple being 10 times EV/EBITDA. We think the returns here are pretty extraordinary, mid to high 20s, five-year IRRs.
We’re almost positive, right, that if this business is taken private it’s likely to come back to the public markets in an IPO. We’re pretty sure at that point the sponsors are not going to say, hey, you should pay in the IPO just what we paid, which is 10 times EV/EBITDA, right?
We think the argument’s going to be, look, this is a world-class business that’s cemented its place as the Foundational Currency for the media ecosystem. Look at other high quality info services business that have a similar market position in their ecosystems. They trade at a mid-teens EBITDA multiple. And so, that’s the price that this should be in the IPO, right? Essentially the same argument that we’re using now that we think is largely foreseeable, right? Of course in a few years that will have been de-risked.
We think the outcome is largely foreseeable, and if you look at the returns that the private equity consortium generates if this business does, indeed, rerate to a mid-teens EV/EBITDA multiple, those returns are extraordinary, right? High 30% to 40% five-year IRRs. Even if you look at what the IRRs would have been if they could have paid $35, right, in that rerating case you get to very attractive returns, right? Mid-20s essentially.
So we have always believed that there are billions of dollars on the table here. And that’s why we fought so hard for a better deal for all shareholders than the $28 deal that we have before us today, right? And to put a finer point on this if we compare the private LBO versus the public LBO scenario, we estimate that the private LBO, i.e. us selling at $28 today transfers $13 billion of value from today's shareholders to the buying consortium. Transfers. The value’s not getting created. It’s getting transferred if we allow a private LBO instead of the public LBO.
Now, we’d note the $28 takeout price is a 60% premium to the pre-deal price. Now, on its face all else equal 60% premium is a large premium. We don't think that’s the right way to look at it. We think you have to view the premium in the context of the share price that the premium is off of, and it’s a historically low share price. That $17.51 outside of the COVID period, right, outside of 2020, that is the lowest share price that this stock has traded on in its history.
And so, yes, it’s a big premium. Yes, it’s an above average premium, but it’s off of a stock price that was totally dislocated from the value of this business. I think it’s even clearer now how dislocated that $17.51 share price was. When you look at the debt financing that the private equity consortium was able to raise for this take private, right, the enterprise value back when the stock was $17.51 was $11.6 billion. The private equity consortium was able to raise $11.1 billion of debt financing, right?
In other words, 95% of the entire enterprise value of this business pre-deal was debt financeable. We can’t think of another business of this scale and quality for which that is true.
And so, we put all this together, we look at various forms, various ways intrinsic value, relative value, what all of those imply in terms of the value of Nielsen today, this is what we see, right? We don't see any numbers that start with at two or a three, right? They're all 40s to 50s to possibly $60 per share, and it’s in that context that we say and we continue to say that we believe Nielsen’s intrinsic value is well north of $40 per share and $28 isn’t even close.
Now even when we sensitize, right, so not just looking at the base case of 4% revenue growth, when we sensitize here and show the ranges which are 3% to 5% revenue growth you can see that $28 isn’t even close to the bottom end of these ranges, right? Not even close to our models when we assume 3% revenue growth. $28 is less than the 3% revenue growth case.
So that leads to the question what do you have to believe to view $28 as full price, as fair value? Of course, there’s an infinite number of iterations, different assumptions you can get to try to get to a $28 share price, but we’ll discuss here one that leads us to a $28 intrinsic value.
You have to believe we think 2% revenue growth beyond 2022, right, that’s revenue growth that may even be sub-inflation, right? So it might be negative real growth. You have to believe flat margins. You have to believe that management is wrong and that the CapEx intensity of this business does not decline to 7.5% of revenue. It stays higher than that despite under growing management to mid single-digit midterm targets, a 3 times leverage peg, and then no value from capital deployment.
Now we’d say we don't believe a single one of those assumptions is true. Not one, but you have to believe all of them to conclude that $28 is intrinsic value.
Now one of the common push backs we’ve gotten is, okay, if you fight this deal, what about the deal break, right? What about the risk the stock breaks back down to $18 per share, the pre or the unaffected deal price?
Look, we’d reiterate here if the business can support 7 times leverage in a public LBO it can support 5.5 times leverage or-- 7 times in a private LBO, it can support 5.5 times leverage in a public LBO, so that should be the fallback case. If there is no deal for whatever reason this business should pursue a public LBO. And what does that mean? That’s a 40% buyback or close to a 40% buyback at $28 per share. That should floor the stock by itself.
In addition the shareholders that don’t sell in to that buyback would get $4.40 distributed to them starting next year, which is a 16% yield on a $28 stock price. We don't think this business is going to trade at a 16% yield, and that yield grows, right?
Again, to us that leave us unconcerned that the stock is going to break below $28. And then there’s a credible path to $80 per share by 2025 as we’ve laid out. And the last thing we’d say on this and why we don't fear a deal break, why we don't fear this business being public and staying public and undergoing a public LBO is this is not a broken business, right?
David Kenny, the CEO, we think is an outstanding CEO. We think he’s exactly the right person to lead this company. He has a clear vision and one we believe is right with Nielsen ONE. And Linda Zukauckas, the CFO, has transformed the financial integrity of this business, right?
This business hit EBITDA and EPS guidance for 2020, and that guidance was provided pre-COVID, right? There just aren’t that many businesses that were able to navigate COVID and hit their pre-COVID profitability numbers, right, but this business did and we think it’s a testament to their leadership. It’s also a testament to the underlying quality of this business, right?
So we look at this and say this is not a broken business that’s in need of a savior. It’s a wonderful business that if in need of anything it’s in need of time, and being public or private doesn’t change how time works.
So I’ll close where we opened, emphasizing what we believe strongly to be true here. Nielsen has an unmatched ability to solve the hardest measurement problem in media, and when you solve a really difficult problem and you solve it at scale and you solve it uniquely that, to us, makes you a world class business.
We believe Nielsen has an intrinsic value of around $50 per share today in a status quo case, and there’s a credible path in a public LBO case for us to realize $80 of value within three years, right? 3x within three years. And $28 per share today doesn’t come even close to compensating us for the potential of this business.
We thank you for your time this morning, and we wish you all well. Goodbye.
Exhibit 3

Exhibit 4
| Item 4. | PURPOSE OF THE TRANSACTION |
Item 4 of the Schedule 13D is hereby amended and supplemented to add the following:
On April 26, 2022, WindAcre hosted an investor webcast to outline the business and valuation case for the Issuer and why it opposes the proposed acquisition of the Issuer by the Consortium for $28 per share (the "Webcast"). During the Webcast, Mr. Amin made a presentation with respect to the foregoing (the "Presentation"). The WindAcre Presentation and Webcast are available at the following website: https://event.on24.com/wcc/r/3763862/A9FF9B8E9397CE3F9CA44284EFB69E0D.
The foregoing summary of the Presentation is not intended to be complete and is qualified in its entirety by reference to the full text of the Presentation, which is filed herewith as Exhibit E and is incorporated herein by reference.
Exhibit 5
CERTAIN INFORMATION REGARDING THE PARTICIPANTS
The Participants (as defined below) intend to requisition a general meeting of shareholders of Nielsen Holdings plc ("Nielsen" or the "Company") to consider a special resolution aimed at restricting the ability of a controlling shareholder to cause the delisting of the Ordinary Shares (as defined below) from trading on the New York Stock Exchange and other proposals that may come before such general meeting and in connection therewith, file a definitive proxy statement and accompanying form of proxy card with the Securities and Exchange Commission (the "SEC") to be used in connection with the solicitation of proxies from the shareholders of Nielsen. THE PARTICIPANTS STRONGLY ADVISE ALL SHAREHOLDERS OF THE COMPANY TO READ THE PROXY STATEMENT AND OTHER PROXY MATERIALS AS THEY BECOME AVAILABLE BECAUSE THEY WILL CONTAIN IMPORTANT INFORMATION, INCLUDING ADDITIONAL INFORMATION RELATED TO THE PARTICIPANTS. SUCH PROXY MATERIALS WILL BE AVAILABLE AT NO CHARGE ON THE SEC'S WEBSITE AT HTTP://WWW.SEC.GOV. THE DEFINITIVE PROXY STATEMENT AND ACCOMPANYING PROXY CARD WILL BE FURNISHED TO SOME OR ALL OF THE COMPANY'S SHAREHOLDERS. IN ADDITION, THE PARTICIPANTS WILL PROVIDE COPIES OF THE DEFINITIVE PROXY STATEMENT WITHOUT CHARGE, WHEN AVAILABLE, UPON REQUEST.
The Participants in the proxy solicitation are anticipated to be (i) The WindAcre Partnership LLC, a Delaware limited liability company ("WindAcre"), (ii) The WindAcre Partnership Master Fund LP, an exempted limited partnership established in the Cayman Islands ("Master Fund"), (iii) Snehal Amin ("Mr. Amin"), (iv) Rachel Foley ("Ms. Foley"), and (v) Chris Smith ("Mr. Smith," together with WindAcre, Master Fund, Mr. Amin, and Ms. Foley, the "Participants").
As of the date hereof, the Participants beneficially own (within the meaning of Rule 13d-3 under the Securities Exchange Act of 1934), in the aggregate, 98,190,100 ordinary shares, par value €0.07 per share, of the Company (the "Ordinary Shares"), which are directly held by Master Fund and which are indirectly beneficially owned by WindAcre, the investment manager to Master Fund, and Mr. Amin, the managing member of WindAcre. Neither Ms. Foley nor Mr. Smith owns any Ordinary Shares.


