Exhibit 99.1

1 INVESTOR PRESENTATION August 2021 NYSE: VRTV © Veritiv 2021 | All Rights Reserved Exhibit 99.1

© Veritiv 2021 | All Rights Reserved Forward Looking Statements Certain statements contained in this presentation regarding Veritiv Corporation’s (the "Company") future operating results, p erf ormance, business plans, prospects, guidance, the 2020 Restructuring Plan and any other restructuring, statements related to the impact of COVID - 19 and any other statements not consti tuting historical fact are "forward - looking statements" subject to the safe harbor created by the Private Securities Litigation Reform Act of 1995. Where possible, the words "believ e," "expect," "anticipate," "continue," "intend," "should," "will," "would," "planned," "estimated," "potential," "goal," "outlook," "may," "predicts," "could," or the negative of such terms, o r o ther comparable expressions, as they relate to the Company or its business, have been used to identify such forward - looking statements. All forward - looking statements reflect only the Compan y’s current beliefs and assumptions with respect to future operating results, performance, business plans, prospects, guidance and other matters, and are based on information cu rre ntly available to the Company. Accordingly, the statements are subject to significant risks, uncertainties and contingencies, which could cause the Company’s actual operatin g r esults, performance, business plans, prospects or guidance to differ materially from those expressed in, or implied by, these statements. Factors that could cause actual results to differ materially from current expectations include risks and other factors descri bed under "Risk Factors" in our Annual Report on Form 10 - K and elsewhere in the Company's publicly available reports filed with the Securities and Exchange Commission ("SEC"), which co nta in a discussion of various factors that may affect the Company's business or financial results. Such risks and other factors, which in some instances are beyond the Company's contr ol, include: adverse impacts of the COVID - 19 pandemic; the industry - wide decline in demand for paper and related products; increased competition from existing and non - tradit ional sources; procurement and other risks in obtaining packaging, facility products and paper from our suppliers for resale to our customers; changes in prices for raw ma ter ials; changes in trade policies and regulations; increases in the cost of fuel and third - party freight and the availability of third - party freight providers; the loss of any of our significant customers; uncertainties as to the structure, timing, benefits and costs of the 2020 Restructuring Plan or any future restructuring plan that the Company may undertake; ad ver se developments in general business and economic conditions that could impair our ability to use net operating loss carryforwards and other deferred tax assets; our ability t o a dequately protect our material intellectual property and other proprietary rights, or to defend successfully against intellectual property infringement claims by third parties; our ability to attract, train and retain highly qualified employees; our pension and health care costs and participation in multi - employer pension, health and welfare plans; the effects of work stoppag es, union negotiations and labor disputes; our ability to generate sufficient cash to service our debt; increasing interest rates; our ability to refinance or restructure our debt on rea sonable terms and conditions as might be necessary from time to time; our ability to comply with the covenants contained in our debt agreements; costs to comply with laws, rules and re gulations, including environmental, health and safety laws, and to satisfy any liability or obligation imposed under such laws; changes in tax laws; adverse results from litigatio n, governmental investigations or audits, or tax - related proceedings or audits; regulatory changes and judicial rulings impacting our business; the impact of adverse developments in gen eral business and economic conditions as well as conditions in the global capital and credit markets on demand for our products and services, our business including our inter nat ional operations, and our customers; foreign currency fluctuations; inclement weather, widespread outbreak of an illness, anti - terrorism measures and other disruptions to our supply chain, distribution system and operations; our dependence on a variety of information technology and telecommunications systems and the Internet; our reliance on third - party v endors for various services; cybersecurity risks; and other events of which we are presently unaware or that we currently deem immaterial that may result in unexpected adverse ope rat ing results. The Company is not responsible for updating the information contained in this presentation beyond the published date, or for changes made to this presentation b y w ire services or Internet service providers. This presentation is being furnished to the SEC through a Form 8 - K. We reference non - GAAP financial measures in this presentation. Please see the appendix for reconciliations of non - GAAP measures to the most comparable United States ("U.S.") GAAP measures. 2

© Veritiv 2021 | All Rights Reserved 3 Who is Veritiv? Sal Abbate Chief Executive Officer: October 2020 Previous Veritiv Roles: • Chief Operating Officer: January 2020 • Chief Commercial Officer: April 2018 Previous Experience: • Andersen Windows, SVP Chief Sales & Marketing Officer 2011 – 2018 • Eastman Chemical (formerly Solutia), VP Global Sales & Marketing 2008 – 2011 New Leadership: 4Q 2020 Steve Smith Chief Financial Officer: March 2014 Investor Engagement Scott Palfreeman Director, Finance & Investor Relations: September 2020 Previous Experience: • American Greetings: Chief Financial Officer: 2006 – 2014; VP of Investor Relations and Treasurer: 2003 – 2006 • General Cable, Vice President and Treasurer: 1999 - 2003 New leadership team is aligned around commercial - led strategy

© Veritiv 2021 | All Rights Reserved Key Messages 4 3 4 1 5 Strategic Portfolio Transformation Investment in Growth Leader in Fragmented Industry & Commitment to ESG Earnings Expansion & Low Leverage Packaging mix shift from 55% to 75% of total Segment Adj. EBITDA since 2014 2Q21 LTM 2 Adj. EBITDA CAGR of 11% in Packaging since 2017; - Investments in organic growth - Disciplined approach to inorganic growth Largest in ~$ 45B total addressable packaging distribution market Diversified customer base Chief Sustainability Officer appointed in May 2021 2Q21 LTM 2 Adj. EBITDA CAGR of 10% overall since 2017 Net Leverage of 1.7x 1,3 ; improved from 4.6x in 2017 2 Inflection Point in Business Fundamentals Doubled Adj. EBITDA Margin 1 from 2% in 2017 to 4% in 2Q21 LTM 2 - Process optimization - Segment mix shift to Packaging - Packaging growth 1. See appendix for reconciliations of non - GAAP measures to the most comparable U.S. GAAP measures. 2. Last twelve months (LTM) as of June 30, 2021. 3. Calculated as net debt divided by trailing twelve months of Adjusted EBITDA, as of June 30, 2021.

© Veritiv 2021 | All Rights Reserved Company Overview NYSE: VRTV © Veritiv 2021 | All Rights Reserved
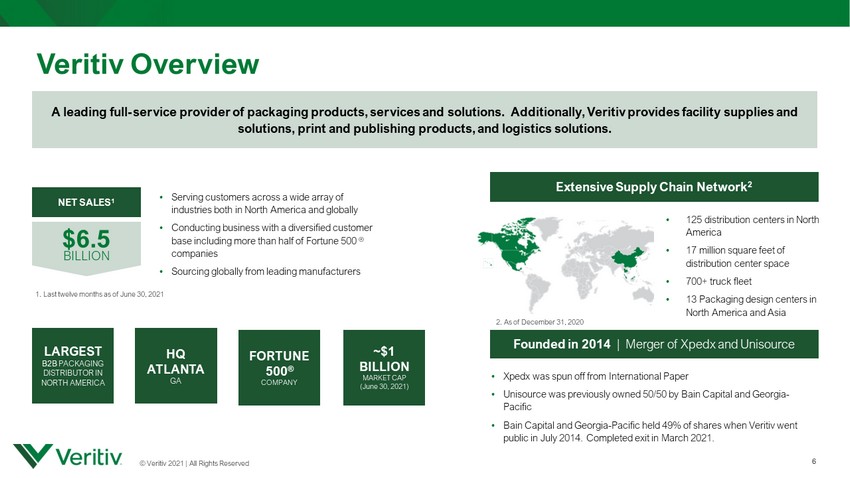
© Veritiv 2021 | All Rights Reserved • 125 distribution centers in North America • 17 million square feet of distribution center space • 700+ truck fleet • 13 Packaging design centers in North America and Asia 6 Veritiv Overview 6 NET SALES 1 $6.5 BILLION • Serving customers across a wide array of industries both in North America and globally • Conducting business with a diversified customer base including more than half of Fortune 500 ® companies • Sourcing globally from leading manufacturers Extensive Supply Chain Network 2 1. Last twelve months as of June 30, 2021 HQ ATLANTA GA LARGEST B2B PACKAGING DISTRIBUTOR IN NORTH AMERICA FORTUNE 500 ® COMPANY ~$1 BILLION MARKET CAP (June 30, 2021) • Xpedx was spun off from International Paper • Unisource was previously owned 50/50 by Bain Capital and Georgia - Pacific • Bain Capital and Georgia - Pacific held 49% of shares when Veritiv went public in July 2014. Completed exit in March 2021. Founded in 2014 | Merger of Xpedx and Unisource A leading full - service provider of packaging products, services and solutions. Additionally, Veritiv provides facility supplies and solutions, print and publishing products, and logistics solutions. 2. As of December 31, 2020
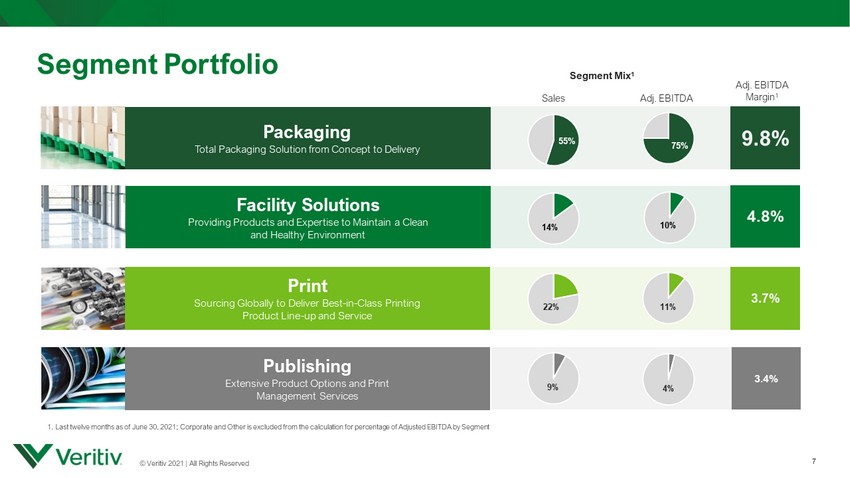
© Veritiv 2021 | All Rights Reserved Print Sourcing Globally to Deliver Best - in - Class Printing Product Line - up and Service Packaging Total Packaging Solution from Concept to Delivery Facility Solutions Providing Products and Expertise to Maintain a Clean and Healthy Environment Publishing Extensive Product Options and Print Management Services 7 Segment Portfolio 55% 75% Sales Adj. EBITDA Segment Mix 1 1. Last twelve months as of June 30, 2021; Corporate and Other is excluded from the calculation for percentage of Adjusted EB ITD A by Segment 14% 10% 22% 11% 9% 4% Adj. EBITDA Margin 1 9.8% 4.8% 3.7% 3.4%

© Veritiv 2021 | All Rights Reserved Leader in Fragmented Industry & Commitment to ESG NYSE: VRTV 1 © Veritiv 2021 | All Rights Reserved
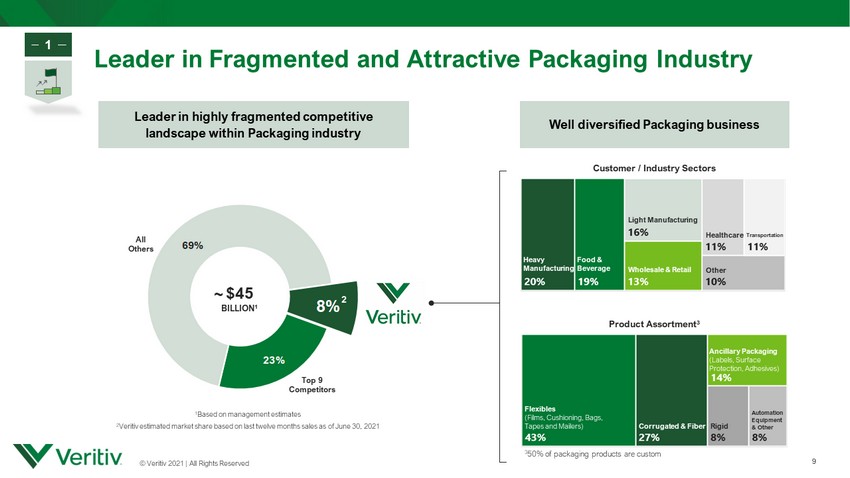
© Veritiv 2021 | All Rights Reserved 8% 23% 69% 8% Well diversified Packaging business Product Assortment 3 Leader in Fragmented and Attractive Packaging Industry 9 2 Top 9 Competitors Leader in highly fragmented competitive landscape within Packaging industry All Others Customer / Industry Sectors Heavy Manufacturing Food & Beverage Wholesale & Retail Light Manufacturing Other Transportation Healthcare Corrugated & Fiber Flexibles (Films, Cushioning, Bags, Tapes and Mailers) Ancillary Packaging (Labels, Surface Protection, Adhesives) Automation Equipment & Other Rigid 3 50% of packaging products are custom 1 Based on management estimates 2 Veritiv estimated market share based on last twelve months sales as of June 30, 2021 $45 BILLION 1 ~ 1

© Veritiv 2021 | All Rights Reserved Full - Service Packaging Solutions Provider Product Concept to Delivery 10 Value - Added Services 1 In - House Same - Day Delivery Capability Source Product from Leading and Niche Manufacturers Comprehensive Hub & Spoke Warehousing Footprint across North America International Sourcing Veritiv - Managed Supply Chain Product Design , Prototype & Structural Testing Contract Product Packaging , Inventory and Program Management Solutions Expertise for Quality, Economic Fit, and Sustainability 1 50% of packaging products are custom 1
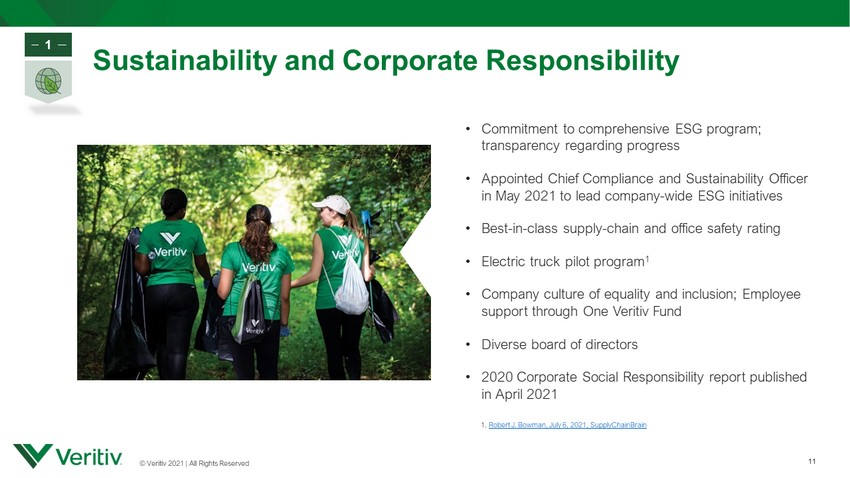
© Veritiv 2021 | All Rights Reserved • Commitment to comprehensive ESG program; transparency regarding progress • Appointed Chief Compliance and Sustainability Officer in May 2021 to lead company - wide ESG initiatives • Best - in - class supply - chain and office safety rating • Electric truck pilot program 1 • Company culture of equality and inclusion; Employee support through One Veritiv Fund • Diverse board of directors • 2020 Corporate Social Responsibility report published in April 2021 11 Sustainability and Corporate Responsibility 1. Robert J. Bowman, July 6, 2021, SupplyChainBrain 1

© Veritiv 2021 | All Rights Reserved 12 NYSE: VRTV Inflection Point in Business Fundamentals 2 © Veritiv 2021 | All Rights Reserved

© Veritiv 2021 | All Rights Reserved 7.0% 2.2% 2.4% 2.4% 7.1% 2.8% 2.0% 2.7% 9.0% 4.5% 2.3% 2.4% 9.8% 4.8% 3.7% 3.4% 0.0% 2.0% 4.0% 6.0% 8.0% 10.0% 12.0% Fundamental Changes to our Business 13 FY18 FY19 FY20 2Q21 LTM Packaging FY18 FY19 FY20 2Q21 LTM Facility Solutions FY18 FY19 FY20 2Q21 LTM Print FY18 FY19 FY20 2Q21 LTM Publishing • Centralized cost and price management • Commercial optimization • Strategic customer rationalization • Supply chain configuration alignment with long - term growth sectors • Supplier and product rationalization • De - risked and rationalized customer portfolio • Commercial optimization to align with secular decline in volume • Supply chain network consolidation (Print) Comprehensive optimization efforts drove enhanced Adjusted EBITDA margins across all our segments Segment Adj. EBITDA Margin 2

© Veritiv 2021 | All Rights Reserved Accelerated Earnings Potential 14 Inflection point in business fundamentals and segment portfolio transformation expected to drive long - term earnings growth and margin expansion Segment Mix Shift to Packaging Packaging Growth Business Process Optimization & Operational Changes Significant progress in 2020 - 2021 toward long - term earnings targets Historical 3 - 5 Year Target 1 2 3 1 2 3 2

© Veritiv 2021 | All Rights Reserved Strategic Portfolio Transformation NYSE: VRTV 3 © Veritiv 2021 | All Rights Reserved

© Veritiv 2021 | All Rights Reserved Print 11% Publishing 4% Packaging 75% Facility Solutions 10% Segment Mix Transformation Strategic Shift to Packaging FY 2014 1, 2 $154 MILLION $245 MILLION 1. Pro Forma 2. See appendix for reconciliations of non - GAAP measures to the most comparable U.S. GAAP measures; Corporate and Other is excluded from the calculation for percentage of Adjusted EBITDA by Segment. LTM 2Q21 2 Packaging 55% Facility Solutions 15% Print 20% 16 Print 20% Publishing 10% Packaging 55% Facility Solutions 15% ADJUSTED EBITDA BY SEGMENT Packaging 7 - Year Adj. EBITDA CAGR: +9% (11% Adj. EBITDA CAGR since 2017) Print & Publishing 30% Print & Publishing 15% 3 FY 2021 Adj. EBITDA Guidance: $270 - $ 290M
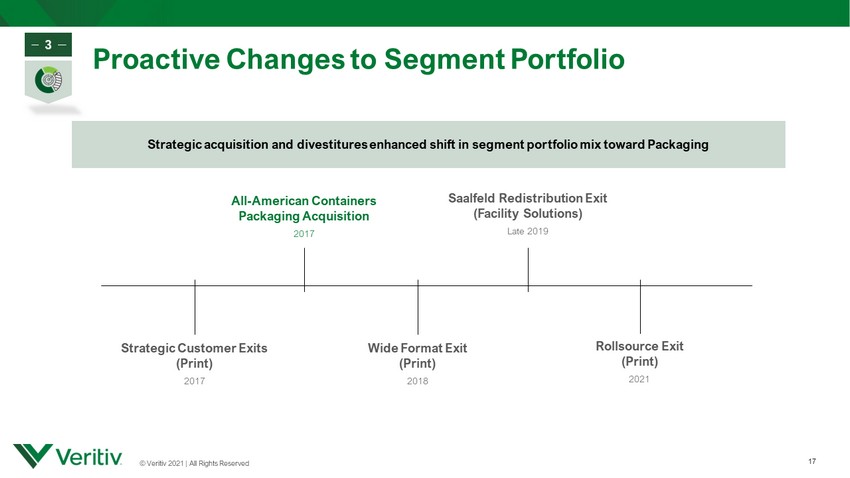
© Veritiv 2021 | All Rights Reserved Proactive Changes to Segment Portfolio 17 Strategic acquisition and divestitures enhanced shift in segment portfolio mix toward Packaging All - American Containers Packaging Acquisition 2017 Strategic Customer Exits (Print) 2017 Saalfeld Redistribution Exit (Facility Solutions) Late 2018 Rollsource Exit (Print) 2020 Wide Format Exit (Print) 2018 Saalfeld Redistribution Exit (Facility Solutions) Late 2019 Rollsource Exit (Print) 2021 3

© Veritiv 2021 | All Rights Reserved Invest in Growth NYSE: VRTV 4 © Veritiv 2021 | All Rights Reserved
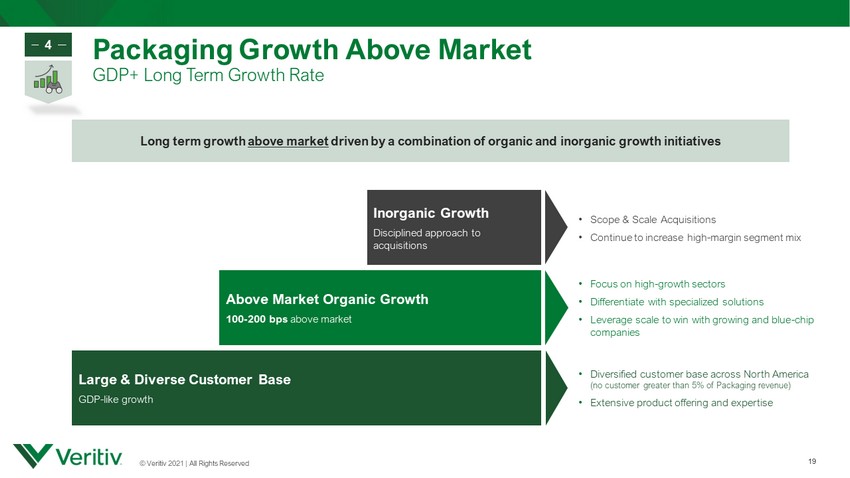
© Veritiv 2021 | All Rights Reserved Packaging Growth Above Market GDP+ Long Term Growth Rate 19 Above Market Organic Growth 100 - 200 bps above market Inorganic Growth Disciplined approach to acquisitions Large & Diverse Customer Base GDP - like growth • Scope & Scale Acquisitions • Continue to increase high - margin segment mix • Focus on high - growth sectors • Differentiate with specialized solutions • Leverage scale to win with growing and blue - chip companies • Diversified customer base across North America (no customer greater than 5% of Packaging revenue) • Extensive product offering and expertise Long term growth above market driven by a combination of organic and inorganic growth initiatives 4
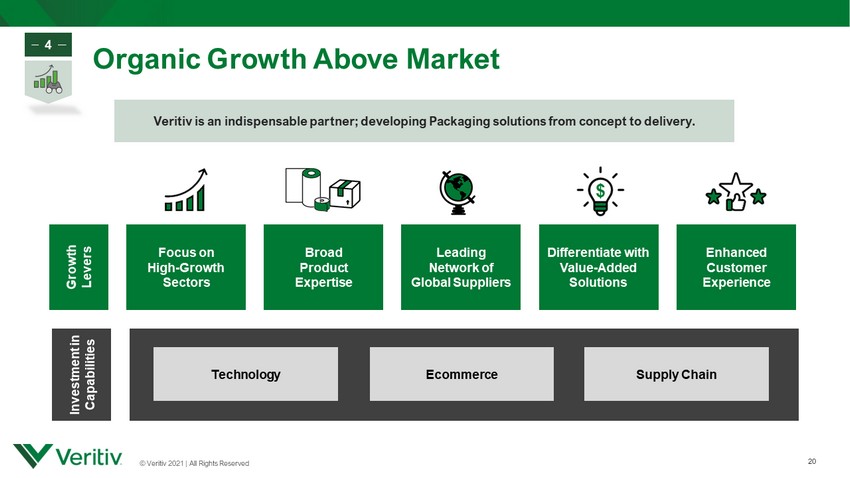
© Veritiv 2021 | All Rights Reserved Veritiv is an indispensable partner; developing Packaging solutions from concept to delivery. Organic Growth Above Market 20 Growth Levers Differentiate with Value - Added Solutions Focus on High - Growth Sectors Broad Product Expertise Enhanced Customer Experience $ Leading Network of Global Suppliers Supply Chain Technology Ecommerce Investment in Capabilities 4

© Veritiv 2021 | All Rights Reserved Inorganic Growth Objectives Disciplined Approach to Acquisitions Packaging 73% Print 11% Facility Solutions 11% Packaging 55% Print 20% 21 Acquisition Considerations : Targeted Financial Parameters : • EBITDA: $ 5M - $ 100M • EBITDA Margins > 10% Scope • Packaging goods & services: - Enhanced product offering - Unique service capability - Deep industry expertise - Proprietary technology Scale • Synergistic companies with similar product & service capabilities • Micro to Small - Cap 2017 Acquisition: All - American Containers Non - auction process, family - owned rigid packaging business 4

© Veritiv 2021 | All Rights Reserved Earnings Expansion & Low Leverage NYSE: VRTV 5 © Veritiv 2021 | All Rights Reserved

© Veritiv 2021 | All Rights Reserved $176M $185M $156M $188M $100M $150M $200M $250M $300M FY17 FY18 FY19 FY20 FY21E Adjusted EBITDA 1 Upward Revision to 2021 Earnings Guidance 1. See appendix for reconciliations of non - GAAP measures to the most comparable U.S. GAAP measures. 23 $270 - $ 290M ($0.85) ($0.99) ($1.84) $2.08 ($2.00) $1.00 $4.00 $7.00 FY17 FY18 FY19 FY20 FY21E Diluted EPS $6.25 – $7.50 Adjusted EBITDA and EPS growth in 2020 despite COVID - related headwinds; accelerated earnings growth in 2021 5
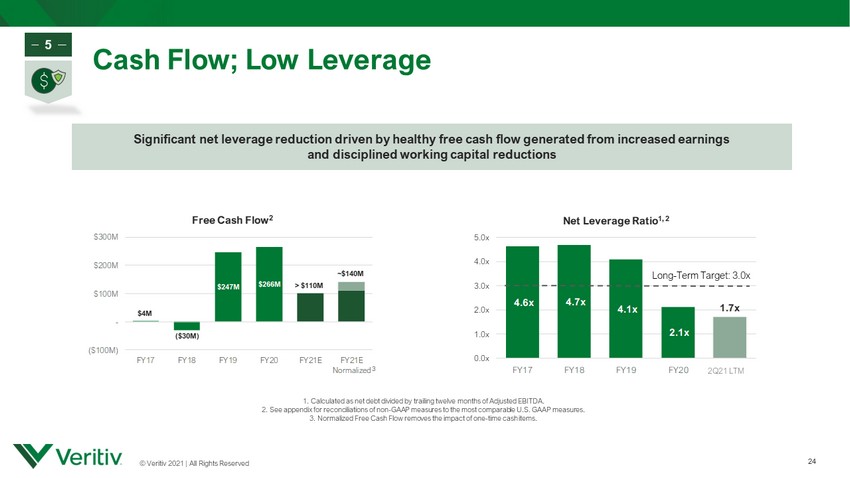
© Veritiv 2021 | All Rights Reserved 4.6x 4.7x 4.1x 2.1x 1.7x 0.0x 1.0x 2.0x 3.0x 4.0x 5.0x FY17 FY18 FY19 FY20 FY21E Net Leverage Ratio 1, 2 Cash Flow; Low Leverage 24 Long - Term Target: 3.0x $4M ($30M) $247M $266M > $110M ~$140M ($100M) - $100M $200M $300M FY17 FY18 FY19 FY20 FY21E FY21E Normalized Free Cash Flow 2 Significant net leverage reduction driven by healthy free cash flow generated from increased earnings and disciplined working capital reductions 2Q21 LTM 5 1. Calculated as net debt divided by trailing twelve months of Adjusted EBITDA. 2 . See appendix for reconciliations of non - GAAP measures to the most comparable U.S. GAAP measures. 3. Normalized Free Cash Flow removes the impact of one - time cash items. 3
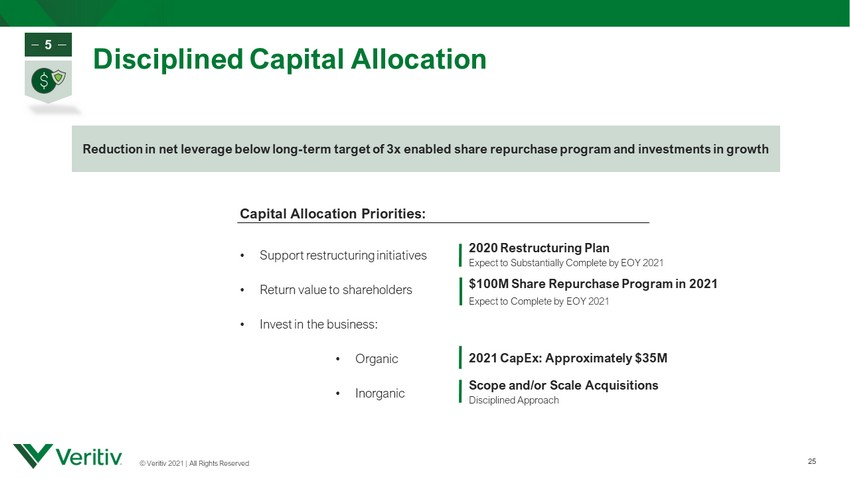
© Veritiv 2021 | All Rights Reserved Disciplined Capital Allocation 25 Reduction in net leverage below long - term target of 3x enabled share repurchase program and investments in growth 5 Capital Allocation Priorities: • Support restructuring initiatives • Return value to shareholders • Invest in the business: • Organic • Inorganic 2021 CapEx : Approximately $35M 2020 Restructuring Plan Expect to Substantially Complete by EOY 2021 $ 100M Share Repurchase Program in 2021 Expect to Complete by EOY 2021 Scope and/or Scale Acquisitions Disciplined Approach
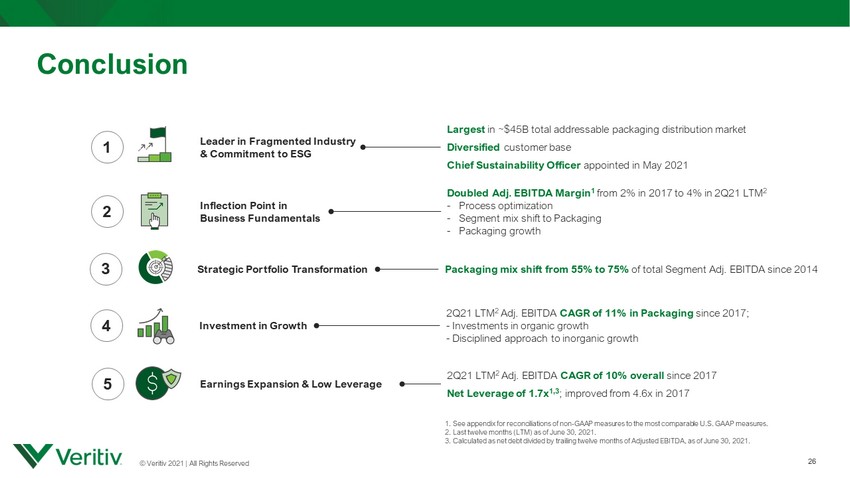
© Veritiv 2021 | All Rights Reserved Conclusion 26 3 4 1 5 Strategic Portfolio Transformation Investment in Growth Leader in Fragmented Industry & Commitment to ESG Earnings Expansion & Low Leverage Packaging mix shift from 55% to 75% of total Segment Adj. EBITDA since 2014 2Q21 LTM 2 Adj. EBITDA CAGR of 11% in Packaging since 2017; - Investments in organic growth - Disciplined approach to inorganic growth Largest in ~$ 45B total addressable packaging distribution market Diversified customer base Chief Sustainability Officer appointed in May 2021 2Q21 LTM 2 Adj. EBITDA CAGR of 10% overall since 2017 Net Leverage of 1.7x 1,3 ; improved from 4.6x in 2017 2 Inflection Point in Business Fundamentals Doubled Adj. EBITDA Margin 1 from 2% in 2017 to 4% in 2Q21 LTM 2 - Process optimization - Segment mix shift to Packaging - Packaging growth 1. See appendix for reconciliations of non - GAAP measures to the most comparable U.S. GAAP measures. 2. Last twelve months (LTM) as of June 30, 2021. 3. Calculated as net debt divided by trailing twelve months of Adjusted EBITDA, as of June 30, 2021.

© Veritiv 2021 | All Rights Reserved 27 APPENDIX NYSE: VRTV © Veritiv 2021 | All Rights Reserved

© Veritiv 2021 | All Rights Reserved Appendix Reconciliation of Non - GAAP Financial Measures We supplement our financial information prepared in accordance with U.S. GAAP with certain non - GAAP measures including Adjusted EBITDA (earnings before interest, income taxes, depreciation and amortization, restructuring charges, net, integration and acquisition expenses and other simil ar charges including any severance costs, costs associated with warehouse and office openings or closings, consolidation, and relocation and other business optimization expe nse s, stock - based compensation expense, changes in the LIFO reserve, non - restructuring asset impairment charges, non - restructuring severance charges, non - restructuring pension charges, net, fair value adjustments related to contingent liabilities assumed in mergers and acquisitions and certain other adjustments), free cash f low and other non - GAAP measures such as the Net Debt to Adjusted EBITDA ratio. We believe investors commonly use Adjusted EBITDA, free cash flow and these other non - GAAP me asures as key financial metrics for valuing companies. In addition, the credit agreement governing our Asset - Based Lending Facility (the "ABL Facility") permits us to exclude the foregoing and other charges in calculating "Consolidated EBITDA", as defined in the ABL Facility. Adjusted EBITDA, free cash flow and these other non - GAAP measures are not alternative measures of financial performance or liqui dity under U.S. GAAP. Non - GAAP measures do not have definitions under U.S. GAAP and may be defined differently by, and not be comparable to, similarly title d m easures used by other companies. As a result, we consider and evaluate non - GAAP measures in connection with a review of the most directly comparable measure calculate d in accordance with U.S. GAAP. We caution investors not to place undue reliance on such non - GAAP measures and to consider them with the most directly comparable U .S. GAAP measures. Adjusted EBITDA, free cash flow and these other non - GAAP measures have limitations as analytical tools and should not be considered in isolation or as a substitute for analyzing our results as reported under U.S. GAAP. Please see the following tables for reconciliations of non - GAAP measures to the most comparable U.S. G AAP measures. 28
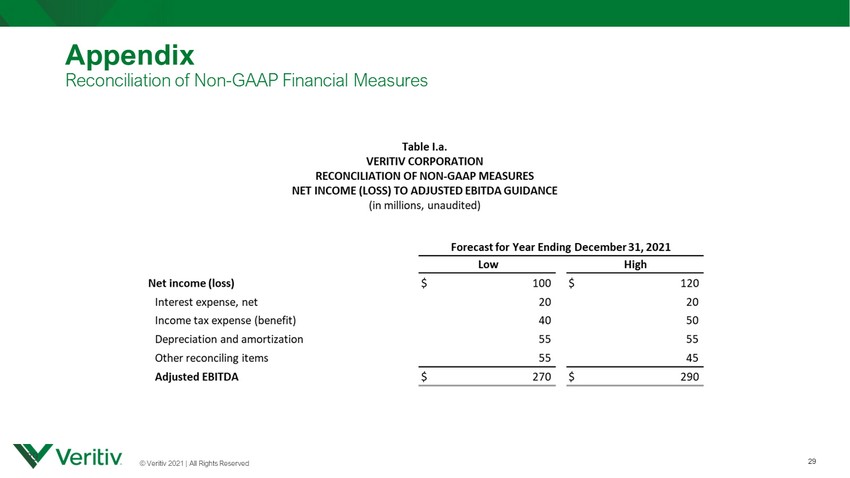
© Veritiv 2021 | All Rights Reserved 29 Appendix Reconciliation of Non - GAAP Financial Measures 29

© Veritiv 2021 | All Rights Reserved 30 Appendix Reconciliation of Non - GAAP Financial Measures 2020 2019 2018 2017 Veritiv As Reported Pro Forma Adjustments Veritiv Pro Forma Net income (loss) 34.2$ (29.5)$ (15.7)$ (13.3)$ (19.6)$ $ (16.2) $ (35.8) Interest expense, net 25.1 38.1 42.3 31.2 14.0 12.4 26.4 Income tax expense (benefit) 8.8 0.7 5.5 11.4 (2.1) 6.8 4.7 Depreciation and amortization 57.7 53.5 53.5 54.2 37.6 16.8 54.4 EBITDA 125.8 62.8 85.6 83.5 29.9 19.8 49.7 Restructuring charges, net 52.2 28.8 21.3 16.7 4.0 0.2 4.2 Facility closure charges, including (gain) loss from asset disposition (3.7) - - - - - - Stock-based compensation 17.7 14.6 18.1 15.7 4.0 0.1 4.1 LIFO reserve (decrease) increase (1.5) (3.7) 19.9 7.1 6.3 1.3 7.6 Non-restructuring asset impairment charges - - 0.4 8.4 - - - Non-restructuring severance charges 4.1 8.4 4.9 3.5 2.6 0.4 3.0 Non-restructuring pension charges, net 7.2 6.6 11.3 2.2 - - - Gain on sale of joint venture - - - - - (6.6) (6.6) Integration, acquisition and merger expenses - 17.5 31.8 36.5 75.1 14.1 89.2 Fair value adjustment on Tax Receivable Agreement contingent liability (19.1) 0.3 (1.2) (9.4) 1.7 - 1.7 Fair value adjustment on contingent consideration liability 1.0 13.1 (12.3) 2.0 - - - Escheat audit contingent liability (0.2) 3.7 2.5 7.5 - - - Other 4.1 3.8 3.1 2.7 (1.7) 2.3 0.6 Loss from discontinued operations, net of income taxes - - - - 0.1 - 0.1 Adjusted EBITDA 187.6$ 155.9$ 185.4$ 176.4$ 122.0$ 31.6$ 153.6$ Net Sales 6,345.6$ 7,659.4$ 8,696.2$ 8,364.7$ 7,406.5$ 1,907.6$ $ 9,314.1 Adjusted EBITDA/Pro Forma Adjusted EBITDA as a % of net sales 3.0% 2.0% 2.1% 2.1% 1.6% 1.6% Year Ended December 31, 2014 * Pro forma adjustments take into account the merger with UWW Holdings, Inc. and the related financing as if they occurred on January 1, 2014, as well as purchase accounting adjustments and adjustments for one-time costs related to the merger. Table l.b VERITIV CORPORATION RECONCILIATION OF NON-GAAP MEASURES NET INCOME (LOSS) TO ADJUSTED EBITDA; ADJUSTED EBITDA MARGIN (in millions, unaudited) Year Ended December 31, 30

© Veritiv 2021 | All Rights Reserved 31 Appendix Reconciliation of Non - GAAP Financial Measures 31 Forecast for Year Ending December 31, 2021 Net cash provided by (used for) operating activities at least $145 Less: Capital expenditures (35) Free cash flow at least $110 Add: Restructuring cash outlay 30 Normalized free cash flow at least $140 VERITIV CORPORATION Table II.a 2021 NORMALIZED FREE CASH FLOW GUIDANCE RECONCILIATION OF NON-GAAP MEASURES (in millions, unaudited)

© Veritiv 2021 | All Rights Reserved 32 Appendix Reconciliation of Non - GAAP Financial Measures VERITIV CORPORATION RECONCILIATION OF NON-GAAP MEASURES FREE CASH FLOW (in millions, unaudited) 2020 2019 2018 2017 Net cash flows provided by operating activities 289.2$ 281.0$ 15.0$ 36.6$ Less: Capital expenditures (23.6) (34.1) (45.4) (32.5) Free cash flow 265.6$ 246.9$ (30.4)$ 4.1$ Table ll.b Year Ended December 31, 32
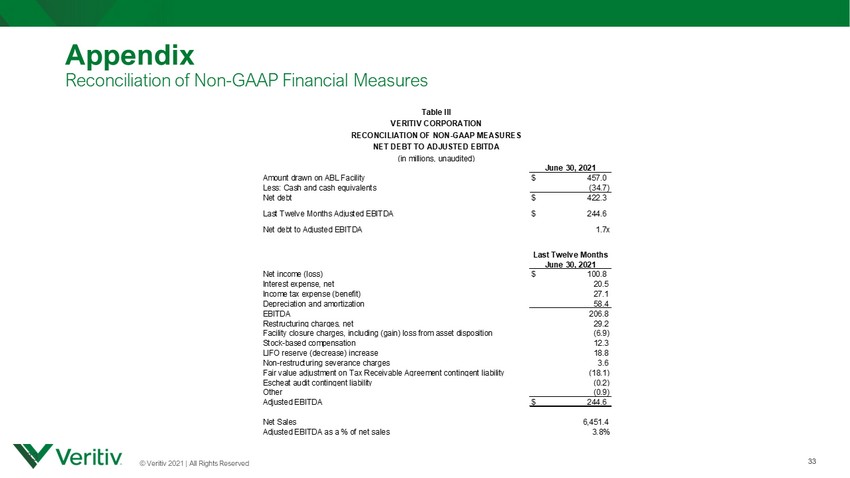
© Veritiv 2021 | All Rights Reserved 33 Appendix Reconciliation of Non - GAAP Financial Measures 33 June 30, 2021 Amount drawn on ABL Facility $ 457.0 Less: Cash and cash equivalents (34.7) Net debt $ 422.3 Last Twelve Months Adjusted EBITDA $ 244.6 Net debt to Adjusted EBITDA 1.7x Last Twelve Months June 30, 2021 Net income (loss) $ 100.8 Interest expense, net 20.5 Income tax expense (benefit) 27.1 Depreciation and amortization 58.4 EBITDA 206.8 Restructuring charges, net 29.2 Facility closure charges, including (gain) loss from asset disposition (6.9) Stock-based compensation 12.3 LIFO reserve (decrease) increase 18.8 Non-restructuring severance charges 3.6 Fair value adjustment on Tax Receivable Agreement contingent liability (18.1) Escheat audit contingent liability (0.2) Other (0.9) Adjusted EBITDA $ 244.6 Net Sales 6,451.4 Adjusted EBITDA as a % of net sales 3.8% VERITIV CORPORATION Table III NET DEBT TO ADJUSTED EBITDA RECONCILIATION OF NON-GAAP MEASURES (in millions, unaudited)
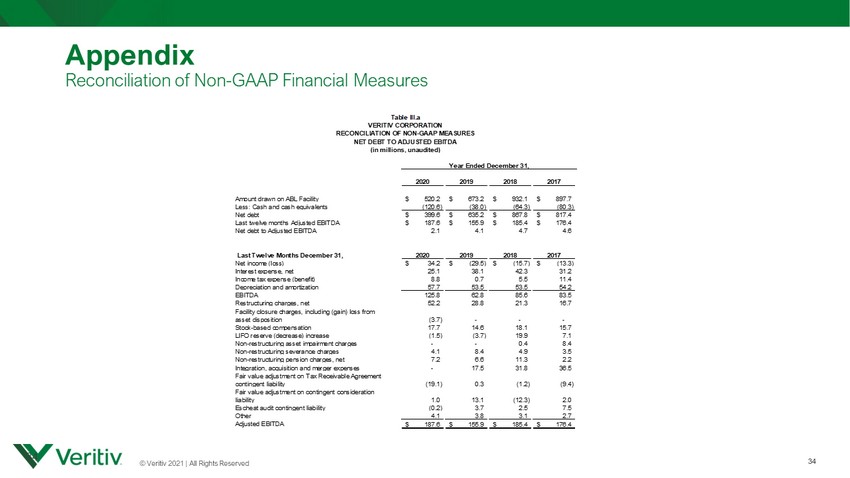
© Veritiv 2021 | All Rights Reserved 34 Appendix Reconciliation of Non - GAAP Financial Measures 2020 2019 2018 2017 Amount drawn on ABL Facility 520.2$ 673.2$ 932.1$ 897.7$ Less: Cash and cash equivalents (120.6) (38.0) (64.3) (80.3) Net debt 399.6$ 635.2$ 867.8$ 817.4$ Last twelve months Adjusted EBITDA 187.6$ 155.9$ 185.4$ 176.4$ Net debt to Adjusted EBITDA 2.1 4.1 4.7 4.6 Last Twelve Months December 31, 2020 2019 2018 2017 Net income (loss) 34.2$ (29.5)$ (15.7)$ (13.3)$ Interest expense, net 25.1 38.1 42.3 31.2 Income tax expense (benefit) 8.8 0.7 5.5 11.4 Depreciation and amortization 57.7 53.5 53.5 54.2 EBITDA 125.8 62.8 85.6 83.5 Restructuring charges, net 52.2 28.8 21.3 16.7 Facility closure charges, including (gain) loss from asset disposition (3.7) - - - Stock-based compensation 17.7 14.6 18.1 15.7 LIFO reserve (decrease) increase (1.5) (3.7) 19.9 7.1 Non-restructuring asset impairment charges - - 0.4 8.4 Non-restructuring severance charges 4.1 8.4 4.9 3.5 Non-restructuring pension charges, net 7.2 6.6 11.3 2.2 Integration, acquisition and merger expenses - 17.5 31.8 36.5 Fair value adjustment on Tax Receivable Agreement contingent liability (19.1) 0.3 (1.2) (9.4) Fair value adjustment on contingent consideration liability 1.0 13.1 (12.3) 2.0 Escheat audit contingent liability (0.2) 3.7 2.5 7.5 Other 4.1 3.8 3.1 2.7 Adjusted EBITDA 187.6$ 155.9$ 185.4$ 176.4$ Table lll.a VERITIV CORPORATION RECONCILIATION OF NON-GAAP MEASURES NET DEBT TO ADJUSTED EBITDA (in millions, unaudited) Year Ended December 31, 34

INVESTOR PRESENTATION 35 August 2021 NYSE: VRTV © Veritiv 2021 | All Rights Reserved