
1 THIRD QUARTER 2021 FINANCIAL RESULTS November 3, 2021 (UNAUDITED) Exhibit 99.2

2 SCOTT PALFREEMAN Director of Finance and Investor Relations SCOTT PALFREEMAN Director of Finance and Investor Relations

3 Safe Harbor Provision Certain statements contained in this presentation regarding Veritiv Corporation’s (the "Company") future operating results, performance, business plans, prospects, guidance, the 2020 Restructuring Plan and any other restructuring, statements related to the impact of COVID-19 and any other statements not constituting historical fact are "forward-looking statements" subject to the safe harbor created by the Private Securities Litigation Reform Act of 1995. Where possible, the words "believe,""expect," "anticipate," "continue," "intend," "should," "will," "would," "planned," "estimated," "potential," "goal," "outlook," "may," "predicts," "could," or the negative of such terms, or other comparable expressions, as they relate to the Company or its business, have been used to identify such forward-looking statements. All forward-looking statements reflect only the Company’s current beliefs and assumptions with respect to future operating results, performance, business plans, prospects, guidance and other matters, and are based on information currently available to the Company. Accordingly, the statements are subject to significant risks, uncertainties and contingencies, which could cause the Company’s actual operating results, performance, business plans, prospects or guidance to differ materially from those expressed in, or implied by, these statements. Factors that could cause actual results to differ materially from current expectations include risks and other factors describedunder "Risk Factors" and elsewhere in our Annual Report on Form 10-K and elsewhere in the Company's publicly available reports filed with the Securities and Exchange Commission ("SEC"), which contain a discussion of various factors that may affect the Company's business or financial results. Such risks and other factors, which in some instances are beyond the Company's control, include: adverse impacts of the COVID-19 pandemic; the industry-wide decline in demand for paper and related products; increased competition from existing and non-traditional sources; procurement and other risks in obtaining packaging, facility products and paper from our suppliers for resale to our customers; changes in prices for raw materials; changes in trade policies and regulations; increases in the cost of fuel and third-party freight and the availability of third-party freight providers; the loss of any of our significant customers; uncertainties as to the structure, timing, benefits and costs of the 2020 Restructuring Plan or any future restructuring plan that the Company may undertake; adverse developments in general business and economic conditions that could impair our ability to use net operating loss carryforwards and other deferred tax assets; our ability to adequately protect our material intellectual property and other proprietary rights, or to defend successfully against intellectual property infringement claims by third parties; our abilitytoattract, train and retain highly qualified employees; our pension and health care costs and participation in multi-employer pension, health and welfare plans; the effects of work stoppages, union negotiations and labor disputes; our ability to generate sufficient cash to service our debt; increasing interest rates; our ability to refinance or restructure our debt on reasonable terms and conditions as might be necessary from time to time; our ability to comply with the covenants contained in our debt agreements; costs to comply with laws, rules andregulations, including environmental, health and safety laws, and to satisfy any liability or obligation imposed under such laws; changes in tax laws; adverse results from litigation, governmental investigations or audits, or tax-related proceedings or audits; regulatory changes and judicial rulings impacting our business; the impact of adverse developments in general business and economic conditions as well as conditions in the global capital and credit markets on demand for our products and services, our business including our international operations, and our customers; foreign currency fluctuations; inclement weather, widespread outbreak of an illness, anti-terrorism measures and other disruptions to our supply chain, distribution system and operations; our dependence on a variety of information technology and telecommunications systems and the Internet; our reliance on third-party vendors for various services; cybersecurity risks; and other events of which we are presently unaware or that we currently deem immaterial that may result in unexpected adverse operating results. The Company is not responsible for updating the information contained in this presentation beyond the published date, or for changes made to this presentation by wire services or Internet service providers. This presentation is being furnished to the SEC through a Form 8-K. The Company’s Quarterly Report on Form 10-Q for the period ended September 30, 2021 to be filed with the SEC may contain updates to the information included in this presentation. We reference non-GAAP financial measures in this presentation. Please see the appendix for reconciliations of non-GAAP measuresto the most comparable United States ("U.S.") GAAP measures.

SAL ABBATE Chief Executive Officer

Financial Results Third Quarter 2021 Compared to Prior Year 5 1. Please see the appendix for reconciliations ofnon-GAAP measures to the most comparableU.S.GAAP measures. Strong Packaging sales growth, improving sales trends in our other segments and operational efficiencies drove record earnings in the third quarter NET SALES NET INCOME DILUTED EPS ADJ. EBITDA 1 ADJ. EBITDA MARGIN 1 $1.8B $40.0M $2.54 $93.7M 5.3% +11.1% +89.6% +95.4% +87.8% +220 bps UP $0.2B UP $18.9M UP $1.24 UP $43.8M FROM 3.1%
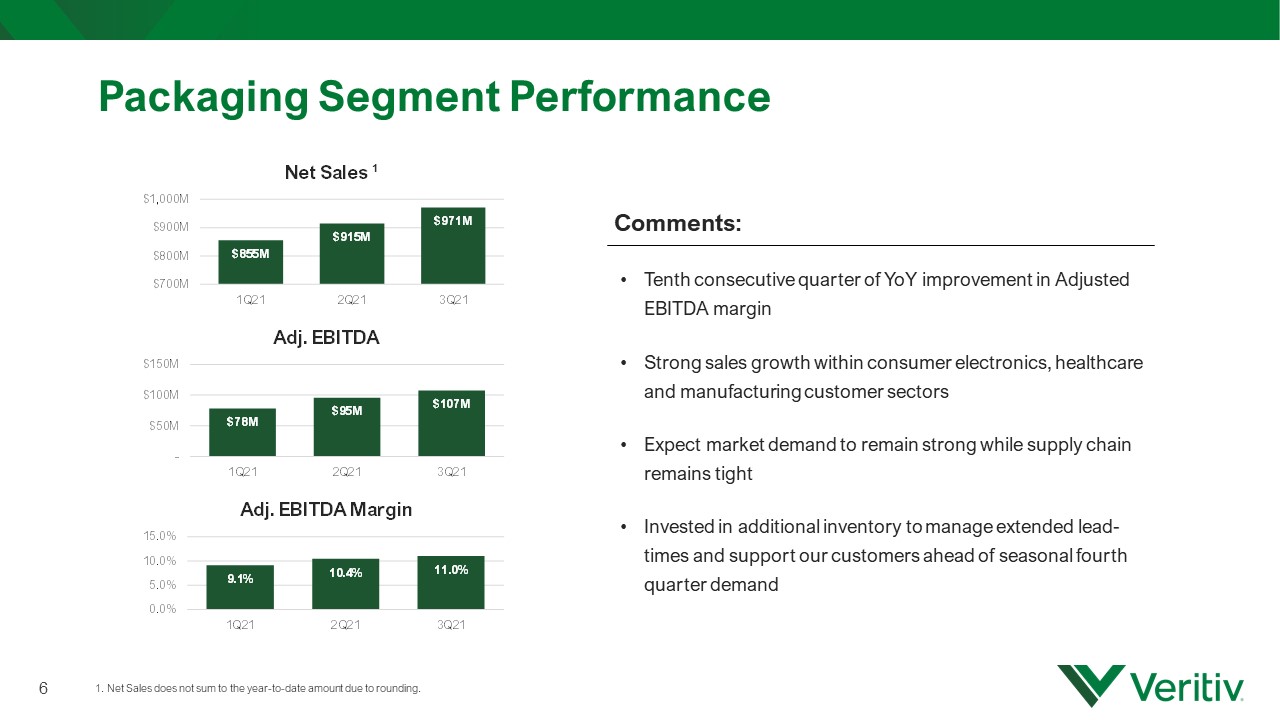
$855M $915M $971M $700M $800M $900M $1,000M 1Q21 2Q21 3Q21 Net Sales $78M $95M $107M - $50M $100M $150M 1Q21 2Q21 3Q21 Adj. EBITDA 9.1% 10.4% 11.0% 0.0% 5.0% 10.0% 15.0% 1Q21 2Q21 3Q21 Adj. EBITDA Margin Packaging Segment Performance 6 Comments: • Tenth consecutive quarter of YoY improvement in Adjusted EBITDA margin • Strong sales growth within heavy manufacturing, consumer electronics, and healthcare customer sectors • Expect market demand to remain strong while supply chain remains tight • Invested in additional inventory to manage extended lead- times and support our customers ahead of seasonal fourth quarter demand 1. Net Sales does not sum to the year-to-date amount due to rounding. 1
7 Business Update Comments: • Inflationary market price increases across product portfolio continued throughout third quarter • Pass-through of market price increases managed effectively and with proper notice • Continued demand and constrained supply expected to support prices at current levels • Wage inflation consistent with broader market and supply chain challenges

STEVE SMITH Chief Financial Officer

3Q 2021 Adj. EBITDA Adj. EBITDA % of Net Sales Change from PY Change from PY $107M 11.0% +24.6% +90 bps $13M 5.8% +2.3% +10 bps $27M 6.9% +202.3% +450 bps $4M 2.6% +11.4% -30 bps Corporate & Other ($57M) $94M 5.3% +87.8% +220 bps Packaging Facility Solutions Print Publishing Veritiv Consolidated Segment and Consolidated Financial Results Third Quarter 2021 1. Please see the appendix for reconciliations ofnon-GAAP measures to the most comparableU.S.GAAP measures. 1 9
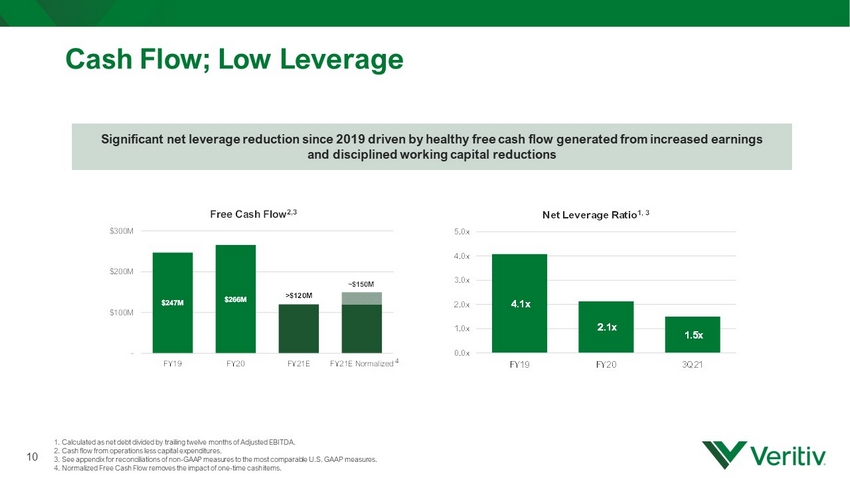
$247M $266M >$120M ~$150M - $100M $200M $300M FY19 FY20 FY21E FY21E Normalized Free Cash Flow 2,3 4.1x 2.1x 1.5x 0.0x 1.0x 2.0x 3.0x 4.0x 5.0x FY19 FY20 3Q21 Net Leverage Ratio 1, 3 Cash Flow; Low Leverage 1. Calculated as net debt divided by trailing twelve months of Adjusted EBITDA. 2. Cash flow from operations less capital expenditures. 3. See appendix for reconciliations ofnon-GAAP measuresto the most comparable U.S. GAAP measures. 4. Normalized Free Cash Flow removes the impact of one-time cash items. Significant net leverage reduction since 2019 driven by healthy free cash flow generated from increased earnings and disciplined working capital reductions 10 4

Capital Allocation Capital Allocation Priorities: • Invest in the business: • Organic • Inorganic • Return value to shareholders • Support restructuring initiatives 2021 CapEx: Approximately $25M 2020 Restructuring Plan Expect to be substantially completed by EOY 2021 $100MShare Repurchase Program in 2021 Completed in 3Q 2021 Reduction in net leverage enabled successful completion of share repurchase program and investments in growth Scope and/or Scale Acquisitions Disciplined Approach 11

SAL ABBATE Chief Executive Officer

Comments: • Increasing Adjusted EBITDA, net income and EPS guidance. • Expect Packaging demand to continue in the fourth quarter. Expect implemented and announced supplier-driven price increases to hold for the remainder of the year. • Expect free cash flow guidance to be higher than original guidance due to an increase in earnings. • Now expect capital expenditures to be lower due to market-related project delays. Revised Outlook Full Year 2021 1. Please see the appendix for reconciliations ofnon-GAAP measures to the most comparableU.S.GAAP measures. 2. Cash flow from operations less capital expenditures. Net Income $130 -$145 Million (estimated 26-28% effective tax rate) Diluted Earnings per Share $8.00 -$9.00 (approximately 16.1 million shares) Adjusted EBITDA 1 $315 –$330 Million Free Cash Flow 1,2 At least $120 Million Capital Expenditures Approximately $25 Million 13

Questions 14

15 SAL ABBATE Chief Executive Officer

Appendix Reconciliation of Non-GAAP Financial Measures We supplement our financial information prepared in accordance with U.S. GAAP with certain non-GAAP measures including Adjusted EBITDA (earnings before interest, income taxes, depreciation and amortization, restructuring charges, net, integration and acquisition expenses and other similar charges including any severance costs, costs associated with warehouse and office openings or closings, consolidation, and relocation and other business optimization expenses, stock-based compensation expense, changes in the LIFO reserve, non-restructuring asset impairment charges, non-restructuring severance charges, non- restructuring pension charges, net, fair value adjustments related to contingent liabilities assumed in mergers and acquisitionsand certain other adjustments), free cash flow and other non-GAAP measures such as the Net Debt to Adjusted EBITDA ratio. We believe investors commonly use Adjusted EBITDA, free cash flow and these other non-GAAP measures as key financial metrics for valuing companies. In addition, the credit agreement governing our Asset-Based Lending Facility (the "ABLFacility") permits us to exclude the foregoing and other charges in calculating "Consolidated EBITDA", as defined in the ABLFacility. We approximate foreign currency effects by applying the foreign currency exchange rate for the prior period to the local currency results for the current period. Adjusted EBITDA, free cash flow and these other non-GAAP measures are not alternative measures of financial performance or liquidity under U.S. GAAP. Non- GAAP measures do not have definitions under U.S. GAAP and may be defined differently by, and not be comparable to, similarly titled measures used by other companies. As a result, we consider and evaluate non-GAAP measures in connection with a review of the most directly comparable measure calculated in accordance with U.S. GAAP. We caution investors not to place undue reliance on such non-GAAP measures and to consider them with the most directly comparable U.S. GAAP measures. Adjusted EBITDA, free cash flow and these other non-GAAP measures have limitations as analytical tools and should not be considered in isolation or as a substitute for analyzing our results as reported under U.S. GAAP. Please see the following tables for reconciliations of non-GAAP measures to the most comparable U.S. GAAP measures. 16
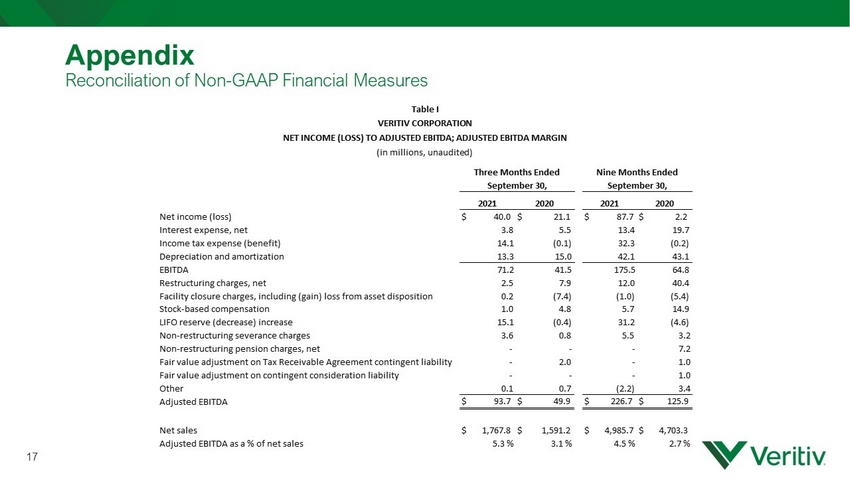
Appendix Reconciliation of Non-GAAP Financial Measures 17 2021 2020 2021 2020 Net income (loss) $ 40.0 $ 21.1 $ 87.7 $ 2.2 Interest expense, net 3.8 5.5 13.4 19.7 Income tax expense (benefit) 14.1 (0.1) 32.3 (0.2) Depreciation and amortization 13.3 15.0 42.1 43.1 EBITDA 71.2 41.5 175.5 64.8 Restructuring charges, net 2.5 7.9 12.0 40.4 Facility closure charges, including (gain) loss from asset disposition 0.2 (7.4) (1.0) (5.4) Stock-based compensation 1.0 4.8 5.7 14.9 LIFO reserve (decrease) increase 15.1 (0.4) 31.2 (4.6) Non-restructuring severance charges 3.6 0.8 5.5 3.2 Non-restructuring pension charges, net - - - 7.2 Fair value adjustment on Tax Receivable Agreement contingent liability - 2.0 - 1.0 Fair value adjustment on contingent consideration liability - - - 1.0 Other 0.1 0.7 (2.2) 3.4 Adjusted EBITDA $ 93.7 $ 49.9 $ 226.7 $ 125.9 Net sales $ 1,767.8 $ 1,591.2 $ 4,985.7 $ 4,703.3 Adjusted EBITDA as a % of net sales 5.3 % 3.1 % 4.5 % 2.7 % Three Months Ended September 30, Nine Months Ended September 30, Table I VERITIV CORPORATION NET INCOME (LOSS) TO ADJUSTED EBITDA; ADJUSTED EBITDA MARGIN (in millions, unaudited)

18 Appendix Reconciliation of Non-GAAP Financial Measures Low High Net income (loss) $ 130 $ 145 Interest expense, net 20 20 Income tax expense (benefit) 50 55 Depreciation and amortization 55 55 Other reconciling items 60 55 Adjusted EBITDA $ 315 $ 330 Forecast for Year Ending December 31, 2021 Table I.a. VERITIV CORPORATION NET INCOME (LOSS) TO ADJUSTED EBITDA GUIDANCE (in millions, unaudited)

19 Appendix Reconciliation of Non-GAAP Financial Measures Three Months Ended September 30, 2021 Nine Months Ended September 30, 2021 Net cash provided by (used for) operating activities $ 41.5 $ 91.6 Less: Capital expenditures (5.0) (14.1) Free cash flow $ 36.5 $ 77.5 Table II VERITIV CORPORATION FREE CASH FLOW (in millions, unaudited)
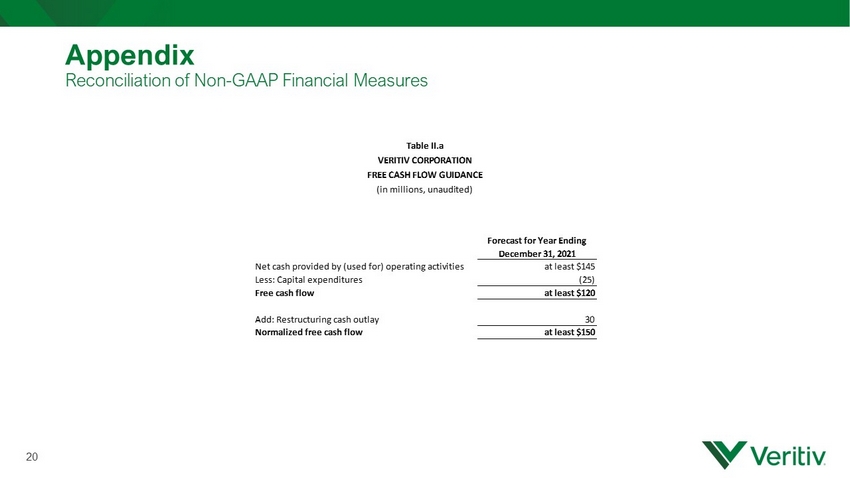
20 Appendix Reconciliation of Non-GAAP Financial Measures Forecast for Year Ending December 31, 2021 Net cash provided by (used for) operating activities at least $145 Less: Capital expenditures (25) Free cash flow at least $120 Add: Restructuring cash outlay 30 Normalized free cash flow at least $150 Table II.a VERITIV CORPORATION FREE CASH FLOW GUIDANCE (in millions, unaudited)
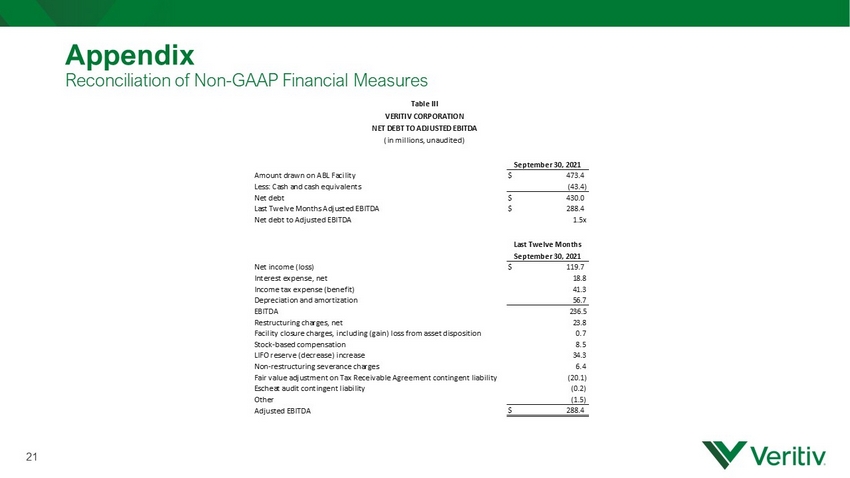
21 Appendix Reconciliation of Non-GAAP Financial Measures September 30, 2021 Amount drawn on ABL Facility $ 473.4 Less: Cash and cash equivalents (43.4) Net debt $ 430.0 Last Twelve Months Adjusted EBITDA $ 288.4 Net debt to Adjusted EBITDA 1.5x Last Twelve Months September 30, 2021 Net income (loss) $ 119.7 Interest expense, net 18.8 Income tax expense (benefit) 41.3 Depreciation and amortization 56.7 EBITDA 236.5 Restructuring charges, net 23.8 Facility closure charges, including (gain) loss from asset disposition 0.7 Stock-based compensation 8.5 LIFO reserve (decrease) increase 34.3 Non-restructuring severance charges 6.4 Fair value adjustment on Tax Receivable Agreement contingent liability (20.1) Escheat audit contingent liability (0.2) Other (1.5) Adjusted EBITDA $ 288.4 Net Sales 6,628.0 Adjusted EBITDA as a % of Net Sales 4.4% Table III VERITIV CORPORATION NET DEBT TO ADJUSTED EBITDA (in millions, unaudited)

22 THIRD QUARTER 2021 FINANCIAL RESULTS (UNAUDITED) November 3, 2021