Exhibit 99.2

1 FOURTH QUARTER AND FULL YEAR 2021 FINANCIAL RESULTS March 1, 2022 Exhibit 99.2

2 SCOTT PALFREEMAN Director of Finance and Investor Relations SCOTT PALFREEMAN Director of Finance and Investor Relations
3 Safe Harbor Provision Certain statements contained in this presentation regarding Veritiv Corporation’s (the "Company") future operating results, p erf ormance, business plans, prospects, guidance, statements related to the impact of COVID - 19 and any other statements not constituting historical fact are "forward - looking stat ements" subject to the safe harbor created by the Private Securities Litigation Reform Act of 1995. Where possible, the words "believe," "expect," "anticipate," "continue," "i nte nd," "should," "will," "would," "planned," "estimated," "potential," "goal," "outlook," "may," "predicts," "could," or the negative of such terms, or other comparable expressions, a s t hey relate to the Company or its business, have been used to identify such forward - looking statements. All forward - looking statements reflect only the Company’s current beliefs and assumpti ons with respect to future operating results, performance, business plans, prospects, guidance and other matters, and are based on information currently available to the C omp any. Accordingly, the statements are subject to significant risks, uncertainties and contingencies, which could cause the Company’s actual operating results, performance, bu sin ess plans, prospects or guidance to differ materially from those expressed in, or implied by, these statements. Factors that could cause actual results to differ materially from current expectations include the risks and other factors de scr ibed under "Risk Factors" and elsewhere in this report and in the Company’s other publicly available reports filed with the Securities and Exchange Commission ("SEC"). Such risks and o the r factors, which in some instances are beyond the Company's control, include: adverse impacts of the COVID - 19 pandemic; the industry - wide decline in demand for paper and related products; increased competition from existing and non - traditional sources; procurement and other risks in obtaining packaging, facility products and paper from our suppliers for resale to our customers; changes in prices for raw materials; changes in trade policies and regulations; increases in the cost of fuel and third - party freight and the availability of third - party freight providers; the loss of any of our significant customers; inability to realize expected benefits of restructuring plans; adverse developments in general business and economic conditions that could impair our ability to use net operating loss carryforwards and other deferred tax assets; our ability to adequately protect our material intellectu al property and other proprietary rights, or to defend successfully against intellectual property infringement claims by third parties; our ability to attract, train and retain hig hly qualified employees; our pension and health care costs and participation in multi - employer pension, health and welfare plans; the effects of work stoppages, union negotiations and labor d isputes; our ability to generate sufficient cash to service our debt; increasing interest rates; our ability to refinance or restructure our debt on reasonable terms and conditions as m igh t be necessary from time to time; our ability to comply with the covenants contained in our debt agreements; costs to comply with laws, rules and regulations, including environmental, he alt h and safety laws, and to satisfy any liability or obligation imposed under such laws; changes in tax laws; adverse results from litigation, governmental investigations or audi ts, or tax - related proceedings or audits; regulatory changes and judicial rulings impacting our business; the impact of adverse developments in general business and economic conditions a s w ell as conditions in the global capital and credit markets on demand for our products and services, our business including our international operations, and our customers; fore ign currency fluctuations; inclement weather, widespread outbreak of an illness, anti - terrorism measures and other disruptions to our supply chain, distribution system and op erations; our dependence on a variety of information technology and telecommunications systems and the Internet; our reliance on third - party vendors for various services; cybersecur ity risks; and other events of which we are presently unaware or that we currently deem immaterial that may result in unexpected adverse operating results. The Company is not resp ons ible for updating the information contained in this presentation beyond the published date, or for changes made to this presentation by wire services or Internet service provide rs. This presentation is being furnished to the SEC through a Form 8 - K. The Company’s Annual Report on Form 10 - K for the period ended December 31, 2021 to be filed with the SEC may contain updates to the information included in this presentation. We reference non - GAAP financial measures in this presentation. Please see the appendix for reconciliations of non - GAAP measures to the most comparable United States ("U.S.") GAAP measures.

SAL ABBATE Chief Executive Officer
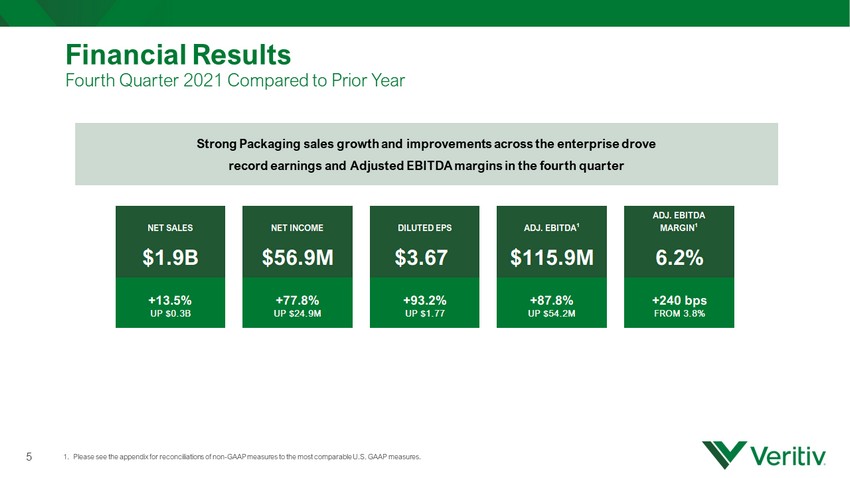
Financial Results Fourth Quarter 2021 Compared to Prior Year 5 1. Please see the appendix for reconciliations of non - GAAP measures to the most comparable U.S. GAAP measures . Strong Packaging sales growth and improvements across the enterprise drove record earnings and Adjusted EBITDA margins in the fourth quarter NET SALES NET INCOME DILUTED EPS ADJ. EBITDA 1 ADJ. EBITDA MARGIN 1 $1.9B $56.9M $3.67 $115.9M 6.2% +13.5% +77.8% +93.2% +87.8% +240 bps UP $0.3B UP $24.9M UP $1.77 UP $54.2M FROM 3.8%

Financial Results Full Year 2021 Compared to Prior Year 6 1. Please see the appendix for reconciliations of non - GAAP measures to the most comparable U.S. GAAP measures . Sustainable and stepwise improvements in net income and diluted earnings per share are the result of fundamental changes to the business and diligent efforts to improve the quality of earnings NET SALES NET INCOME DILUTED EPS ADJ. EBITDA 1 ADJ. EBITDA MARGIN 1 $6.9B $144.6M $9.01 $342.6M 5.0% +8.0% +322.8% +333.2% +82.6% +200 bps UP $0.5B UP $110.4M UP $6.93 UP $155.0M FROM 3.0%

7 Business Update Comments : • Inflationary market price increases across product portfolio continued into fourth quarter • Pass - through of market price increases managed effectively and with proper notice • Continued demand and constrained supply expected to support prices at current levels • Wage inflation consistent with broader market and supply chain challenges

$855M $915M $971M $1,020M $700M $800M $900M $1,000M $1,100M 1Q21 2Q21 3Q21 4Q21 Net Sales $78M $95M $107M $113M - $50M $100M $150M 1Q21 2Q21 3Q21 4Q21 Adj. EBITDA 9.1% 10.4% 11.0% 11.1% 0.0% 5.0% 10.0% 15.0% 1Q21 2Q21 3Q21 4Q21 Adj. EBITDA Margin Packaging Segment Performance 8 Comments : • Eleventh consecutive quarter of YoY improvement in Adjusted EBITDA margin. • Record high Adjusted EBITDA of $113 million and Adjusted EBITDA margin of 11.1% • Packaging sales growth of 15% due to supplier - driven price increases and volume growth, after adjusting for day count differences. • Strong sales growth across all customer sectors and above - market volume growth. • Further established position as the leading provider of Packaging solutions in North America. 1. Quarterly figures do not sum to the year - to - date amount due to rounding. 1 1

FY 2014 1, 2 $154 MILLION $343 MILLION 1. Pro Forma 2. See appendix for reconciliations of non - GAAP measures to the most comparable U.S. GAAP measures; Corporate and Other is excluded from the calculation for percentage of Adjusted EBITDA by Segment. FY 2021 2 Packaging 55% Facility Solutions 15% Print 20% Print 20% Publishing 10% Packaging 55% Facility Solutions 15% ADJUSTED EBITDA BY SEGMENT Packaging 7 - Year Adj. EBITDA CAGR: +11% (14% Adj. EBITDA CAGR since 2017) Print & Publishing 30% Print & Publishing 20% FY 2022 Adj. EBITDA Guidance: $395 - $435M Print 17% Publishing 3% Packaging 70% Facility Solutions 10% Segment Mix Transformation Strategic Shift to Packaging 9

STEVE SMITH Chief Financial Officer

4Q 2021 Full Year 2021 Adj. EBITDA Adj. EBITDA % of Net Sales Adj. EBITDA Adj. EBITDA % of Net Sales Change from PY Change from PY Change from PY Change from PY $113M 11.1% $394M 10.5% +33.7% +150 bps +31.2% +150 bps $17M 7.5% $53M 5.9% +114.8% +400 bps +26.7% +140 bps $39M 9.2% $96M 6.5% +212.9% +570 bps +184.9% +420 bps $6M 3.6% $19M 3.1% -1.7% -50 bps +46.1% +70 bps Corporate & Other ($59M) ($218M) $116M 6.2% $343M 5.0% +87.8% +240 bps +82.6% +200 bps Packaging Facility Solutions Print Publishing Veritiv Consolidated Segment and Consolidated Financial Results Fourth Quarter and Full Year 2021 1. Please see the appendix for reconciliations of non - GAAP measures to the most comparable U.S. GAAP measures. 2. Adjusted EBITDA does not sum to the year - to - date amount due to rounding. 1 11 1, 2

Cash Flow; Low Leverage 1. Calculated as net debt divided by trailing twelve months of Adjusted EBITDA. 2. Cash flow from operations less capital expenditures. 3 . S ee appendix for reconciliations of non - GAAP measures to the most comparable U.S. GAAP measures . Significant net leverage reduction since 2019 driven by healthy free cash flow generated from increased earnings and disciplined working capital reductions 12 4.1x 2.1x 1.1x 0.0x 1.0x 2.0x 3.0x 4.0x 5.0x FY19 FY20 FY21 Net Leverage Ratio 1, 3 $247M $266M $134M ~$200M - $100M $200M $300M FY19 FY20 FY21 FY22E Free Cash Flow 2,3

Capital Allocation Capital Allocation Priorities: • Invest in the business: • Organic • Inorganic • Return value to shareholders • Support restructuring initiatives 2022 CapEx : Approximately $35M 2020 Restructuring Plan Substantially completed in 4Q 2021 $ 200M Share Repurchase Program in 2022 $ 100M Share Repurchase Program Completed in 3Q 2021 Reduction in net leverage below long - term target of 3x enabled successful completion of share repurchase program and investments in growth. Record low net leverage provides both financial and strategic optionality. Scope and/or Scale Acquisitions Disciplined Approach 13

SAL ABBATE Chief Executive Officer
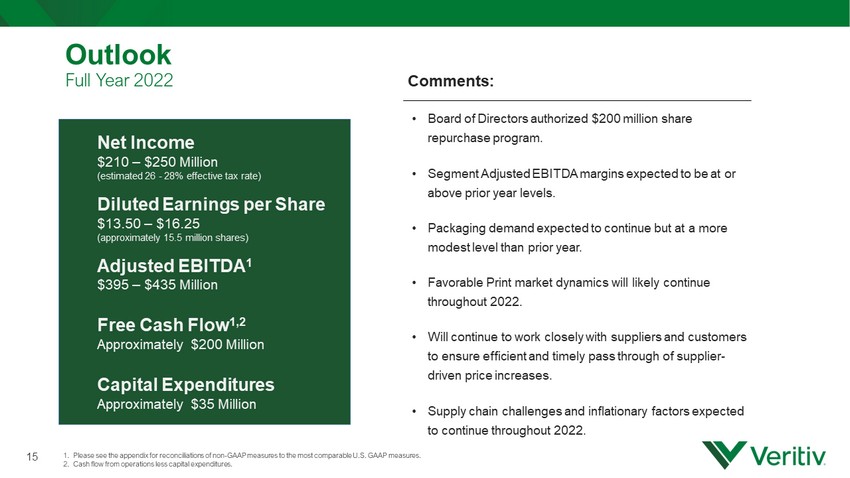
Comments : • Board of Directors authorized $200 million share repurchase program. • Segment Adjusted EBITDA margins expected to be at or above prior year levels. • Packaging demand expected to continue but at a more modest level than prior year. • Favorable Print market dynamics will likely continue throughout 2022. • Will continue to work closely with suppliers and customers to ensure efficient and timely pass through of supplier - driven price increases. • Supply chain challenges and inflationary factors expected to continue throughout 2022. Outlook Full Year 2022 1. Please see the appendix for reconciliations of non - GAAP measures to the most comparable U.S. GAAP measures. 2. Cash flow from operations less capital expenditures. Net Income $210 – $250 Million (estimated 26 - 28% effective tax rate) Diluted Earnings per Share $13.50 – $16.25 (approximately 15.5 million shares) Adjusted EBITDA 1 $395 – $435 Million Free Cash Flow 1,2 Approximately $200 Million Capital Expenditures Approximately $35 Million 15

Questions 16

Appendix Reconciliation of Non - GAAP Financial Measures We supplement our financial information prepared in accordance with U.S. GAAP with certain non - GAAP measures including Adjusted EBITDA (earnings before interest, income taxes, depreciation and amortization, restructuring charges, net, integration and acquisition expenses and o the r similar charges including any severance costs, costs associated with warehouse and office openings or closings, consolidation, and relocation and other bus ine ss optimization expenses, stock - based compensation expense, changes in the LIFO reserve, non - restructuring asset impairment charges, non - restructuring sev erance charges, non - restructuring pension charges, net, fair value adjustments related to contingent liabilities assumed in mergers and acquisiti ons and certain other adjustments), free cash flow and other non - GAAP measures such as the Net Debt to Adjusted EBITDA ratio. We believe investors commonly use Adju sted EBITDA, free cash flow and these other non - GAAP measures as key financial metrics for valuing companies. In addition, the credit agreement governi ng our Asset - Based Lending Facility (the " ABL Facility") permits us to exclude the foregoing and other charges in calculating "Consolidated EBITDA", as defined in the ABL Facility. We approximate foreign currency effects by applying the foreign currency exchange rate for the prior period to the local currenc y r esults for the current period. Adjusted EBITDA, free cash flow and these other non - GAAP measures are not alternative measures of financial performance or liqui dity under U.S. GAAP. Non - GAAP measures do not have definitions under U.S. GAAP and may be defined differently by, and not be comparable to, similarly tit led measures used by other companies. As a result, we consider and evaluate non - GAAP measures in connection with a review of the most directly comparable m easure calculated in accordance with U.S. GAAP. We caution investors not to place undue reliance on such non - GAAP measures and to consider them with the most directly comparable U.S. GAAP measures. Adjusted EBITDA, free cash flow and these other non - GAAP measures have limitations as analytical tools and should not be considered in isolation or as a substitute for analyzing our results as reported under U.S. GAAP. Please see the following ta ble s for reconciliations of non - GAAP measures to the most comparable U.S. GAAP measures. 17
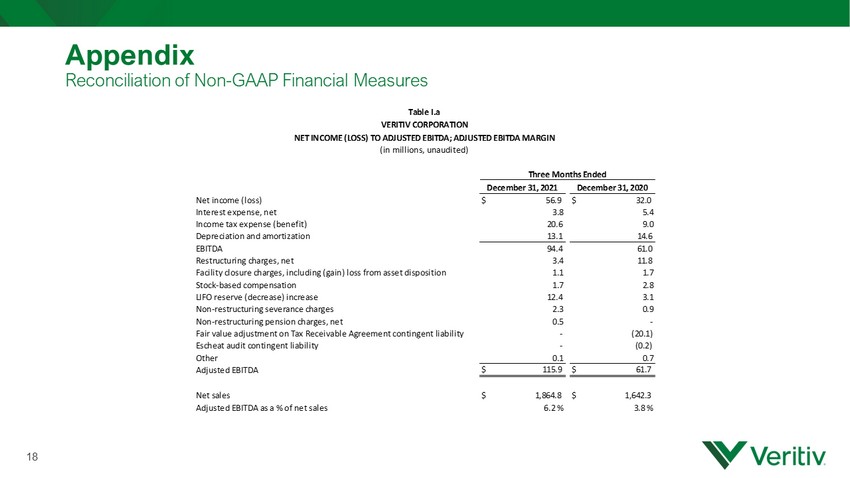
Appendix Reconciliation of Non - GAAP Financial Measures 18 December 31, 2021 December 31, 2020 Net income (loss) $ 56.9 $ 32.0 Interest expense, net 3.8 5.4 Income tax expense (benefit) 20.6 9.0 Depreciation and amortization 13.1 14.6 EBITDA 94.4 61.0 Restructuring charges, net 3.4 11.8 Facility closure charges, including (gain) loss from asset disposition 1.1 1.7 Stock-based compensation 1.7 2.8 LIFO reserve (decrease) increase 12.4 3.1 Non-restructuring severance charges 2.3 0.9 Non-restructuring pension charges, net 0.5 - Fair value adjustment on Tax Receivable Agreement contingent liability - (20.1) Escheat audit contingent liability - (0.2) Other 0.1 0.7 Adjusted EBITDA $ 115.9 $ 61.7 Net sales $ 1,864.8 $ 1,642.3 Adjusted EBITDA as a % of net sales 6.2 % 3.8 % Three Months Ended Table I.a VERITIV CORPORATION NET INCOME (LOSS) TO ADJUSTED EBITDA; ADJUSTED EBITDA MARGIN (in millions, unaudited)

19 Appendix Reconciliation of Non - GAAP Financial Measures Low High Net income (loss) $ 210 $ 250 Interest expense, net 15 15 Income tax expense (benefit) 80 90 Depreciation and amortization 50 50 Other reconciling items 40 30 Adjusted EBITDA $ 395 $ 435 Forecast for Year Ending December 31, 2022 Table I.b. VERITIV CORPORATION NET INCOME (LOSS) TO ADJUSTED EBITDA GUIDANCE (in millions, unaudited)

20 Appendix Reconciliation of Non - GAAP Financial Measures Veritiv As Reported Pro Forma Adjustments* Veritiv Pro Forma Net income (loss) (19.6)$ $ (16.2) $ (35.8) Interest expense, net 14.0 12.4 26.4 Income tax expense (benefit) (2.1) 6.8 4.7 Depreciation and amortization 37.6 16.8 54.4 EBITDA 29.9 19.8 49.7 Restructuring charges, net 4.0 0.2 4.2 Stock-based compensation 4.0 0.1 4.1 LIFO reserve (decrease) increase 6.3 1.3 7.6 Non-restructuring severance charges 2.6 0.4 3.0 Gain on sale of joint venture - (6.6) (6.6) Integration, acquisition and merger expenses 75.1 14.1 89.2 Fair value adjustment on Tax Receivable Agreement contingent liability 1.7 - 1.7 Other (1.7) 2.3 0.6 Loss from discontinued operations, net of income taxes 0.1 - 0.1 Adjusted EBITDA 122.0$ 31.6$ 153.6$ Net Sales 7,406.5$ 1,907.6$ $ 9,314.1 Adjusted EBITDA/Pro Forma Adjusted EBITDA as a % of net sales 1.6% 1.6% Year Ended December 31, 2014 * Pro forma adjustments take into account the merger with UWW Holdings, Inc. and the related financing as if they occurred on January 1, 2014, as well as purchase accounting adjustments and adjustments for one-time costs related to the merger. Table l.c VERITIV CORPORATION RECONCILIATION OF NON-GAAP MEASURES NET INCOME (LOSS) TO ADJUSTED EBITDA; ADJUSTED EBITDA MARGIN (in millions, unaudited)

21 Appendix Reconciliation of Non - GAAP Financial Measures VERITIV CORPORATION RECONCILIATION OF NON-GAAP MEASURES FREE CASH FLOW (in millions, unaudited) Three Months Ended December 31, 2021 2021 2020 2019 Net cash flows provided by operating activities 63.1$ 154.7$ 289.2$ 281.0$ Less: Capital expenditures (6.3) (20.4) (23.6) (34.1) Free cash flow 56.8$ 134.3$ 265.6$ 246.9$ Table ll Year Ended December 31,

22 Appendix Reconciliation of Non - GAAP Financial Measures Forecast for Year Ending December 31, 2022 Net cash provided by (used for) operating activities approximately $235 Less: Capital expenditures (35) Free cash flow approximately $200 Table II.a VERITIV CORPORATION FREE CASH FLOW GUIDANCE (in millions, unaudited)

23 Appendix Reconciliation of Non - GAAP Financial Measures December 31, 2021 Amount drawn on ABL Facility $ 440.8 Less: Cash and cash equivalents (49.3) Net debt $ 391.5 Last Twelve Months Adjusted EBITDA $ 342.6 Net debt to Adjusted EBITDA 1.1x Last Twelve Months December 31, 2021 Net income (loss) $ 144.6 Interest expense, net 17.2 Income tax expense (benefit) 52.9 Depreciation and amortization 55.2 EBITDA 269.9 Restructuring charges, net 15.4 Facility closure charges, including (gain) loss from asset disposition 0.1 Stock-based compensation 7.4 LIFO reserve (decrease) increase 43.6 Non-restructuring severance charges 7.8 Non-restructuring pension charges, net 0.5 Other (2.1) Adjusted EBITDA $ 342.6 Net Sales 6,850.5 Adjusted EBITDA as a % of Net Sales 5.0% Table III VERITIV CORPORATION NET DEBT TO ADJUSTED EBITDA (in millions, unaudited)

24 Appendix Reconciliation of Non - GAAP Financial Measures 2020 2019 Amount drawn on ABL Facility 520.2$ 673.2$ Less: Cash and cash equivalents (120.6) (38.0) Net debt 399.6$ 635.2$ Last twelve months Adjusted EBITDA 187.6$ 155.9$ Net debt to Adjusted EBITDA 2.1 4.1 Last Twelve Months December 31, 2020 2019 Net income (loss) 34.2$ (29.5)$ Interest expense, net 25.1 38.1 Income tax expense (benefit) 8.8 0.7 Depreciation and amortization 57.7 53.5 EBITDA 125.8 62.8 Restructuring charges, net 52.2 28.8 Facility closure charges, including (gain) loss from asset disposition (3.7) - Stock-based compensation 17.7 14.6 LIFO reserve (decrease) increase (1.5) (3.7) Non-restructuring asset impairment charges - - Non-restructuring severance charges 4.1 8.4 Non-restructuring pension charges, net 7.2 6.6 Integration, acquisition and merger expenses - 17.5 Fair value adjustment on Tax Receivable Agreement contingent liability (19.1) 0.3 Fair value adjustment on contingent consideration liability 1.0 13.1 Escheat audit contingent liability (0.2) 3.7 Other 4.1 3.8 Adjusted EBITDA 187.6$ 155.9$ Net Sales 6,345.6$ 7,659.4$ Adjusted EBITDA/Pro Forma Adjusted EBITDA as a % of net sales 3.0% 2.0% Table lll.a VERITIV CORPORATION NET DEBT TO ADJUSTED EBITDA | ADJUSTED EBITDA % OF NET SALES (in millions, unaudited) Year Ended December 31,

2021 2020 2021 2020 2021 2020 2021 2020 2021 2020 Reported sales growth 13.5% (10.5%) 15.3% 4.3% 1.0% (13.3%) 18.0% (28.1%) 13.4% (26.8%) Daily impact 1.9% 0.0% 1.9% (0.0%) 1.7% 0.0% 1.9% 0.0% 1.9% 0.0% Sales per day growth 15.4% (10.5%) 17.2% 4.3% 2.6% (13.3%) 19.9% (28.1%) 15.3% (26.8%) Business divestitures 1 1.1% (0.0%) - - - - 5.3% (0.7%) - - Organic daily sales growth 16.5% (10.5%) 17.2% 4.3% 2.6% (13.3%) 25.3% (28.8%) 15.3% (26.8%) Foreign exchange (0.4%) (0.2%) (0.3%) (0.3%) (1.0%) (0.3%) (0.5%) (0.1%) - - Organic constant currency sales growth 16.1% (10.7%) 16.9% 4.1% 1.7% (13.6%) 24.8% (28.9%) 15.3% (26.8%) 2021 2020 2021 2020 2021 2020 2021 2020 2021 2020 Reported sales growth 8.0% (17.2%) 13.4% (3.8%) (3.1%) (22.0%) 1.8% (30.7%) 9.8% (31.9%) Daily impact 0.9% (0.3%) 0.9% (0.4%) 0.8% (0.3%) 0.8% (0.3%) 0.9% (0.3%) Sales per day growth 8.8% (17.5%) 14.3% (4.1%) (2.3%) (22.3%) 2.6% (31.0%) 10.6% (32.2%) Business divestitures 1 0.8% 0.0% - - - - 3.4% (0.5%) - - Organic daily sales growth 9.6% (17.5%) 14.3% (4.1%) (2.3%) (22.3%) 6.0% (31.4%) 10.6% (32.2%) Foreign exchange (0.8%) 0.1% (0.7%) 0.0% (1.8%) 0.2% (0.8%) 0.1% - - Organic constant currency sales growth 8.8% (17.4%) 13.6% (4.1%) (4.1%) (22.0%) 5.2% (31.4%) 10.6% (32.2%) (1) Represents the results of the Rollsource buisiness divested as of 3/31/21 Table IV VERITIV CORPORATION Organic Growth Total Company Packaging Facility Solutions Print Publishing Three Months Ended December 31, Twelve Months Ended December 31, Total Company Packaging Facility Solutions Print Publishing 25 Appendix Reconciliation of Non - GAAP Financial Measures 25 1. Represents the results of the Rollsource business divested as of 3/31/21 2. Some of the amounts do not sum due to rounding 2 2

26 FOURTH QUARTER AND FULL YEAR 2021 FINANCIAL RESULTS March 1, 2022