
1 THIRD QUARTER 2022 FINANCIAL RESULTS November 8, 2022 Exhibit 99.2

2 SCOTT PALFREEMAN Director of Finance and Investor Relations SCOTT PALFREEMAN Vice President of Finance and Investor Relations

3 Safe Harbor Provision Certain statements contained in this presentation regarding Veritiv Corporation’s (the "Company") future operating results, p erf ormance, strategy, business plans, prospects and guidance, statements related to the impact of COVID - 19 and any other statements not constituting historical fact are "forward - lo oking statements" subject to the safe harbor created by the Private Securities Litigation Reform Act of 1995. Where possible, the words "believe," "expect," "anticipate," "continue, " " intend," "should," "will," "would," "planned," "estimated," "potential," "goal," "outlook," "may," "predicts," "could," or the negative of such terms, or other comparable expressions, h ave been used to identify such forward - looking statements. All forward - looking statements reflect only the Company’s current beliefs and assumptions with respect to future operating results, performance, business plans, prospects, guidance and other matters, and are based on information currently available to the Company. Accordingly, the statements are subject to si gni ficant risks, uncertainties and contingencies, which could cause the Company’s actual operating results, performance, business plans, prospects or guidance to differ materially f rom those expressed in, or implied by, these statements. Factors that could cause actual results to differ materially from current expectations include the risks and other factors de scr ibed under "Risk Factors" and elsewhere in our Annual Report on Form 10 - K and in the Company's other publicly available reports filed with the Securities and Exchange Commission ("SE C"). Such risks and other factors, which in some instances are beyond the Company's control, include: adverse impacts of the COVID - 19 pandemic; the industry - wide decline in dema nd for paper and related products; increased competition from existing and non - traditional sources; procurement and other risks in obtaining packaging, facility products and paper from our suppliers for resale to our customers; changes in prices for raw materials; changes in trade policies and regulations; increases in the cost of fuel and third - party fr eight and the availability of third - party freight providers; the loss of any of our significant customers; inability to realize expected benefits of restructuring plans; adverse developments in general business and economic conditions that could impair our ability to use net operating loss carryforwards and other deferred tax assets; our ability to adequately protect o ur material intellectual property and other proprietary rights, or to defend successfully against intellectual property infringement claims by third parties; our ability to attract, train and ret ain highly qualified employees; our pension and health care costs and participation in multi - employer pension, health and welfare plans; the effects of work stoppages, union negotiations a nd labor disputes; our ability to generate sufficient cash to service our debt; increasing interest rates; our ability to refinance or restructure our debt on reasonable terms and cond iti ons as might be necessary from time to time; our ability to comply with the covenants contained in our debt agreements; costs to comply with laws, rules and regulations, including envir onm ental, health and safety laws, and to satisfy any liability or obligation imposed under such laws; changes in tax laws; adverse results from litigation, governmental investiga tio ns or audits, or tax - related proceedings or audits; regulatory changes and judicial rulings impacting our business; the impact of adverse developments in general business and ec ono mic conditions as well as conditions in the global capital and credit markets on demand for our products and services, our business including our international operations, and our customers; foreign currency fluctuations; inclement weather, widespread outbreak of an illness, anti - terrorism measures and other disruptions to our supply chain, distribution syst em and operations; our dependence on a variety of information technology and telecommunications systems and the Internet; our reliance on third - party vendors for various services ; cybersecurity risks; and other events of which we are presently unaware or that we currently deem immaterial that may result in unexpected adverse operating results. The Company is not responsible for updating the information contained in this presentation beyond the published date. This pr ese ntation should be read together with the Company’s press release furnished to the SEC earlier today through a Form 8 - K. The Company’s Quarterly Report on Form 10 - Q for the three a nd nine months ended September 30, 2022 to be filed with the SEC may contain updates to the information included in this presentation and the related press release.

SAL ABBATE Chief Executive Officer
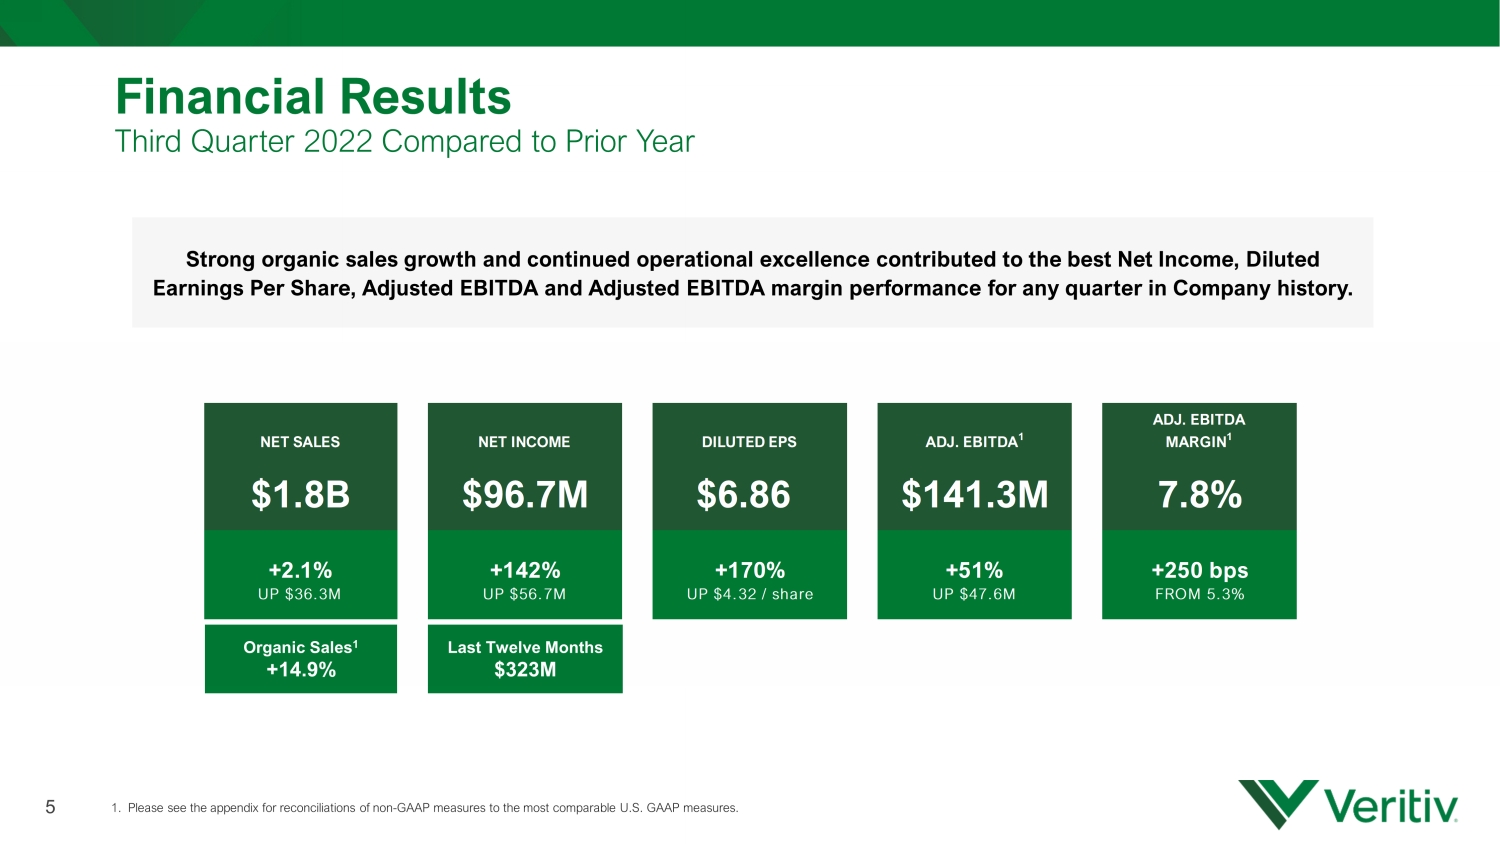
Financial Results Third Quarter 2022 Compared to Prior Year 5 1. Please see the appendix for reconciliations of non - GAAP measures to the most comparable U.S. GAAP measures . Strong organic sales growth and continued operational excellence contributed to the best Net Income, Diluted Earnings Per Share, Adjusted EBITDA and Adjusted EBITDA margin performance for any quarter in Company history. Organic Sales 1 +14.9% NET SALES NET INCOME DILUTED EPS ADJ. EBITDA 1 ADJ. EBITDA MARGIN 1 $1.8B $96.7M $6.86 $141.3M 7.8% +2.1% +142% +170% +51% +250 bps UP $36.3M UP $56.7M UP $4.32 / share UP $47.6M FROM 5.3% Last Twelve Months $323M
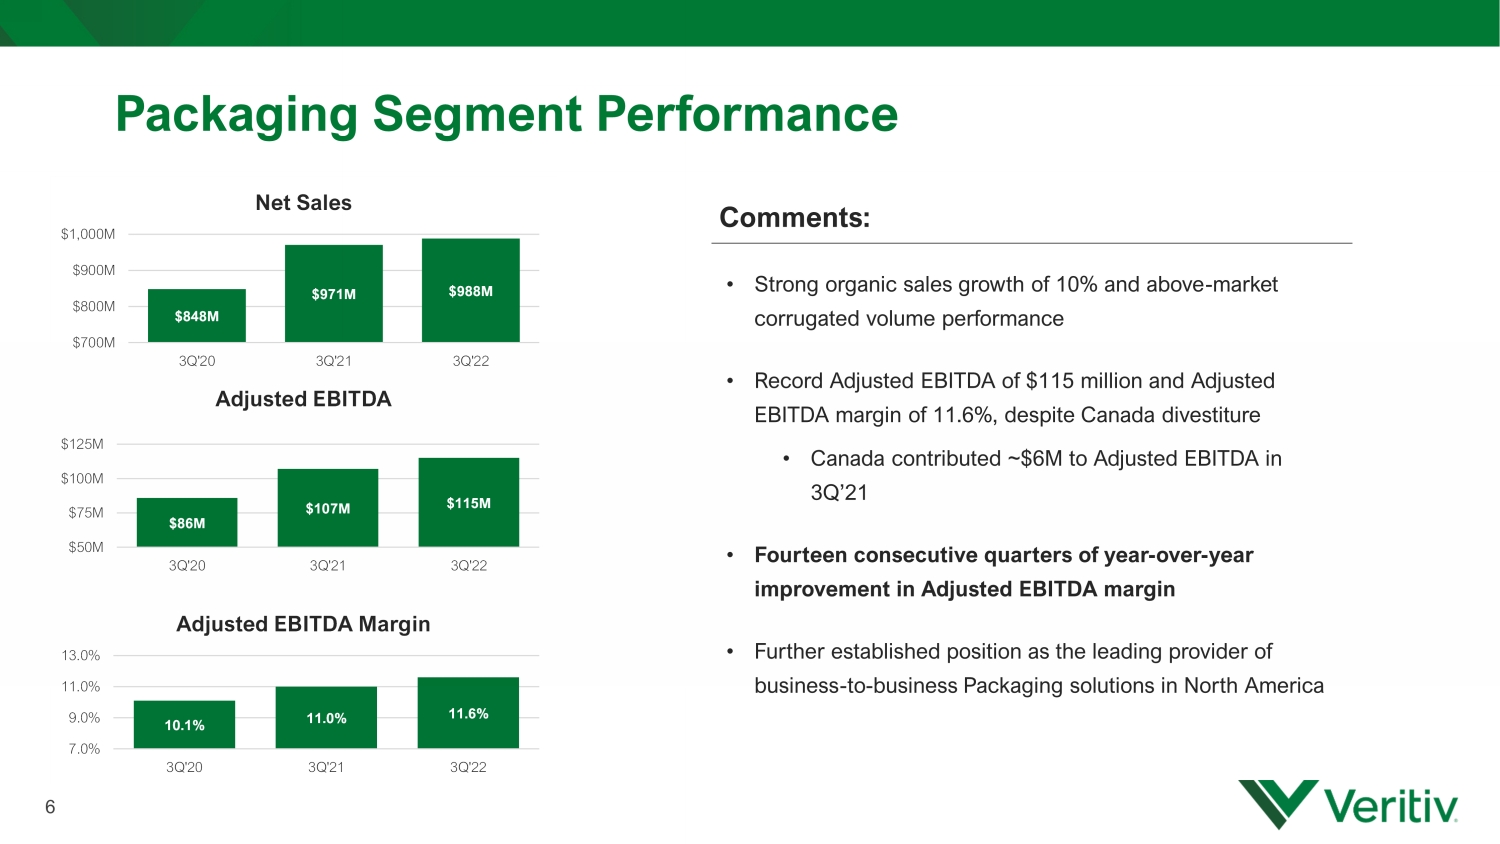
Packaging Segment Performance 6 Comments : • Strong organic sales growth of 10% and above - market corrugated volume performance • Record Adjusted EBITDA of $115 million and Adjusted EBITDA margin of 11.6%, despite Canada divestiture • Canada contributed ~$ 6M to Adjusted EBITDA in 3Q’21 • Fourteen consecutive quarters of year - over - year improvement in Adjusted EBITDA margin • Further established position as the leading provider of business - to - business Packaging solutions in North America $86M $107M $115M $50M $75M $100M $125M 3Q'20 3Q'21 3Q'22 Adjusted EBITDA 10.1% 11.0% 11.6% 7.0% 9.0% 11.0% 13.0% 3Q'20 3Q'21 3Q'22 Adjusted EBITDA Margin $848M $971M $988M $700M $800M $900M $1,000M 3Q'20 3Q'21 3Q'22 Net Sales
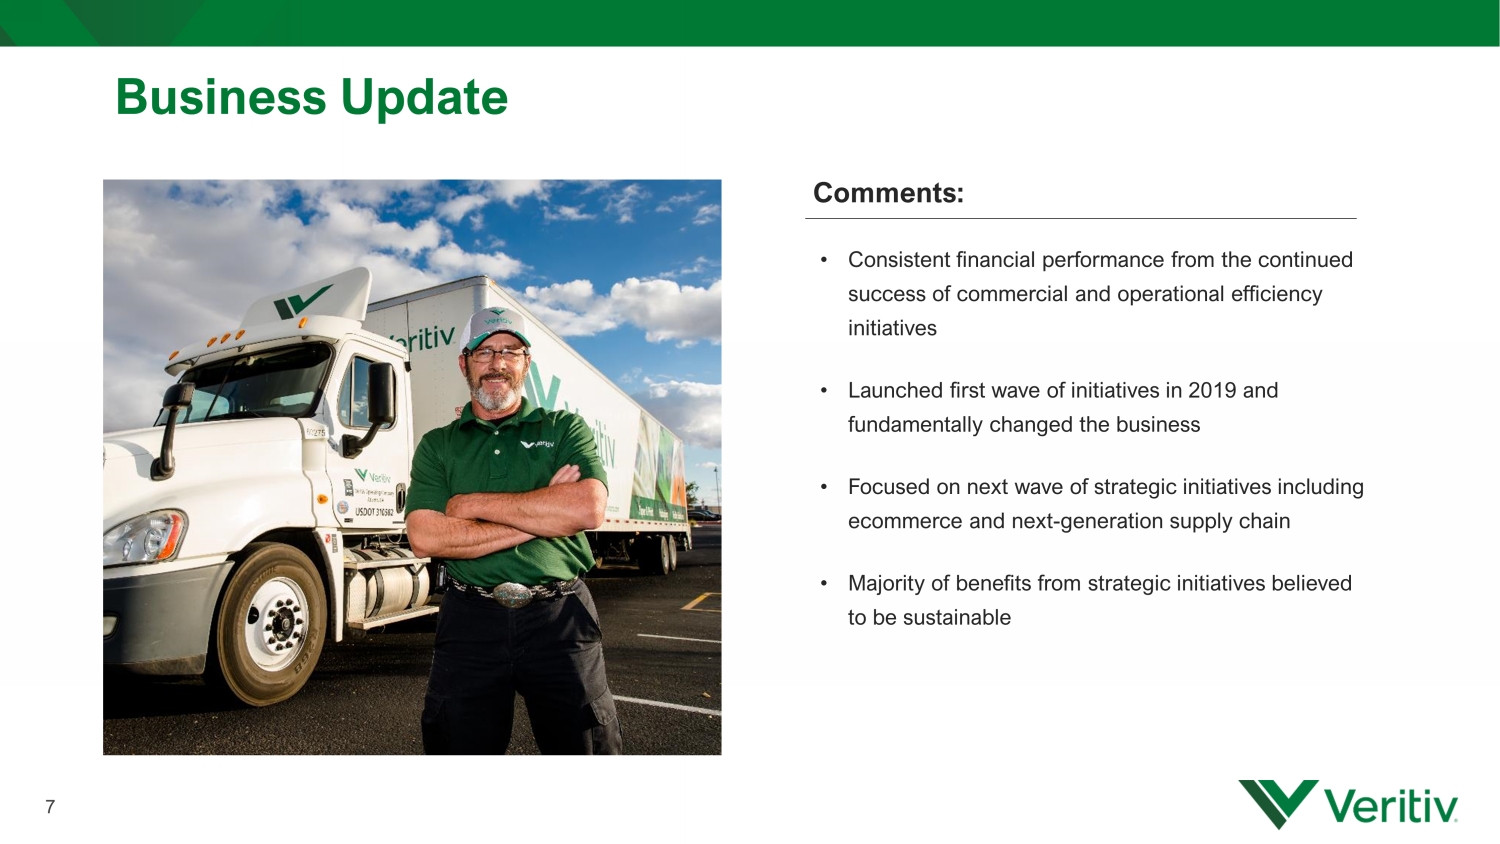
7 Business Update Comments : • Consistent financial performance from the continued success of commercial and operational efficiency initiatives • Launched first wave of initiatives in 2019 and fundamentally changed the business • Focused on next wave of strategic initiatives including ecommerce and next - generation supply chain • Majority of benefits from strategic initiatives believed to be sustainable
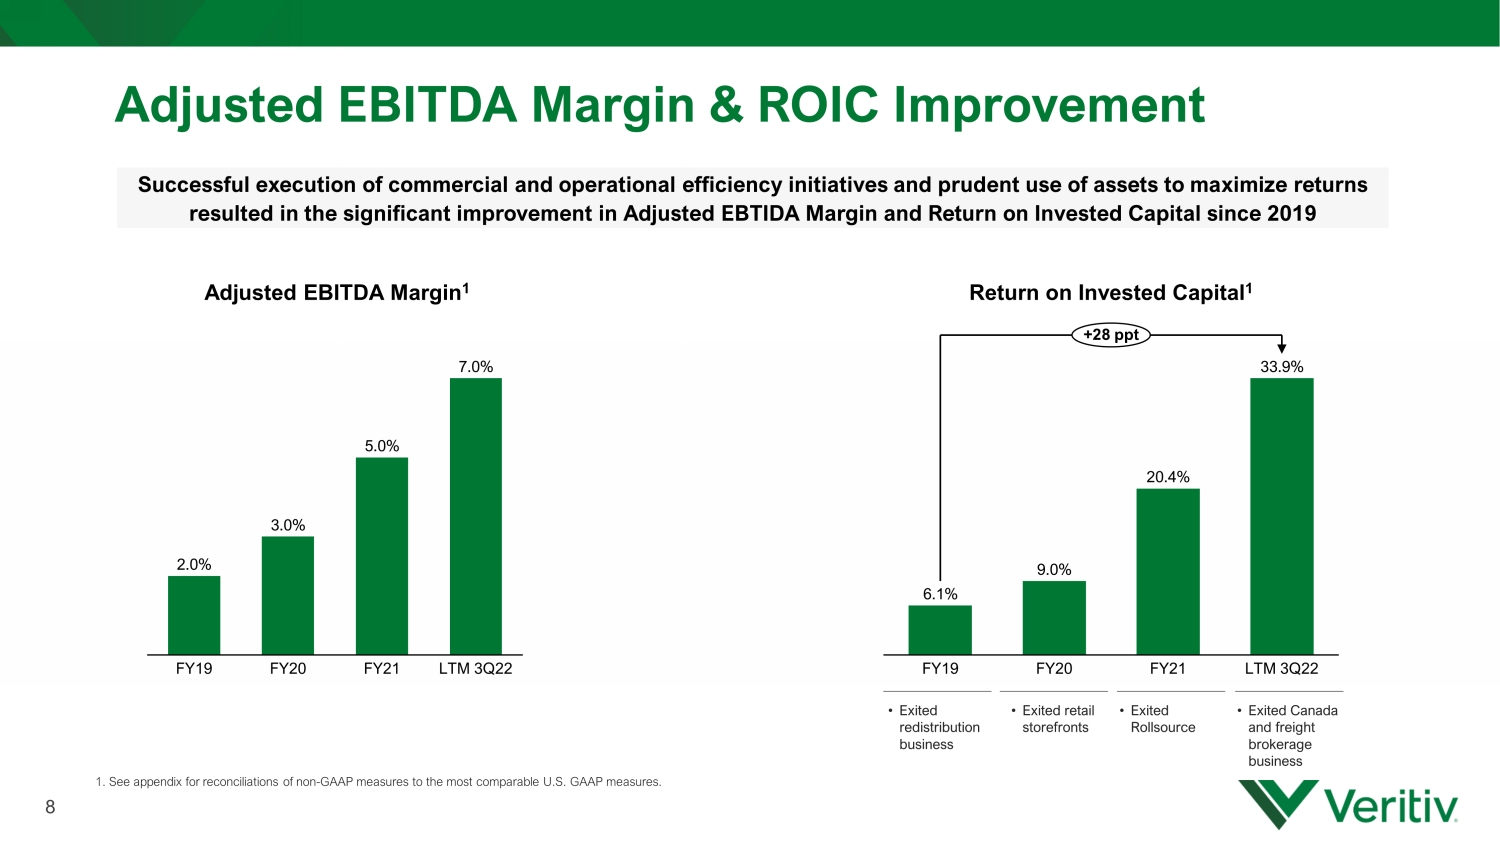
Adjusted EBITDA Margin & ROIC Improvement 1. See appendix for reconciliations of non - GAAP measures to the most comparable U.S. GAAP measures. Successful execution of commercial and operational efficiency initiatives and prudent use of assets to maximize returns resulted in the significant improvement in Adjusted EBTIDA Margin and Return on Invested Capital since 2019 8 6.1% 9.0% 20.4% 33.9% FY21 FY19 FY20 LTM 3Q22 +28 ppt Return on Invested Capital 1 2.0% 3.0% 5.0% 7.0% FY20 FY19 FY21 LTM 3Q22 Adjusted EBITDA Margin 1 • Exited Rollsource • Exited Canada and freight brokerage business • Exited redistribution business • Exited retail storefronts

STEVE SMITH Chief Financial Officer
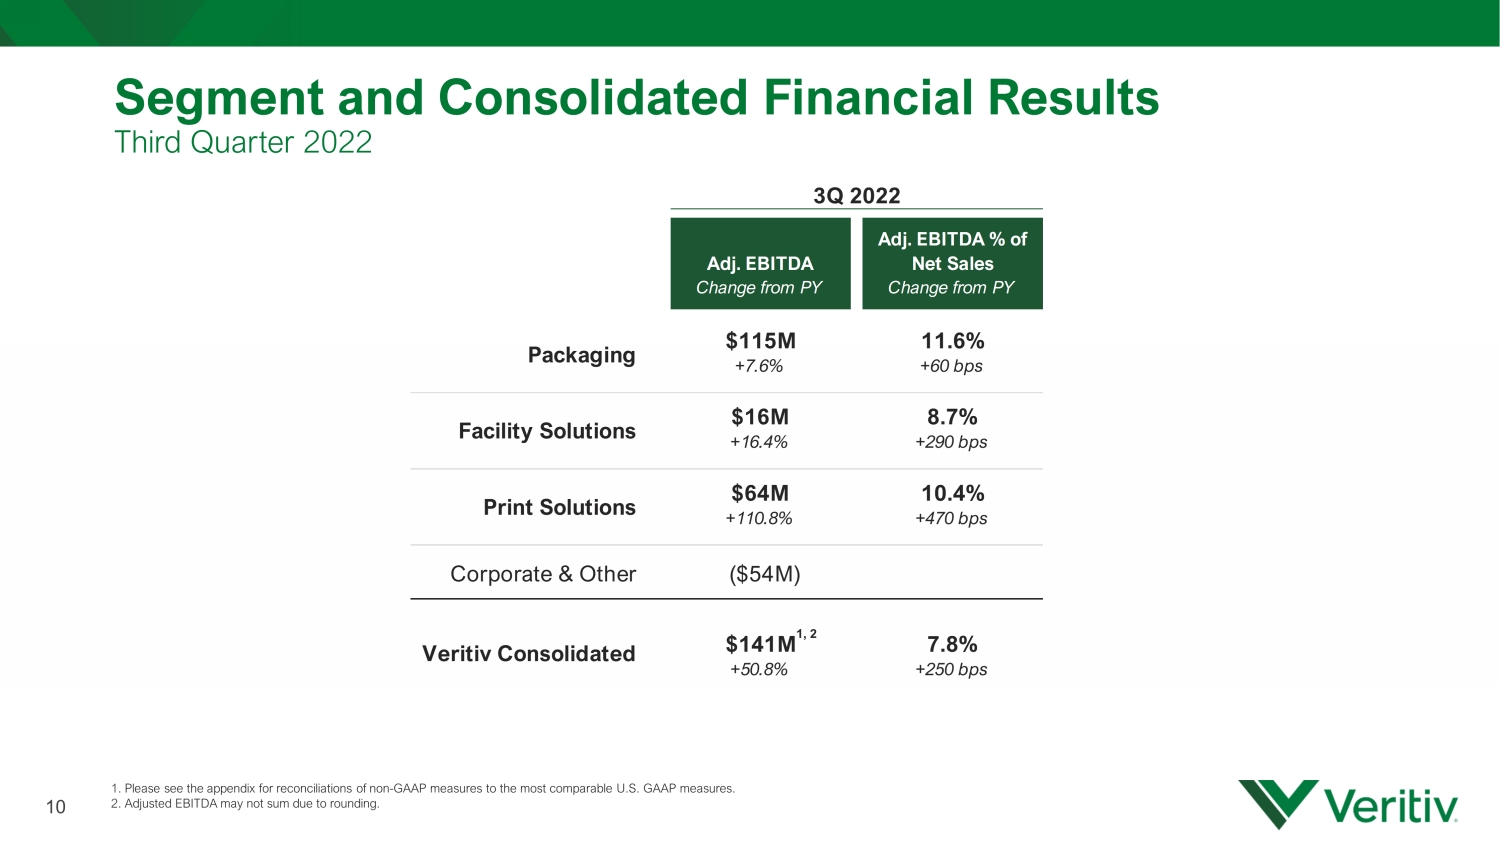
Segment and Consolidated Financial Results Third Quarter 2022 1. Please see the appendix for reconciliations of non - GAAP measures to the most comparable U.S. GAAP measures. 2. Adjusted EBITDA may not sum due to rounding. 10 1, 2 3Q 2022 Full Year 2021 Adj. EBITDA Adj. EBITDA % of Net Sales Change from PY Change from PY $115M 11.6% +7.6% +60 bps $16M 8.7% +16.4% +290 bps $64M 10.4% +110.8% +470 bps Corporate & Other ($54M) $141M 7.8% +50.8% +250 bps Veritiv Consolidated Packaging Facility Solutions Print Solutions

Cash Flow; Low Leverage 1. Calculated as net debt divided by trailing twelve months of Adjusted EBITDA. 2. Cash flow from operations less capital expenditures. 3 . S ee appendix for reconciliations of non - GAAP measures to the most comparable U.S. GAAP measures . Significant net leverage reduction since 2019 driven by healthy free cash flow generated from increased earnings and disciplined working capital reductions 11 $0M • Working capital initiatives • Secular decline in Print • Investment in growth • Strong earnings performance $247M $266M $134M ~ $250M - $100M $200M $300M FY19 FY20 FY21 FY22E Free Cash Flow 2,3 4.1x 2.1x 1.1x 0.6x 0.0x 1.0x 2.0x 3.0x 4.0x 5.0x FY19 FY20 FY21 3Q22 Net Leverage Ratio 1, 3
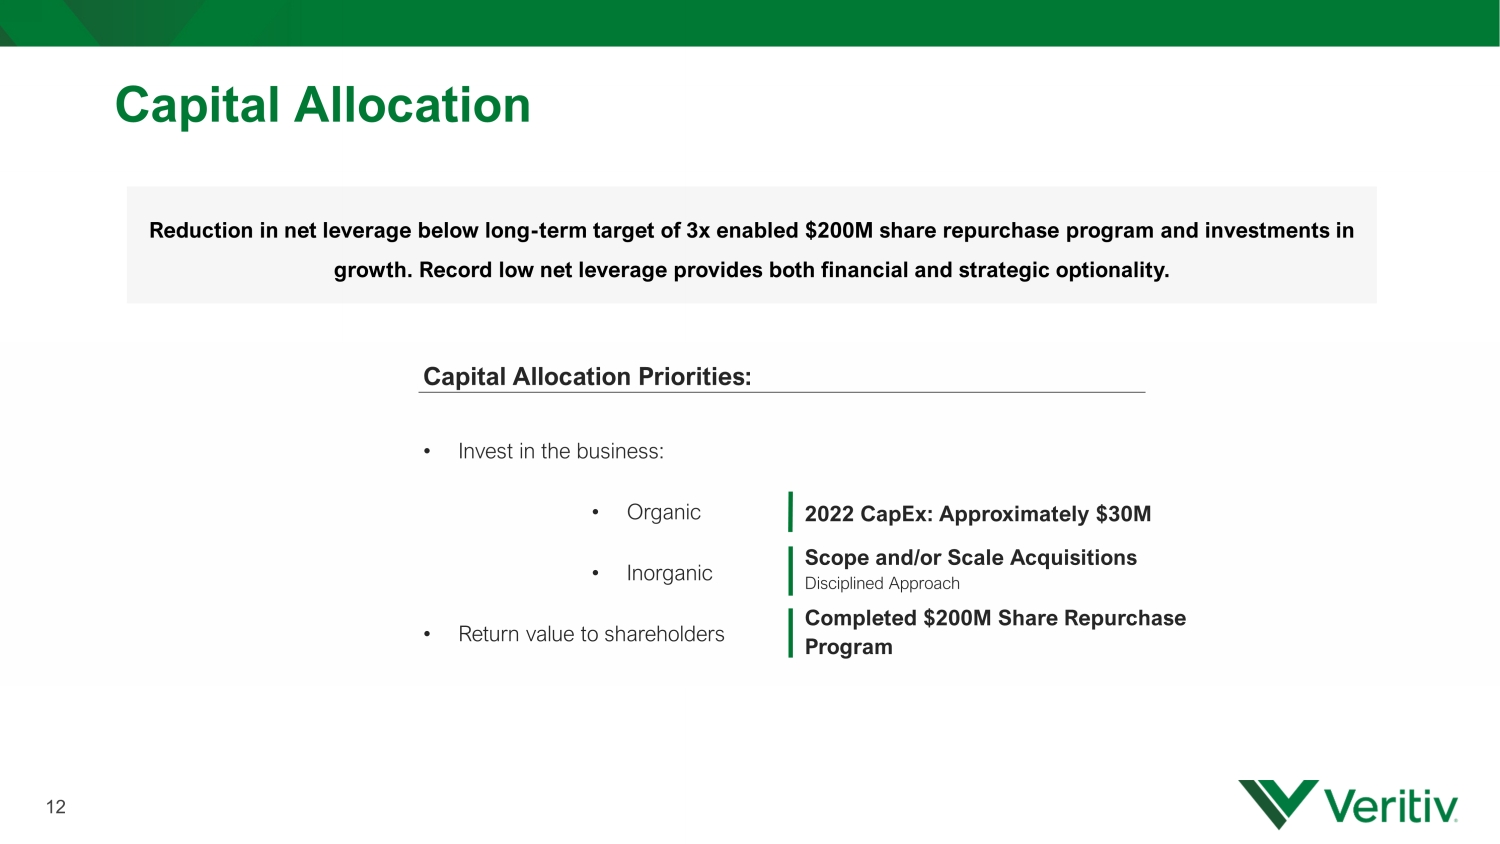
Capital Allocation Capital Allocation Priorities: • Invest in the business: • Organic • Inorganic • Return value to shareholders 2022 CapEx: Approximately $30M Completed $200M Share Repurchase Program Reduction in net leverage below long - term target of 3x enabled $200M share repurchase program and investments in growth. Record low net leverage provides both financial and strategic optionality. Scope and/or Scale Acquisitions Disciplined Approach 12
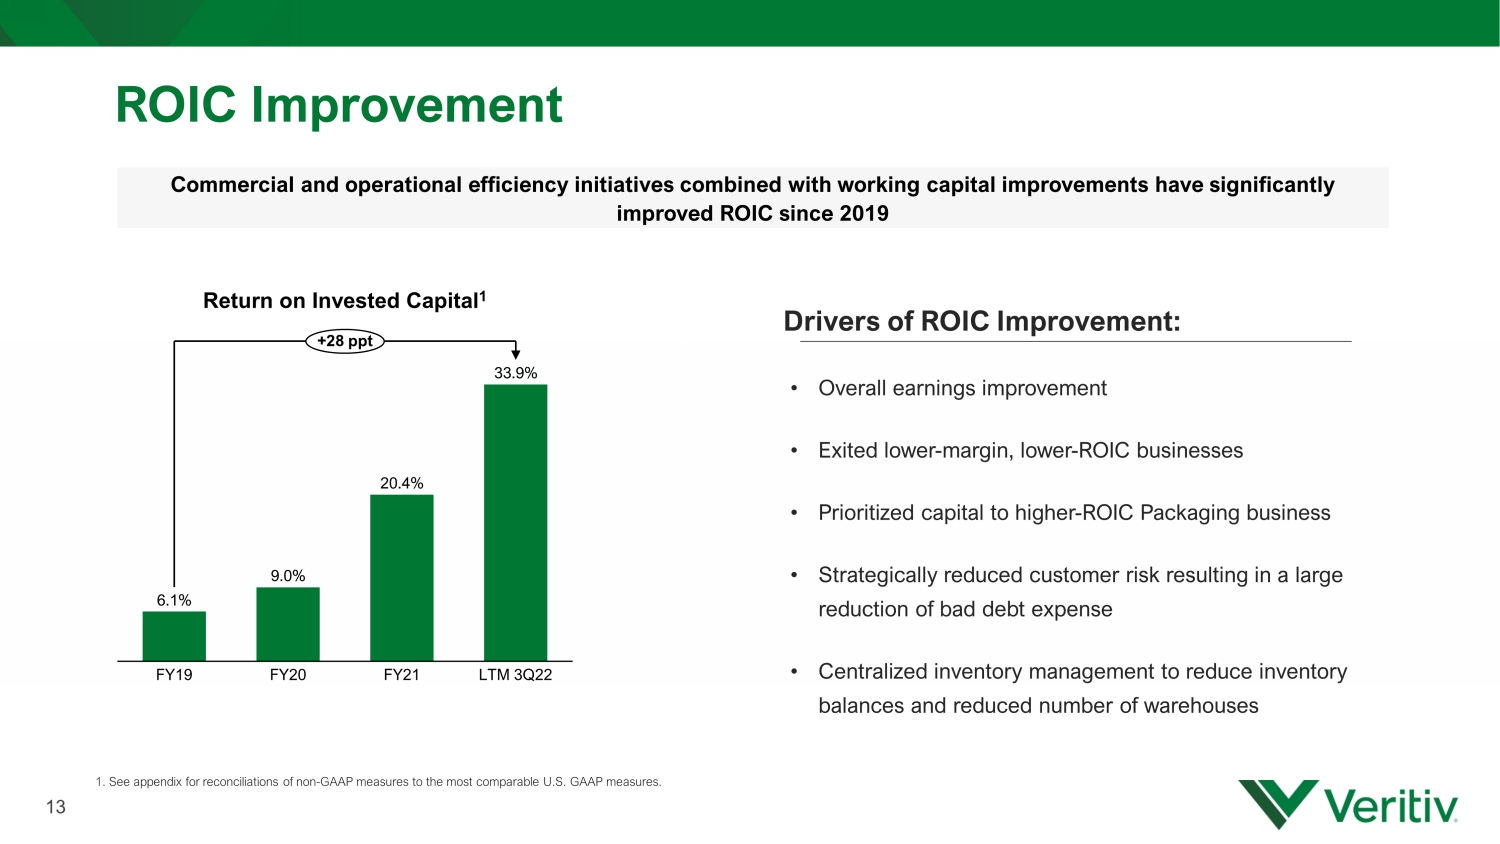
ROIC Improvement 1. See appendix for reconciliations of non - GAAP measures to the most comparable U.S. GAAP measures. Commercial and operational efficiency initiatives combined with working capital improvements have significantly improved ROIC since 2019 13 6.1% 9.0% 20.4% 33.9% FY19 FY20 FY21 LTM 3Q22 +28 ppt Return on Invested Capital 1 Drivers of ROIC Improvement: • Overall earnings improvement • Exited lower - margin, lower - ROIC businesses • Prioritized capital to higher - ROIC Packaging business • Strategically reduced customer risk resulting in a large reduction of bad debt expense • Centralized inventory management to reduce inventory balances and reduced number of warehouses

SAL ABBATE Chief Executive Officer

Outlook Full Year 2022 1. Please see the appendix for reconciliations of non - GAAP measures to the most comparable U.S. GAAP measures. 2. Cash flow from operations less capital expenditures. Net Income $320 – $340 Million (estimated 22 - 24% effective tax rate) Diluted Earnings per Share $22.00 – $23.50 (approximately 14.5 million shares) Adjusted EBITDA 1 $510 – $530 Million Free Cash Flow 1,2 Approximately $250 Million Capital Expenditures Approximately $30 Million 15 Comments : • Despite divestures, raised net income, diluted earnings per share and Adjusted EBITDA guidance • Accelerated net income growth; full - year net income guidance mid - point more than double prior year • Segment Adjusted EBITDA margins expected to be above prior year levels • Favorable Print market dynamics will likely continue into early 2023 Quarterly Dividend: • Announced $0.63 per share quarterly cash dividend
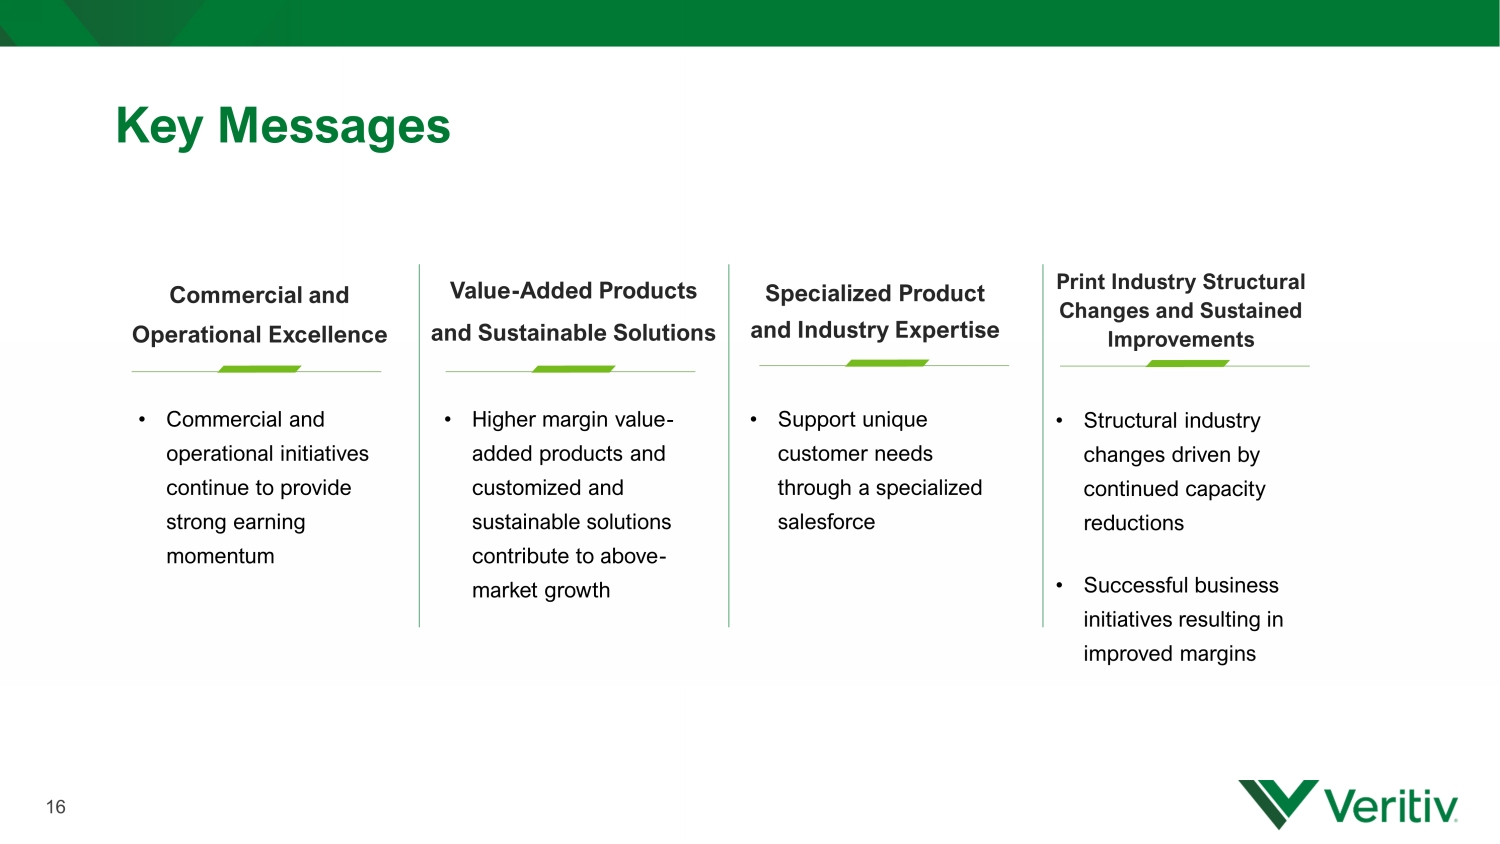
Key Messages Commercial and Operational Excellence • Support unique customer needs through a specialized salesforce 16 Value - Added Products and Sustainable Solutions • Higher margin value - added products and customized and sustainable solutions contribute to above - market growth Specialized Product and Industry Expertise • Commercial and operational initiatives continue to provide strong earning momentum • Structural industry changes driven by continued capacity reductions • Successful business initiatives resulting in improved margins Print Industry Structural Changes and Sustained Improvements

Questions 17

18 SCOTT PALFREEMAN Director of Finance and Investor Relations SAL ABBATE Chief Executive Officer

Appendix Reconciliation of Non - GAAP Financial Measures We supplement our financial information prepared in accordance with U.S. GAAP with certain non - GAAP measures including organic s ales (net sales on an average daily sales basis, excluding revenue from sold businesses and revenue from acquired businesses for a period of 12 mon ths after we complete the acquisition), Adjusted EBITDA (earnings before interest, income taxes, depreciation and amortization, restructuring charges, net , integration and acquisition expenses and other similar charges including any severance costs, costs associated with warehouse and office openings or clos ing s, consolidation, and relocation and other business optimization expenses, stock - based compensation expense, changes in the LIFO reserve, non - restruct uring asset impairment charges, non - restructuring severance charges, non - restructuring pension charges (benefits), fair value adjustments related to co ntingent liabilities assumed in mergers and acquisitions and certain other adjustments), free cash flow and other non - GAAP measures such as the Net Leverage Rat io (calculated as net debt divided by trailing twelve months of Adjusted EBITDA) and Return on Invested Capital (calculated as Net Operating Profit Afte r T ax divided by the sum of net working capital and property and equipment. Net Operating Profit After Tax is defined as Adjusted EBITDA less depreciation an d a mortization times 1 minus the standard tax rate 1 ). We believe investors commonly use Adjusted EBITDA, free cash flow and these other non - GAAP measures as key financial metrics for valuing companies; we also present organic sales to help investors better compare period - over - period results. In addition, the c redit agreement governing our Asset - Based Lending Facility (the "ABL Facility") permits us to exclude the foregoing and other charges in calculating "Consolid ated EBITDA", as defined in the ABL Facility. Organic sales, Adjusted EBITDA, free cash flow, Return on Invested Capital and these other non - GAAP measures are not alternative measures of financial performance or liquidity under U.S. GAAP. Non - GAAP measures do not have definitions under U.S. GAAP and may be defined different ly by, and not be comparable to, similarly titled measures used by other companies. As a result, we consider and evaluate non - GAAP measures in con nection with a review of the most directly comparable measure calculated in accordance with U.S. GAAP. We caution investors not to place undue reliance on su ch non - GAAP measures and to consider them with the most directly comparable U.S. GAAP measures. Organic sales, Adjusted EBITDA, free cash flow and th ese other non - GAAP measures have limitations as analytical tools and should not be considered in isolation or as a substitute for analyzing our res ults as reported under U.S. GAAP. Please see the following tables for reconciliations of non - GAAP measures to the most comparable U.S. GAAP measures. 1 The Company uses a standard tax rate of 26% due to the historic volatility of the Company’s effective tax rate. 19
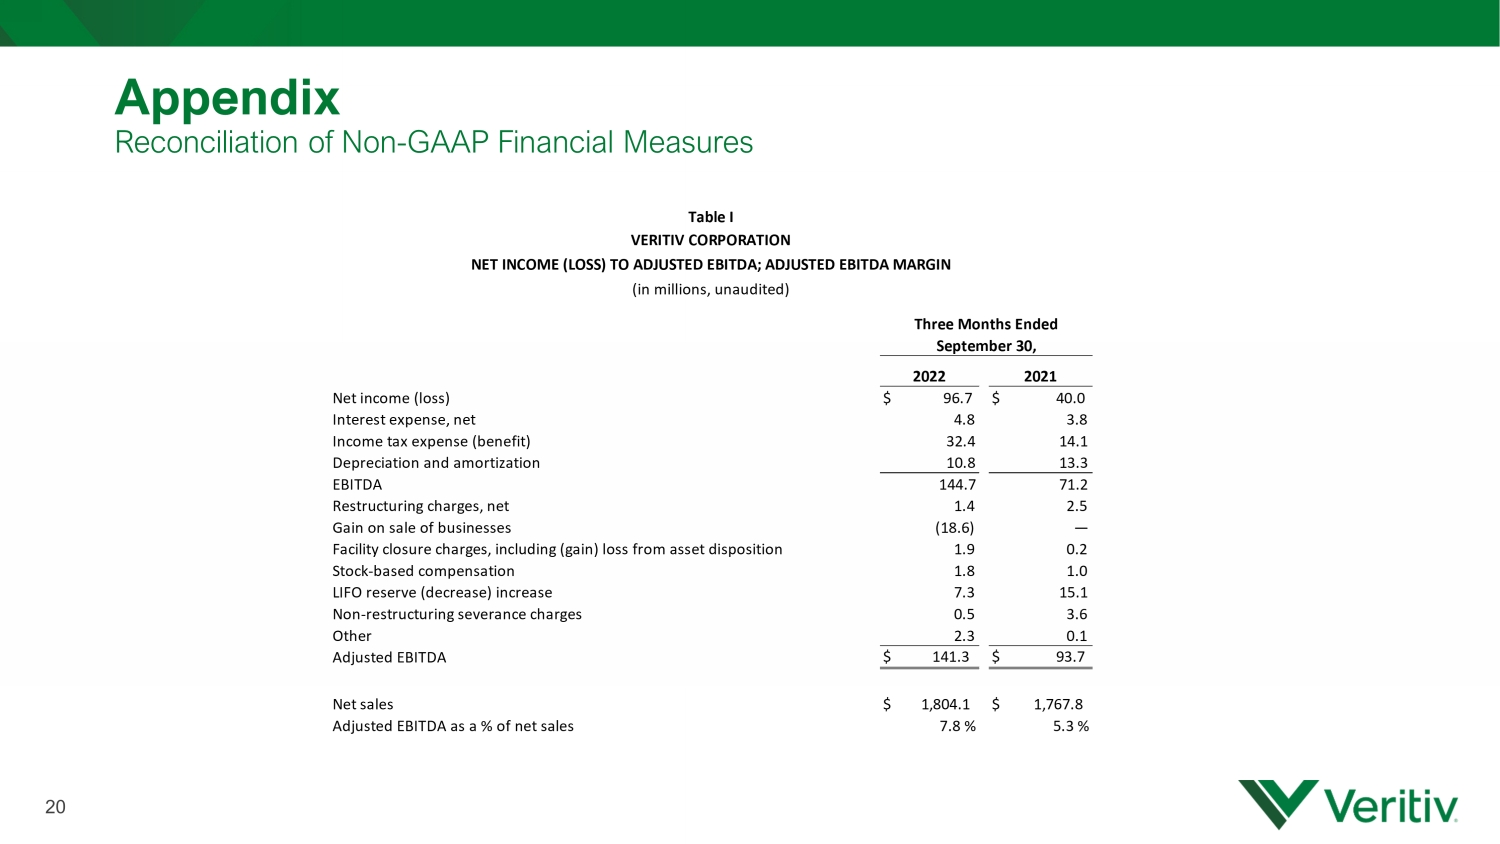
Appendix Reconciliation of Non - GAAP Financial Measures 20 2022 2021 Net income (loss) $ 96.7 $ 40.0 Interest expense, net 4.8 3.8 Income tax expense (benefit) 32.4 14.1 Depreciation and amortization 10.8 13.3 EBITDA 144.7 71.2 Restructuring charges, net 1.4 2.5 Gain on sale of businesses (18.6) — Facility closure charges, including (gain) loss from asset disposition 1.9 0.2 Stock-based compensation 1.8 1.0 LIFO reserve (decrease) increase 7.3 15.1 Non-restructuring severance charges 0.5 3.6 Other 2.3 0.1 Adjusted EBITDA $ 141.3 $ 93.7 Net sales $ 1,804.1 $ 1,767.8 Adjusted EBITDA as a % of net sales 7.8 % 5.3 % Three Months Ended September 30, Table I VERITIV CORPORATION NET INCOME (LOSS) TO ADJUSTED EBITDA; ADJUSTED EBITDA MARGIN (in millions, unaudited)
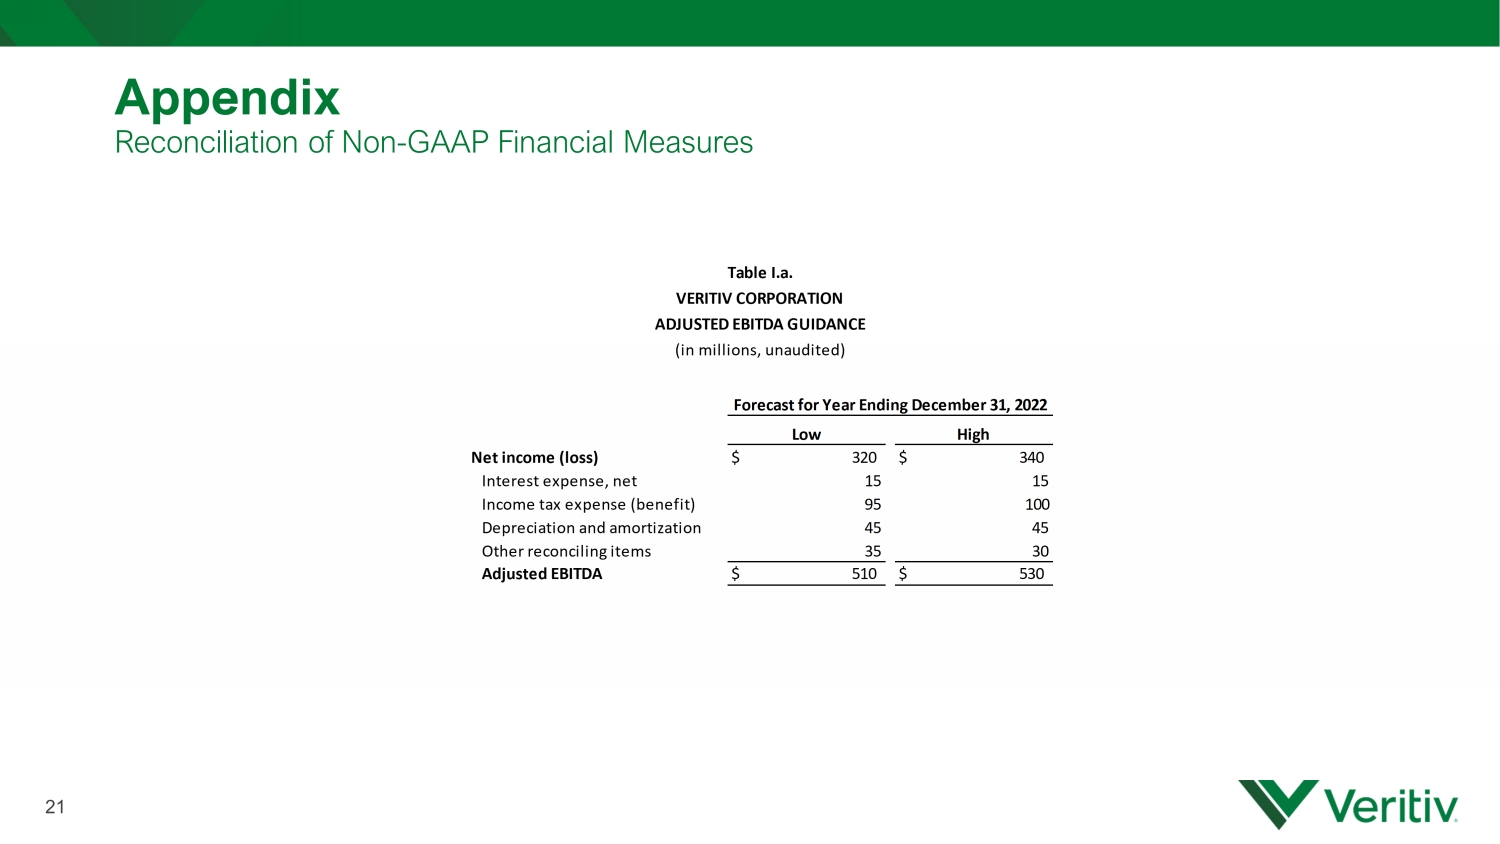
21 Appendix Reconciliation of Non - GAAP Financial Measures Low High Net income (loss) $ 320 $ 340 Interest expense, net 15 15 Income tax expense (benefit) 95 100 Depreciation and amortization 45 45 Other reconciling items 35 30 Adjusted EBITDA $ 510 $ 530 Forecast for Year Ending December 31, 2022 Table I.a. VERITIV CORPORATION ADJUSTED EBITDA GUIDANCE (in millions, unaudited)
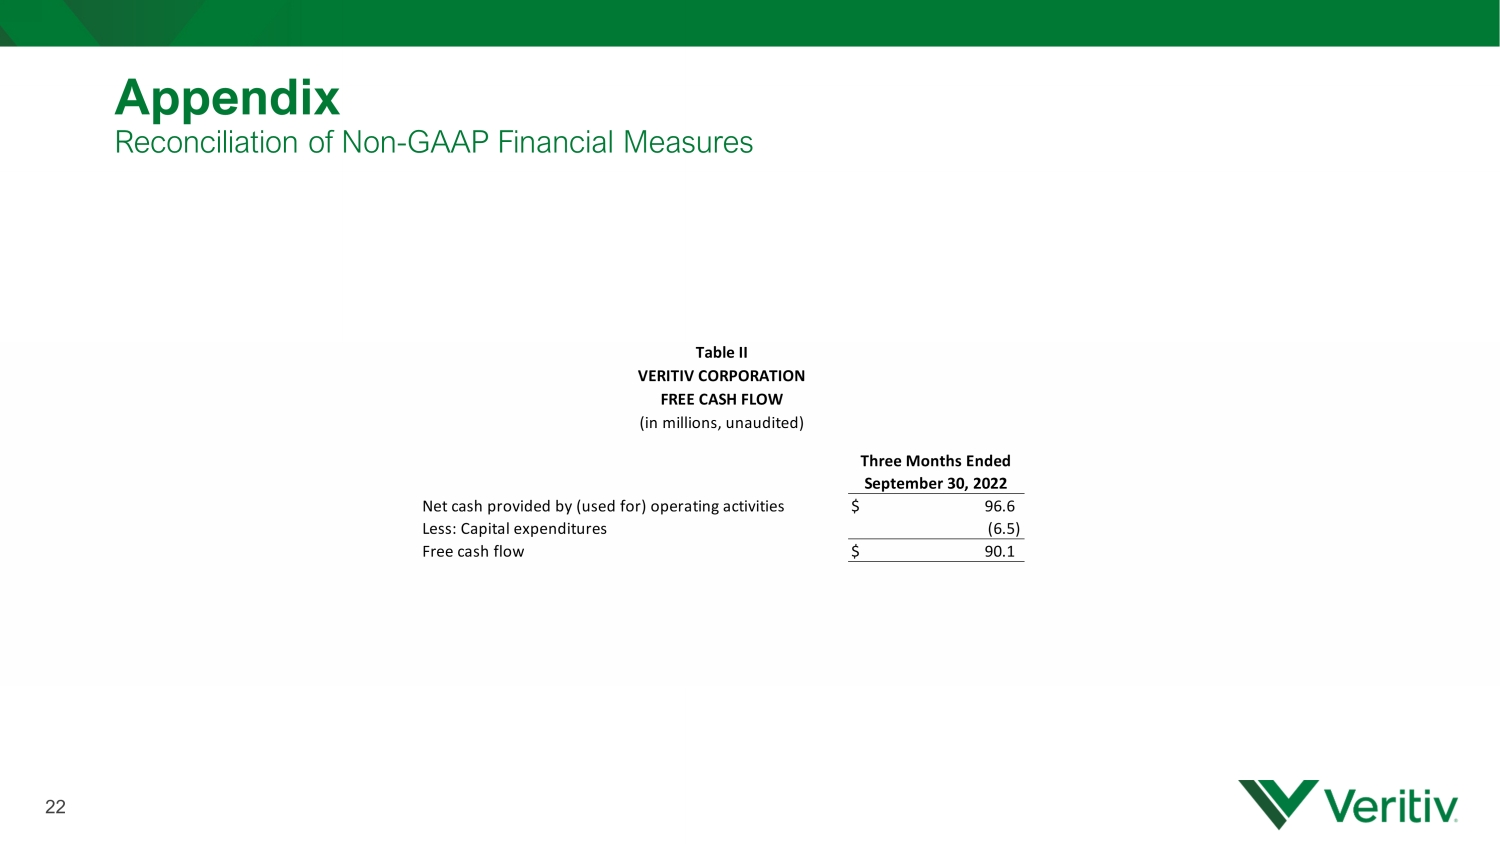
22 Appendix Reconciliation of Non - GAAP Financial Measures Three Months Ended September 30, 2022 Net cash provided by (used for) operating activities $ 96.6 Less: Capital expenditures (6.5) Free cash flow $ 90.1 Table II VERITIV CORPORATION FREE CASH FLOW (in millions, unaudited)
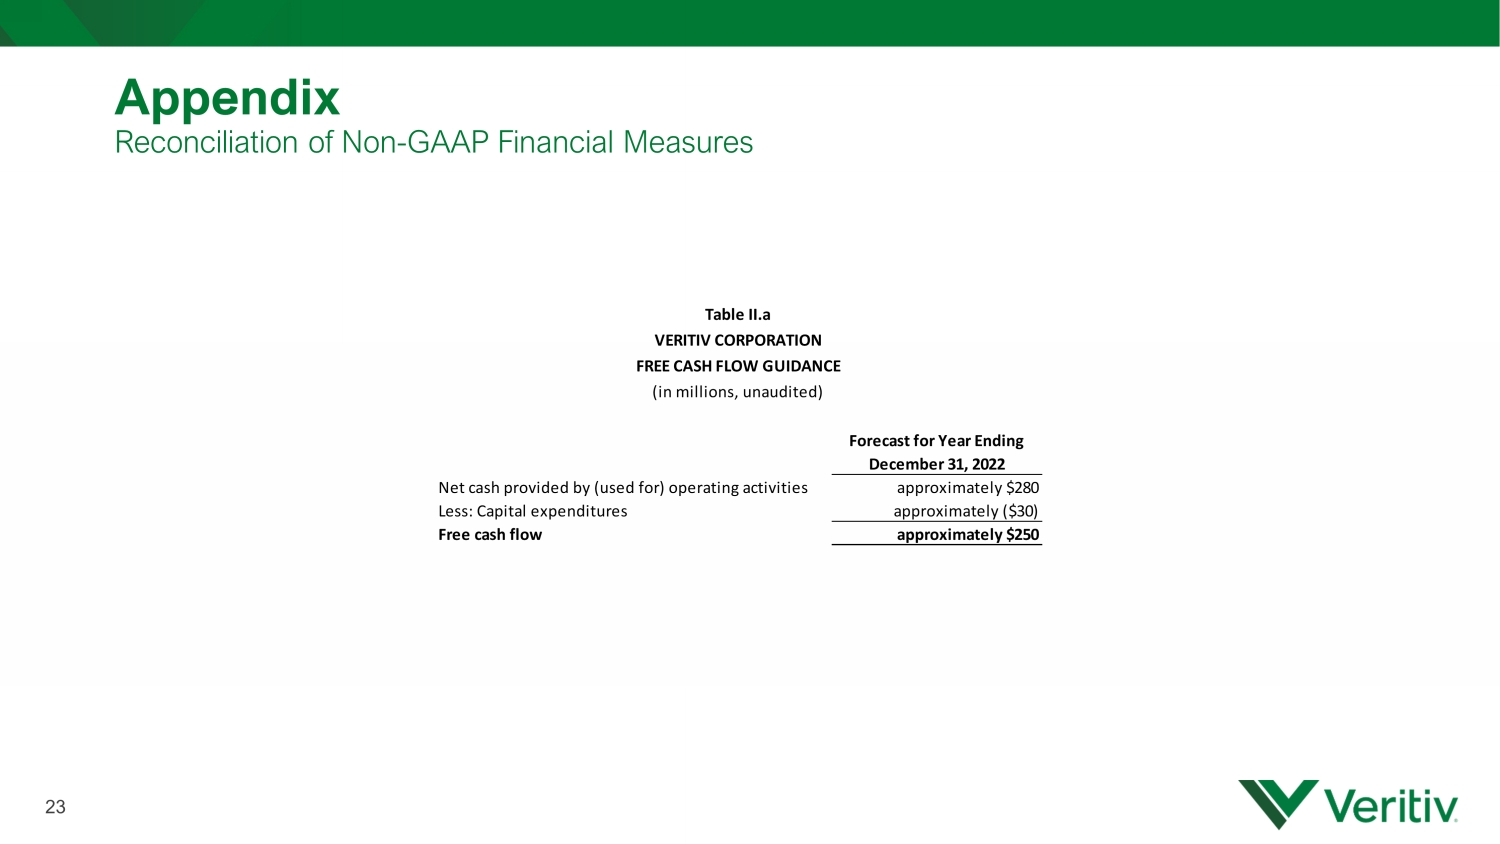
23 Appendix Reconciliation of Non - GAAP Financial Measures Forecast for Year Ending December 31, 2022 Net cash provided by (used for) operating activities approximately $280 Less: Capital expenditures approximately ($30) Free cash flow approximately $250 Table II.a VERITIV CORPORATION FREE CASH FLOW GUIDANCE (in millions, unaudited)
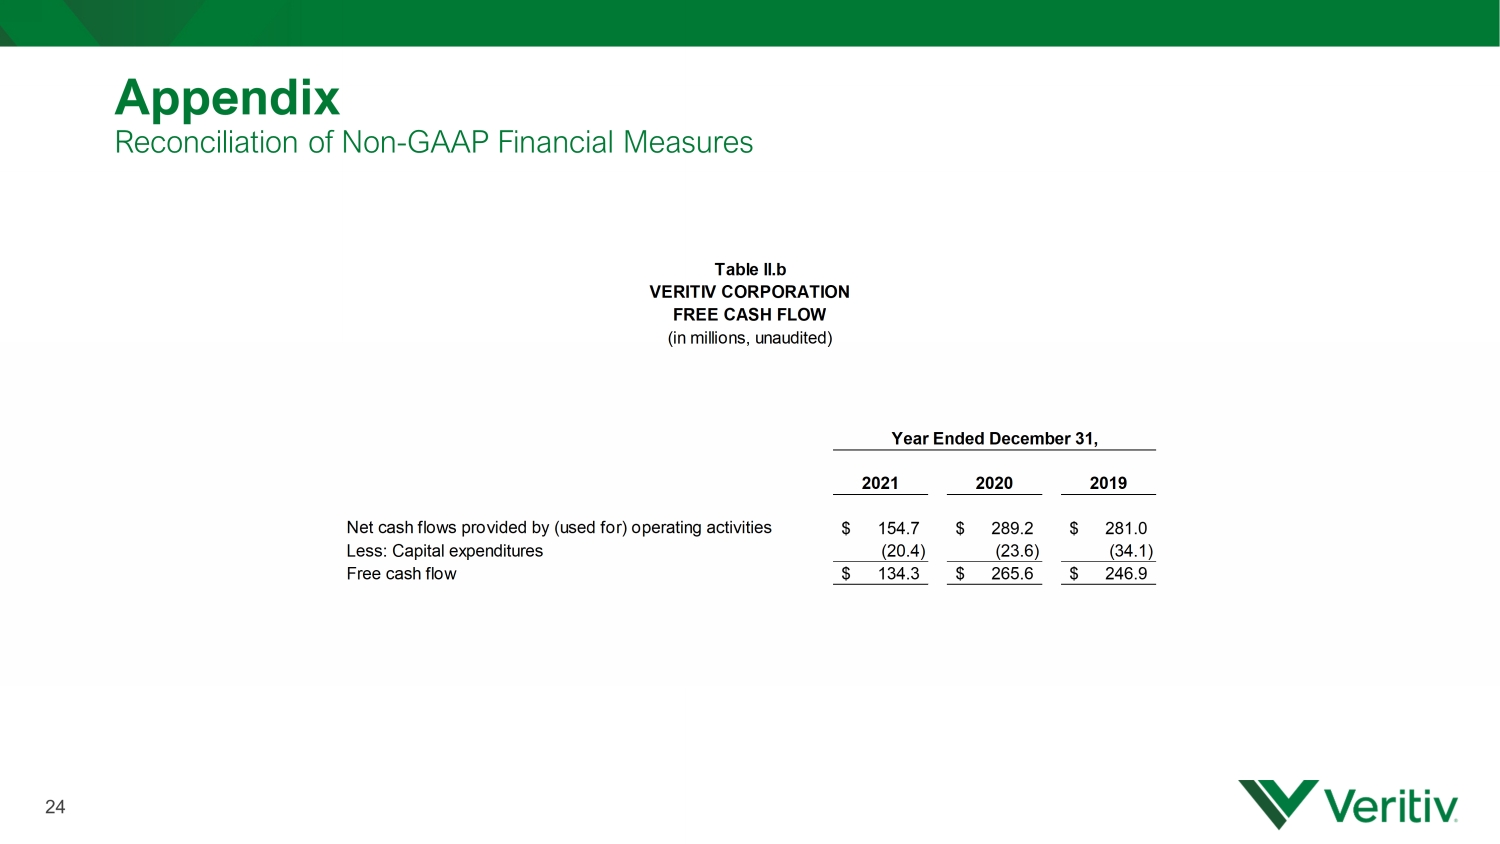
24 Appendix Reconciliation of Non - GAAP Financial Measures VERITIV CORPORATION FREE CASH FLOW (in millions, unaudited) 2021 2020 2019 Net cash flows provided by (used for) operating activities 154.7$ 289.2$ 281.0$ Less: Capital expenditures (20.4) (23.6) (34.1) Free cash flow 134.3$ 265.6$ 246.9$ Table ll.b Year Ended December 31,
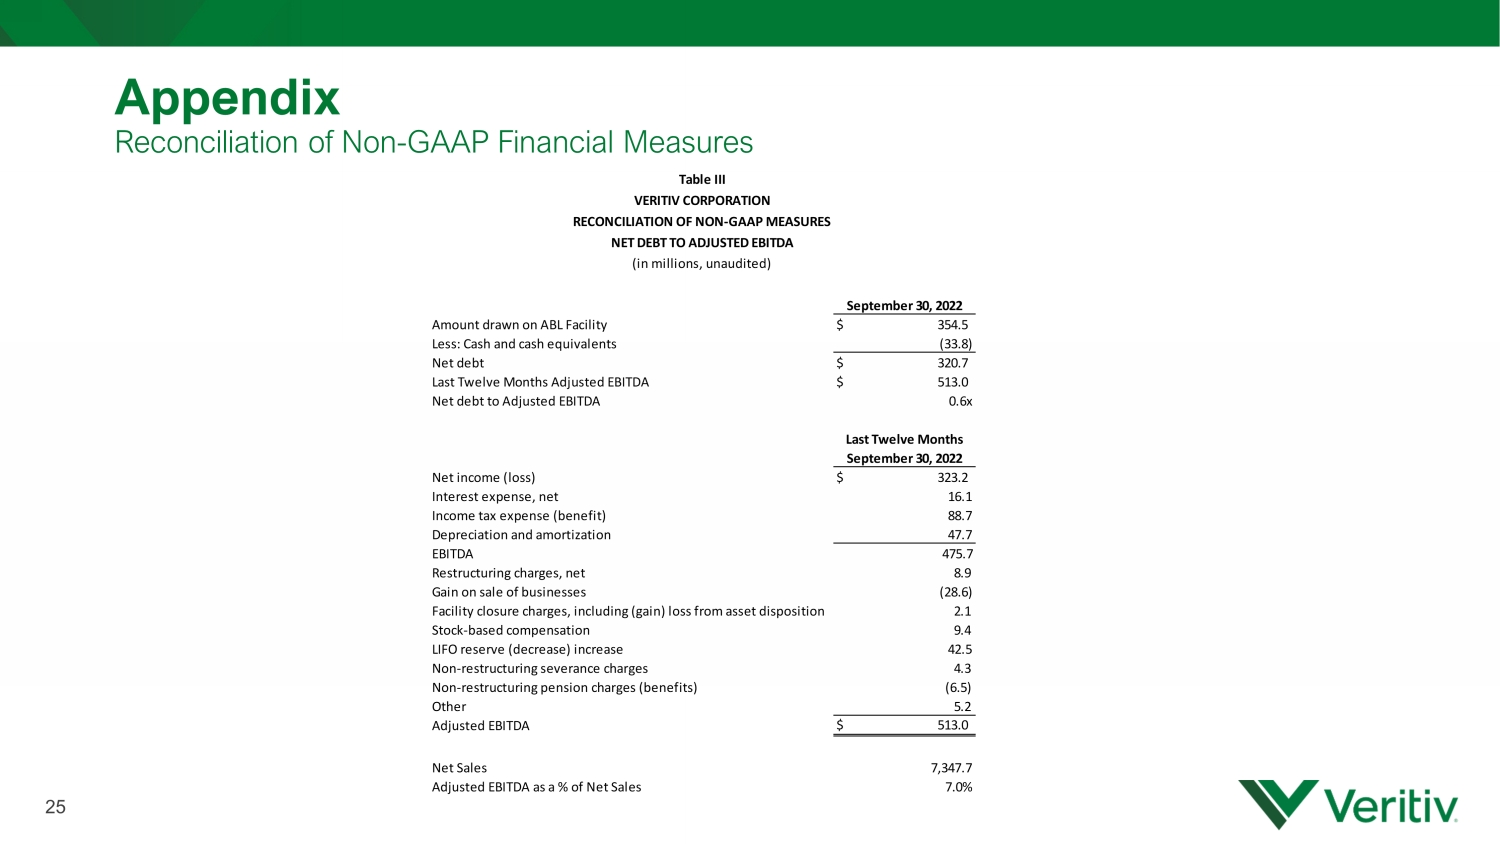
25 Appendix Reconciliation of Non - GAAP Financial Measures September 30, 2022 Amount drawn on ABL Facility $ 354.5 Less: Cash and cash equivalents (33.8) Net debt $ 320.7 Last Twelve Months Adjusted EBITDA $ 513.0 Net debt to Adjusted EBITDA 0.6x Last Twelve Months September 30, 2022 Net income (loss) $ 323.2 Interest expense, net 16.1 Income tax expense (benefit) 88.7 Depreciation and amortization 47.7 EBITDA 475.7 Restructuring charges, net 8.9 Gain on sale of businesses (28.6) Facility closure charges, including (gain) loss from asset disposition 2.1 Stock-based compensation 9.4 LIFO reserve (decrease) increase 42.5 Non-restructuring severance charges 4.3 Non-restructuring pension charges (benefits) (6.5) Other 5.2 Adjusted EBITDA $ 513.0 Net Sales 7,347.7 Adjusted EBITDA as a % of Net Sales 7.0% Table III VERITIV CORPORATION RECONCILIATION OF NON-GAAP MEASURES NET DEBT TO ADJUSTED EBITDA (in millions, unaudited)

26 Appendix Reconciliation of Non - GAAP Financial Measures 2021 2020 2019 Amount drawn on ABL Facility 440.8$ 520.2$ 673.2$ Less: Cash and cash equivalents (49.3) (120.6) (38.0) Net debt 391.5$ 399.6$ 635.2$ Last twelve months Adjusted EBITDA 342.6$ 187.6$ 155.9$ Net debt to Adjusted EBITDA 1.1x 2.1x 4.1x 2021 2020 2019 Net income (loss) 144.6$ 34.2$ (29.5)$ Interest expense, net 17.2 25.1 38.1 Income tax expense (benefit) 52.9 8.8 0.7 Depreciation and amortization 55.2 57.7 53.5 EBITDA 269.9 125.8 62.8 Restructuring charges, net 15.4 52.2 28.8 Gain on sale of businesses (3.1) - - Facility closure charges, including (gain) loss from asset disposition 0.1 (3.7) - Stock-based compensation 7.4 17.7 14.6 LIFO reserve (decrease) increase 43.6 (1.5) (3.7) Non-restructuring severance charges 7.8 4.1 8.4 Non-restructuring pension charges (benefits) 0.5 7.2 6.6 Integration, acquisition and merger expenses - - 17.5 Fair value adjustment on Tax Receivable Agreement contingent liability - (19.1) 0.3 Fair value adjustment on contingent consideration liability - 1.0 13.1 Escheat audit contingent liability - (0.2) 3.7 Other 1.0 4.1 3.8 Adjusted EBITDA 342.6$ 187.6$ 155.9$ Net Sales 6,850.5$ 6,345.6$ 7,659.4$ Adjusted EBITDA Margin 5.0% 3.0% 2.0% Table lll.a VERITIV CORPORATION RECONCILIATION OF NON-GAAP MEASURES NET DEBT TO ADJUSTED EBITDA (in millions, unaudited) Year Ended December 31,
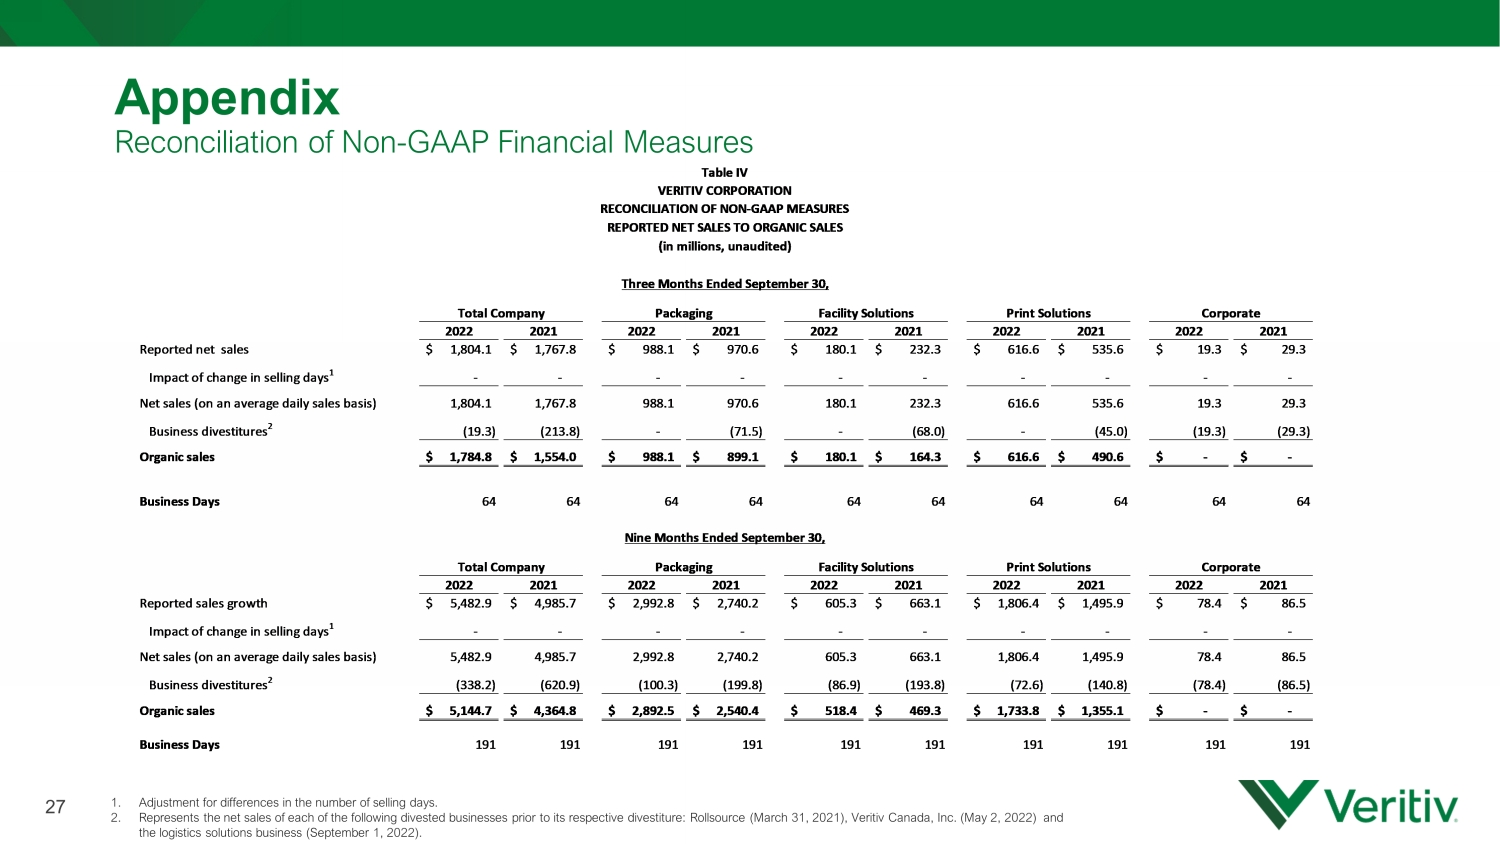
27 Appendix Reconciliation of Non - GAAP Financial Measures 1. Adjustment for differences in the number of selling days. 2. Represents the net sales of each of the following divested businesses prior to its respective divestiture: Rollsource (March 31, 2021), Veritiv Canada, Inc. (May 2, 2022) and the logistics solutions business (September 1, 2022). 2022 2021 2022 2021 2022 2021 2022 2021 2022 2021 Reported net sales 1,804.1$ 1,767.8$ 988.1$ 970.6$ 180.1$ 232.3$ 616.6$ 535.6$ 19.3$ 29.3$ Impact of change in selling days 1 - - - - - - - - - - Net sales (on an average daily sales basis) 1,804.1 1,767.8 988.1 970.6 180.1 232.3 616.6 535.6 19.3 29.3 Business divestitures 2 (19.3) (213.8) - (71.5) - (68.0) - (45.0) (19.3) (29.3) Organic sales 1,784.8$ 1,554.0$ 988.1$ 899.1$ 180.1$ 164.3$ 616.6$ 490.6$ -$ -$ Business Days 64 64 64 64 64 64 64 64 64 64 2022 2021 2022 2021 2022 2021 2022 2021 2022 2021 Reported sales growth 5,482.9$ 4,985.7$ 2,992.8$ 2,740.2$ 605.3$ 663.1$ 1,806.4$ 1,495.9$ 78.4$ 86.5$ Impact of change in selling days 1 - - - - - - - - - - Net sales (on an average daily sales basis) 5,482.9 4,985.7 2,992.8 2,740.2 605.3 663.1 1,806.4 1,495.9 78.4 86.5 Business divestitures 2 (338.2) (620.9) (100.3) (199.8) (86.9) (193.8) (72.6) (140.8) (78.4) (86.5) Organic sales 5,144.7$ 4,364.8$ 2,892.5$ 2,540.4$ 518.4$ 469.3$ 1,733.8$ 1,355.1$ -$ -$ Business Days 191 191 191 191 191 191 191 191 191 191 RECONCILIATION OF NON-GAAP MEASURES Corporate Table IV VERITIV CORPORATION REPORTED NET SALES TO ORGANIC SALES (in millions, unaudited) Three Months Ended September 30, Print Solutions Print Solutions Total Company Packaging Facility Solutions Total Company Packaging Facility Solutions Nine Months Ended September 30, Corporate
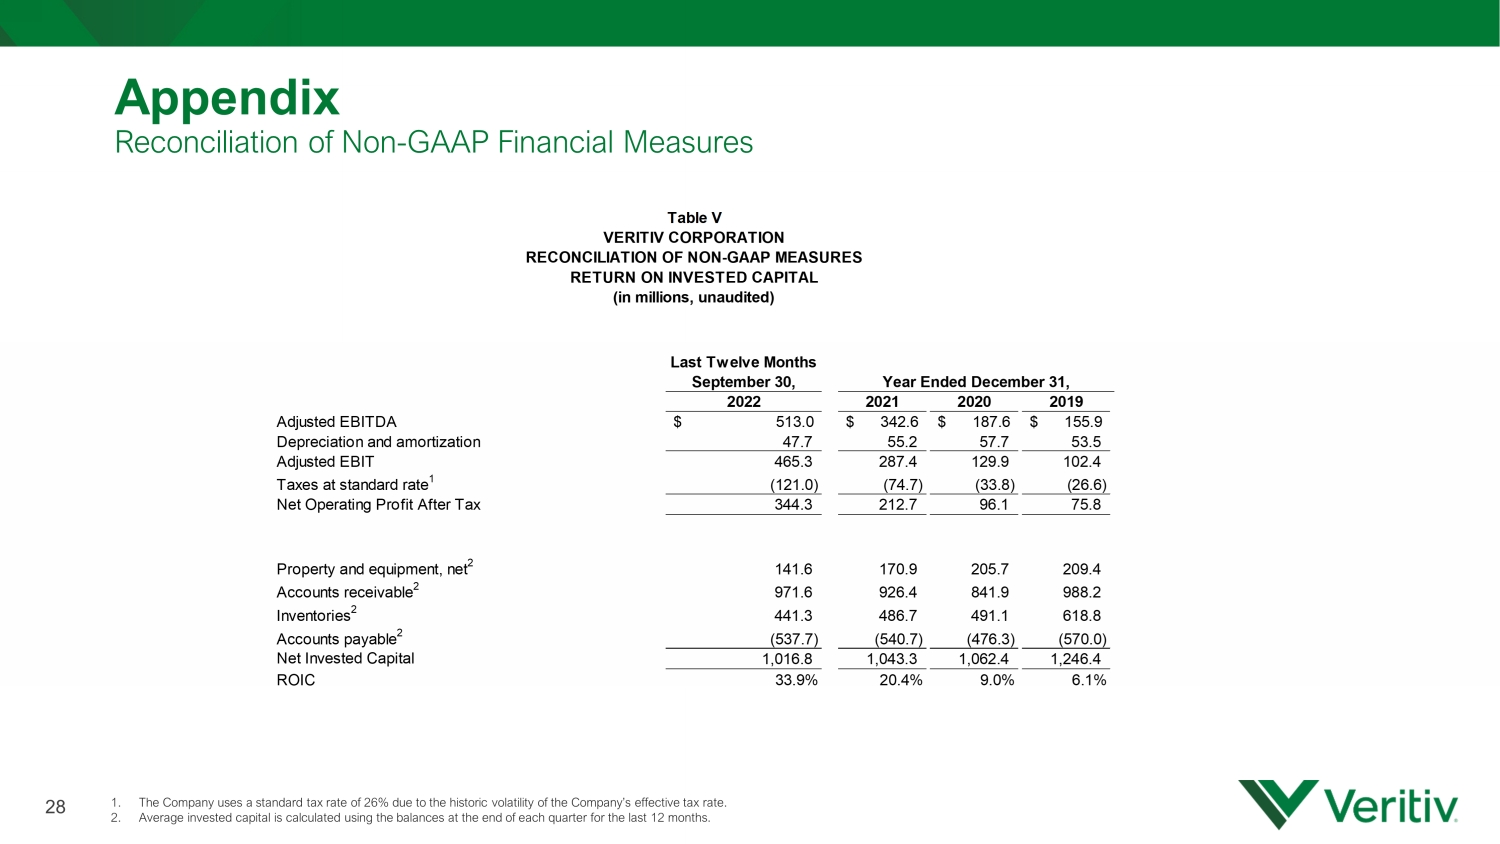
28 Appendix Reconciliation of Non - GAAP Financial Measures 1. The Company uses a standard tax rate of 26% due to the historic volatility of the Company’s effective tax rate. 2. Average invested capital is calculated using the balances at the end of each quarter for the last 12 months. Last Twelve Months September 30, 2022 2021 2020 2019 Adjusted EBITDA 513.0$ 342.6$ 187.6$ 155.9$ Depreciation and amortization 47.7 55.2 57.7 53.5 Adjusted EBIT 465.3 287.4 129.9 102.4 Taxes at standard rate 1 (121.0) (74.7) (33.8) (26.6) Net Operating Profit After Tax 344.3 212.7 96.1 75.8 Property and equipment, net 2 141.6 170.9 205.7 209.4 Accounts receivable 2 971.6 926.4 841.9 988.2 Inventories 2 441.3 486.7 491.1 618.8 Accounts payable 2 (537.7) (540.7) (476.3) (570.0) Net Invested Capital 1,016.8 1,043.3 1,062.4 1,246.4 ROIC 33.9% 20.4% 9.0% 6.1% Year Ended December 31, Table V VERITIV CORPORATION RECONCILIATION OF NON-GAAP MEASURES RETURN ON INVESTED CAPITAL (in millions, unaudited)

29 THIRD QUARTER 2022 FINANCIAL RESULTS November 8, 2022