
1 © Veritiv 2023 All Rights Reserved Veritiv Investor Presentation NYSE: VRTV March 2023 EXHIBIT 99.1
2 © Veritiv 2023 All Rights Reserved Forward Looking Statements Provision Certain statements contained in this presentation regarding Veritiv Corporation’s (the "Company") future operating results, p erf ormance, strategy, business plans, prospects and guidance, statements related to customer demand, supply and demand imbalances, the expected competitive landscape, the expected impact of COVID - 19 an d any other statements not constituting historical fact are "forward - looking statements" subject to the safe harbor created by the Private Securities Litigation Reform Act of 1995. Where p ossible, the words "believe," "expect," "anticipate," "continue," "intend," "will," "may," "should," "could," "would," "plan," "estimate," "predict," "potential," "goal," "outlook," or the negative of suc h terms, or other comparable expressions, have been used to identify such forward - looking statements. All forward - looking statements reflect only the Company’s current beliefs and assumptions with respect to fu ture results and other matters, and are based on information currently available to the Company. Accordingly, the statements are subject to significant risks, uncertainties and contingencies, whic h c ould cause the Company’s actual operating results, performance, strategy, business plans, prospects or guidance to differ materially from those expressed in, or implied by, these statements . Factors that could cause actual results to differ materially from current expectations include the risks and other factors de scr ibed under "Risk Factors" and elsewhere in our Annual Report on Form 10 - K and in the Company's other publicly available reports filed with the Securities and Exchange Commission ("SEC"). Such risks a nd other factors, which in some instances are beyond the Company's control, include the industry - wide decline in demand for paper and related products; increased competition from existing and non - traditional sources; procurement and other risks in obtaining packaging, facility products and paper from our suppliers for resale to our customers; changes in prices for raw materials; c han ges in trade policies and regulations; increases in the cost of fuel and third - party freight and the availability of third - party freight providers; the loss of multiple significant customers; adverse d evelopments in general business and economic conditions that could impair our ability to use net operating loss carryforwards and other deferred tax assets; our ability to adequately protect our material in tellectual property and other proprietary rights, or to defend successfully against intellectual property infringement claims by third parties; our ability to attract, train and retain appropriately qu ali fied employees; our pension and health care costs and participation in multi - employer pension, health and welfare plans; the effects of work stoppages, union negotiations and labor disputes; our ability to generate sufficient cash to service our debt; our ability to comply with the covenants contained in our debt agreements; costs to comply with laws, rules and regulations, including environmental, health an d safety laws, and to satisfy any liability or obligation imposed under such laws; our ability to adequately address environmental, social and governance matters; changes in tax laws; adverse resu lts from litigation, governmental investigations or audits, or tax - related proceedings or audits; regulatory changes and judicial rulings impacting our business; adverse impacts from the COVID - 19 pandemi c, the impact of adverse developments in general business and economic conditions as well as conditions in the global capital and credit markets on demand for our products and services, o ur business including our international operations, and our customers; foreign currency fluctuations; inclement weather, widespread outbreak of an illness, anti - terrorism measures and other disruptio ns to our supply chain, distribution system and operations; our dependence on a variety of information technology and telecommunications systems and the Internet; our reliance on third - party v endors for various services; cybersecurity risks; and other events of which we are presently unaware or that we currently deem immaterial that may result in unexpected adverse operating results. The Company is not responsible for updating the information contained in this presentation beyond the published date or for c han ges made to this presentation by wire services or internet service providers. This presentation is being furnished to the SEC through a Form 8 - K. We reference non - GAAP financial measures in this presentation. Please see the appendix for reconciliations of non - GAAP measures to the most comparable United States ("U.S.") GAAP measures.
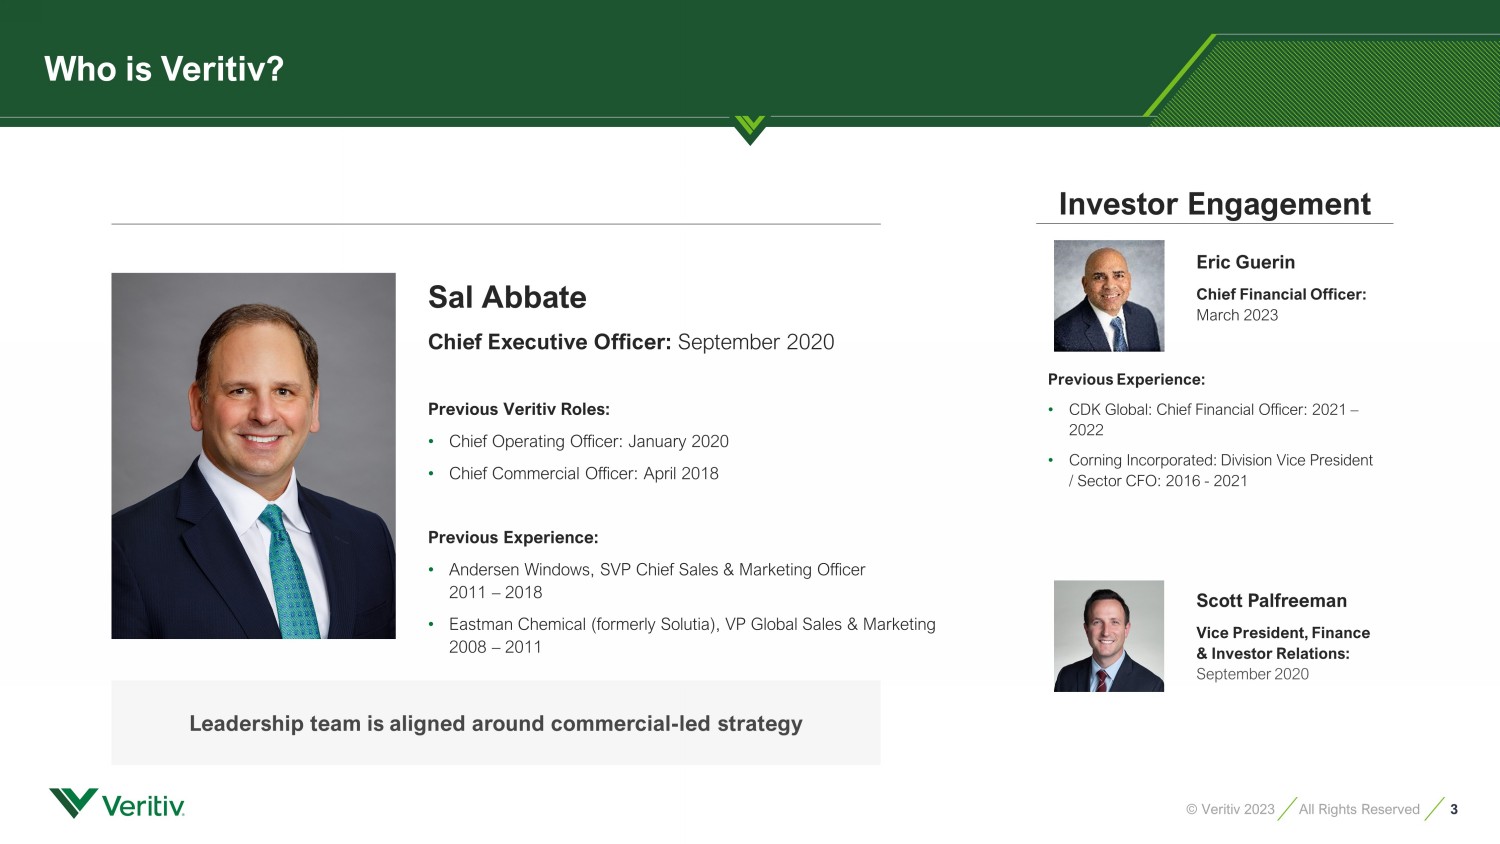
3 © Veritiv 2023 All Rights Reserved Sal Abbate Chief Executive Officer: September 2020 Previous Veritiv Roles: • Chief Operating Officer: January 2020 • Chief Commercial Officer: April 2018 Previous Experience: • Andersen Windows, SVP Chief Sales & Marketing Officer 2011 – 2018 • Eastman Chemical (formerly Solutia), VP Global Sales & Marketing 2008 – 2011 Eric Guerin Chief Financial Officer: March 2023 Investor Engagement Scott Palfreeman Vice President, Finance & Investor Relations: September 2020 Previous Experience: • CDK Global: Chief Financial Officer: 2021 – 2022 • Corning Incorporated: Division Vice President / Sector CFO: 2016 - 2021 Leadership team is aligned around commercial - led strategy Who is Veritiv?
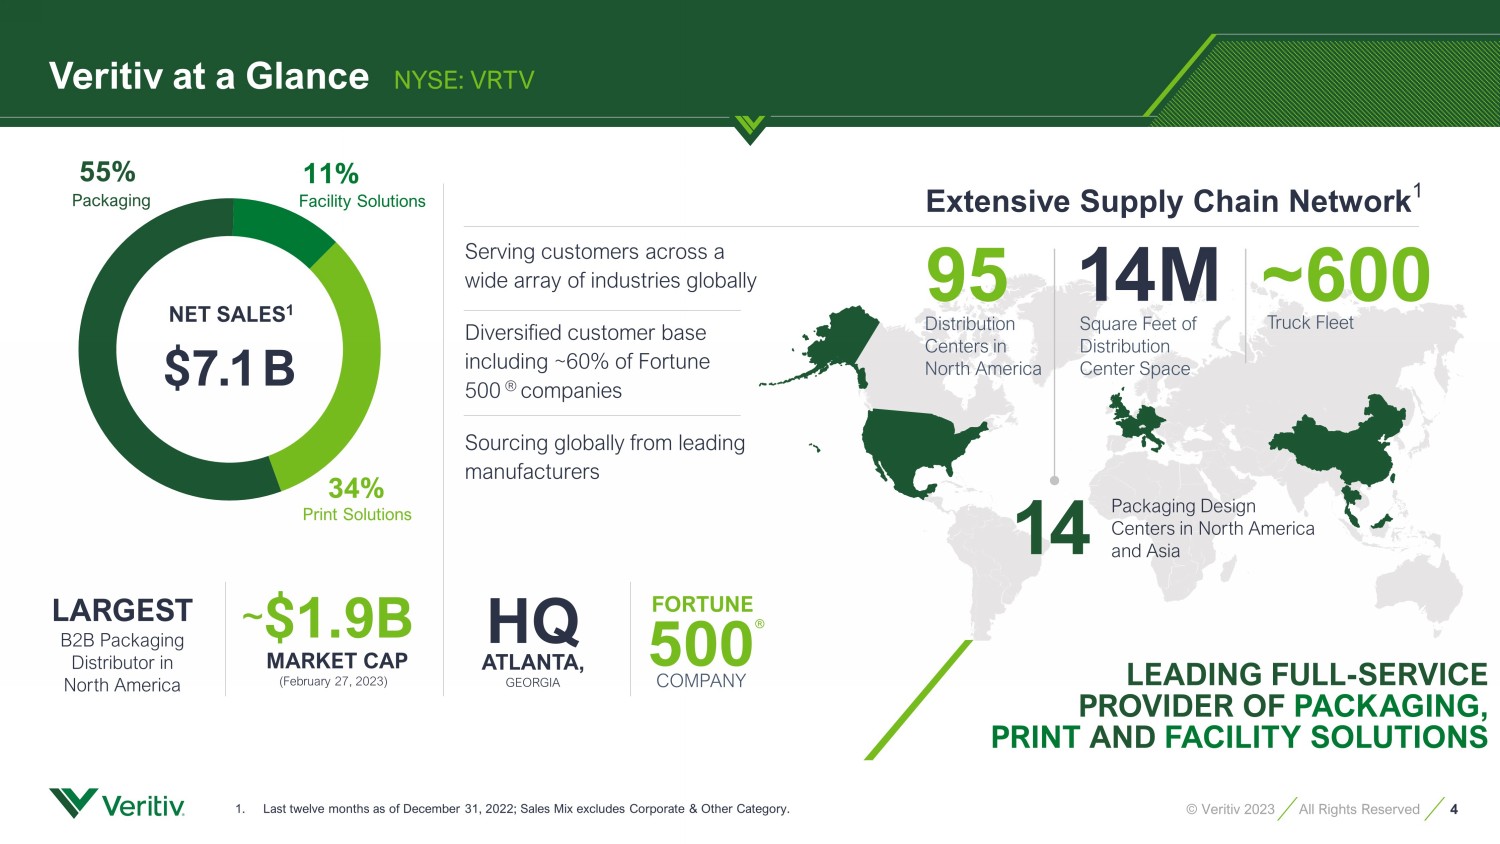
4 © Veritiv 2023 All Rights Reserved LEADING FULL - SERVICE PROVIDER OF PACKAGING, PRINT AND FACILITY SOLUTIONS LARGEST B2B Packaging Distributor in North America ~ $ 1.9B MARKET CAP (February 27, 2023) FORTUNE 500 COMPANY ® HQ ATLANTA, GEORGIA 1 4M Square Feet of Distribution Center Space ~600 Truck Fleet 14 Packaging Design Centers in North America and Asia 1. Last twelve months as of December 31, 2022; Sales Mix excludes Corporate & Other Category. Extensive Supply Chain Network 1 NET SALES 1 $ 7. 1B 34% 11% 55% Distribution Centers in North America 95 Serving customers across a wide array of industries globally Diversified customer base including ~60% of Fortune 500 ® companies Sourcing globally from leading manufacturers Veritiv at a Glance NYSE: VRTV Facility Solutions Packaging Print Solutions
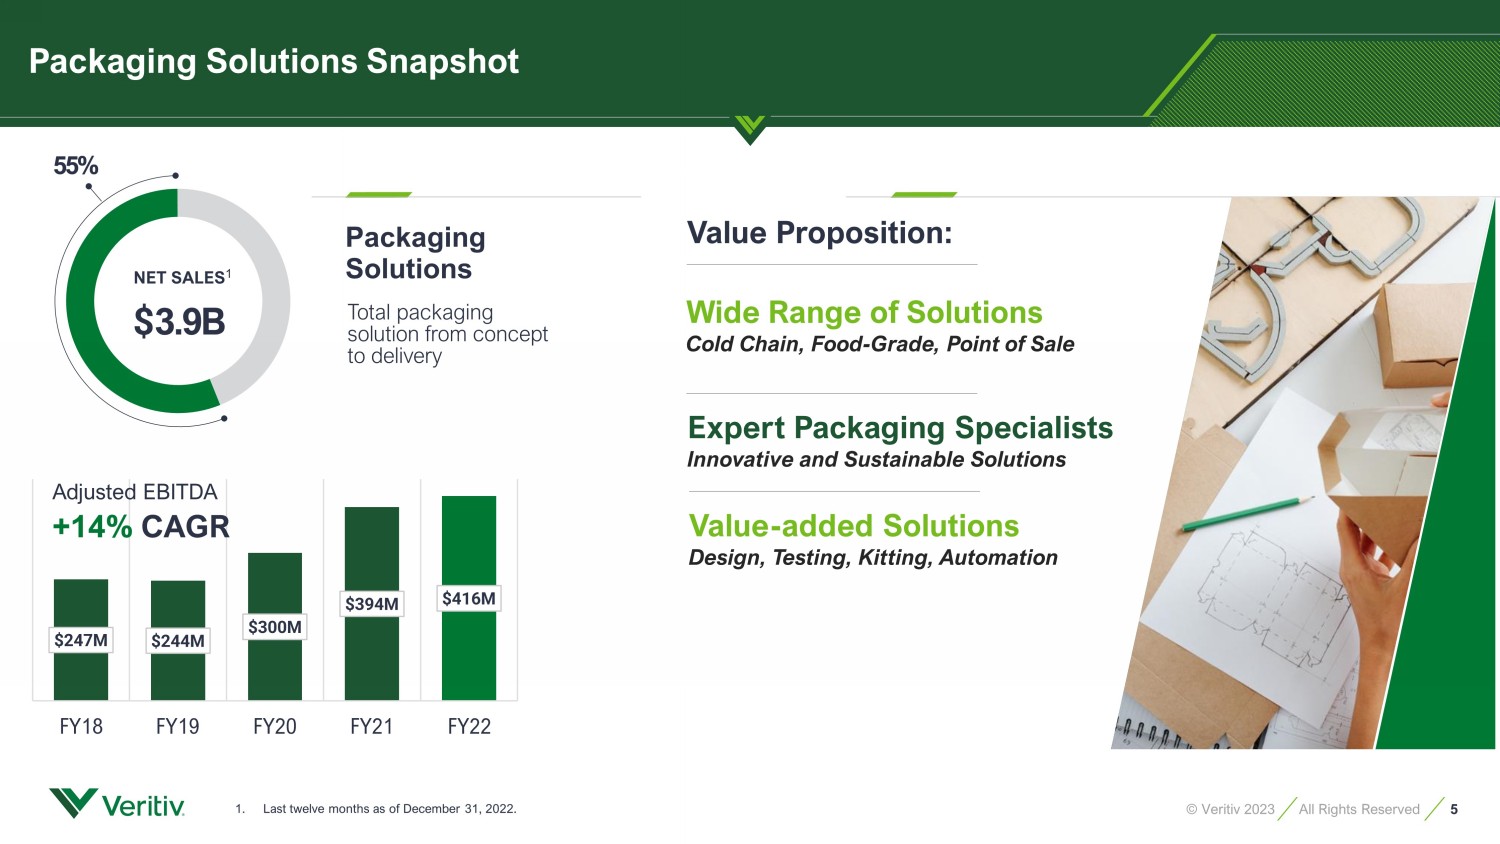
5 © Veritiv 2023 All Rights Reserved Total packaging solution from concept to delivery $247M $244M $300M $394M $416M FY18 FY19 FY21 FY20 FY22 Packaging Solutions Snapshot Packaging Solutions NET SALES 1 $ 3.9 B 55% Adjusted EBITDA +14% CAGR Value Proposition: Value - added Solutions Design, Testing , Kitting, Automation Wide Range of Solutions Cold Chain, Food - Grade, Point of Sale Expert Packaging Specialists Innovative and Sustainable Solutions 1. Last twelve months as of December 31, 2022.
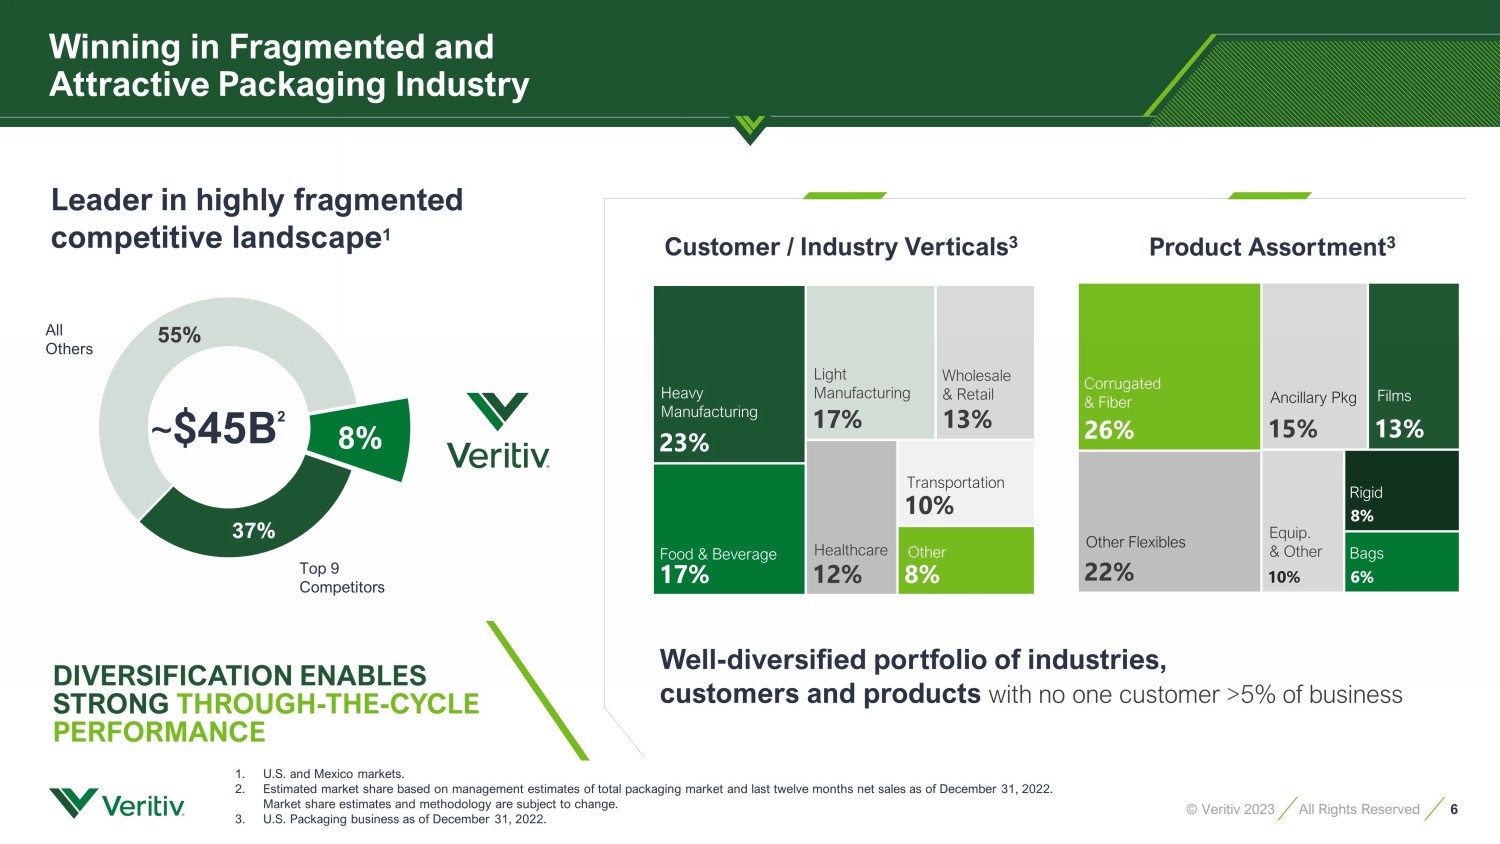
6 © Veritiv 2023 All Rights Reserved Winning in Fragmented and Attractive Packaging Industry 37% 55% 1 ~ $ 45B 2 All Others Top 9 Competitors Leader in highly fragmented competitive landscape 1 Well - diversified portfolio of industries, customers and products with no one customer >5% of business Customer / Industry Verticals 3 Product Assortment 3 Corrugated & Fiber Ancillary Pkg Other Flexibles Films Equip. & Other Bags Heavy Manufacturing Food & Beverage Other Light Manufacturing Healthcare Wholesale & Retail Transportation DIVERSIFICATION ENABLES STRONG THROUGH - THE - CYCLE PERFORMANCE 1. U.S. and Mexico markets. 2. Estimated market share based on management estimates of total packaging market and last twelve months net sales as of Decembe r 3 1, 2022. Market share estimates and methodology are subject to change. 3. U.S. Packaging business as of December 31, 2022. Rigid 8%
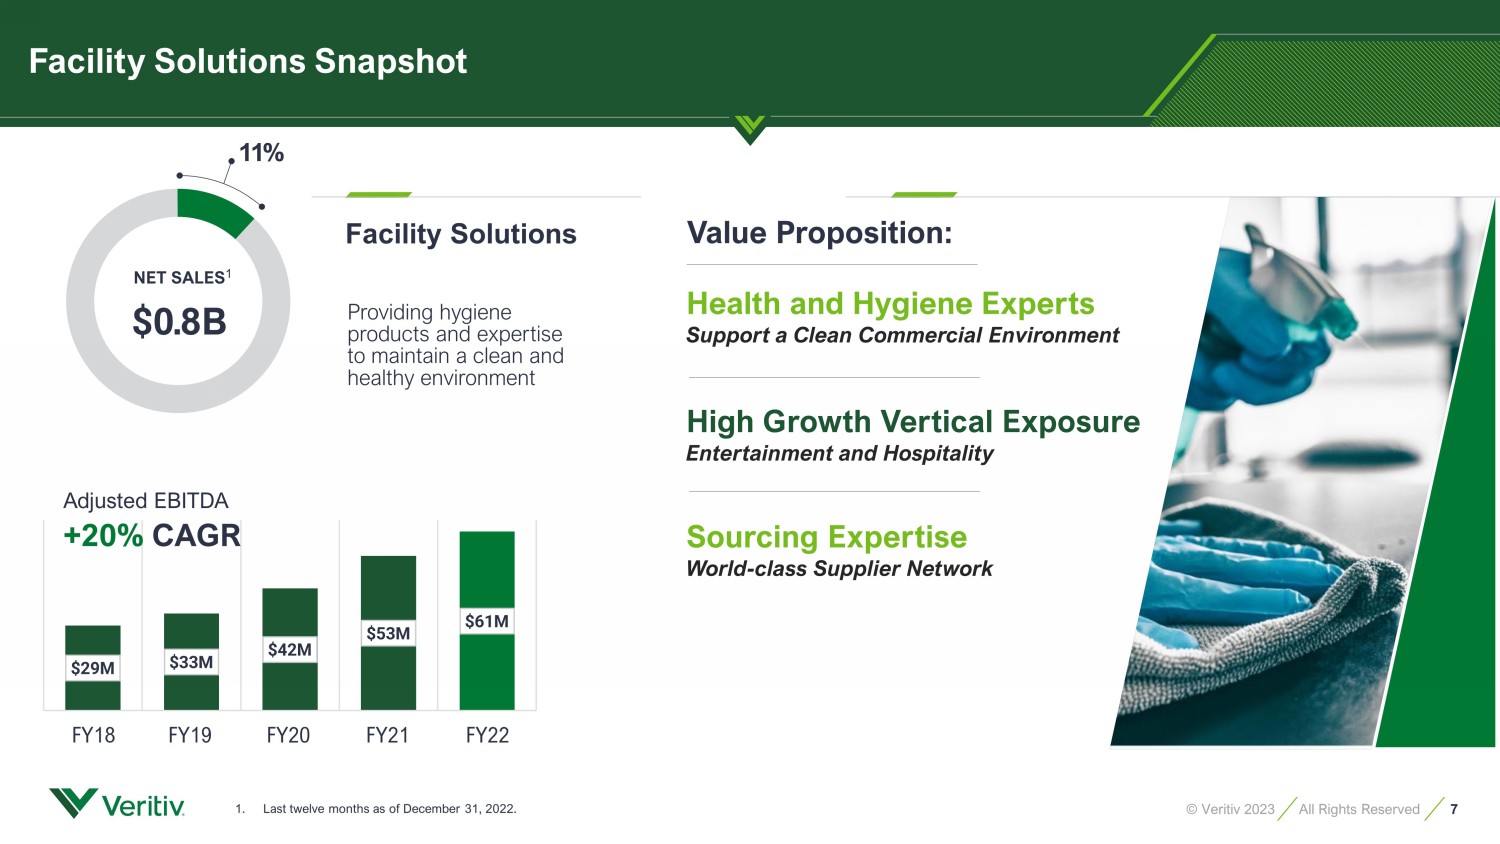
7 © Veritiv 2023 All Rights Reserved Providing hygiene products and expertise to maintain a clean and healthy environment Facility Solutions Snapshot Facility Solutions NET SALES 1 $ 0. 8B 11% $29M $33M $42M $53M $61M Adjusted EBITDA +20% CAGR FY18 FY19 FY21 FY20 FY22 Value Proposition: Health and Hygiene Experts Support a Clean Commercial Environment High Growth Vertical Exposure Entertainment and Hospitality Sourcing Expertise World - class Supplier Network 1. Last twelve months as of December 31, 2022.
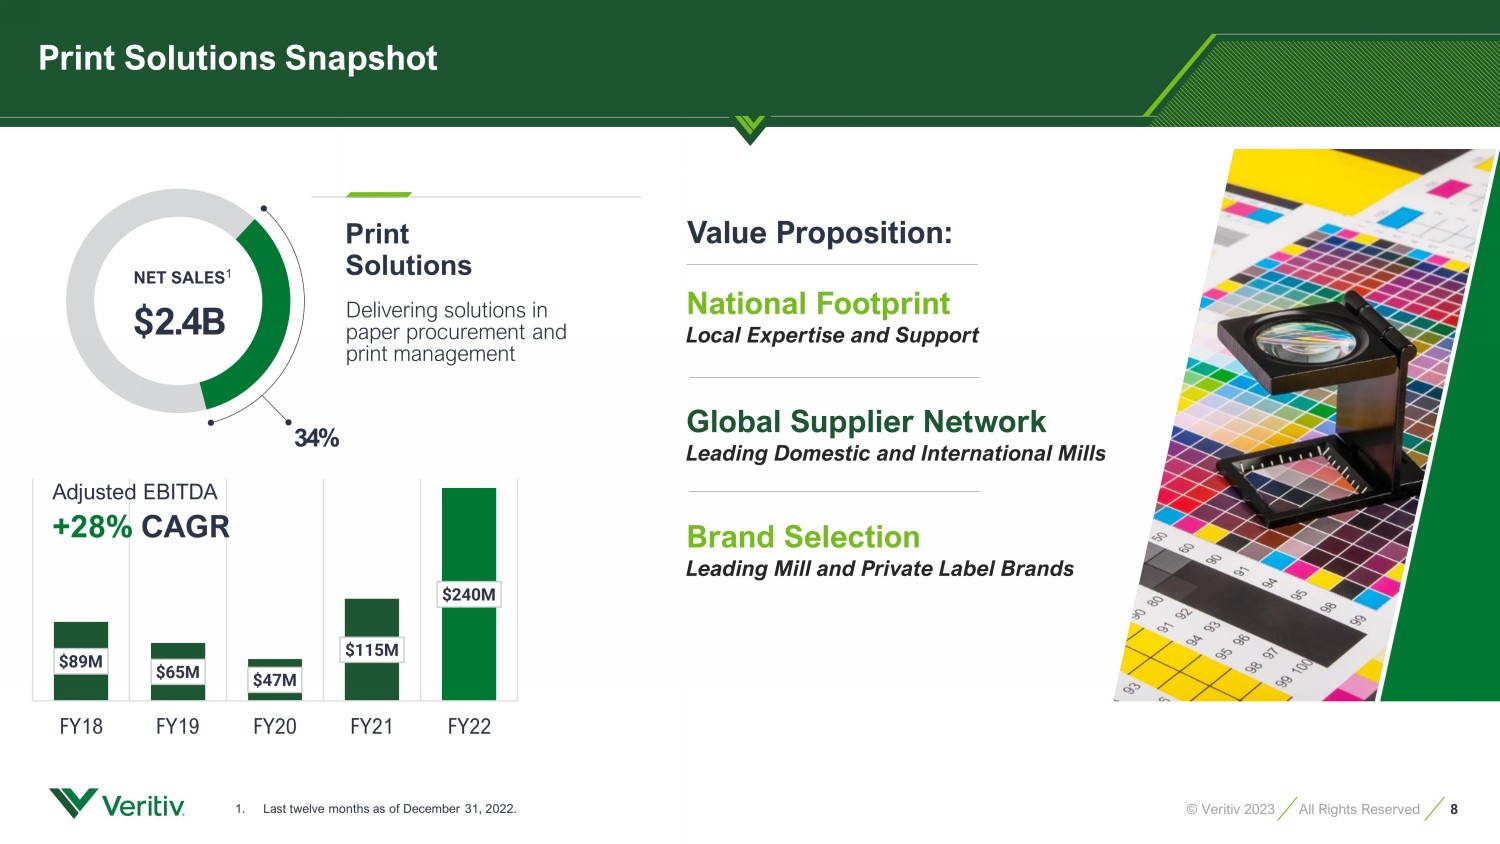
8 © Veritiv 2023 All Rights Reserved Delivering solutions in paper procurement and print management $89M $65M $47M $115M $240M FY18 FY19 FY21 FY20 FY22 Print Solutions Snapshot Print Solutions NET SALES 1 $ 2.4 B 34% Adjusted EBITDA +28% CAGR Value Proposition: Global Supplier Network Leading Domestic and International Mills Brand Selection Leading Mill and Private Label Brands National Footprint Local Expertise and Support 1. Last twelve months as of December 31, 2022.
9 © Veritiv 2023 All Rights Reserved Key Messages 2 4 3 Invest in Growth Earnings Expansion & Low Leverage 1 Inflection Point in Business Fundamentals Strategic Portfolio Optimization
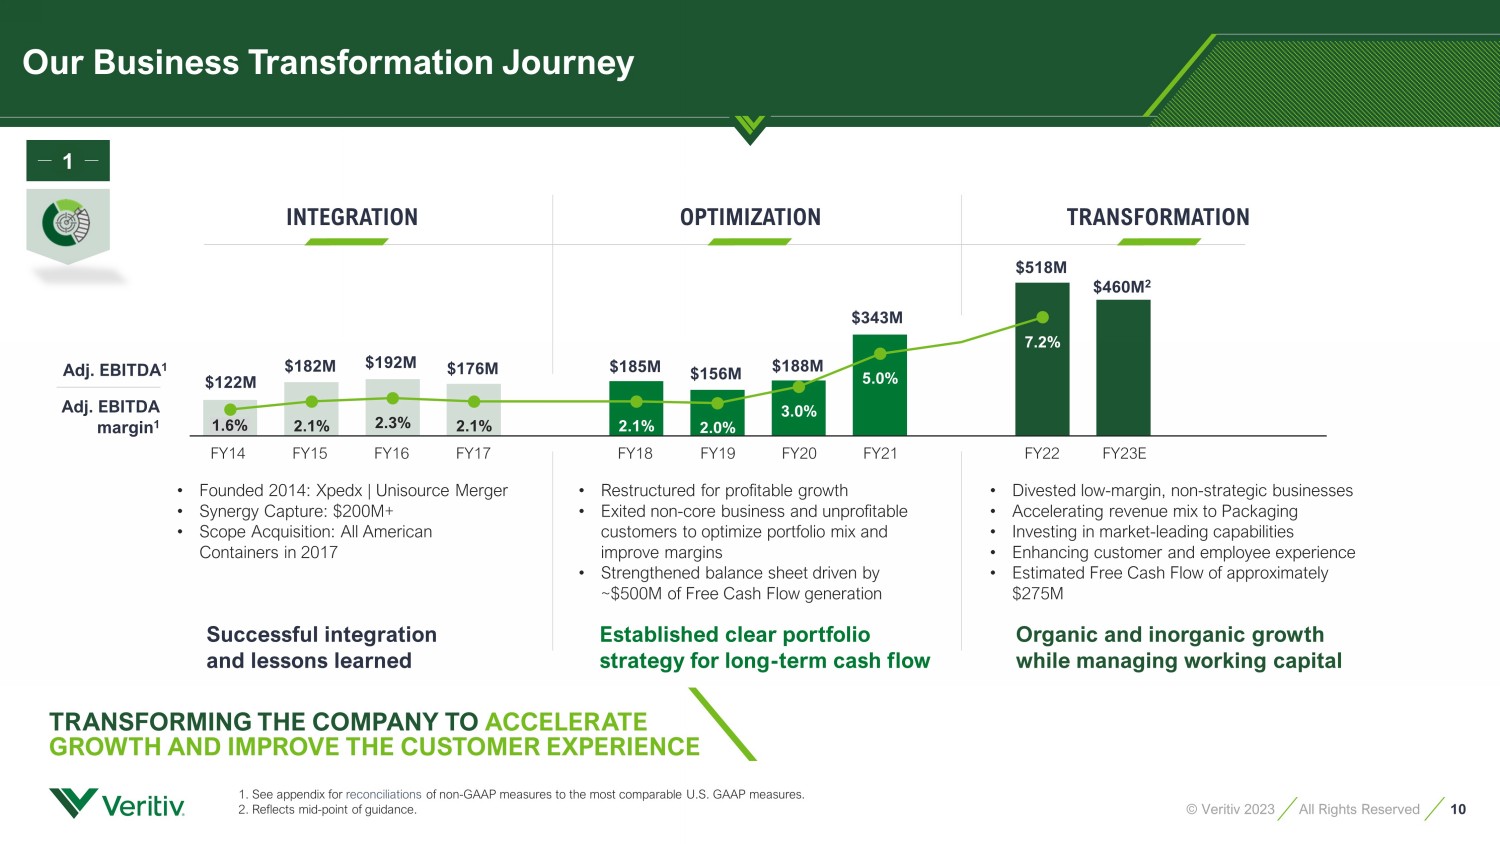
10 © Veritiv 2023 All Rights Reserved Our Business Transformation Journey 2.1% 2.3% 2.1% 2.1% 2.0% 3.0% 5.0% 7.2% INTEGRATION • Founded 2014: Xpedx | Unisource Merger • Synergy Capture: $200M+ • Scope Acquisition: All American Containers in 2017 Successful integration and lessons learned Adj. EBITDA 1 Adj. EBITDA margin 1 TRANSFORMING THE COMPANY TO ACCELERATE GROWTH AND IMPROVE THE CUSTOMER EXPERIENCE • Restructured for profitable growth • Exited non - core business and unprofitable customers to optimize portfolio mix and improve margins • Strengthened balance sheet driven by ~$500M of Free Cash Flow generation Established clear portfolio strategy for long - term cash flow • Divested low - margin, non - strategic businesses • Accelerating revenue mix to Packaging • Investing in market - leading capabilities • Enhancing customer and employee experience • Estimated Free Cash Flow of approximately $275M Organic and inorganic growth while managing working capital OPTIMIZATION TRANSFORMATION FY20 1.6% FY14 FY15 FY19 FY16 FY17 FY18 FY21 FY22 $156M $176M $122M $182M $192M $185M $188M $343M 1. See appendix for reconciliations of non - GAAP measures to the most comparable U.S. GAAP measures. 2. Reflects mid - point of guidance. FY23E $518M $460M 2 1
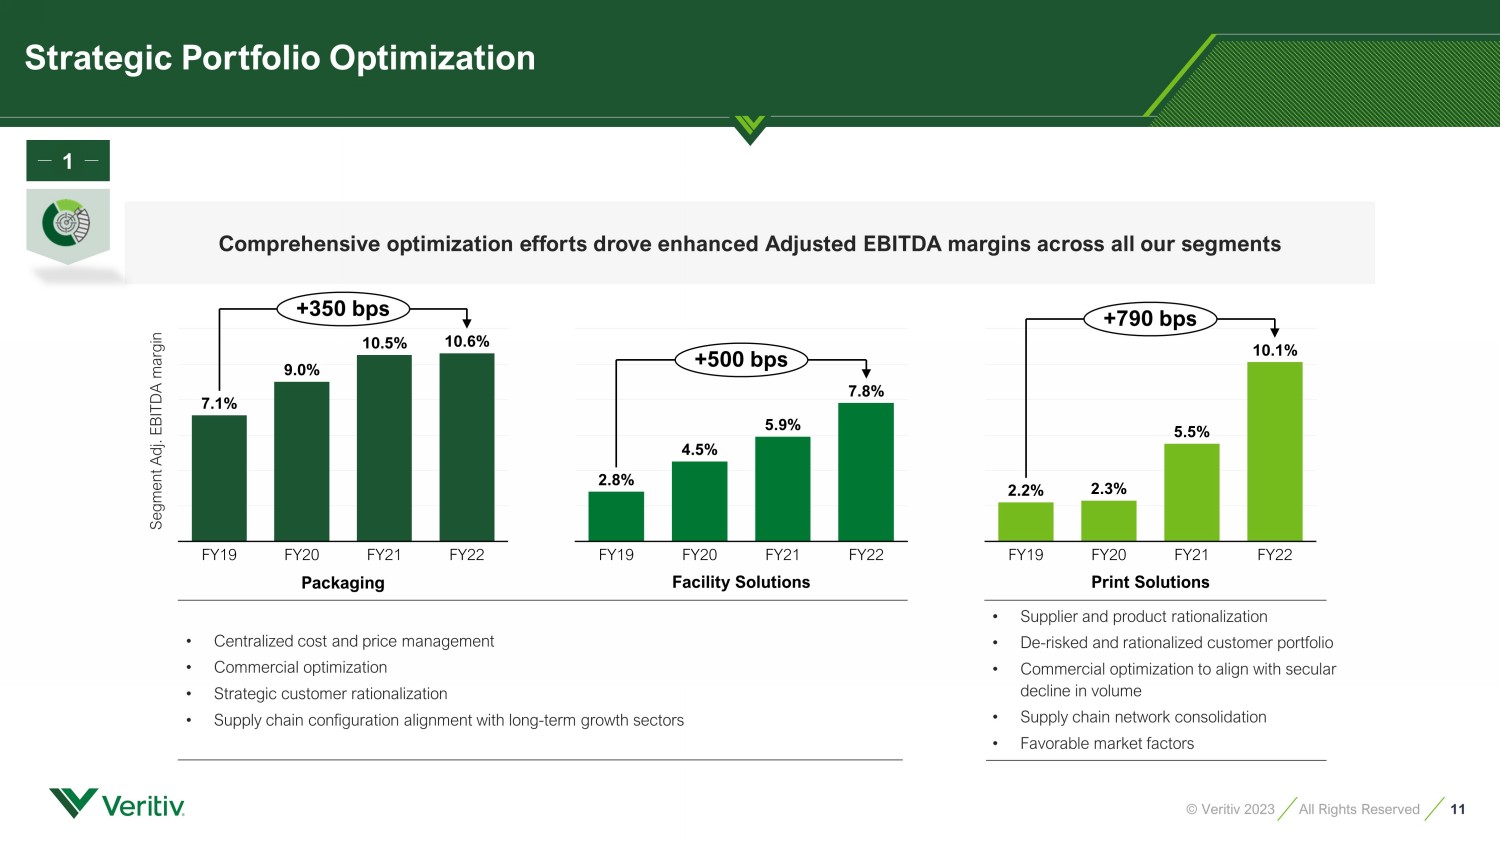
11 © Veritiv 2023 All Rights Reserved Packaging Facility Solutions Print Solutions • Centralized cost and price management • Commercial optimization • Strategic customer rationalization • Supply chain configuration alignment with long - term growth sectors • Supplier and product rationalization • De - risked and rationalized customer portfolio • Commercial optimization to align with secular decline in volume • Supply chain network consolidation • Favorable market factors Comprehensive optimization efforts drove enhanced Adjusted EBITDA margins across all our segments Segment Adj. EBITDA margin 1 FY22 FY19 FY20 FY21 7.1% 9.0% 10.5% 10.6% +350 bps FY20 FY19 FY21 FY22 5.9% 2.8% 7.8% 4.5% +500 bps FY20 10.1% FY19 FY21 FY22 2.2% 2.3% 5.5% +790 bps Strategic Portfolio Optimization
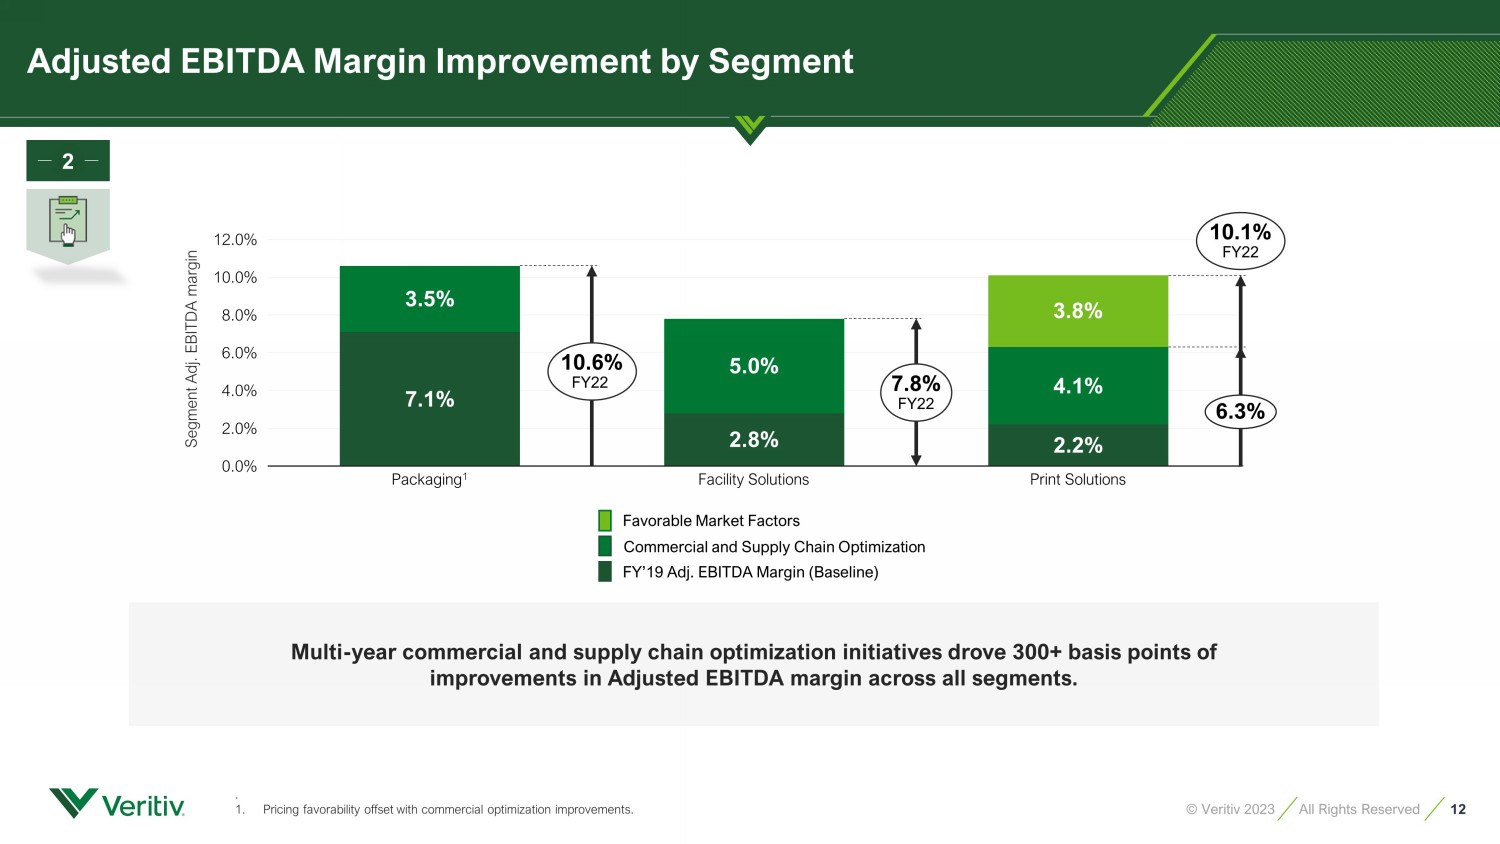
12 © Veritiv 2023 All Rights Reserved Multi - year commercial and supply chain optimization initiatives drove 300+ basis points of improvements in Adjusted EBITDA margin across all segments. Segment Adj. EBITDA margin 7.1% 2.8% 2.2% 3.5% 5.0% 4.1% 6.0% 0.0% 8.0% 2.0% 10.0% 4.0% 12.0% Facility Solutions Packaging 1 3.8% Print Solutions 6.3% 7.8% FY22 10.6% FY22 10.1% FY22 Favorable Market Factors Commercial and Supply Chain Optimization FY’19 Adj. EBITDA Margin (Baseline) Adjusted EBITDA Margin Improvement by Segment . 1. Pricing favorability offset with commercial optimization improvements. 2

13 © Veritiv 2023 All Rights Reserved Adjusted EBITDA and EPS growth in 2020 despite COVID - related headwinds; accelerated earnings growth in 2021 and 2022 1. See appendix for reconciliations of non - GAAP measures to the most comparable U.S. GAAP measures. $18.00 - $21.00 $445 - $485M ($0.99) ($1.84) $2.08 $ 0.00 $ 25.00 $ 20.00 $ - 5.00 $ 10.00 $ 5.00 $ 15.00 FY18 FY19 FY20 FY21 FY22 $23.29 $9.01 Diluted EPS $600M $400M $300M $0M $100M $200M $500M $518M FY18 $343M FY19 FY20 FY21 FY22 $185M $156M $188M +29% CAGR Adjusted EBITDA 1 Trajectory for 2022 Earnings Performance 3
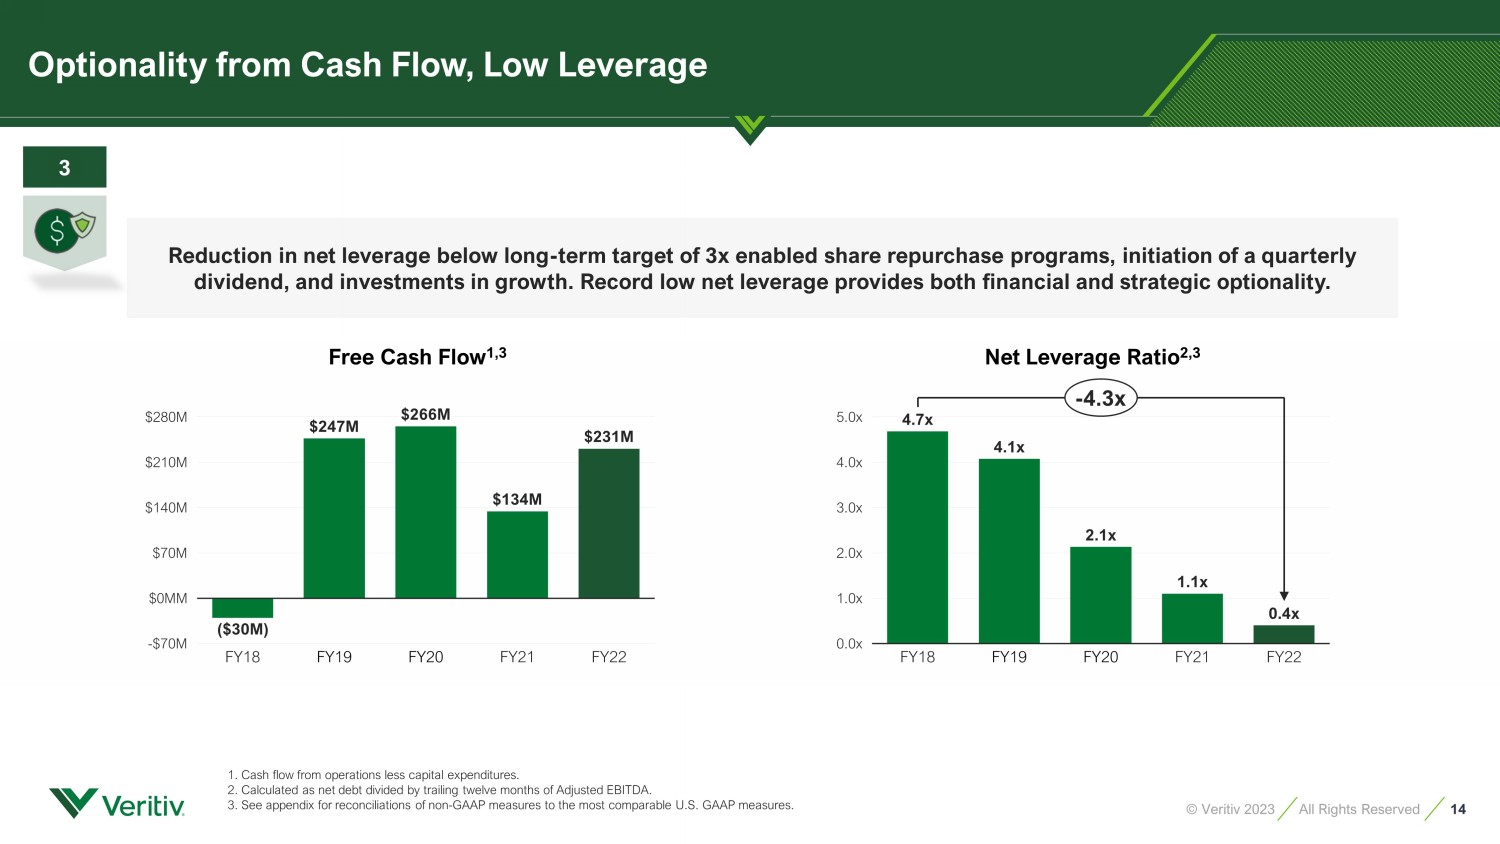
14 © Veritiv 2023 All Rights Reserved Reduction in net leverage below long - term target of 3x enabled share repurchase programs, initiation of a quarterly dividend, and investments in growth. Record low net leverage provides both financial and strategic optionality. 1. Cash flow from operations less capital expenditures. 2. Calculated as net debt divided by trailing twelve months of Adjusted EBITDA. 3 . S ee appendix for reconciliations of non - GAAP measures to the most comparable U.S. GAAP measures . 2.0 x 1.0 x 0.0 x 3.0 x 4.0 x 5.0 x FY18 4.7 x FY19 1.1 x FY20 FY21 FY22 4.1 x 2.1 x 0.4 x - 4.3x Net Leverage Ratio 2,3 $210M - $70M $0M M $70M $140M $280M FY18 FY19 FY20 FY21 FY22 ($30M) $247M $266M $134M $231M Free Cash Flow 1,3 Optionality from Cash Flow, Low Leverage 3
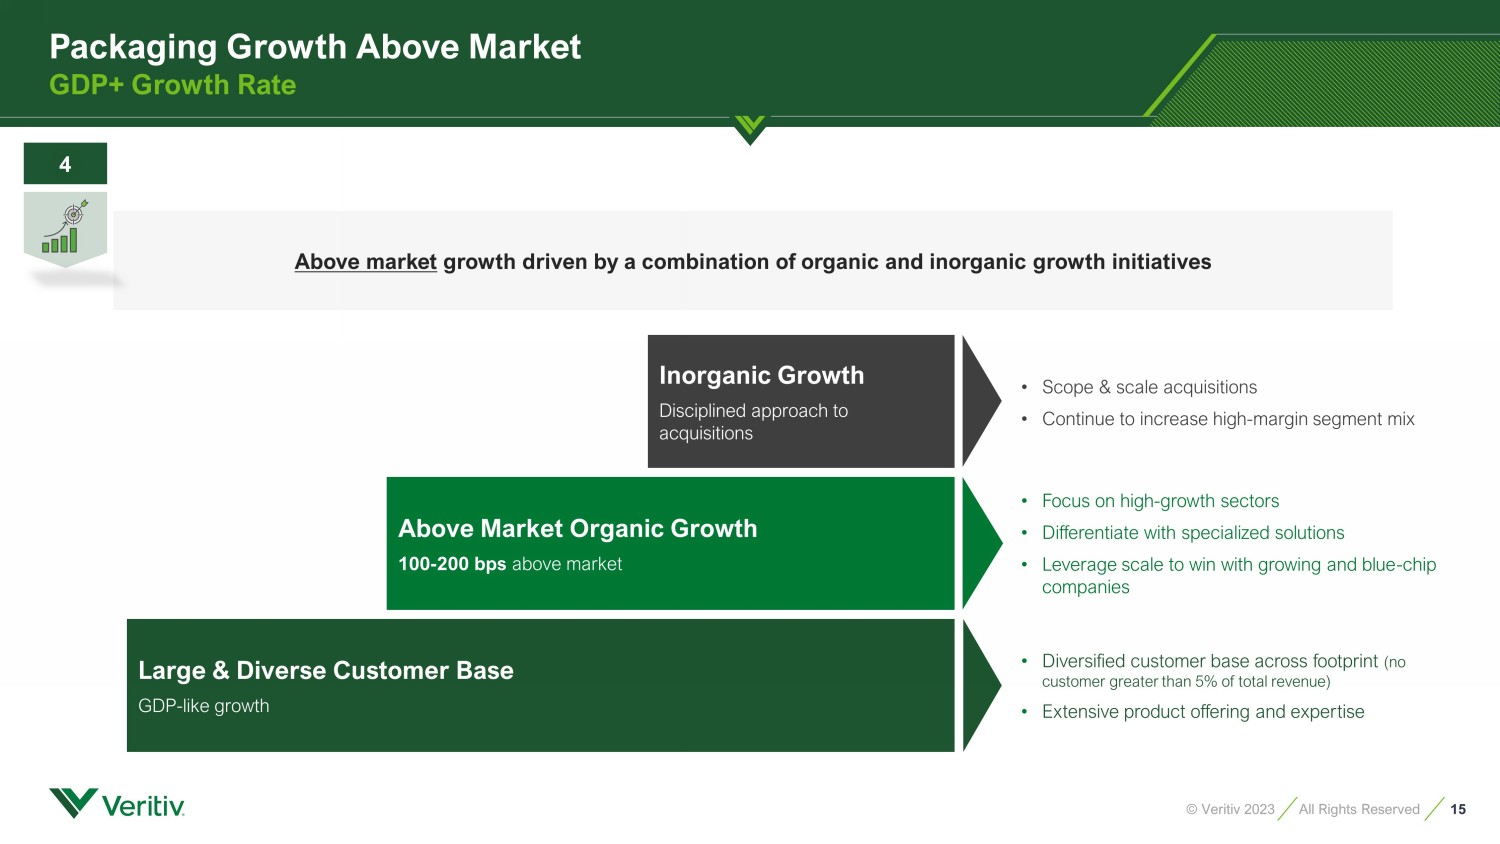
15 © Veritiv 2023 All Rights Reserved Above Market Organic Growth 100 - 200 bps above market Inorganic Growth Disciplined approach to acquisitions Large & Diverse Customer Base GDP - like growth • Scope & scale acquisitions • Continue to increase high - margin segment mix • Focus on high - growth sectors • Differentiate with specialized solutions • Leverage scale to win with growing and blue - chip companies • Diversified customer base across footprint (no customer greater than 5% of total revenue) • Extensive product offering and expertise Above market growth driven by a combination of organic and inorganic growth initiatives Packaging Growth Above Market GDP+ Growth Rate 4
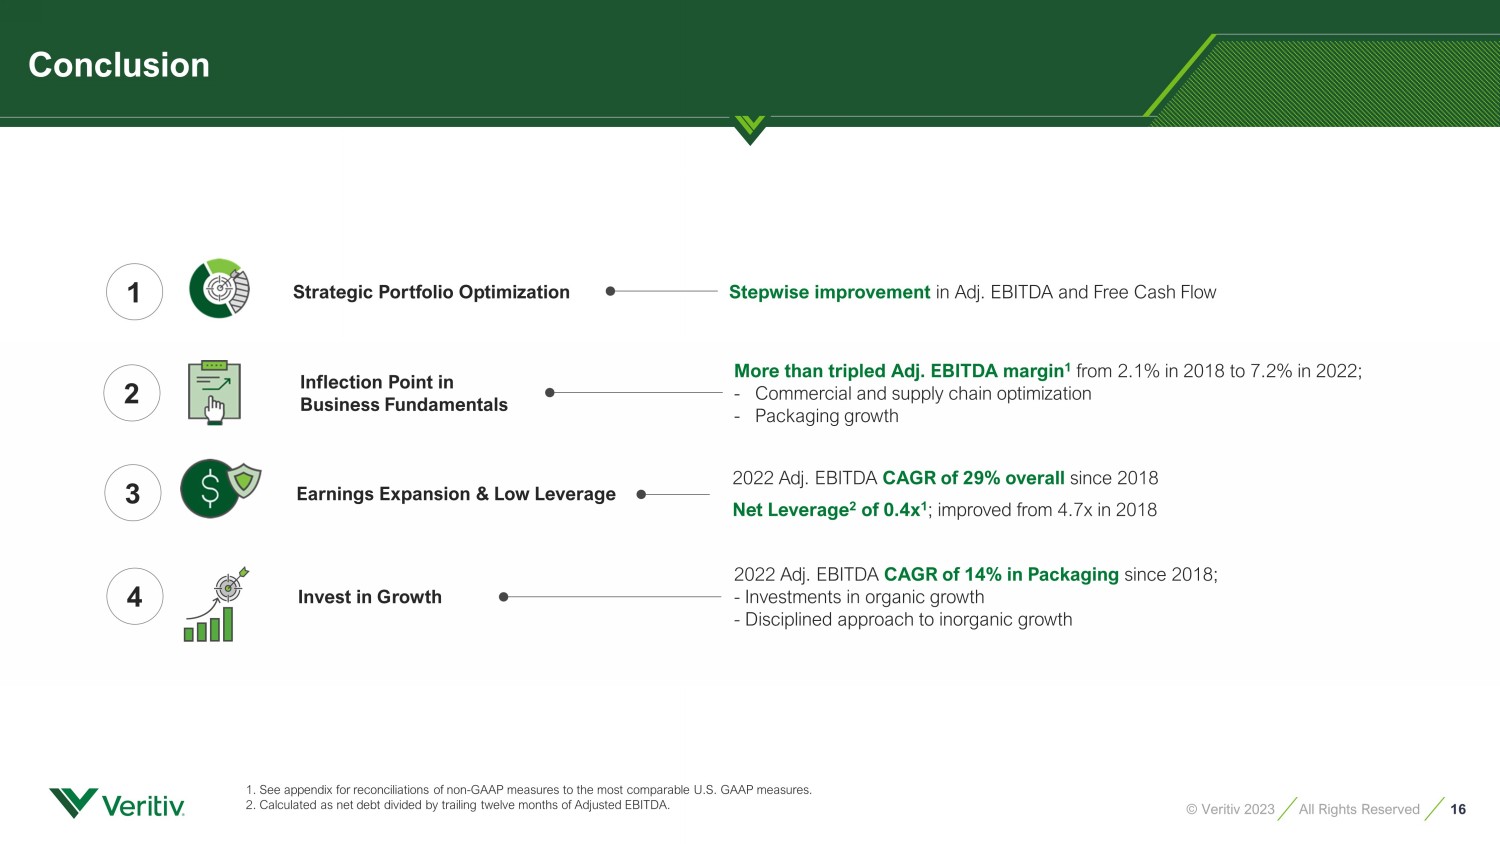
16 © Veritiv 2023 All Rights Reserved 1. See appendix for reconciliations of non - GAAP measures to the most comparable U.S. GAAP measures. 2. Calculated as net debt divided by trailing twelve months of Adjusted EBITDA . 2 3 4 Invest in Growth Earnings Expansion & Low Leverage 2022 Adj. EBITDA CAGR of 14% in Packaging since 2018; - Investments in organic growth - Disciplined approach to inorganic growth 2022 Adj. EBITDA CAGR of 29 % overall since 2018 Net Leverage 2 of 0.4x 1 ; improved from 4.7x in 2018 1 Inflection Point in Business Fundamentals More than tripled Adj. EBITDA margin 1 from 2.1% in 2018 to 7.2% in 2022; - Commercial and supply chain optimization - Packaging growth Strategic Portfolio Optimization Stepwise improvement in Adj. EBITDA and Free Cash Flow Conclusion
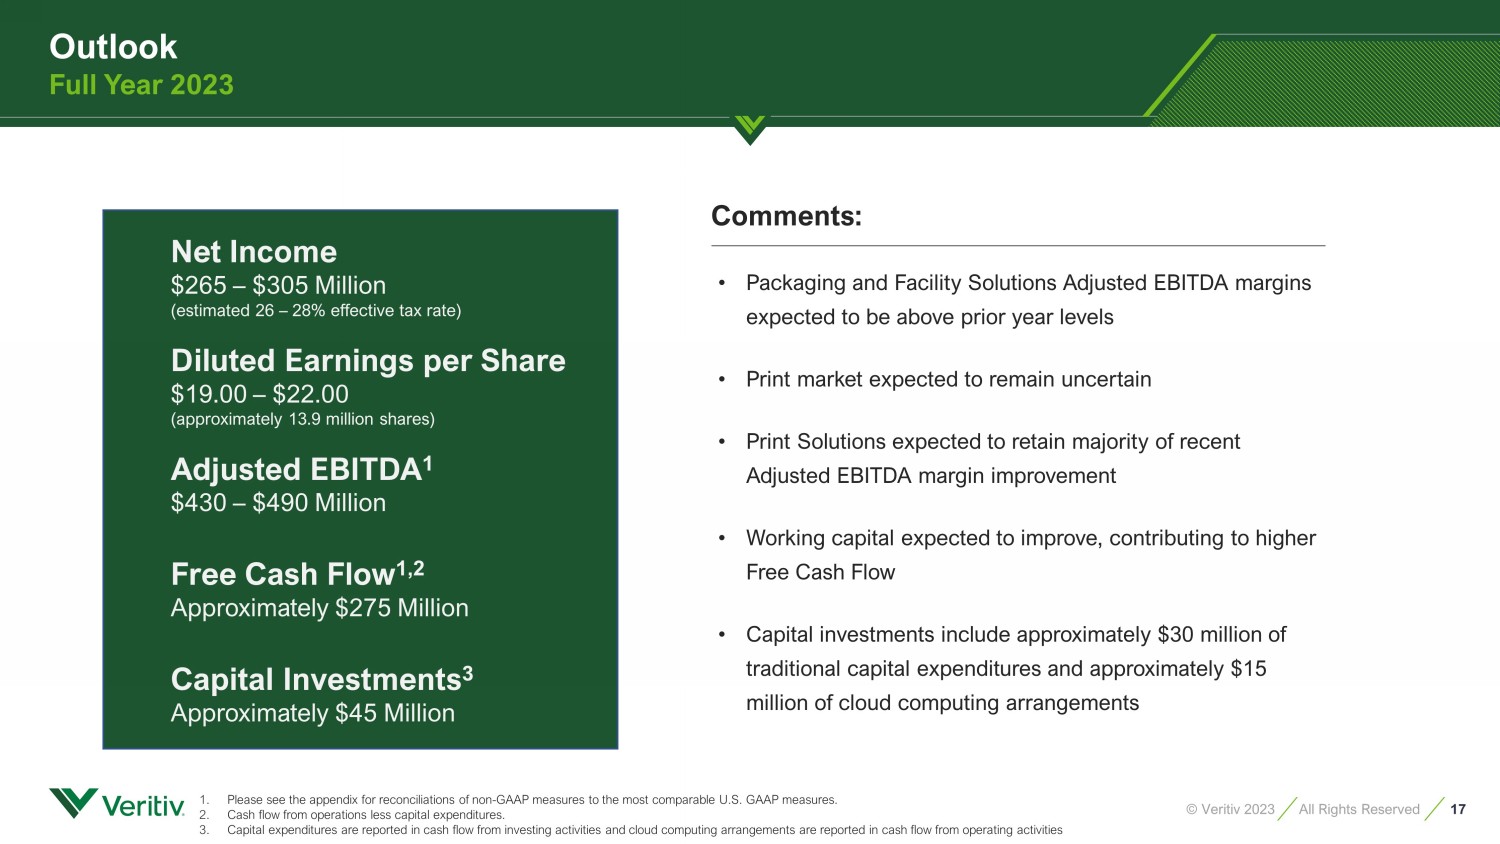
17 © Veritiv 2023 All Rights Reserved 1. P lease see the appendix for reconciliations of non - GAAP measures to the most comparable U.S. GAAP measures. 2. Cash flow from operations less capital expenditures. 3. Capital expenditures are reported in cash flow from investing activities and cloud computing arrangements are reported in cas h f low from operating activities Net Income $265 – $305 Million (estimated 26 – 28% effective tax rate) Diluted Earnings per Share $19.00 – $22.00 (approximately 13.9 million shares) Adjusted EBITDA 1 $430 – $490 Million Free Cash Flow 1,2 Approximately $275 Million Capital Investments 3 Approximately $45 Million Comments : • Packaging and Facility Solutions Adjusted EBITDA margins expected to be above prior year levels • Print market expected to remain uncertain • Print Solutions expected to retain majority of recent Adjusted EBITDA margin improvement • Working capital expected to improve, contributing to higher Free Cash Flow • Capital investments include approximately $30 million of traditional capital expenditures and approximately $15 million of cloud computing arrangements Outlook Full Year 2023

© Veritiv 2022 | All Rights Reserved APPENDIX NYSE: VRTV © Veritiv 2023 | All Rights Reserved
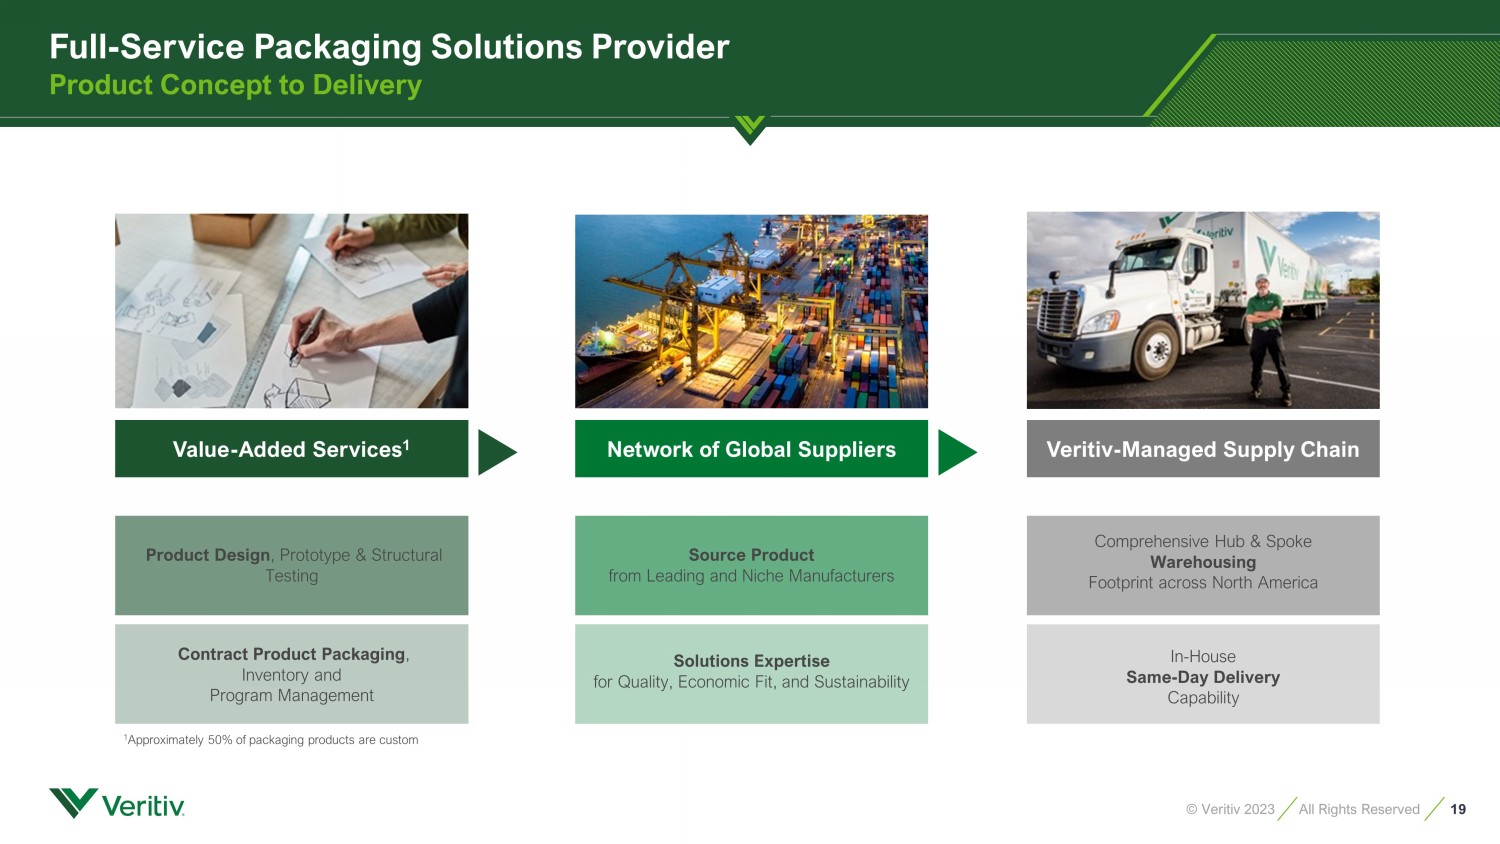
19 © Veritiv 2023 All Rights Reserved Value - Added Services 1 In - House Same - Day Delivery Capability Source Product from Leading and Niche Manufacturers Comprehensive Hub & Spoke Warehousing Footprint across North America Network of Global Suppliers Veritiv - Managed Supply Chain Product Design , Prototype & Structural Testing Contract Product Packaging , Inventory and Program Management Solutions Expertise for Quality, Economic Fit, and Sustainability 1 Approximately 50% of packaging products are custom Full - Service Packaging Solutions Provider Product Concept to Delivery

20 © Veritiv 2023 All Rights Reserved 2021 Corporate Social Responsibility Report published in May 2022 • Recent Progress: • Developed supplier quality, social and environmental performance assessment program • Best in class safety rating • Launched Women and African American Employee Resource Groups (ERGs) • DEI performance target incorporated into 2022 annual incentive compensation plan • 1/3 of board members are female • Expanded portfolio of products with one or more sustainability attributes • ESG Goals | Commitment to Improvement: • 50% Reduction of total Scope 1 and Scope 2 GHG Emissions from 2020 base level by end of 2030 • Recycling Program – increase diversion rate to 30% by end of 2023 • Implement Environmental Management System meeting ISO Certification standard at nearly all U.S. facilities by the end of 2026 • Increase number of employees from underrepresented groups; launch three - year DE&I action plan • Complete ESG assessment of our top 100 suppliers by the end of 2023 Sustainability and Corporate Responsibility
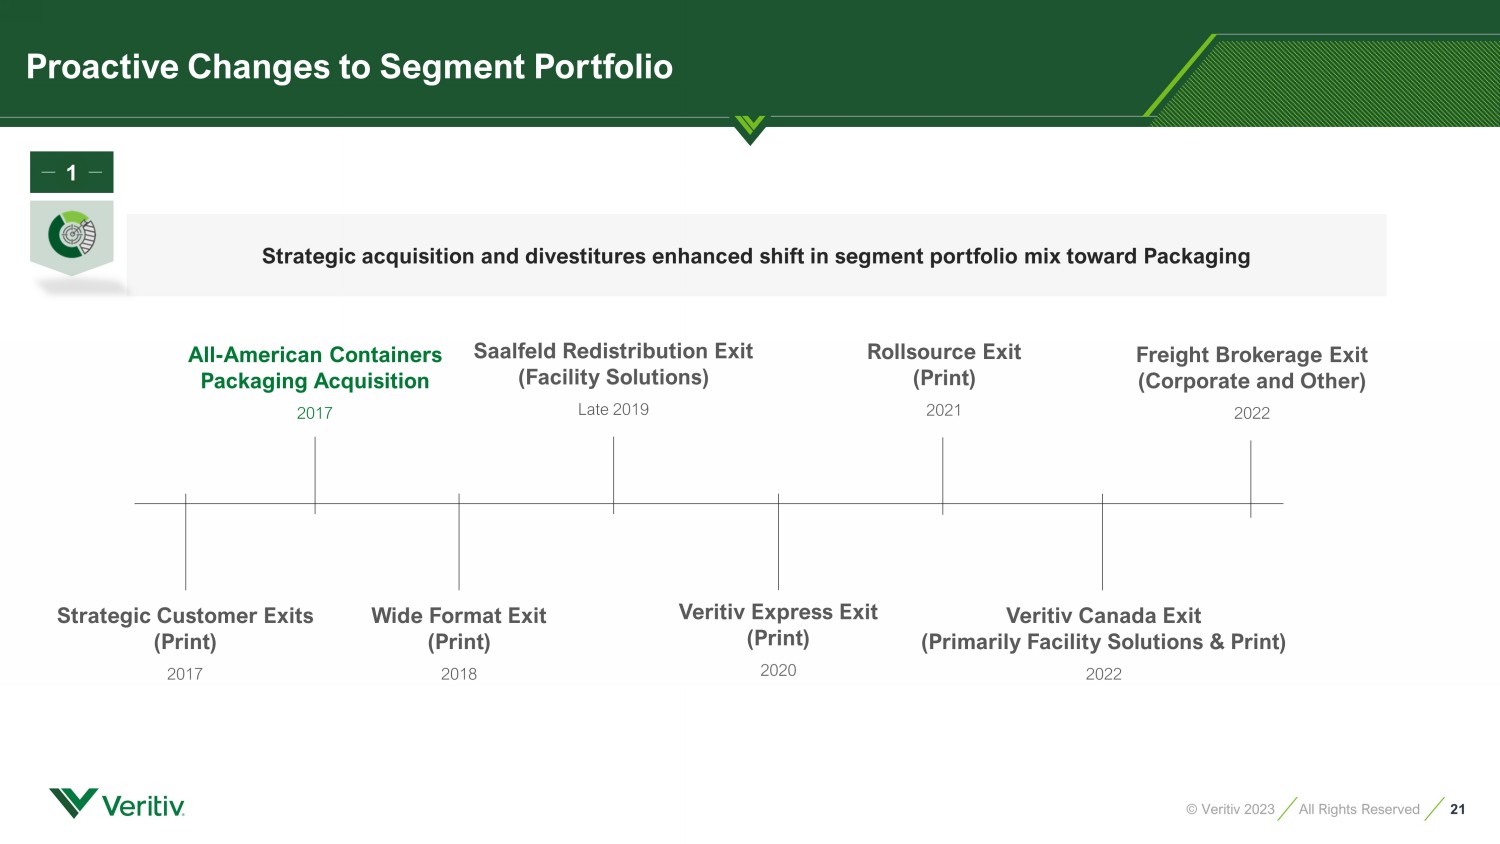
21 © Veritiv 2023 All Rights Reserved Strategic acquisition and divestitures enhanced shift in segment portfolio mix toward Packaging All - American Containers Packaging Acquisition 2017 Strategic Customer Exits (Print) 2017 Wide Format Exit (Print) 2018 Saalfeld Redistribution Exit (Facility Solutions) Late 2019 Veritiv Express Exit (Print) 2020 1 Rollsource Exit (Print) 2021 Veritiv Canada Exit (Primarily Facility Solutions & Print) 2022 Freight Brokerage Exit (Corporate and Other) 2022 Proactive Changes to Segment Portfolio
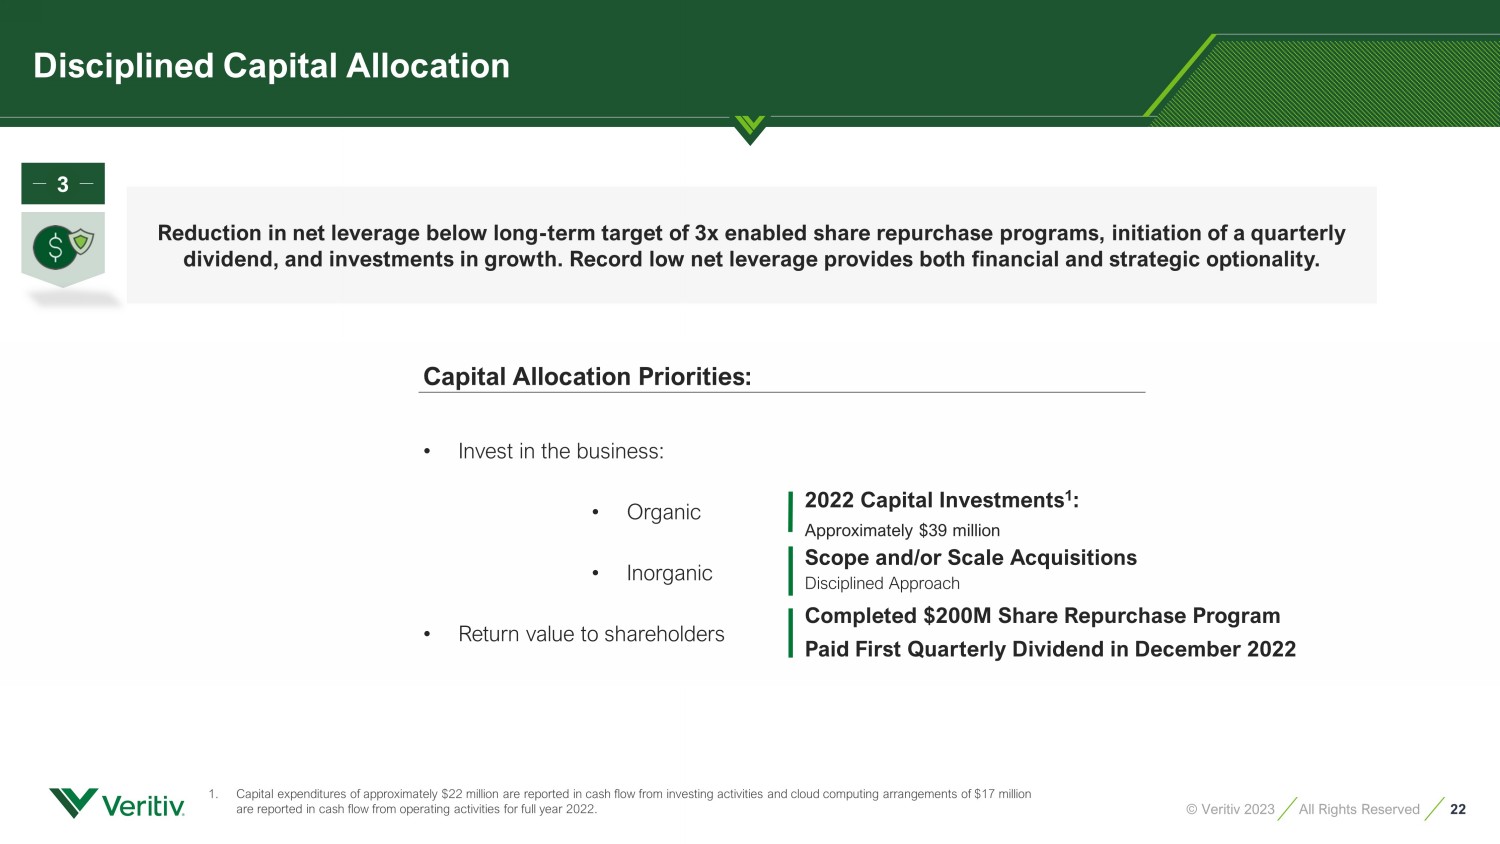
22 © Veritiv 2023 All Rights Reserved 3 Reduction in net leverage below long - term target of 3x enabled share repurchase programs, initiation of a quarterly dividend, and investments in growth. Record low net leverage provides both financial and strategic optionality. Capital Allocation Priorities: • Invest in the business: • Organic • Inorganic • Return value to shareholders 2022 Capital Investments 1 : Approximately $39 million Completed $200M Share Repurchase Program Paid First Quarterly Dividend in December 2022 Scope and/or Scale Acquisitions Disciplined Approach Disciplined Capital Allocation 1. Capital expenditures of approximately $22 million are reported in cash flow from investing activities and cloud computing arr ang ements of $17 million are reported in cash flow from operating activities for full year 2022.
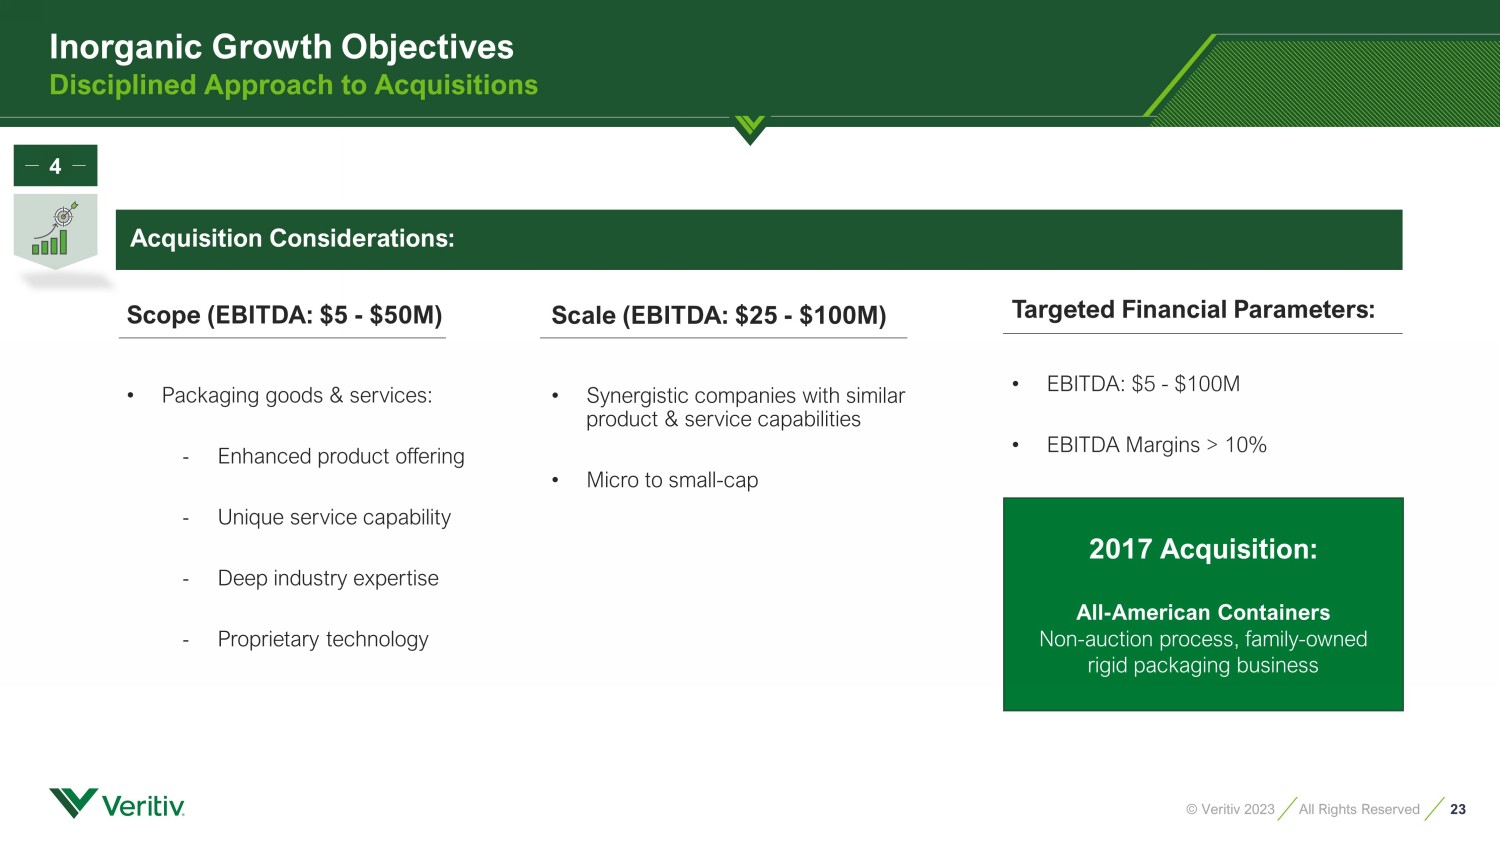
23 © Veritiv 2023 All Rights Reserved Scale (EBITDA: $25 - $100M) • Synergistic companies with similar product & service capabilities • Micro to small - cap Scope (EBITDA: $5 - $50M) • Packaging goods & services: - Enhanced product offering - Unique service capability - Deep industry expertise - Proprietary technology Packaging 73% Acquisition Considerations : Targeted Financial Parameters : • EBITDA: $5 - $100M • EBITDA Margins > 10% 2017 Acquisition: All - American Containers Non - auction process, family - owned rigid packaging business 4 Inorganic Growth Objectives Disciplined Approach to Acquisitions
24 © Veritiv 2023 All Rights Reserved Appendix Reconciliation of Non - GAAP Financial Measures We supplement our financial information prepared in accordance with U.S. GAAP with certain non - GAAP measures including organic s ales (net sales on an average daily sales basis, excluding revenue from sold businesses and revenue from acquired businesses for a period of 12 mon ths after we complete the acquisition), Adjusted EBITDA (earnings before interest, income taxes, depreciation and amortization, restructuring charges, net , integration and acquisition expenses and other similar charges including any severance costs, costs associated with warehouse and office openings or clos ing s, consolidation, and relocation and other business optimization expenses, stock - based compensation expense, changes in the LIFO reserve, non - restruct uring asset impairment charges, non - restructuring severance charges, non - restructuring pension charges (benefits), fair value adjustments related to co ntingent liabilities assumed in mergers and acquisitions and certain other adjustments), free cash flow and other non - GAAP measures such as the Net Leverage Rat io (calculated as net debt divided by trailing twelve months of Adjusted EBITDA) and Return on Invested Capital (calculated as Net Operating Profit Afte r T ax divided by the sum of net working capital and property and equipment. Net Operating Profit After Tax is defined as Adjusted EBITDA less depreciation an d a mortization times 1 minus the standard tax rate1). We believe investors commonly use Adjusted EBITDA, free cash flow and these other non - GAAP measures as key financial metrics for valuing companies; we also present organic sales to help investors better compare period - over - period results. In addition, the c redit agreement governing our Asset - Based Lending Facility (the "ABL Facility") permits us to exclude the foregoing and other charges in calculating "Consolid ated EBITDA", as defined in the ABL Facility. Consolidated EBITDA and ROIC are also used as a basis for certain compensation programs sponsored by the Compan y. Organic sales, Adjusted EBITDA, free cash flow, Return on Invested Capital and these other non - GAAP measures are not alternative measures of financial performance or liquidity under U.S. GAAP. Non - GAAP measures do not have definitions under U.S. GAAP and may be defined different ly by, and not be comparable to, similarly titled measures used by other companies. As a result, we consider and evaluate non - GAAP measures in con nection with a review of the most directly comparable measure calculated in accordance with U.S. GAAP. We caution investors not to place undue reliance on su ch non - GAAP measures and to consider them with the most directly comparable U.S. GAAP measures. Organic sales, Adjusted EBITDA, free cash flow and th ese other non - GAAP measures have limitations as analytical tools and should not be considered in isolation or as a substitute for analyzing our res ults as reported under U.S. GAAP. Please see the following tables for reconciliations of non - GAAP measures to the most comparable U.S. GAAP measures. 1 The Company uses a standard tax rate of 26% due to the historic volatility of the Company’s effective tax rate.
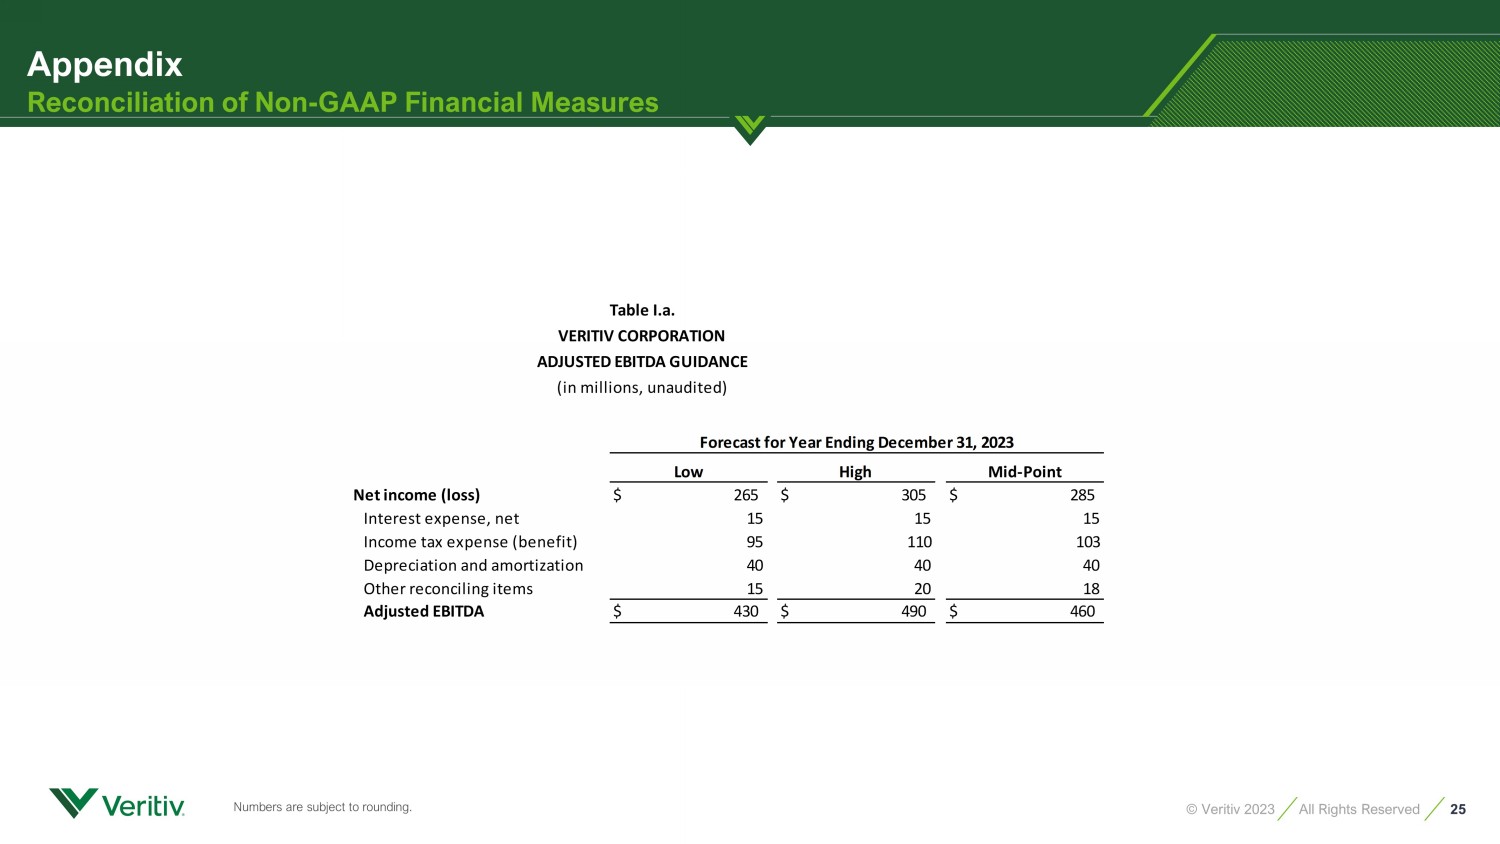
25 © Veritiv 2023 All Rights Reserved Appendix Reconciliation of Non - GAAP Financial Measures Low High Mid-Point Net income (loss) $ 265 $ 305 $ 285 Interest expense, net 15 15 15 Income tax expense (benefit) 95 110 103 Depreciation and amortization 40 40 40 Other reconciling items 15 20 18 Adjusted EBITDA $ 430 $ 490 $ 460 Forecast for Year Ending December 31, 2023 Table I.a. VERITIV CORPORATION ADJUSTED EBITDA GUIDANCE (in millions, unaudited) Numbers are subject to rounding.
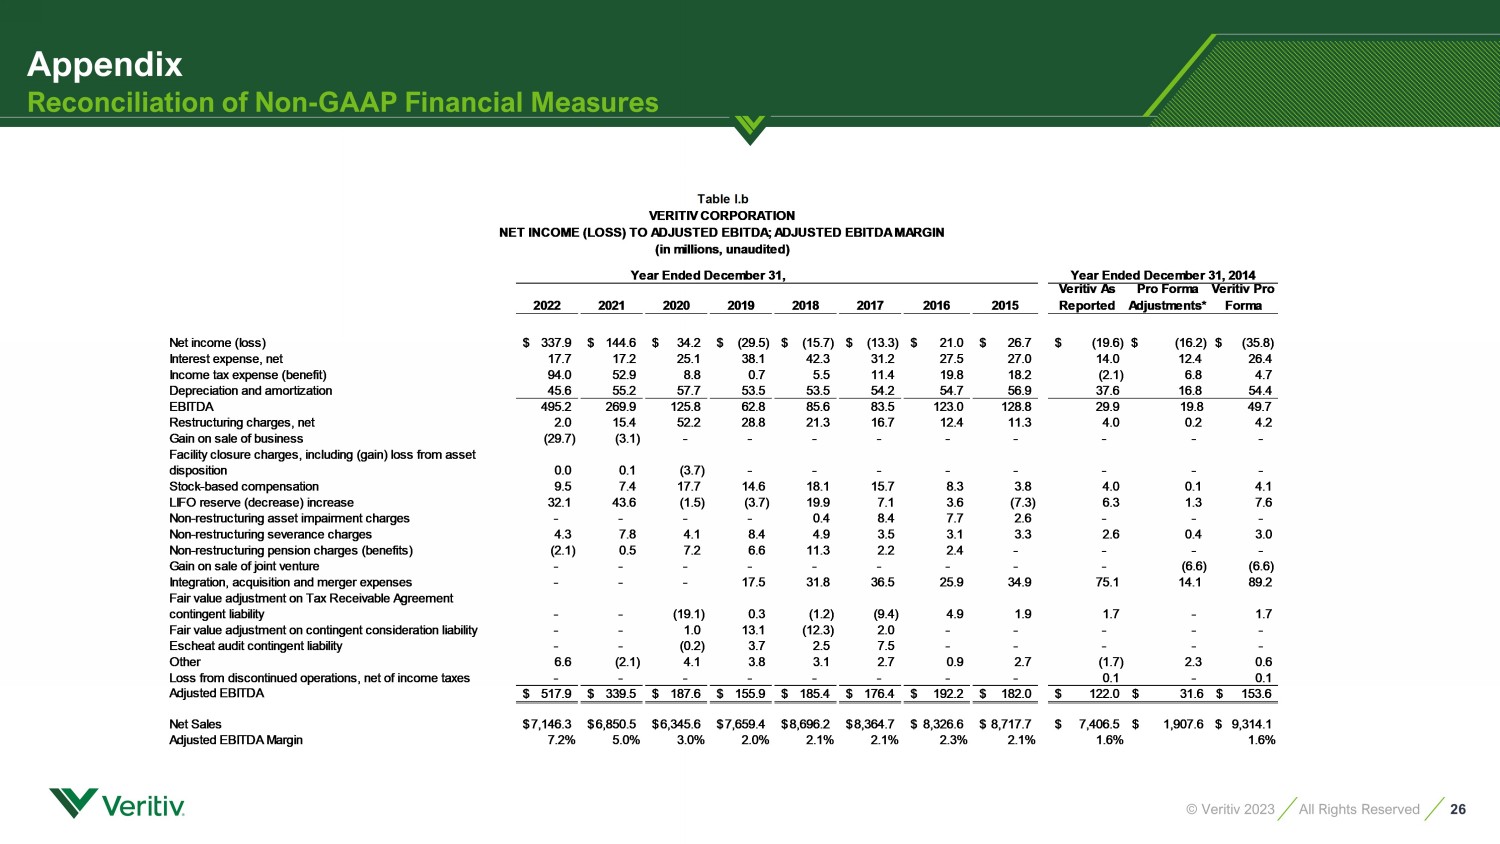
26 © Veritiv 2023 All Rights Reserved Appendix Reconciliation of Non - GAAP Financial Measures 2022 2021 2020 2019 2018 2017 2016 2015 Veritiv As Reported Pro Forma Adjustments* Veritiv Pro Forma Net income (loss) 337.9$ 144.6$ 34.2$ (29.5)$ (15.7)$ (13.3)$ 21.0$ 26.7$ (19.6)$ $ (16.2) $ (35.8) Interest expense, net 17.7 17.2 25.1 38.1 42.3 31.2 27.5 27.0 14.0 12.4 26.4 Income tax expense (benefit) 94.0 52.9 8.8 0.7 5.5 11.4 19.8 18.2 (2.1) 6.8 4.7 Depreciation and amortization 45.6 55.2 57.7 53.5 53.5 54.2 54.7 56.9 37.6 16.8 54.4 EBITDA 495.2 269.9 125.8 62.8 85.6 83.5 123.0 128.8 29.9 19.8 49.7 Restructuring charges, net 2.0 15.4 52.2 28.8 21.3 16.7 12.4 11.3 4.0 0.2 4.2 Gain on sale of business (29.7) (3.1) - - - - - - - - - Facility closure charges, including (gain) loss from asset disposition 0.0 0.1 (3.7) - - - - - - - - Stock-based compensation 9.5 7.4 17.7 14.6 18.1 15.7 8.3 3.8 4.0 0.1 4.1 LIFO reserve (decrease) increase 32.1 43.6 (1.5) (3.7) 19.9 7.1 3.6 (7.3) 6.3 1.3 7.6 Non-restructuring asset impairment charges - - - - 0.4 8.4 7.7 2.6 - - - Non-restructuring severance charges 4.3 7.8 4.1 8.4 4.9 3.5 3.1 3.3 2.6 0.4 3.0 Non-restructuring pension charges (benefits) (2.1) 0.5 7.2 6.6 11.3 2.2 2.4 - - - - Gain on sale of joint venture - - - - - - - - - (6.6) (6.6) Integration, acquisition and merger expenses - - - 17.5 31.8 36.5 25.9 34.9 75.1 14.1 89.2 Fair value adjustment on Tax Receivable Agreement contingent liability - - (19.1) 0.3 (1.2) (9.4) 4.9 1.9 1.7 - 1.7 Fair value adjustment on contingent consideration liability - - 1.0 13.1 (12.3) 2.0 - - - - - Escheat audit contingent liability - - (0.2) 3.7 2.5 7.5 - - - - - Other 6.6 (2.1) 4.1 3.8 3.1 2.7 0.9 2.7 (1.7) 2.3 0.6 Loss from discontinued operations, net of income taxes - - - - - - - - 0.1 - 0.1 Adjusted EBITDA 517.9$ 339.5$ 187.6$ 155.9$ 185.4$ 176.4$ 192.2$ 182.0$ 122.0$ 31.6$ 153.6$ Net Sales 7,146.3$ 6,850.5$ 6,345.6$ 7,659.4$ 8,696.2$ 8,364.7$ 8,326.6$ 8,717.7$ 7,406.5$ 1,907.6$ $ 9,314.1 Adjusted EBITDA Margin 7.2% 5.0% 3.0% 2.0% 2.1% 2.1% 2.3% 2.1% 1.6% 1.6% Year Ended December 31, Table l.b VERITIV CORPORATION NET INCOME (LOSS) TO ADJUSTED EBITDA; ADJUSTED EBITDA MARGIN (in millions, unaudited) Year Ended December 31, 2014
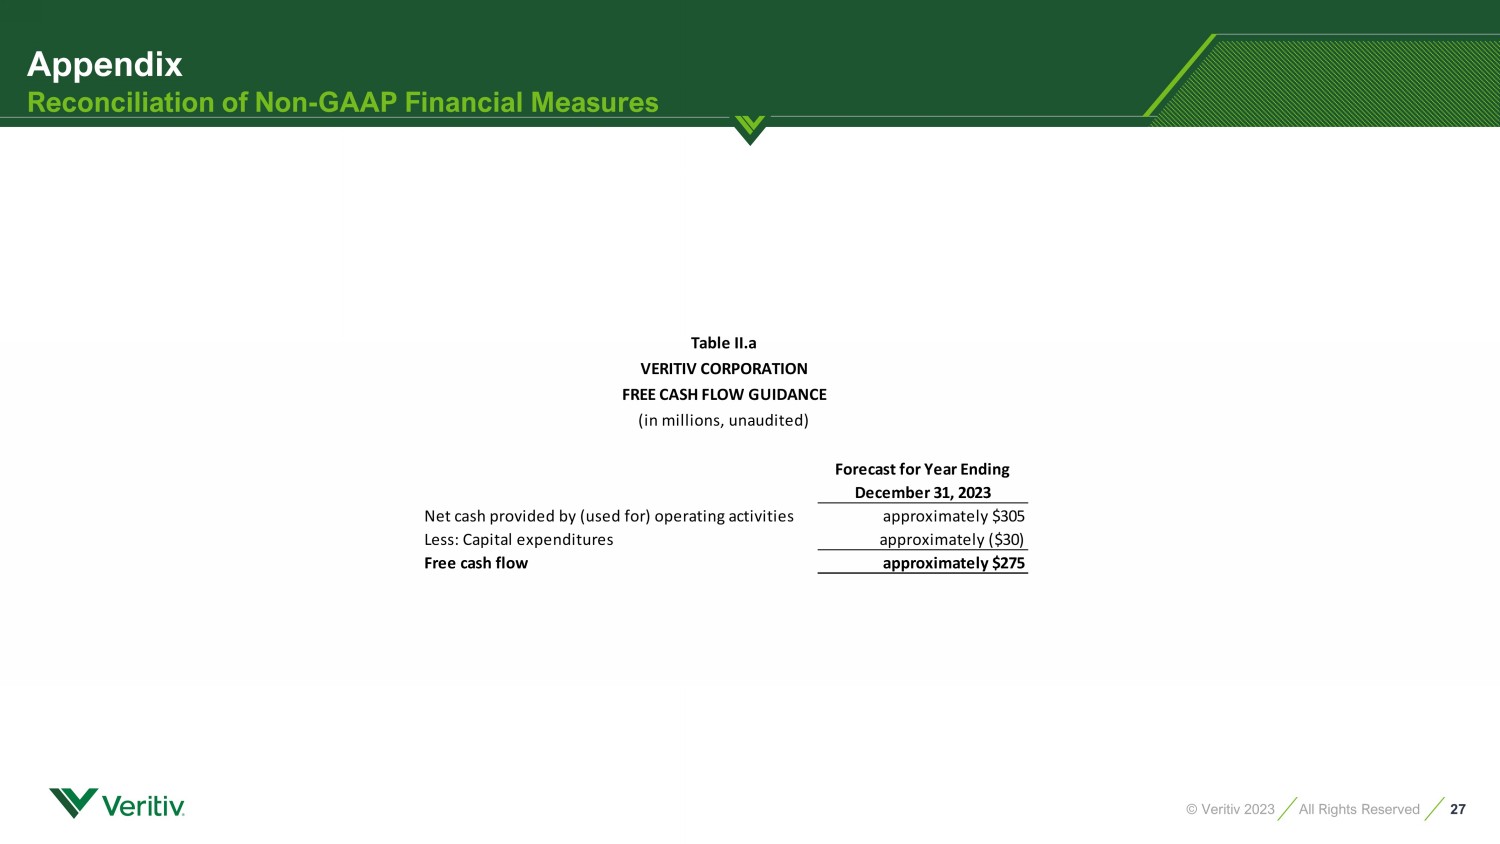
27 © Veritiv 2023 All Rights Reserved Appendix Reconciliation of Non - GAAP Financial Measures Forecast for Year Ending December 31, 2023 Net cash provided by (used for) operating activities approximately $305 Less: Capital expenditures approximately ($30) Free cash flow approximately $275 Table II.a VERITIV CORPORATION FREE CASH FLOW GUIDANCE (in millions, unaudited)
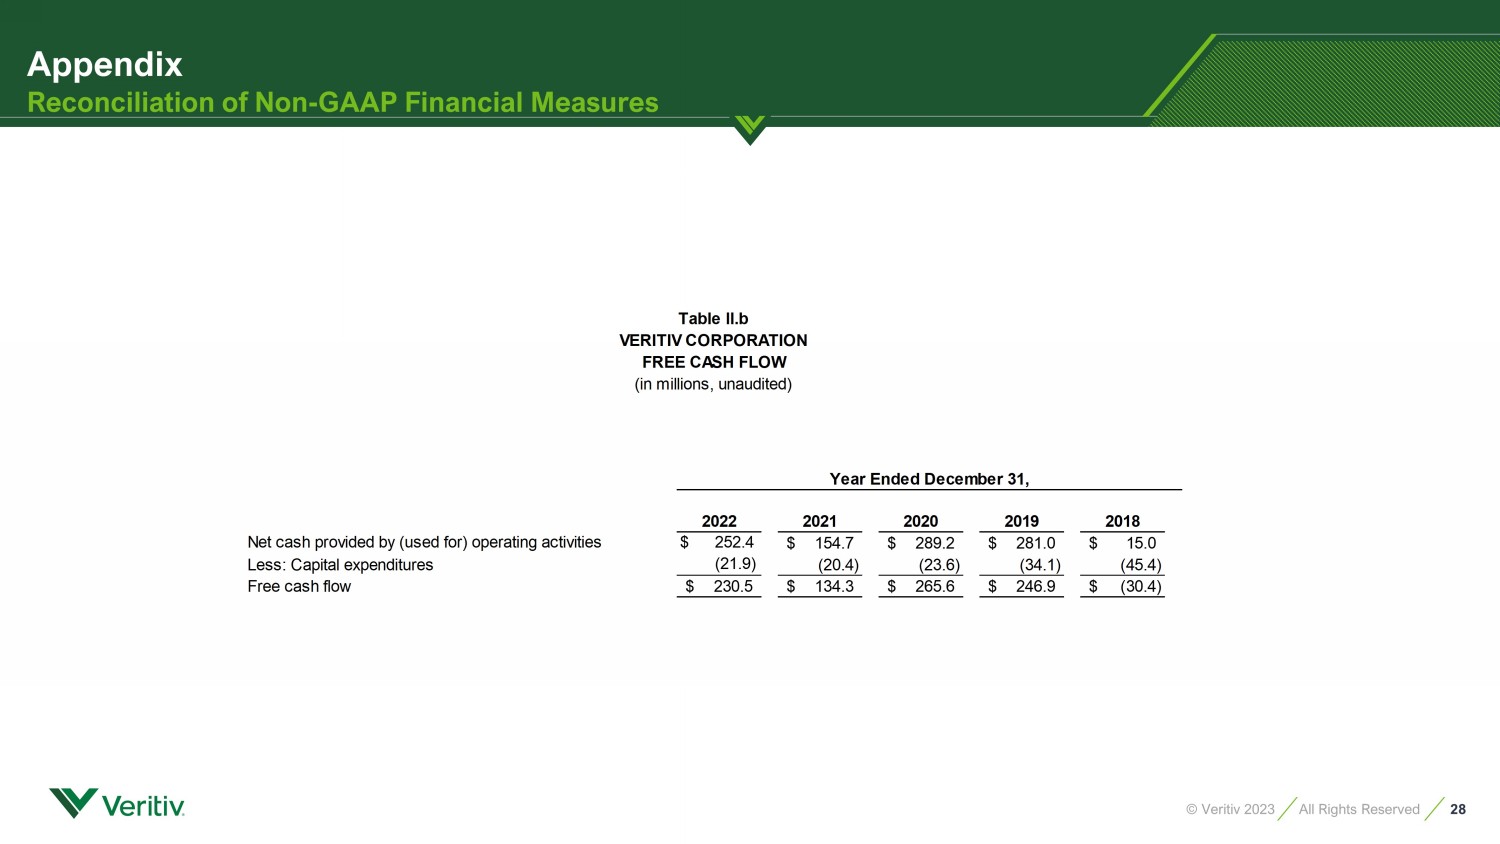
28 © Veritiv 2023 All Rights Reserved Appendix Reconciliation of Non - GAAP Financial Measures VERITIV CORPORATION FREE CASH FLOW (in millions, unaudited) 2022 2021 2020 2019 2018 Net cash provided by (used for) operating activities $ 252.4 154.7$ 289.2$ 281.0$ 15.0$ Less: Capital expenditures (21.9) (20.4) (23.6) (34.1) (45.4) Free cash flow 230.5$ 134.3$ 265.6$ 246.9$ (30.4)$ Table ll.b Year Ended December 31,
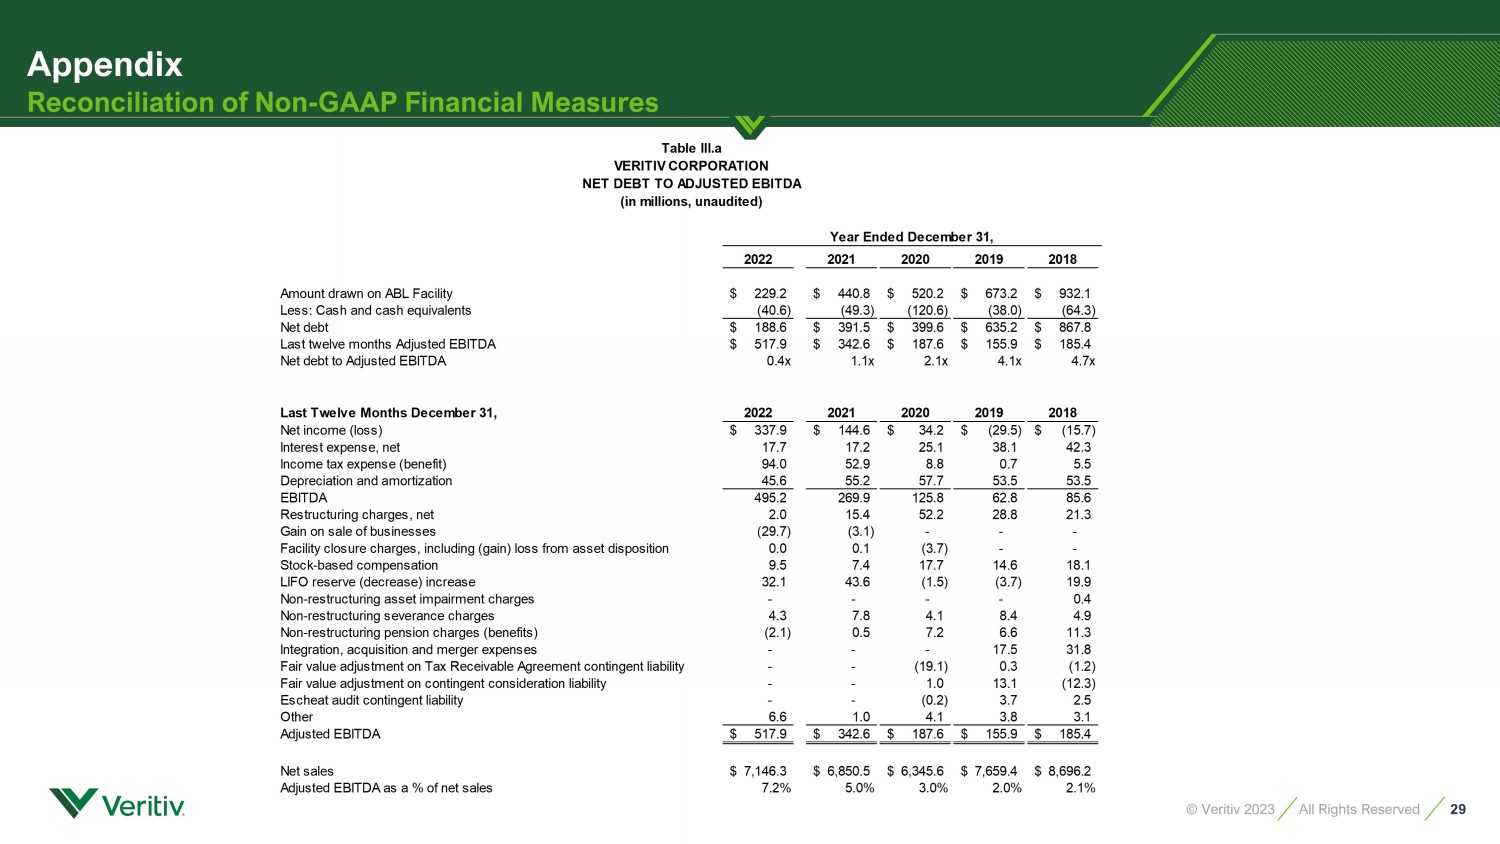
29 © Veritiv 2023 All Rights Reserved Appendix Reconciliation of Non - GAAP Financial Measures 2022 2021 2020 2019 2018 Amount drawn on ABL Facility 229.2$ 440.8$ 520.2$ 673.2$ 932.1$ Less: Cash and cash equivalents (40.6) (49.3) (120.6) (38.0) (64.3) Net debt 188.6$ 391.5$ 399.6$ 635.2$ 867.8$ Last twelve months Adjusted EBITDA 517.9$ 342.6$ 187.6$ 155.9$ 185.4$ Net debt to Adjusted EBITDA 0.4x 1.1x 2.1x 4.1x 4.7x Last Twelve Months December 31, 2022 2021 2020 2019 2018 Net income (loss) 337.9$ 144.6$ 34.2$ (29.5)$ (15.7)$ Interest expense, net 17.7 17.2 25.1 38.1 42.3 Income tax expense (benefit) 94.0 52.9 8.8 0.7 5.5 Depreciation and amortization 45.6 55.2 57.7 53.5 53.5 EBITDA 495.2 269.9 125.8 62.8 85.6 Restructuring charges, net 2.0 15.4 52.2 28.8 21.3 Gain on sale of businesses (29.7) (3.1) - - - Facility closure charges, including (gain) loss from asset disposition 0.0 0.1 (3.7) - - Stock-based compensation 9.5 7.4 17.7 14.6 18.1 LIFO reserve (decrease) increase 32.1 43.6 (1.5) (3.7) 19.9 Non-restructuring asset impairment charges - - - - 0.4 Non-restructuring severance charges 4.3 7.8 4.1 8.4 4.9 Non-restructuring pension charges (benefits) (2.1) 0.5 7.2 6.6 11.3 Integration, acquisition and merger expenses - - - 17.5 31.8 Fair value adjustment on Tax Receivable Agreement contingent liability - - (19.1) 0.3 (1.2) Fair value adjustment on contingent consideration liability - - 1.0 13.1 (12.3) Escheat audit contingent liability - - (0.2) 3.7 2.5 Other 6.6 1.0 4.1 3.8 3.1 Adjusted EBITDA 517.9$ 342.6$ 187.6$ 155.9$ 185.4$ Net sales 7,146.3$ 6,850.5$ 6,345.6$ 7,659.4$ 8,696.2$ Adjusted EBITDA as a % of net sales 7.2% 5.0% 3.0% 2.0% 2.1% Table lll.a VERITIV CORPORATION NET DEBT TO ADJUSTED EBITDA (in millions, unaudited) Year Ended December 31,

30 © Veritiv 2023 All Rights Reserved Veritiv Investor Presentation NYSE: VRTV March 2023