
Veritiv Corporation 3Q14 Financial Results November 13, 2014 Exhibit 99.2
Safe Harbor Provision Certain statements contained in this presentation regarding Veritiv Corporation’s (the “Company”) future operating results, performance, business plans, prospects, guidance and any other statements not constituting historical fact are “forward - looking statements” subject to the safe harbor created by the Private Securities Litigation Reform Act of 1995 . Where possible, the words “believe,” “expect,” “anticipate,” “intend,” “should,” “will,” “would,” “planned,” “estimated,” “potential,” “goal,” “outlook,” “may,” “predicts,” “could,” or the negative of such terms, or other comparable expressions, as they relate to the Company or its management, have been used to identify such forward - looking statements . All forward - looking statements reflect only the Company’s current beliefs and assumptions with respect to future operating results, performance, business plans, prospects, guidance and other matters, and are based on information currently available to the Company . Accordingly, the statements are subject to significant risks, uncertainties and contingencies, which could cause the Company’s actual operating results, performance or business plans or prospects to differ materially from those expressed in, or implied by, these statements . Factors that could cause actual results to differ materially from current expectations include risks and other factors described in the Company’s publicly available reports filed with the Securities and Exchange Commission (“SEC”), which contain a discussion of various factors that may affect the Company’s business or financial results . Such risks and other factors, which in some instances are beyond the Company’s control, include : the industry - wide decline in demand for paper and related products ; procurement and other risks in obtaining packaging, paper and facility products from our suppliers for resale to our customers ; increased competition, from existing and non - traditional sources ; loss of significant customers ; our ability to collect trade receivables from customers to whom we extend credit ; successful integration of the legacy Unisource and xpedx businesses and realization and timing of the expected synergy and other cost savings from the merger ; fuel cost increases ; inclement weather, anti - terrorism measures and other disruptions to the transportation network ; our ability to generate sufficient cash to service our debt ; our ability to comply with the covenants contained in our debt agreements ; our ability to refinance or restructure our debt on reasonable terms and conditions as might be necessary from time to time ; increasing interest rates ; foreign currency fluctuations ; changes in accounting standards and methodologies ; regulatory changes and judicial rulings impacting our business ; adverse results from litigation, governmental investigations or tax related proceedings or audits ; the effects of work stoppages, union negotiations and union disputes ; our reliance on third - party vendors for various services ; and other events of which we are presently unaware or that we currently deem immaterial that may result in unexpected adverse operating results . The Company is not responsible for updating the information contained in this presentation beyond the published date, or for changes made to this document by wire services or Internet service providers . This presentation is being furnished to the SEC through a Form 8 - K . The Company’s Quarterly Report on Form 10 - Q for the period ended September 30 , 2014 to be filed with the SEC may contain updates to the information included in this release . We reference non - GAAP financial measures in this presentation . Please see the appendix for reconciliations of non - GAAP measures to the most comparable GAAP measures . 2

Mary Laschinger, Chairman & CEO 3

Creating An Industry Leader 4 Market Leadership » Creates North American market leader » Improves market position by combining top industry leaders » Strengthens relationships with top customers and suppliers ─ Minimal customer overlap ─ Greater supply chain capability ─ Greater sourcing strategies Value Creation » Bigger, stronger, and more stable company » Better able to service our customers » Growth for suppliers » Opportunity to capture significant synergies ─ Strategic sourcing ─ Supply chain efficiencies ─ Fixed costs Strategic Focus » Creates a standalone company allowing for strategic focus » Better positioned to take advantage of higher margin growth » Creates a unique combination of two like companies
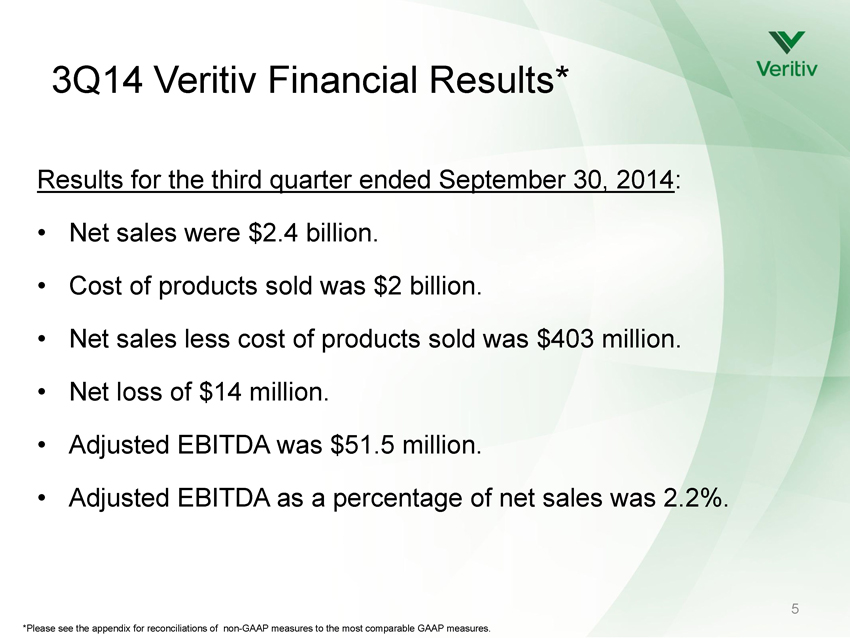
3Q14 Veritiv Financial Results* Results for the third quarter ended September 30, 2014 : • Net sales were $2.4 billion. • Cost of products sold was $2 billion. • Net sales less cost of products sold was $403 million. • Net loss of $14 million. • Adjusted EBITDA was $51.5 million. • Adjusted EBITDA as a percentage of net sales was 2.2%. 5 *Please see the appendix for reconciliations of non - GAAP measures to the most comparable GAAP measures.
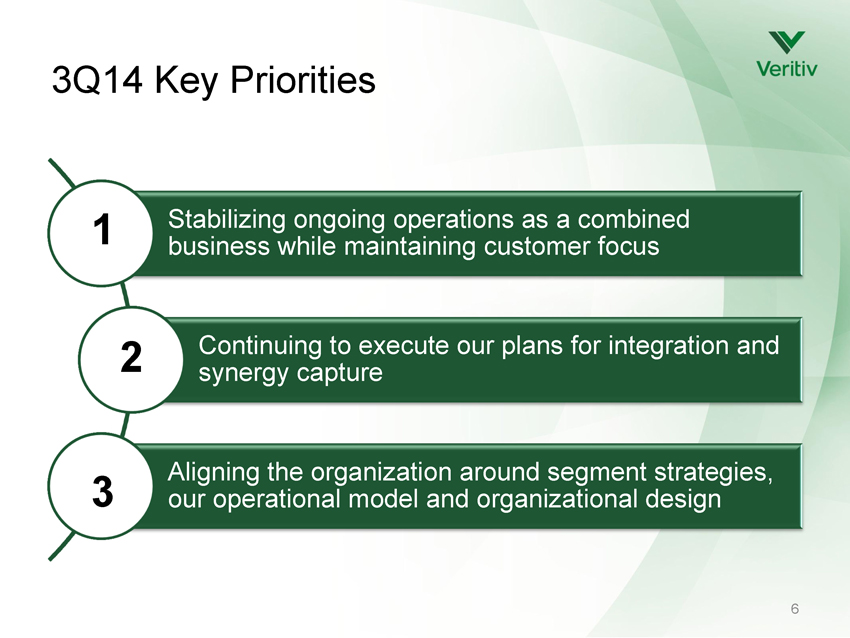
3Q14 Key Priorities Stabilizing ongoing operations as a combined business while maintaining customer focus Continuing to execute our plans for integration and synergy capture Aligning the organization around segment strategies, our operational model and organizational design 6 1 2 3

Steve Smith, CFO 7
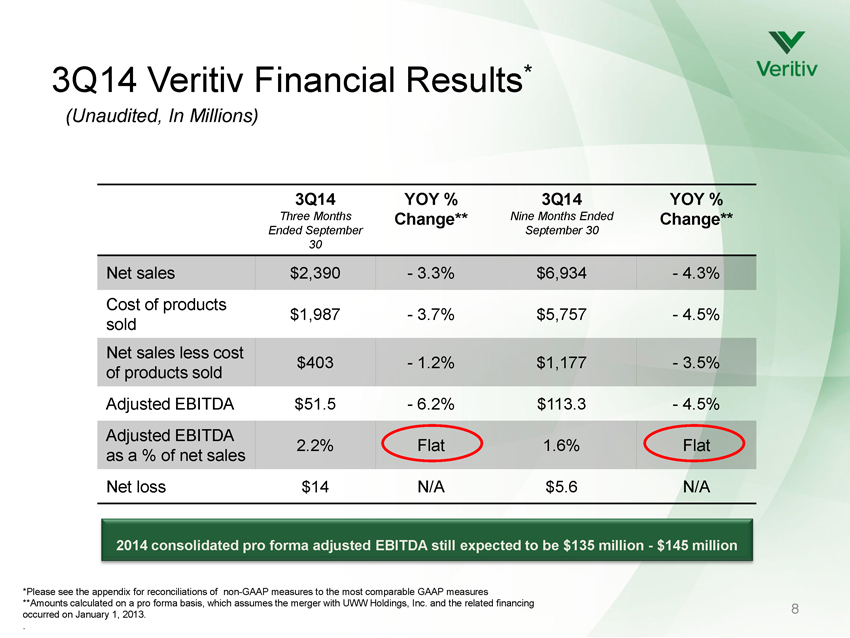
3Q14 Veritiv Financial Results * 8 *Please see the appendix for reconciliations of non - GAAP measures to the most comparable GAAP measures **Amounts calculated on a pro forma basis, which assumes the merger with UWW Holdings, Inc. and the related financing occurred on January 1, 2013. . (Unaudited, In Millions) 3Q14 Three Months Ended September 30 YOY % Change** 3Q14 Nine Months Ended September 30 YOY % Change** Net sales $2,390 - 3.3% $6,934 - 4.3% Cost of products sold $1,987 - 3.7% $5,757 - 4.5% Net sales less cost of products sold $403 - 1.2% $1,177 - 3.5% Adjusted EBITDA $51.5 - 6.2% $113.3 - 4.5% Adjusted EBITDA as a % of net sales 2.2% Flat 1.6% Flat Net loss $14 N/A $5.6 N/A 2014 consolidated pro forma adjusted EBITDA still expected to be $135 million - $145 million
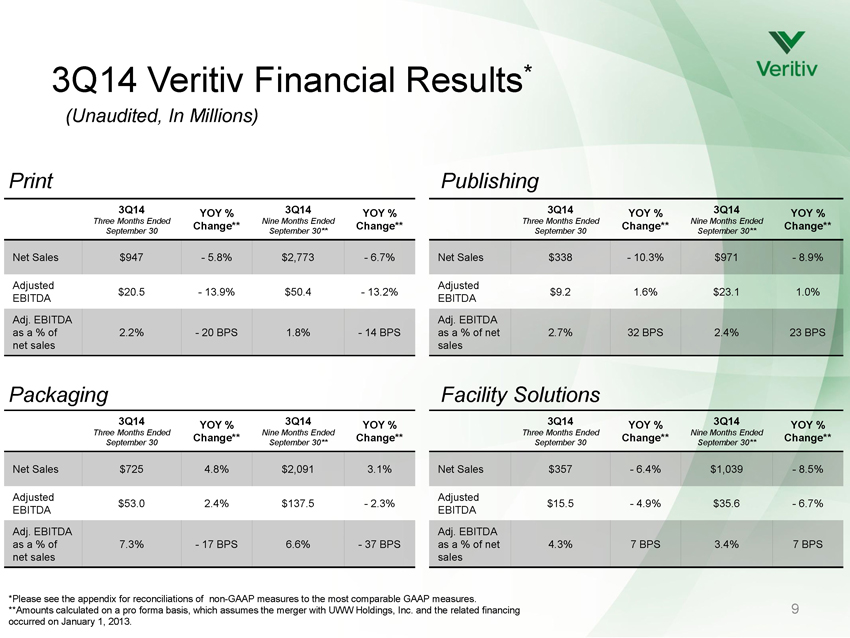
3Q14 Veritiv Financial Results * 9 *Please see the appendix for reconciliations of non - GAAP measures to the most comparable GAAP measures. **Amounts calculated on a pro forma basis, which assumes the merger with UWW Holdings, Inc. and the related financing occurred on January 1, 2013. (Unaudited, In Millions) 3Q14 Three Months Ended September 30 YOY % Change** 3Q14 Nine Months Ended September 30** YOY % Change** Net Sales $947 - 5.8% $2,773 - 6.7% Adjusted EBITDA $20.5 - 13.9% $50.4 - 13.2% Adj. EBITDA as a % of net sales 2.2% - 20 BPS 1.8% - 14 BPS Print Publishing Packaging Facility Solutions 3Q14 Three Months Ended September 30 YOY % Change** 3Q14 Nine Months Ended September 30** YOY % Change** Net Sales $338 - 10.3% $971 - 8.9% Adjusted EBITDA $9.2 1.6% $23.1 1.0% Adj. EBITDA as a % of net sales 2.7% 32 BPS 2.4% 23 BPS 3Q14 Three Months Ended September 30 YOY % Change** 3Q14 Nine Months Ended September 30** YOY % Change** Net Sales $725 4.8% $2,091 3.1% Adjusted EBITDA $53.0 2.4% $137.5 - 2.3% Adj. EBITDA as a % of net sales 7.3% - 17 BPS 6.6% - 37 BPS 3Q14 Three Months Ended September 30 YOY % Change** 3Q14 Nine Months Ended September 30** YOY % Change** Net Sales $357 - 6.4% $1,039 - 8.5% Adjusted EBITDA $15.5 - 4.9% $35.6 - 6.7% Adj. EBITDA as a % of net sales 4.3% 7 BPS 3.4% 7 BPS
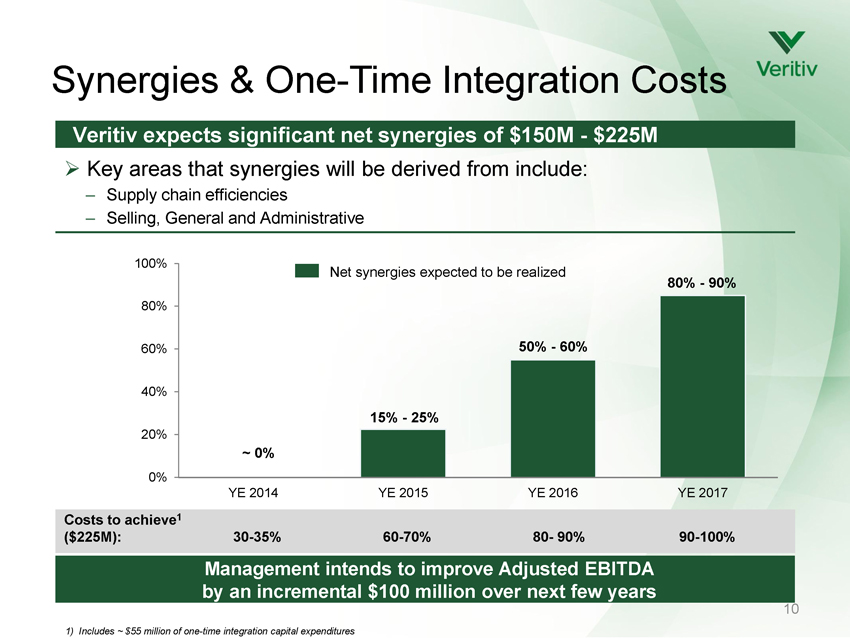
10 Veritiv expects significant net synergies of $150M - $225M » Key areas that synergies will be derived from include: – Supply chain efficiencies – Selling, General and Administrative 0% 20% 40% 60% 80% 100% YE 2014 YE 2015 YE 2016 YE 2017 Net synergies expected to be realized Costs to achieve 1 ($225M): 30 - 35% 60 - 70% 80 - 90% 90 - 100% 1) Includes ~ $55 million of one - time integration capital expenditures Synergies & One - Time Integration Costs 15% - 25% 50% - 60% 80% - 90% ~ 0% Management intends to improve Adjusted EBITDA by an incremental $100 million over next few years
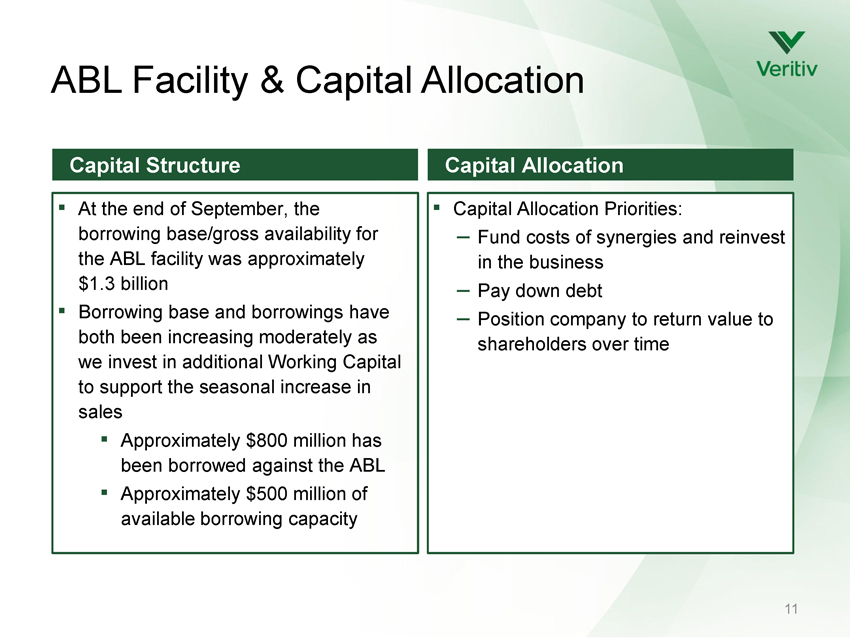
11 Capital Structure Capital Allocation ▪ Capital Allocation Priorities: – Fund costs of synergies and reinvest in the business – Pay down debt – Position company to return value to shareholders over time ▪ A t the end of September, the borrowing base/gross availability for the ABL facility was approximately $1.3 billion ▪ Borrowing base and borrowings have both been increasing moderately as we invest in additional Working Capital to support the seasonal increase in sales ▪ Approximately $800 million has been borrowed against the ABL ▪ Approximately $500 million of available borrowing capacity ABL Facility & Capital Allocation

Mary Laschinger, Chairman & CEO 12
Appendix: Non - GAAP Measures 13 We supplement our financial information prepared in accordance with GAAP with Adjusted EBITDA (earnings before interest, income taxes, depreciation and amortization, restructuring charges (income), non - restructuring stock - based compensation expense, LIFO (income) expense, asset impairment charge, non - restructuring severance charges, (gain ) loss on sale of joint venture, merger and integration expenses, purchase accounting adjustments, and loss from discontinued operations, net of income taxes) because we believe investors commonly use Adjusted EBITDA as a main component of valuing companies such as ours. In addition, the credit agreement governing our ABL Facility permits us to exclude these and other charges in calculating “Consolidated EBITDA” pursuant to such credit agreement. Adjusted EBITDA is not a measurement of financial performance under GAAP. Non - GAAP measures do not have definitions under GAAP and may be defined differently by and not be comparable to, similarly titled measures used by other companies. As a result, we consider and evaluate non - GAAP measures in connection with a review of the most directly comparable measure calculated in accordance with GAAP. We caution investors not to place undue reliance on such non - GAAP measures, but also to consider them with the most directly comparable GAAP measure. Adjusted EBITDA has a limitation as an analytical tool and should not be considered in isolation or as a substitute for analyzing our results as reported under GAAP. Please see the following schedules and related footnotes for reconciliations of these non - GAAP measures to the most comparable GAAP measures.
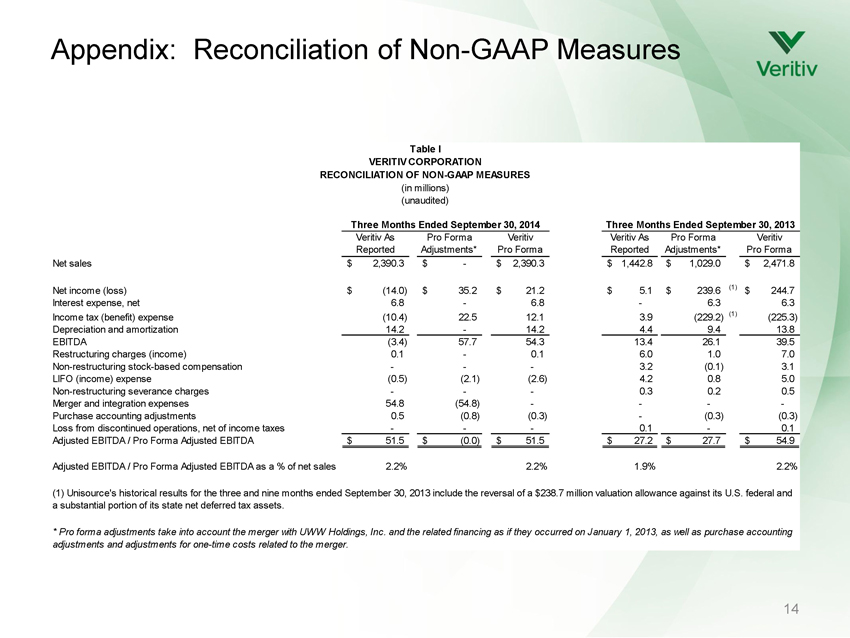
Appendix: Reconciliation of Non - GAAP Measures 14 Table I VERITIV CORPORATION RECONCILIATION OF NON-GAAP MEASURES (in millions) (unaudited) Veritiv As Reported Pro Forma Adjustments* Veritiv Pro Forma Veritiv As Reported Pro Forma Adjustments* Veritiv Pro Forma Net sales 2,390.3$ -$ 2,390.3$ 1,442.8$ 1,029.0$ 2,471.8$ Net income (loss) (14.0)$ 35.2$ 21.2$ 5.1$ 239.6$ (1) 244.7$ Interest expense, net 6.8 - 6.8 - 6.3 6.3 Income tax (benefit) expense (10.4) 22.5 12.1 3.9 (229.2) (1) (225.3) Depreciation and amortization 14.2 - 14.2 4.4 9.4 13.8 EBITDA (3.4) 57.7 54.3 13.4 26.1 39.5 Restructuring charges (income) 0.1 - 0.1 6.0 1.0 7.0 Non-restructuring stock-based compensation - - - 3.2 (0.1) 3.1 LIFO (income) expense (0.5) (2.1) (2.6) 4.2 0.8 5.0 Non-restructuring severance charges - - - 0.3 0.2 0.5 Merger and integration expenses 54.8 (54.8) - - - - Purchase accounting adjustments 0.5 (0.8) (0.3) - (0.3) (0.3) Loss from discontinued operations, net of income taxes - - - 0.1 - 0.1 Adjusted EBITDA / Pro Forma Adjusted EBITDA 51.5$ (0.0)$ 51.5$ 27.2$ 27.7$ 54.9$ Adjusted EBITDA / Pro Forma Adjusted EBITDA as a % of net sales 2.2% 2.2% 1.9% 2.2% Three Months Ended September 30, 2013Three Months Ended September 30, 2014 (1) Unisource's historical results for the three and nine months ended September 30, 2013 include the reversal of a $238.7 million valuation allowance against its U.S. federal and a substantial portion of its state net deferred tax assets. * Pro forma adjustments take into account the merger with UWW Holdings, Inc. and the related financing as if they occurred on January 1, 2013, as well as purchase accounting adjustments and adjustments for one-time costs related to the merger.
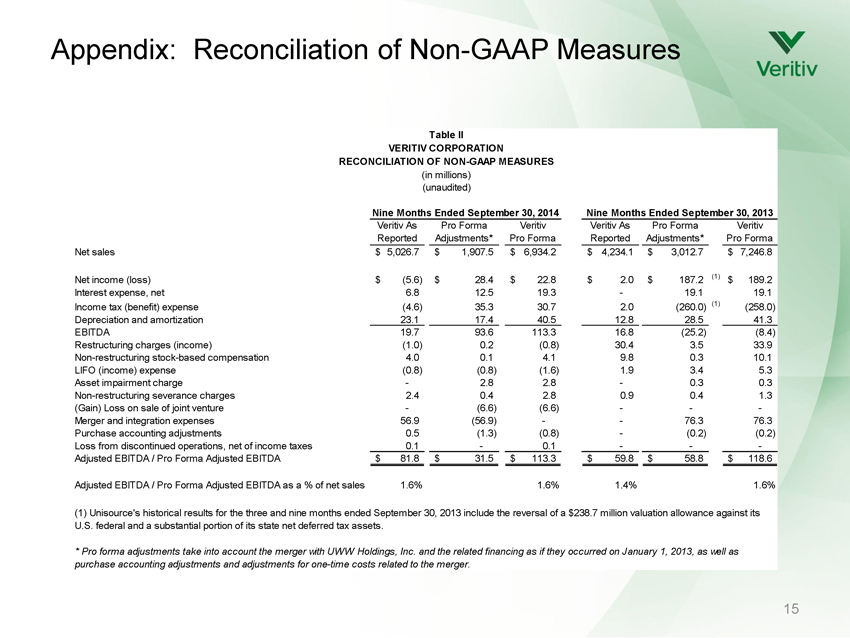
Appendix: Reconciliation of Non - GAAP Measures 15 Table II VERITIV CORPORATION RECONCILIATION OF NON-GAAP MEASURES (in millions) (unaudited) Veritiv As Reported Pro Forma Adjustments* Veritiv Pro Forma Veritiv As Reported Pro Forma Adjustments* Veritiv Pro Forma Net sales 5,026.7$ 1,907.5$ 6,934.2$ 4,234.1$ 3,012.7$ 7,246.8$ Net income (loss) (5.6)$ 28.4$ 22.8$ 2.0$ 187.2$ (1) 189.2$ Interest expense, net 6.8 12.5 19.3 - 19.1 19.1 Income tax (benefit) expense (4.6) 35.3 30.7 2.0 (260.0) (1) (258.0) Depreciation and amortization 23.1 17.4 40.5 12.8 28.5 41.3 EBITDA 19.7 93.6 113.3 16.8 (25.2) (8.4) Restructuring charges (income) (1.0) 0.2 (0.8) 30.4 3.5 33.9 Non-restructuring stock-based compensation 4.0 0.1 4.1 9.8 0.3 10.1 LIFO (income) expense (0.8) (0.8) (1.6) 1.9 3.4 5.3 Asset impairment charge - 2.8 2.8 - 0.3 0.3 Non-restructuring severance charges 2.4 0.4 2.8 0.9 0.4 1.3 (Gain) Loss on sale of joint venture - (6.6) (6.6) - - - Merger and integration expenses 56.9 (56.9) - - 76.3 76.3 Purchase accounting adjustments 0.5 (1.3) (0.8) - (0.2) (0.2) Loss from discontinued operations, net of income taxes 0.1 - 0.1 - - - Adjusted EBITDA / Pro Forma Adjusted EBITDA 81.8$ 31.5$ 113.3$ 59.8$ 58.8$ 118.6$ Adjusted EBITDA / Pro Forma Adjusted EBITDA as a % of net sales 1.6% 1.6% 1.4% 1.6% Nine Months Ended September 30, 2013Nine Months Ended September 30, 2014 (1) Unisource's historical results for the three and nine months ended September 30, 2013 include the reversal of a $238.7 million valuation allowance against its U.S. federal and a substantial portion of its state net deferred tax assets. * Pro forma adjustments take into account the merger with UWW Holdings, Inc. and the related financing as if they occurred on January 1, 2013, as well as purchase accounting adjustments and adjustments for one-time costs related to the merger.

Veritiv Corporation 3Q14 Financial Results November 13, 2014