Exhibit 99.1
Safe Harbor
With the exception of historical information, certain matters disclosed in this presentation are forward-looking statements. Forward-looking statements involve known and unknown risks and uncertainties that could cause actual results to differ materially from those expressed or implied in the forward-looking statements. Potential risks and uncertainties are described in the filings of SunEdison, Inc. (“SunEdison”) and TerraForm Power, Inc. (“TerraForm” and, together with SunEdison, the “Companies”) with the Securities and Exchange Commission (SEC), including SunEdison Inc.’s most recent report on Form 10-K, TerraForm Power, Inc.’s registration statement for its initial public offering, and each Company’s reports on Forms 10-Q and 8-K, in addition to the risks and uncertainties described on page 3 of this presentation. These forward-looking statements represent the Companies’ judgment as of the date of this presentation and the Companies disclaim any intent or obligation to update these forward-looking statements, except as otherwise required by law.
This presentation also includes non-GAAP financial measures. You can find a reconciliation of the non-GAAP financial measures to the most directly comparable GAAP financial measures in the appendix to this presentation.
TerraForm POWER
a SunEdison company
2
Forward-Looking Statements
This report contains “forward-looking statements” within the meaning of Section 27A of the Securities Act of 1933 and Section 21E of the Securities Exchange Act of 1934. Such forward-looking statements are subject to certain risks, uncertainties and assumptions, including the timing of the completion of the First Wind acquisition, and typically can be identified by the use of words such as “expect,” “estimate,” “anticipate,” “forecast,” “intend,” “project,” “target,” “plan,” “believe” and similar terms and expressions. Certain matters discussed in this presentation and conference call are forward-looking statements. The forward-looking statements contained in this presentation represent the SunEdison and TerraForm’s judgment as of the date of this presentation and are based on current expectations and assumptions. Although SunEdison and TerraForm believe that their expectations and assumptions are reasonable, they can give no assurance that these expectations and assumptions will prove to have been correct, and actual results may vary materially. Factors that could cause actual results to differ materially from those set forth in the forward-looking statements include, among others: the failure of counterparties to fulfill their obligations under off-take agreements; price fluctuations, termination provisions and buyout provisions in offtake agreements; TeraForm’s ability to enter into contracts to sell power on acceptable terms as offtake agreements expire; delays or unexpected costs during the completion of projects under construction; TerraForm’s ability to successfully identify, evaluate and consummate acquisitions from SunEdison, Inc. or third parties, including the acquisition of the First Wind wind generating projects from Sellers and to integrate such assets; government regulation; operating and financial restrictions under agreements governing indebtedness; SunEdison and TerraForm’s ability to borrow additional funds and access capital markets; SunEdison and TerraForm’s ability to compete against traditional and renewable energy companies; hazards customary to the power production industry and power generation operations, such as unusual weather conditions and outages, and TerraForm’s ability to operate its business efficiently and enter into new business segments or new geographies. Furthermore, any dividends are subject to available capital, market conditions and compliance with associated laws and regulations and other matters that our board of directors deem relevant. SunEdison and TerraForm undertake no obligation to update or revise any forward-looking statements, whether as a result of new information, future events or otherwise, except as otherwise required by law. The foregoing review of factors that could cause SunEdison and TerraForm’s actual results to differ materially from those contemplated in the forward-looking statements included in this report should be considered in connection with information regarding risks and uncertainties that may affect SunEdison and TerraForm’s future results included in SunEdison and TerraForm’s filings with the Securities and Exchange Commission available at www.sec.gov.
TerraForm POWER
a SunEdison company
3
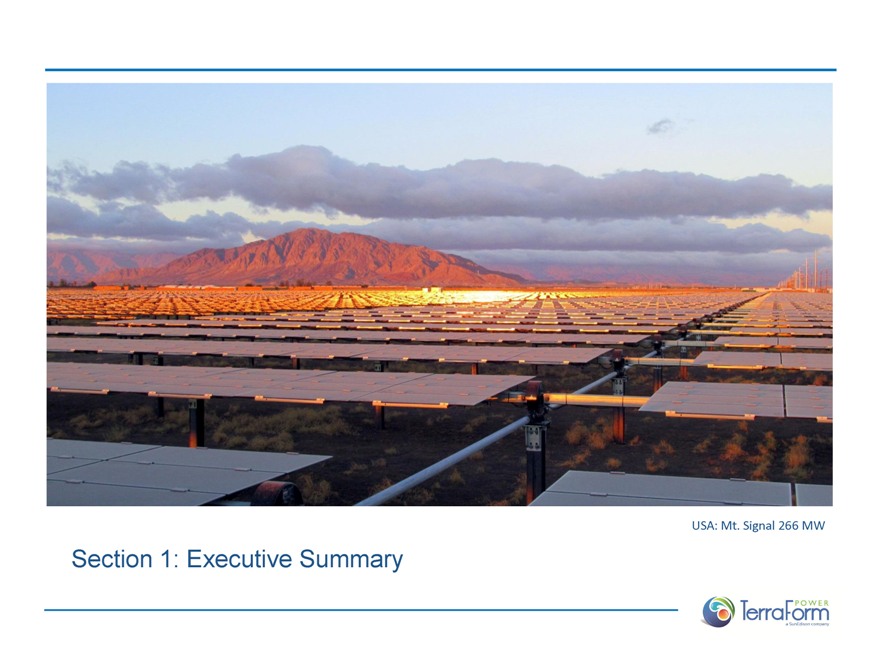
USA: Mt. Signal 266 MW
Section 1: Executive Summary
TerraForm POWER
a SunEdison company
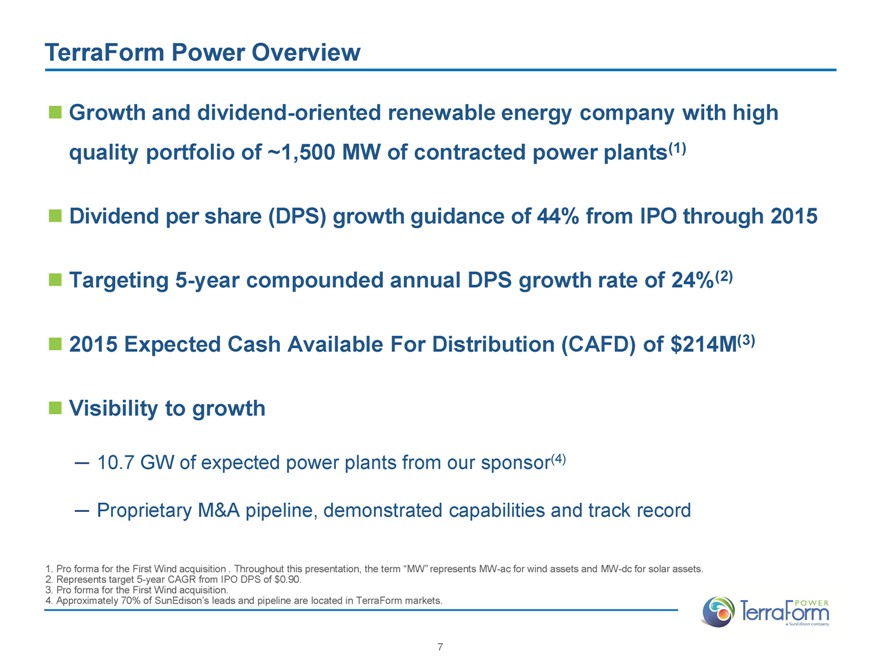
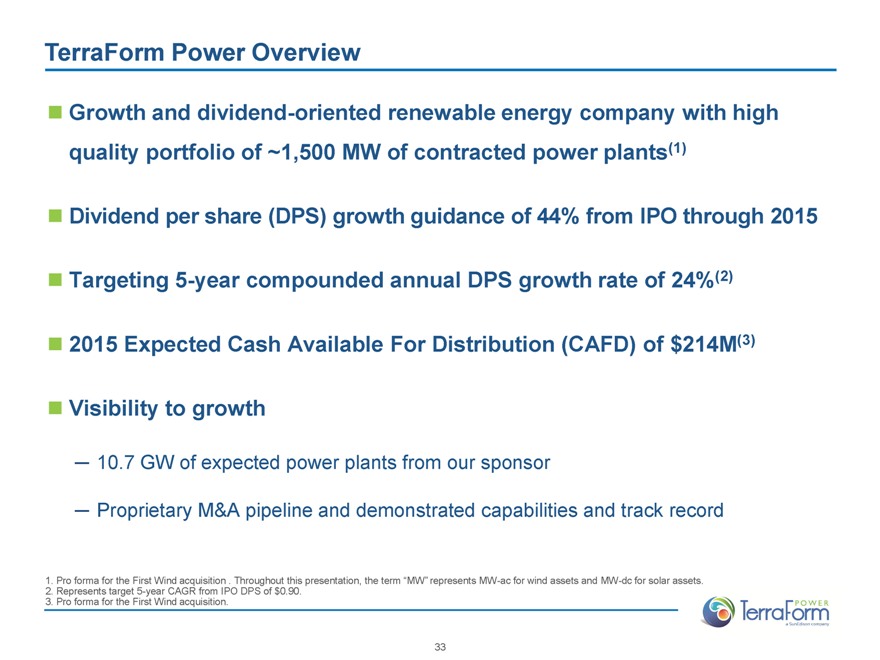
TerraForm Power Overview
Growth and dividend-oriented renewable energy company with high quality portfolio of ~1,500 MW of contracted power plants(1)
Dividend per share (DPS) growth guidance of 44% from IPO through 2015
Targeting 5-year compounded annual DPS growth rate of 24%(2)
2015 Expected Cash Available For Distribution (CAFD) of $214M(3)
Visibility to growth
10.7 GW of expected power plants from our sponsor(4)
Proprietary M&A pipeline, demonstrated capabilities and track record
1. Pro forma for the First Wind acquisition . Throughout this presentation, the term “MW” represents MW-ac for wind assets and MW-dc for solar assets.
2. Represents target 5-year CAGR from IPO DPS of $0.90.
3. Pro forma for the First Wind acquisition.
4. Approximately 70% of SunEdison’s leads and pipeline are located in TerraForm markets.
TerraForm POWER
a SunEdison company
7
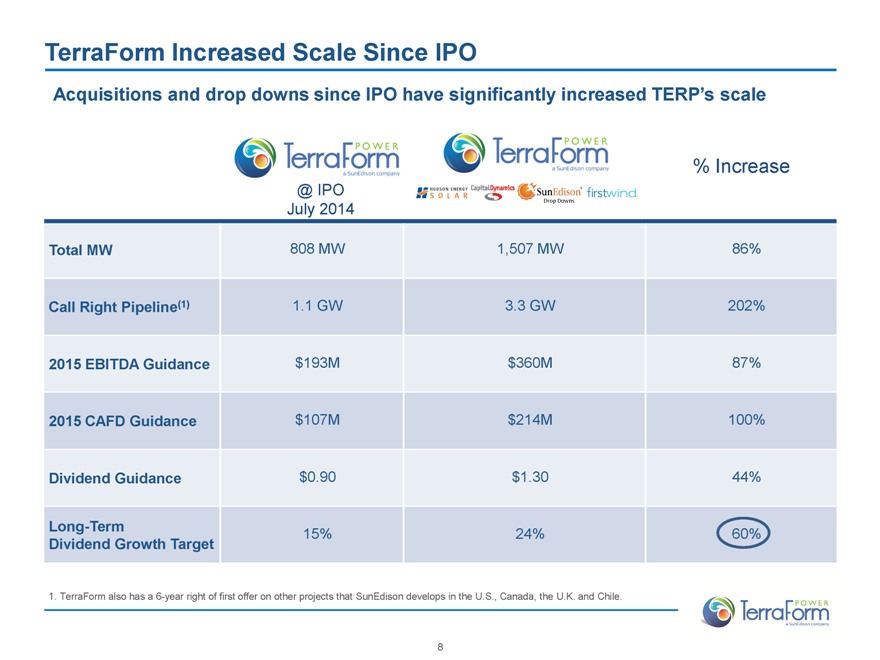
TerraForm Increased Scale Since IPO
Acquisitions and drop downs since IPO have significantly increased TERP’s scale
TerraForm POWER a SunEdison company TerraForm POWER a SunEdison company % Increase
@ IPO July 2014 HUDSON ENERGY SOLAR CapitalDynamics SunEdison Drop Downs firstwind
Total MW 808 MW 1,507 MW 86%
Call Right Pipeline(1) 1.1 GW 3.3 GW 202%
2015 EBITDA Guidance $193M $360M 87%
2015 CAFD Guidance $107M $214M 100%
Dividend Guidance $0.90 $1.30 44%
Long-Term 15% 24% 60%
Dividend Growth Target
1. TerraForm also has a 6-year right of first offer on other projects that SunEdison develops in the U.S., Canada, the U.K. and Chile.
TerraForm POWER
a SunEdison company
8
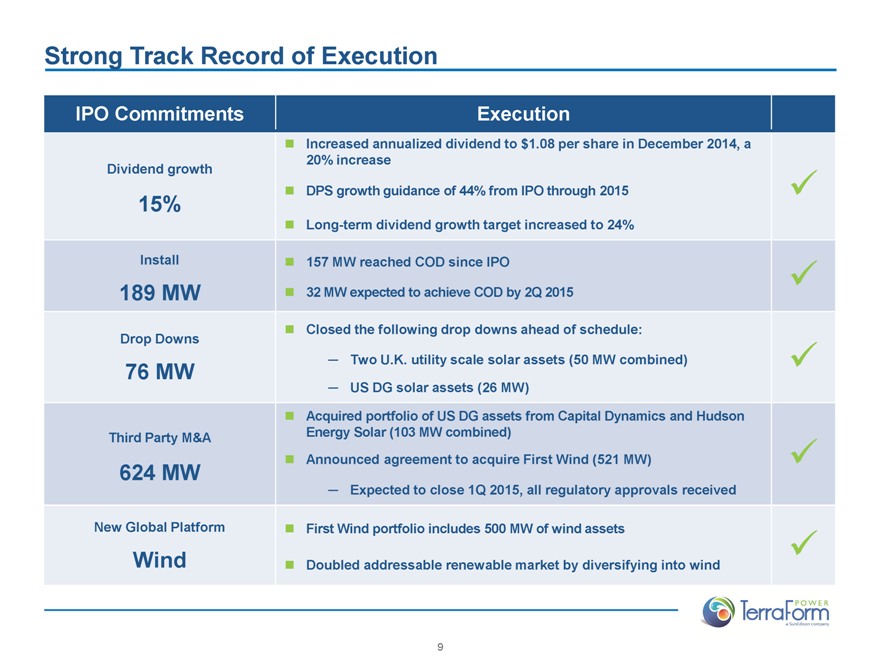
Strong Track Record of Execution
IPO Commitments Execution
Increased annualized dividend to $1.08 per share in December 2014, a 20% increase
Dividend growth
DPS growth guidance of 44% from IPO through 2015
15%
Long-term dividend growth target increased to 24%
Install 157 MW reached COD since IPO
189 MW 32 MW expected to achieve COD by 2Q 2015
Closed the following drop downs ahead of schedule:
Drop Downs
Two U.K. utility scale solar assets (50 MW combined)
76 MW
US DG solar assets (26 MW)
Third Party M&A Acquired portfolio of US DG assets from Capital Dynamics and Hudson Energy Solar (103 MW combined)
Announced agreement to acquire First Wind (521 MW)
624 MW
Expected to close 1Q 2015, all regulatory approvals received
New Global Platform First Wind portfolio includes 500 MW of wind assets
Wind Doubled addressable renewable market by diversifying into wind
TerraForm POWER
a SunEdison company
9
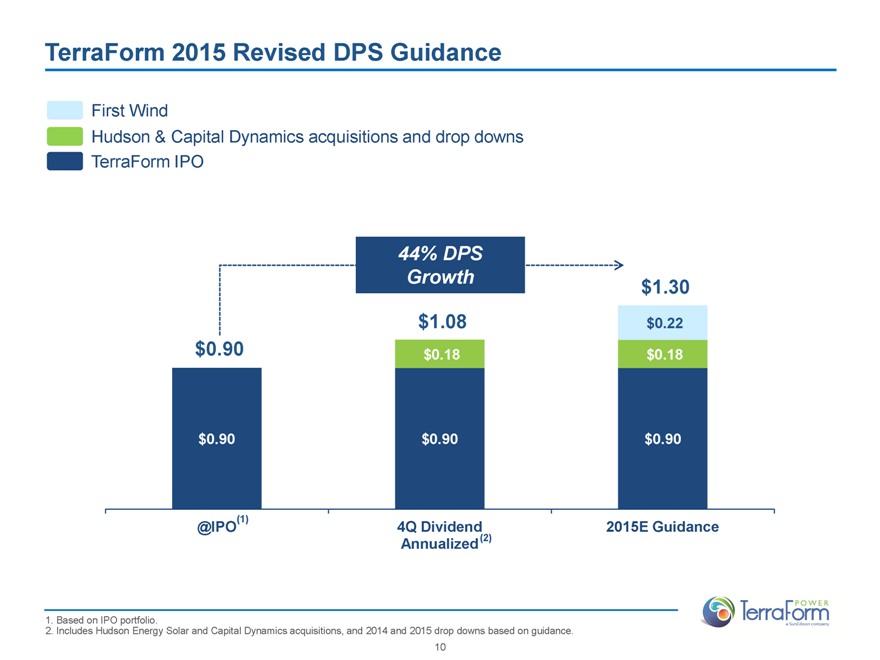
TerraForm 2015 Revised DPS Guidance
First Wind
Hudson & Capital Dynamics acquisitions and drop downs
TerraForm IPO
44% DPS Growth $1.30
$1.08 $0.22
$ 0.90 $0.18 $0.18
$0.90 $0.90 $0.90
@IPO(1) 4Q Dividend Annualized (2) 2015E Guidance
1. Based on IPO portfolio.
2. Includes Hudson Energy Solar and Capital Dynamics acquisitions, and 2014 and 2015 drop downs based on guidance.
TerraForm POWER
a SunEdison company
10
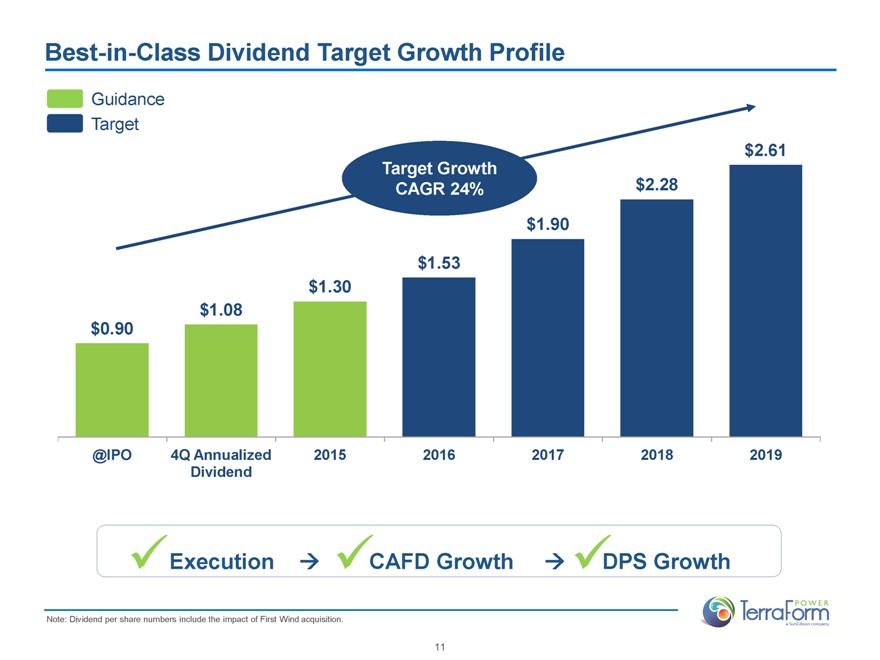
Best-in-Class Dividend Target Growth Profile
Guidance
Target
$2.61
Target Growth CAGR 24% $2.28
$1.90
$1.53
$1.30
$1.08
$0.90
@IPO 4Q Annualized Dividend 2015 2016 2017 2018 2019
Execution CAFD Growth DPS Growth
Note: Dividend per share numbers include the impact of First Wind acquisition.
TerraForm POWER
a SunEdison company
11
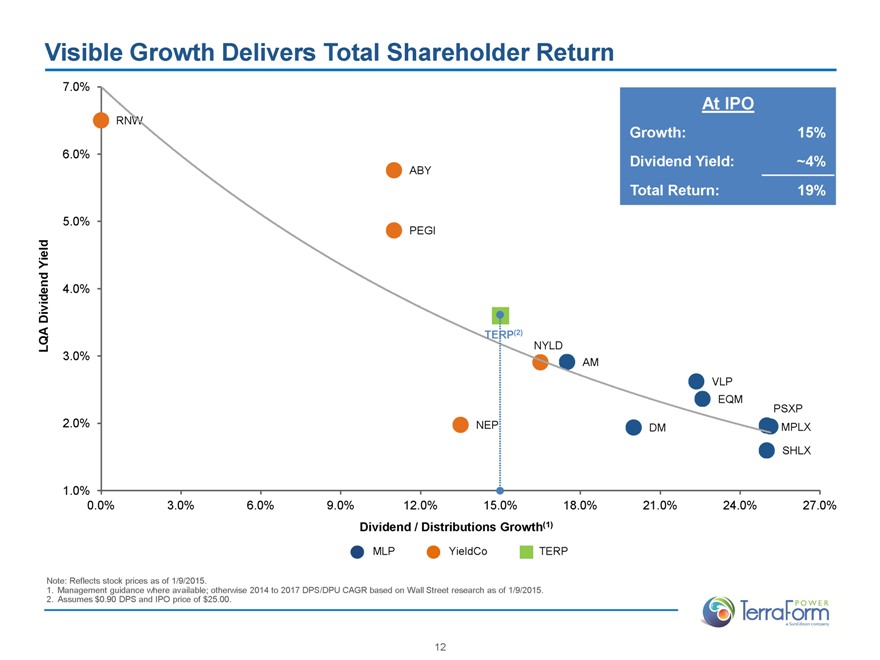
Visible Growth Delivers Total Shareholder Return
7.0%
At IPO
RNW
Growth: 15%
6.0% Dividend Yield: ~4%
ABY
Total Return: 19%
5.0%
PEGI
Yield
Dividend 4.0%
TERP(2)
LQA NYLD
3.0% AM
VLP
EQM
PSXP
2.0% NEP DM MPLX
SHLX
1.0%
0.0% 3.0% 6.0% 9.0% 12.0% 15.0% 18.0% 21.0% 24.0% 27.0%
Dividend / Distributions Growth(1)
MLP YieldCo TERP
Note: Reflects stock prices as of 1/9/2015.
1. Management guidance where available; otherwise 2014 to 2017 DPS/DPU CAGR based on Wall Street research as of 1/9/2015.
2. Assumes $0.90 DPS and IPO price of $25.00.
TerraForm POWER
a SunEdison company
12
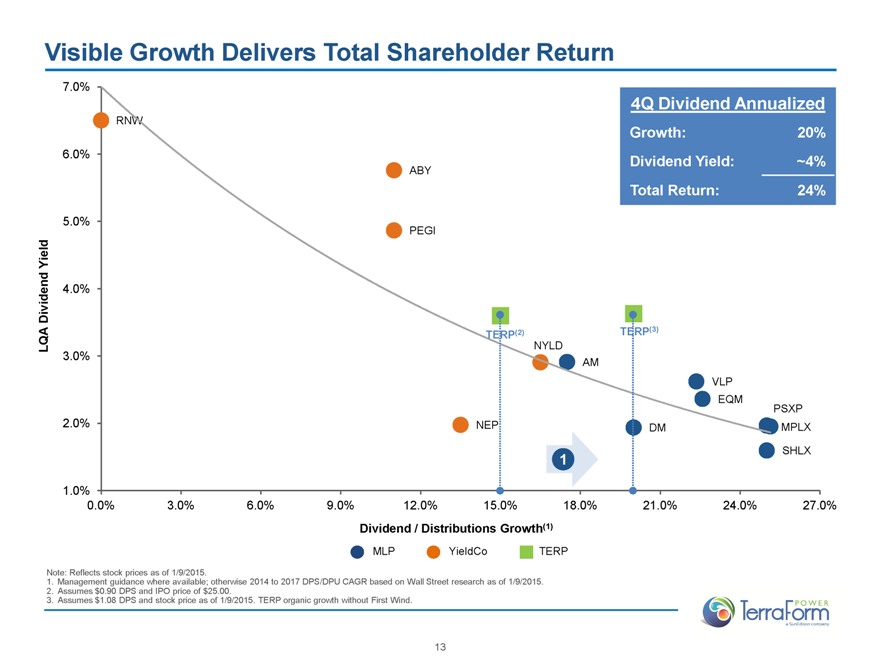
Visible Growth Delivers Total Shareholder Return
4Q Dividend Annualized
Growth: 20%
Dividend Yield: ~4%
Total Return: 24%
LQA Dividend Yield
7.0% 6.0% 5.0% 4.0% 3.0% 2.0% 1.0%
RNW
ABY
PEGI
TERP(2)
TERP(3)
NYLD
AM
VLP
EQM
PSXP
NEP
DM
MPLX
SHLX
1
0.0% 3.0% 6.0% 9.0% 12.0% 15.0% 18.0% 21.0% 24.0% 27.0%
Dividend / Distributions Growth(1)
MLP YieldCo TERP
Note: Reflects stock prices as of 1/9/2015.
1. Management guidance where available; otherwise 2014 to 2017 DPS/DPU CAGR based on Wall Street research as of 1/9/2015.
2. Assumes $0.90 DPS and IPO price of $25.00.
3. Assumes $1.08 DPS and stock price as of 1/9/2015. TERP organic growth without First Wind.
TerraForm POWER
a SunEdison company
13
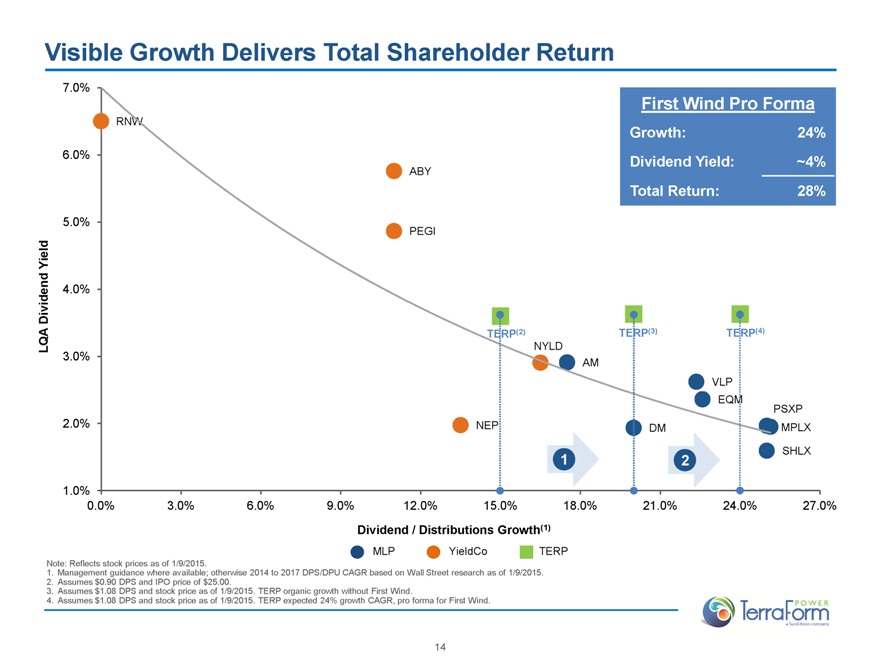
Visible Growth Delivers Total Shareholder Return
First Wind Pro Forma
Growth: 24%
Dividend Yield: ~4%
Total Return: 28%
LQA Dividend Yield
7.0% 6.0% 5.0% 4.0% 3.0% 2.0% 1.0%
RNW
ABY
PEGI
TERP(2)
TERP(3)
TERP(4)
NYLD
AM
VLP
EQM
PSXP
NEP
DM
MPLX
SHLX
1 2
0.0% 3.0% 6.0% 9.0% 12.0% 15.0% 18.0% 21.0% 24.0% 27.0%
Dividend / Distributions Growth(1)
MLP YieldCo TERP
Note: Reflects stock prices as of 1/9/2015.
1. Management guidance where available; otherwise 2014 to 2017 DPS/DPU CAGR based on Wall Street research as of 1/9/2015.
2. Assumes $0.90 DPS and IPO price of $25.00.
3. Assumes $1.08 DPS and stock price as of 1/9/2015. TERP organic growth without First Wind.
4. Assumes $1.08 DPS and stock price as of 1/9/2015. TERP expected 24% growth CAGR, pro forma for First Wind.
TerraForm POWER
a SunEdison company
14
Section 2: Our Portfolio
USA: Alamosa 8 MW
TerraForm POWER
a SunEdison company
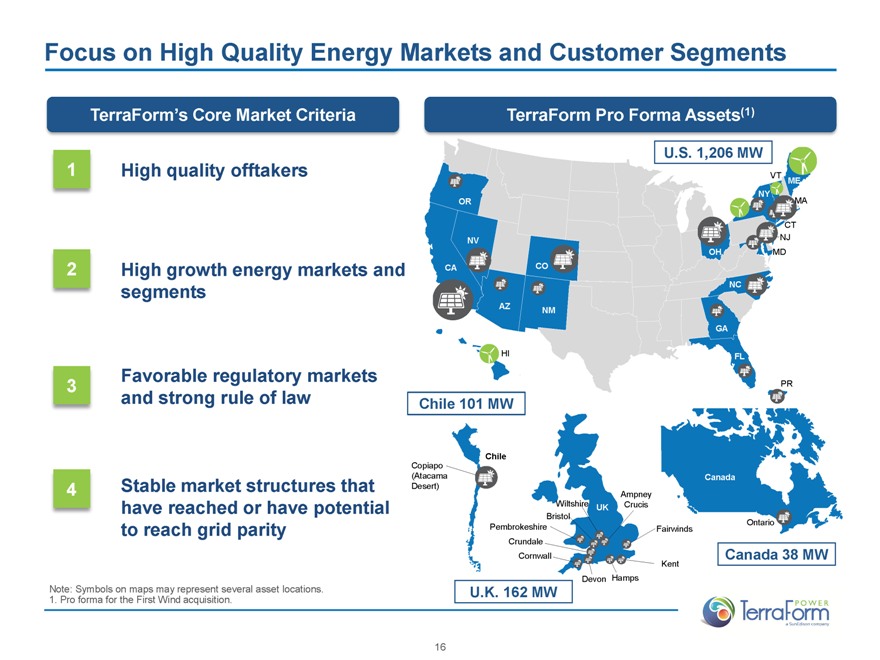
Focus on High Quality Energy Markets and Customer Segments
TerraForm’s Core Market Criteria
1 High quality offtakers
2 High growth energy markets and segments
3 Favorable regulatory markets and strong rule of law
4 Stable market structures that have reached or have potential to reach grid parity
Note: Symbols on maps may represent several asset locations.
1. Pro forma for the First Wind acquisition.
TerraForm Pro Forma Assets(1)
U.S. 1,206 MW
OR NV CA CO AZ NM HI
VT ME NY MA CT NJ MD OH NC GA FL PR
Chile 101 MW
Chile
Copiapo (Atacama Desert)
Wiltshire
UK
Ampney Crucis
Bristol
Pembrokeshire
Crundale
Cornwall
Fairwinds
Kent
Hamps
Canada
Ontario
Canada 38 MW
Devon
U.K. 162 MW
TerraForm POWER
a SunEdison company
16
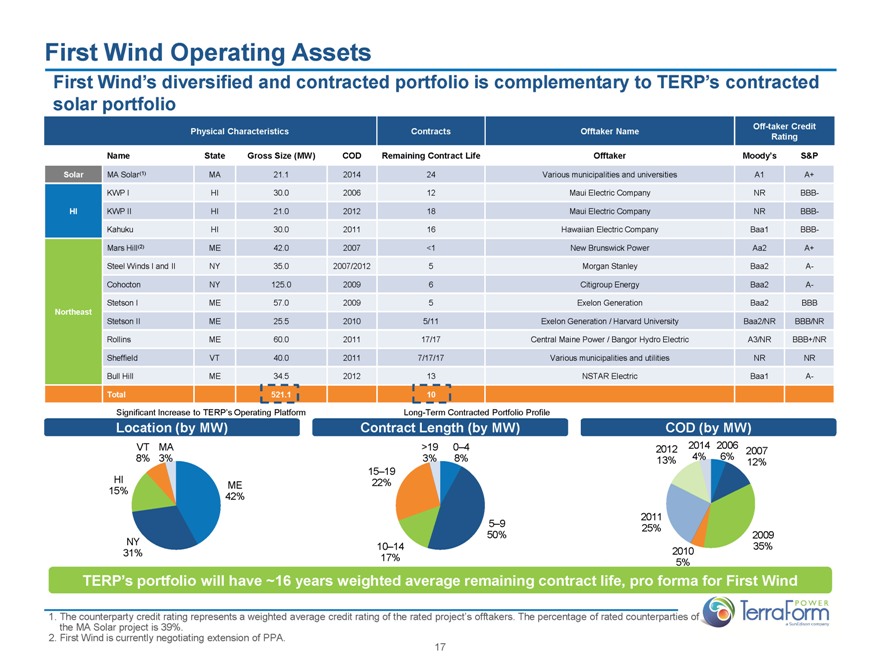
First Wind Operating Assets
First Wind’s diversified and contracted portfolio is complementary to TERP’s contracted solar portfolio
Physical Characteristics Contracts Offtaker Name Off-taker Credit Rating
Name State Gross Size (MW) COD Remaining Contract Life Offtaker Moody’s S&P
Solar MA Solar(1) MA 21.1 2014 24 Various municipalities and universities A1 A+
KWP I HI 30.0 2006 12 Maui Electric Company NR BBB-
HI KWP II HI 21.0 2012 18 Maui Electric Company NR BBB-
Kahuku HI 30.0 2011 16 Hawaiian Electric Company Baa1 BBB-
Mars Hill(2) ME 42.0 2007 <1 New Brunswick Power Aa2 A+
Steel Winds I and II NY 35.0 2007/2012 5 Morgan Stanley Baa2 A-
Cohocton NY 125.0 2009 6 Citigroup Energy Baa2 A-
Stetson I ME 57.0 2009 5 Exelon Generation Baa2 BBB Northeast
Stetson II ME 25.5 2010 5/11 Exelon Generation / Harvard University Baa2/NR BBB/NR
Rollins ME 60.0 2011 17/17 Central Maine Power / Bangor Hydro Electric A3/NR BBB+/NR
Sheffield VT 40.0 2011 7/17/17 Various municipalities and utilities NR NR
Bull Hill ME 34.5 2012 13 NSTAR Electric Baa1 A-
Total 521.1 10
Significant Increase to TERP’s Operating Platform
Location (by MW)
VT 8%
MA 3%
HI 15%
ME 42%
NY 31%
Long-Term Contracted Portfolio Profile
Contract Length (by MW)
>19 3%
0–4 8%
15–19 22%
10–14 17%
5–9 50%
COD (by MW)
2012 13%
2014 4%
2006 6%
2007 12%
2011 25%
2009 35%
2010 5%
TERP’s portfolio will have ~16 years weighted average remaining contract life, pro forma for First Wind
1. The counterparty credit rating represents a weighted average credit rating of the rated project’s offtakers. The percentage of rated counterparties of the MA Solar project is 39%.
2. First Wind is currently negotiating extension of PPA.
TerraForm POWER
a SunEdison company
17
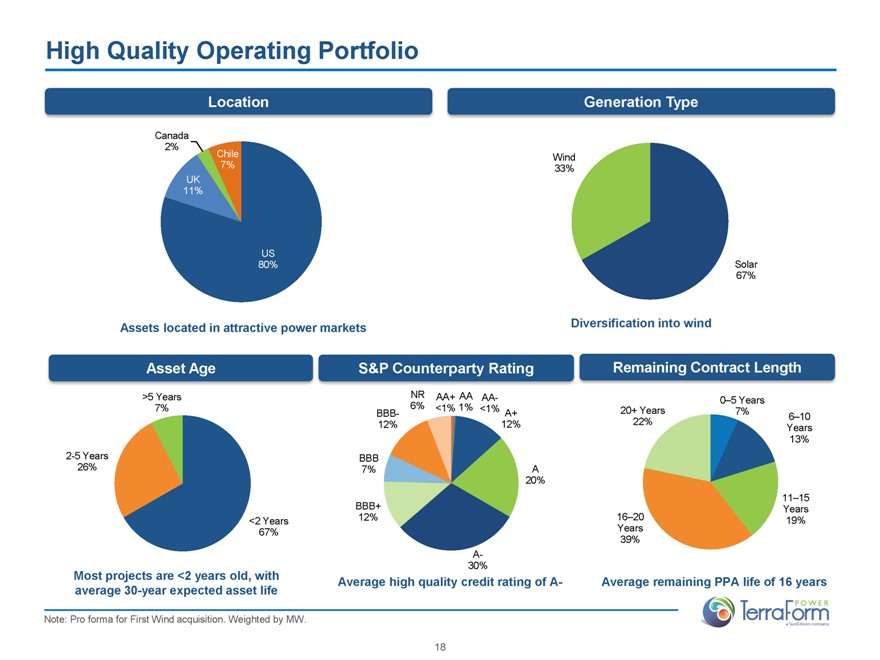
High Quality Operating Portfolio
Location
Canada 2%
Chile 7%
UK 11%
US 80%
Assets located in attractive power markets
Generation Type
Wind 33%
Solar 67%
Diversification into wind
Asset Age
>5 Years 7%
2-5 Years 26%
<2 Years 67%
Most projects are <2 years old, with
average 30-year expected asset life
S&P Counterparty Rating
NR 6%
AA+ <1%
AA 1%
AA- <1%
A+ 12%
A 20%
A- 30%
BBB+ 12%
BBB 7%
BBB- 12%
Average high quality credit rating of A-
Remaining Contract Length
0–5 Years 7%
20+ Years 22%
6–10 Years 13%
11–15 Years 19%
16–20 Years 39%
Average remaining PPA life of 16 years
Note: Pro forma for First Wind acquisition. Weighted by MW.
TerraForm POWER
a SunEdison company
18

USA: KWP I 30 MW
Section 3: Key Growth Drivers
TerraForm POWER
a SunEdison company
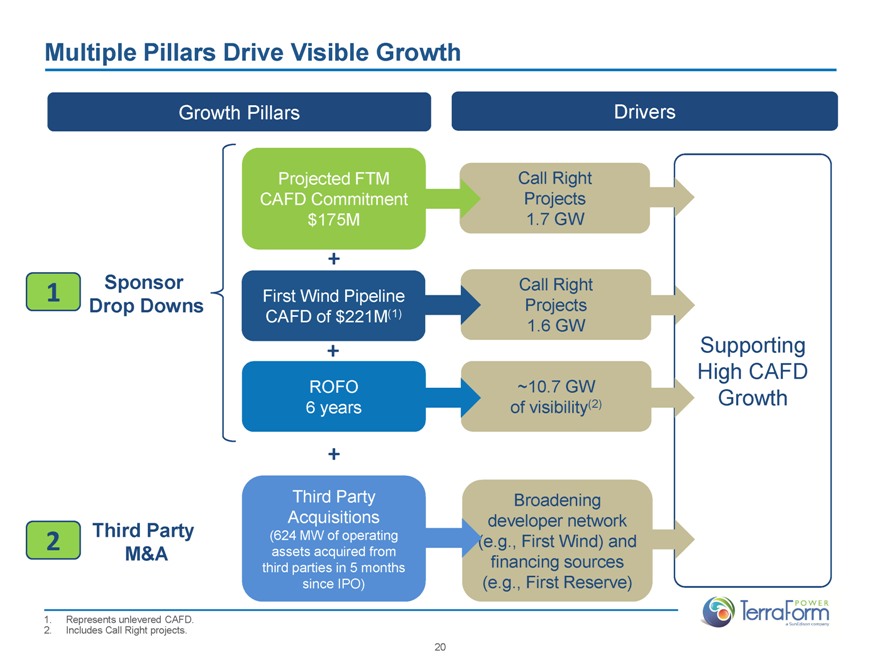
Multiple Pillars Drive Visible Growth
| | | | | | | | |
| | | Growth Pillars | | Drivers | | |
| | | | | Projected FTM CAFD Commitment $175M | | Call Right Projects 1.7 GW | | |
| | | | | + | | | | |
1 | | Sponsor Drop Downs | | First Wind Pipeline CAFD of $221M(1) | | Call Right Projects 1.6 GW | | |
| | | | | + | | | | Supporting High CAFD Growth |
| | | | | ROFO 6 years | | ~10.7 GW of visibility(2) | | |
| | | | | + | | | | |
2 | | Third Party M&A | | Third Party Acquisitions (624 MW of operating assets acquired from third parties in 5 months since IPO) | | Broadening developer network (e.g., First Wind) and financing sources (e.g., First Reserve) | | |
1. Represents unlevered CAFD.
2. Includes Call Right projects.
TerraForm POWER
a SunEdison company
20
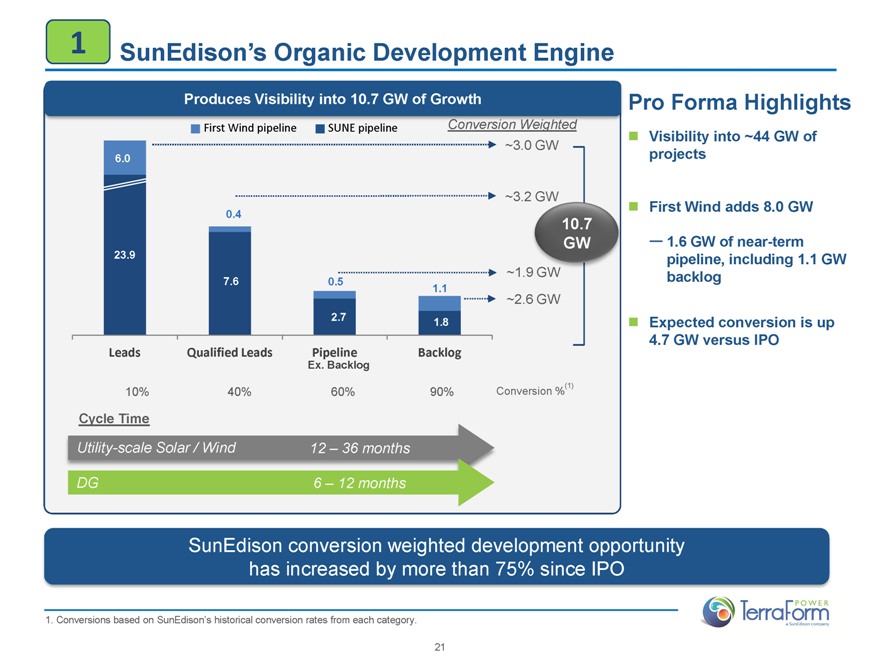
1 SunEdison’s Organic Development Engine
Produces Visibility into 10.7 GW of Growth
First Wind pipeline SUNE pipeline Conversion Weighted
6.0 ~3.0 GW
~3.2 GW
0.4 10.7 GW
23.9 ~1.9 GW
7.6 0.5 1.1 ~2.6 GW
2.7 1.8
Leads 10%
Qualified Leads 40%
Pipeline Ex. Backlog 60%
Backlog 90%
Conversion %(1)
Cycle Time
Utility-scale Solar / Wind
12 – 36 months
DG
6 – 12 months
Pro Forma Highlights
Visibility into ~44 GW of projects
First Wind adds 8.0 GW
1.6 GW of near-term pipeline, including 1.1 GW backlog
Expected conversion is up 4.7 GW versus IPO
SunEdison conversion weighted development opportunity has increased by more than 75% since IPO
1. Conversions based on SunEdison’s historical conversion rates from each category.
TerraForm POWER
a SunEdison company
21
1
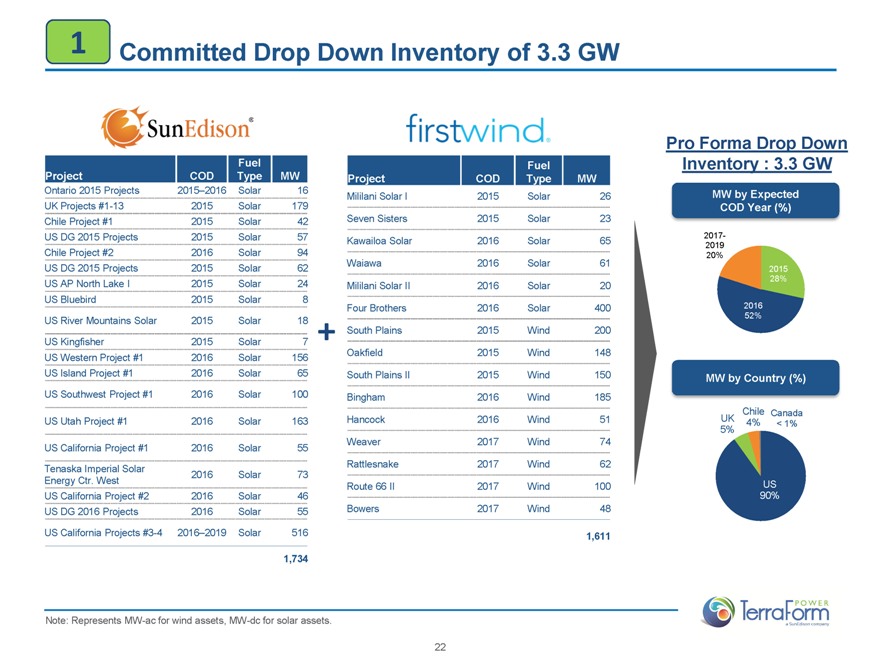
Committed Drop Down Inventory of 3.3 GW
SunEdisonR
Project COD Fuel Type MW
Ontario 2015 Projects 2015–2016 Solar 16
UK Projects #1-13 2015 Solar 179
Chile Project #1 2015 Solar 42
US DG 2015 Projects 2015 Solar 57
Chile Project #2 2016 Solar 94
US DG 2015 Projects 2015 Solar 62
US AP North Lake I 2015 Solar 24
US Bluebird 2015 Solar 8
US River Mountains Solar 2015 Solar 18
US Kingfisher 2015 Solar 7
US Western Project #1 2016 Solar 156
US Island Project #1 2016 Solar 65
US Southwest Project #1 2016 Solar 100
US Utah Project #1 2016 Solar 163
US California Project #1 2016 Solar 55
Tenaska Imperial Solar 2016 Solar 73
Energy Ctr. West
US California Project #2 2016 Solar 46
US DG 2016 Projects 2016 Solar 55
US California Projects #3-4 2016–2019 Solar 516
1,734
+
firstwindR
Project COD Fuel Type MW
Mililani Solar I 2015 Solar 26
Seven Sisters 2015 Solar 23
Kawailoa Solar 2016 Solar 65
Waiawa 2016 Solar 61
Mililani Solar II 2016 Solar 20
Four Brothers 2016 Solar 400
South Plains 2015 Wind 200
Oakfield 2015 Wind 148
South Plains II 2015 Wind 150
Bingham 2016 Wind 185
Hancock 2016 Wind 51
Weaver 2017 Wind 74
Rattlesnake 2017 Wind 62
Route 66 II 2017 Wind 100
Bowers 2017 Wind 48
1,611
Pro Forma Drop Down
Inventory : 3.3 GW
MW by Expected
COD Year (%)
2017-
2019
20%
2015
28%
2016
52%
MW by Country (%)
Chile Canada
UK 4% < 1%
5%
US
90%
Note: Represents MW-ac for wind assets, MW-dc for solar assets.
POWER
TerraForm
a SunEdison company
22
2
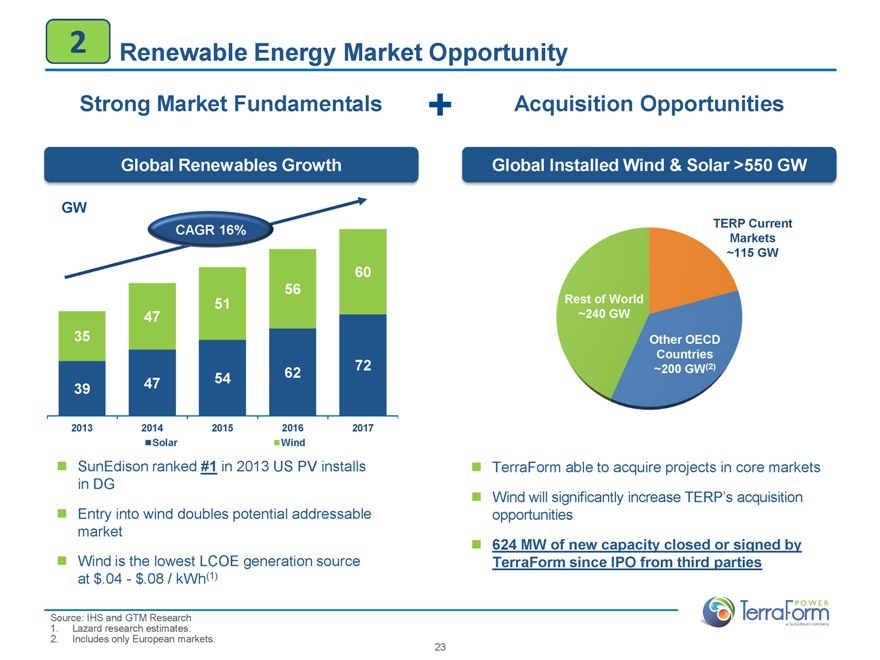
Renewable Energy Market Opportunity
Strong Market Fundamentals
+
Acquisition Opportunities
Global Renewables Growth
GW
CAGR 16%
60
56
51
47
35
72
47 54 62
39
2013 2014 2015 2016 2017
Solar Wind
SunEdison ranked #1 in 2013 US PV installs in DG
Entry into wind doubles potential addressable market
Wind is the lowest LCOE generation source at $.04 - $.08 / kWh(1)
Global Installed Wind & Solar >550 GW
TERP Current
Markets
~115 GW
Rest of World
~240 GW
Other OECD
Countries
~200 GW(2)
TerraForm able to acquire projects in core markets
Wind will significantly increase TERP’s acquisition opportunities
624 MW of new capacity closed or signed by TerraForm since IPO from third parties
Source: IHS and GTM Research
1. Lazard research estimates.
2. Includes only European markets.
POWER
TerraForm
a SunEdison company
23
2
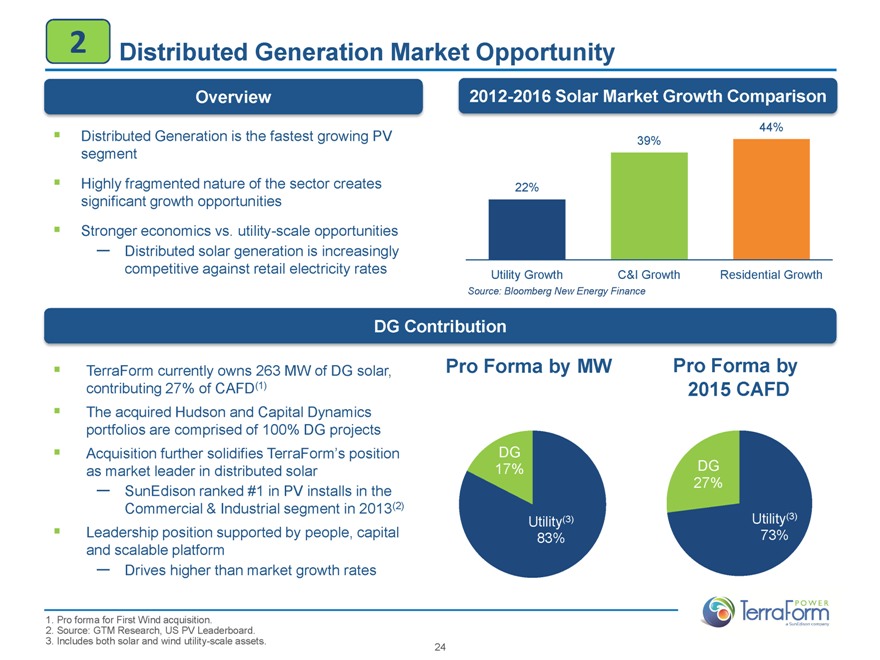
Distributed Generation Market Opportunity
Overview
Distributed Generation is the fastest growing PV segment
Highly fragmented nature of the sector creates significant growth opportunities
Stronger economics vs. utility-scale opportunities
— Distributed solar generation is increasingly competitive against retail electricity rates
2012-2016 Solar Market Growth Comparison
22%
39%
44%
Utility Growth C&I Growth Residential Growth
Source: Bloomberg New Energy Finance
DG Contribution
TerraForm currently owns 263 MW of DG solar, contributing 27% of CAFD(1)
The acquired Hudson and Capital Dynamics portfolios are comprised of 100% DG projects
Acquisition further solidifies TerraForm’s position as market leader in distributed solar
— SunEdison ranked #1 in PV installs in the Commercial & Industrial segment in 2013(2)
Leadership position supported by people, capital and scalable platform
— Drives higher than market growth rates
Pro Forma by MW
DG
17%
Utility(3)
83%
Pro Forma by
2015 CAFD
DG
27%
Utility(3)
73%
1. Pro forma for First Wind acquisition.
2. Source: GTM Research, US PV Leaderboard.
3. Includes both solar and wind utility-scale assets.
POWER
TerraForm
a SunEdison company
24
2
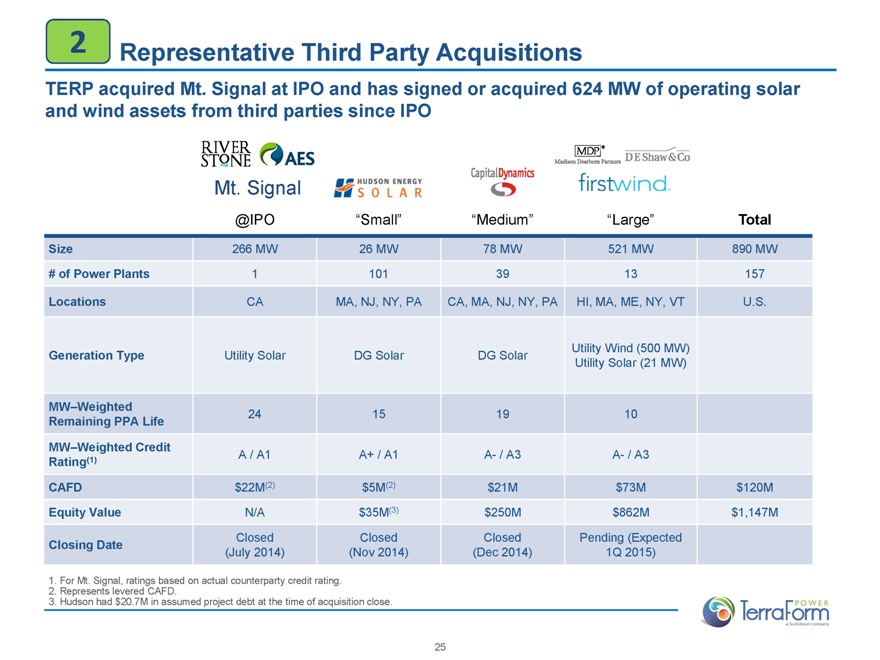
Representative Third Party Acquisitions
TERP acquired Mt. Signal at IPO and has signed or acquired 624 MW of operating solar and wind assets from third parties since IPO
RIVER
STONE AES
Mt. Signal
HUDSON ENERGY
SOLAR
CapitalDynamics
MDPR
Madison Dearborn Partners
FirstwindR
DEShaw&Co
@IPO “Small” “Medium” “Large” Total
Size 266 MW 26 MW 78 MW 521 MW 890 MW
# of Power Plants 1 101 39 13 157
Locations CA MA, NJ, NY, PA CA, MA, NJ, NY, PA HI, MA, ME, NY, VT U.S.
Generation Type Utility Solar DG Solar DG Solar Utility Wind (500 MW)
Utility Solar (21 MW)
MW–Weighted 24 15 19 10
Remaining PPA Life
MW–Weighted Credit
Rating(1) A / A1 A+ / A1 A- / A3 A- / A3
CAFD $22M(2) $5M(2) $21M $73M $120M
Equity Value N/A $35M(3) $250M $862M $1,147M
Closed Closed Closed Pending (Expected
Closing Date (July 2014) (Nov 2014) (Dec 2014) 1Q 2015)
1. For Mt. Signal, ratings based on actual counterparty credit rating.
2. Represents levered CAFD.
3. Hudson had $20.7M in assumed project debt at the time of acquisition close.
25
POWER
TerraForm
a SunEdison company
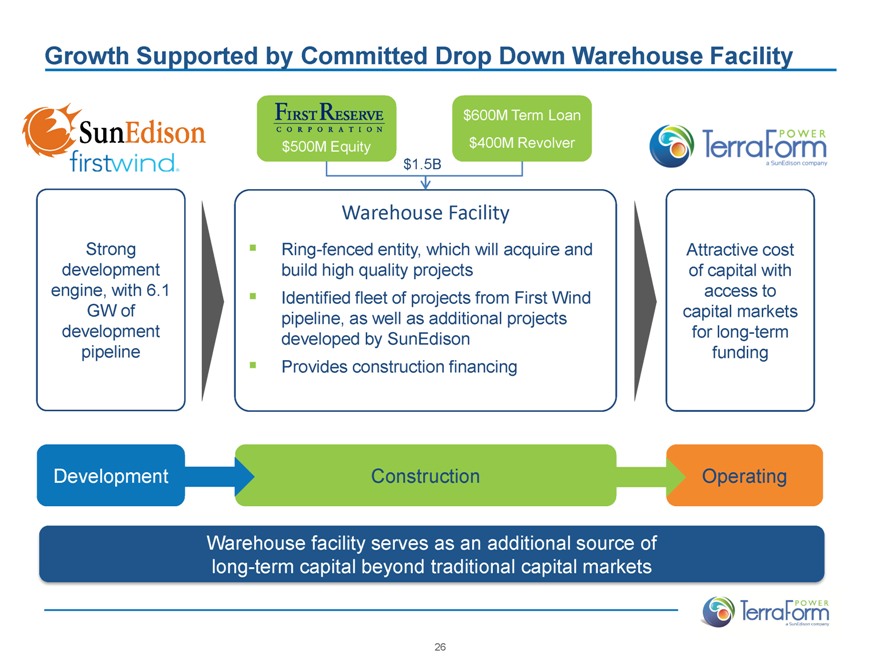
Growth Supported by Committed Drop Down Warehouse Facility
SunEdison
firstwind
Strong development engine, with 6.1 GW of development pipeline
First Reserve
CORPORATION
$500M Equity
$1.5B
$600M Term Loan
$400M Revolver
Warehouse Facility
Ring-fenced entity, which will acquire and build high quality projects
Identified fleet of projects from First Wind pipeline, as well as additional projects developed by SunEdison
Provides construction financing
POWER
TerraForm
a SunEdison company
Attractive cost of capital with access to capital markets for long-term funding
Development
Construction
Operating
Warehouse facility serves as an additional source of long-term capital beyond traditional capital markets
POWER
TerraForm
a SunEdison company
26
USA: DG 2009-2013 Portfolio of 15.2 MW
Section 4: Financials
POWER
TerraForm
a SunEdison company
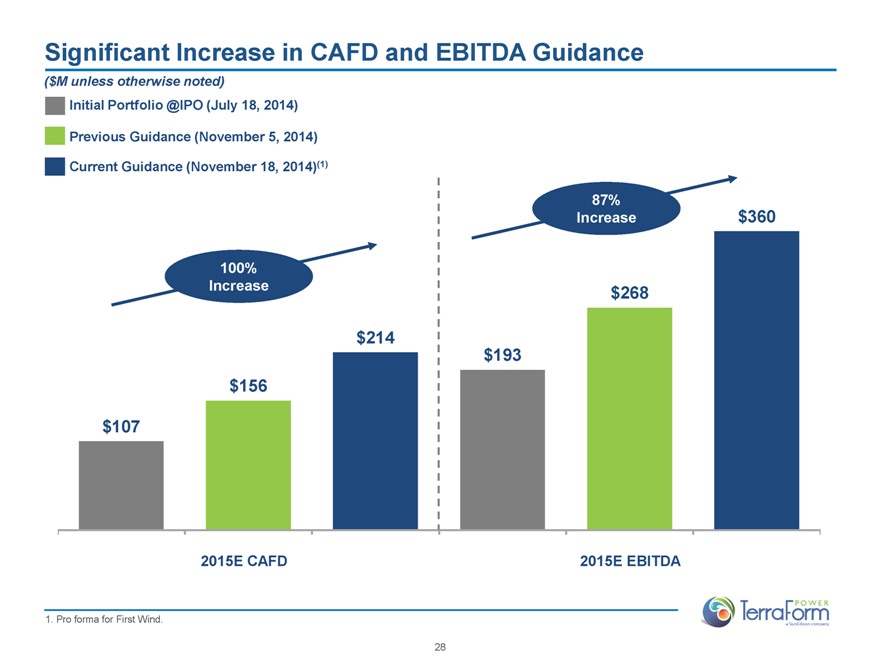
Significant Increase in CAFD and EBITDA Guidance
($M unless otherwise noted)
Initial Portfolio @IPO (July 18, 2014)
Previous Guidance (November 5, 2014)
Current Guidance (November 18, 2014)(1)
100%
Increase
$107
$156
$214
87%
Increase
$193
$268
$360
2015E CAFD
2015E EBITDA
1. Pro forma for First Wind.
POWER
TerraForm
a SunEdison company
28
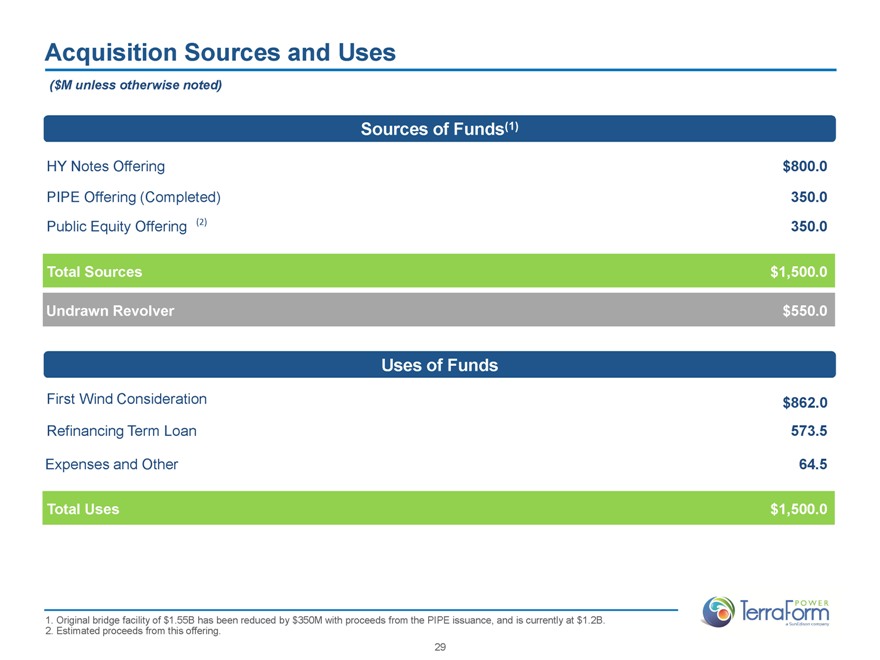
Acquisition Sources and Uses
($M unless otherwise noted)
Sources of Funds(1)
HY Notes Offering
$800.0
PIPE Offering (Completed)
350.0
Public Equity Offering (2)
350.0
Total Sources
$1,500.0
Undrawn Revolver
$550.0
Uses of Funds
First Wind Consideration
$862.0
Refinancing Term Loan
573.5
Expenses and Other
64.5
Total Uses
$1,500.0
1. Original bridge facility of $1.55B has been reduced by $350M with proceeds from the PIPE issuance, and is currently at $1.2B.
2. Estimated proceeds from this offering.
POWER
TerraForm
a SunEdison company
29
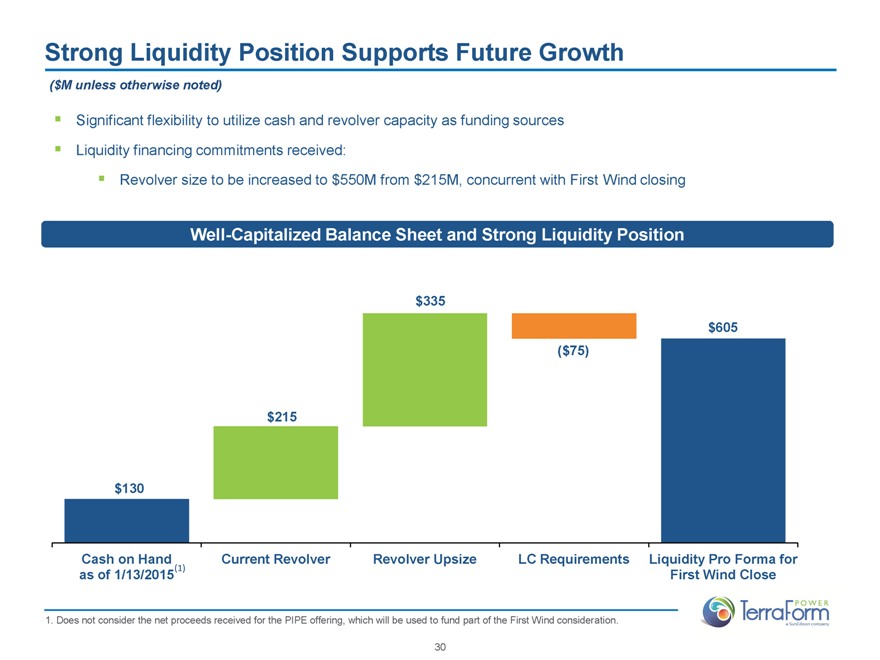
Strong Liquidity Position Supports Future Growth
($M unless otherwise noted)
Significant flexibility to utilize cash and revolver capacity as funding sources Liquidity financing commitments received:
Revolver size to be increased to $550M from $215M, concurrent with First Wind closing
Well-Capitalized Balance Sheet and Strong Liquidity Position
$335
$605
($75)
$215
$130
Cash on Hand
as of 1/13/2015(1)
Current Revolver
Revolver Upsize
LC Requirements
Liquidity Pro Forma for
First Wind Close
1. Does not consider the net proceeds received for the PIPE offering, which will be used to fund part of the First Wind consideration.
POWER
TerraForm
A SunEdison Company
30
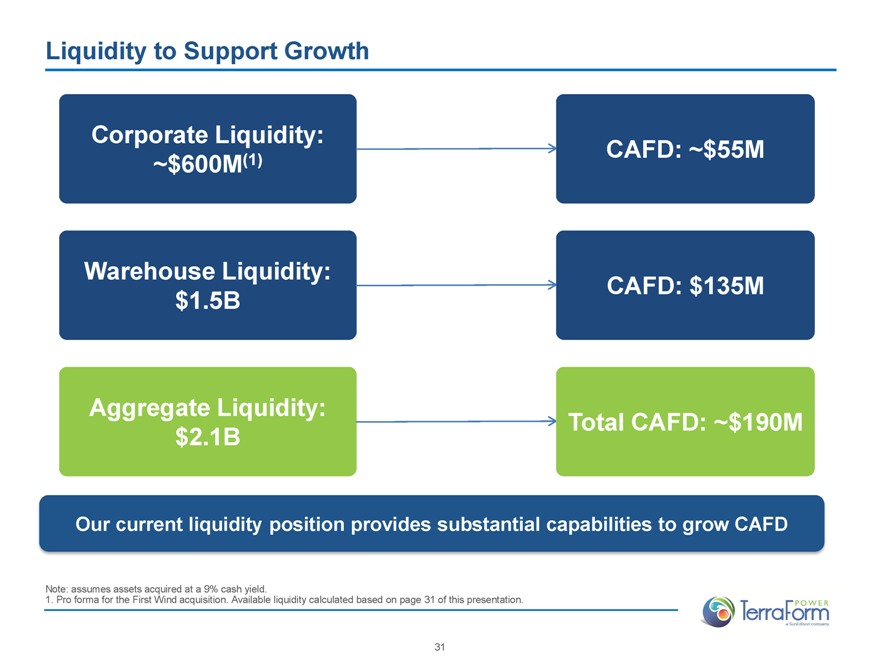
Liquidity to Support Growth
Corporate Liquidity:
~$600M(1) CAFD: ~$55M
Warehouse Liquidity: CAFD: $135M
$1.5B
Aggregate Liquidity: Total CAFD: ~$190M
$2.1B
Our current liquidity position provides substantial capabilities to grow CAFD
Note: assumes assets acquired at a 9% cash yield.
1. Pro forma for the First Wind acquisition. Available liquidity calculated based on page 31 of this presentation.
POWER
TerraForm
A SunEdison Company
31
Section 5: Summary
USA: Stetson Wind I 57 MW
POWER
TerraForm
A SunEdison Company
TerraForm Power Overview
Growth and dividend-oriented renewable energy company with high quality portfolio of ~1,500 MW of contracted power plants(1)
Dividend per share (DPS) growth guidance of 44% from IPO through 2015 Targeting 5-year compounded annual DPS growth rate of 24%(2) 2015 Expected Cash Available For Distribution (CAFD) of $214M(3)
Visibility to growth
10.7 GW of expected power plants from our sponsor
Proprietary M&A pipeline and demonstrated capabilities and track record
1. Pro forma for the First Wind acquisition . Throughout this presentation, the term “MW” represents MW-ac for wind assets and MW-dc for solar assets.
2. Represents target 5-year CAGR from IPO DPS of $0.90.
3. Pro forma for the First Wind acquisition.
POWER
TerraForm
A SunEdison Company
33
Appendix
USA: Nellis Air Force Base 14 MW
POWER
TerraForm
A SunEdison company
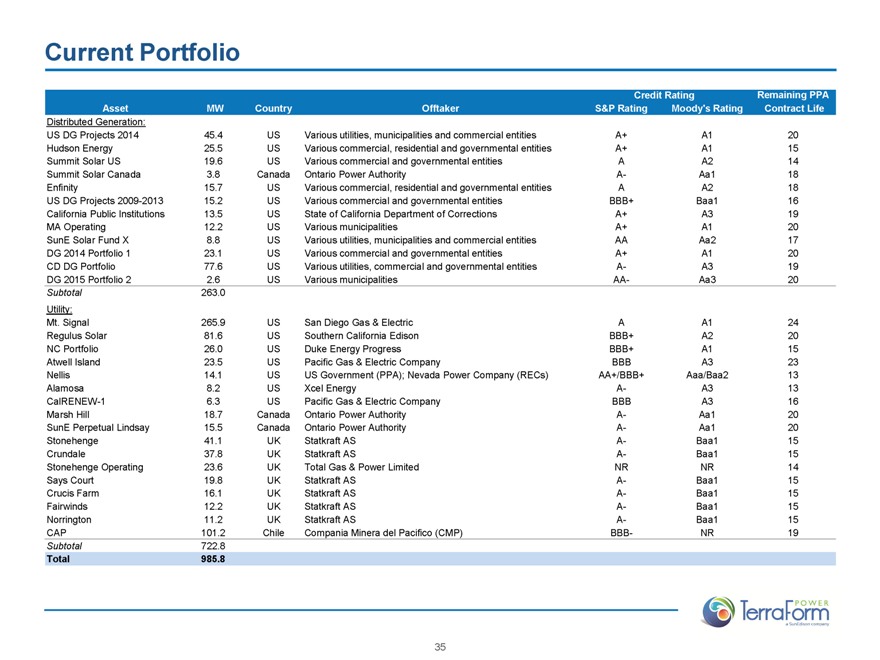
Current Portfolio
Credit Rating Remaining PPA
Asset MW Country Offtaker S&P Rating Moody’s Rating Contract Life
Distributed Generation:
US DG Projects 2014 45.4 US Various utilities, municipalities and commercial entities A+ A1 20
Hudson Energy 25.5 US Various commercial, residential and governmental entities A+ A1 15
Summit Solar US 19.6 US Various commercial and governmental entities A A2 14
Summit Solar Canada 3.8 Canada Ontario Power Authority A- Aa1 18
Enfinity 15.7 US Various commercial, residential and governmental entities A A2 18
US DG Projects 2009-2013 15.2 US Various commercial and governmental entities BBB+ Baa1 16
California Public Institutions 13.5 US State of California Department of Corrections A+ A3 19
MA Operating 12.2 US Various municipalities A+ A1 20
SunE Solar Fund X 8.8 US Various utilities, municipalities and commercial entities AA Aa2 17
DG 2014 Portfolio 1 23.1 US Various commercial and governmental entities A+ A1 20
CD DG Portfolio 77.6 US Various utilities, commercial and governmental entities A- A3 19
DG 2015 Portfolio 2 2.6 US Various municipalities AA- Aa3 20
Subtotal 263.0
Utility:
Mt. Signal 265.9 US San Diego Gas & Electric A A1 24
Regulus Solar 81.6 US Southern California Edison BBB+ A2 20
NC Portfolio 26.0 US Duke Energy Progress BBB+ A1 15
Atwell Island 23.5 US Pacific Gas & Electric Company BBB A3 23
Nellis 14.1 US US Government (PPA); Nevada Power Company (RECs) AA+/BBB+ Aaa/Baa2 13
Alamosa 8.2 US Xcel Energy A- A3 13
CalRENEW-1 6.3 US Pacific Gas & Electric Company BBB A3 16
Marsh Hill 18.7 Canada Ontario Power Authority A- Aa1 20
SunE Perpetual Lindsay 15.5 Canada Ontario Power Authority A- Aa1 20
Stonehenge 41.1 UK Statkraft AS A- Baa1 15
Crundale 37.8 UK Statkraft AS A- Baa1 15
Stonehenge Operating 23.6 UK Total Gas & Power Limited NR NR 14
Says Court 19.8 UK Statkraft AS A- Baa1 15
Crucis Farm 16.1 UK Statkraft AS A- Baa1 15
Fairwinds 12.2 UK Statkraft AS A- Baa1 15
Norrington 11.2 UK Statkraft AS A- Baa1 15
CAP 101.2 Chile Compania Minera del Pacifico (CMP) BBB- NR 19
Subtotal 722.8
Total 985.8
35
POWER
TerraForm
A SunEdison company
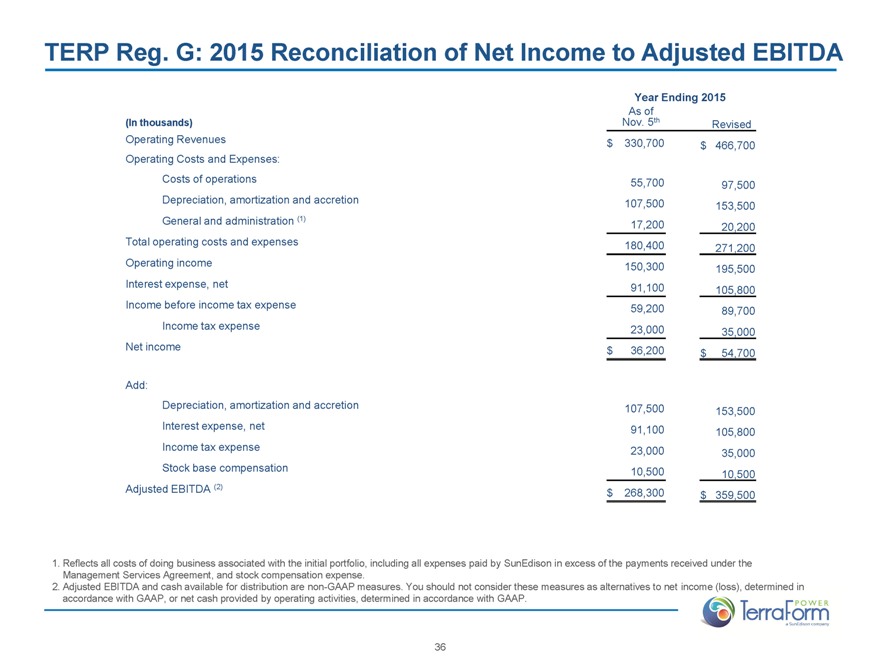
TERP Reg. G: 2015 Reconciliation of Net Income to Adjusted EBITDA
Year Ending 2015
As of
(In thousands)
Nov. 5th Revised
Operating Revenues
$ 330,700 $ 466,700
Operating Costs and Expenses:
Costs of operations
55,700 97,500
Depreciation, amortization and accretion
107,500 153,500
General and administration (1)
17,200 20,200
Total operating costs and expenses
180,400 271,200
Operating income
150,300 195,500
Interest expense, net
91,100 105,800
Income before income tax expense
59,200 89,700
Income tax expense
23,000 35,000
Net income
$ 36,200 $ 54,700
Add:
Depreciation, amortization and accretion
107,500 153,500
Interest expense, net
91,100 105,800
Income tax expense
23,000 35,000
Stock base compensation
10,500 10,500
Adjusted EBITDA (2)
$ 268,300 $ 359,500
1. Reflects all costs of doing business associated with the initial portfolio, including all expenses paid by SunEdison in excess of the payments received under the Management Services Agreement, and stock compensation expense.
2. Adjusted EBITDA and cash available for distribution are non-GAAP measures. You should not consider these measures as alternatives to net income (loss), determined in accordance with GAAP, or net cash provided by operating activities, determined in accordance with GAAP.
36
POWER
TerraForm
A SunEdison company
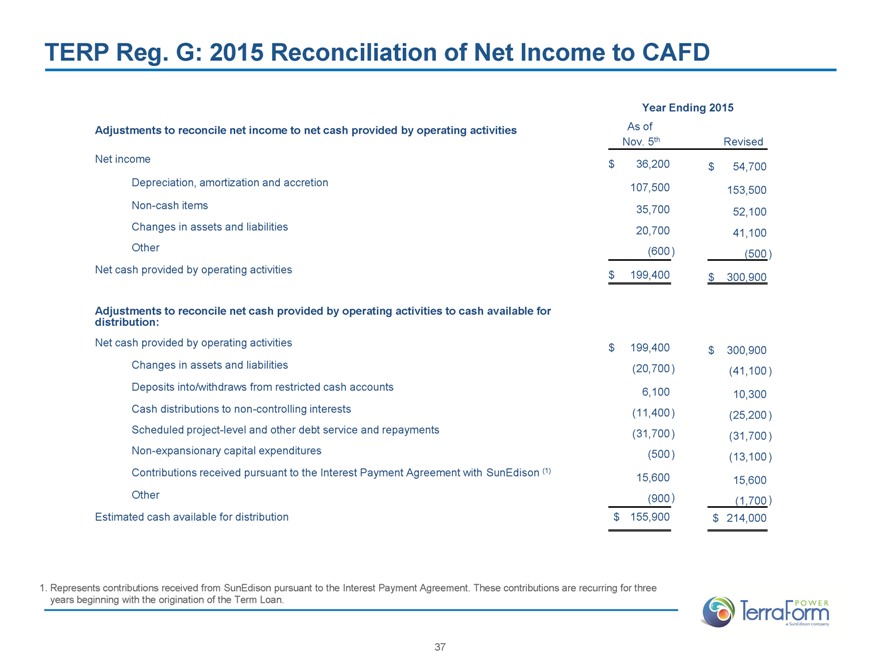
TERP Reg. G: 2015 Reconciliation of Net Income to CAFD
Year Ending 2015
Adjustments to reconcile net income to net cash provided by operating activities As of
Nov. 5th Revised
Net income $36,200 $54,700
Depreciation, amortization and accretion 107,500 153,500
Non-cash items 35,700 52,100
Changes in assets and liabilities 20,700 41,100
Other (600) (500)
Net cash provided by operating activities $199,400 $300,900
Adjustments to reconcile net cash provided by operating activities to cash available for distribution:
Net cash provided by operating activities $199,400 $300,900
Changes in assets and liabilities (20,700) (41,100)
Deposits into/withdraws from restricted cash accounts 6,100 10,300
Cash distributions to non-controlling interests (11,400) (25,200)
Scheduled project-level and other debt service and repayments (31,700) (31,700)
Non-expansionary capital expenditures (500) (13,100)
Contributions received pursuant to the Interest Payment Agreement with SunEdison (1) 15,600 15,600
Other (900) (1,700)
Estimated cash available for distribution $155,900 $214,000
1. Represents contributions received from SunEdison pursuant to the Interest Payment Agreement. These contributions are recurring for three years beginning with the origination of the Term Loan.
37
POWER
TerraForm
A SunEdison company