UNITED STATES
SECURITIES AND EXCHANGE COMMISSION
Washington, D.C. 20549
FORM N-CSR
CERTIFIED SHAREHOLDER REPORT OF REGISTERED
MANAGEMENT INVESTMENT COMPANIES
Investment Company Act file number | 811-22938 | |||||||
| ||||||||
Cohen & Steers Active Commodities Strategy Fund, Inc. | ||||||||
(Exact name of registrant as specified in charter) | ||||||||
| ||||||||
280 Park Avenue, New York, NY |
| 10017 | ||||||
(Address of principal executive offices) |
| (Zip code) | ||||||
| ||||||||
Tina M. Payne | ||||||||
(Name and address of agent for service) | ||||||||
| ||||||||
Registrant’s telephone number, including area code: | (212) 832-3232 |
| ||||||
| ||||||||
Date of fiscal year end: | April 30 |
| ||||||
| ||||||||
Date of reporting period: | April 30, 2015 |
| ||||||
Item 1. Reports to Stockholders.
COHEN & STEERS ACTIVE COMMODITIES STRATEGY FUND, INC.
To Our Shareholders:
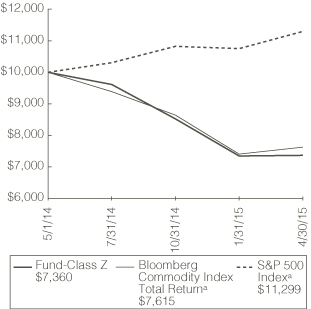
We would like to share with you our report for the period ended April 30, 2015. The net asset values (NAV) per share at that date were $7.34, $7.30, $7.36, $7.34 and $7.36 for Class A, Class C, Class I, Class R and Class Z shares, respectively.
The total returns, including income and change in NAV, for the Fund and its comparative benchmarks were:
| Six Months Ended April 30, 2015 | For the Period May 1, 2014 (commencement of operations) through April 30, 2015 | ||||||||||
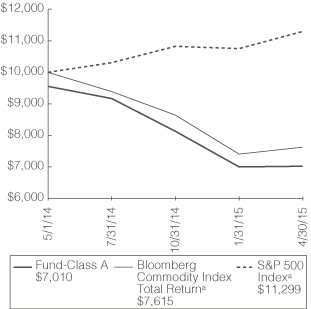
| Cohen & Steers Active Commodities Strategy Fund—Class A | –13.75 | % | –26.60 | % | |||||||
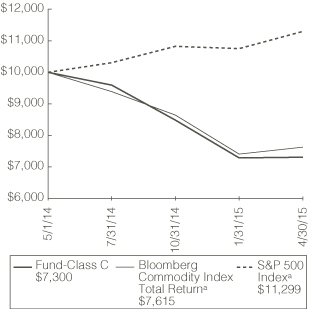
| Cohen & Steers Active Commodities Strategy Fund—Class C | –13.92 | % | –27.00 | % | |||||||
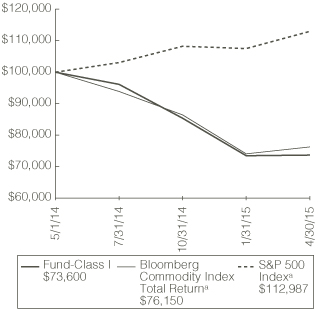
| Cohen & Steers Active Commodities Strategy Fund—Class I | –13.72 | % | –26.40 | % | |||||||
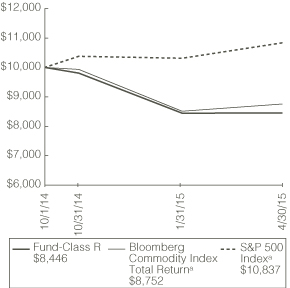
| Cohen & Steers Active Commodities Strategy Fund—Class R | –13.85 | % | — | a | |||||||
| Cohen & Steers Active Commodities Strategy Fund—Class Z | –13.62 | % | –26.40 | % | |||||||
Bloomberg Commodity Index Total Returnb | –11.87 | % | –23.85 | % | |||||||
S&P 500 Indexb | 4.40 | % | 12.99 | % | |||||||
The performance data quoted represent past performance. Past performance is no guarantee of future results. The investment return and the principal value of an investment will fluctuate and shares, if redeemed, may be worth more or less than their original cost. Current performance may be lower or higher than the performance data quoted. Current total returns of the Fund can be obtained by visiting our website at cohenandsteers.com. All share class returns assume the reinvestment of all dividends and distributions at NAV. Fund performance figures reflect fee waivers and/or expense reimbursements, without which the performance would have been lower. Performance quoted does not reflect the deduction of the maximum 4.50% initial sales charge on Class A shares or the 1.00% maximum contingent deferred sales charge on Class C shares. The 1.00% maximum contingent deferred sales
a Inception date of Class R was October 1, 2014. Total return for this class was –15.54% for the period October 1, 2014 through April 30, 2015. Total return for the Bloomberg Commodity Index Total Return was –12.48% for the same period.
b Formerly known as Dow Jones UBS Commodity Index Total Return, the Bloomberg Commodity Index Total Return is a broadly diversified index that tracks the commodity markets through commodity futures contracts. The index is made up of exchange traded futures on physical commodities which are weighted to account for economic significance and market liquidity. The S&P 500 Index is an unmanaged index of 500 large-cap stocks that is frequently used as a general measure of stock market performance.
1
COHEN & STEERS ACTIVE COMMODITIES STRATEGY FUND, INC.
charge on Class C shares applies if redemption occurs less than one year from purchase. If such charges were included, returns would have been lower. Index performance does not reflect the deduction of any fees, taxes or expenses. An investor cannot invest directly in an index. Performance figures for periods shorter than one year are not annualized.
Please note that distributions paid by the Fund to shareholders are subject to recharacterization for tax purposes and are taxable up to the amount of the Fund's investment company taxable income and net realized gains. Distributions in excess of the Fund's investment company taxable income and net realized gains are a return of capital distributed from the Fund's assets.
Investment Review
Most financial markets advanced during the period, with equity and fixed income indexes posting gains. The trajectory of global growth was generally viewed as positive and relatively strong U.S. macro data led to the tapering, and eventual conclusion, of the Federal Reserve's (the Fed's) bond-purchasing program, helping to drive the U.S. dollar to 12-year highs. Towards the end of the period, however, the pace of U.S. growth began to cool and Chinese data was mixed.
Low inflation, a stronger dollar and sector-specific factors drove commodity prices lower. In the energy group, cuts in demand estimates and robust supply weighed on performance. North Sea Brent (–43.0% total returnc) fell as geopolitical unrest failed to show any meaningful supply disruption and most Organization of the Petroleum Exporting Countries showed a reluctance to cut production. In the U.S., prices for West Texas Intermediate (–42.2%) crude oil were lower as production rose to its highest level in 28 years.
Natural gas prices (–48.8%) corrected after surging in April 2014 amid harsh winter weather and a natural gas rig count that reached a 21-year low. Prices then fell sharply, largely due to cool summer weather and generally stronger-than-expected storage injections.
The precious metals sector (–11.0%) declined. High-quality metals such as gold (–9.1%) started the period on a positive note, as geopolitical risks broadly supported prices for assets perceived as safe havens. Those early gains soon faded, however, particularly for silver (–16.9%), amid U.S. dollar strength and the Fed's well-telegraphed end of its bond-purchasing program. Palladium (–4.2%d) also advanced at the outset, breaking through the psychologically important $900/oz. level, but then retreated amid weaker-than-expected economic and automobile data from China. The Russian Central Bank's recent agreement to sell palladium to Norilsk Nickel also resulted in some profit taking among investors.
The base metal complex (–3.3%) fell. Zinc (+12.6%) was a standout as market participants expected a large supply shortfall in 2015, in part due to various mine closures. Aluminum (+2.8%) also had positive returns as fundamentals improved on supply cuts and strong demand. Copper (–4.9%) declined as weakening demand concerns underlying much of the drop in crude oil prices caught up to the red metal.
Grains (–30.9%) had sharp declines. Domestic and world production estimates for grains were broadly revised higher, putting downward pressure on prices. In the U.S., crop conditions and weather
c Sector returns are in U.S. dollars and are for the period May 1, 2014 through April 30, 2015. Sector classifications of securities in the index are determined by investment advisor.
d Some sector returns are based on the performance of the commodity futures held as part of a representative account, as those sectors are not part of the Bloomberg Commodity Index Total Return.
2
COHEN & STEERS ACTIVE COMMODITIES STRATEGY FUND, INC.
were extremely favorable during the growing season which translated into record yields for both corn and soybeans; meanwhile, Brazil and Argentina began planting what could very well be record crops for both commodities.
In the softs sector (–33.4%), cotton prices fell 19.4%, as beneficial rains and an abatement of drought conditions in Texas and the Southwest increased the likelihood of a rebound in U.S. output. Weak cotton prices were also an offshoot of a stronger U.S. dollar and a bearish change in Chinese stockpiling program policy. Sugar (–38.0%) fell as the market remained in surplus, the Brazilian Real weakened and prospects for Chinese and Indian demand softened.
The livestock sector (–10.6%) fell. However, feeder cattle and live cattle (+11.4%) prices advanced on a continued tight supply outlook and strength in wholesale prices of beef. Lean hogs (–38.3%) declined as the West Coast dockworker strike caused major shipping backlogs; pork exports fell to the lowest level since 2010, which put downward pressure on prices. The dollar also remains a significant headwind to U.S. competitiveness in the sector.
Fund Performance
The Fund had a negative total return for the period and underperformed its benchmark. Our overweight allocation in the energy group was the primary detractor from relative performance, though this was partially offset by favorable natural gas contract selection. Other detractors from performance included our underweight in copper and our net short position in feeder cattle.
The most significant contributor to relative returns was our positioning in precious metals, where our out-of-index allocation in palladium and our overweight in silver benefited relative returns. Other contributors to performance included our net short position in cotton, our overweight in zinc and our out-of-index allocation in platinum.
Investment Outlook
Our view on oil has turned more constructive since we've seen a nearly 50% reduction in the oil rig count since it reached its peak in October 2014. At current levels, we expect U.S. inventories to drift lower and seasonal U.S. refinery demand to increase the demand for West Texas Intermediate crude oil relative to Brent, which we believe will lead to continued spread narrowing. In natural gas, our outlook is also more constructive.
Within precious metals, we prefer the platinum group metals and silver over gold. In base metals, we continue to favor those commodities with attractive balance sheets that we expect will tighten further in 2015, such as nickel and zinc. In agriculture, we remain tactical, yet net underweight in softs and grains. We remain bearish in the livestock sector on increased production, herd expansion, lower overseas demand and higher domestic supplies.
3
COHEN & STEERS ACTIVE COMMODITIES STRATEGY FUND, INC.
Sincerely,

ROBERT H. STEERS
Chairman
|
| ||||||||||
NICK KOUTSOFTAS | BEN ROSS | ||||||||||
Portfolio Manager | Portfolio Manager | ||||||||||


The views and opinions in the preceding commentary are subject to change without notice and are as of the date of publication. There is no guarantee that any market forecast set forth in the commentary will be realized. This material represents an assessment of the market environment at a specific point in time, should not be relied upon as investment advice and is not intended to predict or depict performance of any investment.
Visit Cohen & Steers online at cohenandsteers.com
For more information about the Cohen & Steers family of mutual funds, visit cohenandsteers.com. Here you will find fund net asset values, fund fact sheets and portfolio highlights, as well as educational resources and timely market updates.
Our website also provides comprehensive information about Cohen & Steers, including our most recent press releases, profiles of our senior investment professionals and their investment approach to each asset class. The Cohen & Steers family of mutual funds invests in major real asset categories including real estate, infrastructure, commodities and natural resource equities, as well as preferred securities and other income solutions.
4
COHEN & STEERS ACTIVE COMMODITIES STRATEGY FUND, INC.
Performance Review (Unaudited)
Class A—Growth of a $10,000 Investment
Class C—Growth of a $10,000 Investment
Class I—Growth of a $100,000 Investment
Class R—Growth of a $10,000 Investment
5
COHEN & STEERS ACTIVE COMMODITIES STRATEGY FUND, INC.
Performance Review (Unaudited)—(Continued)
Class Z—Growth of a $10,000 Investment
Average Annual Total Returns—For Periods Ended April 30, 2015
| Class A Shares | Class C Shares | Class I Shares | Class R Shares | Class Z Shares | |||||||||||||||||||
Since Inceptiond (with sales charge) | –29.90 | %b | –27.73 | %c | — | — | — | ||||||||||||||||
Since Inceptiond (without sales charge) | –26.60 | % | –27.00 | % | –26.40 | % | –15.54 | % | –26.40 | % | |||||||||||||
The performance data quoted represent past performance. Past performance is no guarantee of future results. The investment return and principal value of an investment will fluctuate and shares, if redeemed, may be worth more or less than their original cost. Current performance may be lower or higher than the performance data quoted. Performance information current to the most recent month end can be obtained by visiting our website at cohenandsteers.com. All share class returns assume the reinvestment of all dividends and distributions at NAV. The performance graphs and table do not reflect the deduction of taxes that a shareholder would pay on Fund distributions or the redemption of Fund shares. During the periods presented above, the investment advisor waived fees and/or reimbursed expenses. Without this arrangement, performance would have been lower.
The annualized gross and net expense ratios, respectively, for each class of shares as disclosed in the May 1, 2014 prospectuses for Class A, Class C and Class I shares; and in the September 30, 2014 prospectus for Class R and Class Z shares were as follows: Class A—2.70% and 1.45%; Class C—3.35% and 2.10%; Class I—2.45% and 1.10%; Class R—2.85% and 1.60%; and Class Z—2.35% and 1.10%. Through June 30, 2016, the investment advisor has contractually agreed to waive its fee and/or reimburse expenses so that the Fund's total annual operating expenses (excluding acquired fund fees and expenses
6
COHEN & STEERS ACTIVE COMMODITIES STRATEGY FUND, INC.
Performance Review (Unaudited)—(Continued)
and extraordinary expenses) do not exceed 1.45% for Class A shares, 2.10% for Class C shares, 1.10% for Class I shares, 1.60% for Class R shares and 1.10% for Class Z shares. This contractual agreement can be amended at any time by agreement of the Fund and the investment advisor and will terminate automatically in the event of termination of the investment advisory agreement between the investment advisor and the Fund.
a The comparative indexes are not adjusted to reflect expenses or other fees that the SEC requires to be reflected in the Fund's performance. Index performance does not reflect the deduction of any fees, taxes or expenses. An investor cannot invest directly in an index. The Fund's performance assumes the reinvestment of all dividends and distributions at NAV. For more information, including charges and expenses, please read the prospectus carefully before you invest.
b Reflects a 4.50% front-end sales charge.
c Reflects a contingent deferred sales charge of 1.00%.
d Inception date of May 1, 2014 for Class A, C, I and Z shares and October 1, 2014 for Class R shares.
7
COHEN & STEERS ACTIVE COMMODITIES STRATEGY FUND, INC.
Expense Example (Unaudited)
As a shareholder of the Fund, you incur two types of costs: (1) transaction costs, including sales charges (loads) on purchase payments; and (2) ongoing costs including investment advisory fees; distribution and/or service (12b-1) fees; and other Fund expenses. This example is intended to help you understand your ongoing costs (in dollars) of investing in the Fund and to compare these costs with the ongoing costs of investing in other mutual funds.
The example is based on an investment of $1,000 invested at the beginning of the period and held for the entire period November 1, 2014—April 30, 2015.
Actual Expenses
The first line of the following table provides information about actual account values and expenses. You may use the information in this line, together with the amount you invested, to estimate the expenses that you paid over the period. Simply divide your account value by $1,000 (for example, an $8,600 account value divided by $1,000 = 8.6), then multiply the result by the number in the first line under the heading entitled "Expenses Paid During Period" to estimate the expenses you paid on your account during this period.
Hypothetical Example for Comparison Purposes
The second line of the following table provides information about hypothetical account values and hypothetical expenses based on the Fund's actual expense ratio and an assumed rate of return of 5% per year before expenses, which is not the Fund's actual return. The hypothetical account values and expenses may not be used to estimate the actual ending account balance or expenses you paid for the period. You may use this information to compare the ongoing cost of investing in the Fund and other funds. To do so, compare this 5% hypothetical example with the 5% hypothetical examples that appear in the shareholder reports of other funds.
Please note that the expenses shown in the table are meant to highlight your ongoing costs only and do not reflect any transaction costs, such as sales charges (loads). Therefore, the second line of the table is useful in comparing ongoing costs only, and will not help you determine the relative total costs of owning different funds. In addition, if these transactional costs were included, your costs would have been higher.
8
COHEN & STEERS ACTIVE COMMODITIES STRATEGY FUND, INC.
Expense Example (Unaudited)—(Continued)
| Beginning Account Value November 1, 2014 | Ending Account Value April 30, 2015 | Expenses Paid During Perioda November 1, 2014– April 30, 2015 | |||||||||||||
Class A | |||||||||||||||
Actual (–13.75% return) | $ | 1,000.00 | $ | 862.50 | $ | 6.56 | |||||||||
| Hypothetical (5% annual return before expenses) | $ | 1,000.00 | $ | 1,017.75 | $ | 7.10 | |||||||||
Class C | |||||||||||||||
Actual (–13.92% return) | $ | 1,000.00 | $ | 860.80 | $ | 9.04 | |||||||||
| Hypothetical (5% annual return before expenses) | $ | 1,000.00 | $ | 1,015.08 | $ | 9.79 | |||||||||
Class I | |||||||||||||||
Actual (–13.72% return) | $ | 1,000.00 | $ | 862.80 | $ | 5.08 | |||||||||
| Hypothetical (5% annual return before expenses) | $ | 1,000.00 | $ | 1,019.34 | $ | 5.51 | |||||||||
Class R | |||||||||||||||
Actual (–13.85% return) | $ | 1,000.00 | $ | 861.50 | $ | 7.38 | |||||||||
| Hypothetical (5% annual return before expenses) | $ | 1,000.00 | $ | 1,016.86 | $ | 8.00 | |||||||||
Class Z | |||||||||||||||
Actual (–13.62% return) | $ | 1,000.00 | $ | 863.80 | $ | 5.08 | |||||||||
| Hypothetical (5% annual return before expenses) | $ | 1,000.00 | $ | 1,019.34 | $ | 5.51 | |||||||||
a Expenses are equal to the Fund's Class A, Class C, Class I, Class R and Class Z annualized expense ratios of 1.42%, 1.96%, 1.10%, 1.60% and 1.10%, respectively, multiplied by the average account value over the period, multiplied by 181/365 (to reflect the one-half year period).
9
COHEN & STEERS ACTIVE COMMODITIES STRATEGY FUND, INC.
April 30, 2015
Fund Sector Summary
(Unaudited)
| % of Net Assets | |||||||
U.S. Treasury Bills | 72.8 | ||||||
Money Market Funds | 12.2 | ||||||
Other Assets in Excess of Liabilitiesa | 15.0 | ||||||
100.0 | |||||||
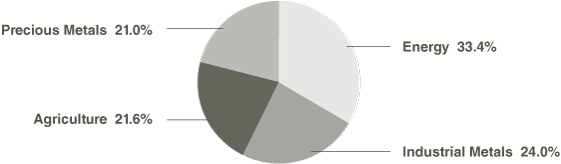
Commodity Allocation Summaryb
(Unaudited)
a Other assets in excess of liabilities include unrealized appreciation/depreciation on open futures contracts at April 30, 2015.
b The commodity allocation summary is expressed as an approximate percentage of the net notional value of the Fund's commodity futures contracts.
10
COHEN & STEERS ACTIVE COMMODITIES STRATEGY FUND, INC.
CONSOLIDATED SCHEDULE OF INVESTMENTS
April 30, 2015
| Number of Shares | Value | ||||||||||||||
SHORT-TERM INVESTMENTS | 85.0% | ||||||||||||||
MONEY MARKET FUNDS | 12.2% | ||||||||||||||
| State Street Institutional Treasury Money Market Fund, 0.00%a,b | 1,000,000 | $ | 1,000,000 | ||||||||||||
| Principal Amount | |||||||||||||||
U.S. TREASURY BILLS | 72.8% | ||||||||||||||
U.S. Treasury Bill, 0.02%, due 7/23/15a,c,d | $ | 6,000,000 | 5,999,898 | ||||||||||||
TOTAL INVESTMENTS (Identified cost—$6,999,723) | 85.0 | % | 6,999,898 | ||||||||||||
OTHER ASSETS IN EXCESS OF LIABILITIESe | 15.0 | 1,237,480 | |||||||||||||
NET ASSETS | 100.0 | % | $ | 8,237,378 | |||||||||||
Note: Percentages indicated are based on the net assets of the Fund.
a All or a portion of this security is held by Cohen & Steers Active Commodities Strategy Ltd., a wholly-owned subsidiary.
b Rate quoted represents the annualized seven-day yield of the Fund.
c The rate shown is the effective yield on the date of purchase.
d All or a portion of this security has been pledged as collateral for futures contracts. $594,200 in aggregate has been pledged as collateral to Morgan Stanley & Co. LLC.
e Other assets in excess of liabilities include unrealized appreciation/depreciation on open futures contracts at April 30, 2015.
See accompanying notes to the consolidated financial statements.
11
COHEN & STEERS ACTIVE COMMODITIES STRATEGY FUND, INC.
CONSOLIDATED SCHEDULE OF INVESTMENTS—(Continued)
April 30, 2015
Futures contracts outstanding at April 30, 2015 were as follows:
| Number of Contractsa | Description | Notional Value | Expiration Date | Unrealized Appreciation (Depreciation) | |||||||||||||||
LONG FUTURES OUTSTANDING | |||||||||||||||||||
| 12 | Aluminum HG LME | $ | 574,275 | May 18, 2015 | $ | 32,969 | |||||||||||||
| 10 | Aluminum HG LME | 482,250 | July 13, 2015 | 32,970 | |||||||||||||||
| 7 | Brent Crude Oilb | 472,150 | June 15, 2015 | 12,174 | |||||||||||||||
| 6 | Coffee C | 309,263 | July 21, 2015 | (3,364 | ) | ||||||||||||||
| 11 | Copper | 793,787 | July 29, 2015 | 33,318 | |||||||||||||||
| 4 | Corn | 76,700 | December 14, 2015 | (5,775 | ) | ||||||||||||||
| 31 | Corn | 567,687 | July 14, 2015 | (30,346 | ) | ||||||||||||||
| 2 | Gasoline RBOB | 170,461 | June 30, 2015 | 23,879 | |||||||||||||||
| 6 | Gold | 709,440 | June 26, 2015 | 14,703 | |||||||||||||||
| 13 | KC Wheat | 324,350 | July 14, 2015 | (15,463 | ) | ||||||||||||||
| 4 | Lean Hogsb | 130,280 | June 12, 2015 | 190 | |||||||||||||||
| 5 | Light Sweet Crude Oil | 315,350 | November 20, 2015 | 21,335 | |||||||||||||||
| 12 | Light Sweet Crude Oil | 728,520 | June 22, 2015 | 78,348 | |||||||||||||||
| 4 | Live Cattle | 239,520 | June 30, 2015 | 1,447 | |||||||||||||||
| 5 | Natural Gas | 156,150 | September 28, 2016 | (11,251 | ) | ||||||||||||||
| 3 | Natural Gas | 84,060 | June 26, 2015 | 7,634 | |||||||||||||||
| 23 | Natural Gas | 650,440 | August 27, 2015 | 15,129 | |||||||||||||||
| 6 | Nickel LME | 502,164 | July 13, 2015 | 49,320 | |||||||||||||||
| 8 | Nickel LME | 668,064 | May 18, 2015 | (39,403 | ) | ||||||||||||||
| 4 | NY Harbor ULSD | 333,665 | June 30, 2015 | 42,222 | |||||||||||||||
| 3 | Palladium | 232,950 | June 26, 2015 | 6,230 | |||||||||||||||
| 8 | Platinum | 456,160 | July 29, 2015 | 2,260 | |||||||||||||||
| 4 | Silver | 323,060 | July 29, 2015 | (4,141 | ) | ||||||||||||||
| 3 | Soybean | 146,400 | July 14, 2015 | 876 | |||||||||||||||
| 6 | Soybean Meal | 189,660 | July 14, 2015 | (746 | ) | ||||||||||||||
| 11 | Soybean Oil | 208,890 | July 14, 2015 | 3,194 | |||||||||||||||
| 19 | Sugar 11 | 280,470 | June 30, 2015 | 5,490 | |||||||||||||||
| 9 | Wheat | 213,300 | July 14, 2015 | (21,915 | ) | ||||||||||||||
| 5 | Zinc LME | 294,250 | May 18, 2015 | 33,774 | |||||||||||||||
| 6 | Zinc LME | 353,475 | June 15, 2015 | 24,885 | |||||||||||||||
| 7 | Zinc LME | 411,338 | July 13, 2015 | 26,304 | |||||||||||||||
SHORT FUTURES OUTSTANDING | |||||||||||||||||||
| 12 | Aluminum HG LME | (574,275 | ) | May 18, 2015 | (37,562 | ) | |||||||||||||
| 2 | Cattle Feederb | (214,700 | ) | August 27, 2015 | (1,957 | ) | |||||||||||||
| 2 | Copper | (144,425 | ) | December 29, 2015 | (440 | ) | |||||||||||||
| 1 | Cotton No. 2 | (33,940 | ) | July 9, 2015 | (33 | ) | |||||||||||||
| 9 | KC Wheat | (237,825 | ) | December 14, 2015 | 4,702 | ||||||||||||||
See accompanying notes to the consolidated financial statements.
12
COHEN & STEERS ACTIVE COMMODITIES STRATEGY FUND, INC.
CONSOLIDATED SCHEDULE OF INVESTMENTS—(Continued)
April 30, 2015
| Number of Contractsa | Description | Notional Value | Expiration Date | Unrealized Appreciation (Depreciation) | |||||||||||||||
| 6 | Natural Gas | $ | (171,780 | ) | September 28, 2015 | $ | 5,663 | ||||||||||||
| 1 | Nickel LME | (83,694 | ) | July 13, 2015 | (7,017 | ) | |||||||||||||
| 8 | Nickle LME | (668,064 | ) | May 18, 2015 | (34,980 | ) | |||||||||||||
| 9 | Soybean | (428,512 | ) | November 13, 2015 | 14,296 | ||||||||||||||
| 6 | Zinc LME | (353,475 | ) | June 15, 2015 | (9,665 | ) | |||||||||||||
| 5 | Zinc LME | (294,250 | ) | May 18, 2015 | (22,515 | ) | |||||||||||||
$ | 246,739 | ||||||||||||||||||
a Represents positions held in the Subsidiary.
b Futures contracts are cash settled based upon the price of the underlying commodity.
Glossary of Portfolio Abbreviations
HG High Grade
LME London Metal Exchange
RBOB Reformulated Gasoline Blendstock for Oxygen Blending
ULSD Ultra Low Sulfur Diesel
See accompanying notes to the consolidated financial statements.
13
COHEN & STEERS ACTIVE COMMODITIES STRATEGY FUND, INC.
CONSOLIDATED STATEMENT OF ASSETS AND LIABILITIES
April 30, 2015
ASSETS: | |||||||
Investments in securities, at value (Identified cost—$6,999,723) | $ | 6,999,898 | |||||
Cash | 1,183,201 | ||||||
Receivable for: | |||||||
Variation margin on futures contracts | 71,459 | ||||||
Fund shares sold | 5,000 | ||||||
Due from investment advisor | 16,783 | ||||||
Other assets | 11,334 | ||||||
Total Assets | 8,287,675 | ||||||
LIABILITIES: | |||||||
Payable for: | |||||||
Administration fees | 525 | ||||||
Directors' fees | 38 | ||||||
Distribution fees | 8 | ||||||
Shareholder servicing fees | 3 | ||||||
Other liabilities | 49,723 | ||||||
Total Liabilities | 50,297 | ||||||
NET ASSETS | $ | 8,237,378 | |||||
NET ASSETS consist of: | |||||||
Paid-in capital | $ | 8,306,746 | |||||
Accumulated net realized loss | (316,282 | ) | |||||
Net unrealized appreciation | 246,914 | ||||||
$ | 8,237,378 | ||||||
See accompanying notes to the consolidated financial statements.
14
COHEN & STEERS ACTIVE COMMODITIES STRATEGY FUND, INC.
CONSOLIDATED STATEMENT OF ASSETS AND LIABILITIES—(Continued)
April 30, 2015
CLASS A SHARES: | |||||||
NET ASSETS | $ | 568,054 | |||||
| Shares issued and outstanding ($0.001 par value common stock outstanding) | 77,429 | ||||||
Net asset value and redemption price per share | $ | 7.34 | |||||
Maximum offering price per share ($7.34 ÷ 0.955)a | $ | 7.69 | |||||
CLASS C SHARES: | |||||||
NET ASSETS | $ | 11,111 | |||||
| Shares issued and outstanding ($0.001 par value common stock outstanding) | 1,523 | ||||||
Net asset value and offering price per shareb | $ | 7.30 | |||||
CLASS I SHARES: | |||||||
NET ASSETS | $ | 7,636,790 | |||||
| Shares issued and outstanding ($0.001 par value common stock outstanding) | 1,037,413 | ||||||
Net asset value, offering and redemption price per share | $ | 7.36 | |||||
CLASS R SHARES: | |||||||
NET ASSETS | $ | 8,444 | |||||
| Shares issued and outstanding ($0.001 par value common stock outstanding) | 1,151 | ||||||
Net asset value, offering and redemption price per share | $ | 7.34 | |||||
CLASS Z SHARES: | |||||||
NET ASSETS | $ | 12,979 | |||||
| Shares issued and outstanding ($0.001 par value common stock outstanding) | 1,764 | ||||||
Net asset value, offering and redemption price per share | $ | 7.36 | |||||
a On investments of $100,000 or more, the offering price is reduced.
b Redemption price per share is equal to the net asset value per share less any applicable contingent deferred sales charge of 1.00% on shares held for less than one year.
See accompanying notes to the consolidated financial statements.
15
COHEN & STEERS ACTIVE COMMODITIES STRATEGY FUND, INC.
CONSOLIDATED STATEMENT OF OPERATIONS
For the Period May 1, 2014a through April 30, 2015
Investment Income: | |||||||
Interest income | $ | 1,422 | |||||
Expenses: | |||||||
Professional fees | 112,604 | ||||||
Investment advisory fees | 92,571 | ||||||
Registration and filing fees | 58,326 | ||||||
Shareholder reporting expenses | 57,554 | ||||||
Custodian fees and expenses | 34,011 | ||||||
Administration fees | 32,261 | ||||||
Transfer agent fees and expenses | 21,626 | ||||||
Directors' fees and expenses | 15,195 | ||||||
Distribution fees—Class A | 623 | ||||||
Distribution fees—Class C | 86 | ||||||
Distribution fees—Class R | 26 | ||||||
Interest expense | 569 | ||||||
Shareholder servicing fees—Class A | 178 | ||||||
Shareholder servicing fees—Class C | 13 | ||||||
Shareholder servicing fees—Class Z | 7 | ||||||
Line of credit fees | 112 | ||||||
| Miscellaneous | 7,803 | ||||||
| Total Expenses | 433,565 | ||||||
Reduction of Expenses (See Note 2) | (330,804 | ) | |||||
Net Expenses | 102,761 | ||||||
Net Investment Loss | (101,339 | ) | |||||
Net Realized and Unrealized Gain (Loss): | |||||||
Net realized gain (loss) on: | |||||||
Investments | (11,231 | ) | |||||
Futures contracts | (3,074,595 | ) | |||||
Foreign currency transactions | 1,643 | ||||||
Net realized loss | (3,084,183 | ) | |||||
Net change in unrealized appreciation (depreciation) on: | |||||||
Investments | 175 | ||||||
Futures contracts | 246,739 | ||||||
Net change in unrealized appreciation (depreciation) | 246,914 | ||||||
Net realized and unrealized loss | (2,837,269 | ) | |||||
Net Decrease in Net Assets Resulting from Operations | $ | (2,938,608 | ) | ||||
a Commencement of operations.
See accompanying notes to the consolidated financial statements.
16
COHEN & STEERS ACTIVE COMMODITIES STRATEGY FUND, INC.
CONSOLIDATED STATEMENT OF CHANGES IN NET ASSETS
| For the Period May 1, 2014a through April 30, 2015 | |||||||
Change in Net Assets: | |||||||
From Operations: | |||||||
Net investment loss | $ | (101,339 | ) | ||||
Net realized loss | (3,084,183 | ) | |||||
Net change in unrealized appreciation (depreciation) | 246,914 | ||||||
Net decrease in net assets resulting from operations | (2,938,608 | ) | |||||
Capital Stock Transactions: | |||||||
Increase in net assets from Fund share transactions | 11,075,986 | ||||||
Total increase in net assets | 8,137,378 | ||||||
Net Assets: | |||||||
Beginning of period | 100,000 | ||||||
End of period | $ | 8,237,378 | |||||
a Commencement of operations.
See accompanying notes to the consolidated financial statements.
17
COHEN & STEERS ACTIVE COMMODITIES STRATEGY FUND, INC.
CONSOLIDATED FINANCIAL HIGHLIGHTS
The following tables include selected data for a share outstanding throughout each period and other performance information derived from the consolidated financial statements. It should be read in conjunction with the consolidated financial statements and notes thereto.
Class A | |||||||
Per Share Operating Performance: | For the Period May 1, 2014a through April 30, 2015 | ||||||
| Net asset value, beginning of period | $ | 10.00 | |||||
Income (loss) from investment operations: | |||||||
| Net investment lossb | (0.11 | ) | |||||
| Net realized and unrealized loss | (2.55 | ) | |||||
| Total from investment operations | (2.66 | ) | |||||
| Net decrease in net asset value | (2.66 | ) | |||||
Net asset value, end of period | $ | 7.34 | |||||
Total investment returnc | –26.60 | %d | |||||
Ratios/Supplemental Data: | |||||||
Net assets, end of period (in 000's) | $ | 568.0 | |||||
Ratio of expenses to average daily net assets (before expense reduction) | 4.99 | %e | |||||
| Ratio of expenses to average daily net assets (net of expense reduction) | 1.42 | %e | |||||
| Ratio of net investment loss to average daily net assets (before expense reduction) | (4.98 | )%e | |||||
| Ratio of net investment loss to average daily net assets (net of expense reduction) | (1.41 | )%e | |||||
| Portfolio turnover rate | — | %f | |||||
a Commencement of operations.
b Calculation based on average shares outstanding.
c Does not reflect sales charges, which would reduce return.
d Not annualized.
e Annualized.
f The Fund's portfolio turnover rate is calculated in accordance with regulatory requirements, without regard to transactions involving short-term investments and certain derivatives. If such transactions were included, the Fund's portfolio turnover rate would be higher.
See accompanying notes to the consolidated financial statements.
18
COHEN & STEERS ACTIVE COMMODITIES STRATEGY FUND, INC.
CONSOLIDATED FINANCIAL HIGHLIGHTS—(Continued)
Class C | |||||||
| Per Share Operating Performance: | For the Period May 1, 2014a through April 30, 2015 | ||||||
| Net asset value, beginning of period | $ | 10.00 | |||||
Income (loss) from investment operations: | |||||||
| Net investment lossb | (0.16 | ) | |||||
| Net realized and unrealized loss | (2.54 | ) | |||||
| Total from investment operations | (2.70 | ) | |||||
| Net decrease in net asset value | (2.70 | ) | |||||
Net asset value, end of period | $ | 7.30 | |||||
Total investment returnc | –27.00 | %d | |||||
Ratios/Supplemental Data: | |||||||
Net assets, end of period (in 000's) | $ | 11.0 | |||||
Ratio of expenses to average daily net assets (before expense reduction) | 5.53 | %e | |||||
Ratio of expenses to average daily net assets (net of expense reduction) | 1.96 | %e | |||||
| Ratio of net investment loss to average daily net assets (before expense reduction) | (5.52 | )%e | |||||
| Ratio of net investment loss to average daily net assets (net of expense reduction) | (1.95 | )%e | |||||
Portfolio turnover rate | — | %f | |||||
a Commencement of operations.
b Calculation based on average shares outstanding.
c Does not reflect sales charges, which would reduce return.
d Not annualized.
e Annualized.
f The Fund's portfolio turnover rate is calculated in accordance with regulatory requirements, without regard to transactions involving short-term investments and certain derivatives. If such transactions were included, the Fund's portfolio turnover rate would be higher.
See accompanying notes to the consolidated financial statements.
19
COHEN & STEERS ACTIVE COMMODITIES STRATEGY FUND, INC.
CONSOLIDATED FINANCIAL HIGHLIGHTS—(Continued)
Class I | |||||||
| Per Share Operating Performance: | For the Period May 1, 2014a through April 30, 2015 | ||||||
| Net asset value, beginning of period | $ | 10.00 | |||||
Income (loss) from investment operations: | |||||||
| Net investment lossb | (0.09 | ) | |||||
| Net realized and unrealized loss | (2.55 | ) | |||||
| Total from investment operations | (2.64 | ) | |||||
| Net decrease in net asset value | (2.64 | ) | |||||
Net asset value, end of period | $ | 7.36 | |||||
| Total investment return | –26.40 | %c | |||||
Ratios/Supplemental Data: | |||||||
Net assets, end of period (in 000's) | $ | 7,637.0 | |||||
Ratio of expenses to average daily net assets (before expense reduction) | 4.67 | %d | |||||
| Ratio of expenses to average daily net assets (net of expense reduction) | 1.10 | %d | |||||
Ratio of net investment loss to average daily net assets (before expense reduction) | (4.66 | )%d | |||||
| Ratio of net investment loss to average daily net assets (net of expense reduction) | (1.09 | )%d | |||||
Portfolio turnover rate | — | %e | |||||
a Commencement of operations.
b Calculation based on average shares outstanding.
c Not annualized.
d Annualized.
e The Fund's portfolio turnover rate is calculated in accordance with regulatory requirements, without regard to transactions involving short-term investments and certain derivatives. If such transactions were included, the Fund's portfolio turnover rate would be higher.
See accompanying notes to the consolidated financial statements.
20
COHEN & STEERS ACTIVE COMMODITIES STRATEGY FUND, INC.
CONSOLIDATED FINANCIAL HIGHLIGHTS—(Continued)
Class R | |||||||
| Per Share Operating Performance: | For the Period October 1, 2014a through April 30, 2015 | ||||||
| Net asset value, beginning of period | $ | 8.69 | |||||
Income (loss) from investment operations: | |||||||
| Net investment lossb | (0.07 | ) | |||||
| Net realized and unrealized loss | (1.28 | ) | |||||
| Total from investment operations | (1.35 | ) | |||||
| Net decrease in net asset value | (1.35 | ) | |||||
Net asset value, end of period | $ | 7.34 | |||||
Total investment return | –15.54 | %c | |||||
Ratios/Supplemental Data: | |||||||
| Net assets, end of period (in 000's) | $ | 8.4 | |||||
| Ratio of expenses to average daily net assets (before expense reduction) | 5.17 | %d | |||||
| Ratio of expenses to average daily net assets (net of expense reduction) | 1.60 | %d | |||||
| Ratio of net investment loss to average daily net assets (before expense reduction) | (5.16 | )%d | |||||
| Ratio of net investment loss to average daily net assets (net of expense reduction) | (1.59 | )%d | |||||
| Portfolio turnover rate | — | %e | |||||
a Commencement of operations.
b Calculation based on average shares outstanding.
c Not annualized.
d Annualized.
e The Fund's portfolio turnover rate is calculated in accordance with regulatory requirements, without regard to transactions involving short-term investments and certain derivatives. If such transactions were included, the Fund's portfolio turnover rate would be higher.
See accompanying notes to the consolidated financial statements.
21
COHEN & STEERS ACTIVE COMMODITIES STRATEGY FUND, INC.
CONSOLIDATED FINANCIAL HIGHLIGHTS—(Continued)
Class Z | |||||||
| Per Share Operating Performance: | For the Period May 1, 2014a through April 30, 2015 | ||||||
| Net asset value, beginning of period | $ | 10.00 | |||||
Income (loss) from investment operations: | |||||||
| Net investment lossb | (0.09 | ) | |||||
| Net realized and unrealized loss | (2.55 | ) | |||||
| Total from investment operations | (2.64 | ) | |||||
| Net decrease in net asset value | (2.64 | ) | |||||
Net asset value, end of period | $ | 7.36 | |||||
| Total investment return | –26.40 | %c | |||||
Ratios/Supplemental Data: | |||||||
| Net assets, end of period (in 000's) | $ | 13.0 | |||||
Ratio of expenses to average daily net assets (before expense reduction) | 4.73 | %d | |||||
| Ratio of expenses to average daily net assets (net of expense reduction) | 1.16 | %d | |||||
| Ratio of net investment loss to average daily net assets (before expense reduction) | (4.70 | )%d | |||||
| Ratio of net investment loss to average daily net assets (net of expense reduction) | (1.13 | )%d | |||||
| Portfolio turnover rate | — | %e | |||||
a Commencement of operations.
b Calculation based on average shares outstanding.
c Not annualized.
d Annualized.
e The Fund's portfolio turnover rate is calculated in accordance with regulatory requirements, without regard to transactions involving short-term investments and certain derivatives. If such transactions were included, the Fund's portfolio turnover rate would be higher.
See accompanying notes to the consolidated financial statements.
22
COHEN & STEERS ACTIVE COMMODITIES STRATEGY FUND, INC.
NOTES TO CONSOLIDATED FINANCIAL STATEMENTS
Note 1. Organization and Significant Accounting Policies
Cohen & Steers Active Commodities Strategy Fund, Inc. (the Fund) was incorporated under the laws of the State of Maryland on February 11, 2014 and is registered under the Investment Company Act of 1940, as amended (the 1940 Act), as a non-diversified, open-end management investment company. The Fund's investment objective is to achieve attractive total return. The Fund had no operations until April 14, 2014 when it sold 1,000 shares each of Class A, C and Z and 7,000 shares of Class I for $100,000 to Cohen & Steers Capital Management, Inc. (the investment advisor). Investment operations commenced on May 1, 2014. On July 22, 2014, the Board of Directors of the Fund approved the Fund's offering of Class R shares. Class R shares became available for investment on October 1, 2014 on which date the Fund sold 1,151 shares of Class R for $10,000 to the investment advisor. The authorized shares of the Fund are divided into five classes designated Class A, C, I, R and Z shares. Each of the Fund's shares has equal dividend, liquidation and voting rights (except for matters relating to distributions and shareholder servicing of such shares.)
Cohen & Steers Active Commodities Strategy, Ltd. (the Subsidiary), a wholly-owned subsidiary of the Fund organized under the laws of the Cayman Islands, was incorporated on March 13, 2014 and commenced operations on May 1, 2014. The Subsidiary acts as an investment vehicle for the Fund in order to effect certain investments on behalf of the Fund, consistent with the Fund's investment objectives and policies as described in the Fund's prospectus. The Fund expects that it will achieve a significant portion of its exposure to commodities and commodities-related investments through investment in the Subsidiary. Unlike the Fund, the Subsidiary may invest without limitation in commodities. The Fund and its Subsidiary are commodity pools under the Commodity Exchange Act. The investment advisor has registered with the CFTC as a commodity pool operator with respect to the Fund and the Subsidiary. As of April 30, 2015, the Fund held $1,237,042 in the Subsidiary, representing 15.0% of the Fund's net assets. During the period May 1, 2014 (commencement of operations) through April 30, 2015, the Subsidiary generated realized losses of $3,084,181. The Consolidated Schedule of Investments includes positions of the Fund and the Subsidiary. The financial statements have been consolidated and include the accounts of the Fund and the Subsidiary. All significant inter-company balances and transactions have been eliminated in consolidation.
The following is a summary of significant accounting policies consistently followed by the Fund in the preparation of its consolidated financial statements. The Fund is an investment company and, accordingly, follows the investment company accounting and reporting guidance of the Financial Accounting Standards Board Accounting Standards Codification Topic 946—Investment Companies. The accounting policies of the Fund are in conformity with accounting principles generally accepted in the United States of America (GAAP). The preparation of the consolidated financial statements in accordance with GAAP requires management to make estimates and assumptions that affect the reported amounts of assets and liabilities at the date of the consolidated financial statements and the reported amounts of income and expenses during the reporting period. Actual results could differ from those estimates.
Portfolio Valuation: Futures contracts traded on a commodities exchange or board of trade are valued at their settlement price at the close of trading on such exchange or board of trade. Exchange traded options are valued at their last sale price as of the close of options trading on applicable
23
COHEN & STEERS ACTIVE COMMODITIES STRATEGY FUND, INC.
NOTES TO CONSOLIDATED FINANCIAL STATEMENTS—(Continued)
exchanges on the valuation date. In the absence of a last sale price on such day, options are valued at the average of the quoted bid and ask prices as of the close of business.
Readily marketable securities traded in the over-the-counter market are valued at the mean of the closing bid and ask prices on such day or, if no ask price is available, at the bid price.
Short-term debt securities with a maturity date of 60 days or less are valued at amortized cost, which approximates fair value. Investments in open-end mutual funds are valued at their closing net asset value.
The policies and procedures approved by the Fund's Board of Directors delegate authority to make fair value determinations to the investment advisor, subject to the oversight of the Board of Directors. The investment advisor has established a valuation committee (Valuation Committee) to administer, implement and oversee the fair valuation process according to the policies and procedures approved annually by the Board of Directors. Among other things, these procedures allow the Fund to utilize independent pricing services, quotations from securities and financial instrument dealers and other market sources to determine fair value.
Securities for which market prices are unavailable, or securities for which the investment advisor determines that the valuation of any investment pursuant to the valuation policy and procedures set forth above does not reflect market value, will be valued at fair value, as determined in good faith by the Valuation Committee, pursuant to procedures approved by the Fund's Board of Directors. Circumstances in which market prices may be unavailable include, but are not limited to, when trading in a security is suspended, the exchange on which the security is traded is subject to an unscheduled close or disruption or material events occur after the close of the exchange on which the security is principally traded. In these circumstances, the Fund determines fair value in a manner that fairly reflects the market value of the security on the valuation date based on consideration of any information or factors it deems appropriate. These may include, but are not limited to, recent transactions in comparable securities, information relating to the specific security and developments in the markets.
The Fund's use of fair value pricing may cause the net asset value of Fund shares to differ from the net asset value that would be calculated using market quotations. Fair value pricing involves subjective judgments and it is possible that the fair value determined for a security may be materially different than the value that could be realized upon the sale of that security.
Fair value is defined as the price that the Fund would expect to receive upon the sale of an investment or expect to pay to transfer a liability in an orderly transaction with an independent buyer in the principal market or, in the absence of a principal market, the most advantageous market for the investment or liability. The hierarchy of inputs that are used in determining the fair value of the Fund's investments is summarized below.
• Level 1—quoted prices in active markets for identical investments
• Level 2—other significant observable inputs (including quoted prices for similar investments, interest rates, credit risk, etc.)
• Level 3—significant unobservable inputs (including the Fund's own assumptions in determining the fair value of investments)
24
COHEN & STEERS ACTIVE COMMODITIES STRATEGY FUND, INC.
NOTES TO CONSOLIDATED FINANCIAL STATEMENTS—(Continued)
The inputs or methodology used for valuing securities are not necessarily an indication of the risk associated with investing in those securities.
For movements between the levels within the fair value hierarchy, the Fund has adopted a policy of recognizing the transfer at the end of the period in which the underlying event causing the movement occurred. Changes in valuation techniques may result in transfers into or out of an assigned level within the disclosure hierarchy. There were no transfers between Level 1 and Level 2 investments as of April 30, 2015.
The following is a summary of the inputs used as of April 30, 2015 in valuing the Fund's investments carried at value:
Total | Quoted Prices In Active Markets for Identical Investments (Level 1) | Other Significant Observable Inputs (Level 2) | Significant Unobservable Inputs (Level 3) | ||||||||||||||||
Short-Term Investments | $ | 6,999,898 | $ | — | $ | 6,999,898 | $ | — | |||||||||||
Total Investmentsa | $ | 6,999,898 | $ | — | $ | 6,999,898 | $ | — | |||||||||||
Futures Contracts | $ | 493,312 | $ | 493,312 | $ | — | $ | — | |||||||||||
| Total Unrealized Appreciation in Other Financial Instrumentsa | $ | 493,312 | $ | 493,312 | $ | — | $ | — | |||||||||||
Futures Contracts | $ | (246,573 | ) | $ | (246,573 | ) | $ | — | $ | — | |||||||||
| Total Unrealized Depreciation in Other Financial Instrumentsa | $ | (246,573 | ) | $ | (246,573 | ) | $ | — | $ | — | |||||||||
a Portfolio holdings are disclosed individually on the Consolidated Schedule of Investments.
Security Transactions, Investment Income and Expense Allocations: Security transactions are recorded on trade date. Realized gains and losses on investments sold are recorded on the basis of identified cost. Interest income is recorded on the accrual basis. Discounts are accreted and premiums are amortized over the life of the respective securities. Income, expenses (other than expenses attributable to a specific class) and realized and unrealized gains or losses on investments are allocated to each class of shares based on its relative net assets.
Foreign Currency Translation: The books and records of the Fund are maintained in U.S. dollars. Investment securities and other assets and liabilities denominated in foreign currencies are translated into U.S. dollars based upon prevailing exchange rates on the date of valuation. Purchases and sales of investment securities and income and expense items denominated in foreign currencies are translated into U.S. dollars based upon prevailing exchange rates on the respective dates of such transactions.
25
COHEN & STEERS ACTIVE COMMODITIES STRATEGY FUND, INC.
NOTES TO CONSOLIDATED FINANCIAL STATEMENTS—(Continued)
The Fund does not isolate that portion of the results of operations resulting from fluctuations in foreign exchange rates on investments from the fluctuations arising from changes in market prices of securities held. Such fluctuations are included with the net realized and unrealized gain or loss on investments.
Net realized foreign exchange gains or losses arise from currency gains or losses realized between the trade and settlement dates on securities transactions. Net unrealized foreign exchange gains and losses arise from changes in the values of assets and liabilities, other than investments in securities, on the date of valuation, resulting from changes in exchange rates. Pursuant to U.S. federal income tax regulations, certain foreign currency gains/losses included in realized and unrealized gains/losses are included in or are a reduction of ordinary income for federal income tax purposes.
Commodities Risk: Because the Fund will have a significant portion of its assets concentrated in commodity-related derivative instruments, developments affecting commodities may have a disproportionate impact on the Fund. The Fund's investment in commodity-linked derivative instruments may subject the Fund to greater volatility than investments in traditional securities, particularly if the instruments involve leverage. The value of commodity-related derivative instruments may be affected by changes in overall market movements, commodity index volatility, changes in interest rates, or factors affecting a particular industry or commodity, such as drought, floods, weather, livestock disease, embargoes, tariffs and international economic, political and regulatory developments. In addition, the relationships between various commodities and related derivatives may not behave as expected. Use of leveraged commodity-related derivatives, if any, creates an opportunity for increased return but, at the same time, creates the possibility for greater loss (including the likelihood of greater volatility of the Fund's net asset value).
Non-U.S. Investment Risk: The Fund may invest in commodity futures contracts traded on non-U.S. exchanges or enter into over-the-counter derivative contracts with non-U.S. counterparties. Transactions on non-U.S. exchanges or with non-U.S. counterparties present risk because they may not be subject to the same degree of regulation as their U.S. counterparts.
Futures Contracts: The Fund uses futures contracts as its primary investment strategy in order to gain exposure to the underlying commodities markets. Futures contracts provide for the delayed delivery of the underlying instrument at a fixed price or for a cash amount based on the change in the value of the underlying instrument at a specific date in the future. Upon entering into a futures contract, the Fund is required to deposit with the broker, cash or securities in an amount equal to a certain percentage of the contract amount, which is referred to as the initial margin deposit. Subsequent payments, referred to as variation margin, are made or received by the Fund periodically and are based on changes in the market value of open futures contracts. Changes in the market value of open futures contracts are recorded as change in unrealized appreciation or depreciation on futures in the Consolidated Statement of Operations. Realized gain or loss, representing the difference between the value of the contract at the time it was opened and the value at the time it was closed, is reported in the Consolidated Statement of Operations at the closing or expiration of the futures contract. Securities deposited as initial margin are designated as such on the Consolidated Schedule of Investments and cash deposited is recorded on the Consolidated Statement of Assets and Liabilities. A receivable from and/or a payable to brokers for the daily variation margin is also recorded on the Consolidated Statement of Assets and Liabilities.
26
COHEN & STEERS ACTIVE COMMODITIES STRATEGY FUND, INC.
NOTES TO CONSOLIDATED FINANCIAL STATEMENTS—(Continued)
The Fund may be subject to the risk that the change in the value of the futures contract may not correlate perfectly with the underlying instrument. Use of long futures contracts subjects the Fund to risk of loss, up to the notional value of the futures contracts. Use of short futures contracts subjects the Fund to unlimited risk of loss. With exchange traded futures contracts, the exchange or board of trade acts as the counterparty to futures transactions; therefore, the Fund's credit risk is limited to failure of the exchange or board of trade. Under some circumstances, futures exchanges may establish daily limits on the amount that the price of a futures contract can vary from the previous day's settlement price, which could effectively prevent liquidation of certain positions. In certain circumstances, the futures commissions merchant (FCM) can require additional margin on the futures contracts which would subject the Fund to counterparty credit risk with the FCM.
Morgan Stanley & Co. LLC serves as the Fund's FCM for the purpose of trading in commodity futures contracts, options and interests therein.
Options: The Fund purchases call and put options on commodity futures contracts. Put and call options purchased are accounted for in the same manner as portfolio securities. Premiums paid for purchasing options which expire are treated as realized losses. Premiums paid for purchasing options which are exercised or closed are added to the amounts paid or offset against the proceeds on the underlying investment transaction to determine the realized gain or loss when the underlying transaction is executed. The risk associated with purchasing an option is that the Fund pays a premium whether or not the option is exercised. Additionally, the Fund bears the risk of loss of the premium and change in market value should the counterparty not perform under the contract. At April 30, 2015, the Fund did not have any purchased options outstanding.
Dividends and Distributions to Shareholders: Dividends from net investment income and capital gain distributions are determined in accordance with U.S. federal income tax regulations, which may differ from GAAP. Dividends from net investment income, if any, are declared and paid annually. Net realized capital gains, unless offset by any available capital loss carryforward, are typically distributed to shareholders at least annually. Dividends and distributions to shareholders are recorded on the ex-dividend date and are automatically reinvested in full and fractional shares of the Fund based on the net asset value per share at the close of business on the payable date, unless the shareholder has elected to have them paid in cash. Distributions paid by the Fund are subject to recharacterization for tax purposes.
Income Taxes: It is the policy of the Fund to continue to qualify as a regulated investment company, if such qualification is in the best interest of the shareholders, by complying with the requirements of Subchapter M of the Internal Revenue Code applicable to regulated investment companies, and by distributing substantially all of its taxable earnings to its shareholders. Accordingly, no provision for federal income or excise tax is necessary. Management has analyzed the Fund's federal tax positions as well as its tax positions in non-U.S. jurisdictions in which it trades and has concluded that as of April 30, 2015, no additional provisions for income tax are required in the Fund's consolidated financial statements. The Fund's tax positions for the current tax year for which the applicable statutes of limitations have not expired are subject to examination by the Internal Revenue Service, state departments of revenue and by foreign tax authorities.
27
COHEN & STEERS ACTIVE COMMODITIES STRATEGY FUND, INC.
NOTES TO CONSOLIDATED FINANCIAL STATEMENTS—(Continued)
The Subsidiary is classified as a controlled foreign corporation under the Internal Revenue Code. The Subsidiary's taxable income, including net gains, is included, as ordinary income, in the calculation of the Fund's taxable income. Net losses of the Subsidiary are not deductible by the Fund either in the current period or carried forward to future periods.
Note 2. Investment Advisory Fees, Administration Fees and Other Transactions with Affiliates
Investment Advisory Fees: The investment advisor serves as the Fund's and Subsidiary's investment advisor pursuant to an investment advisory agreement (the investment advisory agreement). Under the terms of the investment advisory agreement, the investment advisor provides the Fund with day-to-day investment decisions and generally manages the Fund's investments in accordance with the stated policies of the Fund, subject to the supervision of the Board of Directors.
For the services provided to the Fund, the investment advisor receives a fee, accrued daily and paid monthly, at the annual rate of 1.00% of the average daily net assets of the Fund.
For the period May 1, 2014 (commencement of operations) through April 30, 2015, and through June 30, 2016, the investment advisor has contractually agreed to waive its fee and/or reimburse expenses so that the Fund's total annual operating expenses (excluding acquired fund fees and expenses and extraordinary expenses) do not exceed 1.45% for Class A shares, 2.10% for Class C shares, 1.10% for Class I shares, 1.60% for Class R shares and 1.10% for Class Z shares. For the period May 1, 2014 (commencement of operations) through September 30, 2014, the Fund's total annual operating expenses for Class Z shares was 1.25% due to a shareholder servicing fee which terminated on October 1, 2014. This contractual expense limitation agreement can be amended at any time by agreement of the Fund and the investment advisor and will terminate automatically in the event of termination of the investment advisory agreement between the Fund and the investment advisor. For the period May 1, 2014 (commencement of operations) through April 30, 2015, fees waived and/or expenses reimbursed totaled $330,804.
Administration Fees: The Fund has entered into an administration agreement with the investment advisor under which the investment advisor performs certain administrative functions for the Fund and receives a fee, accrued daily and paid monthly, at the annual rate of 0.08% of the average daily net assets of the Fund. For the period May 1, 2014 (commencement of operations) through April 30, 2015, the Fund incurred $7,406 in fees under this administration agreement. Additionally, the Fund pays State Street Bank and Trust Company as co-administrator under a fund accounting and administration agreement.
Distribution Fees: Shares of the Fund are distributed by Cohen & Steers Securities, LLC (the distributor), an affiliated entity of the investment advisor. The Fund has adopted an amended distribution and service plan (the plan) pursuant to Rule 12b-1 under the 1940 Act. The plan provides that the Fund will pay the distributor a fee, accrued daily and paid monthly, at an annual rate of up to 0.25% of the average daily net assets attributable to Class A shares, up to 0.75% of the average daily net assets attributable to Class C shares and up to 0.50% of the average daily net assets attributable to Class R
28
COHEN & STEERS ACTIVE COMMODITIES STRATEGY FUND, INC.
NOTES TO CONSOLIDATED FINANCIAL STATEMENTS—(Continued)
shares. In addition, with respect to Class R shares, such amounts may also be used to pay for services to Fund shareholders or services related to the maintenance of shareholder accounts.
There is a maximum initial sales charge of 4.50% for Class A shares. There is a contingent deferred sales charge (CDSC) of 1.00% on purchases of $1 million or more of Class A shares, which applies if redemption occurs within one year from purchase. There is a CDSC of 1.00% on Class C shares, which applies if redemption occurs within one year from purchase. For the period May 1, 2014 (commencement of operations) through April 30, 2015, the Fund has been advised that the distributor received $88 in sales commissions from the sale of Class A shares. There were no CDSC fees collected relating to redemptions of Class A or Class C shares. The distributor has advised the Fund that proceeds from the CDSC on these classes are used by the distributor to defray its expenses related to providing distribution-related services to the Fund in connection with the sale of these classes, including payments to dealers and other financial intermediaries for selling these classes.
Shareholder Servicing Fees: For shareholder services, the Fund pays the distributor or its affiliates a fee, accrued daily and paid monthly, at an annual rate of up to 0.10% of the average daily net assets of the Fund's Class A shares, up to 0.25% of the average daily net assets of the Fund's Class C shares and up to 0.10% of the average daily net assets of the Fund's Class I shares. For the period May 1, 2014 (commencement of operations) through September 30, 2014, the Fund paid the distributor a fee, accrued daily and paid monthly, at an annual rate of 0.15% of the average daily net assets of the Fund's Class Z shares. The distributor is responsible for paying qualified financial institutions for shareholder services.
Directors' and Officers' Fees: Certain directors and officers of the Fund are also directors, officers and/or employees of the investment advisor. The Fund does not pay compensation to directors and officers affiliated with the investment advisor except for the Chief Compliance Officer, who received compensation from the investment advisor which was reimbursed by the Fund, in the amount of $106 for the period May 1, 2014 (commencement of operations) through April 30, 2015.
Other: At April 30, 2015, the investment advisor and affiliated persons of the investment advisor owned 94.0% of the Fund's outstanding shares. Investment activities of these shareholders could have a significant impact on the Fund. In addition, a person who beneficially owns, either directly or indirectly, more than 25% of the voting securities of the Fund may be presumed to control the Fund. A control person could potentially control the outcome of any proposal submitted to the shareholders for approval, including changes to the Fund's fundamental policies or terms of the investment advisory agreement with the investment advisor.
Note 3. Purchases and Sales of Securities
During the period May 1, 2014 (commencement of operations) through April 30, 2015, there were no purchases or sales of long-term investments. Additionally, during the period May 1, 2014 (commencement of operations) through April 30, 2015, there were no purchases or sales of long-term U.S. government securities.
29
COHEN & STEERS ACTIVE COMMODITIES STRATEGY FUND, INC.
NOTES TO CONSOLIDATED FINANCIAL STATEMENTS—(Continued)
Note 4. Derivative Investments
The following tables present the value of derivatives held at April 30, 2015 and the effect of derivatives held during the period May 1, 2014 (commencement of operations) through April 30, 2015, along with the respective location in the consolidated financial statements.
Consolidated Statement of Assets and Liabilities | |||||||||||||||||||
Assets | Liabilities | ||||||||||||||||||
Derivatives | Location | Fair Value | Location | Fair Value | |||||||||||||||
| Futures Contractsa | Receivable for variation margin on futures contracts | $ | 246,739 | b | — | $ | — | ||||||||||||
a Futures contracts executed with Morgan Stanley & Co. LLC are not subject to a master netting arrangement or another similar agreement.
b Includes cumulative appreciation (depreciation) on futures contracts as reported on the Consolidated Schedule of Investments. The Consolidated Statement of Assets and Liabilities only reflects the current day variation margin receivable from broker.
Consolidated Statement of Operations | |||||||||||||||
| Derivatives | Location | Realized Gain (Loss) | Change in Unrealized Appreciation (Depreciation) | ||||||||||||
Futures Contracts | Net Realized and Unrealized Gain (Loss) | $ | (3,074,595 | ) | $ | 246,739 | |||||||||
The following summarizes the volume of the Fund's futures contracts activity during the period May 1, 2014 (commencement of operations) through April 30, 2015:
| Futures Contracts | |||||||
Average Notional Balance—Long | $ | 13,002,133 | |||||
Average Notional Balance—Short | (3,711,896 | ) | |||||
| Ending Notional Balance—Long | 11,398,529 | ||||||
Ending Notional Balance—Short | (3,204,940 | ) | |||||
30
COHEN & STEERS ACTIVE COMMODITIES STRATEGY FUND, INC.
NOTES TO CONSOLIDATED FINANCIAL STATEMENTS—(Continued)
Note 5. Income Tax Information
As of April 30, 2015, the tax-basis components of accumulated earnings and the federal tax cost were as follows:
Cost for federal income tax purposes | $ | 6,999,723 | |||||
Gross unrealized appreciation | $ | 175 | |||||
Gross unrealized depreciation | — | ||||||
Net unrealized appreciation | $ | 175 | |||||
As of April 30, 2015, the Fund had temporary book/tax differences primarily attributable to futures transactions in the Subsidiary and permanent book/tax differences primarily attributable to Fund net operating losses and Subsidiary losses. To reflect reclassifications arising from the permanent differences, paid-in capital was charged $2,869,240, accumulated net realized loss was credited $2,767,901 and accumulated net investment loss was credited $101,339. Net assets were not affected by this reclassification.
31
COHEN & STEERS ACTIVE COMMODITIES STRATEGY FUND, INC.
NOTES TO CONSOLIDATED FINANCIAL STATEMENTS—(Continued)
Note 6. Capital Stock
The Fund is authorized to issue 1 billion shares of capital stock, at a par value of $0.001 per share. The Board of Directors of the Fund may increase or decrease the aggregate number of shares of common stock that the Fund has authority to issue. Transactions in Fund shares were as follows:
| For the Period May 1, 2014a through April 30, 2015 | |||||||||||
Shares | Amount | ||||||||||
Class A: | |||||||||||
| Sold | 76,429 | $ | 635,675 | ||||||||
| Net increase | 76,429 | $ | 635,675 | ||||||||
Class C: | |||||||||||
| Sold | 523 | $ | 5,000 | ||||||||
| Net increase | 523 | $ | 5,000 | ||||||||
Class I: | |||||||||||
| Sold | 1,200,646 | $ | 11,870,830 | ||||||||
| Redeemed | (170,233 | ) | (1,452,519 | ) | |||||||
| Net increase | 1,030,413 | $ | 10,418,311 | ||||||||
Class R:b | |||||||||||
| Sold | 1,151 | $ | 10,000 | ||||||||
| Net increase | 1,151 | $ | 10,000 | ||||||||
Class Z: | |||||||||||
| Sold | 764 | $ | 7,000 | ||||||||
| Net increase | 764 | $ | 7,000 | ||||||||
a Commencement of operations.
b Inception date of October 1, 2014.
Note 7. Borrowings
Effective January 23, 2015, the Fund, in conjunction with other Cohen & Steers open-end funds, became a party to a $50,000,000 syndicated credit agreement (the credit agreement) with State Street Bank and Trust Company, as administrative agent and operations agent, and the lenders identified in the credit agreement (as applicable). Under the credit agreement, the total commitment amount is
32
COHEN & STEERS ACTIVE COMMODITIES STRATEGY FUND, INC.
NOTES TO CONSOLIDATED FINANCIAL STATEMENTS—(Continued)
$50,000,000 and the Fund pays a commitment fee of 0.15% per annum on its proportionate share of the unused portion of the credit agreement. The credit agreement will expire on January 22, 2016.
During the period from January 23, 2015 to April 30, 2015, the Fund did not borrow under the credit agreement.
Note 8. Other
In the normal course of business, the Fund enters into contracts that provide general indemnifications. The Fund's maximum exposure under these arrangements is dependent on claims that may be made against the Fund in the future and, therefore, cannot be estimated; however, based on experience, the risk of material loss from such claims is considered remote.
Note 9. Subsequent Events
Management has evaluated events and transactions occurring after April 30, 2015 through the date that the financial statements were issued, and has determined that no additional disclosure in the financial statements is required.
33
COHEN & STEERS ACTIVE COMMODITIES STRATEGY FUND, INC.
REPORT OF INDEPENDENT REGISTERED PUBLIC ACCOUNTING FIRM
To the Board of Directors and Shareholders of
Cohen & Steers Active Commodities Strategy Fund, Inc.
In our opinion, the accompanying consolidated statement of assets and liabilities, including the consolidated schedule of investments, and the related consolidated statements of operations and of changes in net assets and the consolidated financial highlights present fairly, in all material respects, the financial position of Cohen & Steers Active Commodities Strategy Fund, Inc. and its subsidiary (hereafter refered to as the "Fund") at April 30, 2015, and the results of their operations and the changes in their net assets for the period May 1, 2014 (commencement of operations) through April 30, 2015, and the consolidated financial highlights for the periods presented, in conformity with accounting principles generally accepted in the United States of America. These consolidated financial statements and consolidated financial highlights (hereafter referred to as "financial statements") are the responsibility of the Fund's management. Our responsibility is to express an opinion on these financial statements based on our audit. We conducted our audit of these financial statements in accordance with the standards of the Public Company Accounting Oversight Board (United States). Those standards require that we plan and perform the audit to obtain reasonable assurance about whether the financial statements are free of material misstatement. An audit includes examining, on a test basis, evidence supporting the amounts and disclosures in the financial statements, assessing the accounting principles used and significant estimates made by management, and evaluating the overall financial statement presentation. We believe that our audit, which included confirmation of securities at April 30, 2015 by correspondence with the custodian and brokers, provides a reasonable basis for our opinion.
PricewaterhouseCoopers LLP
New York, New York
June 23, 2015
34
COHEN & STEERS ACTIVE COMMODITIES STRATEGY FUND, INC.
OTHER INFORMATION
A description of the policies and procedures that the Fund uses to determine how to vote proxies relating to portfolio securities is available (i) without charge, upon request, by calling 800-330-7348, (ii) on our website at cohenandsteers.com or (iii) on the Securities and Exchange Commission's (the SEC) website at http://www.sec.gov. In addition, the Fund's proxy voting record for the most recent 12-month period ended June 30 is available by August 31 of each year (i) without charge, upon request, by calling 800-330-7348 or (ii) on the SEC's website at http://www.sec.gov.
The Fund files its complete schedule of portfolio holdings with the SEC for the first and third quarters of each fiscal year on Form N-Q. The Fund's Forms N-Q are available (i) without charge, upon request, by calling 800-330-7348 or (ii) on the SEC's website at http://www.sec.gov. In addition, the Forms N-Q may be reviewed and copied at the SEC's Public Reference Room in Washington, DC. Information on the operation of the Public Reference Room may be obtained by calling 800-SEC-0330.
Please note that distributions paid by the Fund to shareholders are subject to recharacterization for tax purposes. The Fund may also pay distributions in excess of the Fund's net investment company taxable income and this excess could be a tax free return of capital distributed from the Fund's assets. The final tax treatment of all distributions is reported to shareholders on their 1099-DIV forms, which are mailed after the close of each calendar year.
Election of Additional Director
Effective January 26, 2015, the Board of Directors has elected Dean Junkans as Director of the Fund. Prior to becoming a Director of various Cohen & Steers funds, Mr. Junkans was Chief Investment Officer at Wells Fargo Private Bank from 2004 to 2014, and also served as Chief Investment Officer of the Wealth, Brokerage and Retirement group at Wells Fargo & Company from 2011 to 2014. He is currently a member, and former Chair, of the Claritas Advisory Committee at the CFA Institute, and is also a board member and Investment Committee member of Bethel University Foundation. He was a member of the Board of Governors of the University of Wisconsin Foundation, River Falls, from 1996 to 2004, and is a U.S. Army Veteran.
Foreign Investor Policy Change
Effective February 1, 2015, the Fund no longer accepts investments from investors with non-U.S. addresses as well as dealer controlled accounts designated as foreign accounts (Restricted Accounts), consistent with the industry standard. Existing Restricted Accounts can remain in the Fund, but are prohibited from making further investments into their accounts. U.S. Armed Forces and Diplomatic post office addresses abroad are treated as U.S. addresses and will continue to be able to invest in the Fund. For more information, please call (800) 437-9912.
35
COHEN & STEERS ACTIVE COMMODITIES STRATEGY FUND, INC.
MANAGEMENT OF THE FUND
The business and affairs of the Fund are managed under the direction of the Board of Directors. The Board of Directors approves all significant agreements between the Fund and persons or companies furnishing services to it, including the Fund's agreements with its investment advisor, administrator, co-administrator, custodian and transfer agent. The management of the Fund's day-to-day operations is delegated to its officers, the investment advisor, administrator and co-administrator, subject always to the investment objective and policies of the Fund and to the general supervision of the Board of Directors.
The Board of Directors and officers of the Fund and their principal occupations during at least the past five years are set forth below. The statement of additional information (SAI) includes additional information about fund directors and is available, without charge, upon request by calling 800-330-7348.
| Name, Address1 and Year of Birth | Position(s) Held With Fund | Term of Office2 | Principal Occupation During At Least The Past 5 Years (Including Other Directorships Held) | Number of Funds Within Fund Complex Overseen by Director (Including the Fund) | Length of Time Served3 | ||||||||||||||||||
Interested Directors4 | |||||||||||||||||||||||
| Robert H. Steers Year of Birth: 1953 | Director and Chairman | Until next election of directors | Chief Executive Officer of Cohen & Steers Capital Management, Inc. (CSCM or the Advisor) and its parent, Cohen & Steers, Inc. (CNS) since 2014. Prior to that, Co-Chairman and Co-Chief Executive Officer of the Advisor since 2003 and CNS since 2004. | 21 | Since 1991 | ||||||||||||||||||
| Joseph M. Harvey Year of Birth: 1963 | Director and Vice President | Until next election of directors | President and Chief Investment Officer of the Advisor (since 2003) and President of CNS (since 2004). | 16 | Since 2014 | ||||||||||||||||||
(table continued on next page)
36
COHEN & STEERS ACTIVE COMMODITIES STRATEGY FUND, INC.
(table continued from previous page)
| Name, Address1 and Year of Birth | Position(s) Held With Fund | Term of Office2 | Principal Occupation During At Least The Past 5 Years (Including Other Directorships Held) | Number of Funds Within Fund Complex Overseen by Director (Including the Fund) | Length of Time Served3 | ||||||||||||||||||
Disinterested Directors | |||||||||||||||||||||||
| Michael G. Clark Year of Birth: 1965 | Director | Until next election of directors | From May 2006 to June 2011, President and Chief Executive Officer of DWS Funds and Managing Director of Deutsche Asset Management. | 21 | Since 2011 | ||||||||||||||||||
| Bonnie Cohen Year of Birth: 1942 | Director | Until next election of directors | Consultant. Board Member, DC Public Library Foundation since 2012, President since 2014; Board member, Telluride Mountain Film Festival since 2010; Trustee, H. Rubenstein Foundation since 1996; Trustee, District of Columbia Public Libraries since 2004. | 21 | Since 2001 | ||||||||||||||||||
| George Grossman Year of Birth: 1953 | Director | Until next election of directors | Attorney-at-law. | 21 | Since 1996 | ||||||||||||||||||
| Dean Junkans Year of Birth: 1959 | Director | Until next election of directors | C.F.A; Chief Investment Officer at Wells Fargo Private Bank from 2004 to 2014 and Chief Investment Officer of the Wealth, Brokerage and Retirement group at Wells Fargo & Company from 2011 to 2014; Member and former Chair, Claritas Advisory Committee at the CFA Institute since 2013; Board Member and Investment Committee member, Bethel University Foundation since 2010; Corporate Executive Board Member, National Chief Investment Officers Circle since 2010; formerly, Member of the Board of Governors of the University of Wisconsin Foundation, River Falls, 1996 to 2004; U.S. Army Veteran, Gulf War. | 16 | Since 2015 | ||||||||||||||||||
(table continued on next page)
37
COHEN & STEERS ACTIVE COMMODITIES STRATEGY FUND, INC.
(table continued from previous page)
| Name, Address1 and Year of Birth | Position(s) Held With Fund | Term of Office2 | Principal Occupation During At Least The Past 5 Years (Including Other Directorships Held) | Number of Funds Within Fund Complex Overseen by Director (Including the Fund) | Length of Time Served3 | ||||||||||||||||||
| Richard E. Kroon Year of Birth: 1942 | Director | Until next election of directors | Member of Investment Committee, Monmouth University since 2004; Former Director, Retired Chairman and Managing Partner of Sprout Group venture capital funds, then an affiliate of Donaldson, Lufkin and Jenrette Securities Corporation from 1981 to 2001. Former chairman of the National Venture Capital Association for the year 2000. | 21 | Since 2004 | ||||||||||||||||||
| Richard J. Norman Year of Birth: 1943 | Director | Until next election of directors | Private Investor. Member, Montgomery County, Maryland Department of Corrections Volunteer Corps. since February 2010; Liason for Business Leadership, Salvation Army World Service Organization (SAWSO) since 2010; Advisory Board Member, The Salvation Army since 1985; Prior thereto, Investment Representative of Morgan Stanley Dean Witter from 1966 to 2000. | 21 | Since 2001 | ||||||||||||||||||
(table continued on next page)
38
COHEN & STEERS ACTIVE COMMODITIES STRATEGY FUND, INC.
(table continued from previous page)
| Name, Address1 and Year of Birth | Position(s) Held With Fund | Term of Office2 | Principal Occupation During At Least The Past 5 Years (Including Other Directorships Held) | Number of Funds Within Fund Complex Overseen by Director (Including the Fund) | Length of Time Served3 | ||||||||||||||||||
| Frank K. Ross Year of Birth: 1943 | Director | Until next election of directors | Visiting Professor of Accounting and Director of the Center for Accounting Education at Howard University School of Business since 2004; Board member and member of Audit Committee (Chairman from 2007 to 2012) and Human Resources and Compensation Committee, Pepco Holdings, Inc. (electric utility) from 2004 to 2014; Formerly, Mid-Atlantic Area Managing Partner for Assurance Services at KPMG LLP and Managing Partner of its Washington, DC offices from 1977 to 2003. | 21 | Since 2004 | ||||||||||||||||||
| C. Edward Ward, Jr. Year of Birth: 1946 | Director | Until next election of directors | Member of The Board of Trustees of Manhattan College, Riverdale, New York from 2004 to 2014. Formerly Director of closed-end fund management for the New York Stock Exchange (the NYSE) where he worked from 1979 to 2004. | 21 | Since 2004 | ||||||||||||||||||
1 The address for each director is 280 Park Avenue, New York, NY 10017.
2 On March 12, 2008, the Board of Directors adopted a mandatory retirement policy stating a Director must retire from the Board on December 31st of the year in which he or she turns 75 years of age.
3 The length of time served represents the year in which the Director was first elected or appointed to any fund in the Cohen & Steers fund complex.
4 "Interested person", as defined in the 1940 Act, of the Fund because of affiliation with CSCM (Interested Directors).
39
COHEN & STEERS ACTIVE COMMODITIES STRATEGY FUND, INC.
The officers of the Fund (other than Messrs. Cohen and Harvey, whose biographies are provided above), their address, their year of birth and their principal occupations for at least the past five years are set forth below.
| Name, Address and Year of Birth1 | Position(s) Held With Fund | Principal Occupation During At Least the Past Five Years | Length of Time Served2 | ||||||||||||
| Adam M. Derechin Year of Birth: 1964 | President and Chief Executive Officer | Chief Operating Officer of CSCM (since 2003) and CNS (since 2004). | Since 2005 | ||||||||||||
| Nicholas Koutsoftas Year of Birth: 1973 | Vice President | Senior Vice President of CSCM since 2013. Prior to that, Senior Vice President, co-portfolio manager and head of the Active Commodities strategy at GE Asset Management. | Since 2013 | ||||||||||||
| Ben Ross Year of Birth: 1971 | Vice President | Senior Vice President of CSCM since 2013. Prior to that, co-portfolio manager at GE Asset Management of the GE Active Commodities strategy since its 2006 inception. | Since 2013 | ||||||||||||
| Francis C. Poli Year of Birth: 1962 | Secretary | Executive Vice President, Secretary and General Counsel of CSCM and CNS since March 2007. | Since 2007 | ||||||||||||
| James Giallanza Year of Birth: 1966 | Treasurer and Chief Financial Officer | Executive Vice President of CSCM since 2014 and prior to that Senior Vice President of CSCM since 2006. | Since 2006 | ||||||||||||
| Lisa D. Phelan Year of Birth: 1968 | Chief Compliance Officer | Executive Vice President of CSCM since 2015 and prior to that, Senior Vice President of CSCM since 2008. Chief Compliance Officer of CSCM, the Cohen & Steers funds, Cohen & Steers Asia Limited and CSSL since 2007, 2006, 2005 and 2004, respectively. | Since 2006 | ||||||||||||
| Heather Kaden Year of Birth: 1975 | Deputy Chief Compliance Officer | Senior Vice President of CSCM since 2015. Prior to that, Vice President of CSCM since 2010 and Compliance Officer of Cohen & Steers UK, Limited since 2013. | Since 2014 | ||||||||||||
| Tina M. Payne Year of Birth: 1974 | Assistant Secretary | Senior Vice President and Associate General Counsel of CSCM since 2010. Prior to that Vice President and Associate General Counsel since July 2007. | Since 2007 | ||||||||||||
| Neil Bloom Year of Birth: 1970 | Assistant Treasurer | Vice President of CSCM since August 2008. | Since 2009 | ||||||||||||
1 The address for each officer is 280 Park Avenue, New York, NY 10017.
2 Officers serve one-year terms. The length of time served represents the year in which the officer was first elected to that position in any fund in the Cohen & Steers fund complex. All of the officers listed above are officers of one or more or the other funds in the complex.
40
COHEN & STEERS ACTIVE COMMODITIES STRATEGY FUND, INC.
Cohen & Steers Privacy Policy
Facts | What Does Cohen & Steers Do With Your Personal Information? | ||||||
Why? | Financial companies choose how they share your personal information. Federal law gives consumers the right to limit some but not all sharing. Federal law also requires us to tell you how we collect, share, and protect your personal information. Please read this notice carefully to understand what we do. | ||||||
What? | The types of personal information we collect and share depend on the product or service you have with us. This information can include: • Social Security number and account balances • Transaction history and account transactions • Purchase history and wire transfer instructions | ||||||
How? | All financial companies need to share customers' personal information to run their everyday business. In the section below, we list the reasons financial companies can share their customers' personal information; the reasons Cohen & Steers chooses to share; and whether you can limit this sharing. | ||||||
Reasons we can share your personal information | Does Cohen & Steers share? | Can you limit this sharing? | |||||||||
| For our everyday business purposes— such as to process your transactions, maintain your account(s), respond to court orders and legal investigations, or reports to credit bureaus | Yes | No | |||||||||
| For our marketing purposes— to offer our products and services to you | Yes | No | |||||||||
For joint marketing with other financial companies— | No | We don't share | |||||||||
| For our affiliates' everyday business purposes— information about your transactions and experiences | No | We don't share | |||||||||
| For our affiliates' everyday business purposes— information about your creditworthiness | No | We don't share | |||||||||
For our affiliates to market to you— | No | We don't share | |||||||||
For non-affiliates to market to you— | No | We don't share | |||||||||
Questions? Call 800-330-7348
41
COHEN & STEERS ACTIVE COMMODITIES STRATEGY FUND, INC.
Cohen & Steers Privacy Policy—(Continued)
Who we are | |||||||
Who is providing this notice? | Cohen & Steers Capital Management, Inc., Cohen & Steers Asia Limited, Cohen & Steers UK Limited, Cohen & Steers Securities, LLC, Cohen & Steers Private Funds and Cohen & Steers Open- and Closed-End Funds (collectively, Cohen & Steers). | ||||||
What we do | |||||||
How does Cohen & Steers protect my personal information? | To protect your personal information from unauthorized access and use, we use security measures that comply with federal law. These measures include computer safeguards and secured files and buildings. We restrict access to your information to those employees who need it to perform their jobs, and also require companies that provide services on our behalf to protect your information. | ||||||
How does Cohen & Steers collect my personal information? | We collect your personal information, for example, when you: • Open an account or buy securities from us • Provide account information or give us your contact information • Make deposits or withdrawals from your account We also collect your personal information from other companies. | ||||||
Why can't I limit all sharing? | Federal law gives you the right to limit only: • sharing for affiliates' everyday business purposes—information about your creditworthiness • affiliates from using your information to market to you • sharing for non-affiliates to market to you State law and individual companies may give you additional rights to limit sharing. | ||||||
Definitions | |||||||
Affiliates | Companies related by common ownership or control. They can be financial and nonfinancial companies. • Cohen & Steers does not share with affiliates. | ||||||
Non-affiliates | Companies not related by common ownership or control. They can be financial and nonfinancial companies. • Cohen & Steers does not share with non-affiliates. | ||||||
Joint marketing | A formal agreement between non-affiliated financial companies that together market financial products or services to you. • Cohen & Steers does not jointly market. | ||||||
42
COHEN & STEERS ACTIVE COMMODITIES STRATEGY FUND, INC.
Cohen & Steers Investment Solutions
COHEN & STEERS GLOBAL REALTY SHARES
• Designed for investors seeking total return, investing primarily in global real estate equity securities
• Symbols: CSFAX, CSFCX, CSSPX, GRSRX, CSFZX
COHEN & STEERS INSTITUTIONAL REALTY SHARES
• Designed for institutional investors seeking total return, investing primarily in U.S. real estate securities
• Symbol: CSRIX
COHEN & STEERS REAL ESTATE SECURITIES FUND
• Designed for investors seeking total return, investing primarily in U.S. real estate securities
• Symbols: CSEIX, CSCIX, CSDIX, CIRRX, CSZIX
COHEN & STEERS INTERNATIONAL REALTY FUND
• Designed for investors seeking total return, investing primarily in international real estate securities
• Symbols: IRFAX, IRFCX, IRFIX
COHEN & STEERS REALTY SHARES
• Designed for investors seeking total return, investing primarily in U.S. real estate securities
• Symbol: CSRSX
COHEN & STEERS
INSTITUTIONAL GLOBAL REALTY SHARES
• Designed for institutional investors seeking total return, investing primarily in global real estate securities
• Symbol: GRSIX
COHEN & STEERS GLOBAL INFRASTRUCTURE FUND
• Designed for investors seeking total return, investing primarily in global infrastructure securities
• Symbols: CSUAX, CSUCX, CSUIX, CSURX, CSUZX
COHEN & STEERS DIVIDEND VALUE FUND
• Designed for investors seeking long-term growth of income and capital appreciation, investing primarily in dividend paying common stocks and preferred stocks
• Symbols: DVFAX, DVFCX, DVFIX, DVFRX, DVFZX
COHEN & STEERS
PREFERRED SECURITIES AND INCOME FUND
• Designed for investors seeking total return (high current income and capital appreciation), investing primarily in preferred and debt securities
• Symbols: CPXAX, CPXCX, CPXIX, CPRRX, CPXZX
COHEN & STEERS REAL ASSETS FUND
• Designed for investors seeking total return and the maximization of real returns during inflationary environments by investing primarily in real assets
• Symbols: RAPAX, RAPCX, RAPIX, RAPRX, RAPZX
COHEN & STEERS
MLP & ENERGY OPPORTUNITY FUND
• Designed for investors seeking total return, investing primarily in midstream energy master limited partnership (MLP) units and related stocks
• Symbols: MLOAX, MLOCX, MLOIX, MLORX, MLOZX
COHEN & STEERS
ACTIVE COMMODITIES STRATEGY FUND
• Designed for investors seeking total return, investing primarily in a diversified portfolio of exchange-traded commodity future contracts and other commodity-related derivative instruments
• Symbols: CDFAX, CDFCX, CDFIX, CDFRX, CDFZX
Distributed by Cohen & Steers Securities, LLC.
COHEN & STEERS GLOBAL REALTY MAJORS ETF
• Designed for investors who seek a relatively low-cost passive approach for investing in a portfolio of real estate equity securities of companies in a specified index
• Symbol: GRI
Distributed by ALPS Distributors, Inc.
ISHARES COHEN & STEERS
REALTY MAJORS INDEX FUND
• Designed for investors who seek a relatively low-cost passive approach for investing in a portfolio of real estate equity securities of companies in a specified index
• Symbol: ICF
Distributed by SEI Investments Distribution Co.
Please consider the investment objectives, risks, charges and expenses of the fund carefully before investing. A summary prospectus and prospectus containing this and other information can be obtained by calling 800-330-7348 or by visiting cohenandsteers.com. Please read the summary prospectus and prospectus carefully before investing.
43
COHEN & STEERS ACTIVE COMMODITIES STRATEGY FUND, INC.
OFFICERS AND DIRECTORS
Robert H. Steers
Director and Chairman
Joseph M. Harvey
Director and Vice President
Michael G. Clark
Director
Bonnie Cohen
Director
George Grossman
Director
Dean Junkans
Director
Richard E. Kroon
Director
Richard J. Norman
Director
Frank K. Ross
Director
C. Edward Ward, Jr.
Director
Adam M. Derechin
President and Chief Executive Officer
Nick Koutsoftas
Vice President
Ben Ross
Vice President
Francis C. Poli
Secretary
James Giallanza
Treasurer and Chief Financial Officer
Lisa D. Phelan
Chief Compliance Officer
Heather Kaden
Deputy Chief Compliance Officer
Tina M. Payne
Assistant Secretary
Neil Bloom
Assistant Treasurer
KEY INFORMATION
Investment Advisor
Cohen & Steers Capital Management, Inc.
280 Park Avenue
New York, NY 10017
(212) 832-3232
Co-administrator and Custodian
State Street Bank and Trust Company
One Lincoln Street
Boston, MA 02111
Transfer Agent
Boston Financial Data Services, Inc.
30 Dan Road
Canton, MA 02021
(800) 437-9912
Legal Counsel
Ropes & Gray LLP
1211 Avenue of the Americas
New York, NY 10036
Distributor
Cohen & Steers Securities, LLC
280 Park Avenue
New York, NY 10017
Nasdaq Symbol: Class A—CDFAX
Class C—CDFCX
Class I—CDFIX
Class R—CDFRX
Class Z—CDFZX
Website: cohenandsteers.com
This report is authorized for delivery only to shareholders of Cohen & Steers Active Commodities Strategy Fund, Inc. unless accompanied or preceded by the delivery of a currently effective prospectus setting forth details of the Fund. Performance data quoted represent past performance. Past performance is no guarantee of future results and your investment may be worth more or less at the time you sell your shares.
44
COHEN & STEERS
ACTIVE COMMODITIES STRATEGY FUND
280 PARK AVENUE
NEW YORK, NY 10017
eDelivery NOW AVAILABLE
Stop traditional mail delivery; receive your shareholder reports and prospectus online.
Sign up at cohenandsteers.com
CDFAXAR

Annual Report April 30, 2015
Cohen & Steers Active Commodities Strategy Fund
Item 2. Code of Ethics.
The Registrant has adopted an Amended and Restated Code of Ethics that applies to its Principal Executive Officer and Principal Financial Officer. The Code of Ethics was in effect during the reporting period. The Registrant has not amended the Code of Ethics as described in Form N-CSR during the reporting period. The Registrant has not granted any waiver, including an implicit waiver, from a provision of the Code of Ethics as described in Form N-CSR during the reporting period. A current copy of the Code of Ethics is available on the Registrant’s website at www.cohenandsteers.com/assets/content/uploads/code_of_ethics_exec_and_senior.pdf. Upon request, a copy of the Code of Ethics can be obtained free of charge by calling 800-330-7348 or writing to the Secretary of the Registrant, 280 Park Avenue, 10th floor, New York, NY 10017.
Item 3. Audit Committee Financial Expert.
The registrant’s board has determined that Michael G. Clark and Frank K. Ross, each a member of the board’s audit committee, each are an “audit committee financial expert”. Mr. Clark and Mr. Ross are each “independent,” as such term is defined in Form N-CSR.
Item 4. Principal Accountant Fees and Services.
(a) – (d) Aggregate fees billed to the registrant for the period ended April 30, 2015 (the registrant commenced operations on May 1, 2014) for professional services rendered by the registrant’s principal accountant were as follows:
|
| 2015 |
| |
Audit Fees |
| $ | 42,500 |
|
Audit-Related Fees |
| $ | 0 |
|
Tax Fees |
| $ | 6,400 |
|
All Other Fees |
| $ | 0 |
|
Audit-related fees were billed in connection with agreed upon procedures performed by the registrant’s principal accountant relating to after-tax return calculations. Tax fees were billed in connection with the preparation of tax returns, calculation and designation of dividends and other miscellaneous tax services.
(e)(1) The audit committee is required to pre-approve audit and non-audit services performed for the registrant by the principal accountant. The audit committee also is required to pre-approve non-audit services performed by the registrant’s principal accountant for the registrant’s investment advisor and any sub-advisor (not including any sub-advisor whose role is primarily portfolio management and is subcontracted with or overseen by another investment advisor) and/or to any entity controlling, controlled by or under common control with the registrant’s investment advisor that provides ongoing services to the registrant, if the engagement for services relates directly to the operations and financial reporting of the registrant.
The audit committee may delegate pre-approval authority to one or more of its members who are independent members of the board of directors of the registrant. The member or members to
whom such authority is delegated shall report any pre-approval decisions to the audit committee at its next scheduled meeting. The audit committee may not delegate its responsibility to pre-approve services to be performed by the registrant’s principal accountant to the investment advisor.
(e)(2) No services included in (b) – (d) above were approved by the audit committee pursuant to paragraphs (c)(7)(i)(C) of Rule 2-01 of Regulation S-X.
(f) Not applicable.
(g) For the period ended April 30, 2015 (the registrant commenced operations on May 1, 2014), the aggregate fees billed by the registrant’s principal accountant for non-audit services rendered to the registrant and for non-audit services rendered to the registrant’s investment advisor (not including any sub-advisor whose role is primarily portfolio management and is subcontracted with or overseen by another investment advisor) and/or to any entity controlling, controlled by or under common control with the registrant’s investment advisor that provides ongoing services to the registrant were:
|
| 2015 |
| |
Registrant |
| $ | 6,400 |
|
Investment Advisor |
| $ | 15,000 |
|
(h) The registrant’s audit committee considered whether the provision of non-audit services that were rendered to the registrant’s investment advisor (not including any sub-advisor whose role is primarily portfolio management and is subcontracted with or overseen by another investment advisor) and/or to any entity controlling, controlled by or under common control with the registrant’s investment advisor that provides ongoing services to the registrant that were not required to be pre-approved pursuant to paragraph (c)(7)(ii) of Rule 2-01 of Regulation S-X was compatible with maintaining the principal accountant’s independence.
Item 5. Audit Committee of Listed Registrants.
Not Applicable.
Item 6. Schedule of Investments.
Included in Item 1 above.
Item 7. Disclosure of Proxy Voting Policies and Procedures for Closed-End Management Investment Companies.
Not Applicable.
Item 8. Portfolio Managers of Closed-End Investment Companies.
Not Applicable.
Item 9. Purchases of Equity Securities by Closed-End Management Investment Company and Affiliated Purchasers.
Not Applicable.
Item 10. Submission of Matters to a Vote of Security Holders.
None.
Item 11. Controls and Procedures.
(a) The registrant’s principal executive officer and principal financial officer have concluded that the registrant’s disclosure controls and procedures are reasonably designed to ensure that information required to be disclosed by the registrant in this Form N-CSR was recorded, processed, summarized and reported within the time periods specified in the Securities and Exchange Commission’s rules and forms, based upon such officers’ evaluation of these controls and procedures as of a date within 90 days of the filing date of this report.
(b) There were no changes in the registrant’s internal control over financial reporting that occurred during the second fiscal quarter of the period covered by this report that have materially affected, or are reasonably likely to materially affect, the registrant’s internal control over financial reporting.
Item 12. Exhibits.
(a)(1) Not applicable.
(a)(2) Certifications of principal executive officer and principal financial officer as required by Rule 30a-2(a) under the Investment Company Act of 1940.
(a)(3) Not applicable.
(b) Certifications of principal executive officer and principal financial officer as required by Rule 30a- 2(b) under the Investment Company Act of 1940.
SIGNATURES
Pursuant to the requirements of the Securities Exchange Act of 1934 and the Investment Company Act of 1940, the registrant has duly caused this report to be signed on its behalf by the undersigned, thereunto duly authorized.
COHEN & STEERS ACTIVE COMMODITIES STRATEGY FUND, INC. | |||
| |||
|
|
| |
| By: | /s/ Adam M. Derechin |
|
|
| Name: Adam M. Derechin |
|
|
| Title: President and Chief Executive Officer |
|
|
|
| |
| Date: June 30, 2015 |
| |
Pursuant to the requirements of the Securities Exchange Act of 1934 and the Investment Company Act of 1940, this report has been signed below by the following persons on behalf of the registrant and in the capacities and on the dates indicated.
| By: | /s/ Adam M. Derechin |
| |
|
| Name: | Adam M. Derechin | �� |
|
| Title: | President and Chief Executive Officer |
|
|
|
| (Principal Executive Officer) |
|
|
|
|
|
|
| By: | /s/ James Giallanza |
| |
|
| Name: | James Giallanza |
|
|
| Title: | Treasurer and Chief Financial Officer |
|
|
|
| (Principal Financial Officer) |
|
|
|
|
|
|
|
|
|
|
|
| Date: June 30, 2015 |
| ||