Exhibit 99.2
© 2016 Superior Drilling Products Second Quarter 2016 Financial Results Conference Call August 12, 2016 NYSE MKT: SDPI
© 2016 Superior Drilling Products 2 Safe Harbor Statement These slides and the accompanying oral presentation contain “forward - looking statements” within the meaning of the safe harbor provisions, 15 U.S.C. † 78u - 5, of the Private Securities Litigation Reform Act of 1995. All statements, other than statements of historical fact included in these slides and the accompanying oral presentation, regarding our strategy, future operations, financial position, estimated revenue and losses, projected costs, prospects, plans and objectives of management, are forward - looking statements. The use of words “could,” “believe,” “anticipate,” “intend,” “estimate,” “expect,” “may,” “continue,” “predict,” “potential,” “project”, “forecast,” “should” or “plan, and similar expressions are intended to identify forward - looking statements, although not all forward - looking statements contain such identifying words. Certain statements in these slides and the accompanying oral presentation may constitute forward - looking statements, including statements regarding the Company’s financial position, market success with specialized tools, effectiveness of its sales efforts, success at developing future tools, and the Company’s effectiveness at executing its business strategy and plans. These statements reflect the beliefs and expectations of the Company and are subject to risks and uncertainties that may cause actual results to differ materially. These risks and uncertainties include, among other factors, our business strategy and prospects for growth; our cash flows and liquidity; our financial strategy, budget, projections and operating results; the amount, nature and timing of capital expenditures; the availability and terms of capital; competition and government regulations; and general economic conditions. These and other factors could adversely affect the outcome and financial effects of the Company’s plans and described herein. Therefore, you should not rely on any of these forward - looking statements. Any forward - looking statement made by us in these slides and the accompanying oral presentation is based only on information currently available to us and speaks only as of the date on which it is made. We undertake no obligation to publicly update any forward - looking statement, whether written or oral, that may be made from time to time, whether as a result of new information, future developments or otherwise.

© 2016 Superior Drilling Products Troy Meier Chairman and Chief Executive Officer
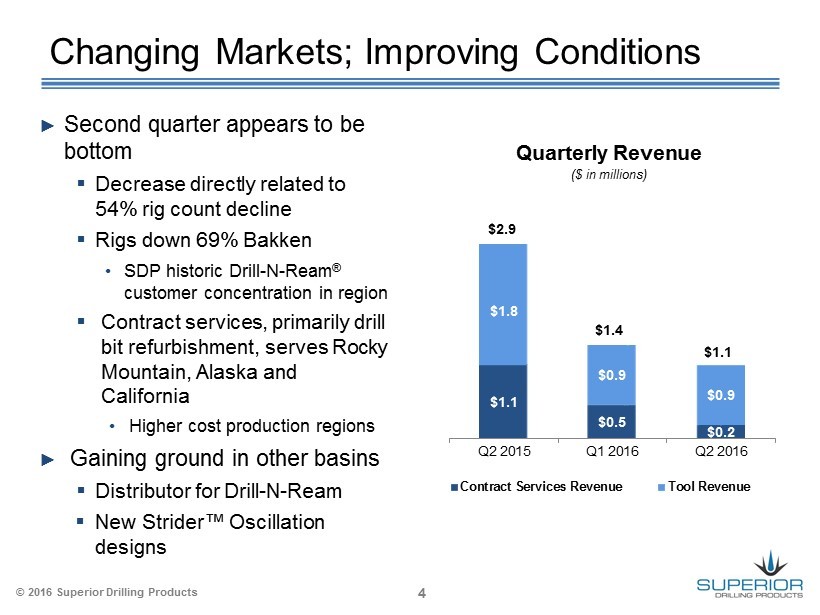
© 2016 Superior Drilling Products 4 $1.1 $0.5 $0.2 $1.8 $0.9 $0.9 Q2 2015 Q1 2016 Q2 2016 Contract Services Revenue Tool Revenue Changing Markets; Improving Conditions ► Second quarter appears to be bottom ▪ Decrease directly related to 54 % rig count decline ▪ Rigs down 69 % Bakken • SDP historic Drill - N - Ream ® customer concentration in region ▪ Contract services, primarily drill bit refurbishment, serves Rocky Mountain, Alaska and California • Higher cost production regions ► Gaining ground in other basins ▪ Distributor for Drill - N - Ream ▪ New Strider™ Oscillation designs ($ in millions) Quarterly Revenue $2.9 $1.4 $ 1.1
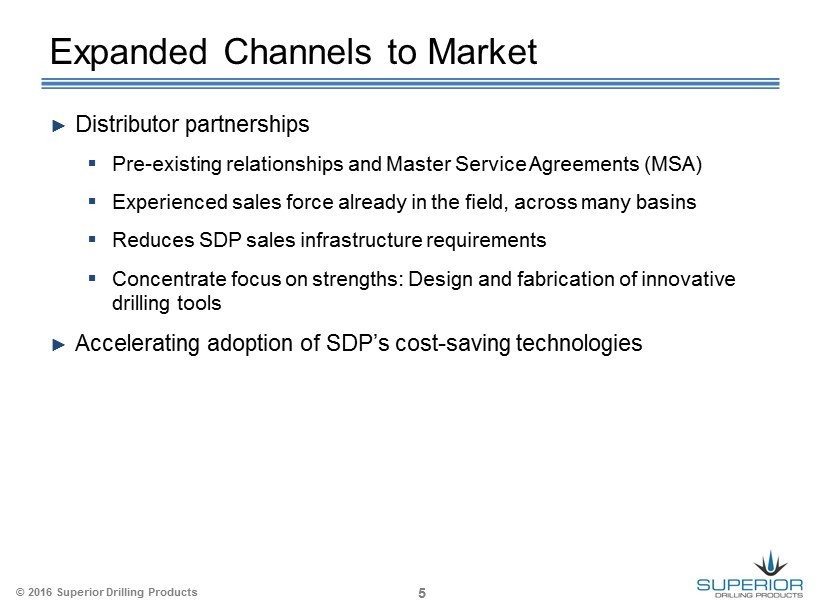
© 2016 Superior Drilling Products 5 ► Distributor partnerships ▪ Pre - existing relationships and Master Service Agreements (MSA) ▪ Experienced sales force already in the field, across many basins ▪ Reduces SDP sales infrastructure requirements ▪ Concentrate focus on strengths: Design and fabrication of innovative drilling tools ► Accelerating adoption of SDP’s cost - saving technologies Expanded Channels to Market
© 2016 Superior Drilling Products 6 ► Drill - N - Ream validating tool’s benefits and capabilities ▪ Sold initial $500 thousand of tools to DTI in May ▪ In June, sold $134 thousand in used tools to DTI ▪ July purchase of $500 thousand completed, and September purchase in production ► Steady adoption in Permian Basin ▪ Major operator potentially standardizing on tool ▪ More potential with DTI customer base Drill - N - Ream: Strengthening Market Position 1 Exclusivity is subject to DTI achieving certain market penetration rates
© 2016 Superior Drilling Products 7 ► Strider Oscillation System redesign: Mono - bore ▪ Unique sealed gear system ▪ Broadened applications: • Multiple drilling fluids: brine & silica sands ▪ Simplification • Tool inventory & manufacturing processes ▪ Reduces potential of application error ► Thru Tubing Strider Oscillation System ▪ Patent - pending rotational drive coupling ▪ Expands addressable market: completions ▪ Successes with initial runs in Bakken • Engaged with major coiled tubing operators ▪ Reduces rig change out requirement Strider : Advanced Technologies
© 2016 Superior Drilling Products Financial Results Chris Cashion Chief Financial Officer
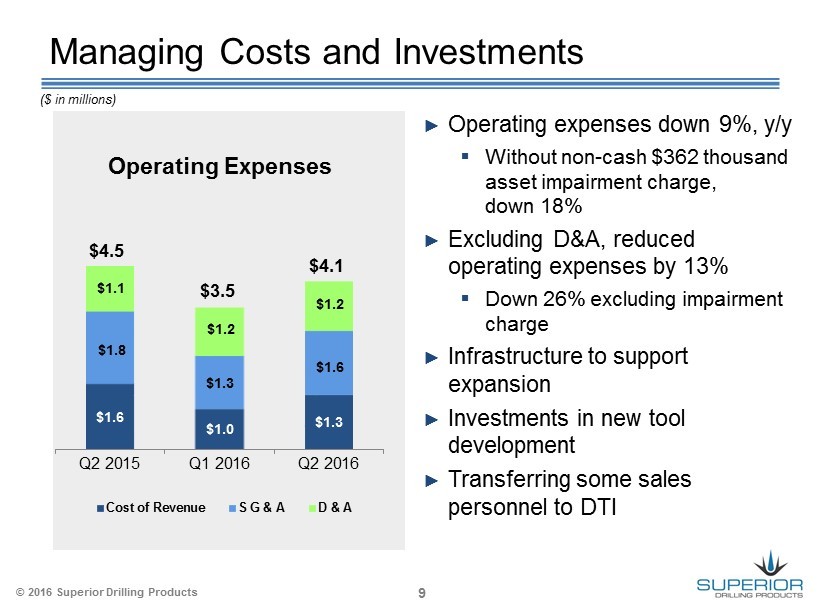
© 2016 Superior Drilling Products 9 $1.6 $1.0 $1.3 $1.8 $1.3 $1.6 $1.1 $1.2 $1.2 Q2 2015 Q1 2016 Q2 2016 Cost of Revenue S G & A D & A $4.5 $3.5 $ 4.1 Managing Costs and Investments ► Operating expenses down 9 %, y/y ▪ Without non - cash $362 thousand asset impairment charge, down 18% ► Excluding D&A, reduced operating expenses by 13 % ▪ Down 26% excluding impairment charge ► Infrastructure to support expansion ► Investments in new tool development ► Transferring some sales personnel to DTI Operating Expenses ($ in millions)
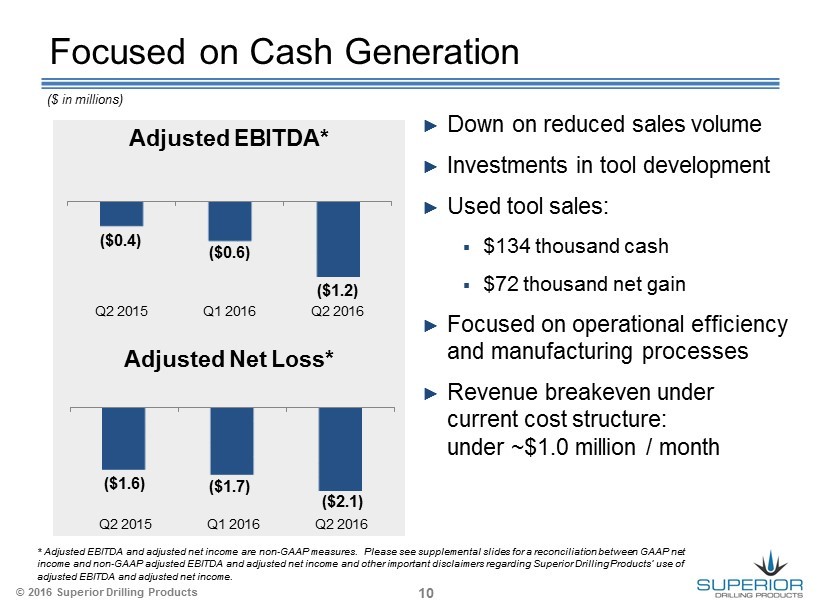
© 2016 Superior Drilling Products 10 Focused on Cash Generation ($0.4) ($0.6) ($1.2) Q2 2015 Q1 2016 Q2 2016 ► Down on reduced sales volume ► Investments in tool development ► Used tool sales: ▪ $134 thousand cash ▪ $72 thousand net gain ► Focused on operational efficiency and manufacturing processes ► Revenue breakeven under current cost structure: under ~$1.0 million / month Adjusted EBITDA* * Adjusted EBITDA and adjusted net income are non - GAAP measures. Please see supplemental slides for a reconciliation between GA AP net income and non - GAAP adjusted EBITDA and adjusted net income and other important disclaimers regarding Superior Drilling Products ’ use of adjusted EBITDA and adjusted net income. ($ in millions) Adjusted Net Loss* ($1.6) ($1.7) ($2.1) Q2 2015 Q1 2016 Q2 2016
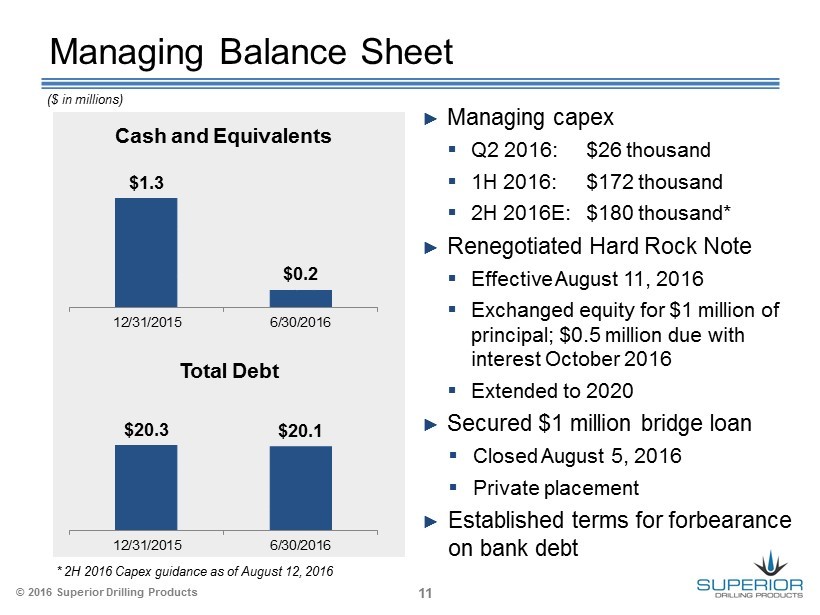
© 2016 Superior Drilling Products 11 Managing Balance Sheet ► Managing capex ▪ Q2 2016: $26 thousand ▪ 1H 2016: $172 thousand ▪ 2H 2016E : $180 thousand* ► Renegotiated Hard Rock Note ▪ Effective August 11, 2016 ▪ Exchanged equity for $1 million of principal; $0.5 million due with interest October 2016 ▪ Extended to 2020 ► Secured $ 1 million bridge loan ▪ Closed August 5, 2016 ▪ Private placement ► Established terms for forbearance on bank debt Cash and Equivalents Total Debt $20.3 $20.1 12/31/2015 6/30/2016 ($ in millions) $1.3 $0.2 12/31/2015 6/30/2016 * 2H 2016 Capex guidance as of August 12, 2016

© 2016 Superior Drilling Products Overview and Outlook Troy Meier Chairman and Chief Executive Officer
© 2016 Superior Drilling Products 13 Strategy and Outlook ► Modestly improving market conditions ▪ Helps to drive opportunities ► Drill - N - Ream gaining market share with new channel to market ► Two exciting Strider tools ▪ New mono bore design: addresses channel partner’s requirements ▪ Thru tubing and completion drilling market ► Focusing on productivity in product development & manufacturing ► Protecting new intellectual property
© 2016 Superior Drilling Products Supplemental Information
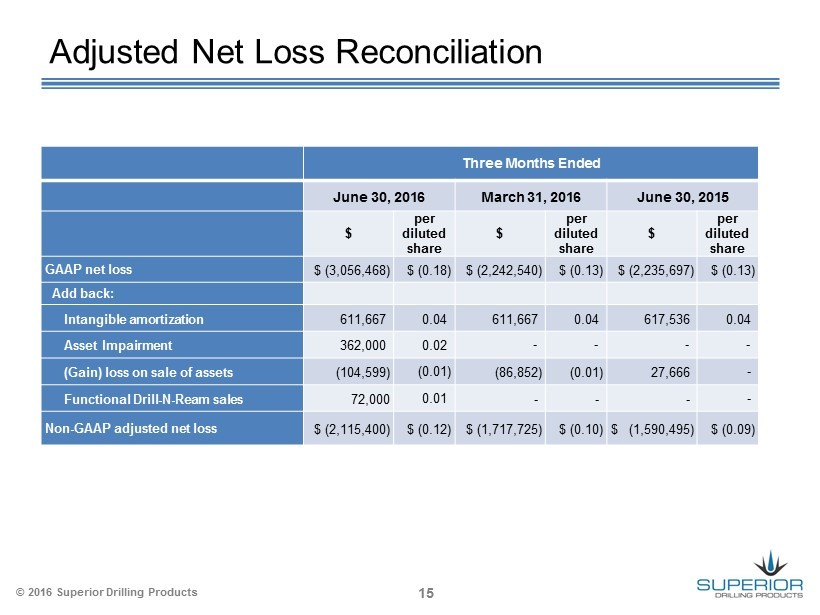
© 2016 Superior Drilling Products 15 Adjusted Net Loss Reconciliation Three Months Ended June 30, 2016 March 31, 2016 June 30, 2015 $ per diluted share $ per diluted share $ per diluted share GAAP net loss $ (3,056,468) $ ( 0.18) $ (2,242,540) $ (0.13) $ (2,235,697) $ ( 0.13) Add back: Intangible amortization 611,667 0.04 611,667 0.04 617,536 0.04 Asset Impairment 362,000 0.02 - - - - (Gain) loss on sale of assets (104,599) (0.01) (86,852) (0.01) 27,666 - Functional Drill - N - Ream sales 72,000 0.01 - - - - Non - GAAP adjusted net loss $ (2,115,400) $ ( 0.12) $ (1,717,725) $ (0.10) $ (1,590,495) $ ( 0.09)
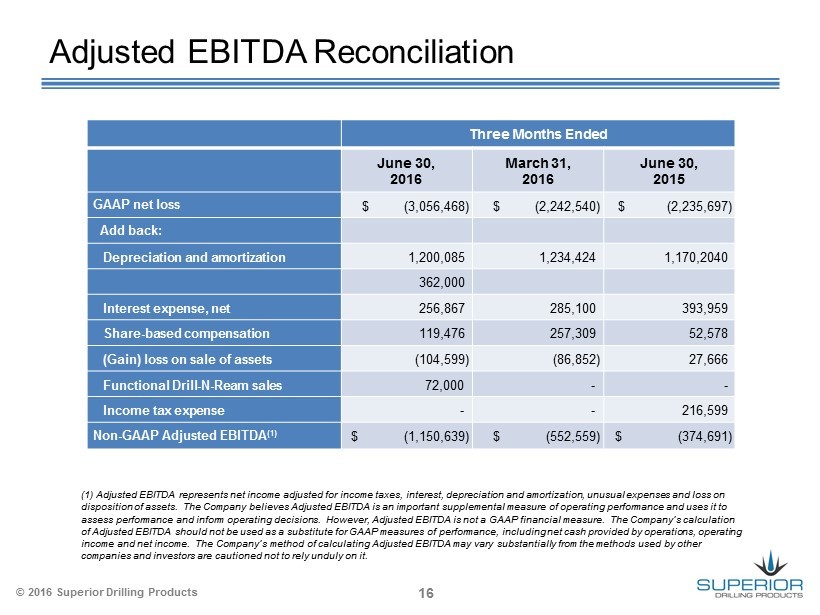
© 2016 Superior Drilling Products 16 Adjusted EBITDA Reconciliation (1) Adjusted EBITDA represents net income adjusted for income taxes, interest, depreciation and amortization, unusual expense s a nd loss on disposition of assets. The Company believes Adjusted EBITDA is an important supplemental measure of operating performance an d u ses it to assess performance and inform operating decisions. However, Adjusted EBITDA is not a GAAP financial measure. The Company’s cal culation of Adjusted EBITDA should not be used as a substitute for GAAP measures of performance, including net cash provided by operat ion s, operating income and net income. The Company’s method of calculating Adjusted EBITDA may vary substantially from the methods used by o the r companies and investors are cautioned not to rely unduly on it. Three Months Ended June 30, 2016 March 31, 2016 June 30, 2015 GAAP net loss $ (3,056,468) $ (2,242,540) $ (2,235,697) Add back: Depreciation and amortization 1,200,085 1,234,424 1,170,2040 362,000 Interest expense, net 256,867 285,100 393,959 Share - based compensation 119,476 257,309 52,578 (Gain) loss on sale of assets (104,599) (86,852) 27,666 Functional Drill - N - Ream sales 72,000 - - Income tax expense - - 216,599 Non - GAAP Adjusted EBITDA (1) $ (1,150,639) $ (552,559) $ (374,691)