As filed with the Securities and Exchange Commission on September 1, 2015
Registration No. 333-205902
SECURITIES AND EXCHANGE COMMISSION
WASHINGTON, D.C. 20549
Amendment No. 1
to
FORM S-1
REGISTRATION STATEMENT
UNDER
THE SECURITIES ACT OF 1933
GMS INC.
(Exact name of registrant as specified in its charter)
| Delaware (State or other jurisdiction of incorporation or organization) | 5030 (Primary Standard Industrial Classification Code Number) | 46-2931287 (I.R.S. Employer Identification No.) |
100 Crescent Centre Parkway, Suite 800
Tucker, Georgia 30084
(800) 392-4619
(Address, including zip code, and telephone number, including area code, of registrant's principal executive offices)
G. Michael Callahan, Jr.
Chief Executive Officer
GMS Inc.
100 Crescent Centre Parkway, Suite 800
Tucker, Georgia 30084
(800) 392-4619
(Name, address, including zip code, and telephone number including area code, of agent for service)
| Copies of all communications, including communications sent to agent for service, should be sent to: | ||
Andrew B. Barkan, Esq. Fried, Frank, Harris, Shriver & Jacobson LLP One New York Plaza New York, New York 10004 (212) 859-8000 | Peter J. Loughran, Esq. Debevoise & Plimpton LLP 919 Third Avenue New York, New York 10022 (212) 909-6000 | |
Approximate date of commencement of proposed sale to the public:
As soon as practicable after this Registration Statement becomes effective.
If any of the securities being registered on this Form are to be offered on a delayed or continuous basis pursuant to Rule 415 under the Securities Act of 1933, check the following box. o
If this Form is filed to register additional securities for an offering pursuant to Rule 462(b) under the Securities Act of 1933, please check the following box and list the Securities Act registration statement number of the earlier effective registration statement for the same offering. o
If this Form is a post-effective amendment filed pursuant to Rule 462(c) under the Securities Act, check the following box and list the Securities Act registration statement number of the earlier effective registration statement for the same offering. o
If this Form is a post-effective amendment filed pursuant to Rule 462(d) under the Securities Act, check the following box and list the Securities Act registration statement number of the earlier effective registration statement for the same offering. o
Indicate by check mark whether the registrant is a large accelerated filer, an accelerated filer, a non-accelerated filer, or a smaller reporting company. See the definitions of "large accelerated filer," "accelerated filer" and "smaller reporting company" in Rule 12b-2 of the Exchange Act. (Check One):
| Large accelerated filer o | Accelerated filer o | Non-accelerated filer ý | Smaller reporting company o |
CALCULATION OF REGISTRATION FEE
| Title of Each Class of Securities to be Registered | Proposed Maximum Aggregate Offering Price(1)(2) | Amount of Registration Fee(3) | ||
|---|---|---|---|---|
Common Stock, par value $0.01 per share | $200,000,000 | $23,240 | ||
| ||||
- (1)
- Estimated solely for the purpose of calculating the registration fee in accordance with Rule 457(o) under the Securities Act of 1933.
- (2)
- Includes the offering price of common stock that may be purchased by the underwriters upon the exercise of their option to purchase additional shares.
- (3)
- The Registrant previously paid $23,240 in connection with a prior filing of this Registration Statement on July 28, 2015.
The Registrant hereby amends this Registration Statement on such date or dates as may be necessary to delay its effective date until the Registrant shall file a further amendment which specifically states that this Registration Statement shall thereafter become effective in accordance with Section 8(a) of the Securities Act of 1933 or until this Registration Statement shall become effective on such date as the Commission, acting pursuant to said Section 8(a), may determine.
The information in this prospectus is not complete and may be changed. We may not sell these securities until the registration statement filed with the Securities and Exchange Commission is effective. This prospectus is not an offer to sell these securities and it is not soliciting an offer to buy these securities in any jurisdiction where the offer or sale is not permitted.
SUBJECT TO COMPLETION. DATED SEPTEMBER 1, 2015
Shares

GMS Inc.
Common Stock
This is an initial public offering of shares of common stock of GMS Inc. We are selling all of the shares to be sold in the offering.
Prior to this offering, there has been no public market for the common stock. The initial public offering price is expected to be between $ and $ per share. We will apply to list our common stock on under the symbol "GMS".
The underwriters have an option for a period of 30 days to purchase up to a maximum of additional shares of our common stock from us, to cover any over-allotments.
After the completion of this offering, we expect to be a "controlled company" within the meaning of the corporate governance standards of .
Investing in our common stock involves risk. See "Risk Factors" beginning on page 18 to read about factors you should consider before buying shares of our common stock.
| | Price to Public | Underwriting Discounts and Commissions | Proceeds to GMS Inc. | |||||||
|---|---|---|---|---|---|---|---|---|---|---|
| Per Share | $ | $ | $ | |||||||
| Total | $ | $ | $ | |||||||
Delivery of the shares of common stock will be made on or about , 2015.
Neither the Securities and Exchange Commission nor any other regulatory body has approved or disapproved of these securities or determined if this prospectus is truthful or complete. Any representation to the contrary is a criminal offense.
| Barclays | Credit Suisse | |||
RBC Capital Markets | Baird | Wells Fargo Securities | ||
SunTrust Robinson Humphrey | ||||
The date of this prospectus is , 2015.

TABLE OF CONTENTS
| | Page | |||
|---|---|---|---|---|
PROSPECTUS SUMMARY | 1 | |||
RISK FACTORS | 18 | |||
CAUTIONARY NOTE REGARDING FORWARD-LOOKING STATEMENTS | 40 | |||
USE OF PROCEEDS | 42 | |||
DIVIDEND POLICY | 43 | |||
CAPITALIZATION | 44 | |||
DILUTION | 45 | |||
SELECTED CONSOLIDATED FINANCIAL AND OTHER DATA | 47 | |||
MANAGEMENT'S DISCUSSION AND ANALYSIS OF FINANCIAL CONDITION AND RESULTS OF OPERATIONS | 51 | |||
BUSINESS | 82 | |||
MANAGEMENT | 99 | |||
COMPENSATION DISCUSSION AND ANALYSIS | 106 | |||
PRINCIPAL STOCKHOLDERS | 123 | |||
CERTAIN RELATIONSHIPS AND RELATED PARTY TRANSACTIONS | 125 | |||
DESCRIPTION OF CAPITAL STOCK | 128 | |||
DESCRIPTION OF CERTAIN INDEBTEDNESS | 132 | |||
SHARES ELIBIGLE FOR FUTURE SALE | 136 | |||
MATERIAL U.S. FEDERAL TAX CONSIDERATIONS FOR NON-U.S. HOLDERS OF OUR COMMON STOCK | 138 | |||
UNDERWRITING | 143 | |||
LEGAL MATTERS | 148 | |||
EXPERTS | 148 | |||
WHERE YOU CAN FIND MORE INFORMATION | 148 | |||
INDEX TO CONSOLIDATED FINANCIAL STATEMENTS | F-1 | |||
You should rely only on the information contained in this prospectus and any free writing prospectus prepared by or on behalf of us that we have referred to you. Neither we nor the underwriters have authorized anyone to provide you with additional information or information different from that contained in this prospectus or in any free writing prospectus prepared by or on behalf of us that we have referred to you. If anyone provides you with additional, different or inconsistent information, you should not rely on it. Offers to sell, and solicitations of offers to buy, shares of our common stock are being made only in jurisdictions where offers and sales are permitted. The information contained in this prospectus is accurate only as of the date of this prospectus, regardless of the time of delivery of this prospectus or of any sale of our common stock. Our business and financial condition may have changed since such date.
No action is being taken in any jurisdiction outside the United States to permit a public offering of common stock or possession or distribution of this prospectus in that jurisdiction. Persons who come into possession of this prospectus in jurisdictions outside the United States are required to inform themselves about and to observe any restriction as to this offering and the distribution of this prospectus applicable to those jurisdictions.
This prospectus includes estimates regarding market and industry data that we prepared based on our management's knowledge and experience in the markets in which we operate, together with information obtained from various sources, including publicly available information, industry reports and publications, surveys, our customers, suppliers, trade and business organizations and other contacts in the markets in which we operate.
In presenting this information, we have made certain assumptions that we believe to be reasonable based on such data and other similar sources and on our knowledge of, and our experience to date in, the markets for the products we distribute. Market share data is subject to change and may be limited by the availability of raw data, the voluntary nature of the data gathering process and other limitations
i
inherent in any statistical survey of market shares. In addition, customer preferences are subject to change. Accordingly, you are cautioned not to place undue reliance on such market share data. References herein to our being a leader in a market or product category refer to our belief that we have a leading market share position in each specified market based on volume, for our wallboard market share position, or sales dollars, for our ceilings market share position, unless the context otherwise requires. In addition, unless otherwise stated or the context otherwise requires, the discussions herein regarding (1) the wallboard market are based on the total volume of wallboard produced in U.S. manufacturing facilities, some of which is sold into Canada, and (2) the suspended ceilings systems, or ceilings, market are based on the total sales, in dollars, of ceilings distributed or otherwise sold in North America.
On April 1, 2014, GMS Inc., or the Successor, acquired, through its wholly-owned entities, GYP Holdings II Corp. and GYP Holdings III Corp., all of the capital stock of Gypsum Management and Supply, Inc., or the Predecessor. Successor is majority owned by certain affiliates of AEA Investors LP, which we refer to as "AEA" or our "Sponsor," and certain of our other stockholders. We refer to this acquisition as the "Acquisition."
As a result of the Acquisition and resulting change in control and changes due to the impact of purchase accounting, we are required to present separately the operating results for the Predecessor periods ending on or prior to March 31, 2014 and the Successor periods beginning on or after April 1, 2014. Accordingly, unless otherwise indicated or the context otherwise requires, all references to "the Company," "GMS," "we," "us," "our" and other similar terms mean (1) the Predecessor for periods ending on or prior to March 31, 2014 and (2) the Successor for periods beginning on or after April 1, 2014, in each case together with its consolidated subsidiaries.
Our fiscal year ends on April 30 of each year. References in this prospectus to a fiscal year mean the year in which that fiscal year ends. References in this prospectus to "fiscal 2011" or "FY 2011" relate to the year ended April 30, 2011, references in this prospectus to "fiscal 2012" or "FY 2012" relate to the year ended April 30, 2012, references in this prospectus to "fiscal 2013" or "FY 2013" relate to the year ended April 30, 2013, references in this prospectus to "fiscal 2015" or "FY 2015" relate to the year ended April 30, 2015 and references in this prospectus to "fiscal 2016" relate to the year ending April 30, 2016. References in this prospectus to "full year 2014" or "FY 2014" represent the sum of the results of the eleven month period from May 1, 2013 to March 31, 2014 and the one month period from April 1, 2014 to April 30, 2014.
The financial statements included in this prospectus include a black line division to indicate that the Predecessor and Successor reporting entities have applied different bases of accounting and are not comparable. Please note that our discussion of certain financial information for the year ended April 30, 2014, specifically net sales and Adjusted EBITDA, includes data from the Predecessor and Successor periods on a combined basis for the full year 2014. The change in basis resulting from the Acquisition did not impact such financial information and, although this presentation of financial information on a combined basis does not comply with generally accepted accounting principles in the United States, or GAAP, we believe it provides a meaningful method of comparison to the other periods presented in this prospectus. The data is being presented for analytical purposes only. Combined operating results (1) have not been prepared on a pro forma basis as if the Acquisition occurred on the first day of the period, (2) may not reflect the actual results we would have achieved absent the Acquisition and (3) may not be predictive of future results of operations.
ii
Amounts presented in this prospectus in thousands or millions are approximations of the actual amounts in that they have been rounded.
This prospectus includes trademarks and service marks owned by us, including GMSTM, GMS Gypsum Management & Supply, Inc.® and GTS®. This prospectus also contains trademarks, trade names and service marks of other companies, which are the property of their respective owners. Solely for convenience, trademarks, trade names and service marks referred to in this prospectus may appear without the ®,TM orSM symbols, but such references are not intended to indicate, in any way, that we will not assert, to the fullest extent under applicable law, our rights or the right of the applicable licensor to these trademarks, trade names and service marks. We do not intend our use or display of other parties' trademarks, trade names or service marks to imply, and such use or display should not be construed to imply, a relationship with, or endorsement or sponsorship of us by, these other parties.
iii
This summary highlights selected information contained elsewhere in this prospectus. Because this is only a summary, it does not contain all the information that may be important to you. You should read the entire prospectus carefully, especially "Risk Factors" beginning on page 18 of this prospectus and our consolidated financial statements and related notes included elsewhere in this prospectus, before deciding to invest in our common stock.
We are the leading North American distributor of wallboard and suspended ceilings systems. Our product offering of wallboard, suspended ceilings systems, or ceilings, and complementary interior construction products is designed to provide a comprehensive solution for our core customer, the interior contractor who installs these products in commercial and residential buildings.
Since our founding in 1971, we have grown our business from a single location to over 155 branches across 36 states through a combination of both organic growth and acquisitions. Underpinning that growth is our entrepreneurial culture, which both enables us to drive organic growth by delivering outstanding customer service and makes us an attractive acquirer for smaller distributors whose owners are seeking liquidity. Over time, we have increased our market share in the distribution of wallboard and ceilings, which management currently estimates is 11% for wallboard, based on volume produced in the United States and Canada, and 14% for ceilings, based on sales dollars in North America.
We serve as a critical link between our suppliers and our highly fragmented customer base of over 20,000 contractors. Based on wallboard's unique product attributes and delivery requirements, distributing wallboard requires a higher degree of logistics and service expertise than most other building products. Wallboard has a high weight-to-value ratio, is easily damaged, cannot be left outside and often must be delivered to a job site before or after normal business hours. Due to the weight of the product, we are often required to deliver wallboard to the specific room where it will be installed. For example, we can place the precise amount and type of wallboard necessary for a second story room of a new building through the second story window using a specialized truck with an articulating boom loader. To do this effectively, we need to load the truck at the branch so that the precise amount and type of wallboard for each room of the building can be off-loaded by the articulating boom loader in the right sequence. Our sales, dispatch and delivery teams then coordinate an often complicated, customized delivery plan to ensure that our delivery schedule matches the customer's job site schedule, that deliveries are made with regard to the specific challenges of a customer's job site, that no damage occurs to the customer's property and, most importantly, that proper safety procedures are followed at all times. Often this requires us to send an employee to a job site before the delivery is made to document the specific requirements and safety considerations of a particular location. Given the logistical intensity of this process and the premium contractors place on distributors delivering the right product, at the right time, in the right place, we are able to differentiate ourselves based on service and can generate attractive gross profit margins. In addition to executing a logistics-intensive service, for all of our products we facilitate purchasing relationships between suppliers and our highly fragmented customer base by transferring technical product knowledge, educating contractors on proper installation techniques for new products, ensuring local product availability and extending trade credit.
We believe our strategic focus and operating model enable us to differentiate ourselves within our industry. Whereas several of our competitors are part of larger organizations that manufacture or distribute a wide variety of products, we focus on distributing wallboard, ceilings and complementary interior construction products. We believe this focus enables us to provide superior service and product expertise to our customers. In addition, our operating model combines a national platform with a local go-to-market strategy through over 155 branches across the country. We believe this combination enables us to generate economies of scale while maintaining the high service levels, entrepreneurial
1
culture and customer intimacy of a local business. In order to tailor its products and services to meet the needs of its local market, each of our branches operates with a significant amount of autonomy within the parameters of our overall business model. Branch managers are responsible for sales, pricing and staffing activities, and have full operational control of customer service and deliveries. They are compensated in part based on the profit they are able to achieve, which aligns their incentives with our financial goals. We believe our experienced, locally-focused teams, and our ability to develop, motivate and incentivize them, are key to our success. Through our Yard Support Center, which includes over 120 employees at our corporate office in Atlanta, we support our branches with various back office functions including accounting, information technology, or IT, legal, safety, human resources, marketing and risk management. We also use our Yard Support Center to generate purchasing efficiencies and share best practices across our branch network.
We have grown our Company and developed our distinctive culture under strong, consistent leadership. Our senior management team has been with us for an average of 22 years. We have been able to retain top talent and incentivize managers through our entrepreneurial culture and broad-based equity ownership. Prior to this offering, 71 of our employees own approximately 31% of our common stock (on a fully diluted basis, including vested and unvested stock options). Together with our strong base of experienced operators, our management team has grown our Company from a single site location to the market leader we are today.
For fiscal 2015, we generated $1.6 billion in net sales, $113.9 million of Adjusted EBITDA and $13.8 million of net loss. For a discussion of our use of Adjusted EBITDA and a reconciliation to net (loss) income, please refer to "—Summary Financial and Other Data." Net sales and Adjusted EBITDA grew 16.0% and 30.8%, respectively, in fiscal 2015 as compared to full year 2014. Over the past four years, net sales and Adjusted EBITDA have grown at a compound annual growth rate, or CAGR, of 15.5% and 59.2%, respectively.
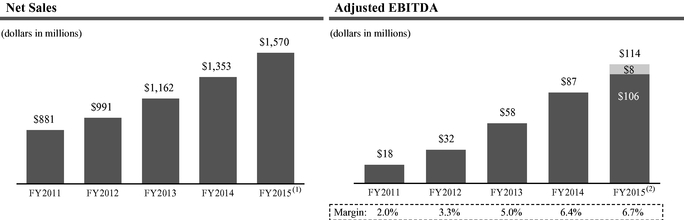
- (1)
- Our net sales do not reflect net sales attributable to acquired entities for any period prior to the respective dates of their acquisition. Entities acquired in FY 2015 generated approximately $82.0 million in net sales in FY 2015 prior to their respective acquisition dates.
- (2)
- Our Adjusted EBITDA for FY 2015 includes approximately $8.1 million from entities acquired in FY 2015 for the period prior to the date of acquisition of such entities, as permitted by the ABL Facility and the Term Loan Facilities. However, Adjusted EBITDA margin, which is calculated as a percentage of net sales, excludes this $8.1 million adjustment for FY 2015 to be consistent with our calculation of net sales for the same period.
2
The table below summarizes our major product categories:
(dollars in millions) | Wallboard | Ceilings | Steel Framing | Other Products | ||||
|---|---|---|---|---|---|---|---|---|
Fiscal 2015 Net Sales | $718.1 | $278.7 | $243.2 | $330.1 | ||||
% of Fiscal 2015 Net Sales | 45.7% | 17.8% | 15.5% | 21.0% | ||||
Description(1) | • #1 market position • Used to finish the interior walls and ceilings in residential, commercial and institutional construction projects | • #1 market position • Suspended ceiling systems primarily comprised of mineral fiber ceiling tile and grid • Architectural specialty ceilings systems | • Steel framing products for interior walls • Sold into commercial applications, typically as part of a package with wallboard, ceilings and other products | • Primarily consists of complementary interior construction products, including joint compound, finishing materials, tools and fasteners, safety products and EIFS (exterior insulation and finishing system) | ||||
Products | • Various types of wallboard including:1/2 inch standard (residential),5/8 inch fire-rated (commercial), foil-backed, lead-lined, moisture-resistant, mold-resistant and vinyl-covered • Tile backer | • Acoustical ceiling tiles (standard and architectural specialty) • Clips • Covered fiberglass • Ceiling tile grid • Hangers | • Beads, clips, furring, hangers, joists, lath, mesh and trim • Control joint • Drywall steel • Flat stock • Plastering steel • Structural • Studs and track | • Adhesives • EIFS • Fasteners • Insulation • Joint compound • Plaster • Safety equipment • Tools • Trims | ||||
Primary End Markets | • Residential New Construction • Residential Repair and Remodeling, or R&R • Commercial New Construction • Commercial R&R | • Commercial New Construction • Commercial R&R | • Commercial New Construction • Commercial R&R | • Commercial New Construction • Commercial R&R • Residential New Construction • Residential R&R | ||||
Key Manufacturers | • American Gypsum Company, LLC, or American Gypsum • CertainTeed Corporation, or CertainTeed • Continental Building Products Inc., or Continental • Georgia-Pacific Corporation, or Georgia-Pacific • National Gypsum Company, or National Gypsum • Pabco Building Products, LLC, or Pabco • USG Corporation, or USG | • Armstrong World Industries, Inc., or Armstrong • CertainTeed • USG | • ClarkDietrich Building Systems LLC • Marino\WARE Industries, Inc. • Super Stud Building Products, Inc. • Telling Industries LLC | • Dryvit Systems, Inc. • Grabber Construction Products, Inc. • Johns Manville • Knauf Gips KG • PrimeSource Building Products, Inc. • Stanley Black & Decker, Inc. • Sto Corp. |
- (1)
- Market position based on management's estimates, and based on volume, for wallboard, and sales dollars, for ceilings.
3
�� As the U.S. construction market evolved during the second half of the 20th century, contractors began to specialize in specific trades within the construction process, and specialty distributors emerged to supply them. One of these trades was wallboard and ceilings installation, and we, along with other specialty distributors, tailored our product offerings and service capabilities to meet the unique needs of that trade. Today, specialty distributors comprise the preferred distribution channel for wallboard and ceilings in both the commercial and residential construction markets.
We believe the success of the specialty distribution model in wallboard and ceilings is driven by the strong value proposition provided to our customers. Given the logistical complexity of the distribution services we provide, the expertise needed to execute effectively, and the special equipment required, we believe specialty distributors focused on wallboard and ceilings are best suited to meet contractors' needs.
The table below provides an overview of the supply chain in our industry, which illustrates management's estimate of the share of the supply channel that is represented by specialty distributors.
Supply Chain Overview
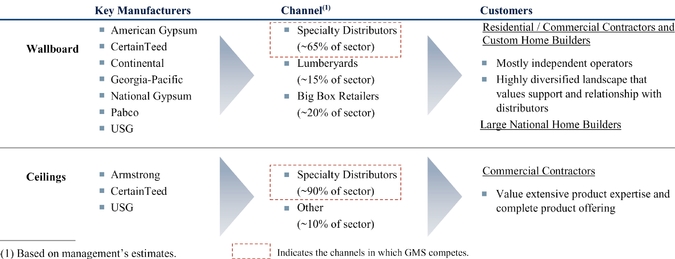
We estimate the North American market for the distribution of wallboard, ceilings and complementary interior construction products generated approximately $14 billion in sales in 2014. Of that market, we believe approximately $11 billion was served through specialty distributors like GMS, while the remaining approximately $3 billion was served by big box retailers, lumberyards and other channels. Despite continued consolidation among our competitors, we believe the North American specialty distribution industry remains highly fragmented and consists of approximately 400 local or regional participants. Our largest competitors in the North American specialty distribution industry include Allied Building Products (a subsidiary of CRH plc), Foundation Building Materials, L&W Supply (a subsidiary of USG) and Winroc (a subsidiary of Superior Plus). However, we believe smaller, regional or local competitors still comprise more than half of the industry. In contrast, the manufacturers of wallboard and ceilings products are highly consolidated. Since the late 1990s, the number of North American wallboard manufacturers has been reduced from twelve to seven, with the top four manufacturers representing approximately 75% of the wallboard market in 2014. Similarly, management estimates that three ceilings manufacturers accounted for approximately 95% of the ceilings manufactured in North America during 2014.
The main drivers for our products are commercial new construction, commercial repair and remodeling, or R&R, residential new construction and residential R&R. We believe all four end
4
markets have begun an extended period of expansion. From 2011 to 2014, commercial construction square footage put in place has increased 38% and housing starts have increased 65%. Despite this progress, for 2014, commercial construction square footage put in place still would have needed to increase by 31% in order to achieve the historical market average of 1.3 billion square feet annually since 1970, while housing starts would have needed to increase by 45% in order to reach the historical market average of 1.5 million annually since 1970. Demand for our interior building products has historically correlated closely with construction activity, typically trailing housing starts and commercial construction square footage put in place by approximately six to nine months. As commercial and residential new construction activity approaches historical levels, we expect a corresponding increase in demand for the products we distribute.
We believe that the following competitive strengths will drive our future growth:
Entrepreneurial culture. We believe our entrepreneurial, results-driven culture fosters highly dedicated employees who provide our customers with outstanding service that differentiates us from our competition. We empower managers with the independence and authority to make decisions locally. Further, we incentivize employees throughout our Company to generate business and execute it profitably through a compensation program that includes variable compensation and equity ownership. Prior to this offering, 71 of our employees own approximately 31% of our common stock (on a fully diluted basis, including vested and unvested stock options). We also believe our entrepreneurial culture, combined with our dedication to developing, training and providing opportunities for all of our employees, helps us attract and retain top talent. Similarly, we believe these characteristics have also positioned us as an attractive acquirer for smaller distributors whose owners are seeking liquidity.
Market leader with significant scale advantages. We are the largest North American specialty distributor of wallboard, ceilings and complementary interior construction products. Our industry is characterized by a large number of smaller, local distributors, which generally lack our level of scale and resources. We believe our leading market position, national reach and differentiated platform provide us significant advantages relative to these competitors, including:
- •
- advantageous purchasing and sourcing, such as exclusive supplier relationships in many markets;
- •
- significant flexibility to efficiently and economically serve a broad range of customers, ranging from local specialty contractors to large production home builders, across their span of operations; and
- •
- substantial financial and human resources to invest in developing our employees and maintaining our market-leading fleet and infrastructure.
Unwavering focus on relationships and superior service. We aim to be the premier partner of choice for our customers, suppliers and employees as well as smaller distributors whose owners may be seeking liquidity.
- •
- Customers. We believe we offer superior services and solutions due to our comprehensive product offering, local market knowledge, product expertise and the quality of our service. We deliver products to job sites in a precise, safe and timely manner with around-the-clock support from our dedicated local teams.
- •
- Suppliers. We provide a trusted professional partnership, resources for investment in growth and differentiated market access through our national reach. As a result, we have become a significant customer for our top suppliers, which enables us to obtain both competitive pricing and access to product in times of tight supply.
5
- •
- Employees. We provide our employees with an entrepreneurial culture, a safe work environment, attractive compensation, financial incentives and career development opportunities.
- •
- Acquisition candidates. We provide smaller distributors whose owners may be seeking liquidity with the opportunity to continue to operate their business in an entrepreneurial manner while relieving them of the risks and burdens associated with owning a small business. We also offer these owners scale advantages, resources for future growth and an attractive culture and platform for their employees.
Differentiated operating model. We believe the combination of our national scale with our local go-to-market strategy helps to drive our growth and attractive margin profile. Specifically, through our Yard Support Center we are able to benefit from scaled purchasing efficiencies, integrated technology systems and shared best practices across our branch network, while still tailoring our service and product offering to the local preferences of each market. By retaining local brands and substantial autonomy in our branches, we are able to leverage local relationships and generate strong customer loyalty. In addition, we believe the inherent diversity in our model across customers, geographies and end markets offers lower volatility and less cyclicality than less diversified distributors in the building materials industry. We have low customer concentration with our largest customer representing less than 3% of our sales in fiscal 2015; we have geographic diversity with operations in 36 states; and based on certain assumptions by management as to the application of our products and our end markets, we believe that we have a balanced mix of business between the commercial and residential markets as well as between the new construction and R&R markets.
Multi-faceted growth. We have a track record of achieving above-market growth by capturing market share within our existing footprint, opening new branches and making selective acquisitions. Based on market data from the Gypsum Association and management's estimates, our volume growth has outpaced the wallboard market by an average of approximately 700 basis points annually over the past five years, and we have increased our market share by approximately 250 basis points over the same period. We believe our success in capturing market share is due to our differentiated culture, superior customer service, national scale and strong supplier relationships. We also have a successful history of growth through opening new branches in select locations where we have identified opportunities in underserved markets. Over the past five years, we have opened 23 new branches and we currently expect to open several new branches each year depending on market conditions. The new branches we have opened since 2010 have typically delivered attractive returns on invested capital in these markets within a few years. In addition, we complement our organic growth strategy with tuck-in acquisitions, of which we have completed eight, constituting 15 new branches, since the beginning of full year 2014. We believe our success in acquiring smaller distributors has been the result of our highly selective acquisition criteria, our focus on culture, our strategy of maintaining the acquisition's existing brand, when appropriate, to help ensure customer and employee continuity, our experience with integration, our national scale and our competitive position.
6
GMS Wallboard Market Share

Source: Gypsum Association and Company data.
- (1)
- Includes the wallboard volume from entities acquired in fiscal 2015 assuming that the entities were acquired on January 1, 2014.
- (2)
- Represents the wallboard production volume of U.S. manufacturing facilities, some of which is sold into Canada.
Our objective is to strengthen our competitive position, achieve above-market rates of profitable growth and increase stockholder value through the following key strategies:
Continue to invest in our employees, assets and infrastructure. We believe our above-market growth is driven by the quality of our employees and our ability to continuously develop outstanding talent. Each year, we target graduates from premier universities to enter our training program and spend considerable time and resources training them across all major functions of our operations. In addition to recruiting and training new talent, we have developed an extensive management training program for existing, high potential employees which is focused on developing sales capabilities, financial acumen and operational and safety expertise. While these programs represent a considerable investment, we believe they are critical to supporting our growth strategy by providing managers for new branches and increasing the overall capacity of our management team. Many of our former trainees have been promoted to run branches, regions and even divisions throughout our Company. We also believe the size and growth of our Company provide our employees with superior career opportunities than many of our competitors, which further enables us to recruit and retain top talent. To ensure that we support our employees with the best equipment, systems and infrastructure, we also continue to invest in other key areas of our business. We have a young and well maintained fleet of trucks and delivery equipment and have also made significant investments in our IT infrastructure and continuously improve our IT capabilities.
7
Grow market share within our existing geographic footprint. We expect to continue to capture profitable market share from competitors within our existing geographic footprint. We believe that our dedication to delivering superior customer service and our national scale differentiates us from our competitors. We also continue to provide strong financial incentives, support and technology to maximize the efficiency and effectiveness of our experienced salesforce as they work to provide local market expertise and tailored solutions for our customers. For example, our salesforce will provide our customers with leads on new job activity that helps them grow their businesses. Additionally, we have a strategic initiative to leverage our national capabilities to serve large homebuilders throughout their operations that we believe will increase our penetration of those accounts. We believe this provides a compelling value proposition for our homebuilder customers by ensuring consistent service levels across their footprint.
Accelerate growth by selectively opening new branches and executing acquisitions. We believe that significant opportunities exist to expand our geographic footprint by opening new branches and executing selective, tuck-in acquisitions.
- •
- New branches. Our strategy for opening new branches is to further penetrate markets that are adjacent to our existing operations. Typically, we have pre-existing customer relationships in these markets but need a new location to fully capitalize on those relationships. Relative to our size and scale, the capital investment required to open a new facility is usually small, and the new branches we have opened since 2010 have typically generated attractive returns on invested capital within a few years. We believe our existing infrastructure is capable of supporting a much larger branch network, and we currently expect to open several new branches each year depending on market conditions.
- •
- Selective acquisitions. We will continue to selectively pursue tuck-in acquisitions and have a dedicated team of professionals to manage the process. Due to the large, highly fragmented nature of our market and our reputation throughout the industry, we believe we have the potential to access a robust acquisition pipeline that will continue to supplement our strong organic growth. We use a rigorous targeting process to identify acquisition candidates that will fit our culture and business model. As a result of our scale, purchasing power and ability to improve operations through implementing best practices, we believe we can achieve substantial synergies and drive earnings accretion from our acquisition strategy. We also believe that our successful track record in acquiring businesses provides a competitive advantage in the evaluation and integration of future acquisitions. We consistently strive to maintain an extensive and active acquisition pipeline and are often evaluating several acquisition opportunities at any given time.
Capitalize on accelerating growth across distinct end markets. We believe the new commercial and residential construction markets have both begun an extended period of expansion. Given the extreme depth of the last recession, despite the growth to date, activity in both markets remains well below average historical levels. As such, we believe both markets will experience an extended, sustained period of growth in the future. In addition, while R&R activity has historically been more stable than new construction activity, we believe the prolonged period of under-investment during the downturn will result in above-average growth in both commercial and residential R&R activity in the near term.
Achieve improved financial performance through operational excellence and operating leverage. Over the past five years, as volumes have recovered and as we have streamlined our operating model, our Adjusted EBITDA margins have improved significantly. Our Yard Support Center continues to drive procurement savings and operational excellence across our branch network. Our operational initiatives include optimizing pricing, improving fleet utilization and maximizing working capital efficiency. As our volumes continue to grow, we expect margins to improve from the inherent operating leverage in our business. In the past, our existing branch network has supported substantially higher volumes per
8
branch. As our end markets continue to recover, we expect to generate higher operating margins on incremental volume as we leverage our fixed costs at our existing branches. Similarly, we have made significant investments in our Yard Support Center over the past few years to prepare for significant growth in our business. As we continue to grow our volumes, we expect to gain operating leverage on that investment in the years ahead.
Our business is subject to a number of risks of which you should be aware before deciding to invest in our common stock. The risks are discussed more fully in the "Risk Factors" section of this prospectus immediately following this prospectus summary. These risks include, but are not limited to, the following:
- •
- general economic and financial conditions;
- •
- the state of the commercial and residential construction and R&R markets;
- •
- competitive industry pressures;
- •
- the fluctuation in prices of the products we distribute;
- •
- the consolidation of our industry;
- •
- product shortages and relationships with key suppliers;
- •
- product liability and warranty claims, and other claims related to our business;
- •
- our ability to attract key employees; and
- •
- our current level of indebtedness.
GMS Inc. is a Delaware corporation. Our Predecessor was founded in 1971. Our principal executive office is located at 100 Crescent Centre Parkway, Suite 800, Tucker, Georgia 30084, and our telephone number at that address is (800) 392-4619. We maintain a website on the Internet at www.gms.com. The information contained on, or that can be accessed through, our website is not a part of, and should not be considered as being incorporated by reference into, this prospectus. For a chart illustrating our organizational structure, see "—Organizational Structure."
AEA is one of the most experienced global private investment firms. Founded in 1968, AEA currently manages over $6 billion of capital for an investor group that includes former and current chief executive officers of major multinational corporations, family groups, and institutional investors from around the world. With a staff of approximately 70 investment professionals and offices in New York, Stamford, London, Munich and Shanghai, AEA focuses on investing in companies in the consumer products/retail, industrial products, specialty chemicals and related services sectors.
9
The chart below summarizes our ownership and corporate structure after giving effect to this offering, assuming no exercise of the underwriters' option to purchase additional shares.
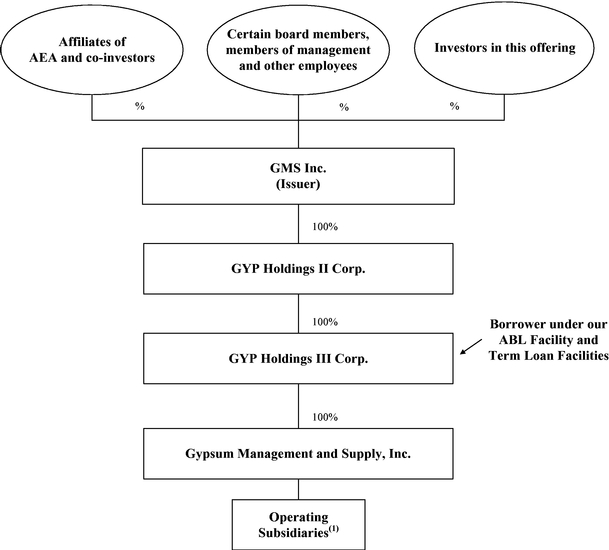
- (1)
- Some of our operating subsidiaries sponsor deferred compensation arrangements that entitle selected employees of those subsidiaries to participate in increases in the adjusted book value of a specified number of shares of common stock of those subsidiaries. Adjusted book value for this purpose generally means the book value of the relevant shares, as increased, or decreased, to reflect those shares' ratable portion of any annual earnings, or losses, of the relevant subsidiary (based on the total number of outstanding shares of the relevant subsidiary). The value of these arrangements is reflective of the carrying value of the subsidiaries' book equity and is not intended to represent its fair value. In certain cases, employees participate in these arrangements by holding a minority portion of the common stock of the subsidiary, which stock is generally non-transferrable and subject to mandatory provisions that require the stock to be redeemed at its adjusted book value, subject in certain cases to an agreed upon minimum value, only upon termination of employment. As of April 30, 2015, the aggregate redemption value of subsidiary stock held by employees (calculated on an adjusted book value basis as described above) was $30.0 million, net of current portion of $1.6 million, which is reflected as "liabilities to noncontrolling interest holders" on our consolidated balance sheets. We do not expect to grant similar interests in our subsidiaries in the future.
10
Common stock offered by us | shares. | |
Common stock to be outstanding after this offering | shares. | |
Option to purchase additional shares | The underwriters have an option to purchase up to an aggregate of additional shares of common stock from us, to cover any over-allotments. The underwriters can exercise this option at any time within 30 days from the date of this prospectus. | |
Use of proceeds | We estimate that the net proceeds to us from this offering, after deducting underwriting discounts and commissions, will be approximately $ , assuming the shares are offered at $ per share (the midpoint of the price range set forth on the cover page of this prospectus). We intend to use the net proceeds from this offering to (i) repay approximately $ of indebtedness under the Second Lien Facility and (ii) pay approximately $ of fees and expenses related to this offering, including fees of $ to our Sponsor immediately following this offering. We expect to use any remaining proceeds for general corporate purposes. See "Use of Proceeds." | |
Dividend policy | We do not expect to pay any dividends on our common stock for the foreseeable future. See "Dividend Policy." | |
Proposed stock exchange symbol | "GMS" | |
Directed share program | The underwriters have reserved for sale, at the initial public offering price, up to shares of the common stock to be offered to our directors, officers and employees. See "Underwriting." | |
Risk factors | Investing in our common stock involves a high degree of risk. See "Risk Factors" beginning on page 18 of this prospectus for a discussion of factors you should carefully consider before investing in our common stock. |
The number of shares of common stock to be outstanding after this offering excludes:
- •
- shares of common stock issuable upon the exercise of options outstanding under our existing equity plan as of April 30, 2015 at a weighted average exercise price of $ per share; and
- •
- shares of common stock reserved for future issuance under our new omnibus incentive plan.
Unless otherwise indicated, all information contained in this prospectus:
- •
- assumes an initial public offering price of $ per share, which is the midpoint of the price range set forth on the cover page of this prospectus;
- •
- assumes the underwriters' option to purchase additional shares will not be exercised;
- •
- gives effect to a -for- stock split effected on , 2015; and
- •
- gives effect to our amended and restated certificate of incorporation and our amended and restated by-laws, which will be in effect prior to the consummation of this offering.
11
Summary Financial and Other Data
The summary consolidated financial information of Successor presented below for the fiscal year ended April 30, 2015, the one month ended April 30, 2014 and as of April 30, 2015 and 2014 has been derived from our audited consolidated financial statements included elsewhere in this prospectus. The summary consolidated financial information of Predecessor presented below for the eleven months ended March 31, 2014 and the fiscal year ended April 30, 2013 has been derived from our audited consolidated financial statements included elsewhere in this prospectus. The summary consolidated financial information of Predecessor presented below as of April 30, 2013 has been derived from our consolidated financial statements not included in this prospectus. As discussed elsewhere in this prospectus, on April 1, 2014, GMS Inc., or the Successor, acquired, through its wholly-owned entities, GYP Holdings II Corp. and GYP Holdings III Corp., all of the capital stock of Gypsum Management and Supply, Inc., or the Predecessor. Successor is majority owned by certain affiliates of AEA and certain of our other stockholders. We refer to this transaction as the "Acquisition." As a result of the Acquisition and the resulting change in control and changes due to the impact of purchase accounting, we are required to present separately the operating results for the Predecessor periods ending on or prior to March 31, 2014 and the Successor periods beginning on or after April 1, 2014. For a discussion of our Predecessor and Successor periods, see "Basis of Presentation."
The historical data presented below has been derived from financial statements that have been prepared using GAAP. This data should be read in conjunction with "Management's Discussion and Analysis of Financial Condition and Results of Operations" and our consolidated financial statements and related notes included elsewhere in this prospectus. The selected operating data has been prepared on an unaudited basis.
12
| | Successor | | Predecessor | | ||||||||||||
|---|---|---|---|---|---|---|---|---|---|---|---|---|---|---|---|---|
| | Fiscal Year Ended April 30, 2015 | One Month Ended April 30, 2014 | | Eleven Months Ended March 31, 2014 | Fiscal Year Ended April 30, 2013 | | ||||||||||
| | (in thousands, except share and per share data) | | ||||||||||||||
Statement of Operations Data: | ||||||||||||||||
Net sales | $ | 1,570,085 | $ | 127,332 | $ | 1,226,008 | $ | 1,161,610 | ||||||||
Cost of sales (exclusive of depreciation and amortization shown separately below) | 1,091,114 | 97,955 | 853,020 | 824,331 | ||||||||||||
| | | | | | | | | | | | | | | | | |
Gross profit | 478,971 | 29,377 | 372,988 | 337,279 | ||||||||||||
| | | | | | | | | | | | | | | | | |
Operating expenses: | ||||||||||||||||
Selling, general and administrative expenses | 396,155 | 46,052 | 352,930 | 295,289 | ||||||||||||
Depreciation and amortization | 64,165 | 6,336 | 12,253 | 11,627 | ||||||||||||
| | | | | | | | | | | | | | | | | |
Total operating expenses | 460,320 | 52,388 | 365,183 | 306,916 | ||||||||||||
| | | | | | | | | | | | | | | | | |
Operating income (loss) | 18,651 | (23,011 | ) | 7,805 | 30,363 | |||||||||||
Other (expense) income: | ||||||||||||||||
Interest expense | (36,396 | ) | (2,954 | ) | (4,226 | ) | (4,413 | ) | ||||||||
Change in fair value of financial instruments | (2,494 | ) | — | — | — | |||||||||||
Change in fair value of mandatorily redeemable common shares(1) | — | — | (200,004 | ) | (198,212 | ) | ||||||||||
Other income, net | 1,916 | 149 | 2,187 | 1,169 | ||||||||||||
| | | | | | | | | | | | | | | | | |
Total other (expense), net | (36,974 | ) | (2,805 | ) | (202,043 | ) | (201,456 | ) | ||||||||
| | | | | | | | | | | | | | | | | |
(Loss), before tax | (18,323 | ) | (25,816 | ) | (194,238 | ) | (171,093 | ) | ||||||||
Income tax (benefit) expense | (4,526 | ) | (6,863 | ) | 6,623 | 11,534 | ||||||||||
| | | | | | | | | | | | | | | | | |
Net (loss) | $ | (13,797 | ) | $ | (18,953 | ) | $ | (200,861 | ) | $ | (182,627 | ) | ||||
| | | | | | | | | | | | | | | | | |
| | | | | | | | | | | | | | | | | |
| | | | | | | | | | | | | | | | | |
Weighted average shares outstanding (basic and diluted) | 3,194,566 | 3,183,870 | ||||||||||||||
| | | | | | | | | | | | | | | | | |
Net (loss) per share (basic and diluted) | $ | (4.32 | ) | $ | (5.95 | ) | ||||||||||
| | | | | | | | | | | | | | | | | |
Other Financial Data: | ||||||||||||||||
Adjusted EBITDA(2)(3) | $ | 113,860 | $ | 8,372 | $ | 78,690 | $ | 57,511 | ||||||||
Adjusted EBITDA margin(2)(3) | 6.7 | % | 6.6 | % | 6.4 | % | 5.0 | % | ||||||||
| | Successor | | Predecessor | |||||||||
|---|---|---|---|---|---|---|---|---|---|---|---|---|
| | April 30, 2015 | April 30, 2014 | | April 30, 2013 | ||||||||
| | (in thousands) | |||||||||||
Balance Sheet Data: | ||||||||||||
Cash and cash equivalents | $ | 12,284 | $ | 32,662 | $ | 13,383 | ||||||
Total assets | 1,154,576 | 1,122,351 | 494,626 | |||||||||
Total debt(4) | 556,984 | 538,785 | 115,003 | |||||||||
Total stockholders' equity (deficit) | 297,472 | 299,434 | (274,846 | ) | ||||||||
13
| | Fiscal Year Ended April 30, 2015 | | | |||||||
|---|---|---|---|---|---|---|---|---|---|---|
Pro Forma Statement of Operations Data(5): | ||||||||||
Pro forma net income(5) | ||||||||||
Pro forma weighted average shares outstanding(6) | ||||||||||
Basic | ||||||||||
Diluted | ||||||||||
Pro forma net income per share(5)(6) | ||||||||||
Basic | ||||||||||
Diluted | ||||||||||
| | April 30, 2015 | April 30, 2014 | April 30, 2013 | |||||||
|---|---|---|---|---|---|---|---|---|---|---|
Selected Operating Data: | ||||||||||
Branches | 156 | 140 | 132 | |||||||
Employees | 3,088 | 2,621 | 2,405 | |||||||
Wallboard volume (for the year ended) (million square feet) | 2,328 | 2,088 | 1,850 | |||||||
- (1)
- Represents the change in fair value of mandatorily redeemable common shares of the Predecessor, all of which were acquired by the Company on April 1, 2014 in connection with the Acquisition. These shares had certain redemption features which provided that upon the death or disability of the shareholder or termination of his employment, Predecessor would be required to purchase these shares at their then current fair values. Pursuant to this provision, these shares were deemed to be mandatorily redeemable and, as such, were required to be reflected as a liability at their estimated fair values at the end of any reporting period. Changes in fair value are reflected as "Change in fair value of mandatorily redeemable common shares" on our consolidated statements of operations. Fair value was estimated based on commonly used valuation techniques. For additional details, see Note 10 of our consolidated financial statements included elsewhere in this prospectus.
- (2)
- We report our financial results in accordance with GAAP. However, we present Adjusted EBITDA and Adjusted EBITDA margin, which are not recognized financial measures under GAAP, because we believe they assist investors and analysts in comparing our operating performance across reporting periods on a consistent basis by excluding items that we do not believe are indicative of our core operating performance. Management believes Adjusted EBITDA is helpful in highlighting trends in our operating results, while other measures can differ significantly depending on long-term strategic decisions regarding capital structure, the tax jurisdictions in which companies operate and capital investments.
- •
- Adjusted EBITDA and Adjusted EBITDA margin do not reflect every expenditure, future requirements for capital expenditures or contractual commitments;
- •
- Adjusted EBITDA does not reflect changes in our working capital needs;
In addition, we utilize Adjusted EBITDA in certain calculations under the ABL Facility and the Term Loan Facilities. The ABL Facility and the Term Loan Facilities permit us to make certain additional adjustments in calculating Consolidated EBITDA, such as projected net cost savings, which are not reflected in the Adjusted EBITDA data presented in this prospectus. We may in the future reflect such permitted adjustments in our calculations of Adjusted EBITDA. See "Description of Certain Indebtedness—Senior Credit Facilities."
You are encouraged to evaluate each adjustment and the reasons we consider it appropriate for supplemental analysis. In addition, in evaluating Adjusted EBITDA, you should be aware that in the future, we may incur expenses similar to the adjustments in the presentation of Adjusted EBITDA. Our presentation of Adjusted EBITDA should not be construed as an inference that our future results will be unaffected by unusual or non-recurring items. In addition, Adjusted EBITDA may not be comparable to similarly titled measures used by other companies in our industry or across different industries.
We also include information concerning Adjusted EBITDA margin, which is calculated as Adjusted EBITDA divided by net sales. We present Adjusted EBITDA margin because it is used by management as a performance measure to judge the level of Adjusted EBITDA that is generated from net sales.
Adjusted EBITDA and Adjusted EBITDA margin have their limitations as analytical tools and you should not consider them in isolation, or as a substitute for analysis of our results as reported under GAAP. Some of these limitations include:
14
- •
- Adjusted EBITDA does not reflect the significant interest expense, or the amounts necessary to service interest or principal payments, on our outstanding debt;
- •
- Adjusted EBITDA does not reflect income tax expense and, because the payment of taxes is part of our operations, tax expense is a necessary element of our costs and ability to operate;
- •
- although depreciation and amortization are eliminated in the calculation of Adjusted EBITDA, the assets being depreciated and amortized will often have to be replaced in the future, and Adjusted EBITDA does not reflect any costs of such replacements;
- •
- non-cash compensation is and will remain a key element of our overall long-term incentive compensation package, although we exclude it as an expense when evaluating our ongoing operating performance for a particular period; and
- •
- Adjusted EBITDA does not reflect the impact of earnings or charges resulting from matters we consider not to be indicative of our ongoing operations.
- We compensate for these limitations by relying primarily on our GAAP results and using Adjusted EBITDA and Adjusted EBITDA margin only as supplemental information.
The following is a reconciliation of our net (loss) to Adjusted EBITDA:
| | Successor | | Predecessor | ||||||||||||
|---|---|---|---|---|---|---|---|---|---|---|---|---|---|---|---|
| | Fiscal Year Ended April 30, 2015 | One Month Ended April 30, 2014 | | Eleven Months Ended March 31, 2014 | Fiscal Year Ended April 30, 2013 | ||||||||||
| | (in thousands) | ||||||||||||||
Net (loss) | $ | (13,797 | ) | $ | (18,953 | ) | $ | (200,861 | ) | $ | (182,627 | ) | |||
Interest expense | 36,396 | 2,954 | 4,226 | 4,413 | |||||||||||
Change in fair value of mandatorily redeemable shares | — | — | 200,004 | 198,212 | |||||||||||
Interest income | (1,010 | ) | (76 | ) | (846 | ) | (798 | ) | |||||||
Income tax (benefit) expense | (4,526 | ) | (6,863 | ) | 6,623 | 11,534 | |||||||||
Depreciation expense | 32,208 | 3,818 | 12,224 | 11,665 | |||||||||||
Amortization expense | 31,957 | 2,518 | 38 | 72 | |||||||||||
| | | | | | | | | | | | | | | | |
EBITDA | $ | 81,228 | $ | (16,602 | ) | $ | 21,408 | $ | 42,471 | ||||||
| | | | | | | | | | | | | | | | |
Executive compensation(a) | $ | — | $ | 20 | $ | 2,427 | $ | 13,420 | |||||||
Stock appreciation rights expense(b) | 2,268 | 80 | 1,288 | 1,061 | |||||||||||
Redeemable noncontrolling interests(c) | 1,859 | 71 | 2,957 | 2,195 | |||||||||||
Equity-based compensation(d) | 6,455 | 1 | 27 | 82 | |||||||||||
Acquisition related costs(e) | 837 | 16,155 | 51,809 | 230 | |||||||||||
Severance and other costs for discontinued operations and closed branches(f) | 413 | — | — | (30 | ) | ||||||||||
Transaction costs (acquisitions and other)(g) | 1,891 | — | — | — | |||||||||||
Loss (gain) on disposal of assets | 1,089 | 170 | (1,034 | ) | (2,231 | ) | |||||||||
Management fee to related party(h) | 2,250 | 188 | — | — | |||||||||||
Effects of fair value adjustments to inventory(i) | 5,012 | 8,289 | — | — | |||||||||||
Interest rate swap and cap mark-to-market(j) | 2,494 | — | (192 | ) | 313 | ||||||||||
Contributions from acquisitions(k) | 8,064 | ||||||||||||||
| | | | | | | | | | | | | | | | |
Adjusted EBITDA | $ | 113,860 | $ | 8,372 | $ | 78,690 | $ | 57,511 | |||||||
| | | | | | | | | | | | | | | | |
| | | | | | | | | | | | | | | | |
| | | | | | | | | | | | | | | | |
- (a)
- Represents compensation paid to certain executives who were majority owners prior to the Acquisition. Following the Acquisition, these executives' compensation agreements were amended, and going forward we do not anticipate additional adjustments.
- (b)
- Represents non-cash compensation expenses related to stock appreciation rights agreements. For additional details regarding stock appreciation rights, refer to "Management's Discussion and Analysis of Financial Condition and Results of Operations—Critical Accounting Policies—Subsidiary Equity-Based Deferred Compensation Arrangements."
- (c)
- Represents non-cash compensation expense related to changes in the redemption values of noncontrolling interests. For additional details regarding redeemable noncontrolling interests of our subsidiaries, refer to "Management's Discussion and Analysis of Financial Condition and Results of Operations—Critical Accounting Policies—Subsidiary Equity-Based Deferred Compensation Arrangements."
15
- (d)
- Represents non-cash equity-based compensation expense related to stock options.
- (e)
- Represents non-recurring expenses related specifically to the Acquisition, including fees to financial advisors, accountants, attorneys and other professionals as well as costs related to the retirement of corporate stock appreciation rights. Also included are one-time bonuses paid to certain employees in connection with the Acquisition.
- (f)
- Represents severance expenses and other costs related to discontinued operations and closed branches.
- (g)
- Represents one-time costs related to this offering and acquisitions (other than the Acquisition) paid to third party advisors.
- (h)
- Represents management fees paid by us to our Sponsor. After this offering, our Sponsor will no longer receive management fees from us.
- (i)
- Represents the non-cash cost of sales impact of purchase accounting adjustments to increase inventory to its estimated fair value, primarily related to the Acquisition.
- (j)
- Represents the mark to market adjustments for certain financial instruments.
- (k)
- Represents earnings of acquired entities from the beginning of the period presented to the date of such acquisition, as well as certain purchasing synergies and cost savings, as defined in and permitted by the ABL Facility and the Term Loan Facilities. Contributions from acquisitions are only reflected for fiscal 2015.
- (3)
- Our Adjusted EBITDA for fiscal 2015 includes approximately $8.1 million from entities acquired in fiscal 2015 for the period prior to the date of acquisition of such entities, as defined in and permitted by the ABL Facility and the Term Loan Facilities. However, Adjusted EBITDA margin, which is calculated as a percentage of net sales, excludes this $8.1 million adjustment for fiscal 2015 to be consistent with our calculation of net sales for the same period.
- (4)
- Includes long-term debt and capital lease obligations.
- (5)
- Pro forma to give effect to the following transactions as if they had occurred as of the beginning of the period presented: (i) this offering, (ii) the repayment of $ million of indebtedness under the Second Lien Facility from the proceeds of this offering as described in "Use of Proceeds" and (iii) each of the related adjustments mentioned below.
- Adjustments to net (loss) for the fiscal year ended April 30, 2015 reflect (i) a $ decrease in interest expense (see the reconciliation of historical interest expense to pro forma interest expense below), (ii) a $ increase in income tax expense due to higher income before taxes relating to our pro forma net income and (iii) the removal of $ of our Sponsor's management fees. Pro forma net income for the fiscal year ended April 30, 2015 does not give effect to the payment of fees to our Sponsor of $ .
- The following is a reconciliation of historical net (loss) to pro forma net income for the fiscal year ended April 30, 2015:
| (in thousands) | Fiscal Year Ended April 30, 2015 | |||
|---|---|---|---|---|
Net (loss) | $ | |||
Decrease in interest expense(a) | ||||
Increase in income tax expense(b) | ||||
Removal of management fee(c) | ||||
| | | | | |
Pro forma net (loss) income | $ | |||
| | | | | |
| | | | | |
| | | | | |
- (a)
- See the reconciliation of historical interest expense to pro forma interest expense below.
- (b)
- Reflects an increase of $ in income tax expense for the fiscal year ended April 30, 2015 for the related tax effects of the pro forma adjustments. The tax impact is based upon an increase of pro forma income before taxes of $ and a statutory tax rate of %.
- (c)
- Reflects the removal of $ of our Sponsor's management fees for the fiscal year ended April 30, 2015. In connection with this offering, the management agreement will be terminated. See "Certain Relationships and Related Party Transactions."
16
The following is a reconciliation of historical interest expense to pro forma interest expense for the fiscal year ended April 30, 2015.
| (in thousands) | Fiscal Year Ended April 30, 2015 | |||
|---|---|---|---|---|
Interest expense | $ | |||
Decrease resulting from use of proceeds of this offering(a) | ||||
| | | | | |
Pro forma interest expense | $ | |||
| | | | | |
| | | | | |
| | | | | |
- (a)
- Assumes repayment of $ million of indebtedness under the Second Lien Facility, which bears interest at a rate of 7.75% per annum, from the proceeds of this offering, as if it had occurred as of the beginning of the period presented.
- (6)
- Gives effect to (i) the -for- stock split effected on , 2015 and (ii) the shares of our common stock to be issued by us in this offering. Pro forma basic net income per share consists of pro forma net income divided by the pro forma basic weighted average common shares outstanding. Pro forma diluted net income per share consists of pro forma net income divided by the pro forma diluted weighted average common shares outstanding.
17
Investing in our common stock involves a high degree of risk. You should carefully consider the following factors, as well as other information contained in this prospectus, before deciding to invest in shares of our common stock. The trading price of our common stock could decline due to any of these risks, and you may lose all or part of your investment in our common stock.
Risks Relating to Our Business and Industry
Our business is affected by general business, financial market and economic conditions, which could adversely affect our results of operations.
Our business and results of operations are significantly affected by general business, financial market and economic conditions. General business, financial market and economic conditions that could impact the level of activity in the commercial and residential construction and the repair and remodeling markets include, among others, interest rate fluctuations, inflation, unemployment levels, tax rates, capital spending, bankruptcies, volatility in both the debt and equity capital markets, liquidity of the global financial markets, the availability and cost of credit, investor and consumer confidence, global economic growth, local, state and federal government regulation and the strength of regional and local economies in which we operate.
There was a significant decline in economic growth, both in the United States and worldwide, that began in the second half of 2007 and continued through 2011. During this period, the U.S. construction markets we serve experienced unprecedented declines since the post-World War II era. There can be no guarantee that any improvement in these markets will be sustained or continue.
Our sales are in part dependent upon the commercial new construction market and the commercial repair and remodel market.
The recent downturn in the U.S. commercial new construction market was one of the most severe of the last 40 years. Previously, such downturns in the construction industry have typically lasted about 2 to 3 years, resulting in market declines of approximately 20% to 40%, while the recent downturn in the commercial construction market has lasted over 4 years, resulting in a market decline of approximately 60%. According to Dodge Data & Analytics, commercial construction put in place began to recover in 2013 and continued to increase 11% in 2014. However, 2014 levels of new commercial construction square footage put in place, measured by square footage of construction, are still well below the historical market average of 1.3 billion square feet annually since 1970. We cannot predict the duration of the current market conditions or the timing or strength of any future recovery of commercial construction activity in our markets. Continued weakness in the commercial construction market and the commercial R&R market, would have a significant adverse effect on our business, financial condition and operating results. Continued uncertainty about current economic conditions will continue to pose a risk to our business that serves the commercial construction and R&R markets as participants in this industry may postpone spending in response to tighter credit, negative financial news and/or declines in income or asset values, which could have a continued material negative effect on the demand for our products and services.
Our sales are also in part dependent upon the residential new construction market and home repair and remodeling activity.
The distribution of our products, particularly wallboard, to contractors serving the residential market represents a significant portion of our business. Though its cyclicality has historically been somewhat moderated by R&R activity, wallboard demand is highly correlated with housing starts. Housing starts and R&R activity, in turn, are dependent upon a number of factors, including housing demand, housing inventory levels, housing affordability, foreclosure rates, geographical shifts in the
18
population and other changes in demographics, the availability of land, local zoning and permitting processes, the availability of construction financing and the health of the economy and mortgage markets. Unfavorable changes in any of these factors beyond our control could adversely affect consumer spending, result in decreased demand for homes and adversely affect our business.
Beginning in mid-2006 and continuing through late-2011, the homebuilding industry experienced a significant downturn. This decrease in homebuilding activity led to a steep decline in wallboard demand which, in turn, had a significant adverse effect on our business during this time. According to the U.S. Census Bureau, 1.0 million housing units were started in 2014, representing an increase of 8% from 2013. Nevertheless, housing starts in 2014 remained significantly below their historical long-term average. In addition, some analysts project that the demand for residential construction may be negatively impacted as the number of renting households has increased in recent years and a shortage in the supply of affordable housing is expected to result in lower home ownership rates. The timing and extent of a recovery, if any, in homebuilding and the resulting impact on demand for our products are uncertain. Further, even if homebuilding activity fully recovers, the impact of such recovery on our business may be suppressed if, for example, the average selling price or average size of new single family homes decreases, which could cause homebuilders to decrease spending on our services and the products we distribute.
Beginning in 2007, the mortgage markets were also substantially disrupted as a result of increased defaults, primarily due to weakened credit quality of homeowners. In reaction to the disruption in the mortgage markets, stricter regulations and financial requirements were adopted and the availability of mortgages for potential homebuyers was significantly reduced as a result of a limited credit market and stricter standards to qualify for mortgages. Mortgage financing and commercial credit for smaller homebuilders, as well as for the development of new residential lots, continue to be constrained. If the residential construction industry continues to experience weakness and a reduction in activity, our business, financial condition and operating results will be significantly and adversely affected.
We also rely, in part, on home R&R activity. High unemployment levels, high mortgage delinquency and foreclosure rates, lower home prices, limited availability of mortgage and home improvement financing and significantly lower housing turnover, may restrict consumer spending, particularly on discretionary items such as home improvement projects, and affect consumer confidence levels leading to reduced spending in the R&R end markets. We cannot predict the timing or strength of a significant recovery in R&R activity, if any. Furthermore, without a significant recovery of the general economy, consumer preferences and purchasing practices and the strategies of our customers may adjust in a manner that could result in changes to the nature and prices of products demanded by the end consumer and our customers and could adversely affect our business and results of operations.
Our industry and the markets in which we operate are highly fragmented and competitive, and increased competitive pressure may adversely affect our results.
We currently compete in the wallboard, ceilings and complementary interior construction products distribution markets primarily with smaller distributors, but we also face competition from a number of national and multi-regional distributors of building materials, some of which are larger and have greater financial resources than us.
Competition varies depending on product line, type of customer and geographic area. If our competitors have greater financial resources, they may be able to offer higher levels of service or a broader selection of inventory than we can. As a result, we may not be able to continue to compete effectively with our competitors. Any of our competitors may (i) foresee the course of market development more accurately than we do, (ii) provide superior service and sell or distribute superior products, (iii) have the ability to supply or deliver similar products and services at a lower cost, (iv) develop stronger relationships with our customers and other consumers in the industry in which we
19
operate, (v) adapt more quickly to evolving customer requirements than we do, (vi) develop a superior network of distribution centers in our markets or (vii) access financing on more favorable terms than we can obtain. As a result, we may not be able to compete successfully with our competitors.
Competition can also reduce demand for our products, negatively affect our product sales or cause us to lower prices. The consolidation of homebuilders may result in increased competition for their business. Certain product manufacturers that sell and distribute their products directly to homebuilders may increase the volume of such direct sales. Our suppliers may also elect to enter into exclusive supplier arrangements with other distributors.
Our customers consider the performance of the products we distribute, our customer service and price when deciding whether to use our services or purchase the products we distribute. Excess industry capacity for certain products in several geographic markets could lead to increased price competition. We may be unable to maintain our operating costs or product prices at a level that is sufficiently low for us to compete effectively. If we are unable to compete effectively with our existing competitors or new competitors enter the markets in which we operate, our financial condition, operating results and cash flows may be adversely affected.
We are subject to significant pricing pressures.
Large contractors and homebuilders in both the commercial and residential industries have historically been able to exert significant pressure on their outside suppliers and distributors to keep prices low in the highly fragmented building products supply and services industry. The recent construction industry downturn significantly increased the pricing pressures from homebuilders and other customers. In addition, continued consolidation in the commercial and residential industries and changes in builders' purchasing policies and payment practices could result in even further pricing pressure. A decline in the prices of the products we distribute could adversely impact our operating results. When the prices of the products we distribute decline, customer demand for lower prices could result in lower sales prices and, to the extent that our inventory at the time was purchased at higher costs, lower margins. Alternatively, due to the rising market price environment, our suppliers may increase prices or reduce discounts on the products we distribute and we may be unable to pass on any cost increase to our customers, thereby resulting in reduced margins and profits. Overall, these pricing pressures may adversely affect our operating results and cash flows.
The trend toward consolidation in our industry may negatively impact our business.
Customer demands and supplier capabilities have resulted in consolidation in our industry, which could cause markets to become more competitive as greater economies of scale are achieved by distributors that are able to efficiently expand their operations. We believe these customer demands could result in fewer overall distributors operating multiple locations. There can be no assurance that we will be able to effectively take advantage of this trend toward consolidation which may make it more difficult for us to maintain operating margins and could also increase the competition for acquisition targets in our industry, resulting in higher acquisition costs and prices.
We may be unable to successfully implement our growth strategy, which includes pursuing strategic acquisitions and opening new branches.
Our long-term business strategy depends in part on increasing our sales and growing our market share through strategic acquisitions and opening new branches. If we fail to identify and acquire suitable acquisition targets on appropriate terms, our growth strategy may be materially and adversely affected. Further, if our operating results decline as a result of reduced activity in the residential or commercial construction markets, we may be unable to obtain the capital required to effect new acquisitions or open new branches.
20
In addition, we may not be able to integrate the operations of future acquired businesses in an efficient and cost-effective manner or without significant disruption to our existing operations. Moreover, acquisitions involve significant risks and uncertainties, including uncertainties as to the future financial performance of the acquired business, difficulties integrating acquired personnel and corporate cultures into our business, the potential loss of key employees, customers or suppliers, difficulties in integrating different computer and accounting systems, exposure to unknown or unforeseen liabilities of acquired companies, difficulties implementing disclosure controls and procedures and internal control over financial reporting for the acquired businesses, and the diversion of management attention and resources from existing operations. We may be unable to successfully complete potential acquisitions due to multiple factors, such as issues related to regulatory review of the proposed transactions. We may also be required to incur additional debt in order to consummate acquisitions in the future, which debt may be substantial and may limit our flexibility in using our cash flow from operations. Our failure to integrate future acquired businesses effectively or to manage other consequences of our acquisitions, including increased indebtedness, could prevent us from remaining competitive and, ultimately, could adversely affect our financial condition, operating results and cash flows.
In addition, if we finance acquisitions by issuing our equity securities or securities convertible into our equity securities, our existing stockholders would be diluted, which, in turn, could adversely affect the market price of our common stock. We could also finance an acquisition with debt, resulting in higher leverage and interest costs relating to the acquisition. As a result, if we fail to evaluate and execute acquisitions efficiently, we may not ultimately experience the anticipated benefits of the acquisitions, and we may incur costs that exceed our expectations.
We may not be able to expand into new geographic markets, which may impact our ability to grow our business.
We intend to continue to pursue our growth strategy to expand into new geographic markets for the foreseeable future. Our expansion into new geographic markets may present competitive, distribution and other challenges that differ from the challenges we currently face. In addition, we may be less familiar with the customers in these markets and may ultimately face different or additional risks, as well as increased or unexpected costs, compared to those we experience in our existing markets. Expansion into new geographic markets may also expose us to direct competition with companies with whom we have limited or no past experience as competitors. To the extent we rely upon expanding into new geographic markets and do not meet, or are unprepared for, any new challenges posed by such expansion, our future sales growth could be negatively impacted, our operating costs could increase, and our business operations and financial results could be negatively affected.
Product shortages, loss of key suppliers or failure to develop relationships with qualified suppliers, and our dependence on third-party suppliers and manufacturers could affect our financial health.
We distribute wallboard, ceilings and related specialty building materials that are manufactured by a number of major suppliers. Our ability to offer a wide variety of products to our customers is dependent upon our ability to obtain adequate product supply from manufacturers and other suppliers. Generally, the products we distribute are obtainable from various sources and in sufficient quantities. Any disruption in our sources of supply, particularly of the most commonly sold items, could result in a loss of revenues, reduced margins and damage to our relationships with customers. Supply shortages may occur as a result of unanticipated increases in demand or difficulties in production or delivery. When shortages occur, our suppliers often allocate products among distributors. The loss of, or a substantial decrease in the availability of, products from our suppliers or the loss of key supplier arrangements, such as those whereby we are afforded exclusive distribution rights in certain geographic
21
areas, could adversely impact our financial condition, operating results and cash flows. For example, if our relationship with Armstrong were to be damaged or lost, our financial condition, operating results and cash flows may suffer.
Our ability to maintain relationships with qualified suppliers who can satisfy our high standards for quality and our need to be supplied with products in a timely and efficient manner is a significant challenge. Our suppliers' ability to provide us with products can also be adversely affected in the event they become financially unstable, particularly in light of continuing economic difficulties in various regions of the United States and the world, fail to comply with applicable laws, encounter supply disruptions, shipping interruptions or increased costs, or they become faced with other factors beyond our control.
Although in many instances we have agreements with our suppliers, these agreements are generally terminable by either party on limited notice. If market conditions change, suppliers may stop offering us favorable terms. Failure by our suppliers to continue to supply us with products on favorable terms, commercially reasonable terms, or at all, could put pressure on our operating margins or have a material adverse effect on our financial condition, operating results and cash flows.
The commercial and residential construction markets are seasonal.
The markets in which we operate are seasonal. Although weather patterns affect our operating results throughout the year, the months of November through February have historically been, and are generally expected to continue to be, adversely affected by weather patterns in some of our markets, causing reduced commercial and residential construction activity. We experience seasonal variation as a result of our customers' dependence on suitable weather to engage in construction, repair and remodeling projects. For example, during the winter months, construction activity generally declines due to inclement weather and shorter daylight hours. In addition, to the extent that hurricanes, severe storms, earthquakes, floods, fires, other natural disasters or similar events occur in the markets in which we operate, our business may be adversely affected. As a result, our operating results have historically varied significantly between fiscal quarters, and we anticipate that we will continue to experience these quarterly fluctuations in the future.
The loss of any of our significant customers or a reduction in the quantity of products they purchase could affect our financial health.
Our ten largest customers generated approximately 10.6% and 11.1% of our net sales in the aggregate for our fiscal 2015 and full year 2014, respectively. We cannot guarantee that we will maintain or improve our relationships with these customers, or successfully assume the customer relationships of any businesses that we acquire, or that we will continue to supply these customers at historical levels. Due to the weak housing market in recent years in comparison to long-term averages, many of our homebuilder customers substantially reduced their construction activity. Some of our homebuilder customers exited or severely curtailed building activity in certain of our markets.
In addition, professional homebuilders, commercial builders and other customers may: (i) purchase some of the products that we currently sell and distribute directly from manufacturers; (ii) elect to establish their own building products manufacturing and distribution facilities or (iii) give advantages to manufacturing or distribution intermediaries in which they have an economic stake. Continued consolidation among professional homebuilders and commercial builders could also result in a loss of some of our present customers to our competitors. The loss of one or more of our significant customers or deterioration in our existing relationships with any of our customers could adversely affect our financial condition, operating results and cash flows. Furthermore, our customers typically are not required to purchase any minimum amount of products from us. Should our customers purchase the products we distribute in significantly lower quantities than they have in the past, or should the customers of any businesses that we acquire purchase products from us in significantly lower quantities than they had prior to our acquisition of the business, such decreased purchases could have a material adverse effect on our financial condition, operating results and cash flows.
22
We are exposed to product liability, warranty, casualty, construction defect, contract, tort, employment and other claims and legal proceedings related to our business, the products we distribute, the services we provide and services provided for us by third parties.
In the ordinary course of business, we are subject to various claims and litigation. Any such claims, whether with or without merit, could be time consuming and expensive to defend and could divert management's attention and resources. The building materials industry has been subject to personal injury and property damage claims arising from alleged exposure to raw materials contained in building products as well as claims for incidents of catastrophic loss, such as building fires. As a distributor of building materials, we face an inherent risk of exposure to product liability claims in the event that the use of the products we have distributed in the past or may in the future distribute is alleged to have resulted in economic loss, personal injury or property damage or violated environmental, health or safety or other laws. Such product liability claims have included and may in the future include allegations of defects in manufacturing, defects in design, a failure to warn of dangers inherent in the product, negligence, strict liability or a breach of warranties. In particular, certain of our subsidiaries have been the subject of claims related to alleged exposure to asbestos-containing products they distributed prior to 1979, which have not materially impacted our financial condition or operating results. See "Business—Litigation and Legal Proceedings." We are also from time to time subject to casualty, contract, tort and other claims relating to our business, the products we have distributed in the past or may in the future distribute, and the services we have provided in the past or may in the future provide, either directly or through third parties. If any such claim were adversely determined, our financial condition, operating results and cash flows could be adversely affected if we were unable to seek indemnification for such claims or were not adequately insured for such claims. We rely on manufacturers and other suppliers to provide us with the products we sell or distribute. Since we do not have direct control over the quality of products that are manufactured or supplied to us by third-parties, we are particularly vulnerable to risks relating to the quality of such products. In addition, we are exposed to potential claims arising from the conduct of our employees, builders and their subcontractors, and third-party installers for which we may be liable. We and they are subject to regulatory requirements and risks applicable to general contractors, which include management of licensing, permitting and quality of third-party installers. As they apply to our business, if we fail to manage these processes effectively or provide proper oversight of these services, we could suffer lost sales, fines and lawsuits, as well as damage to our reputation, which could adversely affect our business and the results of our operations.
In addition, claims and investigations may arise related to distributor relationships, commercial contracts, antitrust or competition law requirements, employment matters, employee benefits issues and other compliance and regulatory matters, including anti-corruption and anti-bribery matters. While we have processes and policies designed to mitigate these risks and to investigate and address such claims as they arise, we cannot predict or, in some cases, control the costs to defend or resolve such claims.
Although we believe we currently maintain suitable and adequate insurance in excess of our self-insured amounts, there can be no assurance that we will be able to maintain such insurance on acceptable terms or that such insurance will provide adequate protection against potential liabilities, and the cost of any product liability, warranty, casualty, construction defect, contract, tort, employment or other litigation or other proceeding, even if resolved in our favor, could be substantial. Additionally, we do not carry insurance for all categories of risk that our business may encounter. Any significant uninsured liability may require us to pay substantial amounts. There can be no assurance that any current or future claims will not adversely affect our financial position, cash flows or results of operations.
23
Our operations are subject to various hazards that may cause personal injury or property damage and increase our operating costs, and which may exceed the coverage of our insurance.
There are inherent risks to our operations. Our delivery employees are subject to the usual hazards associated with providing services on construction sites, while our distribution center personnel are subject to the hazards associated with moving and storing large quantities of heavy materials. In addition, we employ approximately 950 drivers in connection with our distribution operations and, from time to time, these drivers are involved in accidents which may cause injuries and in which goods carried by these drivers may be lost or damaged. Our trucks with articulating boom loaders, particularly when loaded, expose our drivers and others to traffic hazards.
Operating hazards can cause personal injury and loss of life, damage to or destruction of property, building and equipment and environmental damage, and we cannot eliminate these risks. We maintain vehicle and commercial insurance to cover property damages and personal injuries resulting from traffic accidents, and rely on state mandated social insurance for work-related injuries of our employees. Nevertheless, any claim that exceeds the scope of our insurance coverage, if successful and of sufficient magnitude, could result in the incurrence of substantial costs and the diversion of resources, which could have a material adverse effect on us. A material increase in the frequency or severity of accidents, claims for lost or damaged goods, liability claims, workers' compensation claims, or unfavorable resolutions of any such claims could also adversely affect our results of operations to the extent such claims are not covered by our insurance or such losses exceed our reserves. Further, significant increases in insurance costs or the inability to purchase insurance as a result of these claims could reduce our profitability and have an adverse effect on our results of operations. The timing of the incurrence of these costs could significantly and adversely impact our operating results compared to prior periods.
Failure to attract and retain key employees could have a significant adverse effect on our business.
Our success depends to a large extent on our ability to attract, hire, train and retain qualified managerial, operational, sales and other personnel. We face significant competition for qualified and experienced employees in our industry and from other industries and, as a result, we may be unable to attract and retain the personnel needed to successfully conduct and grow our operations. Additionally, key personnel, including members of management and our sales team with key customer relationships, may leave and compete against us.
Our continued success also depends to a significant degree on the continued service of our senior management team. Each member having an average of 25 years of experience in the building products distribution sector, our senior management team has been integral to our successful acquisition and integration of businesses to grow our market share. The loss of any member of our senior management team or other experienced, senior employees or sales team members could significantly impair our ability to execute our business plan, cause us to lose customers and reduce our net sales, or lead to challenges with employee morale and the loss of other key employees. In any such event, our financial condition, operating results and cash flows could be adversely affected.
Additionally, the recent downturn in the general economy and the markets we serve resulted in a reduction of the workforce in the construction industry. There can be no assurance that we or our customers will be able to efficiently attract employees as activity in the markets we serve returns to historical levels. As a result, we and our customers may experience higher costs in attracting and retaining such employees. Any significant increases in these costs may have an adverse effect on our financial position, cash flows or results of operations.
Higher health care costs and labor costs could adversely affect our business.
As a result of the passage in 2010 of the U.S. Patient Protection and Affordable Care Act, or the ACA, we are required to provide affordable coverage, as defined in the ACA, to all employees, or
24
otherwise be subject to a payment per employee based on the affordability criteria in the ACA. Additionally, some states and localities have passed state and local laws mandating the provision of certain levels of health benefits by some employers. Increased health care and insurance costs as well as other changes in federal or state workplace regulations could have a material adverse effect on our business, financial condition and results of operations.
Various federal and state labor laws govern our relationships with our employees and affect our operating costs. These laws include employee classifications as exempt or non-exempt, minimum wage requirements, unemployment tax rates, workers' compensation rates, overtime, family leave, safety standards, payroll taxes, citizenship requirements and other wage and benefit requirements for employees classified as non-exempt. As our employees may be paid at rates that relate to the applicable minimum wage, further increases in the minimum wage could increase our labor costs. Significant additional government regulations could materially affect our business, financial condition and results of operations.
In addition, we compete with other companies for many of our employees in hourly positions, and we invest significant resources to train and motivate our employees to maintain a high level of job satisfaction. Our hourly employment positions have historically had high turnover rates, which can lead to increased spending on training and retention and, as a result, increased labor costs. If we are unable to effectively retain highly qualified employees in the future, it could adversely impact our operating results.
The majority of our net sales are credit sales that are made primarily to customers whose ability to pay is dependent, in part, upon the economic strength of the industry and geographic areas in which they operate, and the failure to collect or timely collect monies owed from customers could adversely affect our financial condition.
The majority of our net sales volume in fiscal 2015 was facilitated through the extension of credit to our customers whose ability to pay is dependent, in part, upon the economic strength of the industry in the areas where they operate. We offer credit to customers, either through unsecured credit that is based solely upon the creditworthiness of the customer, or secured credit for materials sold for a specific construction project where we establish a security interest in the material used in the project. The type of credit we offer depends both on the customer's financial strength and the nature of the business in which the customer is involved. End users, resellers and other non-contractor customers typically purchase more on unsecured credit than secured credit. If any of our customers are unable to repay credit that we have extended in a timely manner, or at all, our financial condition, operating results and cash flows would be adversely affected. Further, our collections efforts with respect to non-paying or slow-paying customers could negatively impact our customer relations going forward.
Because we depend on certain of our customers to repay extensions of credit, if the financial condition of our customers declines, our credit risk could increase as a result. Significant contraction in the commercial and residential construction markets, coupled with limited credit availability and stricter financial institution underwriting standards, could adversely affect the operations and financial stability of certain of our customers. Should one or more of our larger customers declare bankruptcy, it could adversely affect the collectability of our accounts receivable, bad debt reserves and net income.
We occupy many of our facilities under long-term non-cancellable leases, and we may be unable to renew our leases at the end of their terms.
Many of our facilities and distribution centers are located on leased premises subject to non-cancellable leases. Typically, our leases have initial terms ranging from three to five years, with options to renew for specified periods of time. We believe that our future leases will likely also be long-term and non-cancellable and have similar renewal options. If we close or stop fully utilizing a facility, we will most likely remain obligated to perform under the applicable lease, which would
25
include, among other things, making the base rent payments, and paying insurance, taxes and other expenses on the leased property for the remainder of the lease term. Our future minimum aggregate rental commitments for leases for our facilities and distribution centers, as of April 30, 2015, is approximately $50.8 million of which $49.4 million is not reflected as liabilities on our balance sheet. Our inability to terminate a lease when we stop fully utilizing a facility or exit a geographic market can have a significant adverse impact on our financial condition, operating results and cash flows.
In addition, at the end of the lease term and any renewal period for a facility, we may be unable to renew the lease without substantial additional cost, if at all. If we are unable to renew our facility leases, we may close or relocate a facility, which could subject us to construction and other costs and risks, which in turn could have a material adverse effect on our business and operating results. Further, we may not be able to secure a replacement facility in a location that is as commercially viable, including access to rail service, as the lease we are unable to renew. Having to close a facility, even briefly to relocate, would reduce the sales that such facility would have contributed to our revenues. Additionally, a relocated facility may generate less revenue and profit, if any, than the facility it was established to replace.
We may be unable to effectively manage our inventory and working capital as our sales volume increases or the prices of the products we distribute fluctuate, which could have a material adverse effect on our business, financial condition and operating results.
We purchase certain products, including wallboard, ceilings, steel framing and other specialty building materials, from manufacturers which are then sold and distributed to customers. We must maintain, and have adequate working capital to purchase, sufficient inventory to meet customer demand. Due to the lead times required by our suppliers, we order products in advance of expected sales. As a result, we are required to forecast our sales and purchase accordingly. In periods characterized by significant changes in economic growth and activity in the commercial and residential building and home repair and remodeling industries, it can be especially difficult to forecast our sales accurately. We must also manage our working capital to fund our inventory purchases. Excessive increases in the market prices of certain building products, such as wallboard, ceilings and steel framing, can put negative pressure on our operating cash flows by requiring us to invest more in inventory. In the future, if we are unable to effectively manage our inventory and working capital as we attempt to expand our business, our cash flows may be negatively affected, which could have a material adverse effect on our business, financial condition and operating results.
The agreements that govern our indebtedness contain various financial covenants that could limit our ability to engage in activities that may be in our best long-term interests.
The agreements that govern our indebtedness include covenants that, among other things, may impose significant operating and financial restrictions, including restrictions on our ability to engage in activities that may be in our best long-term interests. These covenants may restrict our ability to:
- •
- incur additional indebtedness;
- •
- create or maintain liens on property or assets;
- •
- make investments, loans and advances;
- •
- sell certain assets or engage in acquisitions, mergers or consolidations;
- •
- redeem debt;
- •
- pay dividends and distributions; and
- •
- enter into transactions with affiliates.
In addition, under the terms of our senior secured asset based revolving credit facility, or the ABL Facility, we may at times be required to comply with a specified fixed charge coverage ratio. Our ability to meet this ratio could be affected by events beyond our control, and we cannot assure that we will meet this ratio.
26
A breach of any of the covenants under any of our debt agreements would result in a default under such agreement. If any such default occurs, the administrative agent under the agreement would be entitled to take various actions, including the acceleration of amounts due under the agreement and all actions permitted to be taken by a secured creditor. This could have serious adverse consequences on our financial condition and could cause us to become insolvent.
Our current indebtedness, degree of leverage and any future indebtedness we may incur, may adversely affect our cash flow, limit our operational and financing flexibility and negatively impact our business and our ability to make payments on our indebtedness and declare dividends and make other distributions.
Our subsidiary, GYP Holdings III Corp., entered into the ABL Facility and the Term Loan Facilities in connection with the Acquisition. As of April 30, 2015, $17.0 million was outstanding under the ABL Facility and $171.7 million was available for future borrowings under the ABL Facility. In addition, we had $386.1 million outstanding under the First Lien Facility and $160.0 million outstanding under the Second Lien Facility. We may incur substantial additional debt in the future. The ABL Facility, the Term Loan Facilities and other debt instruments we may enter into in the future, may have significant consequences to our business and, as a result, may impact our stockholders, including:
- •
- impairing our ability to obtain additional financing for working capital, capital expenditures, acquisitions or general corporate purposes;
- •
- requiring us to dedicate a significant portion of our cash flows from operations to pay interest on any outstanding indebtedness, which would reduce the funds available to us for operations and other purposes;
- •
- limiting our flexibility in planning for, or reacting to, changes in our business, the industries in which we operate;
- •
- making it more difficult for us to satisfy our obligations with respect to our indebtedness;
- •
- making us more vulnerable to adverse changes in general economic, industry and competitive conditions and adverse changes in government regulation;
- •
- placing us at a competitive disadvantage compared to our competitors that are less leveraged and, therefore, more able to take advantage of opportunities that our leverage prevents us from exploiting;
- •
- impairing our ability to refinance existing indebtedness or borrow additional amounts for working capital, capital expenditures, acquisitions, debt service requirements, execution of our business strategy or other purposes;
- •
- restricting our ability to pay dividends and make other distributions; and
- •
- adversely affecting our credit ratings.
Any of the above listed factors could materially adversely affect our financial condition, liquidity or results of operations.
Furthermore, we expect that we will depend primarily on cash generated by our operations in order to pay our expenses and any amounts due under our existing indebtedness and any future indebtedness we may incur. As a result, our ability to repay our indebtedness depends on the future performance of our business, which will be affected by financial, business, economic and other factors, many of which we cannot control. Our business may not generate sufficient cash flows from operations in the future and we may not achieve our currently anticipated growth in revenues and cash flows, either or both of which could result in our being unable to repay indebtedness or to fund other liquidity needs. If we do not have enough funds, we may be required to refinance all or part of our then existing indebtedness, sell assets or borrow additional funds, in each case on terms that may not be acceptable to us, if at all. In addition, the terms of existing or future debt agreements, including our
27
existing ABL Facility, may restrict us from engaging in any of these alternatives. Our ability to recapitalize and incur additional debt in the future could also delay or prevent a change in control of our Company, make certain transactions more difficult to complete or impose additional financial or other covenants on us.
Despite our current level of indebtedness, we may still be able to incur substantially more debt. This could further exacerbate the risks to our financial condition described above.
We may be able to incur significant additional indebtedness in the future, including secured debt. Although the agreements governing our indebtedness contain restrictions on the incurrence of additional indebtedness, these restrictions are subject to a number of qualifications and exceptions, and the additional indebtedness incurred in compliance with these restrictions could be substantial. These restrictions also will not prevent us from incurring obligations that do not constitute indebtedness, including obligations under lease arrangements that are currently recorded as operating leases even if operating leases were to be treated as debt under GAAP. In addition, the ABL Facility provides a commitment of up to $200.0 million, subject to a borrowing base. As of April 30, 2015, we are able to borrow an additional $171.7 million under the ABL Facility. If new debt is added to our current debt levels, the related risks that we now face could intensify. See "Description of Certain Indebtedness."
An increase in interest rates would increase the cost of servicing our debt and could reduce our profitability.
A significant portion of our outstanding debt bears interest at variable rates. We have entered into an interest rate cap on three-month U.S. dollar LIBOR, which effectively caps the interest rate at 5.75% on an initial notional amount of $275.0 million of our variable rate debt obligation under the First Lien Facility, or any replacement facility with similar terms. However, increases in interest rates with respect to any amount of our debt not covered by the interest rate cap could increase the cost of servicing our debt and could materially reduce our profitability and cash flows. Excluding the effect of the interest rate cap and the interest rate floor on the Term Loan Facilities, each 1% increase in interest rates on the Term Loan Facilities would increase our annual interest expense by approximately $5.5 million based on balances outstanding under the Term Loan Facilities as of April 30, 2015. Assuming the ABL Facility was fully drawn, each 1% increase in interest rates would result in a $2.0 million increase in annual interest expense on the ABL Facility. The impact of increases in interest rates could be more significant for us than it would be for some other comparable companies because of our substantial indebtedness.
We incurred net losses in recent periods and we may experience net losses in the future.
We experienced net losses of $13.8 million, $19.0 million and $200.9 million for fiscal 2015, the one month ended April 30, 2014 and the eleven months ended March 31, 2014, respectively. There is no guarantee that we will be successful in realizing net income or otherwise achieving profitability or sustaining positive Adjusted EBITDA and operating cash flow in future periods. Any failure to achieve net income or sustain positive Adjusted EBITDA and operating cash flow could, among other things, impair our ability to complete future financings, increase the cost of obtaining financing or force us to seek additional capital through sales of our equity securities, which could dilute the value of any shares of common stock you purchase in this offering. In addition, a lack of profitability could adversely affect the price of our common stock.
We may have future capital needs that require us to incur additional debt and may be unable to obtain additional financing on acceptable terms, if at all.
We rely substantially on the liquidity provided by our existing ABL Facility and cash on hand to provide working capital and fund our operations. Our working capital and capital expenditure requirements are likely to grow as the commercial and residential construction markets improve and we execute our strategic growth plan. Economic and credit market conditions, the performance of the
28
commercial and residential construction markets, and our financial performance, as well as other factors, may constrain our financing abilities. Our ability to secure additional financing, if available, and to satisfy our financial obligations under indebtedness outstanding from time to time will depend upon our future operating performance, the availability of credit, economic conditions and financial, business and other factors, many of which are beyond our control. The prolonged continuation or worsening of current housing market conditions and the macroeconomic factors that affect our industry could require us to seek additional capital and have a material adverse effect on our ability to secure such capital on favorable terms, if at all.
We may be unable to secure additional financing or financing on favorable terms or our operating cash flow may be insufficient to satisfy our financial obligations under our outstanding indebtedness. If additional funds are raised through the issuance of additional equity or convertible debt securities, our stockholders may experience significant dilution. We may also incur additional indebtedness in the future, including secured debt, subject to the restrictions contained in the ABL Facility and the Term Loan Facilities. If new debt is added to our current debt levels, the related risks that we now face could intensify.
Because we are a holding company with no operations of our own, we are financially dependent on receiving distributions from our subsidiaries and we could be harmed if such distributions could not be made in the future.
We are a holding company and all of our operations are conducted through subsidiaries. Consequently, we rely on payments or distributions from our subsidiaries. We do not currently expect to declare or pay dividends on our common stock for the foreseeable future; however, to the extent that we determine in the future to pay dividends on our common stock, we will be dependent on our subsidiaries to make funds available to us for the payment of such dividends. The ability of such subsidiaries to pay dividends or make other payments or distributions to us is subject to applicable local law. Such laws and restrictions could limit the payment of dividends and distributions to us, which would restrict our ability to continue operations. In addition, the terms of the agreements governing the ABL Facility and the Term Loan Facilities restrict the ability of our subsidiaries to pay dividends, make loans or otherwise transfer assets to us. Furthermore, our subsidiaries are permitted under the terms of the ABL Facility and the Term Loan Facilities to incur additional indebtedness that may restrict or prohibit the making of distributions, the payment of dividends or the making of loans by such subsidiaries to us.
Some of our subsidiaries sponsor deferred compensation arrangements that entitle selected employees of those subsidiaries to participate in increases in the adjusted book value of a specified number of shares of common stock of those subsidiaries. Employees participate in these arrangements through cash-based stock appreciation rights, by holding common stock of the applicable subsidiary and/or through deferred compensation programs. As of April 30, 2015, we recorded an aggregate of $41.6 million of liabilities related to these compensation arrangements on our consolidated balance sheets, of which $2.6 million is classified as a current liability and the remainder is classified as a long-term liability. Upon termination of employment of those with whom we have these arrangements, these subsidiaries are required to make payments to these individuals. Settlements of these awards are typically made with cash or through execution of an installment note payable to the employee over a period of four to five years. Any requirement to make payments to employees pursuant to these deferred compensation arrangements could impact the cash flows of these subsidiaries and their ability to make funds available to us.
An impairment of goodwill could have a material adverse effect on our results of operations.
Acquisitions frequently result in the recording of goodwill and other intangible assets. At April 30, 2015, goodwill represented 29.7% of our total assets. Goodwill is not amortized and is subject to
29
impairment testing at least annually using a fair value based approach. The identification and measurement of goodwill impairment involves the estimation of the fair value of our reporting units, which are consistent with our operating segments. The estimates of fair value of reporting units are based on the best information available as of the date of the assessment and incorporate management assumptions about expected future cash flows and other valuation techniques. Future cash flows can be affected by changes in industry or market conditions, among other factors. The recoverability of goodwill is evaluated at least annually and when events or changes in circumstances indicate that the fair value of a reporting unit has more likely than not declined below its carrying value. The annual impairment test resulted in no impairment of goodwill during fiscal 2015, full year 2014 or fiscal 2013.
We cannot accurately predict the amount and timing of any impairment of assets, and, in the future, we may be required to take additional goodwill or other asset impairment charges relating to certain of our reporting units. Any such non-cash charges would have an adverse effect on our financial results.
Federal, state, local and other regulations could impose substantial costs and restrictions on our operations that would reduce our net income.
We are subject to various federal, state, local and other laws and regulations, including, among other things, transportation regulations promulgated by the U.S. Department of Transportation, or the DOT, work safety regulations promulgated by the Occupational Safety and Health Administration, or OSHA, employment regulations promulgated by the U.S. Equal Employment Opportunity Commission, regulations of the U.S. Department of Labor, accounting standards issued by the Financial Accounting Standards Board or similar entities, and state and local zoning restrictions, building codes and contractors' licensing regulations. More burdensome regulatory requirements in these or other areas may increase our general and administrative costs and adversely affect our financial condition, operating results and cash flows. Moreover, failure to comply with the regulatory requirements applicable to our business could expose us to litigation and substantial fines and penalties that could adversely affect our financial condition, operating results and cash flows.
Our transportation operations, upon which we depend to distribute products from our distribution centers, are subject to the regulatory jurisdiction of the DOT, which has broad administrative powers with respect to our transportation operations. Vehicle dimensions and driver hours of service also are subject to both federal and state regulation. More restrictive limitations on vehicle weight and size, trailer length and configuration, or driver hours of service would increase our costs, which, if we are unable to pass these cost increases on to our customers, may increase our selling, general and administrative expenses and adversely affect our financial condition, operating results and cash flows. If we fail to comply adequately with the DOT regulations or regulations become more stringent, we could experience increased inspections, regulatory authorities could take remedial action including imposing fines or shutting down our operations or we could be subject to increased audit and compliance costs. If any of these events were to occur, our financial condition, operating results and cash flows would be adversely affected.
In addition, the commercial and residential construction industries are subject to various local, state and federal statutes, ordinances, codes, rules and regulations concerning zoning, building design and safety, construction, contractor licensing, energy conservation and similar matters, including regulations that impose restrictive zoning and density requirements on the residential new construction industry or that limit the number of homes or other buildings that can be built within the boundaries of a particular area. Regulatory restrictions may increase our operating expenses and limit the availability of suitable building lots for our customers, any of which could negatively affect our business, financial condition and results of operations.
30
Compliance with environmental, health and safety laws and regulations could be expensive. Failure to comply with environmental, health and safety laws and regulations could subject us to significant liability.
We are subject to various federal, state and local environmental, health and safety laws and regulations, including laws and regulations governing the investigation and cleanup of contaminated properties, air emissions, water discharges, waste management and disposal, product safety and the health and safety of our employees and customers. These laws and regulations impose a variety of requirements and restrictions on our operations and the products we distribute. Our failure to comply with these laws and regulations could result in fines, penalties, enforcement actions, third party claims, damage to property or natural resources and personal injury, requirements to investigate or cleanup property or to pay for the costs of investigation or cleanup, or regulatory or judicial orders requiring corrective measures, including the installation of pollution control equipment or remedial actions and could negatively impact our reputation with customers. Environmental, health and safety laws and regulations applicable to our business, the products we distribute and the business of our customers, and the interpretation or enforcement of these laws and regulations, are constantly evolving and it is difficult to accurately predict the effect that changes in these laws and regulations, or their interpretation or enforcement, may have upon our business, financial condition or results of operations. Should environmental, health and safety laws and regulations, or their interpretation or enforcement, become more stringent, our costs, or the costs of our customers, could increase, which may have an adverse effect on our business, financial position, results of operations or cash flows.
Under certain environmental laws and regulations, such as the U.S. federal Superfund law or its state equivalents, the obligation to investigate, remediate, monitor and clean up contamination at a facility may be imposed on current and former owners, lessees or operators or on persons who may have sent waste to that facility for disposal. Liability under these laws and regulations may be imposed without regard to fault or to the legality of the activities giving rise to the contamination. Contamination has been identified at several of our current and former facilities, and we have incurred and will continue to incur costs to investigate, remediate, monitor and otherwise address these conditions. Moreover, we may incur liabilities in connection with environmental conditions currently unknown to us relating to our prior, existing or future owned or leased sites or operations or those of predecessor companies whose liabilities we may have assumed or acquired.
Any significant fuel cost increases or shortages in the supply of fuel could disrupt our ability to distribute products to our customers, which could adversely affect our results of operations.
We currently use our own fleet of approximately 2,000 owned and leased vehicles to service customers in the regions in which we operate. As a result, we are inherently dependent upon energy to operate and are impacted by changes in diesel fuel prices. The cost of fuel has reached historically high levels during portions of the last several years, is largely unpredictable and has a significant impact on our results of operations. Fuel availability, as well as pricing, is also impacted by political and economic factors. It is difficult to predict the future availability of fuel due to the following factors, among others:
- •
- dependency on foreign imports of crude oil and the potential for hostilities or other conflicts in oil producing areas;
- •
- limited refining capacity; and
- •
- the possibility of changes in governmental policies on fuel production, transportation and marketing.
Significant disruptions in the supply of fuel could have a negative impact on fuel prices and thus our financial condition and results of operations.
31
A disruption or breach of our IT systems could adversely impact our business and operations.
We rely on the accuracy, capacity and security of our IT systems, some of which are managed or hosted by third parties, and our ability to continually update these systems in response to the changing needs of our business. In the ordinary course of our business, we collect and store sensitive data, including our proprietary business information and that of our customers, suppliers and business partners, and personally identifiable information of our customers and employees, in our data centers and on our networks. The secure processing, maintenance and transmission of this information is critical to our operations. We have incurred costs and may incur significant additional costs in order to implement the security measures that we feel are appropriate to protect our IT systems. Our security measures are focused on the prevention, detection and remediation of damage from computer viruses, natural or man-made disasters, unauthorized access, cyber attacks and other similar disruptions. Despite our security measures, our IT systems and infrastructure may be vulnerable to attacks by hackers or breached due to employee error, malfeasance or other disruptions. Any attacks on our IT systems could result in our systems or data being breached or damaged by computer viruses or unauthorized physical or electronic access. Such a breach could result in not only business disruption, but also theft of our intellectual property or other competitive information or unauthorized access to controlled data and any personal information stored in our IT systems. To the extent that any data is lost or destroyed or any confidential information is inappropriately disclosed or used, it could adversely affect our competitive position or customer relationships. In addition, any such access, disclosure or other loss of information could result in legal claims or proceedings, liability under laws that protect the privacy of personal information, damage our reputation and cause a loss of confidence in our business, products and services, which could adversely affect our business, financial condition, profitability and cash flows. To date, we have not experienced a material breach of our IT systems. However, during the course of preparing for this offering, we identified a material weakness in our general IT computer controls. See "—Risks Related to this Offering and Ownership of Our Common Stock—We have identified material weaknesses in our internal control over financial reporting. If our remediation of these material weaknesses is not effective, or if we experience additional material weaknesses in the future or otherwise fail to maintain an effective system of internal controls in the future, we may not be able to accurately or timely report our financial condition or results of operations, which may adversely affect investor confidence in us and, as a result, the value of our common stock."
Natural or man-made disruptions to our facilities may adversely affect our business and operations.
We currently maintain a broad network of distribution facilities throughout the United States, as well as our Yard Support Center in Atlanta, Georgia, which supports our branches with various back office functions. In the event any of our facilities are damaged or operations are disrupted from fire, earthquake, weather-related events, an act of terrorism or any other cause, a significant portion of our inventory could be damaged and our ability to distribute products to customers could be materially impaired. Moreover, we could incur significantly higher costs and experience longer lead times associated with distributing products to our customers during the time that it takes for us to reopen or replace a damaged facility. Disruptions to the national or local transportation infrastructure systems, including those related to a domestic terrorist attack, may also affect our ability to keep our operations and services functioning properly. If any of these events were to occur, our financial condition, operating results and cash flows could be materially adversely affected.
Anti-terrorism measures and other disruptions to the transportation network could impact our distribution system and our operations.
Our ability to efficiently distribute products to our customers is an integral component of our overall business strategy. In the aftermath of terrorist attacks in the United States, federal, state and local authorities have implemented and continue to implement various security measures that affect
32
many parts of the transportation network in the United States. Our customers typically need quick delivery and rely on our on-time delivery capabilities. If security measures disrupt or impede the timing of our deliveries, we may fail to meet the needs of our customers, or may incur increased expenses to do so.
Risks Related to this Offering and Ownership of Our Common Stock
There is no existing market for our common stock, and we do not know if one will develop to provide you with adequate liquidity to sell our common stock at prices equal to or greater than the price you paid in this offering.
Prior to this offering, there has not been a public market for our common stock. Although we expect that our common stock will be approved for listing on , if an active trading market for our common stock does not develop following this offering, you may not be able to sell your shares quickly or above the initial public offering price. The initial public offering price for the shares will be determined by negotiations between us and representatives of the underwriters and may not be indicative of prices that will prevail in the trading market, and the value of our common stock may decrease from the initial public offering price.
The market price of our common stock may be highly volatile, and you may not be able to resell your shares at or above the initial public offering price.
The trading price of our common stock could be volatile, and you can lose all or part of your investment. The following factors, in addition to other factors described in this "Risk Factors" section and elsewhere in this prospectus, may have a significant impact on the market price of our common stock:
- •
- announcements of innovations or new products or services by us or our competitors;
- •
- any adverse changes to our relationship with our customers, manufacturers or suppliers;
- •
- variations in the costs of products that we distribute;
- •
- any legal actions in which we may become involved;
- •
- announcements concerning our competitors or the building supply industry in general;
- •
- achievement of expected product sales and profitability;
- •
- manufacture, supply or distribution shortages;
- •
- adverse actions taken by regulatory agencies with respect to our services or the products we distribute;
- •
- actual or anticipated fluctuations in our quarterly or annual operating results;
- •
- changes in financial estimates or recommendations by securities analysts;
- •
- trading volume of our common stock;
- •
- sales of our common stock by us, our executive officers and directors or our stockholders (including certain affiliates of AEA) in the future;
- •
- general economic and market conditions and overall fluctuations in the U.S. equity markets;
- •
- changes in accounting principles; and
- •
- the loss of any of our management or key personnel.
In addition, broad market and industry factors may negatively affect the market price of our common stock, regardless of our actual operating performance, and factors beyond our control may cause our stock price to decline rapidly and unexpectedly.
33
We may be subject to securities litigation, which is expensive and could divert management attention.
Our share price may be volatile and, in the past, companies that have experienced volatility in the market price of their stock have been subject to securities class action litigation. We may be the target of this type of litigation in the future. Litigation of this type could result in substantial costs and diversion of management's attention and resources, which could adversely impact our business. Any adverse determination in litigation could also subject us to significant liabilities.
Because AEA controls a significant percentage of our common stock, it may control all major corporate decisions and its interests may conflict with the interests of other holders of our common stock.
Upon completion of this offering, certain affiliates of AEA will beneficially own approximately % of the voting power of our outstanding common stock (or % if the underwriters exercise their option to purchase additional shares in full). Through this beneficial ownership and a stockholders agreement, which provides voting control over additional shares of our common stock, AEA will control approximately % of the voting power of our outstanding common stock (or % if the underwriters exercise their option to purchase additional shares in full). As a result of this control, AEA will be able to influence or control matters requiring approval by our stockholders and/or our board of directors, including the election of directors and the approval of business combinations or dispositions and other extraordinary transactions. AEA may also have interests that differ from yours and may vote in a way with which you disagree and which may be adverse to your interests. The concentration of ownership may have the effect of delaying, preventing or deterring a change of control of our Company, could deprive our stockholders of an opportunity to receive a premium for their common stock as part of a sale of our Company and may materially and adversely affect the market price of our common stock. In addition, AEA may in the future own businesses that directly compete with ours. See "Prospectus Summary—Our Sponsor" and "Certain Relationships and Related Party Transactions."
Investors purchasing common stock in this offering will experience immediate and substantial dilution as a result of this offering and future equity issuances.
If you purchase shares of our common stock in this offering, you will incur immediate and substantial dilution in the book value of your stock, because the price that you pay will be substantially greater than the net tangible book value per share of the shares you acquire. As a result, you will pay a price per share that substantially exceeds the book value of our assets after subtracting our liabilities. The net tangible deficit per share, calculated as of , 2015 and after giving effect to the offering (assuming an initial public offering price of $ per share, the midpoint of the price range set forth on the cover page of this prospectus), is $ . Investors purchasing common stock in this offering will experience immediate and substantial dilution of $ per share, based on an initial public offering price of $ per share, which is the midpoint of the price range set forth on the cover page of this prospectus. To the extent outstanding options are ultimately exercised, there will be further dilution to investors in this offering. In addition, if the underwriters exercise their option to purchase additional shares, or if we issue additional equity securities in the future, investors purchasing common stock in this offering will experience additional dilution.
As a result of this dilution, investors purchasing stock in this offering may receive significantly less than the purchase price paid in this offering in the event of liquidation. See "Dilution."
Sales of a substantial number of shares of our common stock in the public market by our existing stockholders could cause our stock price to fall.
Sales of a substantial number of shares of our common stock in the public market or the perception that these sales might occur, could depress the market price of our common stock and could impair our ability to raise capital through the sale of additional equity securities. Substantially all of our
34
existing stockholders are subject to lock-up agreements with the underwriters of this offering that restrict the stockholders' ability to transfer shares of our common stock for at least 180 days from the date of this prospectus, subject to certain exceptions. The lock-up agreements limit the number of shares of common stock that may be sold immediately following the public offering. After this offering, we will have outstanding shares of common stock based on the number of shares outstanding as of , 2015, assuming we sell shares in this offering. Subject to limitations, approximately shares will become eligible for sale upon expiration of the lock-up period, as calculated and described in more detail in the section entitled "Shares Eligible for Future Sale." In addition, shares issued or issuable upon exercise of options vested as of the expiration of the lock-up period will be eligible for sale at that time. Sales of stock by these stockholders could have a material adverse effect on the trading price of our common stock.
Moreover, after this offering, holders of an aggregate of shares of our common stock will have rights, subject to certain conditions such as the 180-day lock-up arrangement described above, to require us to file registration statements covering their shares or to include their shares in registration statements that we may file for ourselves or other stockholders. Registration of these shares under the Securities Act would result in the shares becoming freely tradable without restriction under the Securities Act, except for shares held by our affiliates as defined in Rule 144 under the Securities Act. Any sales of securities by these stockholders could have a material adverse effect on the trading price of our common stock.
If securities or industry analysts do not publish or cease publishing research or reports about us, our business or our markets, or if they adversely change their recommendations or publish negative reports regarding our business or our stock, our stock price and trading volume could decline.
The trading market for our common stock will be influenced by the research and reports that industry or securities analysts may publish about us, our business, our markets or our competitors. We do not have any control over these analysts and we cannot provide any assurance that analysts will cover us or provide favorable coverage. If any of the analysts who may cover us adversely change their recommendation regarding our stock, or provide more favorable relative recommendations about our competitors, our stock price could decline. If any analyst who may cover us were to cease coverage of our Company or fail to regularly publish reports on us, we could lose visibility in the financial markets, which in turn could cause our stock price or trading volume to decline.
Because we do not intend to declare cash dividends on our shares of common stock in the foreseeable future, stockholders must rely on appreciation of the value of our common stock for any return on their investment.
We currently anticipate that we will retain future earnings for the development, operation and expansion of our business and do not anticipate declaring or paying any cash dividends in the foreseeable future. In addition, the terms of the ABL Facility, the Term Loan Facilities and any future debt agreements may preclude our subsidiaries from paying dividends to us which, in turn, may preclude us from paying dividends to our stockholders. As a result, we expect that only appreciation of the price of our common stock, if any, will provide a return to investors in this offering for the foreseeable future.
The requirements of being a public company, including compliance with the reporting requirements of the Exchange Act and the requirements of the Sarbanes-Oxley Act and , may strain our resources, increase our costs and distract management, and we may be unable to comply with these requirements in a timely or cost-effective manner.
As a public company, we will be subject to the reporting requirements of the Securities Exchange Act of 1934, as amended, or the Exchange Act, and the corporate governance standards of the Sarbanes-Oxley Act of 2002, or the Sarbanes-Oxley Act, and . As a result, we will incur significant legal, accounting and other costs that we did not incur as a private company. These
35
requirements will place a strain on our management, systems and resources and we will incur significant legal, accounting, insurance and other expenses that we have not incurred as a private company. The Exchange Act will require us to file annual, quarterly and current reports with respect to our business and financial condition within specified time periods and to prepare a proxy statement with respect to our annual meeting of shareholders. The Sarbanes-Oxley Act will require that we maintain effective disclosure controls and procedures and internal controls over financial reporting. will require that we comply with various corporate governance requirements. To maintain and improve the effectiveness of our disclosure controls and procedures and internal controls over financial reporting and comply with the Exchange Act and requirements, significant resources and management oversight will be required. This may divert management's attention from other business concerns and lead to significant costs associated with compliance, which could have a material adverse effect on us and the price of our common stock.
We also expect that it could be difficult and will be significantly more expensive to obtain directors' and officers' liability insurance, and we may be required to accept reduced policy limits and coverage or incur substantially higher costs to obtain the same or similar coverage. As a result, it may be more difficult for us to attract and retain qualified persons to serve on our board of directors or as executive officers. Advocacy efforts by shareholders and third parties may also prompt even more changes in governance and reporting requirements. We cannot predict or estimate the amount of additional costs we may incur or the timing of these costs.
We have identified material weaknesses in our internal control over financial reporting. If our remediation of these material weaknesses is not effective, or if we experience additional material weaknesses in the future or otherwise fail to maintain an effective system of internal controls in the future, we may not be able to accurately or timely report our financial condition or results of operations, which may adversely affect investor confidence in us and, as a result, the value of our common stock.
We are not currently required to comply with the SEC's rules implementing Section 404 of the Sarbanes-Oxley Act and therefore are not required to make a formal assessment of the effectiveness of our internal control over financial reporting for that purpose. As a public company, we will be required to comply with the SEC's rules implementing Section 302 and 404 of the Sarbanes-Oxley Act, which will require management to certify financial and other information in our quarterly and annual reports and provide an annual management report on the effectiveness of control over financial reporting, as well as a statement that our independent registered public accounting firm has issued an opinion on our internal control over financial reporting. Though we will be required to disclose changes made in our internal controls and procedures on a quarterly basis, we will not be required to make our first annual assessment of our internal control over financial reporting pursuant to Section 404 of the Sarbanes-Oxley Act (including an auditor attestation on management's internal controls report) until our annual report on Form 10-K for the fiscal year ending April 30, 2017.
During the course of preparing for this offering, we identified material weaknesses in the design and operation of our internal control over financial reporting. A material weakness is a deficiency, or a combination of deficiencies, in internal control over financial reporting, such that there is a reasonable possibility that a material misstatement of a company's annual or interim financial statements will not be prevented or detected on a timely basis. The material weaknesses included an insufficient complement of personnel with a level of U.S. GAAP accounting knowledge commensurate with the Company's financial reporting requirements, a lack of formal accounting policies and procedures, ineffective IT general computer controls and a lack of controls over the preparation and review of manual journal entries. These deficiencies resulted in material adjustments to correct the previously issued consolidated financial statements of our wholly owned subsidiary, GYP Holdings III Corp., and could result in material misstatements to our consolidated financial statements that would not be prevented or detected.
36
We are currently in the process of remediating the above material weaknesses. We are taking numerous steps to enhance our internal control environment and address the underlying causes of the material weaknesses, primarily through the hiring of additional financial reporting personnel with technical accounting and financial reporting experience, formalizing our accounting policies and procedures, enhancing our internal review procedures during the financial statement close process and designing and implementing the appropriate IT general computer controls. Our current efforts to design and implement an effective control environment may not be sufficient to remediate the material weaknesses described above or prevent future material weaknesses or control deficiencies from occurring. There is no assurance that we will not identify additional material weaknesses in our internal control over financial reporting in the future.
If we fail to effectively remediate the material weaknesses in our control environment, if we identify future material weaknesses in our internal controls over financial reporting or if we are unable to comply with the demands that will be placed upon us as a public company, including the requirements of Section 404 of the Sarbanes-Oxley Act, in a timely manner, we may be unable to accurately report our financial results, or report them within the timeframes required by the SEC. We also could become subject to sanctions or investigations by , the SEC or other regulatory authorities. In addition, if we are unable to assert that our internal control over financial reporting is effective, or if our independent registered public accounting firm is unable to express an opinion as to the effectiveness of our internal control over financial reporting, when required, investors may lose confidence in the accuracy and completeness of our financial reports, we may face restricted access to the capital markets and our stock price may be adversely affected.
We are a "controlled company" within the meaning of the rules of and, as a result, will qualify for, and may rely on, exemptions from certain corporate governance requirements.
Following the consummation of this offering, we expect that a control group, consisting of certain affiliates of AEA and certain of our other stockholders, will continue to control a majority of the voting power of our outstanding common stock. As a result, we expect to be a "controlled company" within the meaning of corporate governance standards. A company of which more than 50% of the voting power is held by an individual, a group or another company is a "controlled company" within the meaning of the rules of and may elect not to comply with certain corporate governance requirements of , including:
- •
- the requirement that a majority of our board consist of independent directors;
- •
- the requirement that we have a nominating/corporate governance committee that is composed entirely of independent directors with a written charter addressing the committee's purpose and responsibilities; and
- •
- the requirement that we have a compensation committee that is composed entirely of independent directors with a written charter addressing the committee's purpose and responsibilities.
Following this offering, we intend to rely on all of the exemptions listed above. If we do utilize the exemptions, we will not have a majority of independent directors and our nominating and corporate governance and compensation committees will not consist entirely of independent directors. As a result, our board of directors and those committees may have more directors who do not meet 's independence standards than they would if those standards were to apply. The independence standards are intended to ensure that directors who meet those standards are free of any conflicting interest that could influence their actions as directors. Accordingly, you will not have the same protections afforded to stockholders of companies that are subject to all of the corporate governance requirements of .
37
Some provisions of our charter documents and Delaware law may have anti-takeover effects that could discourage an acquisition of us by others, even if an acquisition would be beneficial to our stockholders, and may prevent attempts by our stockholders to replace or remove our current management.
Provisions in our amended and restated certificate of incorporation and our amended and restated by-laws that will become effective following the closing of this offering, as well as provisions of the Delaware General Corporation Law, or DGCL, could make it more difficult for a third party to acquire us or increase the cost of acquiring us, even if doing so would benefit our stockholders, including transactions in which stockholders might otherwise receive a premium for their shares. These provisions include:
- •
- establishing a classified board of directors such that not all members of the board are elected at one time;
- •
- allowing the authorized number of our directors to be changed only by resolution of our board of directors and granting to our board the sole power to fill any vacancy on the board;
- •
- limiting the ability of stockholders to remove directors without cause if the control group, consisting of certain affiliates of AEA and certain of our other stockholders, ceases to own more than 50% of our common stock;
- •
- providing that our board of directors is expressly authorized to adopt, or to alter or repeal, our by-laws;
- •
- authorizing the issuance of "blank check" preferred stock that could be issued by our board of directors to thwart a takeover attempt;
- •
- prohibiting stockholder action by written consent, which requires all stockholder actions to be taken at a meeting of our stockholders, if the control group, consisting of certain affiliates of AEA and certain of our other stockholders ceases to own more than 50% of our common stock;
- •
- eliminating the ability of stockholders to call a special meeting of stockholders if the control group, consisting of certain affiliates of AEA and certain of our other stockholders ceases to own more than 50% of our common stock;
- •
- establishing advance notice requirements for nominations for election to the board of directors or for proposing matters that can be acted upon at stockholder meetings; and
- •
- requiring the approval of the holders of at least 75% of the votes that all of our stockholders would be entitled to cast to amend or repeal certain provisions of our amended and restated by-laws.
In addition, until the control group, consisting of certain affiliates of AEA and certain of our other stockholders, no longer beneficially owns more than 50% of our common stock, we expect to opt out of Section 203 of the DGCL which, subject to some exceptions, prohibits business combinations between a Delaware corporation and an interested stockholder, which is generally defined as a stockholder who becomes a beneficial owner of 15% or more of a Delaware corporation's voting stock for a three-year period following the date that the stockholder became an interested stockholder. After such time, we will be governed by Section 203. Section 203 could have the effect of delaying, deferring or preventing a change in control that our stockholders might consider to be in their best interests. See "Description of Capital Stock."
These anti-takeover defenses could discourage, delay or prevent a transaction involving a change in control of our Company. These provisions could also discourage proxy contests and make it more difficult for you and other stockholders to elect directors of your choosing and cause us to take corporate actions other than those you desire.
38
Our amended and restated certificate of incorporation will designate the Court of Chancery of the State of Delaware as the exclusive forum for certain litigation that may be initiated by our stockholders, which could limit our stockholders' ability to obtain a favorable judicial forum for disputes with us.
Our amended and restated certificate of incorporation will provide that the Court of Chancery of the State of Delaware will be the sole and exclusive forum for (i) any derivative action or proceeding brought on our behalf, (ii) any action asserting a claim of breach of a fiduciary duty owed to us or our stockholders by any of our directors, officers, employees or agents, (iii) any action asserting a claim against us arising under the DGCL or (iv) any action asserting a claim against us that is governed by the internal affairs doctrine. By becoming a stockholder in our Company, you will be deemed to have notice of and have consented to the provisions of our amended and restated certificate of incorporation related to choice of forum. The choice of forum provision in our amended and restated certificate of incorporation may limit our stockholders' ability to obtain a favorable judicial forum for disputes with us.
39
CAUTIONARY NOTE REGARDING FORWARD-LOOKING STATEMENTS
This prospectus contains forward-looking statements. You can generally identify forward-looking statements by our use of forward-looking terminology such as "anticipate," "believe," "continue," "could," "estimate," "expect," "intend," "may," "might," "plan," "potential," "predict," "seek," or "should," or the negative thereof or other variations thereon or comparable terminology. In particular, statements about the markets in which we operate, including growth of our various markets, and statements about our expectations, beliefs, plans, strategies, objectives, prospects, assumptions or future events or performance contained in this prospectus under the headings "Prospectus Summary," "Risk Factors," "Management's Discussion and Analysis of Financial Condition and Results of Operations," and "Business" are forward-looking statements.
We have based these forward-looking statements on our current expectations, assumptions, estimates and projections. While we believe these expectations, assumptions, estimates and projections are reasonable, such forward-looking statements are only predictions and involve known and unknown risks and uncertainties, many of which are beyond our control. These and other important factors, including those discussed in this prospectus under the headings "Prospectus Summary," "Risk Factors," "Management's Discussion and Analysis of Financial Condition and Results of Operations," and "Business," may cause our actual results, performance or achievements to differ materially from any future results, performance or achievements expressed or implied by these forward-looking statements. Some of the factors that could cause actual results to differ materially from those expressed or implied by the forward-looking statements include:
- •
- general economic and financial conditions;
- •
- our dependency upon the commercial and residential construction and R&R markets;
- •
- competition in our highly fragmented industry and the markets in which we operate;
- •
- the fluctuations in prices of the products we distribute;
- •
- the consolidation of our industry;
- •
- our inability to pursue strategic transactions and open new branches;
- •
- our inability to expand into new geographic markets;
- •
- product shortages and potential loss of relationships with key suppliers;
- •
- the seasonality of the commercial and residential construction markets;
- •
- the potential loss of any significant customers;
- •
- exposure to product liability and various other claims and litigation;
- •
- our inability to attract key employees;
- •
- rising health care costs;
- •
- the reduction of the quantity of products our customers purchase;
- •
- the credit risk from our customers;
- •
- our inability to renew leases for our facilities;
- •
- our inability to effectively manage our inventory as our sales volume increases or the prices of the products we distribute fluctuate;
- •
- our inability to engage in activities that may be in our best long-term interests because of restrictions in our debt agreements;
- •
- our current level of indebtedness and our potential to incur additional indebtedness;
40
- •
- our inability to obtain additional financing on acceptable terms, if at all;
- •
- our holding company structure;
- •
- an impairment of our goodwill;
- •
- the impact of federal, state and local regulations;
- •
- the cost of compliance with environmental, health and safety laws and other regulations;
- •
- significant increases in fuel costs or shortages in the supply of fuel;
- •
- a disruption or breach in our IT systems;
- •
- natural or man-made disruptions to our facilities;
- •
- AEA's control of us; and
- •
- other risks and uncertainties, including those listed under "Risk Factors."
Given these risks and uncertainties, you are cautioned not to place undue reliance on such forward-looking statements. The forward-looking statements contained in this prospectus are not guarantees of future performance and our actual results of operations, financial condition and liquidity, and the development of the industry in which we operate, may differ materially from the forward-looking statements contained in this prospectus. In addition, even if our results of operations, financial condition and liquidity, and events in the industry in which we operate, are consistent with the forward-looking statements contained in this prospectus, they may not be predictive of results or developments in future periods.
Any forward-looking statement that we make in this prospectus speaks only as of the date of such statement. Except as required by law, we do not undertake any obligation to update or revise, or to publicly announce any update or revision to, any of the forward-looking statements, whether as a result of new information, future events or otherwise, after the date of this prospectus.
41
We estimate that the net proceeds to us from our sale of shares in this offering will be approximately $ , based on the assumed initial public offering price of $ per share, which is the midpoint of the price range set forth on the cover page of this prospectus, and after deducting underwriting discounts and commissions. We intend to use the net proceeds from this offering to (i) repay approximately $ of indebtedness plus accrued and unpaid interest and premium, if any, under the Second Lien Facility and (ii) pay approximately $ of fees and expenses related to this offering, including fees of $ to our Sponsor immediately following this offering. We expect to use any remaining proceeds for general corporate purposes. If the underwriters' option to purchase additional shares is exercised in full, we estimate that we will receive additional net proceeds of approximately $ , which we will use for general corporate purposes.
The interest rate on the indebtedness under the Second Lien Facility that we intend to repay from proceeds of this offering is 7.75% and the maturity date is April 1, 2022.
Each $1.00 increase (decrease) in the assumed initial public offering price of $ per share, the midpoint of the price range set forth on the cover page of this prospectus, would increase (decrease) the net proceeds to us from this offering by approximately $ , assuming the number of shares offered by us, as set forth on the cover page of this prospectus, remains the same, and after deducting underwriting discounts and commissions and estimated offering expenses payable by us. Each increase (decrease) of 1.0 million shares in the number of shares sold in this offering, as set forth on the cover page of this prospectus, would increase (decrease) the net proceeds to us from this offering by approximately $ , assuming the assumed initial public offering price of $ per share, the midpoint of the price range set forth on the cover page of this prospectus, remains the same, and after deducting underwriting discounts and commissions and estimated offering expenses payable by us. The information discussed above is illustrative only and will adjust based on the actual initial public offering price and other terms of this offering determined at pricing.
42
We do not currently expect to pay any cash dividends on our common stock for the foreseeable future. Instead, we intend to retain future earnings, if any, for the future operation and expansion of our business and the repayment of debt. Any determination to pay dividends in the future will be at the discretion of our board of directors and will depend upon our results of operations, cash requirements, financial condition, contractual restrictions, restrictions imposed by applicable laws and other factors that our board of directors may deem relevant. Our business is conducted through our subsidiaries. Dividends, distributions and other payments from, and cash generated by, our subsidiaries will be our principal sources of cash to repay indebtedness, fund operations and pay dividends. Accordingly, our ability to pay dividends to our stockholders is dependent on the earnings and distributions of funds from our subsidiaries. In addition, the covenants in the agreements governing our existing indebtedness, including the ABL Facility and the Term Loan Facilities, significantly restrict the ability of our subsidiaries to pay dividends or otherwise transfer assets to us. See "Description of Certain Indebtedness," "Risk Factors—Risks Relating to Our Business and Industry—Because we are a holding company with no operations of our own, we are financially dependent on receiving distributions from our subsidiaries and we could be harmed if such distributions could not be made in the future" and "Risk Factors—Risks Related to this Offering and Ownership of Our Common Stock—Because we do not intend to declare cash dividends on our shares of common stock in the foreseeable future, stockholders must rely on appreciation of the value of our common stock for any return on their investment."
43
The following table sets forth our cash and cash equivalents and our consolidated capitalization as of April 30, 2015:
- •
- on an actual basis; and
- •
- on an as adjusted basis to give effect to our issuance and sale of shares of our common stock in this offering at an assumed initial public offering price of $ per share, the midpoint of the price range set forth on the cover page of this prospectus, after deducting estimated underwriting discounts and commissions and estimated offering expenses payable by us, and the application of the net proceeds from this offering as described in "Use of Proceeds."
You should read the data set forth below in conjunction with "Management's Discussion and Analysis of Financial Condition and Results of Operations" and the consolidated financial statements and accompanying notes included elsewhere in this prospectus.
| | As of April 30, 2015 | ||||||
|---|---|---|---|---|---|---|---|
| | Actual | As Adjusted(1) | |||||
| | (in thousands, except share and per share data) | ||||||
Cash and cash equivalents | $ | 12,284 | $ | ||||
| | | | | | | | |
| | | | | | | | |
| | | | | | | | |
Debt: | |||||||
ABL Facility | $ | 16,950 | $ | ||||
First Lien Facility(2) | 376,180 | ||||||
Second Lien Facility(3) | 153,585 | ||||||
Capital lease obligation | 8,628 | ||||||
Installment notes(4) | 1,641 | ||||||
| | | | | | | | |
Total debt | 556,984 | ||||||
Stockholders' equity: | |||||||
Common stock, par value $0.01 per share; 5,000,000 shares authorized, 3,224,838 shares issued and outstanding actual, shares issued and outstanding as adjusted | 32 | ||||||
Additional paid-in capital | 330,180 | ||||||
Accumulated deficit | (32,750 | ) | |||||
| | | | | | | | |
Total stockholders' equity(5) | 297,462 | ||||||
| | | | | | | | |
Total capitalization | $ | 854,446 | $ | ||||
| | | | | | | | |
| | | | | | | | |
| | | | | | | | |
- (1)
- Each $1.00 increase (decrease) in the assumed initial public offering price of $ per share, the midpoint of the price range set forth on the cover page of this prospectus, would increase (decrease) each of cash and cash equivalents, additional paid-in-capital, total stockholders' equity and total capitalization by approximately $ million, assuming the number of shares offered by us, as set forth on the cover page of this prospectus, remains the same, and after deducting underwriting discounts and commissions and estimated offering expenses payable by us. Each increase (decrease) of 1.0 million shares in the number of shares sold in this offering, as set forth on the cover page of this prospectus, would increase (decrease) each of cash and cash equivalents, additional paid-in-capital, total stockholders' equity and total capitalization by approximately $ million, assuming the assumed initial public offering price of $ per share, the midpoint of the price range set forth on the cover page of this prospectus, remains the same, and after deducting underwriting discounts and commissions and estimated offering expenses payable by us.
- (2)
- Net of unamortized discount of $1.6 million and deferred financing costs of $8.3 million.
- (3)
- Net of unamortized discount of $1.4 million and deferred financing costs of $5.0 million.
- (4)
- For a description of our installment notes, refer to Note 9 of our consolidated financial statements included elsewhere in this prospectus.
- (5)
- Excludes $10 thousand of other comprehensive income.
44
If you purchase any of the shares offered by this prospectus, you will experience dilution to the extent of the difference between the offering price per share that you pay in this offering and the net tangible book value per share of our common stock immediately after this offering.
Our net tangible book value (deficit) as of April 30, 2015 was $ , or $ per share of common stock. Net tangible book value (deficit) per share is determined by dividing our net tangible book value (deficit), which is total tangible assets less total liabilities, by the aggregate number of shares of common stock outstanding. Tangible assets represent total assets excluding goodwill and other intangible assets. Dilution in net tangible book value (deficit) per share represents the difference between the amount per share paid by purchasers of shares of our common stock in this offering and the pro forma as adjusted net tangible book value per share of our common stock immediately afterwards.
After giving effect to (i) our -for- stock split and (ii) our sale of shares of common stock in this offering at an assumed initial public offering price of $ per share, the midpoint of the price range set forth on the cover page of this prospectus, our pro forma as adjusted net tangible book value as of , 2015 would have been approximately $ , or $ per share. This represents an immediate increase in net tangible book value (deficit) of $ per share to our existing stockholders and an immediate dilution of $ per share to new investors purchasing shares of common stock in this offering. The following table illustrates this dilution on a per share basis:
The following table illustrates this dilution on a per share basis:
Assumed initial public offering price per share | $ | |||||
Historical net tangible book value per share | $ | |||||
Increase per share attributable to this offering | ||||||
| | | | | | | |
Pro forma net tangible book value per share after this offering | $ | |||||
| | | | | | | |
Dilution per share to new investors | $ | |||||
| | | | | | | |
| | | | | | | |
| | | | | | | |
Each $1.00 increase (decrease) in the assumed initial offering price of $ per share, the midpoint of the price range set forth on the cover page of this prospectus, would affect our net tangible book value after this offering by approximately $ , the net tangible book value per share after this offering by $ per share, and the dilution per common share to new investors by $ per share, assuming the number of shares offered by us, as set forth on the cover page of this prospectus, remains the same, and after deducting underwriting commissions and discounts and estimated offering expenses payable by us. Each increase (decrease) of 1.0 million shares in the number of shares sold in this offering, as set forth on the cover page of this prospectus, would affect our net tangible book value after this offering by approximately $ , the net tangible book value per share after this offering by $ per share, and the dilution per common share to new investors by $ per share, assuming the assumed initial public offering price of $ per share, the midpoint of the price range set forth on the cover page of this prospectus, remains the same, and after deducting underwriting commissions and discounts and estimated offering expenses payable by us.
The following table summarizes, as of April 30, 2015, on an as adjusted basis, the number of shares of common stock purchased or to be purchased from us, the total consideration paid or to be paid to us and the average price per share paid or to be paid by existing stockholders and by new
45
investors purchasing shares of common stock in this offering, before deducting the underwriting commissions and discounts and estimated offering expenses payable by us.
| | | | Total Consideration | | |||||||||||
|---|---|---|---|---|---|---|---|---|---|---|---|---|---|---|---|
| | Shares Purchased | | |||||||||||||
| | Average Price Per Share | ||||||||||||||
| | Number | Percent | Amount | Percent | |||||||||||
| | (in thousands, except share and per share data) | ||||||||||||||
Existing stockholders | % | $ | % | $ | |||||||||||
New investors | % | $ | % | $ | |||||||||||
| | | | | | | | | | | | | | | | |
Total | 100 | % | $ | 100 | % | $ | |||||||||
| | | | | | | | | | | | | | | | |
| | | | | | | | | | | | | | | | |
| | | | | | | | | | | | | | | | |
Each $1.00 increase (decrease) in the assumed initial offering price of $ per share, the midpoint of the price range set forth on the cover page of this prospectus, would increase (decrease) total consideration paid by new investors, total consideration paid by all stockholders and average price per share paid by all stockholders by $ , $ and $ per share, respectively, assuming the number of shares offered by us, as set forth on the cover page of this prospectus, remains the same, and after deducting underwriting discounts and commissions and estimated offering expenses payable by us. Each increase (decrease) of 1.0 million shares in the number of shares sold in this offering, as set forth on the cover page of this prospectus, would increase (decrease) total consideration paid by new investors, total consideration paid by all stockholders and average price per share paid by all stockholders by $ , $ and $ per share, respectively, assuming the assumed initial public offering price of $ per share, the midpoint of the price range set forth on the cover page of this prospectus, remains the same, and after deducting underwriting discounts and commissions and estimated offering expenses payable by us.
If the underwriters exercise in full their option to purchase additional shares of our common stock in this offering, the as adjusted net tangible book value per share would be $ per share and the dilution to new investors in this offering would be $ per share. If the underwriters exercise such option in full, the number of shares held by new investors will increase to approximately shares of our common stock, or approximately % of the total number of shares of our common stock outstanding after this offering. The number of shares of our common stock to be outstanding immediately following this offering set forth above excludes:
- •
- shares of common stock issuable upon the exercise of options outstanding under our existing equity plan as of April 30, 2015 at a weighted average exercise price of $ per share; and
- •
- shares of common stock reserved for future issuance under our new omnibus incentive plan.
To the extent any options are granted and exercised in the future, there may be additional economic dilution to new investors.
In addition, we may choose to raise additional capital due to market conditions or strategic considerations, even if we believe we have sufficient funds for our current or future operating plans. To the extent that we raise additional capital through the sale of equity or convertible debt securities, the issuance of these securities could result in further dilution to our stockholders.
46
SELECTED CONSOLIDATED FINANCIAL AND OTHER DATA
The selected consolidated financial information of Successor presented below for the fiscal year ended April 30, 2015, the one month ended April 30, 2014 and as of April 30, 2015 and 2014 has been derived from our audited consolidated financial statements included elsewhere in this prospectus. The selected consolidated financial information of Predecessor presented below for the eleven months ended March 31, 2014 and the fiscal year ended April 30, 2013 has been derived from our audited consolidated financial statements included elsewhere in this prospectus. The selected consolidated financial information of Predecessor presented below for the fiscal years ended April 30, 2012 and 2011 and as of April 30, 2013, 2012 and 2011 has been derived from our consolidated financial statements not included in this prospectus.
The historical data presented below has been derived from financial statements that have been prepared using GAAP. This data should be read in conjunction with "Management's Discussion and Analysis of Financial Condition and Results of Operations" and our consolidated financial statements and related notes included elsewhere in this prospectus. The selected operating data has been prepared on an unaudited basis.
| | Successor | | Predecessor | ||||||||||||||||||
|---|---|---|---|---|---|---|---|---|---|---|---|---|---|---|---|---|---|---|---|---|---|
| | Fiscal Year Ended April 30, 2015 | One Month Ended April 30, 2014 | | Eleven Months Ended March 31, 2014 | Fiscal Year Ended April 30, 2013 | Fiscal Year Ended April 30, 2012 | Fiscal Year Ended April 30, 2011 | ||||||||||||||
| | (in thousands, except share and per share data) | | | ||||||||||||||||||
Statement of Operations Data: | |||||||||||||||||||||
Net sales | $ | 1,570,085 | $ | 127,332 | $ | 1,226,008 | $ | 1,161,610 | $ | 990,741 | $ | 881,236 | |||||||||
Cost of sales (exclusive of depreciation and amortization shown separately below) | 1,091,114 | 97,955 | 853,020 | 824,331 | 703,352 | 624,855 | |||||||||||||||
| | | | | | | | | | | | | | | | | | | | | | |
Gross profit | 478,971 | 29,377 | 372,988 | 337,279 | 287,389 | 256,381 | |||||||||||||||
| | | | | | | | | | | | | | | | | | | | | | |
Operating expenses: | |||||||||||||||||||||
Selling, general and administrative expenses | 396,155 | 46,052 | 352,930 | 295,289 | 274,193 | 242,439 | |||||||||||||||
Depreciation and amortization | 64,165 | 6,336 | 12,253 | 11,627 | 8,319 | 10,570 | |||||||||||||||
| | | | | | | | | | | | | | | | | | | | | | |
Total operating expenses | 460,320 | 52,388 | 365,183 | 306,916 | 282,512 | 253,009 | |||||||||||||||
| | | | | | | | | | | | | | | | | | | | | | |
Operating income (loss) | 18,651 | (23,011 | ) | 7,805 | 30,363 | 4,877 | 3,372 | ||||||||||||||
Other (expense) income: | |||||||||||||||||||||
Interest expense | (36,396 | ) | (2,954 | ) | (4,226 | ) | (4,413 | ) | (2,966 | ) | (3,236 | ) | |||||||||
Change in fair value of financial instruments | (2,494 | ) | — | — | — | — | — | ||||||||||||||
Change in fair value of mandatorily redeemable common shares(1) | — | — | (200,004 | ) | (198,212 | ) | (8,952 | ) | (6,978 | ) | |||||||||||
Other income, net | 1,916 | 149 | 2,187 | 1,169 | 1,507 | 2,012 | |||||||||||||||
| | | | | | | | | | | | | | | | | | | | | | |
Total other (expense), net | (36,974 | ) | (2,805 | ) | (202,043 | ) | (201,456 | ) | (10,411 | ) | (8,202 | ) | |||||||||
| | | | | | | | | | | | | | | | | | | | | | |
(Loss) from continuing operations, before tax | (18,323 | ) | (25,816 | ) | (194,238 | ) | (171,093 | ) | (5,534 | ) | (4,830 | ) | |||||||||
Income tax (benefit) expense | (4,526 | ) | (6,863 | ) | 6,623 | 11,534 | 2,658 | 2,086 | |||||||||||||
| | | | | | | | | | | | | | | | | | | | | | |
(Loss) from continuing operations, net of tax | (13,797 | ) | (18,953 | ) | (200,861 | ) | (182,627 | ) | (8,192 | ) | (6,916 | ) | |||||||||
Discontinued operations, net of tax | — | — | — | — | 362 | (23 | ) | ||||||||||||||
| | | | | | | | | | | | | | | | | | | | | | |
Net (loss) | $ | (13,797 | ) | $ | (18,953 | ) | $ | (200,861 | ) | $ | (182,627 | ) | $ | (7,830 | ) | $ | (6,939 | ) | |||
| | | | | | | | | | | | | | | | | | | | | | |
| | | | | | | | | | | | | | | | | | | | | | |
| | | | | | | | | | | | | | | | | | | | | | |
Weighted average shares outstanding (basic and diluted) | 3,194,566 | 3,183,870 | |||||||||||||||||||
| | | | | | | | | | | | | | | | | | | | | | |
Net (loss) from continuing operations per share (basic and diluted) | $ | (4.32 | ) | $ | (5.95 | ) | |||||||||||||||
| | | | | | | | | | | | | | | | | | | | | | |
47
| | Successor | | Predecessor | ||||||||||||||||||
|---|---|---|---|---|---|---|---|---|---|---|---|---|---|---|---|---|---|---|---|---|---|
| | Fiscal Year Ended April 30, 2015 | One Month Ended April 30, 2014 | | Eleven Months Ended March 31, 2014 | Fiscal Year Ended April 30, 2013 | Fiscal Year Ended April 30, 2012 | Fiscal Year Ended April 30, 2011 | ||||||||||||||
| | (in thousands) | ||||||||||||||||||||
Other Financial Data: | |||||||||||||||||||||
Adjusted EBITDA(2) | $ | 113,860 | $ | 8,372 | $ | 78,690 | $ | 57,511 | $ | 32,394 | $ | 17,712 | |||||||||
Adjusted EBITDA margin(2) | 6.7 | % | 6.6 | % | 6.4 | % | 5.0 | % | 3.3 | % | 2.0 | % | |||||||||
Working capital (at period end)(3) | 220,196 | 247,469 | 197,960 | 172,101 | 146,482 | ||||||||||||||||
Adjusted working capital (at period end)(4) | 231,621 | 220,892 | 189,786 | 166,626 | 143,825 | ||||||||||||||||
| | Successor | | Predecessor | |||||||||||||||
|---|---|---|---|---|---|---|---|---|---|---|---|---|---|---|---|---|---|---|
| | April 30, 2015 | April 30, 2014 | | April 30, 2013 | April 30, 2012 | April 30, 2011 | ||||||||||||
| | (in thousands) | |||||||||||||||||
Balance Sheet Data: | ||||||||||||||||||
Cash and cash equivalents | $ | 12,284 | $ | 32,662 | $ | 13,383 | $ | 9,113 | $ | 6,513 | ||||||||
Total assets | 1,154,576 | 1,122,351 | 494,626 | 431,184 | 399,268 | |||||||||||||
Total debt(5) | 556,984 | 538,785 | 115,003 | 100,040 | 75,366 | |||||||||||||
Total stockholders' equity (deficit) | $ | 297,472 | $ | 299,434 | $ | (274,846 | ) | $ | (84,630 | ) | $ | (76,800 | ) | |||||
| | April 30, 2015 | April 30, 2014 | April 30, 2013 | April 30, 2012 | April 30, 2011 | |||||||||||
|---|---|---|---|---|---|---|---|---|---|---|---|---|---|---|---|---|
Selected Operating Data: | ||||||||||||||||
Branches | 156 | 140 | 132 | 127 | 127 | |||||||||||
Employees | 3,088 | 2,621 | 2,405 | 2,226 | 2,075 | |||||||||||
Wallboard volume (for the year ended) (million square feet) | 2,328 | 2,088 | 1,850 | 1,588 | 1,436 | |||||||||||
- (1)
- Represents the change in fair value of mandatorily redeemable common shares of the Predecessor, all of which were acquired by the Company on April 1, 2014 in connection with the Acquisition. These shares had certain redemption features which provided that upon the death or disability of the shareholder or termination of his employment, Predecessor would be required to purchase these shares at their then current fair values. Pursuant to this provision, these shares were deemed to be mandatorily redeemable and, as such, were required to be reflected as a liability at their estimated fair values at the end of any reporting period. Changes in fair value are reflected as "Change in fair value of mandatorily redeemable common shares" on our consolidated statements of operations. Fair value was estimated based on commonly used valuation techniques. For additional details, see Note 10 of our consolidated financial statements included elsewhere in this prospectus.
- (2)
- See "Summary Financial and Other Data" for an explanation of how we define and calculate Adjusted EBITDA and Adjusted EBITDA margin.
48
The following is a reconciliation of our net (loss) to Adjusted EBITDA:
| | Successor | | Predecessor | ||||||||||||||||||
|---|---|---|---|---|---|---|---|---|---|---|---|---|---|---|---|---|---|---|---|---|---|
| | Fiscal Year Ended April 30, 2015 | One Month Ended April 30, 2014 | | Eleven Months Ended March 31, 2014 | Fiscal Year Ended April 30, 2013 | Fiscal Year Ended April 30, 2012 | Fiscal Year Ended April 30, 2011 | ||||||||||||||
| | | ||||||||||||||||||||
| | | ||||||||||||||||||||
| | | | | (in thousands) | | | |||||||||||||||
Net (loss) | $ | (13,797 | ) | $ | (18,953 | ) | $ | (200,861 | ) | $ | (182,627 | ) | $ | (7,830 | ) | $ | (6,939 | ) | |||
Discontinued operations, net of tax | — | — | — | — | (362 | ) | 23 | ||||||||||||||
Interest expense | 36,396 | 2,954 | 4,226 | 4,413 | 2,966 | 3,236 | |||||||||||||||
Change in fair value of mandatorily redeemable shares | — | — | 200,004 | 198,212 | 8,952 | 6,978 | |||||||||||||||
Interest income | (1,010 | ) | (76 | ) | (846 | ) | (798 | ) | (885 | ) | (711 | ) | |||||||||
Income tax (benefit) expense | (4,526 | ) | (6,863 | ) | 6,623 | 11,534 | 2,658 | 2,086 | |||||||||||||
Depreciation expense | 32,208 | 3,818 | 12,224 | 11,665 | 7,840 | 7,136 | |||||||||||||||
Amortization expense | 31,957 | 2,518 | 38 | 72 | 732 | 4,239 | |||||||||||||||
| | | | | | | | | | | | | | | | | | | | | | |
EBITDA | $ | 81,228 | $ | (16,602 | ) | $ | 21,408 | $ | 42,471 | $ | 14,071 | $ | 16,048 | ||||||||
| | | | | | | | | | | | | | | | | | | | | | |
Executive compensation(a) | $ | — | $ | 20 | $ | 2,427 | $ | 13,420 | $ | 8,266 | $ | 3,413 | |||||||||
Stock appreciation rights expense(b) | 2,268 | 80 | 1,288 | 1,061 | 253 | (47 | ) | ||||||||||||||
Redeemable noncontrolling interests(c) | 1,859 | 71 | 2,957 | 2,195 | 407 | (245 | ) | ||||||||||||||
Equity-based compensation(d) | 6,455 | 1 | 27 | 82 | (154 | ) | (114 | ) | |||||||||||||
Acquisition related costs(e) | 837 | 16,155 | 51,809 | 230 | 133 | 53 | |||||||||||||||
Severance and other costs for discontinued operations and closed branches(f) | 413 | — | — | (30 | ) | (205 | ) | (824 | ) | ||||||||||||
Transaction costs (acquisitions and other)(g) | 1,891 | — | — | — | — | — | |||||||||||||||
Loss (gain) on disposal of assets | 1,089 | 170 | (1,034 | ) | (2,231 | ) | (556 | ) | 14 | ||||||||||||
Management fee to related party(h) | 2,250 | 188 | — | — | — | — | |||||||||||||||
Effects of fair value adjustments to inventory(i) | 5,012 | 8,289 | — | — | — | — | |||||||||||||||
Interest rate swap and cap mark-to-market(j) | 2,494 | — | (192 | ) | 313 | — | (586 | ) | |||||||||||||
Contributions from acquisitions(k) | 8,064 | ||||||||||||||||||||
Pension withdrawal(l) | — | — | — | — | 10,179 | — | |||||||||||||||
| | | | | | | | | | | | | | | | | | | | | | |
Adjusted EBITDA | $ | 113,860 | $ | 8,372 | $ | 78,690 | $ | 57,511 | $ | 32,394 | $ | 17,712 | |||||||||
| | | | | | | | | | | | | | | | | | | | | | |
| | | | | | | | | | | | | | | | | | | | | | |
| | | | | | | | | | | | | | | | | | | | | | |
- (a)
- Represents compensation paid to certain executives who were majority owners prior to the Acquisition. Following the Acquisition, these executives' compensation agreements were amended and, going forward, we do not anticipate additional adjustments.
- (b)
- Represents non-cash compensation expenses related to stock appreciation rights agreements. For additional details regarding stock appreciation rights, refer to "Management's Discussion and Analysis of Financial Condition and Results of Operations—Critical Accounting Policies—Subsidiary Equity-Based Deferred Compensation Arrangements."
- (c)
- Represents non-cash compensation expense related to changes in the redemption values of noncontrolling interests. For additional details regarding redeemable noncontrolling interests of our subsidiaries, refer to "Management's Discussion and Analysis of Financial Condition and Results of Operations—Critical Accounting Policies—Subsidiary Equity-Based Deferred Compensation Arrangements."
- (d)
- Represents non-cash equity-based compensation expense related to the issuance of stock options.
49
- (e)
- Represents non-recurring expenses related specifically to the Acquisition, including fees to financial advisors, accountants, attorneys and other professionals as well as costs related to the retirement of corporate stock appreciation rights. Also included are one-time bonuses paid to certain employees in connection with the Acquisition.
- (f)
- Represents severance expenses and other costs related to discontinued operations and closed branches.
- (g)
- Represents one-time costs related to this offering and acquisitions (other than the Acquisition) paid to third party advisors.
- (h)
- Represents management fees paid by us to our Sponsor. After this offering, our Sponsor will no longer receive management fees from us.
- (i)
- Represents the non-cash cost of sales impact of purchase accounting adjustments to increase inventory to its estimated fair value, primarily related to the Acquisition.
- (j)
- Represents the mark to market adjustments for certain financial instruments.
- (k)
- Represents earnings of acquired entities from the beginning of the periods presented to the date of such acquisition, as well as certain purchasing synergies and cost savings, as defined in and permitted by the ABL Facility and the Term Loan Facilities. Contributions from acquisitions are only reflected for fiscal 2015.
- (l)
- Represents costs incurred in connection with withdrawal from a multi-employer pension plan.
- (3)
- Current assets less current liabilities.
- (4)
- Adjusted working capital represents current assets, excluding cash and cash equivalents, minus current liabilities, excluding current maturities of long-term debt. Adjusted working capital is not a recognized term under GAAP and does not purport to be an alternative to working capital. Management believes that adjusted working capital is useful in analyzing the cash flow and working capital needs of the Company. We exclude cash and cash equivalents and current maturities of long-term debt to evaluate the investment in working capital required to support our business.
The following is a reconciliation from working capital, the most directly comparable financial measure under GAAP, to adjusted working capital for the periods presented:
| | April 30, 2015 | April 30, 2014 | April 30, 2013 | April 30, 2012 | April 30, 2011 | |||||||||||
|---|---|---|---|---|---|---|---|---|---|---|---|---|---|---|---|---|
Current assets | $ | 426,980 | $ | 390,005 | $ | 306,355 | $ | 270,809 | $ | 235,525 | ||||||
Current liabilities | 206,784 | 142,536 | 108,395 | 98,708 | 89,043 | |||||||||||
| | | | | | | | | | | | | | | | | |
Working capital | $ | 220,196 | $ | 247,469 | $ | 197,960 | $ | 172,101 | $ | 146,482 | ||||||
Cash and cash equivalents | (12,284 | ) | (32,662 | ) | (13,383 | ) | (9,113 | ) | (6,513 | ) | ||||||
Current maturities of long-term debt | 23,709 | 6,085 | 5,209 | 3,638 | 3,856 | |||||||||||
| | | | | | | | | | | | | | | | | |
Adjusted working capital | $ | 231,621 | $ | 220,892 | $ | 189,786 | $ | 166,626 | $ | 143,825 | ||||||
| | | | | | | | | | | | | | | | | |
| | | | | | | | | | | | | | | | | |
| | | | | | | | | | | | | | | | | |
- (5)
- Includes long-term debt and capital lease obligations.
50
MANAGEMENT'S DISCUSSION AND ANALYSIS OF FINANCIAL CONDITION AND
RESULTS OF OPERATIONS
The following discussion and analysis of our results of operations and financial condition is intended to help the reader understand our business, financial condition, results of operations, liquidity and capital resources. You should read this discussion in conjunction with "Selected Consolidated Financial and Other Data," and our financial statements and the related notes beginning on page F-1 of this prospectus. This section contains forward-looking statements, based on current expectations and related to future events and our future financial performance, that involve risks and uncertainties. Our actual results may vary materially from those discussed in the forward-looking statements as a result of various factors, including, without limitation, those set forth in "Risk Factors" as well as other matters described in this prospectus. See "Cautionary Note Regarding Forward-Looking Statements."
Effect of the Acquisition
On April 1, 2014, GMS Inc., or the Successor, acquired, through its wholly-owned entities, GYP Holdings II Corp. and GYP Holdings III Corp., all of the capital stock of Gypsum Management and Supply, Inc., or the Predecessor. Successor is majority owned by certain affiliates of AEA and certain of our other stockholders. We refer to this acquisition as the "Acquisition."
As a result of the Acquisition, the financial information for the period beginning on April 1, 2014, through and including April 30, 2015, represents the consolidated financial statements of the Successor. The financial information for the period prior to, and including, March 31, 2014, represents the consolidated financial statements of the Predecessor. Due to the change in the basis of accounting resulting from the application of the acquisition method of accounting, the Predecessor's consolidated financial statements and the Successor's consolidated financial statements are not necessarily comparable. The new basis of accounting primarily impacted the values of our inventory, long-lived and indefinite-lived intangible assets, and resulted in increased depreciation and amortization expenses. The impact of the Acquisition also resulted in increased interest expense and increases in selling, general and administrative expenses. However, the change in basis resulting from the Acquisition did not impact net sales or Adjusted EBITDA and, for these metrics, we believe combining Predecessor and Successor results provides meaningful information. Accordingly, certain discussions below for net sales and Adjusted EBITDA present the combined results of the Predecessor and the Successor for the full year ended April 30, 2014. Such combination was performed by mathematical addition and is not a presentation made in accordance with GAAP, although we believe it provides a meaningful method of comparison for these two metrics. The combined net sales and Adjusted EBITDA data is being presented for informational purposes only. The combined operating results for these two metrics for the full year ended April 30, 2014 (i) have not been prepared on a pro forma basis as if the Acquisition occurred on the first day of the period, (ii) may not reflect the actual results we would have achieved absent the Acquisition, (iii) may not be predictive of our future results of operations and (iv) should not be viewed as a substitute for the financial results of the Predecessor and the Successor presented in accordance with GAAP. For all other metrics, to the extent that the change in basis had a material impact on our results, we have disclosed such impact under "—Results of Operations."
Business Overview
Founded in 1971, we are the leading North American distributor of wallboard and ceilings. Our core customer is the interior contractor, who typically installs wallboard, ceilings and our other interior construction products in commercial and residential buildings. As a leading specialty distributor, we serve as a critical link between our suppliers and a highly fragmented customer base of over 20,000 contractors. Our operating model combines a national platform with a local go-to-market strategy through over 155 branches across the country. We believe this combination enables us to
51
generate economies of scale while maintaining the high service levels, entrepreneurial culture and customer intimacy of a local business.
Our growth strategy entails taking market share within our existing footprint, expanding into new markets by opening new branches and acquiring competitors. We expect to continue to capture profitable market share in our existing footprint by delivering industry-leading customer service. Our strategy for opening new branches is to further penetrate markets that are adjacent to our existing operations. Typically, we have pre-existing customer relationships in these markets but need a new location to fully capitalize on those relationships. Since the beginning of full year 2014, we have opened 16 new branches and we currently expect to open several new branches each year depending on market conditions. In addition, we will continue to selectively pursue tuck-in acquisitions and have a dedicated team of professionals to manage the process. Due to the large, highly fragmented nature of our market and our reputation throughout the industry, we believe we have the potential to access a robust acquisition pipeline that will continue to supplement our organic growth. We use a rigorous targeting process to identify acquisition candidates that will fit our culture and business model. As a result of our scale, purchasing power and ability to improve operations through implementing best practices, we believe we can achieve substantial synergies and drive earnings accretion from our acquisition strategy.
Factors and Trends Affecting our Operating Results
General Economic Conditions and Outlook
Our business is sensitive to changes in general economic conditions, including, in particular, conditions in the North American commercial construction and housing markets. The markets we serve are broadly categorized as commercial new construction, commercial R&R, residential new construction and residential R&R. We believe all four end markets are currently in an extended period of expansion following a deep and prolonged downturn.
Our addressable commercial construction market is composed of a variety of commercial and institutional sub-segments with varying demand drivers. Our commercial markets include offices, hotels, retail stores and other commercial buildings, while our institutional markets include educational facilities, healthcare facilities, government buildings and other institutional facilities. The principal demand drivers across these markets include the overall economic outlook, the general business cycle, government spending, vacancy rates, employment trends, interest rates, availability of credit and demographic trends. Given the extreme depth of the last recession, despite the growth to date, activity in the commercial construction market remains well below average historical levels. According to Dodge Data & Analytics, new commercial construction put in place was 973 million square feet during the 2014 calendar year, which is an increase of 43% from 680 million square feet during the 2010 calendar year. However, new commercial construction activity remains well below historical levels. New commercial construction square footage put in place of 973 million square feet in 2014 would have needed to increase by 31% in order to achieve the historical market average of 1.3 billion square feet annually since 1970. We believe this represents a significant growth opportunity as activity continues to improve.
We believe commercial R&R spending is typically more stable than new commercial construction activity. Commercial R&R spending is driven by a number of factors, including commercial real estate prices and rental rates, office vacancy rates, government spending and interest rates. Commercial R&R spending is also driven by commercial lease expirations and renewals, as well as tenant turnover. Such events often result in repair, reconfiguration and/or upgrading of existing commercial space. As such, the commercial R&R market has historically been less volatile than commercial new construction. While there is very limited third party data for commercial R&R spending, we believe spending in this end market is in a period of expansion and will continue to grow over the next several years.
52
Residential construction activity is driven by a number of factors, including the overall economic outlook, employment, income growth, home prices, availability of mortgage financing, interest rates and consumer confidence, among others. According to the U.S. Census Bureau, U.S. housing starts reached 1.0 million in the 2014 calendar year, which is an increase of 8% from 2013 starts of 0.9 million. While housing starts increased for the fifth consecutive year in 2014, activity in the market remains well below historical levels. New residential housing starts of 1.0 million in 2014 would have needed to increase by 45% in order to reach their historical market average of 1.5 million annually since 1970. Industry analysts expect that over the long-term housing starts will return to their historical average, which we believe will result in substantial growth from current levels.
While residential R&R activity is typically more stable than new construction activity, we believe the prolonged period of under-investment during the recent downturn will result in above-average growth for the next several years. The primary drivers of residential R&R spending include changes in existing home prices, existing home sales, the average age of the housing stock, consumer confidence and interest rates. According to the U.S. Census Bureau, residential R&R spending reached $133.1 billion in the 2013 calendar year, which is an increase of 4.1% from $127.8 billion in 2012, and we believe this trend will continue for the next several years.
Seasonality and Inflation
Our operating results are typically impacted by seasonality. Historically, sales of our products have been slightly higher in the first and second quarters of each fiscal year (covering the calendar months of May through October) due to favorable weather and longer daylight conditions during these periods. Seasonal variations in operating results may be impacted by inclement weather conditions, such as cold or wet weather, which can delay construction projects.
We believe that our results of operations are not materially impacted by moderate changes in the economic inflation rate. In general, we have historically been successful in passing on price increases from our vendors to our customers in a timely manner, although there is no assurance that we can successfully do so in the future.
Acquisitions
We complement our organic growth strategy with selective, tuck-in acquisitions. Since the beginning of full year 2014, we have completed eight strategic acquisitions, of Dakota Gypsum, Sun Valley Supply, Inc., Contractors' Choice Supply, Inc., Drywall Supply, Inc., AllSouth Drywall Supply Company, Serrano Supply, Inc., Ohio Valley Building Products, LLC and J&B Materials, Inc., totaling 15 branches. We believe that significant opportunities exist to expand our geographic footprint by executing additional strategic acquisitions and we consistently strive to maintain an extensive and active acquisition pipeline. We are often evaluating several acquisition opportunities at any given time.
Public Company Costs
As a result of this initial public offering, we will incur additional legal, accounting and other expenses that we did not previously incur, including costs associated with SEC reporting and corporate governance requirements. These requirements include compliance with the Sarbanes-Oxley Act as well as other rules implemented by the SEC and . Our financial statements following this offering will reflect the impact of these expenses.
Debt Refinancings
Amounts outstanding under our $175.0 million revolving credit agreement with certain financial institutions, or the 2010 Credit Facility, were repaid in conjunction with the Acquisition. At such time, we entered into the ABL Facility and the Term Loan Facilities. As a result of the higher debt levels
53
following these refinancings, our interest expense increased during the full year ended April 30, 2014 and the fiscal year ended April 30, 2015. See "—Liquidity and Capital Resources" below.
Our Products
The following is a summary of our net sales by product group for the fiscal year ended April 30, 2015, the full year ended April 30, 2014 and the fiscal year ended April 30, 2013.
| | Fiscal Year Ended April 30, 2015 | % of Total | Full Year Ended April 30, 2014(1) | % of Total | Fiscal Year Ended April 30, 2013 | % of Total | |||||||||||||
|---|---|---|---|---|---|---|---|---|---|---|---|---|---|---|---|---|---|---|---|
| | (dollars in thousands) | ||||||||||||||||||
Wallboard | $ | 718,102 | 45.7 | % | $ | 602,801 | 44.5 | % | $ | 468,644 | 40.3 | % | |||||||
Ceilings | 278,749 | 17.8 | % | 256,999 | 19.0 | % | 253,951 | 21.9 | % | ||||||||||
Steel Framing | 243,173 | 15.5 | % | 216,538 | 16.0 | % | 198,377 | 17.1 | % | ||||||||||
Other Products | 330,061 | 21.0 | % | 277,002 | 20.5 | % | 240,638 | 20.7 | % | ||||||||||
| | | | | | | | | | | | | | | | | | | | |
Total Net Sales | $ | 1,570,085 | $ | 1,353,340 | $ | 1,161,610 | |||||||||||||
| | | | | | | | | | | | | | | | | | | | |
| | | | | | | | | | | | | | | | | | | | |
| | | | | | | | | | | | | | | | | | | | |
- (1)
- Represents the combined results of the Predecessor and the Successor periods for the full year ended April 30, 2014. This combination was performed by mathematical addition and is not a presentation made in accordance with GAAP. However, we believe it provides a meaningful method of comparison of net sales for the full year ended April 30, 2014 to the fiscal years ended April 30, 2013 and 2015. Net sales accounts were not impacted by the Acquisition.
54
Results of Operations
Fiscal Year Ended April 30, 2015 (Fiscal 2015), One Month Ended April 30, 2014 (Fiscal 2014 Successor Period) and Eleven Months Ended March��31, 2014 (Fiscal 2014 Predecessor Period)
The following table summarizes key components of our results of operations for the fiscal year ended April 30, 2015, the one month ended April 30, 2014 and the eleven months ended March 31, 2014:
| | Successor | Successor | Predecessor | |||||||
|---|---|---|---|---|---|---|---|---|---|---|
| | Fiscal Year Ended April 30, 2015 | One Month Ended April 30, 2014 | Eleven Months Ended March 31, 2014 | |||||||
| | (dollars in thousands) | |||||||||
Statement of operations data: | ||||||||||
Net sales | $ | 1,570,085 | $ | 127,332 | $ | 1,226,008 | ||||
Cost of sales (exclusive of depreciation and amortization shown separately below) | 1,091,114 | 97,955 | 853,020 | |||||||
| | | | | | | | | | | |
Gross profit | 478,971 | 29,377 | 372,988 | |||||||
| | | | | | | | | | | |
Operating expenses: | ||||||||||
Selling, general and administrative expenses | 396,155 | 46,052 | 352,930 | |||||||
Depreciation and amortization | 64,165 | 6,336 | 12,253 | |||||||
| | | | | | | | | | | |
Total operating expenses | 460,320 | 52,388 | 365,183 | |||||||
| | | | | | | | | | | |
Operating income (loss) | 18,651 | (23,011 | ) | 7,805 | ||||||
Other (expense) income: | ||||||||||
Interest expense | (36,396 | ) | (2,954 | ) | (4,226 | ) | ||||
Change in fair value of financial instruments | (2,494 | ) | — | — | ||||||
Change in fair value of mandatorily redeemable common shares(1) | — | — | (200,004 | ) | ||||||
Other income, net | 1,916 | 149 | 2,187 | |||||||
| | | | | | | | | | | |
Total other (expense), net | (36,974 | ) | (2,805 | ) | (202,043 | ) | ||||
| | | | | | | | | | | |
(Loss) before tax | (18,323 | ) | (25,816 | ) | (194,238 | ) | ||||
Income tax (benefit) expense | (4,526 | ) | (6,863 | ) | 6,623 | |||||
| | | | | | | | | | | |
Net (loss) | $ | (13,797 | ) | $ | (18,953 | ) | $ | (200,861 | ) | |
| | | | | | | | | | | |
| | | | | | | | | | | |
| | | | | | | | | | | |
Non-GAAP measures: | ||||||||||
Adjusted EBITDA(2) | $ | 113,860 | $ | 8,372 | $ | 78,690 | ||||
Adjusted EBITDA margin(2)(3) | 6.7 | % | 6.6 | % | 6.4 | % | ||||
- (1)
- Represents the change in fair value of mandatorily redeemable common shares of the Predecessor, all of which were acquired by the Company on April 1, 2014 in connection with the Acquisition. These shares had certain redemption features which provided that upon the death or disability of the shareholder or termination of his employment, Predecessor would be required to purchase these shares at their then current fair values. Pursuant to this provision, these shares were deemed to be mandatorily redeemable and, as such, were required to be reflected as a liability at their estimated fair values at the end of any reporting period. Changes in fair value are reflected as "Change in fair value of mandatorily redeemable common shares" on our consolidated statements of operations. Fair value was estimated based on commonly used valuation techniques. For additional details, see Note 10 of our consolidated financial statements included elsewhere in this prospectus.
- (2)
- Adjusted EBITDA and Adjusted EBITDA margin are non-GAAP measures. See "Prospectus Summary—Summary Financial and Other Data" for how we define and calculate Adjusted EBITDA and Adjusted EBITDA margin, reconciliations thereof to net (loss) income and a description of why we believe these measures are important.
55
- (3)
- Our Adjusted EBITDA for fiscal 2015 includes approximately $8.1 million from entities acquired in fiscal 2015 for the period prior to the date of acquisition of such entities, as defined in and permitted by the ABL Facility and the Term Loan Facilities. However, Adjusted EBITDA margin, which is calculated as a percentage of net sales, excludes this $8.1 million adjustment for fiscal 2015 to be consistent with our calculation of net sales for the same period.
Net Sales
Net sales of $1,570.1 million for the fiscal year ended April 30, 2015 increased $216.7 million, or 16.0%, from $1,353.3 million for the full year ended April 30, 2014. Our performance in fiscal 2015 was strong as our sales increased across all product categories. In fiscal 2015, our wallboard sales, which are impacted by both commercial and residential construction activity, increased by $115.3 million, or 19.1% from the full year ended April 30, 2014, primarily as a result of a 6.9% increase in product prices and an 11.5% increase in unit volume. In addition, in fiscal 2015, our ceiling sales increased $21.8 million, or 8.5%, from the full year ended April 30, 2014, and steel framing sales increased $26.6 million, or 12.3%. Ceiling and steel framing sales are primarily driven by commercial construction activity.
During the fiscal year ended April 30, 2015, we completed six acquisitions, totaling 13 branches. These acquisitions contributed $44.4 million to our net sales in fiscal 2015. Excluding the sites we acquired in fiscal 2015, our base business sales increased 12.7% compared to the full year ended April 30, 2014. When calculating our "base business" results, we exclude acquired branches for the first 15 months of operation. After 15 months of operation, we include acquired branches in our base business calculation, including for the comparative prior year period. The overall increase in our base business sales for fiscal 2015 reflected the increase in demand for our products as a result of the improvement in new housing starts, R&R activity and commercial construction, coupled with market share gains attributed to continued improvements in customer service levels. In addition, our base business improved through the addition of nine new branches opened in 2015. These new branches contributed $21.3 million to our base net sales in fiscal 2015.
The following table breaks out our consolidated net sales into the base business component and the excluded components, which are the recently acquired branches excluded from the base business:
| (Unaudited) | Fiscal Year Ended April 30, 2015 | Full Year Ended April 30, 2014 | |||||
|---|---|---|---|---|---|---|---|
| | (dollars in thousands) | ||||||
Base business net sales | $ | 1,525,705 | $ | 1,353,340 | |||
Excluded net sales | 44,380 | — | |||||
| | | | | | | | |
Total net sales | $ | 1,570,085 | $ | 1,353,340 | |||
| | | | | | | | |
| | | | | | | | |
| | | | | | | | |
We have excluded the following acquisitions from the base business for the periods identified:
Acquisition | Acquisition Date | Branches Acquired | Periods Excluded | ||||
|---|---|---|---|---|---|---|---|
Contractors' Choice Supply, Inc. (TX) | August 2014 | 1 | August 2014 - April 2015 | ||||
Drywall Supply, Inc. (NE) | October 2014 | 4 | October 2014 - April 2015 | ||||
AllSouth Drywall Supply Company (GA) | November 2014 | 1 | November 2014 - April 2015 | ||||
Serrano Supply, Inc. (IA) | February 2015 | 1 | February 2015 - April 2015 | ||||
Ohio Valley Building Products, LLC (WV) | February 2015 | 1 | February 2015 - April 2015 | ||||
J&B Materials, Inc. (CA, HI) | March 2015 | 5 | March 2015 - April 2015 | ||||
56
Gross Profit and Gross Margin
Gross profit was $479.0 million for the fiscal year ended April 30, 2015. Gross profit during the one month ended April 30, 2014 and the eleven months ended March 31, 2014 was $29.4 million and $373.0 million, respectively. As a result of the Acquisition, we applied the acquisition method of accounting and increased the value of our inventory by $12.8 million as of April 1, 2014. This adjustment increased our cost of sales during the fiscal year ended April 30, 2015 and the one month ended April 30, 2014 by $4.5 million and $8.3 million, respectively, as the related inventory was sold. Gross margin on net sales was 30.5% for the fiscal year ended April 30, 2015. Our gross margin on net sales during the one month ended April 30, 2014 and the eleven months ended March 31, 2014 was 23.1% and 30.4%, respectively. The purchase accounting adjustments to cost of sales negatively impacted our gross margin on net sales during the fiscal year ended April 30, 2015 and the one month ended April 30, 2014 by 29 basis points and 652 basis points, respectively. The favorable gross profit in fiscal 2015 was primarily the result of increased volumes and higher pricing, partially offset by higher cost of sales.
Selling, General and Administrative Expenses
Selling, general and administrative expenses consist of warehouse, delivery and general and administrative expenses. Our selling, general and administrative expenses were $396.2 million for the fiscal year ended April 30, 2015. For the one month ended April 30, 2014 and the eleven months ended March 31, 2014, selling, general and administrative expenses were $46.1 million and $352.9 million, respectively. With respect to costs related to the Acquisition, $16.2 million and $51.8 million were included in selling, general and administrative expenses for the one month ended April 30, 2014 and the eleven months ended March 31, 2014, respectively. Selling, general and administrative expenses were $399.0 million for the full year 2014. Excluding costs related to the Acquisition, these expenses were $331.0 million. Excluding the Acquisition related costs, selling, general and administrative expenses increased $65.2 million, or 19.7%, to $396.2 million for the fiscal year ended April 30, 2015. This increase was due to increases in warehouse expense of $3.3 million, of which $2.0 million was related to payroll; delivery expense of $18.9 million, of which $11.8 million was related to payroll; and increases in branch and corporate general and administrative expenses of $43.0 million, of which $24.1 million was related to payroll. The increases in payroll and payroll related costs were primarily due to increased headcount, which was due to the increase in delivered volume, acquisitions and the expansion of the yard support center. Selling, general and administrative expenses were 25.2%, 36.2% and 28.8% of our net sales during the fiscal year ended April 30, 2015, the one month ended April 30, 2014 and the eleven months ended March 31, 2014, respectively. Costs related to the Acquisition increased the percentage for the one month ended April 30, 2014 and the eleven months ended March 31, 2014 by 1,272 basis points and 423 basis points, respectively.
Depreciation and Amortization Expenses
Depreciation and amortization expenses were $64.2 million for the fiscal year ended April 30, 2015. For the one month ended April 30, 2014 and the eleven months ended March 31, 2014, depreciation and amortization expenses were $6.3 million and $12.3 million, respectively. As a result of the application of purchase accounting, at April 1, 2014, we increased the values of certain long-lived assets, including property and equipment. The impact of such adjustments increased depreciation expenses during the fiscal year ended April 30, 2015 and the one month ended April 30, 2014 by $16.4 million and $2.6 million, respectively. Amortization of definite-lived intangibles for the fiscal year ended April 30, 2015 was $32.0 million and was comprised of amortization on intangible assets acquired in the AEA Transaction. Amortization expenses for the one month ended April 30, 2014 was $2.5 million, representing one month of expense for the acquired intangibles.
57
Other Expense
Other expense primarily consists of interest expense associated with our debt, interest income, miscellaneous non-operating income and the change in fair value associated with the mandatorily redeemable common shares of Predecessor.
Interest expense was $36.4 million in the fiscal year ended April 30, 2015. For the one month ended April 30, 2014 and the eleven months ended March 31, 2014, interest expense was $3.0 million and $4.2 million, respectively. Our interest expense increased, subsequent to the Acquisition closing date, as a result of the incurrence of the term loan debt in connection with the Acquisition. Amounts outstanding under our $175.0 million 2010 Credit Facility were repaid in full with the proceeds of the Term Loan Facilities. See "Description of Certain Indebtedness." The Term Loan Facilities had a balance of $546.1 million and $550.0 million as of April 30, 2015 and 2014, respectively. Interest expense of $31.3 million and $2.6 million related to the Term Loan Facilities was recognized for the fiscal year ended April 30, 2015 and the one month ended April 30, 2014, respectively. The ABL Facility, which was entered into in connection with the Acquisition, had a balance of $17.0 million as of April 30, 2015 and interest expense of $1.2 million for the fiscal year ended April 30, 2015. Other interest expense incurred in the fiscal year ended April 30, 2015 was $3.9 million, primarily related to deferred financing costs and discounts amortized to interest expense.
Because Predecessor common stock included features that required Predecessor to redeem such shares upon the death or termination of employment with Predecessor by the shareholder, we reflected the change in such fair value as a non-operating charge in our consolidated statements of operations for the eleven months ended March 31, 2014. This non-cash charge was $200.0 million for the eleven months ended March 31, 2014. The change in the fair value of mandatorily redeemable common shares was attributable to appreciation of the value of the common shares. On April 1, 2014, all outstanding shares were acquired in the Acquisition. See Note 10 in our consolidated financial statements for additional information.
Income Tax (Benefit) Expense
Income tax benefit was $4.5 million for the fiscal year ended April 30, 2015. For the one month ended April 30, 2014, we recorded an income tax benefit of $6.9 million. For the eleven months ended March 31, 2014, we recorded an income tax expense of $6.6 million. We made valuation allowances of $0.1 million, $1.3 million and $1.4 million in the fiscal year ended April 30, 2015, the one month ended April 30, 2014 and the eleven months ended March 31, 2014, respectively. Our effective tax rate was 24.7%, 26.6% and 3.4% for the fiscal year ended April 30, 2015, the one month ended April 30, 2014 and the eleven months ended March 31, 2014, respectively. Tax expense for the one month ended April 30, 2014 and the eleven months ended March 31, 2014 differs from the statutory rate due to non-deductible charges related to non-deductible Acquisition-related transaction costs, state taxes and other permanent items. For the eleven months ended March 31, 2014, the primary drivers of the effective rate of 3.4% (or tax expense of $6.6 million) were $70.0 million of change in fair value of mandatorily redeemable common shares, $1.4 million in state income taxes, $2.2 million in non-deductible Acquisition-related transaction costs and $0.1 million of other permanent differences offset by $68.0 million of tax at the statutory rate.
Net Loss
Net loss was $13.8 million, $19.0 million and $200.9 million, for the fiscal year ended April 30, 2015, the one month ended April 30, 2014 and the eleven months ended March 31, 2014, respectively. The net loss of $13.8 million for the fiscal year ended April 30, 2015 was comprised of operating profit of $18.7 million, interest expense of $36.4 million, decrease in the fair value of financial instruments of $2.5 million, other income of $1.9 million and income tax benefit of $4.5 million. The net loss of
58
$19.0 million for the one month ended April 30, 2014 was comprised of operating loss of $23.0 million, interest expense of $3.0 million, other income of $0.2 million and income tax benefit of $6.9 million. The net loss of $200.9 million for the eleven months ended March 31, 2014 was comprised of operating income of $7.8 million, interest expense of $4.2 million, increase in the fair value of mandatorily redeemable common shares of $200.0 million, other income of $2.2 million and income tax expense of $6.6 million.
Adjusted EBITDA
Adjusted EBITDA of $113.9 million for the fiscal year ended April 30, 2015 increased $26.8 million, or 30.8%, from our Adjusted EBITDA of $87.1 million for the full year ended April 30, 2014. Excluding $8.1 million in contributions from acquisitions for the pre-acquisition period, Adjusted EBITDA margin increased approximately 31 basis points to 6.7% in the fiscal year ended April 30, 2015, compared to 6.4% in the full year ended April 30, 2014. The increase in Adjusted EBITDA was primarily due to increased profitability on higher net sales during the fiscal year ended April 30, 2015, which was partially offset by increases in variable costs to support the increased sales volumes. These variable costs include warehouse and delivery costs and other variable compensation. Additionally, expenses at our Yard Support Center increased approximately $4.5 million in fiscal 2015, primarily due to higher payroll and payroll related costs associated with an increase in corporate headcount and higher incentive compensation expense associated with our strong financial performance. See "—Non-GAAP Financial Measures" for more information and for a reconciliation of Adjusted EBITDA to net (loss) income, the most directly comparable financial measure calculated in accordance with GAAP.
59
One Month Ended April 30, 2014 (Fiscal 2014 Successor Period), Eleven Months Ended March 31, 2014 (Fiscal 2014 Predecessor Period) and Fiscal Year Ended April 30, 2013
The following table summarizes key components of our results of operations for the one month ended April 30, 2014, the eleven months ended March 31, 2014 and the fiscal year ended April 30, 2013:
| | Successor | Predecessor | Predecessor | |||||||
|---|---|---|---|---|---|---|---|---|---|---|
| | One Month Ended April 30, 2014 | Eleven Months Ended March 31, 2014 | Fiscal Year Ended April 30, 2013 | |||||||
| | (dollars in thousands) | |||||||||
Statement of Operations Data: | ||||||||||
Net sales | $ | 127,332 | $ | 1,226,008 | $ | 1,161,610 | ||||
Cost of sales (exclusive of depreciation and amortization shown separately below) | 97,955 | 853,020 | 824,331 | |||||||
| | | | | | | | | | | |
Gross profit | 29,377 | 372,988 | 337,279 | |||||||
| | | | | | | | | | | |
Operating expenses: | ||||||||||
Selling, general and administrative expenses | 46,052 | 352,930 | 295,289 | |||||||
Depreciation and amortization | 6,336 | 12,253 | 11,627 | |||||||
| | | | | | | | | | | |
Total operating expenses | 52,388 | 365,183 | 306,916 | |||||||
| | | | | | | | | | | |
Operating (loss) income | (23,011 | ) | 7,805 | 30,363 | ||||||
| | | | | | | | | | | |
Other (expense) income: | ||||||||||
Interest expense | (2,954 | ) | (4,226 | ) | (4,413 | ) | ||||
Change in fair value of mandatorily redeemable common shares(1) | — | (200,004 | ) | (198,212 | ) | |||||
Other income, net | 149 | 2,187 | 1,169 | |||||||
| | | | | | | | | | | |
Total other (expense), net | (2,805 | ) | (202,043 | ) | (201,456 | ) | ||||
| | | | | | | | | | | |
(Loss) before tax | (25,816 | ) | (194,238 | ) | (171,093 | ) | ||||
Income tax (benefit) expense | (6,863 | ) | 6,623 | 11,534 | ||||||
| | | | | | | | | | | |
Net (loss) | $ | (18,953 | ) | $ | (200,861 | ) | $ | (182,627 | ) | |
| | | | | | | | | | | |
| | | | | | | | | | | |
| | | | | | | | | | | |
Non-GAAP Measures: | ||||||||||
Adjusted EBITDA(2) | $ | 8,372 | $ | 78,690 | $ | 57,511 | ||||
Adjusted EBITDA Margin(2) | 6.6 | % | 6.4 | % | 5.0 | % | ||||
- (1)
- Represents the change in fair value of mandatorily redeemable common shares of the Predecessor, all of which were acquired by the Company on April 1, 2014 in connection with the Acquisition. These shares had certain redemption features which provided that upon the death or disability of the shareholder or termination of his employment, Predecessor would be required to purchase these shares at their then current fair values. Pursuant to this provision, these shares were deemed to be mandatorily redeemable and, as such, were required to be reflected as a liability at their estimated fair values at the end of any reporting period. Changes in fair value are reflected as "Change in fair value of mandatorily redeemable common shares" on our consolidated statements of operations. Fair value was estimated based on commonly used valuation techniques. For additional details, see Note 10 of our consolidated financial statements included elsewhere in this prospectus.
- (2)
- Adjusted EBITDA and Adjusted EBITDA margin are non-GAAP measures. See "Prospectus Summary—Summary Financial and Other Data" for how we define and calculate Adjusted EBITDA and Adjusted EBITDA margin, reconciliations thereof to net (loss) income and a description of why we believe these measures are important.
Net Sales
Net sales of $1,353.3 million for the full year ended April 30, 2014 increased $191.7 million, or 16.5%, from net sales of $1,161.6 million in fiscal 2013. For the full year ended April 30, 2014, our wallboard sales, which are impacted by both commercial and residential construction, increased by $134.2 million, or 28.6%, from fiscal 2013, as a result of a 13.9% increase in product prices and a 12.9% increase in unit volume. In addition, our ceiling sales increased $3.0 million, or 1.2%, from the previous year, and steel framing sales increased $18.2 million, or 9.2% from the previous year. Ceiling and steel framing sales are primarily driven by commercial construction activity.
60
In the full year ended April 30, 2014, we completed two acquisitions, each of which had one branch. These acquired branches contributed $14.1 million to our net sales in full year 2014. Excluding the sites we acquired in full year 2014, our base business sales increased 15.3% compared to the fiscal year ended April 30, 2013. The overall increase in our base business sales for full year 2014 reflected the increase in demand for our products as a result of the improvement in new housing starts, R&R activity and commercial construction, coupled with market share gains attributed to continued improvements in customer service levels. In addition, our base business improved through the addition of seven new branches opened in full year 2014. These new branches contributed $9.8 million to our base net sales in full year 2014.
The following table breaks out our consolidated net sales into the base business component and the excluded components, which are the branches excluded from the base business:
| (Unaudited) | Full Year Ended April 30, 2014 | Fiscal Year Ended April 30, 2013 | |||||
|---|---|---|---|---|---|---|---|
| | (dollars in thousands) | ||||||
Base business net sales | $ | 1,339,228 | $ | 1,161,610 | |||
Excluded net sales | 14,112 | — | |||||
| | | | | | | | |
Total net sales | $ | 1,353,340 | $ | 1,161,610 | |||
| | | | | | | | |
| | | | | | | | |
| | | | | | | | |
We have excluded the following acquisitions from the base business for the periods identified:
Acquisition | Acquisition Date | Branches Acquired | Periods Excluded | |||
|---|---|---|---|---|---|---|
Dakota Gypsum (ND) | August 2013 | 1 | August 2013 - April 2015 | |||
Sun Valley Supply, Inc. (AZ) | August 2013 | 1 | August 2013 - April 2015 |
Gross Profit and Gross Margin
Gross profit was $29.4 million and $373.0 million for the one month ended April 30, 2014 and the eleven months ended March 31, 2014, respectively. Gross profit was $337.3 million for the fiscal year ended April 30, 2013. The favorable gross profit in the one month ended April 30, 2014 and the eleven months ended March 31, 2014 was primarily the result of increased volumes and higher pricing, partially offset by the impact of higher costs of goods sold.
Gross margin on net sales during the one month ended April 30, 2014 and the eleven months ended March 31, 2014 was 23.1% and 30.4%, respectively. For the fiscal year ended April 30, 2013, gross margin was 29.0%. The purchase accounting adjustments to cost of sales negatively impacted our gross margin on net sales during the one month ended April 30, 2014 by 652 basis points.
Selling, General and Administrative Expenses
Selling, general and administrative expenses were $46.1 million and $352.9 million, for the one month ended April 30, 2014 and the eleven months ended March 31, 2014, respectively. For the fiscal year ended April 30, 2013, selling, general and administrative expenses were $295.3 million. With respect to costs related to the Acquisition, $16.2 million and $51.8 million were included in selling, general and administrative expenses for the one month ended April 30, 2014 and the eleven months ended March 31, 2014, respectively. Selling, general and administrative expenses were $399.0 million for the full year 2014. Excluding costs related to the Acquisition, these expenses were $331.0 million. Excluding the Acquisition related costs, selling, general and administrative expenses increased $35.7 million, or 12.1%, from $295.3 million for the fiscal year ended April 30, 2013. This increase was due to increases in warehouse expense of $3.1 million of which $1.5 million related to payroll expense; increases in delivery expense of $13.1 million, of which $9.6 million was related to payroll costs; and
61
increases in branch and corporate general and administrative expenses of $19.5 million, of which $7.2 million was related to payroll costs. The increases in payroll and payroll related costs was primarily due to increased headcount, which was due to an increase in delivered volumes and acquisitions. Selling, general and administrative expenses were 36.2%, 28.8% and 25.4% of net sales during the one month ended April 30, 2014, the eleven months ended March 31, 2014 and the fiscal year ended April 30, 2013, respectively. Costs related to the Acquisition increased the percentage for the one month ended April 30, 2014 and the eleven months ended March 31, 2014 by 1,272 basis points and 423 basis points, respectively.
Depreciation and Amortization Expenses
Depreciation and amortization expense was $6.3 million and $12.3 million for the one month ended April 30, 2014 and the eleven months ended March 31, 2014, respectively. For the year ended April 30, 2013, depreciation and amortization expense was $11.6 million. As a result of the application of purchase accounting, at April 1, 2014, we increased the values of certain long-lived assets, including property and equipment and definite-lived intangibles. The impact of such adjustments increased depreciation and amortization expenses during the one month ended April 30, 2014 by $5.1 million. The eleven months ended March 31, 2014 was impacted by asset purchases of $7.7 million.
Other Expense
Other expense primarily consists of interest expense associated with our debt, interest income, miscellaneous non-operating income and the change in fair value associated with the mandatory redeemable common shares of the Predecessor.
Interest expense was $3.0 million and $4.2 million in the one month ended April 30, 2014 and eleven months ended March 31, 2014, respectively. For the year ended April 30, 2013, interest expense was $4.4 million. Our interest expense increased, subsequent to the Acquisition closing date, as a result of the term loan debt incurred in connection with the Acquisition. The Term Loan Facilities had a balance of $550.0 million as of April 30, 2014. Interest expense of $2.6 million related to the Term Loan Facilities was recognized for the one month ended April 30, 2014. No amounts were outstanding under the ABL Facility as of April 30, 2014. Other interest expense incurred in the one month ended April 30, 2014 was $0.4 million, primarily related to deferred financing costs and discounts amortized to interest expense. The 2010 Credit Facility had a balance of $99.9 million as of April 30, 2013. Interest expense of $3.5 million related to the 2010 Credit Facility was recognized for the fiscal year ended April 30, 2013. Other interest expense incurred in the fiscal year ended April 30, 2013 was $0.9 million.
Because Predecessor common stock included features that required Predecessor to redeem such shares upon the death or termination of employment with Predecessor by the shareholder, we reflected the change in such fair value as a non-operating charge in our consolidated statements of operations for the eleven months ended March 31, 2014. This non-cash charge was $200.0 million and $198.2 million for the eleven months ended March 31, 2014 and the fiscal year ended April 30, 2013, respectively. The change in the fair value of mandatorily redeemable common shares was attributable to appreciation in the value of the common shares. On April 1, 2014, all outstanding shares were purchased in the Acquisition. See Note 10 in our consolidated financial statements for additional information.
Income Tax (Benefit) Expense
We recorded an income tax benefit of $6.9 million in the one month ended April 30, 2014, and income tax expense of $6.6 million in the eleven months ended March 31, 2014. For the year ended April 30, 2013, we recorded an income tax expense of $11.5 million. The effective income tax rates of 26.6% and 3.4% during the one month ended April 30, 2014 and the eleven months ended March 31, 2014, respectively, differed from the statutory rates and are primarily attributable to non-deductible
62
Acquisition related transaction costs, state taxes and other permanent items. For the eleven months ended March 31, 2014, the primary drivers of the effective rate of 3.4% (or tax expense of $6.6 million) were $70.0 million of change in fair value of mandatorily redeemable common shares, $1.4 million in state income taxes, $2.2 million in non-deductible Acquisition related transaction costs and $0.1 million of other permanent differences offset by $68.0 million of tax at the statutory rate. Differences between the statutory rate and the effective tax rate of 6.7% for the year ended April 30, 2013 are primarily attributable to change in fair value of redeemable common shares and permanent differences in state income taxes on subsidiaries with varying levels of taxable income.
Net Loss
Net loss was $19.0 million, $200.9 million and $182.6 million, for the one month ended April 30, 2014, the eleven months ended March 31, 2014 and the fiscal year ended April 30, 2013, respectively. The net loss of $19.0 million for the one month ended April 30, 2014 was comprised of operating loss of $23.0 million, interest expense of $3.0 million, other income of $0.2 million and income tax benefit of $6.9 million. The net loss of $200.9 million for the eleven months ended March 31, 2014 was comprised of operating income of $7.8 million, interest expense of $4.2 million, change in fair value of mandatorily redeemable common shares of $200.0 million, other income of $2.2 million and income tax expense of $6.6 million. The net loss of $182.6 million for the fiscal year ended April 30, 2013 was comprised of operating income of $30.4 million, interest expense of $4.4 million, increase in the fair value of mandatorily redeemable common shares of $198.2 million, other income of $1.2 million and income tax expense of $11.5 million.
Adjusted EBITDA
Adjusted EBITDA of $87.1 million in the full year ended April 30, 2014 increased by $29.6 million, or 51.4%, from Adjusted EBITDA of $57.5 million for the fiscal year ended April 30, 2013. Adjusted EBITDA margin increased by approximately 148 basis points to 6.4% in the full year ended April 30, 2014 as compared to the fiscal year ended April 30, 2013. The increase in Adjusted EBITDA was primarily due to increased profitability on higher net sales during the one month ended April 30, 2014 and the eleven months ended March 31, 2014, which were partially offset by increases in variable costs incurred to support the increased sales volumes. These variable costs include warehouse and delivery costs and other variable compensation costs including incentive compensation costs associated with our strong performance. See "—Non-GAAP Financial Measures" for more information and for a reconciliation of Adjusted EBITDA to net (loss) income, the most directly comparable financial measure calculated in accordance with GAAP.
Liquidity and Capital Resources
Summary
We depend on cash flow from operations, cash on hand and funds available under the ABL Facility to finance working capital needs and capital expenditures. We believe that these sources of funds will be adequate to fund debt service requirements and provide cash, as required, to support our strategies, ongoing operations, capital expenditures, lease obligations and working capital for at least the next 12 months.
As of April 30, 2015, we had available borrowing capacity of approximately $171.7 million under our $200.0 million ABL Facility. For a summary of selected terms of the ABL Facility and other indebtedness, see "Description of Certain Indebtedness."
During the fiscal year ended April 30, 2015, our use of cash was primarily driven by our investing activities, particularly our investments in acquisitions and property and equipment for our operating facilities.
63
Adjusted working capital
Adjusted working capital is an important measurement that we use in determining the efficiencies of our operations and our ability to readily convert assets into cash. Adjusted working capital represents current assets, excluding cash and cash equivalents, minus current liabilities, excluding current maturities of long-term debt. The material components of adjusted working capital for us include accounts receivable, inventory and accounts payable. Management of our adjusted working capital helps to ensure we can maximize our return and continue to invest in our operations for future growth. Comparing our adjusted working capital to that of other companies in our industry may be difficult, as other companies may calculate adjusted working capital differently than we do. A summary of adjusted working capital and a reconciliation to working capital as of April 30, 2015, 2014 and 2013 is shown in the following table:
| | April 30, 2015 | April 30, 2014 | April 30, 2013 | |||||||
|---|---|---|---|---|---|---|---|---|---|---|
| | (in thousands) | |||||||||
Trade accounts and notes receivables, net of allowances | $ | 214,321 | $ | 188,612 | $ | 159,470 | ||||
Inventories, net | 147,603 | 135,309 | 112,593 | |||||||
Accounts payable | (77,834 | ) | (70,106 | ) | (61,020 | ) | ||||
| | | | | | | | | | | |
| 284,090 | 253,815 | 211,043 | ||||||||
Other current assets | 65,056 | 66,084 | 34,292 | |||||||
Other current liabilities | (128,950 | ) | (72,430 | ) | (47,375 | ) | ||||
| | | | | | | | | | | |
Working capital | 220,196 | 247,469 | 197,960 | |||||||
| | | | | | | | | | | |
Cash and cash equivalents | (12,284 | ) | (32,662 | ) | (13,383 | ) | ||||
Current maturities of long term debt | 23,709 | 6,085 | 5,209 | |||||||
| | | | | | | | | | | |
Adjusted working capital | $ | 231,621 | $ | 220,892 | $ | 189,786 | ||||
| | | | | | | | | | | |
| | | | | | | | | | | |
| | | | | | | | | | | |
Our adjusted working capital increased by $10.7 million from April 30, 2014 to April 30, 2015 as a result of an increase in trade accounts and notes receivable and inventories, net of $25.7 million and $12.3 million, respectively, partially offset by an increase in accounts payable of $7.7 million and an increase in other current liabilities, net (excluding cash and cash equivalents and current maturities of long-term debt), of $19.5 million. The increases in trade accounts and notes receivable, inventories, net and accounts payable were related to increases in sales and to working capital needs related to acquisitions. The increase in other current assets (liabilities) (excluding cash and cash equivalents and current maturities of long-term debt), net was related to increases in accrued compensation and employee benefits of $12.2 million and other accrued liabilities of $26.7 million, partially offset by an increase to prepaid expenses and other current assets of $23.7 million. Working capital decreased $27.3 million from April 30, 2014 to April 30, 2015 as a result of the same factors which impacted adjusted working capital combined with the decrease in cash and cash equivalents of $20.4 million and the increase in current maturities of long-term debt of $17.6 million.
From April 30, 2013 to April 30, 2014, adjusted working capital increased by $31.1 million. This increase was primarily due to increases in receivables and inventories, net of $29.1 million and $22.7 million, respectively, which occurred due to increased sales. These increases were partially offset by increases in accounts payable of $9.1 million which related to increased purchases of inventory, and an increase in other current liabilities, net (excluding cash and cash equivalents and current maturities of long-term debt), of $11.7 million. Working capital increased $49.5 million from April 30, 2013 to April 30, 2014 as a result of the same factors which impacted adjusted working capital combined with the increase in cash and cash equivalents of $19.3 million.
64
A summary of our operating, investing and financing activities is shown in the following table:
| | Successor | Predecessor | |||||||||||
|---|---|---|---|---|---|---|---|---|---|---|---|---|---|
| | Fiscal Year Ended April 30, 2015 | One Month Ended April 30, 2014 | Eleven Months Ended March 31, 2014 | Fiscal Year Ended April 30, 2013 | |||||||||
| | (in thousands) | ||||||||||||
Cash flows | |||||||||||||
Cash flows provided by (used in) operating activities | $ | 48,023 | $ | (14,925 | ) | $ | 36,059 | $ | 13,316 | ||||
Cash flows used in investing activities | (81,466 | ) | (703,300 | ) | (8,371 | ) | (14,421 | ) | |||||
Cash flows provided by (used in) financing activities | 13,065 | 750,887 | (16,946 | ) | 5,375 | ||||||||
| | | | | | | | | | | | | | |
(Decrease) increase in cash and cash equivalents | $ | (20,378 | ) | $ | 32,662 | $ | 10,742 | $ | 4,270 | ||||
| | | | | | | | | | | | | | |
Operating Activities
Cash from operating activities consists primarily of net income adjusted for non-cash items, including depreciation and amortization, equity-based compensation, deferred taxes and the effects of changes in operating assets and liabilities, which were primarily the changes in working capital discussed above.
Net cash provided by operating activities was $48.0 million for the fiscal year ended April 30, 2015. This cash provided by operating activities was primarily driven by non-cash charges of $81.0 million, including depreciation and amortization of $67.5 million, combined with changes in current assets and liabilities of $20.3 million, partially offset by a net loss of $13.8 million, deferred tax benefits of $19.6 million and changes in primary working capital of $19.9 million, which was necessary to support the sales increases in the fiscal year ended April 30, 2015 as well as the addition of acquired businesses and new branches.
Net cash used in operating activities was $14.9 million in the one month ended April 30, 2014, which was primarily driven by a net loss of $19.0 million and deferred tax benefits of $6.9 million, partially offset by non-cash charges of $7.8 million, including depreciation and amortization of $6.6 million, combined with changes in current assets and liabilities of $3.2 million. In the eleven months ended March 31, 2014, cash provided by operating activities of $36.1 million was primarily driven by non-cash charges of $214.7 million, including the change in fair value of mandatorily redeemable common shares of $200.0 million and depreciation and amortization of $12.8 million, combined with changes in current assets and liabilities of $57.0 million including approximately $48.9 million in costs associated with the Acquisition, partially offset by a net loss of $200.9 million, deferred tax benefits of $7.1 million and changes in primary working capital of $27.6 million.
For the fiscal year ended April 30, 2013, cash provided by operating activities was $13.3 million, driven by net loss of $182.6 million and non-cash charges of $212.0 million, including the change in fair value of mandatorily redeemable common shares of $198.2 million and depreciation and amortization of $12.3 million, combined with changes in current assets and liabilities of $3.8 million, partially offset by decreases in primary working capital of $19.9 million.
Investing Activities
Net cash used in investing activities consists primarily of acquisitions; investments in our facilities including purchases of land, buildings, and leasehold improvements; and purchases of fleet assets, IT, and other equipment. We present this figure net of proceeds from asset sales which typically relate to sales of our fleet assets and closed facilities.
65
In the fiscal year ended April 30, 2015, net cash used in investing activities was $81.5 million, net of $3.8 million in proceeds from asset sales. This amount consisted of $66.7 million used to acquire six businesses, $4.6 million used to acquire an interest rate cap (see Note 1 to our consolidated financial statements included elsewhere in this prospectus for additional detail), $10.1 million of facilities expenditures and $3.8 million of other capital expenditures. Our facilities expenditures included investments made to purchase land and warehouses for the purpose of relocating and optimizing branches in Atlanta, Georgia and Milton, Florida and leasehold improvements associated with the relocation of our corporate headquarters.
During the one month ended April 30, 2014, net cash used in investing activities was $703.3 million. Of this amount, $703.0 million was used in the Acquisition.
During the eleven months ended March 31, 2014, net cash used in investing activities was $8.4 million, net of $4.4 million in proceeds from asset sales. This amount consisted of $5.0 million used to acquire two businesses, $3.8 million in facilities expenditures and $3.9 million of other capital expenditures. Our facilities expenditures included investments made to purchase land and warehouses for the purpose of relocating and optimizing branches in Winston-Salem, North Carolina and Duluth, Georgia.
In the fiscal year ended April 30, 2013, net cash used in investing activities was $14.4 million, net of $2.5 million in proceeds from asset sales. This amount consisted of $11.0 million in facilities expenditures and $5.9 million of other capital expenditures. Our facilities expenditures included investments made to purchase land and warehouses for a previously leased branch in Cedar, Minnesota and a new branch in Kirkland, Washington.
Capital expenditures vary depending on prevailing business factors, including current and anticipated market conditions. Historically, capital expenditures have for the most part remained at relatively low levels in comparison to the operating cash flows generated during the corresponding periods. We expect our fiscal 2016 capital expenditures to be approximately $7.0 million to $9.0 million (excluding acquisitions) primarily related to fleet and equipment purchases, facilities and IT investments to support our operations.
Financing Activities
Cash provided by, or used in, financing activities consists primarily of borrowings and related repayments under our credit agreements, as well as repayments of capital lease obligations and proceeds from the sales of equity.
Net cash provided by financing activities was $13.1 million for the fiscal year ended April 30, 2015, consisting primarily of net borrowings from the ABL Facility of $17.0 million. In the one month ended April 30, 2014, cash provided from financing activities was $750.9 million, which consisted of $546.5 million (net of original issue discount) received from the issuance of debt under the Term Loan Facilities and $224.1 million received from the sales of our common stock as a result of the Acquisition. In the eleven months ended March 31, 2014, cash used in financing activities of $16.9 million primarily consisted of net cash repayments on the 2010 Credit Facility of $13.8 million. For the fiscal year ended April 30, 2013, cash provided by financing activities of $5.4 million primarily consisted of borrowings of $9.5 million on the 2010 Credit Facility, partially offset by principal payments on long-term debt and capital lease obligations.
66
Our Credit Facilities
Our long-term debt consisted of the following at April 30, 2015 and April 30, 2014:
Acquisition Debt (Successor)
On April 1, 2014, our wholly-owned subsidiaries, GYP Holdings II Corp., as parent guarantor, and GYP Holdings III Corp., as borrower, entered into a senior secured first lien term loan facility, or the First Lien Facility, and a senior secured second lien term loan facility, or the Second Lien Facility and, together with the First Lien Facility, the Term Loan Facilities, in the aggregate amount of $550.0 million in connection with the Acquisition. The proceeds from the Term Loan Facilities were used to (i) repay all amounts outstanding under the 2010 Credit Facility in the amount of $86.1 million, (ii) pay the Acquisition purchase price and (iii) pay related fees and expenses.
The First Lien Facility was issued in an original aggregate principal amount of $388.1 million (net of $1.9 million of original issue discount). The Second Lien Facility was issued in an original aggregate principal amount of $158.4 million (net of $1.6 million of original issue discount). At April 30, 2015, the borrowing interest rates for the First Lien Facility and Second Lien Facility were 4.75% and 7.75%, respectively. Accrued interest, presented within other accrued expenses and current liabilities in our consolidated balance sheets, was approximately $1.1 million and $0.1 million at April 30, 2015 and 2014, respectively, and cash paid for interest was $30.3 million and $2.5 million in the fiscal year ended April 30, 2015 and the one month ended April 30, 2014, respectively. The First Lien Facility permits us to add one or more incremental term loans up to a fixed amount of $100.0 million (shared with the Second Lien Facility) plus a certain amount depending on a secured first lien leverage ratio test included in the First Lien Facility. The Second Lien Facility permits us to also add one or more incremental term loans up to a fixed amount of $100.0 million (shared with the First Lien Facility) plus a certain amount depending on a secured leverage ratio test included in the Second Lien Facility. The First Lien Facility bears interest at LIBOR (subject to a floor of 1.00%) plus a borrowing margin of 3.75%. The Second Lien Facility bears interest at LIBOR (subject to a floor of 1.00%) plus a borrowing margin of 6.75%. The First Lien Facility amortizes in nominal quarterly installments equal to approximately $975 thousand or 0.25% of the original aggregate principal amount of the First Lien Facility and matures on April 1, 2021. The Second Lien Facility has no amortization and matures on April 1, 2022. Provided that the individual affected lenders agree accordingly, the maturities of the term loans under the Term Loan Facilities, may, upon our request and without the consent of any other lender, be extended. Further, we are not subject to any financial maintenance covenants pursuant to the terms of the Term Loan Facilities.
Asset Based Lending Facility (Successor)
The asset-based revolving credit facility, or the ABL Facility, entered into on April 1, 2014, provides for revolving loans and the issuance of letters of credit up to a maximum aggregate principal amount of $200.0 million. Extensions of credit under the ABL Facility will be limited by a borrowing base calculated periodically based on specified percentages of the value of eligible inventory and eligible accounts receivable, subject to certain reserves and other adjustments. As of April 30, 2015, we had approximately $17.0 million in short-term swing line borrowings outstanding under the ABL Facility. As of April 30, 2015 and 2014, there were approximately $0.3 million and $0 accrued interest payable, respectively, on the ABL Facility. In the fiscal year ended April 30, 2015 and the one month ended April 30, 2015, we paid interest and other fees of $0.9 million and $0.1 million, respectively, on the ABL Facility.
The ABL Facility also permits us to request increases in the amount of the revolving, swing line and letter of credit facilities up to an aggregate maximum amount of $300.0 million for the total commitments under the ABL Facility (including all incremental commitments).
67
At our option, the interest rates applicable to the loans under the ABL Facility are based at LIBOR or Base Rate, plus, in each case, an applicable margin. The margins applicable for each elected interest rate are subject to a pricing grid, as defined in the ABL Facility Credit Agreement, based on average daily availability for the most recent fiscal quarter. The ABL Facility also contains an unused commitment fee subject to utilization, as included in the ABL Facility Credit Agreement.
The ABL Facility will mature on April 1, 2019 unless the individual affected lenders agree to extend the maturity of their respective loans under the ABL Facility upon our request and without the consent of any other lender.
Collateral under the ABL Facility and Term Loan Facilities
The ABL Facility is collateralized by (a) first priority perfected liens on our (i) accounts receivable, (ii) inventory, (iii) deposit accounts, (iv) cash and cash equivalents, (v) tax refunds and tax payments, (vi) chattel paper and (vii) documents, instruments, general intangibles, securities accounts, books and records, proceeds and supporting obligations related to each of the foregoing, subject to certain exceptions (collectively, "ABL Priority Collateral") and (b) third priority perfected liens on our remaining assets not constituting ABL Priority Collateral, subject to customary exceptions (collectively, "Term Priority Collateral").
The First Lien Facility and the Second Lien Facility are collateralized by (a) first priority liens and second priority liens, respectively, on the Term Priority Collateral and (b) second priority liens and third priority liens, respectively, on the ABL Priority Collateral, subject to customary exceptions.
Prepayments under the ABL Facility and Term Loan Facilities
The ABL Facility may be prepaid at our option at any time without premium or penalty and will be subject to mandatory prepayment if the outstanding ABL Facility exceeds the lesser of the (i) borrowing base and (ii) the aggregate amount of commitments. Mandatory prepayments do not result in a permanent reduction of the lenders' commitments under the ABL Facility.
The Term Loans under the Term Loan Facilities may be prepaid at any time without penalty, except that the Term Loans under the Second Lien Facility are subject to a 1% prepayment premium on voluntary prepayments and certain mandatory prepayments made prior to April 1, 2016. Under certain circumstances and subject to certain exceptions, the Term Loan Facilities will be subject to mandatory prepayments in the amount equal to: 100% of the net proceeds of certain assets sales and issuances or incurrences of non-permitted indebtedness; and 50% of annual excess cash flow for any fiscal year, such percentage to decrease to 25% or 0% depending on the attainment of certain total leverage ratio targets.
As of April 30, 2015, there was no requirement for a prepayment related to excess cash flow.
Guarantees
GYP Holdings III Corp. is the borrower under Term Loan Facilities and the lead borrower under the ABL Facility. Our wholly-owned subsidiary, GYP Holdings II Corp. (and direct parent of GYP Holdings III Corp.) guarantees our payment obligations under the Term Loan Facilities and the ABL Facility. Certain of our other subsidiaries are co-borrowers under the ABL Facility and guarantee our payment obligations under the Term Loan Facilities.
Covenants under the ABL Facility and Term Loan Facilities
The ABL Facility contains certain affirmative covenants, including financial and other reporting requirements. We are in compliance with all such covenants at April 30, 2015.
68
The Term Loan Facilities contain a number of covenants that limit our ability and the ability of our restricted subsidiaries, as described in the Term Loan Credit Agreements, to: (i) incur more indebtedness; (ii) pay dividends, redeem stock or make other distributions; (iii) make investments; (iv) create restrictions on the ability of our restricted subsidiaries to pay dividends to us or make other intercompany transfers; (v) create liens securing indebtedness; (vi) transfer or sell assets; (vii) merge or consolidate; (viii) enter into certain transactions with our affiliates; and (ix) prepay or amend the terms of certain indebtedness. We are in compliance with all restrictive covenants at April 30, 2015.
Events of Default under the ABL Facility and Term Loan Facilities
The ABL Facility and Term Loan Facilities provide for customary events of default, including non-payment of principal, interest or fees, violation of covenants, material inaccuracy of representations or warranties, specified cross default to other material indebtedness, certain bankruptcy events, certain ERISA events, material invalidity of guarantees or security interest, material judgments and changes of control.
Asset Based Lending Facility (Predecessor)
During fiscal 2013, we utilized our 2010 Credit Facility. At April 30, 2013, outstanding borrowings under the 2010 Credit Facility were $99.9 million with a weighted average interest rate of 2.57%.
In conjunction with the Acquisition, the outstanding balance of the 2010 Credit Facility was paid in full and unamortized deferred financing charges of $1.6 million were written off as part of the purchase price accounting.
Installment Notes
During the year ended April 30, 2013, the installment notes represented (i) notes for subsidiary stock repurchases from shareholders (ii) a note for the payout of stock appreciation rights and (iii) an installment note for a software license. In conjunction with the Acquisition, the shareholder notes and software license were paid in full as part of the purchase price. The installment note for the one month ended April 30, 2014 represents the outstanding note for the payout of the stock appreciation rights. The installment notes as of April 30, 2015 represent notes for subsidiary stock repurchases from shareholders and a note for the payout of stock appreciation rights.
Contractual Obligations
We enter into long-term obligations and commitments in the normal course of business, primarily debt obligations and non-cancelable operating leases. As of April 30, 2015, without giving effect to this offering, our contractual cash obligations over the next several periods are as follows:
| | Fiscal Year Ending April 30, 2016 | Fiscal Year Ending April 30, 2017 | Fiscal Year Ending April 30, 2018 | Fiscal Year Ending April 30, 2019 | Fiscal Year Ending April 30, 2020 | Thereafter | |||||||||||||
|---|---|---|---|---|---|---|---|---|---|---|---|---|---|---|---|---|---|---|---|
| | (in thousands) | ||||||||||||||||||
First Lien Facility | 3,900 | 3,900 | 3,900 | 3,900 | 3,900 | 366,600 | |||||||||||||
Second Lien Facility(1) | — | — | — | — | — | 160,000 | |||||||||||||
Interest on long-term debt | 30,670 | 30,485 | 30,300 | 30,115 | 29,929 | 39,671 | |||||||||||||
Capital Leases(2) | 4,546 | 2,973 | 1,121 | 407 | 334 | 568 | |||||||||||||
Operating Leases | 29,891 | 27,605 | 24,232 | 17,735 | 11,388 | 12,382 | |||||||||||||
| | | | | | | | | | | | | | | | | | | | |
Total(3) | $ | 69,007 | $ | 64,963 | $ | 59,553 | $ | 52,157 | $ | 45,551 | $ | 579,221 | |||||||
| | | | | | | | | | | | | | | | | | | | |
| | | | | | | | | | | | | | | | | | | | |
| | | | | | | | | | | | | | | | | | | | |
- (1)
- We expect to use the proceeds from this offering to repay $ of our borrowings under the Second Lien Facility.
- (2)
- Includes interest on capital lease obligations.
69
- (3)
- Does not reflect any borrowings under the ABL Facility. As of April 30, 2015, we had approximately $17.0 million in short-term swing line borrowings outstanding under the ABL Facility.
We may, from time to time, repurchase or otherwise retire or extend our debt and/or take other steps to reduce our debt or otherwise improve our financial position. These actions may include open market debt repurchases, negotiated repurchases, other retirements of outstanding debt and/or opportunistic refinancing of debt. The amount of debt that may be repurchased or otherwise retired or refinanced, if any, will depend on market conditions, trading levels of our debt, our cash position, compliance with debt covenants and other considerations. Our affiliates may also purchase our debt from time to time, through open market purchases or other transactions. In such cases, our debt may not be retired, in which case we would continue to pay interest in accordance with the terms of the debt, and we would continue to reflect the debt as outstanding in our consolidated balance sheets.
We lease certain office and warehouse facilities and equipment, some of which provide renewal options. Rent expense for operating leases, which may have escalating rents over the terms of the leases, is recorded on a straight-line basis over the minimum lease terms. Rent expense under operating leases approximated $29.9 million, $1.5 million, $19.9 million and $18.8 million for the fiscal year ended April 30, 2015, the one month ended April 30, 2014, the eleven months ended March 31, 2014 and the fiscal year ended April 30, 2013, respectively. As existing leases expire, we anticipate such leases will be renewed or replaced with other leases that are substantially similar in terms, which are consistent with market rates at the time of renewal.
Off Balance Sheet Arrangements
At April 30, 2015, we did not have any relationship with unconsolidated entities or financial partnerships for the purpose of facilitating off-balance sheet arrangements or for other contractually narrow or limited purposes.
Qualitative and Quantitative Disclosure of Market Risks
Interest Rate Risk
We are exposed to interest rate risk through fluctuations in interest rates on our debt obligations. A significant portion of our outstanding debt bears interest at variable rates. As a result, increases in interest rates could increase the cost of servicing our debt and could materially reduce our profitability and cash flows. However, we have entered into an interest rate cap on three-month U.S. dollar LIBOR based on a strike rate of 2.0%, which effectively caps the interest rate at 5.75% on an initial notional amount of $275.0 million of our variable rate debt obligation under the First Lien Facility, or any replacement facility with similar terms. Excluding the impact of this interest rate cap and the interest rate floor on the Term Loan Facilities, each 1% increase in interest rates on the Term Loan Facilities would increase our annual interest expense by approximately $5.5 million based on balances outstanding under the Term Loan Facilities as of April 30, 2015. Assuming the ABL Facility was fully drawn, each 1% increase in interest rates would result in a $2.0 million increase in our annual interest expense on the ABL Facility. We seek to manage exposure to adverse interest rate changes through our normal operating and financing activities, as well as through hedging activities, such as entering into interest rate derivative agreements, as discussed below under "—Derivative Financial Instruments." As of April 30, 2015, $17.0 million was outstanding under the ABL Facility and $171.7 million was available for future borrowings under the ABL Facility. In addition, we had $386.1 million outstanding under the First Lien Facility and $160.0 million outstanding under the Second Lien Facility. We intend to use a portion of the net proceeds from this offering to repay approximately $ of indebtedness under the Second Lien Facility, which will reduce our interest expense in the future.
70
Derivative Financial Instruments
We enter into interest rate derivative agreements, commonly referred to as caps or swaps, with the objective of minimizing the risks and costs associated with financing activities, as well as to maintain an appropriate mix of fixed and floating rate debt.
On October 31, 2014, we entered into an interest rate cap on three-month U.S. dollar LIBOR based on a strike rate of 2.0%, which is payable quarterly. This instrument effectively caps the interest rate at 5.75% on an initial notional amount of $275.0 million of our variable rate debt obligation under the First Lien Facility, or any replacement facility with similar terms. The interest rate cap was purchased for $4.6 million on October 31, 2014, effectively hedged on January 31, 2015, and expires on October 31, 2018.
This derivative instrument is recorded in "Other assets" on our consolidated balance sheets as of April 30, 2015 at its fair value of $2.2 million. The valuation of this instrument was determined using widely accepted valuation techniques, including discounted cash flow analysis on the expected cash flows of each derivative. This analysis reflected the contractual terms of the derivatives, including the period to maturity, and used observable market-based inputs, including interest rate curves and implied volatilities.
The decrease in fair value of the instrument from the purchase date to effective hedge date was $2.5 million and is reflected in "Change in fair value of financial instruments" on our consolidated statements of operations and comprehensive income (loss). The increase in fair value from the effective hedge date to the fiscal year ended April 30, 2015 was $10 thousand and was recorded in "Increase in fair value of financial instrument, net of tax," on our consolidated statements of operations and comprehensive income (loss). We believe there have been no material changes in the creditworthiness of the counterparty to this cap agreement and believe the risk of nonperformance by such party is minimal.
Impact of Inflation
We believe that our results of operations are not materially impacted by moderate changes in the economic inflation rate. In general, we have historically been successful in passing on price increases from our vendors to our customers in a timely manner, although there is no assurance that we can successfully do so in the future.
Critical Accounting Policies
Our discussion and analysis of operating results and financial condition are based upon our audited financial statements included elsewhere in this prospectus. The preparation of our financial statements, in accordance with GAAP, requires us to make estimates and assumptions that affect the reported amounts of assets, liabilities, net sales, expenses and related disclosures of contingent assets and liabilities. We base our estimates on past experience and other assumptions that we believe are reasonable under the circumstances, and we evaluate these estimates on an ongoing basis. Our critical accounting policies are those that materially affect our consolidated financial statements and involve difficult, subjective or complex judgments by management. Although these estimates are based on management's best knowledge of current events and actions that may impact us in the future, actual results may be materially different from the estimates.
We believe the following critical accounting policies are affected by significant judgments and estimates used in the preparation of our consolidated financial statements and that the judgments and estimates are reasonable.
71
Use of Estimates
The preparation of consolidated financial statements, in conformity with GAAP, requires management to make estimates and assumptions that affect the reported amounts of assets and liabilities and disclosure of contingent assets and liabilities at the date of the financial statements and the reported amounts of revenues and expenses during the reporting period. Actual results could differ from those estimates.
Revenue Recognition
We recognize revenue at the point of sale or upon delivery to the customer's site when the following four basic criteria are met:
- •
- persuasive evidence of an arrangement exists;
- •
- delivery has occurred or services have been rendered;
- •
- the price to the buyer is fixed or determinable; and
- •
- collectibility is reasonably assured.
Revenue, net of estimated returns and allowances, is recognized when sales transactions occur and title is passed, the related product is delivered, and includes any applicable shipping and handling costs invoiced to the customer. The expense related to such costs is included in "Selling, general and administrative" expenses.
Allowance for Doubtful Accounts
We maintain an allowance for doubtful accounts for estimated losses due to the failure of our customers to make required payments. Management believes the accounting estimate related to the allowance for doubtful accounts is a "critical accounting estimate" as it involves complex judgments about our customers' ability to pay.
The allowance for doubtful accounts is based on an assessment of individual past due accounts, historical write-off experience, accounts receivable aging, customer disputes and the business environment. Account balances are charged off when the potential for recovery is considered remote.
Management believes the allowance amounts recorded, in each instance, represent its best estimate of future outcomes. If there is a deterioration of a major customer's financial condition, if we become aware of additional information related to the creditworthiness of a major customer, or if future actual default rates on trade receivables in general differ from those currently anticipated, we may have to adjust its allowance for doubtful accounts, which would affect earnings in the period the adjustments were made. Based on our evaluation, we record reserves to reduce the related receivables to amounts we reasonably believe are collectible.
Inventories
Inventories consist primarily of materials purchased for resale, and include wallboard, ceilings, steel framing and other specialty building products. The cost of our inventories is determined by the moving average cost method, which approximates the first-in, first-out approach. We monitor our inventory levels by branch and record provisions for excess inventories based on slower moving inventory. We define potential excess inventory as the amount of inventory on hand in excess of the historical usage, excluding items purchased in the last 12 months. We then review our most recent history of sales and adjustments of such excess inventory and apply our judgment as to forecasted demand and other factors, including liquidation value, to determine the required adjustments to net realizable value. In addition, at the end of each fiscal year, we evaluate our inventory at each branch and write-off and
72
dispose of obsolete products. Our inventories are generally not susceptible to technological obsolescence.
During the fiscal year, we perform periodic cycle counts and write-off excess or damaged inventory as needed. At fiscal year-end, we take a physical inventory and record any necessary additional write-offs.
Long-Lived Assets and Goodwill
Our long-lived assets consist primarily of property, equipment, purchased intangible assets and goodwill. The valuation and the impairment testing of these long-lived assets involve significant judgments and assumptions, particularly as they relate to the identification of reporting units, asset groups and the determination of fair market value.
We test our tangible and intangible long-lived assets subject to amortization for impairment whenever facts and circumstances indicate that the carrying amount of an asset may not be recoverable. We test goodwill for impairment annually, or more frequently if triggering events occur indicating that there may be impairment.
We have recorded goodwill and perform testing for potential goodwill impairment at a reporting unit level. A reporting unit is an operating segment, or a business unit one level below an operating segment for which discrete financial information is available, and for which management regularly reviews the operating results. Additionally, components within an operating segment can be aggregated as a single reporting unit if they have similar economic characteristics. We have performed testing on each of our reporting units which contain goodwill.
During the fourth quarters of fiscals 2015, 2014 and 2013, we performed our annual impairment assessments of goodwill, which did not indicate that an impairment existed. During each assessment, we determined that the fair value of our reporting units which contain goodwill exceeded their carrying values.
For impairment testing of long-lived assets, we identify asset groups at the lowest level for which identifiable cash flows are largely independent of the cash flows of other groups of assets and liabilities. Recoverability of assets to be held and used is measured by a comparison of the carrying amount of an asset to estimated undiscounted future cash flow expected to be generated by the assets. If the carrying amount of an asset exceeds its estimated future cash flows, an impairment charge is recognized by the amount by which the carrying amount of the asset exceeds the estimated fair value of the asset.
As discussed above, changes in management intentions, market events or conditions, projected future net sales, operating results, cash flow of our reporting units and other similar circumstances could affect the assumptions used in the impairment tests. Although management currently believes that the estimates used in the evaluation of goodwill and other long-lived assets are reasonable, differences between actual and expected net sales, operating results and cash flow could cause these assets to be impaired. If any asset were determined to be impaired, this could have a material adverse effect on our results of operations and financial position, but not our cash flow from operations.
Significant estimates and assumptions inherent in the valuations reflect a consideration of other marketplace participants and include the amount and timing of future cash flows (including expected growth rates and profitability), the underlying product or technology life cycles, the economic barriers to entry and the discount rate applied to the cash flows. Unanticipated market or macroeconomic events and circumstances may occur that could affect the accuracy or validity of the estimates and assumptions.
Determining the useful life of an intangible asset also requires judgment. Certain intangible assets are expected to have indefinite lives based on their history and our plans to continue to support and
73
build the acquired brands. Other acquired intangible assets such as customer relationships and other brand or trade names are expected to have determinable useful lives. All of our customer-related intangibles are expected to have determinable useful lives. The costs of determinable-lived intangibles are amortized to expense over their estimated lives.
Equity-Based Compensation
We utilize the Black-Scholes option-pricing model to estimate the grant-date fair value of all stock options. The Black-Scholes option-pricing model requires the use of weighted average assumptions for estimated expected volatility, estimated expected term of stock options, risk-free rate, estimated expected dividend yield and the fair value of the underlying common stock at the date of grant. Because we do not have sufficient history to estimate the expected volatility of our common stock price, expected volatility is based on the average volatility of peer public entities that are similar in size and industry. We estimate the expected term of all stock options based on previous history of exercises. The risk-free rate is based on the U.S. Treasury yield curve in effect at the time of grant for the expected term of the stock option. The expected dividend yield is 0% as we have not declared any common stock dividends to date and do not expect to declare common stock dividends in the near future. The fair value of the underlying common stock at the date of grant is determined based on a valuation of our common stock. In the absence of a public trading market, we determine the fair value of our common stock utilizing methodologies, approaches and assumptions consistent with the American Institute of Certified Public Accountants Practice Aid, "Valuation of Privately-Held-Company Equity Securities Issued as Compensation." Our approach considered contemporaneous common stock valuations in determining the equity value of our company using a weighted combination of various methodologies, each of which can be categorized under either of the following two valuation approaches: the income approach and the market approach. The assumptions used in calculating the fair value of stock-based payment awards represent our best estimates, but these estimates involve inherent uncertainties and the application of management judgment.
We estimate forfeitures based on our historical analysis of actual stock option forfeitures and employee turnover. Actual forfeitures are recorded when incurred and estimated forfeitures are reviewed and adjusted at least annually. The weighted average assumptions used in the Black-Scholes option-pricing model for the fiscal year ended April 30, 2015 are set forth below:
| | April 30, 2015 | |||
|---|---|---|---|---|
Volatility | 59.54 | % | ||
Expected life (years) | 6.00 | |||
Risk-free interest rate | 1.78 | % | ||
Dividend yield | — | % | ||
In the fiscal year ended April 30, 2015, we issued 278,013 stock option awards to employees that vest based on service only. The weighted average grant date fair value of each stock option was $48.06 and the aggregate fair value of options outstanding and the aggregate fair value of options vested was $13.4 million and $2.2 million, respectively. All of these awards vest over a four-year period. Additionally, all these options could vest earlier in the event of a change in control, merger or other acquisition. This expense is recorded on an accelerated basis over the requisite service period of each separate vesting tranche. Equity-based compensation expense related to stock option awards was $6.5 million for the fiscal year ended April 30, 2015 and was included as a component of "Selling, general and administrative" expenses in our consolidated statements of operations and comprehensive income (loss). We also recognized related income tax benefits of $2.4 million which has been partially offset by a valuation allowance. At April 30, 2015, the unrecognized compensation expense related to stock option awards was $5.6 million with a remaining weighted average life of 3.1 years.
74
Subsidiary Equity-Based Deferred Compensation Arrangements
Some of our operating subsidiaries sponsor deferred compensation arrangements that entitle selected employees of those subsidiaries to participate in increases in the adjusted book value of a specified number of shares of common stock of those subsidiaries. Adjusted book value for this purpose generally means the book value of the relevant shares, as increased, or decreased, to reflect those shares' ratable portion of any annual earnings, or losses, of the relevant subsidiary (based on the total number of outstanding shares of the relevant subsidiary). The value of these arrangements is reflective of the carrying value of the subsidiaries' book equity and is not intended to represent its fair value. Employees participate in these deferred compensation arrangements in one or more of three ways: through cash-based stock appreciation rights (described below under the heading "—Stock appreciation rights"), by holding common stock of the applicable subsidiary (described below under the heading "—Liabilities to noncontrolling interest holders") and/or through deferred compensation programs (described below under the heading "—Deferred compensation"). We do not expect to grant similar interests in our subsidiaries in the future. Because in all cases these arrangements are typically settled in cash or notes, and do not meet the criteria established by ASC Topic 718, Compensation—Stock Compensation ("ASC 718") to be accounted for in "Stockholders' Equity", they are accounted for as liability awards. The arrangements are described in further detail below:
Stock appreciation rights. Certain subsidiaries have granted stock appreciation rights to certain employees under which payments are dependent on the appreciation in the adjusted book value of a specified number of shares of the applicable subsidiary. Settlements of the awards can be made in a combination of cash or installment notes, generally paid over four years, upon certain terminations of employment. Vesting periods vary by grant date and range from fiscal 2016 to fiscal 2018.
Current liabilities related to these stock appreciation rights awards of $1.1 million and $0.4 million were recorded as components of "Accrued compensation and employee benefits" at April 30, 2015 and 2014, respectively. The remaining liabilities related to these awards of $7.0 million and $5.4 million were recorded as components of "Other liabilities" at April 30, 2015 and 2014, respectively. In accordance with ASC 718, the change in the values of these awards is recognized as compensation expense in "Selling, general and administrative" expenses in our consolidated statements of operations and comprehensive income (loss). We recorded compensation expense related to these awards of $2.3 million, $80 thousand, $1.3 million and $1.1 million in fiscal 2015, the one month ended April 30, 2014, the eleven months ended March 31, 2014 and fiscal 2013, respectively. In fiscal 2015, the one month ended April 30, 2014 and the eleven months ended March 31, 2014, there were no forfeitures or exercises of stock appreciation rights.
As of the date of the initial filing of the registration statement of which this prospectus forms a part, we are a public entity in accordance with ASC 718. As a result, the stock appreciation rights will be reflected as liabilities measured at fair value, instead of intrinsic value, in our financial statements for the three months ending July 31, 2015, and in any other financial statements prepared prior to the completion of this offering.
Liabilities to noncontrolling interest holders. As described in Note 1 to our audited consolidated financial statements, noncontrolling interests were issued to certain employees of the subsidiaries in the form of common stock. All of these noncontrolling interest awards are subject to buy-sell agreements that require the stock to be redeemed for its adjusted book value, subject in certain cases to an agreed upon minimum value, only upon termination of employment. These instruments are redeemed in cash, typically in annual installments over the five years following termination of employment.
Liabilities related to these agreements are classified as share-based liability awards and the Company has elected to measure the awards at intrinsic value under ASC 718. Intrinsic value is determined to be the stated redemption value of the shares based on their adjusted book value as described above. The aggregate redemption values of these obligations as of April 30, 2015 and 2014
75
were $30.0 million and $29.7 million, respectively. Amounts expected to be paid in the next year are included in "Accrued compensation and benefits" at April 30, 2015 and 2014 in amounts of $1.6 million and $0, respectively.
In accordance with ASC 718, the change in the redemption values of these awards is recognized as compensation expense in "Selling, general and administrative" expenses in our consolidated statements of operations and comprehensive income (loss). Compensation expense of $1.6 million, $40 thousand, $2.3 million and $2.0 million was recognized related to these awards in fiscal 2015, the one month ended April 30, 2014, the eleven months ended March 31, 2014 and fiscal 2013, respectively.
In connection with the Acquisition, noncontrolling interest holders had the option to reinvest their ownership interests in the subsidiaries into GMS Inc. Noncontrolling interests of $32.5 million were reinvested into GMS Inc.
Accounting for our liabilities to noncontrolling interest holders will change as we transition from a private company to a public company. Our historical financial statements presented for periods prior to the filing of this registration statement reflect the noncontrolling interests as liability awards which are measured at intrinsic value under ASC 718. As of the date of the initial filing of the registration statement of which this prospectus forms a part, we are a public entity in accordance with ASC 718. As a result, the noncontrolling interest will be reflected as liabilities measured at fair value, instead of intrinsic value, in our financial statements for the three months ending July 31, 2015, and in any other financial statements prepared prior to the completion of this offering.
Deferred compensation. During fiscal 2014, each employee who held redeemable noncontrolling interests as described above was granted a deferred compensation obligation entitling the employee to a payment based on a percentage of the adjusted book value of his or her associated noncontrolling interest at the time of payment. These deferred compensation obligations become payable only upon the employee's death, disability, termination without cause or retirement. The obligations are paid in cash, usually in annual installments over the five years following termination of employment.
Current liabilities related to these obligations of $11 thousand and $15 thousand were recorded as components of "Accrued compensation and employee benefits" at April 30, 2015 and 2014, respectively. The remaining liabilities related to these obligations of $3.5 million and $3.3 million were recorded as components of "Other liabilities" at April 30, 2015 and 2014, respectively. In accordance with ASC 718, the change in the values of these obligations is recognized as compensation expense in "Selling, general and administrative" expenses in our consolidated statements of operations and comprehensive income (loss). We recorded compensation expense related to these obligations of $0.3 million, $31 thousand and $0.6 million in fiscal 2015, the one month ended April 30, 2014 and the eleven months ended March 31, 2014, respectively.
As of the date of the initial filing of the registration statement of which this prospectus forms a part, we are a public entity in accordance with ASC 718. As a result, the deferred compensation will be reflected as liabilities measured at fair value, instead of intrinsic value, in our financial statements for the three months ending July 31, 2015, and in any other financial statements prepared prior to the completion of this offering.
Income Taxes
Income taxes are accounted for in accordance with ASC 740, "Income Taxes", which requires the use of the asset and liability method. Deferred tax assets and liabilities are recognized based on the difference between the financial statement carrying amounts of existing assets and liabilities and their respective tax bases. Inherent in the measurement of deferred balances are certain judgments and interpretations of existing tax law and published guidance as applicable to our operations.
76
We evaluate our deferred tax assets to determine if valuation allowances are required. In assessing the realizability of deferred tax assets, we consider both positive and negative evidence in determining whether it is more likely than not that some portion or all of the deferred tax assets will not be realized. The primary negative evidence considered includes the cumulative operating losses generated in prior periods. The primary positive evidence considered includes the reversal of deferred tax liabilities related to depreciation and amortization that would occur within the same jurisdiction and during the carry-forward period necessary to absorb the federal and state net operating losses and other deferred tax assets. The reversal of such liabilities would utilize the federal and state net operating losses and other deferred tax assets.
We record amounts for uncertain tax positions that management believes are supportable, but are potentially subject to successful challenge by the applicable taxing authority. Consequently, changes in our assumptions and judgments could materially affect amounts recognized related to income tax uncertainties and may affect our results of operations or financial position. We believe our assumptions for estimates continue to be reasonable, although actual results may have a positive or negative material impact on the balances of such tax positions. Historically, the variation of estimates to actual results is immaterial and material variation is not expected in the future.
Vendor Rebates
Typical arrangements with our vendors provide for us to receive a rebate of a specified amount after we achieve any of a number of measures generally related to the volume of our purchases over a period of time. We reserve these rebates to effectively reduce our cost of sales in the period in which we sell the product. Throughout the year, we estimate the amount of rebates receivable for the periodic programs based upon the expected level of purchases. We continually revise these estimates to reflect actual rebates earned based on actual and projected purchase levels. If we fail to achieve a measure which is required to obtain a vendor rebate, we will have to record a charge in the period in which we determine the criteria or measure for the vendor rebate will not be met to the extent the vendor rebate was estimated and included as a reduction to cost of sales. Historically, our actual rebates have been within our expectations used for our estimates.
Derivative Instruments
We enter into interest rate derivative agreements, with the objective of minimizing the risks and costs associated with financing activities, as well as to maintain an appropriate mix of fixed-and floating-rate debt.
For derivative instruments designated as hedges for accounting purposes, we record the effective portions of changes in their fair value, net of taxes, in "Comprehensive (loss) income" to the extent the derivative is considered perfectly effective in achieving offsetting changes in fair value or cash flows attributable to the risk being hedged, until the hedged item is recognized in earnings (commonly referred to as the "hedge accounting" method).
The effectiveness of the hedges is periodically assessed by management during the lives of the hedges by: (i) comparing the current terms of the hedges with the related hedged debt to assure they continue to coincide and (ii) through an evaluation of the ability of the counterparties to the hedges to honor their obligations under the hedges. Any ineffective portions of the hedges are recognized in earnings through interest expense, financing costs and other expenses.
During the year ended April 30, 2015, we elected to designate a derivative instrument as a cash flow hedge in accordance with ASC 815. This instrument is an interest rate cap on quarterly resetting 3-month LIBOR, based on a strike rate of 2.0% and payable quarterly. This instrument effectively caps the interest rate at 5.75% on an initial notional amount of $275 million of our variable rate debt obligation under the ABL Facility and the Term Loan Facilities, or any replacement facility with similar
77
terms. The interest rate cap was purchased for $4.6 million on October 31, 2014, designated as a hedge on January 31, 2015 and expires on October 31, 2018.
This derivative instrument is recorded in the consolidated balance sheet as of April 30, 2015 as an asset at its fair value of $2.2 million within "Other assets". The valuation of this instrument was determined using widely accepted valuation techniques including a discounted cash flow analysis on the expected cash flows of each derivative. This analysis reflected the contractual terms of the derivatives, including the period to maturity, and used observable market-based inputs, including interest rate curves and implied volatilities.
The decrease in fair value of the instrument from the purchase date to the date of the hedge was $2.5 million and is reflected in "Change in fair value of financial instruments" on our consolidated statements of operations and comprehensive income (loss). The increase in fair value from the effective hedge date to the fiscal year ended April 30, 2015 was $10 thousand and was recorded in "Increase in fair value of financial instrument, net of tax." We believe there have been no material changes in the creditworthiness of the counterparty to this cap agreement and believes the risk of nonperformance by such party is minimal.
For derivatives that do not qualify or are not designated as hedging instruments for accounting purposes, changes in fair value are recorded in current period earnings, commonly referred to as the "mark-to-market" method. During fiscal 2013, we entered into an interest-rate swap agreement as a fixed-rate payor to mitigate interest-rate risk associated with floating interest rate borrowings under our revolving credit facility on an initial notional amount of $35.0 million. Per the terms of the contract, the Predecessor received fixed interest of 0.69% in exchange for floating interest indexed to the one-month LIBOR rate. Changes in fair value resulted in a gain of $0.2 million for the eleven month period ended March 31, 2014 and a loss of $0.3 million in the fiscal year ended April 30, 2013. These gains and losses are recognized in our consolidated statements of operations and comprehensive income (loss), in "Other income, net." At April 30, 2013, the fair value of the interest rate swap reported on our consolidated balance sheets in "Other liabilities" was $0.3 million. The interest rate swap was terminated in the eleven month period ended March 31, 2014 with a penalty of $0.1 million and interest of $16 thousand in "Other income, net" in our consolidated statements of operations and comprehensive income (loss).
Newly Issued Accounting Pronouncements
Presentation of an unrecognized tax benefit—In July 2013, the Financial Accounting Standards Board ("FASB") issued Accounting Standards Update ("ASU") No. 2013-11, "Presentation of an Unrecognized Tax Benefit When a Net Operating Loss Carry-forward, a Similar Tax Loss, or a Tax Credit Carry-forward Exists" ("ASU 2013-11"), which resolves diversity in practice on the financial statement presentation of an unrecognized tax benefit when a net operating loss carry-forward, a similar tax loss, or a tax credit carry-forward exists. An unrecognized tax benefit, or a portion of an unrecognized tax benefit, should be presented in the financial statements as a reduction to a deferred tax asset for a net operating loss carry-forward, a similar tax loss, or a tax credit carryforward, except in certain situations, as defined in ASU 2013-11. The amendments in ASU 2013-11 are effective prospectively for fiscal years, and interim periods within those years, beginning after December 15, 2013. We adopted ASU 2013-11 on May 1, 2014. The adoption of this standard did not materially impact our financial position, results of operations, or cash flows.
Discontinued operations—In April 2014, the FASB issued ASU No. 2014-08, "Reporting discontinued operations and disclosure of disposals of components of an entity" ("ASU 2014-08"). The amended guidance requires that a disposal representing a strategic shift that has (or will have) a major effect on an entity's financial results or a business activity classified as held for sale should be reported as discontinued operations. The amendments also expand the disclosure requirements for discontinued
78
operations and add new disclosures for individually significant dispositions that do not qualify as discontinued operations. The amendments are effective prospectively for fiscal years, and interim reporting periods within those years, beginning on or after December 15, 2014 (early adoption were permitted only for disposals that have not been previously reported). The impact on us of adopting ASU 2014-08 will depend on the nature and size of future disposals, if any, of a component of ours after the effective date. We had elected to early adopt ASU 2014-08 effective May 1, 2014. As a result of the adoption of this standard, the classification of a disposal made in fiscal 2015 that did not represent a strategic shift in our direction or have a major impact on our financial position or results of operations was not reported as a discontinued operation.
Revenue recognition—In May 2014, the FASB issued ASU No. 2014-09, "Revenue from contracts with customers" ("ASU 2014-09"). The amended guidance outlines a single comprehensive revenue model for entities to use in accounting for revenue arising from contracts with customers. The guidance supersedes most current revenue recognition guidance, including industry-specific guidance. The core principle of the revenue model is that "an entity recognizes revenue to depict the transfer of promised goods or services to customers in an amount that reflects the consideration to which the entity expects to be entitled in exchange for those goods or services." Entities have the option of using either a full retrospective or modified approach to adopt the guidance. ASU 2014-09 is effective for fiscal years, and interim reporting periods within those years, beginning after December 15, 2017 (early adoption is not permitted). We are currently evaluating the impact of adopting ASU 2014-09.
Going Concern—In August 2014, the FASB issued ASU 2014-15, "Disclosure of Uncertainties about an Entity's Ability to Continue as a Going Concern" ("ASU 2014-15"), which requires management to evaluate whether there are conditions or events that raise substantial doubt about an organization's ability to continue as a going concern and to provide related footnote disclosures. ASU 2014-15 is effective for interim and annual reporting periods beginning after December 15, 2016. Early adoption is permitted. We are currently evaluating the impact the adoption of this ASU will have on our consolidated financial statements.
Debt Issuance Costs—In April 2015, the FASB issued ASU 2015-03, "Simplifying the Presentation of Debt Issuance Costs" ("ASU 2015-03") which changes the presentation of debt issuance costs in financial statements. Under ASU 2015-03, an entity presents such costs in the balance sheet as a direct deduction from the related debt liability rather than as an asset. Amortization of the costs is reported as interest expense. The guidance is effective prospectively for fiscal years, and interim reporting periods within those years, beginning on or after December 15, 2015. Early adoption is permitted and upon adoption, the guidance must be applied retroactively to all periods presented in the financial statements. Management has early adopted the standard and retroactively applied to all periods presented in the financial statements. The adoption of this standard did not materially impact our financial position, results of operations, or cash flows.
Non-GAAP Financial Measures
Adjusted EBITDA
The following is a reconciliation of our net (loss) to Adjusted EBITDA for the fiscal year ended April 30, 2015, the one month ended April 30, 2014, the eleven months ended March 31, 2014 and the fiscal year ended April 30, 2013, as well as the calculation of Adjusted EBITDA for the full year ended April 30, 2014. EBITDA, Adjusted EBITDA and Adjusted EBITDA margin are non-GAAP measures. See "Prospectus Summary—Summary Financial and Other Data" for how we define and calculate Adjusted EBITDA and Adjusted EBITDA margin as non-GAAP measures and a description of why we believe these measures are important.
79
The following is a reconciliation of our net (loss) to Adjusted EBITDA:
| | Successor | | Predecessor | ||||||||||||
|---|---|---|---|---|---|---|---|---|---|---|---|---|---|---|---|
| | Fiscal Year Ended April 30, 2015 | One Month Ended April 30, 2014 | | Eleven Months Ended March 31, 2014 | Fiscal Year Ended April 30, 2013 | ||||||||||
| | (in thousands) | ||||||||||||||
Net (loss) | $ | (13,797 | ) | $ | (18,953 | ) | $ | (200,861 | ) | $ | (182,627 | ) | |||
Interest expense | 36,396 | 2,954 | 4,226 | 4,413 | |||||||||||
Change in fair value of mandatorily redeemable shares | — | — | 200,004 | 198,212 | |||||||||||
Interest income | (1,010 | ) | (76 | ) | (846 | ) | (798 | ) | |||||||
Income tax (benefit) expense | (4,526 | ) | (6,863 | ) | 6,623 | 11,534 | |||||||||
Depreciation expense | 32,208 | 3,818 | 12,224 | 11,665 | |||||||||||
Amortization expense | 31,957 | 2,518 | 38 | 72 | |||||||||||
| | | | | | | | | | | | | | | | |
EBITDA | $ | 81,228 | $ | (16,602 | ) | $ | 21,408 | $ | 42,471 | ||||||
| | | | | | | | | | | | | | | | |
Executive compensation(a) | $ | — | $ | 20 | $ | 2,427 | $ | 13,420 | |||||||
Stock appreciation rights expense(b) | 2,268 | 80 | 1,288 | 1,061 | |||||||||||
Redeemable noncontrolling interests(c) | 1,859 | 71 | 2,957 | 2,195 | |||||||||||
Equity-based compensation(d) | 6,455 | 1 | 27 | 82 | |||||||||||
Acquisition related costs(e) | 837 | 16,155 | 51,809 | 230 | |||||||||||
Severance and other costs for discontinued operations and closed branches(f) | 413 | — | — | (30 | ) | ||||||||||
Transaction costs (acquisitions and other)(g) | 1,891 | — | — | — | |||||||||||
Loss (gain) on disposal of assets | 1,089 | 170 | (1,034 | ) | (2,231 | ) | |||||||||
Management fee to related party(h) | 2,250 | 188 | — | — | |||||||||||
Effects of fair value adjustments to inventory(i) | 5,012 | 8,289 | — | — | |||||||||||
Interest rate swap and cap mark-to-market(j) | 2,494 | — | (192 | ) | 313 | ||||||||||
Contributions from acquisitions(k) | 8,064 | ||||||||||||||
| | | | | | | | | | | | | | | | |
Adjusted EBITDA | $ | 113,860 | $ | 8,372 | $ | 78,690 | $ | 57,511 | |||||||
| | | | | | | | | | | | | | | | |
| | | | | | | | | | | | | | | | |
| | | | | | | | | | | | | | | | |
- (a)
- Represents compensation paid to certain executives who were majority owners prior to the Acquisition. Following the Acquisition, these executives' compensation agreements were amended and, going forward, we do not anticipate additional adjustments.
- (b)
- Represents non-cash compensation expenses related to stock appreciation rights agreements. For additional details regarding stock appreciation rights, refer to "—Critical Accounting Policies—Subsidiary Equity-Based Deferred Compensation Arrangements."
- (c)
- Represents non-cash compensation expense related to changes in the redemption values of noncontrolling interests. For additional details regarding redeemable noncontrolling interests of our subsidiaries, refer to "—Critical Accounting Policies—Subsidiary Equity-Based Deferred Compensation Arrangements."
- (d)
- Represents non-cash equity-based compensation expense related to the issuance of stock options.
- (e)
- Represents non-recurring expenses related specifically to the Acquisition, including fees to financial advisors, accountants, attorneys and other professionals as well as costs related to the retirement of corporate stock appreciation rights. Also included are one-time bonuses paid to certain employees in connection with the Acquisition.
- (f)
- Represents severance expenses and other costs related to discontinued operations and closed branches.
- (g)
- Represents one-time costs related to this offering and acquisitions (other than the Acquisition) paid to third party advisors.
- (h)
- Represents management fees paid by us to our Sponsor. After this offering, our Sponsor will no longer receive management fees from us.
80
- (i)
- Represents the non-cash cost of sales impact of purchase accounting adjustments to increase inventory to its estimated fair value, primarily related to the Acquisition.
- (j)
- Represents the mark to market adjustments for certain financial instruments.
- (k)
- Represents earnings of acquired entities from the beginning of the periods presented to the date of such acquisition, as well as certain purchasing synergies and cost savings, as defined in and permitted by the ABL Facility and the Term Loan Facilities. Contributions from acquisitions are only reflected for fiscal 2015.
The following is the calculation of Adjusted EBITDA for the full year ended April 30, 2014. As discussed above, the change in basis resulting from the Acquisition did not impact Adjusted EBITDA. Although this presentation of Adjusted EBITDA on a combined basis is not a presentation made in accordance with GAAP, we believe it provides a meaningful method of comparison to the other periods presented in this prospectus.
| (in thousands) | Adjusted EBITDA | |||
|---|---|---|---|---|
Eleven Months Ended March 31, 2014 | $ | 78,690 | ||
One Month Ended April 30, 2014 | 8,372 | |||
| | | | | |
Full Year Ended April 30, 2014 | $ | 87,062 | ||
| | | | | |
| | | | | |
| | | | | |
81
Our Company
We are the leading North American distributor of wallboard and suspended ceilings systems. Our product offering of wallboard, suspended ceilings systems, or ceilings, and complementary interior construction products is designed to provide a comprehensive solution for our core customer, the interior contractor who installs these products in commercial and residential buildings. Over time, we have increased our market share in the distribution of wallboard and ceilings, which management currently estimates is 11% for wallboard, based on volume produced in the United States and Canada, and 14% for ceilings, based on sales dollars in North America.
Since our predecessor company was founded in 1971, we have sought to aggressively grow the business by capturing market share, opening new branches and acquiring other businesses. We completed our first acquisition in 1972 and proceeded to scale our business through a series of small acquisitions and new branch openings in the years thereafter. By 2000, we had acquired Metro Building Supply and GTS, two large regional distribution operations with strong positions in their markets. These acquisitions enabled us to establish a truly national platform and begin to realize the benefits of national scale. During the 2008 to 2009 financial crisis, construction markets declined to unprecedented levels in the post-World War II era. During this period, we proactively right-sized our Company. We consolidated back office functions, eliminated non-critical positions, closed underperforming branches and drove efficiencies in our core distribution operation. Because of our financial strength during the downturn, we were able to retain our key people, continue to take market share and emerge from the recession as a stronger company. As the construction markets have begun to recover, we have continued our aggressive growth strategy, completing eight acquisitions, constituting 15 branches, since the beginning of full year 2014.
We serve as a critical link between our suppliers and our highly fragmented customer base of over 20,000 contractors. Based on wallboard's unique product attributes and delivery requirements, distributing wallboard requires a higher degree of logistics and service expertise than most other building products. Wallboard has a high weight-to-value ratio, is easily damaged, cannot be left outside and often must be delivered to a job site before or after normal business hours. Due to the weight of the product, we are often required to deliver wallboard to the specific room where it will be installed. For example, we can place the precise amount and type of wallboard necessary for a second story room of a new building through the second story window using a specialized truck with an articulating boom loader. To do this effectively, we need to load the truck at the branch so that the precise amount and type of wallboard for each room of the building can be off-loaded by the articulating boom loader in the right sequence. Our sales, dispatch and delivery teams then coordinate an often complicated, customized delivery plan to ensure that our delivery schedule matches the customer's job site schedule, that deliveries are made with regard to the specific challenges of a customer's job site, that no damage occurs to the customer's property and, most importantly, that proper safety procedures are followed at all times. Often this requires us to send an employee to a jobsite before the delivery is made to document the specific requirements and safety considerations of a particular location. Given the logistical intensity of this process and the premium contractors place on distributors delivering the right product, at the right time, in the right place, we are able to differentiate ourselves based on service and can generate attractive gross profit margins. In addition to executing a logistics-intensive service, for all of our products we facilitate purchasing relationships between suppliers and our highly fragmented customer base by transferring technical product knowledge, educating contractors on proper installation techniques for new products, ensuring local product availability and extending trade credit.
We believe our strategic focus and operating model enable us to differentiate ourselves within our industry. Whereas several of our competitors are part of larger organizations that manufacture or distribute a wide variety of products, we focus on distributing wallboard, ceilings and complementary
82
interior construction products. We believe this focus enables us to provide superior service and product expertise to our customers. In addition, our operating model combines a national platform with a local go-to-market strategy through over 155 branches across the country. We believe this combination enables us to generate economies of scale while maintaining the high service levels, entrepreneurial culture and customer intimacy of a local business. In order to tailor its products and services to meet the needs of its local market, each of our branches operates with a significant amount of autonomy within the parameters of our overall business model. Branch managers are responsible for sales, pricing and staffing activities, and have full operational control of customer service and deliveries. They are compensated in part based on the profit they are able to achieve, which aligns their incentives with our financial goals. We believe our experienced, locally-focused teams, and our ability to develop, motivate and incentivize them, are key to our success. Through our Yard Support Center, which includes over 120 employees at our corporate office in Atlanta, we support our branches with various back office functions including accounting, IT, legal, safety, human resources, marketing and risk management. We also use our Yard Support Center to generate purchasing efficiencies and share best practices across our branch network.
We have grown our Company and developed our distinctive culture under strong, consistent leadership. Our senior management team has been with us for an average of 22 years. We have been able to retain top talent and incentivize managers through our entrepreneurial culture and broad-based equity ownership. Prior to this offering 71 of our employees own approximately 31% of our common stock (on a fully diluted basis, including vested and unvested stock options). Together with our strong base of experienced operators, our management team has grown our Company from a single site location to the market leader we are today.
Our Industry
As the U.S. construction market evolved during the second half of the 20th century, contractors began to specialize in specific trades within the construction process, and specialty distributors emerged to supply them. One of these trades was wallboard and ceilings installation, and we, along with other specialty distributors, tailored our product offerings and service capabilities to meet the unique needs of that trade. Today, specialty distributors comprise the preferred distribution channel for wallboard and ceilings in both the commercial and residential construction markets.
We believe the success of the specialty distribution model in wallboard and ceilings is driven by the strong value proposition provided to our customers. Given the logistical complexity of the distribution services we provide, the expertise needed to execute effectively, and the special equipment required, we believe specialty distributors focused on wallboard and ceilings are best suited to meet contractors' needs.
The table below provides an overview of the supply chain in our industry, which illustrates management's estimate of the share of the supply channel that is represented by specialty distributors.
83
Supply Chain Overview
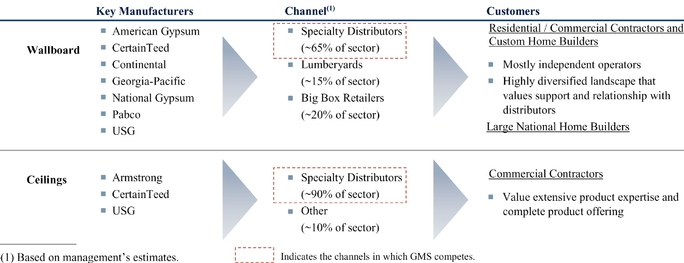
We estimate the North American market for the distribution of wallboard, ceilings and complementary interior construction products generated approximately $14 billion in sales in 2014. Of that market, we believe approximately $11 billion was served through specialty distributors like GMS, while the remaining approximately $3 billion was served by big box retailers, lumberyards and other channels. Despite continued consolidation among our competitors, we believe the North American specialty distribution industry remains highly fragmented and consists of approximately 400 local or regional participants. Our largest competitors in the North American specialty distribution industry include Allied Building Products (a subsidiary of CRH plc), Foundation Building Materials, L&W Supply (a subsidiary of USG) and Winroc (a subsidiary of Superior Plus). However, we believe smaller, regional or local competitors still comprise more than half of the industry. In contrast, the manufacturers of wallboard and ceilings products are highly consolidated. Since the late 1990s, the number of North American wallboard manufacturers has been reduced from twelve to seven, with the top four manufacturers representing approximately 75% of the wallboard market in 2014. Similarly, management estimates that three ceilings manufacturers accounted for approximately 95% of the ceilings manufactured in North America during 2014.
84
The main drivers for our products are commercial new construction, commercial R&R, residential new construction and residential R&R. Commercial new construction and residential new construction have historically been cyclical, while the commercial R&R and residential R&R drivers of our business have historically been more stable. We believe all four end markets have begun an extended period of expansion following a deep and prolonged downturn. Throughout most of the post-World War II era, the commercial construction cycle has typically lagged the residential construction cycle by approximately 12 to 24 months. We believe this lag, along with our balanced exposure to all four end markets and the more stable nature of the R&R markets, helps mitigate a portion of the cyclicality in our individual end markets and leads to lower volatility in our earnings than less diversified, more cyclical building products companies.
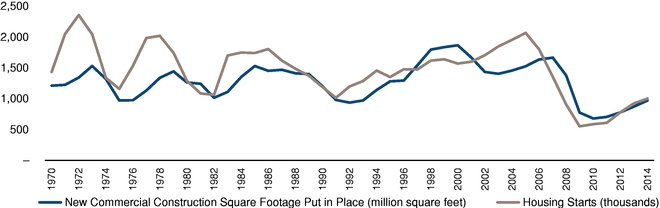
Source: U.S. Census Bureau and Dodge Data & Analytics.
85
Commercial
Our addressable commercial construction market is composed of a variety of commercial and institutional sub-segments with varying demand drivers. Our commercial markets include offices, hotels, retail stores and other commercial buildings, while our institutional markets include educational facilities, healthcare facilities, government buildings and other institutional facilities. The principal demand drivers across these markets include the overall economic outlook, the general business cycle, government spending, vacancy rates, employment trends, interest rates, availability of credit and demographic trends. Given the extreme depth of the last recession, despite the growth to date, activity in the commercial construction market remains well below average historical levels. According to Dodge Data & Analytics, new commercial construction square footage put in place was 973 million square feet during the 2014 calendar year, which is an increase of 43% from 680 million square feet during the 2010 calendar year. However, new commercial construction square footage put in place of 973 million square feet in 2014 would have needed to increase by 31% in order to achieve the historical market average of 1.3 billion square feet annually since 1970. We believe this represents a significant opportunity for growth as activity continues to improve.

New Commercial Construction Square Footage Put in Place | Units (million square feet) | 2014 | Unit Difference | Percentage Difference | |||||||||
|---|---|---|---|---|---|---|---|---|---|---|---|---|---|
Peak(1) | 1,666 | 973 | 693 | 71.1 | % | ||||||||
Long-Term Average(2) | 1,279 | 973 | 306 | 31.4 | % | ||||||||
Average Cyclical Low(3) | 1,108 | 973 | 135 | 13.9 | % | ||||||||
- (1)
- Prior peak occurred in 2007.
- (2)
- Average since 1970.
- (3)
- Prior downturn troughs include 1970, 1975, 1982, 1992 and 2003.
Source: Dodge Data & Analytics.
We believe commercial R&R spending is typically more stable than new commercial construction activity. Commercial R&R spending is driven by a number of factors, including commercial real estate prices and rental rates, office vacancy rates, government spending and interest rates. Commercial R&R spending is also driven by commercial lease expirations and renewals, as well as tenant turnover. Such events often result in repair, reconfiguration and/or upgrading of existing commercial space. As such, the commercial R&R market has historically been less volatile than commercial new construction. While there is very limited third party data for commercial R&R spending, we believe spending in this end market is in a period of expansion and will continue to grow for the next several years.
86
Residential
Residential construction activity is driven by a number of factors, including the overall economic outlook, employment, income growth, home prices, availability of mortgage financing, interest rates and consumer confidence, among others. According to the U.S. Census Bureau, U.S. housing starts reached 1.0 million in the 2014 calendar year, which is an increase of 8% from 2013 starts of 0.9 million. While housing starts increased for the fifth consecutive year in 2014, activity in the market remains well below historical levels. New residential housing starts of 1.0 million in 2014 would have needed to increase by 45% in order to reach their historical market average of 1.5 million annually since 1970. Industry analysts expect that over the long-term housing starts will return to their historical average, which we believe will result in substantial growth from current levels.
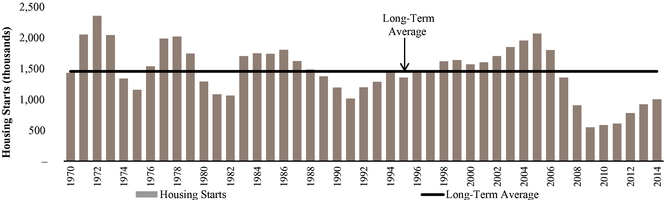
Housing Starts | Units (thousands) | 2014 | Unit Difference | Percentage Difference | |||||||||
|---|---|---|---|---|---|---|---|---|---|---|---|---|---|
Peak(1) | 2,068 | 1,003 | 1,065 | 106.1 | % | ||||||||
Long-Term Average(2) | 1,457 | 1,003 | 454 | 45.3 | % | ||||||||
Average Cyclical Low(3) | 1,079 | 1,003 | 76 | 7.5 | % | ||||||||
- (1)
- Prior peak occurred in 2005.
- (2)
- Average housing starts since 1970.
- (3)
- Prior downturn troughs include 1975, 1982 and 1991.
Source: U.S. Census Bureau.
87
While residential R&R activity is typically more stable than new construction activity, we believe the prolonged period of under-investment during the recent downturn will result in above-average growth for the next several years. The primary drivers of residential R&R spending include changes in existing home prices, existing home sales, the average age of the housing stock, consumer confidence and interest rates. According to the U.S. Census Bureau, residential R&R spending reached $133.1 billion in the 2013 calendar year, which is an increase of 4.1% from $127.8 billion in 2012, and we believe this trend will continue for the next several years.
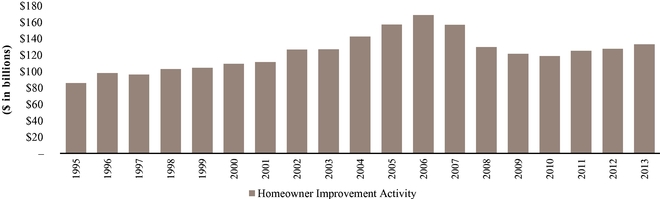
Source: U.S. Census Bureau.
Note: Dollars adjusted for inflation based on Consumer Price Index data provided by the U.S. Department of Labor, Bureau of Labor Statistics.
88
We believe that the following competitive strengths will drive our future growth:
Entrepreneurial culture. We believe our entrepreneurial, results-driven culture fosters highly dedicated employees who provide our customers with outstanding service that differentiates us from our competition. We empower managers with the independence and authority to make decisions locally. Further, we incentivize employees throughout our Company to generate business and execute it profitably through a compensation program that includes variable compensation and equity ownership. Prior to this offering, 71 of our employees own approximately 31% of our common stock (on a fully diluted basis, including vested and unvested stock options). We also believe our entrepreneurial culture, combined with our dedication to developing, training and providing opportunities for all of our employees, helps us attract and retain top talent. Similarly, we believe these characteristics have also positioned us as an attractive acquirer for smaller distributors whose owners are seeking liquidity.
Market leader with significant scale advantages. We are the largest North American specialty distributor of wallboard, ceilings and complementary interior construction products. Our industry is characterized by a large number of smaller, local distributors, which generally lack our level of scale and resources. We believe our leading market position, national reach and differentiated platform provide us significant advantages relative to these competitors, including:
- •
- advantageous purchasing and sourcing, such as exclusive supplier relationships in many markets;
- •
- significant flexibility to efficiently and economically serve a broad range of customers, ranging from local specialty contractors to large production home builders, across their span of operations; and
- •
- substantial financial and human resources to invest in developing our employees and maintaining our market-leading fleet and infrastructure.
Unwavering focus on relationships and superior service. We aim to be the premier partner of choice for our customers, suppliers and employees as well as smaller distributors whose owners may be seeking liquidity.
- •
- Customers. We believe we offer superior services and solutions due to our comprehensive product offering, local market knowledge, product expertise and the quality of our service. We deliver products to job sites in a precise, safe and timely manner with around-the-clock support from our dedicated local teams.
- •
- Suppliers. We provide a trusted professional partnership, resources for investment in growth and differentiated market access through our national reach. As a result, we have become a significant customer for our top suppliers, which enables us to obtain both competitive pricing and access to product in times of tight supply.
- •
- Employees. We provide our employees with an entrepreneurial culture, a safe work environment, attractive compensation, financial incentives and career development opportunities.
- •
- Acquisition candidates. We provide smaller distributors whose owners may be seeking liquidity with the opportunity to continue to operate their business in an entrepreneurial manner while relieving them of the risks and burdens associated with owning a small business. We also offer these owners scale advantages, resources for future growth and an attractive culture and platform for their employees.
Differentiated operating model. We believe the combination of our national scale with our local go-to-market strategy helps to drive our growth and attractive margin profile. Specifically, through our Yard Support Center we are able to benefit from scaled purchasing efficiencies, integrated technology
89
systems and shared best practices across our branch network, while still tailoring our service and product offering to the local preferences of each market. By retaining local brands and substantial autonomy in our branches, we are able to leverage local relationships and generate strong customer loyalty. In addition, we believe the inherent diversity in our model across customers, geographies and end markets offers lower volatility and less cyclicality than less diversified distributors in the building materials industry. We have low customer concentration with our largest customer representing less than 3% of our sales in fiscal 2015; we have geographic diversity with operations in 36 states; and based on certain assumptions by management as to the application of our products and our end markets, we believe that we have a balanced mix of business between the commercial and residential markets as well as between the new construction and R&R markets.
Multi-faceted growth. We have a track record of achieving above-market growth by capturing market share within our existing footprint, opening new branches and making selective acquisitions. Based on market data from the Gypsum Association and management's estimates, our volume growth has outpaced the wallboard market by an average of approximately 700 basis points annually over the past five years, and we have increased our market share by approximately 250 basis points over the same period. We believe our success in capturing market share is due to our differentiated culture, superior customer service, national scale and strong supplier relationships. We also have a successful history of growth through opening new branches in select locations where we have identified opportunities in underserved markets. Over the past five years, we have opened 23 new branches and we currently expect to open several new branches each year depending on market conditions. The new branches we have opened since 2010 have typically delivered attractive returns on invested capital in these markets within a few years. In addition, we complement our organic growth strategy with tuck-in acquisitions, of which we have completed eight, constituting 15 new branches, since the beginning of full year 2014. We believe our success in acquiring smaller distributors has been the result of our highly selective acquisition criteria, our focus on culture, our strategy of maintaining the acquisition's existing brand, when appropriate, to help ensure customer and employee continuity, our experience with integration, our national scale and our competitive position.
90
GMS Wallboard Market Share
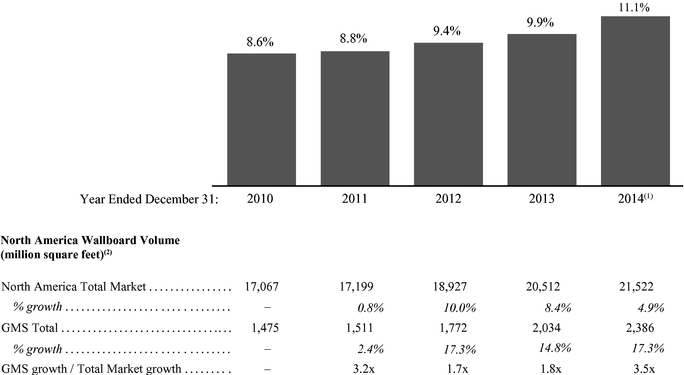
Source: Gypsum Association and Company data.
- (1)
- Includes the wallboard volume from entities acquired in fiscal 2015 assuming that the entities were acquired on January 1, 2014.
- (2)
- Represents the wallboard production volume of U.S. manufacturing facilities, some of which is sold into Canada.
Our objective is to strengthen our competitive position, achieve above-market rates of profitable growth and increase stockholder value through the following key strategies:
Continue to invest in our employees, assets and infrastructure. We believe our above market growth is driven by the quality of our employees and our ability to continuously develop outstanding talent. Each year we target graduates from premier universities to enter our training program and spend considerable time and resources training them across all major functions of our operations. In addition to recruiting and training new talent, we have developed an extensive management training program for existing, high potential employees which is focused on developing sales capabilities, financial acumen and operational and safety expertise. While these programs represent a considerable investment, we believe they are critical to supporting our growth strategy by providing managers for new branches and increasing the overall capacity of our management team. Many of our former trainees have been promoted to run branches, regions and even divisions throughout our Company. We also believe the size and growth of our Company provide our employees with superior career opportunities than many of our competitors, which further enables us to recruit and retain top talent. To ensure that we support our employees with the best equipment, systems and infrastructure, we also continue to invest in other key areas of our business. We have a young and well maintained fleet of trucks and delivery equipment and have also made significant investments in our IT infrastructure and continuously improve our IT capabilities.
91
Grow market share within our existing geographic footprint. We expect to continue to capture profitable market share from competitors within our existing geographic footprint. We believe that our dedication to delivering superior customer service and our national scale differentiates us from our competitors. We also continue to provide strong financial incentives, support and technology to maximize the efficiency and effectiveness of our experienced salesforce as they work to provide local market expertise and tailored solutions for our customers. For example, our salesforce will provide our customers with leads on new job activity that helps them grow their businesses. Additionally, we have a strategic initiative to leverage our national capabilities to serve large homebuilders throughout their operations that we believe will increase our penetration of those accounts. We believe this provides a compelling value proposition for our homebuilder customers by ensuring consistent service levels across their footprint.
Accelerate growth by selectively opening new branches and executing acquisitions. We believe that significant opportunities exist to expand our geographic footprint by opening new branches and executing selective, tuck-in acquisitions.
- •
- New branches. Our strategy for opening new branches is to further penetrate markets that are adjacent to our existing operations. Typically, we have pre-existing customer relationships in these markets but need a new location to fully capitalize on those relationships. Relative to our size and scale, the capital investment required to open a new facility is usually small, and the new branches we have opened over the past five years have typically generated attractive returns on invested capital within a few years. We believe our existing infrastructure is capable of supporting a much larger branch network, and we currently expect to open several new branches each year depending on market conditions.
- •
- Selective acquisitions. We will continue to selectively pursue tuck-in acquisitions and have a dedicated team of professionals to manage the process. Due to the large, highly fragmented nature of our market and our reputation throughout the industry, we believe we have the potential to access a robust acquisition pipeline that will continue to supplement our strong organic growth. We use a rigorous targeting process to identify acquisition candidates that will fit our culture and business model. As a result of our scale, purchasing power and ability to improve operations through implementing best practices, we believe we can achieve substantial synergies and drive earnings accretion from our acquisition strategy. We also believe that our successful track record in acquiring businesses provides a competitive advantage in the evaluation and integration of future acquisitions. We consistently strive to maintain an extensive and active acquisition pipeline and are often evaluating several acquisition opportunities at any given time.
Capitalize on accelerating growth across distinct end markets. We believe the new commercial and residential construction markets have both begun an extended period of expansion. Given the extreme depth of the last recession, despite the growth to date, activity in both markets remains well below average historical levels. As such, we believe both markets will experience an extended, sustained period of growth in the future. In addition, while R&R activity has historically been more stable than new construction activity, we believe the prolonged period of under-investment during the downturn will result in above-average growth in both commercial and residential R&R activity in the near term.
Achieve improved financial performance through operational excellence and operating leverage. Over the past five years, as volumes have recovered and as we have streamlined our operating model, our Adjusted EBITDA margins have improved significantly. Our Yard Support Center continues to drive procurement savings and operational excellence across our branch network. Our operational initiatives include optimizing pricing, improving fleet utilization and maximizing working capital efficiency. As our volumes continue to grow, we expect margins to improve from the inherent operating leverage in our business. In the past, our existing branch network has supported substantially higher volumes per
92
branch. As our end markets continue to recover, we expect to generate higher operating margins on incremental volume as we leverage our fixed costs at our existing branches. Similarly, we have made significant investments in our Yard Support Center over the past few years to prepare for significant growth in our business. As we continue to grow our volumes, we expect to gain operating leverage on that investment in the years ahead.
We provide a comprehensive product offering for interior contractors. By carrying a full line of wallboard and ceilings along with steel framing and ancillary products, we are able to serve as a one-stop-shop for our customers.
Wallboard
Wallboard is one of the most widely used building products for interior and exterior walls and ceilings in residential and commercial structures due to its low cost, ease of installation and superior performance in providing comfort, fire resistance, thermal insulation, sound insulation, mold and moisture resistance, impact resistance, aesthetics and design elements. Wallboard is sold in panels of various dimensions, suited to various applications. These panels come in1/2 inch,3/8 inch and5/8 inch thicknesses, with varying lengths and widths designed to meet customers' needs for various applications. Panels with greater thickness provide increased durability and sound insulation. In commercial and institutional construction projects, architectural specifications and building codes provide requirements related to the thickness of the panels and, in some cases, other characteristics, including fire resistance. In addition, there are wallboard products that provide some additional value in use. These include lighter weight panels, panels with additional sound insulation, and panels coated to provide mold and moisture resistance. In addition to the interior wallboard products described above, exterior sheathing is a water-resistant wallboard product designed for attachment to exterior side-wall framing as an underlayment for various exterior siding materials. These panels are manufactured with a treated, water-resistant core faced with water-repellent paper on both face and back surfaces and long edges.
While highly visible and essential, wallboard typically comprises only 3% to 5% of a new home's total cost. Given its low price point relative to other materials, we believe that there is no economical substitute for wallboard in either residential or commercial applications. We believe wallboard demand is driven by a balanced mix of both residential and commercial new construction as well as R&R activity.
Ceilings
Our ceilings product line consists of suspended mineral fiber, soft fiber and metal ceiling systems primarily used in offices, hotels, hospitals, retail facilities, schools and a variety of other commercial and institutional buildings. The principal components of our ceiling systems are typically square mineral fiber tiles and the metal grid that holds the tile in place. The systems vary by acoustical performance characteristics, reflectivity, color, fire protection and aesthetic appeal. In addition to these systems, we have expanded our ceilings product offering to include architectural specialty ceilings. This product line consists of a variety of specialty shapes that provide a room with a unique visual effect as well as enhanced acoustical performance. As a result of the specified, often customized nature of these products, architectural specialty ceilings are a growing, high margin component of our product offering.
Our ceilings product line is almost exclusively sold into commercial and institutional applications. Because interior contractors who purchase ceilings frequently buy wallboard from the same distributor, carrying our ceilings product line helps increase our sales of wallboard and other complementary products, which are often delivered together with ceilings to the same worksite as part of a commercial package.
93
In the ceilings market, brand is highly valued and often specified by the architect of a commercial building. Because of our strong market position, we have exclusive access to the leading ceilings brand in many of our local markets. Where we have exclusivity, these specifications help us drive sales of ceilings products as well as all of the complementary products we sell as part of our commercial package. In effect, our exclusivity on the leading ceiling tile brand creates a virtuous cycle which helps reinforce our market position in our other products. In addition, because ceiling tile systems differ in size, shape and aesthetic appeal between manufacturers, they are often replaced with the same brand for repair and remodeling projects. As a result, the leading brand's installed base of product generates built in demand for replacement product over time. Because we have exclusive access to that brand in certain markets, we benefit from these recurring sales.
Steel Framing
Our steel framing product line consists of steel track, studs and the various other steel products used to frame the interior walls of a commercial or institutional building. Typically the contractor who installs the steel framing also installs the wallboard, and the two products along with ceilings, insulation and other products are sold together as part of a commercial package. Nearly all of our steel framing products are sold for use in commercial buildings.
Other Products
In addition to our three main product lines, we supply our customers with complementary products, including insulation, ready-mix-joint compound and various other interior construction products. We also supply our customers with the ancillary products they need to complete the job including tools and safety products. We partner with leading branded vendors for many of these products and allow them to merchandise their products in our show rooms that are adjacent to many of our warehouses.
Customers
Our diverse customer base consists of more than 20,000 contractors as well as home builders. We maintain local relationships with our contractors through our network of branches and our extensive salesforce. We also serve our large homebuilder customers through our local branches, but are able to coordinate the relationship on a national basis through our Yard Support Center. Our ability to serve multi-regional homebuilders across their footprint provides value to them and differentiates us from most of our competitors. As of fiscal 2015, our single largest customer accounted for 3% of our revenues and our top ten customers accounted for 11%.
Suppliers
Our leading market position, national footprint and superior service capabilities has allowed us to develop strong relationships with our suppliers. We maintain exceptional, long-term relationships with all seven major North American wallboard manufacturers, as well as the three major ceilings manufacturers: Armstrong, CertainTeed and USG. Because we account for a meaningful portion of their volumes and provide them with an extensive salesforce to market their products, we are viewed by our suppliers as a key channel partner. We believe this position provides us with advantaged procurement.
Our sales and marketing strategy is to provide a comprehensive set of high-quality products and superior services to contractors and builders reliably, safely, accurately and on-time. We have a highly
94
experienced sales force of more than 500 people who manage our customer relationships and grow our customer base. We have strategies to increase our customer base at both the corporate and local branch levels, which employ sales strategies to drive and grow strong relationships with our customers, whether they serve a small local market, or a national footprint. We believe that the experience and expertise of our salesforce differentiates us from our competition particularly in the commercial market, which requires a highly technical and specialized product knowledge and a sophisticated delivery plan.
As of April 30, 2015, we had approximately 3,100 employees, of which less than 3% were affiliated with labor unions. We believe that we have good relations with our employees. Additionally, we believe that the training provided through our development programs and our entrepreneurial, performance-based culture provides significant benefits to our employees.
Facilities
Our corporate headquarters is in Tucker, Georgia. In addition, we have one leased sales office in Atlanta, Georgia and one owned office in Riverview, Florida. In addition, we are holding seven of our owned properties for sale, with five in the Atlanta, Georgia metropolitan area, one in Winston-Salem, North Carolina and one in Austin, Texas. We operate our business through 156 branches, across 36 states and the District of Columbia. The covered square footage of our warehouses is equal to an aggregate of approximately 5.5 million square feet. As of April 30, 2015, we owned 77 of our facilities, some of which were used as collateral to secure the Term Loan Facilities. We believe that substantially all of our property and equipment is in good condition, subject to normal wear and tear.
As of April 30, 2015, we operated 156 branches, a few with multiple facilities, located in the following locations:
Location | Number of Branches | Location | Number of Branches | ||||||
|---|---|---|---|---|---|---|---|---|---|
Alabama | 5 | Montana | 2 | ||||||
Alaska | 1 | Nebraska | 2 | ||||||
Arizona | 1 | Nevada | 1 | ||||||
Arkansas | 3 | New Jersey | 2 | ||||||
California | 4 | New Mexico | 5 | ||||||
Colorado | 6 | North Carolina | 9 | ||||||
Delaware | 2 | North Dakota | 3 | ||||||
District of Columbia | 1 | Oklahoma | 2 | ||||||
Florida | 9 | Oregon | 4 | ||||||
Georgia | 16 | South Carolina | 9 | ||||||
Hawaii | 1 | South Dakota | 1 | ||||||
Idaho | 3 | Tennessee | 4 | ||||||
Iowa | 1 | Texas | 14 | ||||||
Kansas | 1 | Virginia | 12 | ||||||
Kentucky | 3 | Washington | 9 | ||||||
Louisiana | 1 | West Virginia | 1 | ||||||
Maryland | 6 | Wisconsin | 1 | ||||||
Minnesota | 5 | Wyoming | 1 | ||||||
| | | | | | | | | | |
Missouri | 5 | Total | 156 | ||||||
| | | | | | | | | | |
| | | | | | | | | | |
| | | | | | | | | | |
95
Fleet
We maintain a dedicated fleet of approximately 2,000 leased and owned pieces of equipment, including approximately 500 trucks with articulating boom loaders and nearly 300 flatbed trucks. Our fleet can be transferred across our branch network based upon changes in demand. Our leased fleet currently accounts for roughly 35% of total vehicles, with the remaining 65% being owned.
We compete against other specialty distributors as well as big box retailers and lumberyards. Among specialty distributors, we compete against a small number of large distributors and many small, local, privately-owned distributors. Our largest competitors include: Allied Building Products (a subsidiary of CRH plc), Foundation Building Materials, L&W Supply (a subsidiary of USG) and Winroc (a subsidiary of Superior Plus). However, we believe smaller, regional or local competitors still comprise approximately more than half of the North American specialty distribution market. The principal competitive factors in our business include, but are not limited to, availability of materials and supplies; technical product knowledge and expertise; advisory or other service capabilities; delivery capabilities; pricing of products; and availability of credit.
In a typical year, our operating results are impacted by seasonality. Historically, sales of our products have been slightly higher in the first and second quarters of each fiscal year due to favorable weather and longer daylight conditions during these periods. Seasonal variations in operating results may be impacted by inclement weather conditions, such as cold or wet weather, which can delay construction projects.
While we are not engaged in a "regulated industry," we are subject to various federal, state and local government regulations applicable to the business generally in the jurisdictions in which we operate, including laws and regulations relating to our relationships with our employees, public health and safety, work place safety, transportation, zoning and fire codes. We strive to operate each of our branches in accordance with applicable laws, codes and regulations. We believe we are in compliance in all material respects with existing applicable environmental laws and regulations and our employment, workplace health and workplace safety practices.
Our operations in domestic interstate commerce are subject to the regulatory jurisdiction of the DOT, which has broad administrative powers with respect to our transportation operations. We are subject to safety requirements governing interstate operations prescribed by the DOT. Vehicle dimension and driver hours of service also are subject to both federal and state regulation. See "Risk Factors—Risks Related to Our Business and Industry—Federal, state, local and other regulations could impose substantial costs and restrictions on our operations that would reduce our net income." Our operations are also subject to the regulatory jurisdiction of OSHA, which has broad administrative powers with respect to workplace and jobsite safety.
Litigation and Legal Proceedings
From time to time, we are involved in lawsuits that are brought against us in the normal course of business. We are not currently a party to any legal proceedings that would be expected, either individually or in the aggregate, to have a material adverse effect on our business or financial condition.
96
The building materials industry has been subject to personal injury and property damage claims arising from alleged exposure to raw materials contained in building products as well as claims for incidents of catastrophic loss, such as building fires. As a distributor of building materials, we face an inherent risk of exposure to product liability claims in the event that the use of the products we have distributed in the past or may in the future distribute is alleged to have resulted in economic loss, personal injury or property damage or violated environmental, health or safety or other laws. Such product liability claims have included and may in the future include allegations of defects in manufacturing, defects in design, a failure to warn of dangers inherent in the product, negligence, strict liability or a breach of warranties. In particular, certain of our subsidiaries have been the subject of claims related to alleged exposure to asbestos-containing products they distributed prior to 1979, which have not materially impacted our financial condition or operating results. Since 2002, approximately 920 asbestos-related personal injury lawsuits have been brought and we vigorously defend against them. Of these, 818 have been dismissed without any payment by us, 21 are on deferred or inactive court dockets, 76 are pending and only 5 have been settled. In total, we have paid an aggregate of less than $300,000 in connection with these settlements. See "Risk Factors—Risks Related to Our Business and Industry—We are exposed to product liability, warranty, casualty, construction defect, contract, tort, employment and other claims and legal proceedings related to our business, the products we distribute, the services we provide and services provided for us by third parties."
We own United States trademark registrations for approximately 20 trademarks that we use in our business. Generally, registered trademarks have a perpetual life, provided that they are renewed on a timely basis and continue to be used properly as trademarks. We intend to maintain these trademark registrations so long as they remain valuable to our business. Other than certain of our local brands, the retention of which we believe helps maintain customer loyalty, we do not believe our business is dependent to a material degree on trademarks, patents, copyrights or trade secrets. In addition, other than commercially available software licenses, we do not believe that any of our licenses for third-party intellectual property are material to our business, taken as a whole.
Environmental, Health and Safety
We are subject to various federal, state and local environmental, health and safety laws and regulations, including laws and regulations governing the investigation and cleanup of contaminated properties, air emissions, water discharges, waste management and disposal, product safety and workplace health and safety. These laws and regulations impose a variety of requirements and restrictions on our operations and the products we distribute. The failure by us to comply with these laws and regulations could result in fines, penalties, enforcement actions, third party claims, damage to property or natural resources and personal injury, requirements to investigate or cleanup property or to pay for the costs of investigation or cleanup, or regulatory or judicial orders requiring corrective measures, including the installation of pollution control equipment or remedial actions and could negatively impact our reputation with customers. Environmental, health and safety laws and regulations applicable to our business, the products we distribute and the business of our customers, and the interpretation or enforcement of these laws and regulations, are constantly evolving and it is impossible to predict accurately the effect that changes in these laws and regulations, or their interpretation or enforcement, may have upon our business, financial condition or results of operations. Should environmental, health and safety laws and regulations, or their interpretation or enforcement, become more stringent, our costs, or the costs of our customers, could increase, which may have an adverse effect on our business, financial position, results of operations or cash flows.
Under certain laws and regulations, such as the U.S. federal Superfund law or its state equivalents, the obligation to investigate, remediate, monitor and clean up contamination at a facility may be
97
imposed on current and former owners, lessees or operators or on persons who may have sent waste to that facility for disposal. Liability under these laws and regulations may be imposed without regard to fault or to the legality of the activities giving rise to the contamination. Moreover, we may incur liabilities in connection with environmental conditions currently unknown to us relating to our prior, existing or future owned or leased sites or operations or those of predecessor companies whose liabilities we may have assumed or acquired.
98
Executive Officers and Directors
The following table sets forth information about our executive officers and directors, including their ages as of June 30, 2015. With respect to our directors, each biography contains information regarding the person's service as a director, business experience, director positions held currently or at any time during the past five years, information regarding involvement in certain legal or administrative proceedings, and the experience, qualifications, attributes or skills that caused our board of directors to determine that the person should serve as a director of our Company.
Name | Age | Position | ||
|---|---|---|---|---|
Executive Officers | ||||
Richard K. Mueller | 73 | Chairman of the Board | ||
G. Michael Callahan, Jr. | 61 | Chief Executive Officer, President and Director | ||
H. Douglas Goforth | 52 | Vice President, Chief Financial Officer and Treasurer | ||
Richard Alan Adams | 55 | Vice President and Chief Accounting Officer | ||
Non-Employee Directors | ||||
Peter C. Browning | 73 | Director | ||
Justin de La Chapelle | 35 | Director | ||
John J. Gavin | 59 | Director | ||
Theron I. Gilliam | 50 | Director | ||
Brian R. Hoesterey | 47 | Director | ||
Ronald R. Ross | 63 | Director | ||
J. Louis Sharpe | 41 | Director | ||
J. David Smith | 66 | Director |
Richard K. Mueller, the Chairman of our board of directors, co-founded our Company in 1971. Mr. Mueller served as our Chief Executive Officer from 1990 until May 2015, and as our President from 1990 until 2013. Mr. Mueller is responsible for long-term strategic direction and establishing relationships with suppliers, financial institutions, professional organizations and strategic acquisitions. Prior to these roles with us, Mr. Mueller was a sales representative for USG. Mr. Mueller earned a B.S. in Physical Education and an M.S. in Education from the University of Illinois. Mr. Mueller was selected as Chairman of our board of directors because of his leadership, significant experience as our Chief Executive Officer and his expertise in our industry.
G. Michael Callahan, Jr., our Chief Executive Officer, President and member of our board of directors, joined us in 1993. Mr. Callahan has served as our Chief Executive Officer since May 2015 and as our President since 2013. Mr. Callahan directs all corporate and administrative staff and coordinates acquisitions and expansions as well as all legal, banking, real estate and credit relationships. From 1993 to 2013, Mr. Callahan served as our Vice President of Finance and Chief Financial Officer. Prior to joining us, from 1974 to 1993, Mr. Callahan served as a Senior Vice President and Group Manager at C&S National Bank and Nations Bank. Mr. Callahan earned a B.A. in Economics from Georgia State University. Mr. Callahan was selected to serve on our board of directors because of the perspective, experience and the operational expertise in our business that he has developed as our Chief Financial Officer, Chief Executive Officer and President.
H. Douglas Goforth, our Vice President, Chief Financial Officer and Treasurer, joined us in 2014. Prior to joining us, Mr. Goforth served as a Senior Vice President, Chief Financial Officer and Treasurer at BlueLinx Holdings Inc., or BlueLinx, from February 2008 until June 2014. From November 2006 until February 2008, Mr. Goforth served as Vice President and Corporate Controller for Armor
99
Holdings Inc., which was acquired by BAE Systems in July 2007. Previously he served as Corporate Controller for BlueLinx from May 2004 until October 2006, where he played a key role in BlueLinx's initial public offering. From 2002 until 2004 he served as Controller for BlueLinx (formerly Georgia-Pacific, Building Products Distribution Division). Mr. Goforth has over 25 years of combined accounting, finance, treasury, acquisition and management experience with leading distribution and manufacturing companies including Mitsubishi Wireless Communications, Inc., Yamaha Motor Manufacturing, Inc. and Ingersoll-Rand. Mr. Goforth is a North Carolina State Board Certified Public Accountant and earned a B.S. in Accounting from Mars Hill College in North Carolina.
Richard Alan Adams, our Vice President and Chief Accounting Officer, joined us in 1996 and has served as our Vice President and Chief Accounting Officer since August 2014. Mr. Adams served as our Subsidiary Accounting Manager from March 1996 to May 2000, as our Controller from May 2000 to November 2013, and Chief Financial Officer from November 2013 to August 2014. Prior to joining us, Mr. Adams held various positions with Colonial Pipeline Company. Mr. Adams is a Certified Public Accountant in the State of Georgia and earned a B.B.A. from Emory University and a Masters of Taxation degree from Georgia State University.
Peter C. Browning has been a member of our board of directors since 2014 and has served as the Managing Director of Peter C. Browning & Partners, LLC, a board advisory consulting firm, since 2009. Mr. Browning served as Lead Director of Nucor Corporation, or Nucor, from 2006 to 2012, and as Non-Executive Chairman of Nucor from 2000 to 2006. Mr. Browning was the Dean of the McColl Graduate School of Business at Queens University of Charlotte, North Carolina, from 2002 to 2005. From 1998 to 2000, Mr. Browning was President and Chief Executive Officer, from 1996 to 1998, President and Chief Operating Officer, and from 1993 to 1996, Executive Vice President, of Sonoco Products Company, a manufacturer of industrial and consumer packaging products. Before joining Sonoco, from 1990 to 1993, Mr. Browning was Chairman, President and Chief Executive Officer of National Gypsum, a manufacturer and supplier of building and construction products. Mr. Browning currently serves on the boards of directors of Acuity Brands, Inc. and ScanSource, Inc., and previously was a director of Wachovia Corporation until 2008, the Phoenix Companies, Inc. until 2009, Lowe's Companies, Inc. until 2014 and EnPro Industries, Inc. until 2015. Mr. Browning earned a B.A. in History from Colgate University and a M.B.A. from the University of Chicago. Mr. Browning was selected to serve on our board of directors because he possesses particular knowledge of our industry and has leadership experience with other major corporations.
Justin de La Chapelle has been a member of our board of directors since 2014 and serves as Principal at AEA. Mr. de La Chapelle joined AEA in 2006 and focuses on AEA's investments in the Value-Added Industrial Products and Services sectors. Mr. de La Chapelle was involved in AEA's investments in Henry Company, SRS Distribution Inc., or SRS, Behavioral Interventions Inc., RelaDyne, Inc., and of our subsidiary, Gypsum Management and Supply, Inc. Prior to joining AEA, Mr. de La Chapelle worked at Brera Capital Partners, a global private equity firm based in New York. Prior to Brera Capital Partners, he worked at Banc of America Securities in both the mergers and acquisitions group and the leveraged acquisition finance group. Mr. de La Chapelle earned a B.A. in English and Mathematics,cum laude, from Georgetown University. Mr. de La Chapelle was selected to serve on our board of directors because he possesses particular knowledge and experience in corporate finance, strategic planning and investments.
John J. Gavin has been a member of our board of directors since 2014. Mr. Gavin serves as a Senior Operating Advisor with LLR Partners, a growth-oriented private equity firm. Prior to LLR Partners, Mr. Gavin was Vice Chairman, Chief Executive Officer and President of Drake, Beam, Morin, Inc., or DBM, an international career management and transitions management firm. Before DBM, Mr. Gavin served as President and Chief Operating Officer of Right Management Consultants, Inc., a global provider of integrated consulting solutions across the employment lifecycle. Mr. Gavin was employed from 1979 to 1996 and also served as a partner at Andersen Worldwide
100
Société Coopérative, or Andersen, from 1990 to 1996. Mr. Gavin currently serves on the boards of CareerMinds Group, Inc., Strategic Distribution, Inc., and AmeriQuest Business Services, Inc. In the past, Mr. Gavin has also served on the boards of DFC Global Corp., Tribridge, Inc., Right Management Consultants, Inc., Opinion Research Corporation, Catholic Health East, DBM, Interline Brands, Inc., GCA Services Group, and CSS Industries, Inc. Mr. Gavin earned a B.B.A. in Accounting from Temple University. Mr. Gavin was selected to serve on our board of directors, and as the Chairman of our Audit Committee, because he possesses particular knowledge and experience in strategic planning and leadership of other major corporations and because of his experience as a Certified Public Accountant and former partner at Andersen.
Theron I. Gilliam has served as a director of our Company since 2014. Mr. Gilliam has served as Chief Executive Officer of NES Global Talent, a global solutions company specializing in recruiting and deploying engineering talent to meet client needs in more than 65 countries, since November 2014. Mr. Gilliam was previously a Managing Director and Operating Partner of AEA, from November 2013 to November 2014. Prior to joining AEA, from March 2007 until July 2012, Mr. Gilliam was the CEO of Adecco Group North America, a multi-brand specialty staffing and workforce solutions company. Mr. Gilliam spent twenty years with PricewaterhouseCoopers LLP, or PwC, and then IBM Business Consulting Services when it acquired PwC Consulting in 2002. Mr. Gilliam led the global supply chain management consulting services business, as well as the Americas consumer, wholesale distribution and software industry practices. Mr. Gilliam is an independent director for Lennar Corporation, one of the nation's leading homebuilders and a public company listed on the NYSE. Mr. Gilliam is also an independent director for Work Market, Inc., a technology and marketplace platform for enterprises to manage external labor. Mr. Gilliam earned a B.S. in Systems Engineering from the University of Virginia, School of Engineering and Applied Sciences and a M.B.A. from Columbia University. Mr. Gilliam was selected to serve on our board of directors because of his expertise in matters related to supply chain management and human resources.
Brian R. Hoesterey has served as a director of our Company since 2014. Mr. Hoesterey is a Partner with AEA, which he joined in 1999, where he focuses on investments in the specialty chemicals and value-added industrial products sectors. Prior to joining AEA, Mr. Hoesterey was with BT Capital Partners, the private equity investment vehicle of Bankers Trust. Mr. Hoesterey has also previously worked for McKinsey & Co. and the investment banking division of Morgan Stanley. Mr. Hoesterey is currently a director of At Home Group Inc., Evoqua, and Swanson Industries. Mr. Hoesterey was previously on the board of CPG International, Houghton, SRS, Henry Company, Unifrax, Pregis and Noveon. Mr. Hoesterey currently serves on the Oversight Committee for Patagonia Sur, a for-profit venture that invests in, protects and enhances scenically remarkable and ecologically valuable properties in Chilean Patagonia. Mr. Hoesterey earned a B.B.A. in Accounting, summa cum laude, from Texas Christian University and received a M.B.A., with honors, from The Harvard Business School. Mr. Hoesterey was selected to serve on our board of directors because he possesses particular knowledge and experience in corporate finance, strategic planning and investments.
Ronald R. Ross has served as a member of our board of directors since 2014. Mr. Ross is currently the Chairman and CEO of SRS, one of the largest roofing distributors in the U.S. For more than the last 24 years, Mr. Ross has served as either the Chief Executive Officer, Chairman, or as a member of the board of directors for several leading platforms in the building products distribution industry. Prior to joining SRS, Mr. Ross partnered with Brazos Private Equity Partners in 2002 to acquire Shelter Distribution, Inc., or Shelter, where he served as President and Chief Executive Officer. After growing Shelter's revenue and completing multiple acquisitions, Mr. Ross assisted in the sale of Shelter to Beacon Roofing Supply in 2005. Prior to his time at Shelter, Mr. Ross served as interim Chief Executive Officer for MMI Products, Inc., a leading manufacturer and distributor of building products. From 1991 to 2000, Mr. Ross served first as President and Chief Executive Officer, and from 1994 as Chairman of the board of directors and as Chief Executive Officer of Cameron Ashley Building
101
Products, a publicly traded building products distributor on the NYSE. Mr. Ross has served on the board of directors of both the Builders Suppliers Corporation and the North American Building Materials Distributors Association, the leading building products distribution industry trade association. Mr. Ross received an M.B.A. from Pennsylvania State University as well as a B.S. from Husson College. Mr. Ross was selected to serve on our board of directors because he possesses particular knowledge and experience in strategic planning and leadership of other major corporations.
J. Louis Sharpe has served as a member of our board of directors since 2014. Mr. Sharpe joined AEA in 1998 as an Associate and became a Partner in 2010. Mr. Sharpe focuses on AEA's investments in the Specialty Chemicals and Value-Added Industrial Products sectors. Mr. Sharpe currently serves on the board of RelaDyne, Inc. Mr. Sharpe previously served on the boards of Henry Company and SRS. Prior to joining AEA, Mr. Sharpe was in the investment banking division of Morgan Stanley. Mr. Sharpe earned a B.A. in Economics from Yale University. Mr. Sharpe was selected to serve on our board of directors because he possesses particular knowledge and experience in corporate finance, strategic planning and investments.
J. David Smith has served as a member of our board of directors since 2014. Mr. Smith has been a member of the board of directors of Nortek, Inc., or Nortek, since February 2010 and was appointed to serve as the Chairman of the Nortek's board of directors in April 2012. Mr. Smith has also served as the Chairman of the board of directors at Siamons International, Inc. since 2008, and as a member of the board of directors of Commercial Metals Company since 2004, and DiversiTech, Inc. since 2010. Mr. Smith served as President of Alumax Fabricated Products, Inc. and as an officer of Alumax, Inc. from 1989 to 1996. Mr. Smith held the positions of Chief Executive Officer and President of Euramax International, Inc. beginning in 1996 and also served as the Chairman of its board of directors from 2002 until his retirement in 2008. Mr. Smith served as a director of both Houghton International Inc. and Air Distribution Technologies, Inc. until 2014. Mr. Smith has extensive operating and management experience in private and public international metals and building products companies. Mr. Smith received a B.A. from Gettysburg College. Mr. Smith was selected to serve on our board of directors because he possesses particular knowledge and experience in strategic planning and leadership of other major corporations.
Board Composition
Our board of directors currently consists of ten directors. Currently, each director is elected for a one-year term and serves until a successor is duly elected and qualified or until his or her death, resignation or removal. There are no family relationships between any of our directors or executive officers. Our executive officers are elected by and serve at the discretion of the board of directors.
Our amended and restated certificate of incorporation and amended and restated by-laws that will become effective upon the closing of this offering provide that the authorized number of directors may be changed only by resolution of the board of directors. Our amended and restated certificate of incorporation and amended and restated by-laws that will become effective upon the closing of this offering also provide that our directors may be removed only for cause, and that any vacancy on our board of directors, including a vacancy resulting from an enlargement of our board of directors, may be filled only by vote of a majority of our directors then in office.
In accordance with the terms of our amended and restated certificate of incorporation and amended and restated by-laws that will become effective upon the closing of this offering, our board of directors will be divided into three classes, class I, class II and class III, with members of each class serving staggered three-year terms. Upon the closing of this offering, the members of the classes will be divided as follows:
- •
- the Class I directors will be and , and their terms will expire at the annual meeting of stockholders to be held in 2016;
102
- •
- the Class II directors will be and , and their terms will expire at the annual meeting of stockholders to be held in 2017; and
- •
- the Class III directors will be and , and their terms will expire at the annual meeting of stockholders to be held in 2018.
The classification of the board of directors may have the effect of delaying or preventing changes in control of our Company. We expect that additional directorships resulting from an increase in the number of directors, if any, will be distributed among the three classes so that, as nearly as possible, each class will consist of one-third of the directors.
Leadership Structure of the Board of Directors
Our board of directors currently separates the roles of Chief Executive Officer and Chairman of the Board. These positions are currently held by G. Michael Callahan, Jr., as our Chief Executive Officer, and Richard K. Mueller, as the Chairman. We believe this leadership structure is appropriate for our Company due to the differences between the two roles. The Chief Executive Officer is responsible for setting our strategic direction, providing day-to-day leadership and managing our business, while the Chairman of the Board provides guidance to the Chief Executive Officer, chairs board meetings, sets the agendas for meetings of our board of directors as well as provides information to the members of our board of directors in advance of such meetings. In addition, separating the roles of Chief Executive Officer and Chairman of the Board allows the Chairman to provide oversight of our management.
Director Independence and Controlled Company Exception
Our board of directors has affirmatively determined that Messrs. Browning, Gavin, Gilliam, Ross and Smith are independent directors under the rules of and independent directors as such term is defined in Rule 10A-3(b)(1) under the Exchange Act. Mr. Callahan, our Chief Executive Officer, is not independent because of his position as an executive officer. Mr. Mueller, our Chairman of the Board is not independent because of his current position with us. Our remaining directors, Messrs. de La Chapelle, Hoesterey and Sharpe, are not independent because of their affiliations with AEA. Certain affiliates of AEA, together with certain of our other stockholders, control a majority of the voting power of our outstanding common stock.
After completion of this offering, we expect that certain affiliates of AEA, together with certain of our other stockholders, will continue to control a majority of the voting power of our outstanding common stock. As a result, we expect to be a "controlled company" within the meaning of corporate governance standards. Under these rules, a "controlled company" may elect not to comply with certain corporate governance standards, including:
- •
- the requirement that a majority of our board of directors consist of independent directors;
- •
- the requirement that we have a nominating and corporate governance committee that is composed entirely of independent directors with a written charter addressing the committee's purpose and responsibilities;
- •
- the requirement that we have a compensation committee that is composed entirely of independent directors with a written charter addressing the committee's purpose and responsibilities; and
- •
- the requirement for an annual performance evaluation of the nominating and corporate governance committee and compensation committee.
Following this offering, we intend to utilize certain of these exemptions. As a result, we will not have a majority of independent directors, our nominating and corporate governance committee and
103
compensation committee will not consist entirely of independent directors and such committees will not be subject to annual performance evaluations. Accordingly, you will not have the same protections afforded to stockholders of companies that are subject to all of the corporate governance requirements. See "Risk Factors—Risks Related to this Offering and Ownership of Our Common Stock—We are a "controlled company" within the meaning of the rules of and, as a result, will qualify for, and may rely on, exemptions from certain corporate governance requirements."
Committees of the Board of Directors
Upon the consummation of this offering, our board of directors will have three committees: the audit committee, the compensation committee and the nominating and corporate governance committee. From time to time, our board of directors may contemplate establishing other committees.
Audit Committee. The members of the audit committee are John J. Gavin, as Chairman, Justin de La Chapelle, Brian R. Hoesterey, Ronald R. Ross and J. Louis Sharpe. Rule 10A-3 of the Exchange Act requires us to have one independent audit committee member upon the listing of our common stock, a majority of independent directors on our audit committee within 90 days of the date of this prospectus and an audit committee composed entirely of independent directors within one year of the date of this prospectus. Mr. Gavin qualifies as our "audit committee financial expert" within the meaning of regulations adopted by the SEC. The audit committee recommends the annual appointment and reviews independence of auditors and reviews the scope of audit and non-audit assignments and related fees, the results of the annual audit, accounting principles used in financial reporting, internal auditing procedures, the adequacy of our internal control procedures, related party transactions, and investigations into matters related to audit functions. The audit committee is also responsible for overseeing risk management on behalf of our board of directors. See "—Risk Oversight."
Compensation Committee. The members of the compensation committee are Brian R. Hoesterey, as Chairman, Peter C. Browning, Theron I. Gilliam, J. Louis Sharpe and J. David Smith. The principal responsibilities of the compensation committee are to review and approve matters involving executive and director compensation, recommend changes in employee benefit programs, authorize equity and other incentive arrangements, and authorize our Company to enter into employment and other employee related agreements.
Nominating and Corporate Governance Committee. Upon the consummation of this offering, the members of the nominating and corporate governance committee will be , as Chairman, and . The nominating and corporate governance committee assists our board of directors in identifying individuals qualified to become board members, makes recommendations for nominees for committees and develops, recommends to the board of directors and reviews our corporate governance principles.
Risk Oversight
Our board of directors administers its risk oversight function primarily through the audit committee. To that end, our audit committee meets at least quarterly with our Chief Financial Officer and our independent auditors where it receives regular updates regarding our management's assessment of risk exposures including liquidity, credit and operational risks and the process in place to monitor such risks and review results of operations, financial reporting and assessments of internal controls over financial reporting. Our board of directors believes that its administration of risk management has not affected the board's leadership structure, as described above.
104
Code of Ethics
We have adopted a code of ethics applicable to all of our directors, officers (including our principal executive officer, principal financial officer and principal accounting officer) and employees, known as the Code of Business Conduct & Ethics. The Code of Business Conduct & Ethics will be available on our website at www.gms.com under Investor Relations. In the event that we amend or waive certain provisions of the Code of Business Conduct & Ethics applicable to our principal executive officer, principal financial officer or principal accounting officer that requires disclosure under applicable SEC rules, we intend to disclose the same on our website.
Compensation Committee Interlocks and Insider Participation
None of our executive officers serves, or in the past year has served, as a member of the board of directors or compensation committee (or other committee performing equivalent functions) of any entity that has one or more executive officers serving on our board of directors or compensation committee. No interlocking relationship exists between any member of our compensation committee (or other committee performing equivalent functions) and any executive, member of the board of directors or member of the compensation committee (or other committee performing equivalent functions) and of any other company.
105
COMPENSATION DISCUSSION AND ANALYSIS
The discussion that follows describes the executive compensation program for fiscal 2015 for the executive officers listed below (our "NEOs"):
Name | Title | |
|---|---|---|
Richard K. Mueller | Chairman and Chief Executive Officer | |
H. Douglas Goforth | Chief Financial Officer | |
G. Michael Callahan, Jr. | President | |
Stephen K. Barker | Former Chief Operating Officer | |
Richard Alan Adams | Chief Accounting Officer & Former Chief Financial Officer |
There have been changes in the composition of our management team that occurred following the end of fiscal 2015, which changes are described below in the section entitled "Fiscal 2016 Compensation Goals and Philosophy."
Background
Prior to the Acquisition, we operated as a closely-held, privately owned company. As such, all compensation programs through full year 2014 in which our NEOs participated, and all decisions made with regard to the compensation of our NEOs, were programs of, or decisions made by the founders, including Mr. Mueller (our "Chief Executive Officer"). In connection with the Acquisition, each of our NEOs (other than Mr. Goforth) entered into an employment agreement following individual negotiations with AEA (the "Employment Agreements"), which agreements generally set forth the material terms of the NEO's respective compensation package and which are described in greater detail below in the section entitled "Employment Agreements." AEA also adopted the 2014 GYP Holdings I Corp. Stock Option Plan (the "Option Plan") for purposes of providing management team members equity compensation following the Acquisition, and as part of its negotiations with the Company's management team, AEA established a pool under the Option Plan and negotiated the size of grants to be made thereunder to members of the management which included our NEOs (other than Mr. Goforth).
The Employment Agreements remained in place during fiscal 2015, and therefore, the compensation programs for our NEOs (other than Mr. Goforth) generally remained consistent with those in effect prior to the Acquisition. Mr. Goforth joined the Company as Chief Financial Officer in August 2014. As with our other NEOs, Mr. Goforth's compensation package for fiscal 2015 is set forth in his employment agreement (the "CFO Agreement"), but includes elements more consistent with those offered by public companies.
Following the Acquisition, the Compensation Committee has had and will continue to have the responsibility for reviewing the executive compensation arrangements in place for NEOs, and for structuring future compensation in a way that maximizes long-term Company growth and aligns the interest of our management team with our stockholders.
Notwithstanding the descriptions of the compensation programs in place for fiscal 2015 as described in this Compensation Discussion and Analysis, the Company has made significant changes to its compensation programs in anticipation of its initial public offering, which changes are described in the section below entitled "Fiscal 2016 Compensation Goals and Philosophy."
Compensation Philosophies and Objectives for Fiscal 2015
Our primary goal is to establish a compensation program that serves the long-term interests of the Company and our stockholders by aligning management's interests with that of our stockholders
106
through pay for performance oriented cash compensation programs, equity ownership and by promoting the attainment of certain individual and corporate goals. Our fiscal 2015 executive compensation program was based on, but was not limited to, the following principles:
- •
- supporting a strong pay for performance orientation;
- •
- maintaining an entrepreneurial culture; and
- •
- aligning the interests of executives and shareholders.
Elements of Compensation
For fiscal 2015, compensation for our named executive officers generally consisted of five general components:
- •
- base salary;
- •
- annual performance-based cash awards;
- •
- long-term equity incentive compensation in the form of stock options;
- •
- an employee defined contribution plan; and
- •
- other perquisite and benefit programs.
The appropriate mix and amount of compensation for each NEO vary based on the level of the executive's responsibilities and, as discussed above, were generally established at the time of the Acquisition (for Mr. Goforth, at the time he commenced employment with the Company), with the material terms relating to cash compensation and short-term incentive compensation being set forth in the Employment Agreements (the CFO Agreement, for Mr. Goforth) and long-term equity compensation taking the form of options granted under the Option Plan. The Compensation Committee does not maintain any formal policy or formula for allocating the appropriate mix of compensation as it believes it is more important to remain flexible to respond to shifts in the marketplace in which the Company must compete to recruit and retain executive talent. Therefore, the Compensation Committee retains the authority to review our NEOs' compensation periodically and to use its discretion to adjust the mix of compensation and the amount of any element of compensation as it deems appropriate.
Base Salary
We believe that the provision of base salary plays an important role in attracting and retaining top executive talent by providing executives with a predictable level of income. Base salaries represent a fixed portion of our NEOs' compensation and vary by job responsibility. For fiscal 2015, base salaries were generally established at the time of the Acquisition (or commencement of employment for Mr. Goforth) and are set forth in the Executive Agreements or CFO Agreement, as applicable. It is expected that the Compensation Committee will review our NEOs' base salaries annually, though it may make periodic base salary adjustments in connection with a named executive officer's promotion, change in job responsibility, or when otherwise necessary for equitable reasons. In connection with its review and determination of base salaries, the Compensation Committee will consider market data, the level of the executive's compensation (individually and relative to the other executives), the level of the executive's performance and, for the base salaries for executives other than the chief executive officer, the recommendations of the chief executive officer. In respect of fiscal 2015, the Compensation Committee did not conduct a peer group analysis or benchmark in connection with its determination of base salaries. See the discussion in the section below entitled "Fiscal 2016 Compensation Goals and Philosophy" for a discussion of the peer group used in respect of fiscal 2016.
107
The following table sets forth our NEOs' base salaries for fiscal 2015.
Named Executive Officer | Base Salary ($) | |||
|---|---|---|---|---|
Richard K. Mueller(1) | 1,000,000 | |||
H. Douglas Goforth | 375,000 | |||
G. Michael Callahan, Jr.(2) | 327,600 | |||
Stephen K. Barker(3) | 327,000 | |||
Richard Alan Adams | 236,200 | |||
- (1)
- Mr. Mueller served as Chairman and Chief Executive Officer through April 30, 2015. He continues to serve as Chairman of the Board effective as of May 1, 2015.
- (2)
- Mr. Callahan was named President and Chief Executive Officer effective May 1, 2015.
- (3)
- Mr. Barker was no longer employed by the Company effective May 4, 2015. We are presenting his compensation package for 2015 as he was a named executive officer during fiscal 2015.
Annual Bonuses
The Company maintains the Corporate Bonus Plan (the "Bonus Plan") in order to drive the Company's annual performance by linking variable compensation payments to achievement of individual and Company performance. Cash bonuses under the Bonus Plan are designed to support our strategic business, promote the maximization of Company profitability and encourage teamwork. In fiscal 2015, each of our NEOs, other than Mr. Mueller, was eligible to earn an annual cash bonus under the Bonus Plan, subject to the conditions described below. For fiscal 2015, Mr. Mueller did not participate in the Bonus Plan but was awarded a discretionary bonus of $200,000 in recognition of his efforts in the transition of his duties to Mr. Callahan and his efforts in connection with acquisitions made by the Company.
Under the Bonus Plan, for each fiscal year, a corporate management bonus pool (the "Bonus Pool") is established and funded based solely on a percentage of pre-tax profit adjusted for any significant special items (the "Adjusted Pre-Tax Profit"). We believe that Adjusted Pre-Tax Profit is a useful measure to support the desire to maximize the Company's growth and increase profits. The Bonus Pool is funded only to the extent certain levels of Adjusted Pre-Tax Profit are attained, as set forth in the guidelines determined by the Compensation Committee for fiscal 2015. For fiscal 2015, 20% of the first $11.4 million of Adjusted Pre-Tax Profit was added to the Bonus Pool, 25% of the next $11.4 million of Adjusted Pre-Tax Profit was added to the Bonus Pool and 30% of Adjusted Pre-Tax Profit in excess of $91.0 million was added to the Bonus Pool. The Adjusted Pre-Tax Profit for fiscal 2015 was $113.8 million, which resulted in a Bonus Pool of $32.4 million. Amounts allocated to participants in the Bonus Plan are generally expressed as a percentage of the Bonus Pool (the "Bonus Pool Percentage"). Each of the NEOs who participated in the Bonus Plan and were employed as of the first day of fiscal 2015 was eligible to receive an annual cash bonus based on his respective Bonus Pool Percentage as set forth in the table below. Payments under the Bonus Plan are subject to adjustment by the Compensation Committee which may, in its sole discretion, adjust any payments under the Bonus Plan based on an NEO's individual performance and contribution to the Company during the year. No adjustments were made for fiscal 2015 bonuses for Messrs. Callahan, Barker and Adams.
Pursuant to the terms of the CFO Agreement, for fiscal 2015 Mr. Goforth was eligible to earn an annual bonus under the Bonus Plan, subject to the Company's attainment of its adjusted EBITDA target. Mr. Goforth's bonus could range from 0% to 200% of base salary based on the level of achievement relative to the adjusted EBITDA target. The Company did not achieve the fiscal 2015 target adjusted EBITDA. Therefore, Mr. Goforth did not receive a bonus under the Bonus Plan in respect of fiscal 2015. However, in recognition of Mr. Goforth's immediate engagement in financial reporting activities to meet the demands for reporting to the Company's board of directors and lenders,
108
and his efforts in anticipation of the Company's initial public offering, the Compensation Committee granted Mr. Goforth a discretionary bonus of $105,625.
The following table sets forth the Bonus Pool Percentage and target bonus as a percentage of base salary for our NEOs for fiscal 2015.
Officer | Bonus Pool Percentage | Percent of Base Salary | |||||
|---|---|---|---|---|---|---|---|
Richard K. Mueller(1) | — | — | |||||
H. Douglas Goforth(2) | — | 65 | % | ||||
G. Michael Callahan, Jr. | 6.9 | % | — | ||||
Stephen K. Barker(3) | 6.9 | % | — | ||||
Richard Alan Adams | 2.0 | % | — | ||||
- (1)
- Mr. Mueller was not a participant in the corporate bonus plan during fiscal 2015.
- (2)
- Mr. Goforth's target is 65% of base salary, but this percentage was prorated to reflect his employment start date of August 18, 2014.
- (3)
- Mr. Barker was no longer employed by the Company effective May 4, 2015. We are presenting his compensation package for 2015 as he was an NEO during fiscal 2015.
In addition, prior to the consummation of this offering, the Company intends to adopt the GMS Inc. Annual Incentive Plan which sets forth other performance criteria and performance goals which may be used by the Compensation Committee in future fiscal years in determining the appropriate annual cash incentive packages for our named executive officers.
Long-Term Incentive Plan
As discussed above, the Company maintains the Option Plan, a long-term incentive plan under which we may make grants of options from time to time. The main objectives of the Option Plan are to (1) directly link the executives to increasing shareholder value, (2) incentivize our executives to work towards the achievement of our long-term performance goals, (3) provide the Company a competitive means through which we may better attract able individuals to become executives and (4) retain executives for a multiple year period by providing these individuals with stock ownership opportunities. For the foregoing reasons, we believe providing our NEOs long-term equity compensation in the form of options further advances and aligns the interests of the Company and its stockholders. The Compensation Committee has the authority to make grants under the Option Plan as it deems appropriate, and generally does so in connection with new hires or promotions within the Company.
In June 2014, pursuant to the terms of their Employment Agreements, Messrs. Callahan, Adams and Barker were granted 70,753, 26,532, 35,376 options to purchase shares, respectively, which options vested as to 25% on April 1, 2015 and thereafter as to 6.25% on each of the first 12 quarterly anniversaries of April 1, 2015 such that the option grant will be fully vested on April 1, 2018. Pursuant to the terms of the CFO Agreement, Mr. Goforth was granted 26,532 options to purchase shares on August 18, 2014, which options will vest as to 25% on August 18, 2015 and thereafter as to 6.25% on each of the first 12 quarterly anniversaries of August 18, 2015 such that the option grant will be fully vested on August 18, 2018. Mr. Barker received an additional grant of 8,844 options on March 23, 2015 in order to offset the planned reduction to his cash compensation, which options will vest as to 25% on March 23, 2016 and thereafter as to 6.25% on each of the first 12 quarterly anniversaries of March 23, 2016 such that the option grant will be fully vested on March 23, 2019.
A description of the effect of a Change in Control on these options (as defined in the Option Plan) is below under "Payments upon Certain Events of Termination or Change in Control."
109
Defined Contribution Plan
The Company provides retirement benefits to the NEOs, including matching contributions, under the terms of its tax-qualified defined contribution plan (the "401(k) Plan"). The NEOs participate in the 401(k) Plan on the same terms as our other participating employees. We believe that the retirement benefits provided under the 401(k) Plan are analogous to those provided by comparable companies. The Company does not maintain any defined benefit or supplemental retirement plans for any its executive officers.
Perquisites and Other Personal Benefits
The Company provides the NEOs with perquisites and other personal benefits that it believes are reasonable and consistent with its overall compensation program to better enable the Company to attract and retain superior employees for key positions. We believe that these benefits enable our executives to focus on our business and enhance their commitment to us. In fiscal 2015, Mr. Mueller was provided perquisites which included (i) use of a Company vehicle, (ii) provision of Netjets service for (x) all business trips and (y) up to 25 hours of personal use per year and a tax gross-up payment for this benefit and (iii) supplemental medical coverage and a tax gross-up payment for this benefit. In fiscal 2015, Mr. Callahan was provided perquisites which included (i) use of a Company vehicle and (ii) provision of Netjets service for (x) all business trips and (y)��up to 12 hours of personal use per year and a tax gross-up payment for this benefit. Each of our NEOs received Company matching contributions under the 401(k) Plan. For fiscal 2015, the aggregate value of the perquisites provided to each of Messrs. Goforth, Barker and Adams was less than $10,000.
The Compensation Committee periodically reviews the levels of perquisites and other personal benefits provided to our NEOs to confirm such levels are reasonable and continue to serve their intended retentive purposes.
Risk Analysis of Compensation Program
The Compensation Committee has reviewed our compensation program to determine if the elements encourage excessive or unnecessary risk taking that is reasonably likely to have a material adverse effect on the Company. After reviewing our compensation program, the Compensation Committee believes that while the Bonus Plan may incentivize risk taking as it provides for annual cash incentive payments which are uncapped, it is appropriately balanced by the other elements of compensation program which include base salary and time-vesting options. The Compensation Committee believes that the Company's compensation program offers an appropriate mix of fixed compensation and short- and long-term variable compensation so as to mitigate the motivation to take high levels of business risk as any risks taken for short-term gains ultimately could jeopardize not only the Company's ability to meet the long-term performance objectives, but also appreciation in the Company's stock price. As a result, the Compensation Committee believes that our compensation program does not encourage unreasonable risk taking that is reasonably likely to have a material adverse effect on the Company.
Internal Revenue Code Section 162(m)
As a private company, in fiscal 2015 the Company was not subject to Section 162 (m) of the Internal Revenue Code of 1986, as amended ("Section 162(m)"). In making future compensation decisions, the Compensation Committee will consider the potential impact of Section 162(m) which disallows a tax deduction for any publicly held corporation for individual compensation exceeding $1 million in any taxable year for the Chief Executive Officer and the next three mostly highly compensated officers (other than the Chief Financial Officer), other than compensation that is performance-based under a plan that is approved by the stockholders of the Company and meets other
110
technical requirements. However, the Compensation Committee reserves the right to provide for compensation to executive officers that may not be deductible if it believes such compensation is in the best interests of the Company and its stockholders. Transition provisions under Section 162(m) may apply for a period of approximately three years following the consummation of an initial public offering of the Company (which is not guaranteed to occur) to certain compensation arrangements that were entered into before such initial public offering, including, without limitation, awards under the Bonus Plan and the Option Plan and any future awards under the GMS Inc. Annual Incentive Plan.
Fiscal 2016 Compensation Goals and Philosophy
Beginning with fiscal 2016, the Compensation Committee began to implement certain changes to our NEOs' compensation packages to more closely align them with current public company market practices, as described below.
In anticipation of the Company's initial public offering (which is not guaranteed to occur), in fiscal 2015 the Compensation Committee retained AON Hewitt to review and advise on our executive compensation program and provide benchmarking data. At the request of the Compensation Committee, AON Hewitt presented a compensation benchmarking study to the Compensation Committee in March 2015. The peer group used in the study included the following companies: A.O. Smith Corporation, Airgas, Inc., Armstrong, Beacon Roofing Supply, Inc., BlueLinx Holdings, Inc., Boise Cascade Company, Builders FirstSource, Inc., Fastenal Company, Gilbraltar Industries, Inc., HD Supply Holdings, Inc., Huttig Building Products, Inc., Kamen Corporation, Lennox International Inc., MRC Global Inc., MSC Industrial Direct Co., Inc., Pool Corporation, Simpson Manufacturing Co., Inc., Stock Building Supply Holdings, Inc., USG, WW Grainger, Inc., Watsco, Inc., and WESCO International, Inc. Fiscal 2013 revenue for the peer group listed above ranged from $561 million to $8.5 billion (with the median revenue at $2.6 billion), a range within which the Company's revenue falls. The benchmarking study was used as a comparative tool in the Compensation Committee's evaluation of the Company's executive compensation program in relation to companies believed to represent the appropriate comparable labor market for executive talent and to provide context for the changes made for fiscal 2016 compensation.
For fiscal 2016, the objectives of the executive compensation program included the following:
- •
- balancing an entrepreneurial focus with the need to set and achieve pre-determined goals;
- •
- aligning with best practices and standards as determined by institutional shareholders and shareholder advisors;
- •
- basing annual reward opportunities on performance measures linked to shareholder value creation;
- •
- providing substantial, but capped upside that is linked to superior performance; and
- •
- requiring a threshold level of performance in order for any award to be earned.
Based on the information obtained from the benchmarking study provided by AON Hewitt, informal market surveys, various trade publications, and other publicly available information, the Compensation Committee implemented certain changes to our executive compensation program for fiscal 2016, including changes to the base salaries and annual bonus opportunities for certain of our NEOs. The principal objective of these changes was to adjust the proportion of base salary to annual cash incentive compensation such that those NEOs who had previously received relatively low base salaries and annual cash incentive payments that had been calculated as a portion of the Company's pre-tax profit would instead (i) receive increased base salaries (raised to meet competitive levels) and (ii) be eligible to earn annual cash incentive payments that would be determined in accordance with adjusted EBITDA targets to be established at the beginning of each fiscal year and would be subject to
111
established caps. The Compensation Committee believes the foregoing changes will position the Company between the 50th and 75th percentiles as compared to total cash compensation levels provided for similar positions in our industry.
The Compensation Committee approved a reduction in Mr. Mueller's base salary from $1,000,000 to $300,000 in light of his resignation from his position as chief executive officer, as set forth in his amended and restated Employment Agreement (the "Chairman Agreement"), which became effective July 1, 2015 and is described in further detail below in the section entitled "Employment Agreements." Pursuant to the Chairman Agreement, Mr. Mueller has continued in his position as Chairman of the Board. Consistent with fiscal 2015, Mr. Mueller will not participate in the Bonus Plan, but will receive options under the Option Plan pursuant to the terms of the Chairman Agreement. Concurrent with Mr. Mueller's resignation, Mr. Callahan was appointed as the Company's President and Chief Executive Officer, and in connection therewith, the Compensation Committee approved an increase in his base salary from $327,600 to $700,000 and provided that he will have a target annual incentive opportunity of 125% of base salary with a maximum opportunity of 250% of base salary based on the Company's achievement of adjusted EBITDA and other performance goals as approved by the Compensation Committee.
For fiscal 2016, the Compensation Committee also implemented the following changes: (i) Mr. Adams' base salary was increased from $236,200 to $350,000 and (ii) Mr. Adams' annual bonus opportunity range was set to 50% - 100% of his base salary.
It is expected that in future years, the Compensation Committee will review base salaries and awards of cash bonuses and options on an annual basis in order to determine whether the levels and allocation of the various elements of our NEO's compensation packages are appropriate. The Compensation Committee will conduct its review after the Chief Executive Officer has presented recommendations regarding the level and mix of compensation for our NEOs (other than for the Chief Executive Officer), including with respect to base salary, short-term incentive compensation and long-term incentive compensation. The Chief Executive Officer's recommendations will be developed in consultation with our Vice President of Human Resources and other Company representatives.
COMPENSATION OF THE NAMED EXECUTIVE OFFICERS
SUMMARY COMPENSATION TABLE
The following table sets forth the cash and non-cash compensation paid to our NEOs for the fiscal year ended April 30, 2015.
Name | Principal Position | Year | Salary ($) | Bonus ($)(1) | Option Awards ($)(2) | Non-Equity Incentive Plan Compensation ($) | All Other Compensation ($) | Total | ||||||||||||||||
|---|---|---|---|---|---|---|---|---|---|---|---|---|---|---|---|---|---|---|---|---|---|---|---|---|
Richard K. Mueller | Chairman and Chief Executive Officer(3) | 2015 | 1,000,000 | 200,000 | — | — | 20,140 | 1,220,140 | ||||||||||||||||
H. Douglas Goforth | Chief Financial Officer | 2015 | 265,385 | 105,625 | 1,204,287 | — | — | 1,575,297 | ||||||||||||||||
G. Michael Callahan, Jr. | President(4) | 2015 | 328,860 | — | 3,211,479 | 2,237,804 | 27,731 | 5,805,874 | ||||||||||||||||
Stephen K. Barker | Former Chief Operating Officer | 2015 | 328,860 | — | 2,264,772 | 2,237,804 | — | 4,831,436 | ||||||||||||||||
Richard Alan Adams | Chief Accounting Officer and Former Chief Financial Officer | 2015 | 237,109 | — | 1,204,287 | 648,639 | — | 2,090,035 | ||||||||||||||||
- (1)
- Mr. Mueller was awarded a discretionary bonus of $200,000 in recognition of his efforts in the transition of his duties to Mr. Callahan and his efforts in connection with acquisitions made by the Company. Mr. Goforth was awarded a discretionary bonus of $105,625 in recognition of his efforts to prepare the Company for its public offering. Both of these payments were approved by the Compensation Committee. See also "Compensation Discussion and Analysis—Annual Bonuses."
112
- (2)
- The amounts in this column for 2015 were calculated based on the grant date fair value of our common stock, in accordance with FASB ASC Topic 718. Stock awards generally vest in various increments over multi-year periods. As a result, this grant date fair value may not be indicative of the ultimate value the executive may receive under these grants. Assumptions used to determine the grant date fair value are set forth in Note 14 to our consolidated financial statements for the fiscal year ended April 30, 2015.
- (3)
- The amount set forth under "All Other Compensation" for 2015 includes calendar year 2014 matching contributions made to the GMS 401(k) Plan of $1,167, the calendar 2014 imputed value of company provided automobile of $1,625, calendar 2014 tax and tax gross-up payments of $17,198 related to unreimbursed medical expenses, and personal gifts of $150.
- (4)
- The amount set forth under "All Other Compensation" for 2015 includes calendar year 2014 matching contributions made to the GMS 401(k) Plan of $1,008, the calendar 2014 imputed value of company provided automobile of $4,188, calendar 2014 costs of $11,172 attributable to personal usage of Company-provided aircraft and $11,213 for the related gross-up payment, and personal gifts of $150. The incremental cost to the Company of personal use of company provided aircraft is calculated based on the variable operating costs to the Company. We impose an annual limit of 12 hours on the President's non-business use of Company-provided aircraft.
GRANTS OF PLAN-BASED AWARDS FOR 2015
The table below sets forth information regarding all grants of awards made to the named executive officers during the fiscal year ended April 30, 2015. For further information regarding the terms of certain of these grants, see "Compensation Discussion and Analysis" above.
| | | | | | All Other Option Awards: Number of Securities Underlying Options (#)(2) | | | |||||||||||||||
|---|---|---|---|---|---|---|---|---|---|---|---|---|---|---|---|---|---|---|---|---|---|---|
| | | Estimated Future Payouts Under Non-Equity Incentive Plan Awards(1) | Exercise or Base Price of Option Awards ($/Sh) | | ||||||||||||||||||
| | | Grant Date Fair Value of Option Awards ($) | ||||||||||||||||||||
Name | Grant Date | Threshold ($) | Target ($) | Max ($) | ||||||||||||||||||
Richard K. Mueller | — | — | — | — | — | — | — | |||||||||||||||
H. Douglas Goforth | 8/18/2014 | 17,096 | 170,959 | 341,918 | — | — | — | |||||||||||||||
| 8/18/2014 | — | — | — | 26,532 | 125.00 | 1,204,287 | ||||||||||||||||
G. Michael Callahan, Jr. | 5/1/2014 | — | 2,716,166 | — | — | — | — | |||||||||||||||
| 6/17/2014 | — | — | — | 70,753 | 125.00 | 3,211,479 | ||||||||||||||||
Stephen K. Barker | 5/1/2014 | — | 2,716,166 | — | — | — | — | |||||||||||||||
| 6/24/2014 | — | — | — | 35,376 | 125.00 | 1,605,717 | ||||||||||||||||
| 3/23/2015 | — | — | — | 8,844 | 150.00 | 659,055 | ||||||||||||||||
Richard Alan Adams | 5/1/2014 | — | 787,294 | — | — | — | — | |||||||||||||||
| 6/17/2014 | — | — | — | 26,532 | 125.00 | 1,204,287 | ||||||||||||||||
- (1)
- These columns, where applicable, show the range of possible payouts which were targeted for fiscal 2015 performance under the Company's annual bonus plan as described in the in the section titled "Annual Bonuses" in the Compensation Discussion and Analysis.
- (2)
- The stock options grants disclosed in the table were all issued pursuant to each named executive's employment agreement and vest as described in the section titled "Long-Term Incentive Plans." Assumptions used to determine the grant date fair value are set forth in Note 14 to our consolidated financial statements for the fiscal year ended April 30, 2015.
Employment Agreements
We currently use employment agreements to attract and/or retain named executive officers to the Company. As discussed above, the material terms of the Employment Agreements for our NEOs, other than Mr. Goforth, were established at the time of the Acquisition, and the CFO Agreement was negotiated at the time of Mr. Goforth's commencement of employment.
113
Chairman and Chief Executive Officer (Richard K. Mueller)
On April 1, 2014 the Company entered into an Employment Agreement with Mr. Mueller, pursuant to which his employment term commenced on closing of the Acquisition and would continue thereafter until either the Company or Mr. Mueller provided at least 60 days' written notice to the other of intent to terminate Mr. Mueller's employment. Pursuant to his Employment Agreement, Mr. Mueller would be entitled to an annual base salary of $1,000,000, and would be eligible to participate in all health and other group insurance and other benefit plans and programs and any fringe benefit programs for which other senior executives of the Company are generally eligible. In addition, Mr. Mueller would be entitled to (a) the provision of Netjets service for (i) all business trips and (ii) personal travel not to exceed 25 hours per year, (b) use of a Company vehicle and (c) a payment for unreimbursed medical expenses incurred by Mr. Mueller or his dependents in the amount not to exceed $25,000 per year. Mr. Mueller's Employment Agreement also provided for severance upon certain terminations of employment, as described below under "Payments upon Certain Events of Termination or Change in Control."
Effective May 1, 2015, Mr. Mueller resigned from his position as Chief Executive Officer, and in connection therewith, the Company and Mr. Mueller entered into the Chairman Agreement which provides for terms which are generally consistent with those provided in his Employment Agreement, except as described below. The Chairman Agreement provides for the following: (i) a three-year employment term which commenced on July 1, 2015; (ii) a change in Mr. Mueller's title to Chairman of the Board; (iii) changes in duties and responsibilities to reflect his role as chairman; (iv) annual base salary of $300,000; and (v) a grant of 6,000 options under the Option Plan to be granted on the day following the effective date of an initial public offering of the Company, each at an exercise price equal to the closing price of a share of common stock of the Company on the effective date of such initial public offering (which is not guaranteed to occur) (the "Chairman Option Grant"). The Chairman Option Grant would vest as to 25% on the first anniversary of the date of grant and thereafter as to 6.25% on each quarterly anniversary of the date of grant such that the Chairman Option Grant will be fully vested on the fourth anniversary of the date of the grant. In addition, the Chairman Agreement provides that Mr. Mueller is entitled to a cash make-whole payment, in respect of each share underlying the Chairman Option Grant, in an amount equal to the excess, if any, between the closing price of a share of common stock of the Company on the effective date an initial public offering of the Company and the per share price of common stock of the Company as of April 30, 2015, which make-whole payment would be paid as and when the portion of the shares underlying the Chairman Option Grant to which the make-whole payment relates vests.
Chief Financial Officer (H. Douglas Goforth)
On August 12, 2014 the Company entered into the CFO Agreement with Mr. Goforth, pursuant to which his initial employment term commenced on August 18, 2014 and will expire on August 18, 2017, and will thereafter be subject to automatic one-year extensions unless either the Company or Mr. Goforth provides at least 90 days' written notice to the other of intent not to renew the term. The CFO Agreement provides that Mr. Goforth will receive an annual base salary of $375,000, subject to increase at the discretion of the Compensation Committee and shall be eligible to receive a target annual bonus equal to 65% of his base salary with a maximum annual bonus opportunity of up to 130% of his base salary, pursuant to the terms of the Bonus Plan, subject to satisfaction of performance goals and bonus criteria to be defined and approved by the Compensation Committee. The CFO Agreement also provides that Mr. Goforth is eligible to participate in all benefit programs for which other senior executives of the Company are generally eligible and entitled to use of a Company vehicle. The CFO Agreement also provides for severance upon certain terminations of employment, as described below under "Payments upon Certain Events of Termination or Change in Control."
114
President (G. Michael Callahan, Jr.)
On April 1, 2014 the Company entered into an Employment Agreement with Mr. Callahan, pursuant to which his initial employment term commenced on the closing of the Acquisition and will expire on third anniversary thereof, and would thereafter be subject to automatic one-year extensions unless either the Company or Mr. Callahan provides at least 90 days' written notice to the other of intent not to renew the term. The Employment Agreement provides that Mr. Callahan would receive a base salary of $327,600 per year, subject to increase at the discretion of the Company and that he would be eligible to participate in all benefit programs for which other senior executives of the Company are generally eligible. Mr. Callahan would also be eligible to receive an annual bonus pursuant to the terms of the Bonus Plan, which bonuses in respect of fiscal 2015 would be calculated in accordance with methodology used prior to the Acquisition. In addition, Mr. Callahan would be entitled to (a) the provision of Netjets service for (i) all business trips and (ii) personal travel not to exceed 12 hours per year and (b) use of a Company vehicle. Mr. Callahan's Employment Agreement also provided for severance upon certain terminations of employment, as described below under "Payments upon Certain Events of Termination or Change in Control."
In connection with Mr. Callahan's appointment as President and Chief Executive Officer effective May 1, 2015, Mr. Callahan's annual base salary was increased to $700,000 and he will be eligible to earn an annual bonus of up to 250% of his base salary as reflected in his amended and restated employment agreement effective as of May 1, 2015.
Former Chief Operating Officer (Stephen K. Barker)
On April 1, 2014 the Company entered into an Employment Agreement with Mr. Barker, pursuant to which his initial employment term commenced on the closing of the Acquisition and will expire on third anniversary thereof, and would thereafter be subject to automatic one-year extensions unless either the Company or Mr. Barker provides at least 90 days' written notice to the other of intent not to renew the term. The Employment Agreement provides that Mr. Barker would receive a base salary of $327,000 per year, subject to increase at the discretion of the Company and would be eligible to participate in all benefit programs for which other senior executives of the Company are generally eligible, including use of a Company vehicle. Mr. Barker would also be eligible to receive an annual bonus pursuant to the terms of the Bonus Plan, which bonuses in respect of fiscal 2015 would be calculated in accordance with methodology used prior to the Acquisition.
Mr. Barker no longer served as Chief Operating Officer of the Company effective as of May 4, 2015. In connection with his separation, Mr. Barker and the Company entered into a separation agreement on May 11, 2015 which agreement provides that Mr. Barker will be entitled to the following, subject to his execution of a release of claims against the Company: (i) severance in an amount equal to equal to one and one-half times his base salary then in effect, payable in equal installments on the Company's regular payroll dates occurring during the 18-month period beginning on May 28, 2015; (ii) payment of his annual bonus in respect of fiscal 2015; (iii) continued medical and dental insurance coverage for 18 months following the termination date or, if earlier until Mr. Barker becomes covered under a health plan offered by a subsequent employer; and (iv) repurchase of 30,000 shares of our common stock. The separation agreement also provides that Mr. Barker is subject to a perpetual confidentiality covenant and non-competition and non-solicitation covenants for the 18-month period following his separation from the Company.
Chief Accounting Officer & Former Chief Financial Officer (Richard Alan Adams)
On April 1, 2014 the Company entered into an Employment Agreement with Mr. Adams, pursuant to which his initial employment term commenced on the closing of the Acquisition and will expire on third anniversary thereof, and will thereafter be subject to automatic one-year extensions unless either
115
the Company or Mr. Adams provides at least 90 days' written notice to the other of intent not to renew the term. The Employment Agreement provides that Mr. Adams will receive a base salary of $236,200 per year, subject to increase at the discretion of the Company and will be eligible to participate in all benefit programs for which other senior executives of the Company are generally eligible, including use of a Company vehicle. Mr. Adams shall also be eligible to receive an annual bonus pursuant to the terms of the Bonus Plan, which bonuses in respect of fiscal 2015 would be calculated in accordance with methodology used prior to the Acquisition. Mr. Adams' Employment Agreement also provides for severance upon certain terminations of employment, as described below under "Payments upon Certain Events of Termination or Change in Control."
For fiscal 2016, the Compensation Committee approved an increase in Mr. Adams' base salary to $350,000 and provided that he shall be eligible to receive a target annual bonus equal to 50% of his base salary with a maximum annual bonus opportunity of up to 100% of his base salary based on the Company's achievement of adjusted EBITDA and other performance goals as approved by the Compensation Committee, in each case, as reflected in his amended and restated employment agreement effective as of May 1, 2015.
2015 OUTSTANDING EQUITY AWARDS AT YEAR END
The following table sets forth certain information with respect to outstanding options held by each of our NEOs on April 30, 2015.
| | Option Awards | ||||||||||||
|---|---|---|---|---|---|---|---|---|---|---|---|---|---|
Name | Number of Securities Underlying Unexercised Options Exercisable | Number of Securities Underlying Unexercised Options Un-exercisable | Option Exercise Price ($) | Option Expiration Date | |||||||||
Richard K. Mueller | — | — | — | — | |||||||||
H. Douglas Goforth | — | 26,532 | (1) | 125.00 | 08/18/24 | ||||||||
G. Michael Callahan, Jr. | 17,688 | 53,065 | (2) | 125.00 | 04/01/24 | ||||||||
Stephen K. Barker | 8,844 | 26,532 | (2)(3) | 125.00 | 04/01/24 | ||||||||
| 0 | 8,844 | (3)(4) | 150.00 | 03/31/25 | |||||||||
Richard Alan Adams | 6,633 | 19,899 | (2) | 125.00 | 04/01/24 | ||||||||
- (1)
- These options are scheduled to vest with respect to 25% of the underlying shares on August 18, 2015 and thereafter in 12 equal installments on each quarterly anniversary of August 18, 2015.
- (2)
- These options vested with respect to 25% of the underlying shares on April 1, 2015 and will vest with respect to the remaining underlying shares in 12 equal installments on each quarterly anniversary of April 1, 2015.
- (3)
- Mr. Barker was no longer employed by the Company effective May 4, 2015. He exercised his right to purchase 8,844 shares at a price of $125.00 on June 1, 2015, and his remaining unvested options were forfeited without consideration as of the effective date of his termination of employment.
- (4)
- These options would have vested with respect to 25% of the underlying shares on March 31, 2016 and thereafter in 12 equal installments on each quarterly anniversary of March 31, 2016.
Payments upon Certain Events of Termination or Change in Control
Pursuant to the terms of the Employment Agreement or CFO Agreement, as applicable, our NEOs are entitled to receive certain payments in connection with certain termination events. In the event of a termination for any reason, Mr. Mueller is entitled to receive, in addition to any accrued benefits, a payment in each of the 24 months following the termination date in an amount that is sufficient, after deducting all applicable federal, state and local taxes, to permit Mr. Mueller to pay the full amount of any monthly premium applicable to the medical and dental insurance programs of the
116
Company in which Mr. Mueller participated prior to the termination date. With respect to Messrs. Goforth, Callahan, Barker and Adams, in the event the NEO's employment is terminated by the Company other than for cause, or due to death or disability (each, as defined in the respective Employment Agreement or CFO Agreement) or by the NEO for good reason (as defined in the respective Employment Agreement or CFO Agreement), the NEO shall be entitled to (i) base salary continuation for the Severance Period (as defined below); (ii) a pro-rata annual bonus for the year in which termination occurs and (iii) medical benefits continuation for the Severance Period and, to the extent the medical benefits continuation is taxable to the NEO, a tax gross-up payment for such benefit. The Severance Period for our NEOs (other than Mr. Mueller) is: 12 months for Mr. Goforth, 18 months for Mr. Callahan, 18 months for Mr. Barker and 12 months for Mr. Adams.
With respect to our NEOs other than Mr. Mueller, in the event the NEO's employment is terminated by the Company for cause, the Company is obligated to pay the NEO any accrued benefits through the date of termination, which accrued benefits are quantified in the table below in the "Accrued Benefits" column. The amounts in the "Accrued Benefits" column represent four weeks' vacation pay.
The following table describes the estimated value of payments that would have been due to NEOs (other than Mr. Mueller) in the event that their employment was terminated by the Company due to a termination without cause or by the NEO for good reason on April 30, 2015. With respect to Mr. Mueller, the amount included in the table below is the estimated value of the payment that would have been due upon a termination of employment for any reason occurring on April 30, 2015.
Name | Accrued Benefits ($) | Base Salary ($) | Pro Rata Bonus ($) | Medical Coverage ($) | Other ($) | Total ($) | |||||||||||||
|---|---|---|---|---|---|---|---|---|---|---|---|---|---|---|---|---|---|---|---|
Richard K. Mueller | 76,923 | — | — | 50,000 | — | 126,923 | |||||||||||||
H. Douglas Goforth | 28,846 | 375,000 | — | 20,140 | — | 423,986 | |||||||||||||
G. Michael Callahan, Jr. | 25,200 | 491,400 | 2,237,804 | 30,210 | — | 2,784,614 | |||||||||||||
Stephen K. Barker | 25,200 | 491,400 | 2,237,804 | 30,210 | — | 2,784,614 | |||||||||||||
Richard Alan Adams | 18,169 | 236,200 | 648,639 | 20,140 | — | 923,148 | |||||||||||||
Additionally, our NEOs hold options issued pursuant to Option Plan, which options become fully vested and exercisable upon a Change in Control (as defined below). The following table describes the estimated present value of payments for unvested options to purchase shares that would have become vested upon a Change in Control, assuming that such Change in Control occurred on April 30, 2015.
Name | Unvested Stock Options ($)(1) | Total ($) | |||||
|---|---|---|---|---|---|---|---|
Richard K. Mueller | — | — | |||||
H. Douglas Goforth | 26,532 | 1,208,533 | |||||
G. Michael Callahan, Jr. | 53,065 | 2,417,099 | |||||
Stephen K. Barker | 35,376 | 1,390,277 | |||||
Richard Alan Adams | 19,899 | 906,399 | |||||
- (1)
- Represents unvested options as of year ended April 30, 2015. Calculations with regard to stock options are based upon the most recent appraisal price of the Company's common stock ($170.55) as of April 30, 2015, less exercise price.
The Company does not currently pay cash compensation to its directors who are employed by either the Company or AEA for their services as directors. Each non-employee, non-AEA director received options to purchase 3,000 shares of the Company's common stock under the Option Plan, which generally vest as to 25% on the first anniversary of the date of grant and thereafter on a quarterly basis such that the options will be fully vested on the fourth anniversary of the date of grant.
117
Shown below is information regarding the compensation for each member of the Board for fiscal 2015, other than the compensation for Mr. Mueller and Mr. Callahan which is reported above in the Summary Compensation Table.
Name | Fees Earned or Paid in Cash ($) | Option Awards(1) ($) | All Other Compensation ($) | Total ($) | |||||||||
|---|---|---|---|---|---|---|---|---|---|---|---|---|---|
Peter C. Browning | — | 136,170 | — | 136,170 | |||||||||
Justin de La Chapelle | — | — | — | — | |||||||||
John J. Gavin | — | 136,170 | — | 136,170 | |||||||||
Theron I. Gilliam | — | 223,560 | — | 223,560 | |||||||||
Brian B. Hoesterey | — | — | — | — | |||||||||
Ronald R. Ross | — | 136,170 | — | 136,170 | |||||||||
J. Louis Sharpe | — | — | — | — | |||||||||
J. David Smith | — | 136,170 | — | 136,170 | |||||||||
- (1)
- Only our directors who are not current employees of the Company or current employees or members of AEA received options to purchase the Company's common stock in fiscal 2015. On September 17, 2014, each of Messrs. Browning, Gavin, Ross and Smith was granted options to purchase 3,000 shares Company common stock at an exercise price of $125.00 per share. On April 8, 2015, subsequent to becoming a non-AEA director, Mr. Gilliam was granted an option to purchase 3,000 shares at an exercise price of $150.00. The amounts included in the "Option Awards" column represent the grant date fair value computed in accordance with FASB ASC Topic 718. The valuation assumptions used in determining such amounts are described in Note 14 to our financial statements. As of April 30, 2015, all of the options granted to Messrs. Browning, Gavin, Gilliam, Ross and Smith were unvested.
2014 GMS Inc. Stock Option Plan
The Option Plan was established to attract, retain, incentivize and motivate officers and employees of, consultants to, and non-employee directors providing services to the Company and its subsidiaries and affiliates and to promote the success of the Company by providing such participating individuals with a proprietary interest in the performance of the Company. On April 1, 2014, the board of directors adopted the 2014 GMS Inc. Stock Option Plan under which 353,556 shares of common stock of the Company ("Shares") are reserved for the issuance of options to purchase Shares ("Options").
Administration. The Option Plan shall be administered by the Compensation Committee, which shall have all of the powers necessary to enable it to carry out its duties under the Option Plan properly, including the power and duty to construe and interpret the Option Plan and to determine all questions arising under it. The Compensation Committee may correct any defect, supply any omission, or reconcile any inconsistency in the Option Plan or in any Option in the manner and to the extent it deems necessary to carry out the intent of the Option Plan. The Compensation Committee's interpretations and determinations shall be final, binding and conclusive upon all persons.
Plan Term. The Option Plan became effective on April 1, 2014 and will terminate on the tenth (10th) anniversary thereof, unless earlier terminated by the Board.
Eligibility. Under the Option Plan, the "Eligible Individuals" includes officers, employees, consultants, advisors and non-employee directors providing services to the Company and its subsidiaries and affiliates. The Compensation Committee will determine which Eligible Individuals will receive grants of options.
118
Option Price. The manner in which the exercise price is to be determined for Shares under each Option shall be determined by the Compensation Committee and set forth in the option agreement; provided, however, that the exercise price per Share under each Option shall not be less than the greater of (i) the par value of a Share and (ii) 100% of the fair market value of a Share on the date the Option is granted.
Maximum Duration. Options granted under the Option Plan shall be for such term as the Compensation Committee shall determine; provided that an Option shall not be exercisable after the expiration of 10 years from the date it is granted; provided, further, however, that unless the Compensation Committee provides otherwise, an Option may, upon the death of the participant prior to the expiration of the Option, be exercised for up to one year following the date of the participant's death, even if such period extends beyond 10 years from the date the Option is granted. The Compensation Committee may, subsequent to the granting of any Option, extend the period within which the Option may be exercised (including following a participant's termination), but in no event shall the period be extended to a date that is later than the earlier of the latest date on which the Option could have been exercised and the 10th anniversary of the date of grant of the Option.
Vesting. The Compensation Committee shall determine and set forth in the applicable option agreement the time or times at which an Option shall become vested and exercisable. To the extent not exercised, vested installments shall accumulate and be exercisable, in whole or in part, at any time after becoming exercisable, but not later than the date the Option expires. The Compensation Committee may accelerate the exercisability of any Option or portion thereof at any time.
Method of Exercise. The exercise of an Option shall be made only by giving notice in the form and to the person designated by the Company, specifying the number of Shares to be exercised and, to the extent applicable, accompanied by payment therefor and otherwise in accordance with the option agreement pursuant to which the Option was granted. The Option Price shall be paid in any or any combination of the following forms: (a) cash or its equivalent or (b) in the form of other property as determined by the Compensation Committee. Any Shares transferred to or withheld by the Company as payment of the exercise price under an Option (to the extent permitted by the Compensation Committee) shall be valued at their fair market value on the last business day preceding the date of exercise of such Option.
Adjustments. In the event of a Change in Capitalization (as defined in the Option Plan), the Compensation Committee shall conclusively determine the appropriate adjustments, if any, to (a) the maximum number and class of Shares with respect to which Options may be granted under the Option Plan, (b) the number and class of Shares or other stock or securities (of the Company or any other corporation or entity), cash or other property which are subject to outstanding Options granted under the Option Plan and the exercise price therefor, if applicable and (c) any other adjustments the Compensation Committee determines to be equitable. If, by reason of a Change in Capitalization, pursuant to an Option Agreement, a participant shall be entitled to, or shall be entitled to exercise an Option with respect to new, additional or different shares of stock or securities of the Company or any other entity, such new, additional or different shares shall thereupon be subject to all of the conditions and restrictions which were applicable to the Shares subject to the Option prior to such Change in Capitalization.
Effect of Change in Control or Certain Other Transactions. Unless otherwise provided in an award agreement, in connection with a merger, consolidation, reorganization, recapitalization or other similar change in the capital stock of the Company, or a liquidation or dissolution of the Company or a Change in Control (each a "Corporate Transaction"), all outstanding Options shall terminate upon the consummation of the Corporate Transaction, unless provision is made in connection with such transaction, in the sole discretion of the Compensation Committee or the parties to the Corporate Transaction, for the assumption or continuation of such Options by, or the substitution for such
119
Options with new awards of, the surviving, or successor or resulting entity, or a parent or subsidiary thereof, with such adjustments as to the number and kind of shares or other securities or property subject to such new awards, option and stock appreciation right exercise or base prices, and other terms of such new awards as the Compensation Committee or the parties to the Corporate Transaction shall agree. In the event that provision is made in writing as aforesaid in connection with a Corporate Transaction, the Option Plan and the unexercised Options theretofore granted or the new awards substituted therefor shall continue in the manner and under the terms provided in such writing. Notwithstanding the foregoing, except as otherwise provided in the applicable option agreement, vested Options (including those Options that would become vested upon the consummation of the Corporate Transaction) shall not be terminated upon the consummation of the Corporate Transaction unless holders of affected Options are provided either (a) a period of at least fifteen (15) calendar days prior to the date of the consummation of the Corporate Transaction to exercise the Options, or (b) payment in respect of each Share covered by the Option being cancelled in an amount equal to the excess, if any, of the per Share price to be paid or distributed to stockholders in the Corporate Transaction over the option price of the Option.
Without limiting the generality of the foregoing or being construed as requiring any such action, in connection with any such Corporate Transaction the Compensation Committee may, in its sole and absolute discretion, without the consent of any participant, cause any of the following actions to be taken effective upon or at any time prior to any Corporate Transaction: (a) cause any or all unvested Options to become fully vested and immediately exercisable (as applicable) and/or provide the holders of such Options a reasonable period of time prior to the date of the consummation of the Corporate Transaction to exercise the Options; (b) with respect to unvested Options that are terminated in connection with the Corporation Transaction, provide the holders thereof a payment in respect of each Share covered by the Option being terminated in an amount equal to all or a portion of the excess, if any, of the per Share price to be paid or distributed to stockholders in the Corporate Transaction.
For purposes of the Option Plan, "Change in Control" generally means (i) the approval by stockholders of the liquidation or dissolution of the Company, (ii) a transaction or series of related transaction resulting in the sale or other disposition of 51% or more of the outstanding voting stock of the Company, (iii) the merger or consolidation of the Company with or into any entity, or (iv) a sale or other disposition of substantially all of the assets of the Company;provided,however, that the term "Change in Control" shall exclude each transaction which is a "Non-Control Transaction." Unless otherwise provided in an option agreement, "Non-Control Transaction" means (i) any transaction following which AEA and/or its affiliates, participants, investors and/or employees own directly or indirectly a majority of the outstanding shares of voting stock of the Company or any purchasing or surviving entity, as applicable, (ii) a merger or consolidation following which those persons who owned directly or indirectly a majority of the outstanding shares of voting stock of the Company immediately prior to such merger or consolidation will own directly or indirectly a majority of the outstanding shares of voting stock of the surviving or resulting entity, as applicable, (iii) a sale or other disposition of capital stock of the Company following which those persons who owned directly or indirectly a majority of the outstanding shares of voting stock immediately prior to such sale will own directly or indirectly a majority of the outstanding interests or shares of voting stock of the Company or the purchasing entity, as applicable, (iv) a sale or other disposition of substantially all of the assets of the Company to an affiliate of the Company, (v) an initial public offering of the Company, or (vi) any transaction following which AEA, any person controlling or controlled by AEA, or any officers, directors, employees, participants or shareholders of AEA constitute a majority of the directors of the Board or have a right to elect a majority of the Board.
Transferability. Notwithstanding anything contained in the Option Plan or any option agreement to the contrary, in the event that the disposition of Shares acquired pursuant to the Option Plan is not covered by a then current registration statement under the Securities Act and is not otherwise exempt
120
from such registration, such Shares shall be restricted against transfer to the extent required by the Securities Act and Rule 144 or other regulations promulgated thereunder. The Compensation Committee may require any individual receiving Shares pursuant to an Option granted under the Option Plan, as a condition precedent to receipt of such Shares, to represent and warrant to the Company in writing that the Shares acquired by such individual are acquired without a view to any distribution thereof and will not be sold or transferred other than pursuant to an effective registration thereof under the Securities Act or pursuant to an exemption applicable under the Securities Act or the rules and regulations promulgated thereunder.
Amendment or Termination of the Option Plan. The Board may earlier terminate the Option Plan and the Board may at any time and from time to time amend, modify or suspend the Option Plan; provided, however, that, (a) no such amendment, modification, suspension or termination shall impair or adversely alter any Options theretofore granted under the Option Plan, except with the consent of the participant, nor shall any amendment, modification, suspension or termination deprive any participant of any Shares which he or she may have acquired through or as a result of the Option Plan; and (b) to the extent necessary under any applicable law, regulation or exchange requirement, no other amendment shall be effective unless approved by the stockholders of the Company in accordance with applicable law, regulation or exchange requirement.
Annual Incentive Plan
�� Prior to the consummation of this offering, the Company intends to adopt the GMS Inc. Annual Incentive Plan (the "AIP") which sets forth other performance criteria and performance goals which may be used by the Compensation Committee in future fiscal years for the grant of annual bonus awards to our executive officers and other key employees.
The AIP will be administered by the Compensation Committee. Subject to the limitations set forth in the AIP, the Compensation Committee shall have the authority to determine, for each plan year, the time or times at which awards may be granted, the recipients of awards, the performance criteria, the performance goals and all other terms of an award, interpret the AIP, make all determinations under the AIP and necessary or advisable for the administration of the AIP, prescribe, amend and rescind rules and regulations relating to the AIP. The Compensation Committee shall be able to delegate responsibility for performing certain ministerial functions under the AIP to any officer or employee of the Company.
The performance criteria for us or any identified subsidiary or business unit, as selected by the Compensation Committee at the time of the award will be one or any combination of the following: (i) net earnings; (ii) earnings per share; (iii) net debt; (iv) revenue or sales growth; (v) net or operating income; (vi) net operating profit; (vii) return measures (including, but not limited to, return on assets, capital, equity or sales); (viii) cash flow (including, but not limited to, operating cash flow, distributable cash flow and free cash flow); (ix) earnings before or after taxes, interest, depreciation, amortization and/or rent; (x) share price (including, but not limited to growth measures and total stockholder return); (xi) expense control or loss management; (xii) customer satisfaction; (xiii) market share; (xiv) economic value added; (xv) working capital; (xvi) the formation of joint ventures or the completion of other corporate transactions; (xvii) gross or net profit margins; (xviii) revenue mix; (xix) operating efficiency; (xx) product diversification; (xxi) market penetration; (xxii) measurable achievement in quality, operation or compliance initiatives; (xxiii) quarterly dividends or distributions; (xxiv) employee retention or turnover; and (xxv) any combination of or a specified increase in any of the foregoing, or such other performance criteria determined to be appropriate by the Compensation Committee in its sole discretion.
The performance goals shall be the levels of achievement relating to the performance criteria as selected by the Compensation Committee for an award. The Compensation Committee shall be able to
121
establish such performance goals relative to the applicable performance criteria in its sole discretion at the time of an award. The performance goals may be applied on an absolute basis or relative to an identified index or peer group, as specified by the Compensation Committee. The performance goals may be applied by the Compensation Committee after excluding charges for restructurings, discontinued operations, extraordinary items and other unusual or nonrecurring items and the cumulative effects of accounting changes, and without regard to realized capital gains.
122
The following table sets forth information regarding the beneficial ownership of our common stock as of , 2015, and as adjusted to reflect the sale of the shares of common stock offered in this offering for:
- •
- each person or entity who is known by us to beneficially own more than 5% of our common stock;
- •
- each of our directors and named executive officers; and
- •
- all of our directors and executive officers as a group.
Information with respect to beneficial ownership has been furnished to us by each director, executive officer or stockholder listed in the table below, as the case may be. The amounts and percentages of our common stock beneficially owned are reported on the basis of rules of the SEC governing the determination of beneficial ownership of securities. Under these rules, a person is deemed to be a "beneficial owner" of a security if that person has or shares "voting power," which includes the power to vote or direct the voting of such security, or "investment power," which includes the power to dispose of or to direct the disposition of such security. A person is also deemed to be a beneficial owner of any securities of which that person has a right to acquire beneficial ownership within 60 days after , 2015, including any shares of our common stock subject to an option that is exercisable within 60 days after , 2015. More than one person may be deemed to be a beneficial owner of the same securities.
Percentage of beneficial ownership prior to this offering is based on shares of common stock outstanding as of , 2015. Percentage of beneficial ownership after this offering is based on shares of common stock outstanding (assuming no exercise of the underwriters' option to purchase additional shares), or shares of common stock outstanding (assuming full exercise of the underwriters' option to purchase additional shares), in each case, after giving effect to the sale by us of the shares of common stock offered hereby. For a discussion of our stock split, see "Prospectus Summary—The Offering" and "Description of Capital Stock."
Unless otherwise indicated below, to our knowledge, all persons listed below have sole voting and investment power with respect to their shares of common stock, except to the extent authority is shared
123
by spouses under applicable law. Unless otherwise indicated below, the address for each person or entity listed below is c/o GMS Inc., 100 Crescent Centre Parkway, Suite 800, Tucker, Georgia 30084.
Name of Beneficial Owner | Number of Shares Beneficially Owned | Percentage of Shares Beneficially Owned Before this Offering | Percentage of Shares Beneficially Owned After this Offering | Percentage of Shares Beneficially Owned After this Offering Assuming Full Exercise of Underwriters' Option to Purchase Additional Shares | |||||||||
|---|---|---|---|---|---|---|---|---|---|---|---|---|---|
5% Stockholders | |||||||||||||
AEA(1)(2) | % | % | % | ||||||||||
Richard A. Whitcomb | |||||||||||||
Directors and Named Executive Officers | |||||||||||||
Richard K. Mueller | |||||||||||||
G. Michael Callahan, Jr. | |||||||||||||
H. Douglas Goforth | |||||||||||||
Stephen K. Barker | |||||||||||||
Richard Alan Adams | |||||||||||||
Peter C. Browning | |||||||||||||
Justin de La Chapelle | |||||||||||||
John J. Gavin | |||||||||||||
Theron I. Gilliam | |||||||||||||
Brian R. Hoesterey | |||||||||||||
Ronald R. Ross | |||||||||||||
J. Louis Sharpe | |||||||||||||
J. David Smith | |||||||||||||
All executive officers and directors as a group (13 persons) | |||||||||||||
- *
- Represents beneficial ownership of less than 1% of our outstanding common stock.
- (1)
- For purposes of this beneficial ownership table, we have excluded shares of common stock owned by other parties to the Stockholders' Agreement with which AEA may be deemed to share beneficial ownership. All of our stockholders prior to this offering were parties to the Stockholders' Agreement. See "Certain Relationships and Related Party Transactions—Stockholders' Agreement."
- (2)
- Represents investment vehicles managed by AEA Investors LP or AEA Management (Cayman) Ltd. John L. Garcia, the Chairman and Chief Executive Officer of AEA, may be deemed to have voting power and dispositive power with respect to shares of our common stock that are beneficially owned by AEA, but Mr. Garcia disclaims beneficial ownership of such shares.
The address for AEA Investors LP is 666 Fifth Avenue, 36 Floor, New York, NY 10103. The address for AEA Management (Cayman) Ltd. is P.O. Box 309, Ugland House, Grand Cayman KY1-1104, Cayman Islands.
124
CERTAIN RELATIONSHIPS AND RELATED PARTY TRANSACTIONS
The following is a description of transactions since May 1, 2012 to which we were a party in which the amount involved exceeded or will exceed $120,000, and in which any of our executive officers, directors or holders of more than 5% of any class of our voting securities, or an affiliate or immediate family member thereof, had or will have a direct or indirect material interest. We believe the terms obtained or the consideration that we paid or received, as applicable, in connection with the transactions described below are comparable to terms available or amounts that would be paid or received, as applicable, in arms'-length transactions with parties unrelated to us.
AEA
We have entered into a management agreement with our Sponsor relating to the provision of their advisory and consulting services. The agreement requires us to pay our Sponsor an annual management fee of approximately $2.3 million per year following the Acquisition. The annual management fee is payable in quarterly installments of approximately $0.6 million, in advance, on the first day of each calendar quarter. We prepaid the quarterly installment of the management fee for the months of April, May and June 2014 on April 1, 2014. The management agreement also requires us to reimburse our Sponsor for their reasonable out-of-pocket costs and expenses incurred in connection with the Acquisition, their provision of ongoing advisory and consulting services, monitoring their investment in us and developing, negotiating, performing or enforcing any agreements or documents relating to their investment in us. The cost reimbursement is typically billed in arrears during the month following the end of each quarter. As of April 30, 2015, we have reimbursed our Sponsor for reasonable out-of-pocket costs and expenses in the aggregate amount of approximately $0.1 million. We believe that the management agreement and the services mentioned above are or were on terms at least as favorable to us as we would expect to negotiate with unrelated third parties. Immediately following this offering, the management agreement will be terminated. We will pay fees of $ to our Sponsor immediately following this offering.
As compensation for services provided by our Sponsor in connection with the Acquisition, we paid our Sponsor a one-time fee of $10.0 million.
Pursuant to the management agreement, we agreed to indemnify our Sponsor against any claims or liabilities relating to or arising out of actions taken by our Sponsor under the terms of the management agreement or the operation of our business, except for claims or liabilities that are shown to have resulted from actions taken by our Sponsor in bad faith, or due to our Sponsor's gross negligence or willful misconduct. This indemnification provision will survive termination of the management agreement.
Stockholders' Agreement
We, our Sponsor, certain members of management, and all of our existing stockholders prior to this offering have entered into a stockholders' agreement in connection with the Acquisition. The stockholders' agreement contains, among other things, certain restrictions on the ability of the parties thereto to freely transfer shares of our stock. In addition, pursuant to the stockholders' agreement, the parties thereto agree to vote their shares of our common stock on certain matters presented to the stockholders in the same manner that the board of directors and a majority of our stockholders vote on such matters. The foregoing transfer and voting provisions will terminate upon completion of this offering. However, following the consummation of this offering, and for so long as our Sponsor holds an aggregate of at least 10% of our outstanding common stock, our Sponsor will be entitled to nominate at least one individual for election to our board, and our board and nominating committee thereof will nominate and recommend to our stockholders that such individual be elected to our board, and each party to the stockholders' agreement agrees to vote all of their shares to elect such individual to our board.
125
Registration Rights Agreement
The parties to the stockholders' agreement described above also entered into a registration rights agreement in connection with the Acquisition. Pursuant to the registration rights agreement, upon the closing of this offering and subject to the terms of the lock-up agreement they have entered into with the representatives of the underwriters, holders of a total of shares of our common stock as of , 2015, will have the right to require us to register these shares under the Securities Act under specified circumstances and will have incidental registration rights as described below. After registration pursuant to these rights, these shares will become freely tradable without restriction under the Securities Act.
Demand Registration Rights
Subject to certain restrictions, at any time after 180 days following the effective date of the registration statement of which this prospectus forms a part, or 120 days following the effective date of any subsequent registration statement that we file (other than registration statements on Forms S-4 or S-8), our Sponsor may request that we register all or a portion of its common stock for sale under the Securities Act. We will effect the registration as requested in writing by our Sponsor, unless in the good faith judgment of our board of directors, such registration would materially and adversely interfere with certain transactions involving the Company and should be delayed. We are not obligated to file a registration statement pursuant to these demand provisions on more than five occasions on Form S-1; however, our Sponsor is entitled to make an unlimited number of demands for registration on Form S-3 if and when we become eligible to use such form.
Piggyback Registration Rights
In addition, if at any time we register any shares of our common stock (other than pursuant to registrations on Form S-4 or Form S-8), the holders of all shares having registration rights are entitled to at least 10 business days notice of the registration and to include all or a portion of their common stock in the registration.
In the event that any registration in which the holders of registrable shares participate pursuant to the registration rights agreement is an underwritten public offering, the number of registrable shares to be included may, in specified circumstances, be limited.
Other Provisions
We will pay all registration and offering expenses, and the reasonable fees and expenses of a single special counsel for our Sponsor and a single special counsel for all other selling stockholders, related to any demand or piggyback registration. The registration rights agreement contains customary cross-indemnification provisions, pursuant to which we are obligated to indemnify any selling stockholders in the event of material misstatements or omissions in the registration statement attributable to us, and they are obligated to indemnify us for material misstatements or omissions in the registration statement attributable to them. A particular stockholder's shares shall no longer be considered registrable shares, to which demand and piggyback registration rights apply, when such shares have been disposed of under an effective registration statement or sold under Rule 144 of the Securities Act. In addition, the parties to the registration rights agreement, other than our Sponsor, agree to not sell any shares pursuant to Rule 144 of the Securities Act or in some other private placement for a period of one year following the closing of this offering, except pursuant to a registered offering in accordance with the terms of the registration rights agreement, if consented to by our Sponsor or in private transfers to certain permitted transferees.
Other Relationships and Transactions
We lease office and warehouse facilities from partnerships owned by certain of our directors, executive officers and stockholders, including Richard K. Mueller, the Chairman of the Board, and G.
126
Michael Callahan, Jr., our Chief Executive Officer. At April 30, 2015, these leases had expiration dates through our fiscal year ending April 30, 2018. Rent expense related to these leases included in our consolidated financial statements was approximately $1.0 million, $77 thousand, $0.9 million and $0.9 million for fiscal 2015, the one month ended April 30, 2014, the eleven months ended March 31, 2014 and fiscal 2013, respectively. At April 30, 2015, future minimum payments under the terms of the leases aggregated approximately $4.3 million.
On January 24, 2001, Mr. Callahan issued a promissory note to us as payment of the purchase price of certain redeemable common shares of the Predecessor. As of the end of fiscal 2013, Mr. Callahan owed us approximately $463 thousand pursuant to the promissory note. The promissory note was fully repaid in cash prior to the Acquisition in fiscal 2014.
The Predecessor guaranteed the principal balance of borrowings outstanding of a partnership owned by certain stockholders of the Predecessor and one of its subsidiaries. At April 30, 2013, the principal balance of these guaranteed borrowings outstanding was approximately $188,000. The guarantee was released during the eleven months ended March 31, 2014.
During fiscal 2015, full year 2014 and fiscal 2013, we purchased inventories from our former subsidiary, Southern Wall Products, Inc., or SWP, an entity with which Messrs. Mueller, Callahan and Adams are affiliated, either through their direct or indirect ownership interests or through their position as director, or both. Mr. Mueller owns, either directly or indirectly, 48.8% of the common stock outstanding of SWP as of April 30, 2015 and is a director of SWP. Mr. Callahan owns, either directly or indirectly, 2.5% of the common stock of SWP as of April 30, 2015 and is a director of SWP. Mr. Adams is a director of SWP. SWP was spun-off from the Predecessor on August 31, 2012. We purchased inventory from SWP for distribution in the amounts of approximately $11.9 million, $1.0 million, $10.0 million and $9.7 million in fiscal 2015, the one month ended April 30, 2014, the eleven months ended March 31, 2014 and fiscal 2013, respectively. Amounts due to SWP for purchases of inventory for distribution as of April 30, 2015 and 2014 were approximately $943,000 and $1.1 million, respectively.
Policies and Procedures for Related Person Transactions
Prior to the completion of this offering, we expect that our board of directors will adopt a policy providing that the audit committee will review and approve or ratify transactions in excess of $120,000 of value in which we participate and in which a director, executive officer or beneficial holder of more than 5% of any class of our voting securities has or will have a direct or indirect material interest. Under this policy, the board of directors is to obtain all information it believes to be relevant to a review and approval or ratification of these transactions. After consideration of the relevant information, the audit committee is to approve only those related party transactions that the audit committee believes are on their terms, taken as a whole, no less favorable to us than could be obtained in an arms'-length transaction with an unrelated third party and that the audit committee determines are not inconsistent with the best interests of the Company. In particular, our policy with respect to related person transactions will require our audit committee to consider the benefits to the Company, the impact on a director's independence in the event the related person is a director, an immediate family member of a director or an entity in which a director has a position or relationship, the availability of other sources for comparable products or services, the terms of the transaction and the terms available to unrelated third parties or to employees generally. A "related person" is any person who is or was one of our executive officers, directors or director nominees or is a holder of more than 5% of our common stock, or their immediate family members or any entity owned or controlled by any of the foregoing persons. All of the transactions described above were entered into prior to the adoption of this policy.
127
General
Upon the completion of this offering, our authorized capital stock will consist of shares of common stock, par value $0.01 per share, and shares of preferred stock, par value $ per share, the rights and preferences of which the Board may establish from time to time. Upon the completion of this offering, there will be outstanding shares of common stock (excluding shares of our common stock issuable upon exercise of outstanding stock options) and no outstanding shares of preferred stock. As of , 2015, we had stockholders of record.
In connection with this offering, we will amend and restate our certificate of incorporation and by-laws. The following descriptions of our capital stock, amended and restated certificate of incorporation and amended and restated by-laws are intended as summaries only and are qualified in their entirety by reference to our amended and restated certificate of incorporation and amended and restated by-laws, which will become effective upon the completion of this offering and which are filed as exhibits to the registration statement, of which this prospectus forms a part, and to the applicable provisions of the DGCL.
Common Stock
The holders of our common stock are entitled to the following rights, preferences and privileges:
Following the consummation of this offering, we expect that certain affiliates of AEA, together with certain of our other stockholders, will continue to control a majority of the voting power of our outstanding common stock. Holders of our common stock are entitled to one vote for each share held on all matters submitted to a vote of stockholders and do not have cumulative voting rights. An election of directors by our stockholders shall be determined by a plurality of the votes cast by the stockholders entitled to vote on the election. There will be no cumulative voting in the election of directors, which means that holders of a majority of the outstanding shares of common stock will be able to elect all of the directors, and holders of less than a majority of such shares will be unable to elect any director. Holders of common stock are entitled to receive proportionately any dividends as may be declared by our board of directors, subject to any preferential dividend rights of outstanding preferred stock.
In the event of our liquidation or dissolution, the holders of our common stock are entitled to receive proportionately all assets available for distribution to stockholders after the payment of all debts and other liabilities and subject to the prior rights of any outstanding preferred stock. Holders of our common stock have no preemptive or other rights to subscribe for additional shares. The shares of our outstanding common stock are not subject to further calls or assessments by us. There are no conversion or redemption rights or sinking fund provisions applicable to the shares of our common stock. The rights, preferences and privileges of holders of our common stock are subject to and may be adversely affected by the rights of the holders of shares of any series of preferred stock that we may designate and issue in the future.
Preferred Stock
Our preferred stock, if issued, would have priority over our common stock with respect to dividends and other distributions, including the distribution of our assets upon liquidation. Unless required by law or by any stock exchange on which our common stock may be listed, our board of directors will have the authority without further stockholder authorization to issue from time to time shares of preferred stock in one or more series and to fix the terms, limitations, relative rights and preferences and variations of each series. Although we have no present plans to issue any shares of preferred stock, the issuance of shares of preferred stock, or the issuance of rights to purchase such
128
shares, could adversely affect the rights and powers, including voting rights, of the common stock, and could have the effect of delaying, deterring or preventing a change in control of us or an unsolicited acquisition proposal.
Limitations on Directors' Liability
Our amended and restated certificate of incorporation and amended and restated by-laws contain provisions indemnifying our directors and officers to the fullest extent permitted by law. Prior to the completion of this offering, we intend to enter into indemnification agreements with each of our directors which may, in certain cases, be broader than the specific indemnification provisions contained under Delaware law.
In addition, as permitted by Delaware law, our certificate of incorporation provides that no director will be liable to us or our stockholders for monetary damages for breach of fiduciary duty as a director. The effect of this provision is to restrict our rights and the rights of our stockholders in derivative suits to recover monetary damages against a director for breach of fiduciary duty as a director, except that a director will be personally liable for:
- •
- any breach of his or her duty of loyalty to us or our stockholders;
- •
- acts or omissions not in good faith which involve intentional misconduct or a knowing violation of law;
- •
- the payment of dividends or the redemption or purchase of stock in violation of Delaware law; or
- •
- any transaction from which the director derived an improper personal benefit.
This provision does not affect a director's liability under the federal securities laws.
To the extent that our directors, officers and controlling persons are indemnified under the provisions contained in our amended and restated certificate of incorporation, Delaware law or contractual arrangements against liabilities arising under the Securities Act, we have been advised that in the opinion of the SEC such indemnification is against public policy as expressed in the Securities Act and is therefore unenforceable.
Provisions of Our Amended and Restated Certificate of Incorporation, Amended and Restated By-laws and Delaware Law that May Have an Anti-Takeover Effect
Delaware law contains, and upon the completion of this offering our amended and restated certificate of incorporation and our amended and restated by-laws will contain, provisions that could have the effect of delaying, deferring or discouraging another party from acquiring control of us. These provisions, which are summarized below, are expected to discourage coercive takeover practices and inadequate takeover bids. These provisions are also designed to encourage persons seeking to acquire control of us to first negotiate with our board of directors.
Staggered Board; Removal of Directors
Our amended and restated certificate of incorporation and our amended and restated by-laws will divide our board of directors into three classes with staggered three-year terms. In addition, a director will only be subject to removal by our stockholders for cause if the control group, consisting of certain affiliates of AEA and certain of our other stockholders, ceases to own more than 50% of our common stock. Any vacancy on our board of directors, including a vacancy resulting from an enlargement of our board of directors, will only be able to be filled by vote of a majority of our directors then in office. Furthermore, our amended and restated certificate of incorporation will provide that the authorized number of directors may be changed only by the resolution of our board of directors. The classification
129
of our board of directors and the limitations on the removal of directors, changes to the authorized numbers of directors and filling of vacancies could make it more difficult for a third party to acquire, or discourage a third party from seeking to acquire, control of our Company.
Stockholder Action by Written Consent; Special Meetings
Our amended and restated certificate of incorporation will provide that any action required or permitted to be taken by our stockholders must be effected at a duly called annual or special meeting of such holders and may not be effected by any consent in writing by such holders if the control group, consisting of certain affiliates of AEA and certain of our other stockholders, ceases to own more than 50% of our common stock. Our amended and restated certificate of incorporation and our amended and restated by-laws will also provide that, except as otherwise required by law, special meetings of our stockholders can only be called by our chairman of the board, our chief executive officer or our board of directors if the control group ceases to own more than 50% of our common stock.
Advance Notice Requirements for Stockholder Proposals
Our amended and restated by-laws will establish an advance notice procedure for stockholder proposals to be brought before an annual meeting of stockholders, including proposed nominations of persons for election to our board of directors. Stockholders at an annual meeting will only be able to consider proposals or nominations specified in the notice of meeting or brought before the meeting by or at the direction of our board of directors or by a stockholder of record on the record date for the meeting who is entitled to vote at the meeting and who has delivered timely written notice in proper form to our secretary of the stockholder's intention to bring such business before the meeting. These provisions could have the effect of delaying until the next stockholder meeting stockholder actions that are favored by the holders of a majority of our outstanding voting securities.
Section 203 of the Delaware General Corporation Law
In our amended and restated certificate of incorporation, we elect not to be governed by Section 203 of the DGCL, as permitted under and pursuant to subsection (b)(3) of Section 203, until the first date that the control group, consisting of certain affiliates of AEA and certain of our other stockholders, no longer beneficially owns more than 50% of our common stock. After such date, we will be governed by Section 203, which prohibits a Delaware corporation from engaging in a business combination with any interested stockholder for a period of three years following the date the person became an interested stockholder, with the following exceptions:
- •
- before such date, the board of directors of the corporation approved either the business combination or the transaction that resulted in the stockholder becoming an interested holder;
- •
- upon completion of the transaction that resulted in the stockholder becoming an interested stockholder, the interested stockholder owned at least 85% of the voting stock of the corporation outstanding at the time the transaction began, excluding for purposes of determining the voting stock outstanding (but not the outstanding voting stock owned by the interested stockholder) those shares owned (a) by persons who are directors and also officers and (b) pursuant to employee stock plans in which employee participants do not have the right to determine confidentially whether shares held subject to the plan will be tendered in a tender or exchange offer; or
- •
- on or after such date, the business combination is approved by the board of directors and authorized at an annual or special meeting of the stockholders, and not by written consent, by the affirmative vote of at least 662/3% of the outstanding voting stock that is not owned by the interested stockholder.
130
In general, Section 203 defines business combination to include the following:
- •
- any merger or consolidation involving the corporation and the interested stockholder;
- •
- any sale, transfer, pledge or other disposition of 10% or more of the assets of the corporation involving the interested stockholder;
- •
- subject to certain exceptions, any transaction that results in the issuance or transfer by the corporation of any stock of the corporation to the interested stockholder;
- •
- any transaction involving the corporation that has the effect of increasing the proportionate share of the stock or any class or series of the corporation beneficially owned by the interested stockholder; or
- •
- the receipt by the interested stockholder of the benefit of any loans, advances, guarantees, pledges or other financial benefits by or through the corporation.
In general, Section 203 defines an "interested stockholder" as an entity or person who, together with the entity's or person's affiliates and associates, beneficially owns, or is an affiliate of the corporation and within three years prior to the time of determination of interested stockholder status did own, 15% or more of the outstanding voting stock of the corporation.
Amendments to Our By-laws
The Delaware General Corporation Law provides generally that the affirmative vote of a majority of the shares presents at any meeting and entitled to vote on a matter is required to amend a corporation's by-laws, unless a corporation's by-laws requires a greater percentage. Effective upon the completion of this offering, our amended and restated by-laws may be amended or repealed by a majority vote of our board of directors or by the affirmative vote of the holders of at least 75% of the votes that all of our stockholders would be entitled to cast in any annual election of directors.
Exclusive Forum
Our amended and restated certificate of incorporation will provide that the Court of Chancery of the State of Delaware will be the sole and exclusive forum for (i) any derivative action or proceeding brought on our behalf, (ii) any action asserting a claim of breach of a fiduciary duty owed to us or our stockholders by any of our directors, officers, employees or agents, (iii) any action asserting a claim against us arising under the DGCL or (iv) any action asserting a claim against us that is governed by the internal affairs doctrine. Although we believe this provision benefits us by providing increased consistency in the application of Delaware law in the types of lawsuits to which it applies, the provision may have the effect of discouraging lawsuits against our directors and officers and may limit our stockholders' ability to obtain a favorable judicial forum for disputes with us.
Stock Exchange Listing
We intend to apply to list our common stock on under the symbol "GMS".
Transfer Agent and Registrar
The transfer agent and registrar for our common stock is .
131
DESCRIPTION OF CERTAIN INDEBTEDNESS
On April 1, 2014, we entered into (i) a senior secured asset based revolving credit facility (the "ABL Facility"), (ii) a senior secured first lien term loan facility (the "First Lien Facility"), and (iii) a senior secured second lien term loan facility (the "Second Lien Facility" and, together with the First Lien Facility, the "Term Loan Facilities"). The proceeds of the Term Loan Facilities were used to (i) repay certain existing indebtedness of the Predecessor, (ii) pay a portion of the purchase price of the Acquisition, and (iii) pay related fees and expenses. Borrowings under the ABL Facility are used to finance or refinance our working capital and capital expenditures and for general corporate purposes.
ABL Facility
General
GYP Holdings III Corp. (in such capacity, the "Lead Borrower") and certain of the Lead Borrower's direct and indirect wholly-owned domestic restricted subsidiaries (together with the Lead Borrower, collectively, the "ABL Borrowers") entered into the ABL Facility, pursuant to an ABL Credit Agreement (the "ABL Credit Agreement"), with GYP Holdings II Corp. ("Holdings"), the lenders party thereto and Wells Fargo Bank, N.A., as administrative agent and collateral agent. The ABL Facility is scheduled to mature on April 1, 2019. There is no scheduled amortization under the ABL Facility.
The ABL Facility provides for revolving borrowings of up to $200.0 million subject to borrowing base availability. The borrowing base is equal to the sum (subject to certain reserves and adjustments) of (i) 90% of eligible credit card receivables, (ii) 85% of eligible accounts receivables, (iii) the lesser of 75% of the cost of eligible inventory and 85% of the appraised orderly liquidation value of eligible inventory, and (iv) 100% of the aggregate amount of borrowing base eligible cash. Subject to the borrowing base availability, the ABL Facility also includes a letter of credit facility of up to $50.0 million and a swing line facility for same-day borrowings of up to $20.0 million. Borrowings under the ABL Facility are subject to the satisfaction of customary conditions, including absence of default and accuracy of representations and warranties. We may increase the ABL Facility by up to $100.0 million, with notice to the administrative agent, subject to customary conditions.
As of April 30, 2015, we had approximately $17.0 million in short-term swing line borrowings outstanding under the ABL Credit Agreement.
Interest
Borrowings under the ABL Facility bear interest at a rate per annum equal to, at our option, either (a) adjusted LIBOR plus the applicable rate or (b) base rate (determined by reference to the greatest of the prime rate published by Wells Fargo Bank, N.A., the federal funds effective rate plus 0.5% and one-month LIBOR plus 1%) plus the applicable rate. The applicable rates under the ABL Facility are subject to step-ups and step-downs based on the Lead Borrowers' average daily availability as a percentage of the line cap (i.e., aggregate commitments under the ABL Facility) for the immediately preceding fiscal quarter in accordance with the following schedule:
Pricing Level | Average Daily Availability (as a % of line cap) | Eurodollar Rate and Letters of Credit | Base Rate | ||||||
|---|---|---|---|---|---|---|---|---|---|
| I | Less than 33.33% | 2.00 | % | 1.00 | % | ||||
| II | Greater than or equal to 33.3% but less than 66.7% | 1.75 | % | 0.75 | % | ||||
| III | Greater than or equal to 66.7% | 1.50 | % | 0.50 | % | ||||
132
Optional and Mandatory Prepayments; Cash Dominion
At our option, the ABL Facility may be prepaid at any time without a premium or penalty with notice to the administrative agent. We may also terminate and/or permanently reduce the unused commitments under the ABL Facility, with notice to the administrative agent. Such termination or reduction must be in a minimum aggregate amount of $1.0 million or in whole multiples of $1.0 million in excess thereof. In addition, we are not permitted to terminate or reduce the commitments if such termination or reduction (and any concurrent prepayments) would cause the total outstanding amount to exceed the amount of the ABL Facility. To the extent the borrowings under the ABL Facility at any time exceed the lesser of the borrowing base or the line cap at such time, we are required to prepay the borrowings under the ABL Facility in the amount of such excess.
During the existence of an event of default or when we fail to maintain excess availability of at least the greater of $15.0 million or 10.0% of the line cap for five consecutive days, we will be required to sweep substantially all cash receipts from the sale of inventory, collection of receivables and dispositions of the ABL Priority Collateral (defined below) into certain concentration accounts under the dominion and control of the administrative agent under the ABL Facility and all such cash will be used to repay outstanding borrowings under the ABL Facility.
Guarantee and Collateral
Obligations in respect of the ABL Facility are guaranteed by Holdings, and each of our newly acquired or created wholly-owned domestic restricted subsidiaries. Obligations under the ABL Credit Agreement, as well as obligations to the ABL Facility lenders and their affiliates under certain secured cash management agreements and secured hedge agreements, are secured by a first priority lien on the Lead Borrowers' and the guarantors' cash and cash equivalents, bank accounts, accounts receivable, chattel paper, inventory, documents, instruments and general intangibles (collectively, the "ABL Priority Collateral"), and a third priority lien on the Lead Borrowers' and the guarantors' and their wholly-owned subsidiaries' capital stock (which will be limited, in the case of any foreign subsidiaries, to 65% of the voting stock and 100% of the non-voting stock of any first-tier foreign subsidiaries), and the Lead Borrowers' and the guarantors' intercompany debt and all other assets other than the ABL Priority Collateral (collectively, the "Term Loan Priority Collateral"), as further detailed in (i) the ABL Security Agreement, dated April 1, 2014 between the grantors and the collateral agent under the ABL Credit Agreement, (ii) the First Lien Security Agreement, dated April 1, 2014 between the grantors and the collateral agent under the First Lien Credit Agreement (as defined below), (iii) the Second Lien Security Agreement, dated April 1, 2014 between the grantors and the collateral agent under the Second Lien Credit Agreement (as defined below), (iv) the ABL/Term Intercreditor Agreement dated April 1, 2014 between Holdings, the Lead Borrower, the collateral agent under the ABL Credit Agreement and the collateral agents under the Term Credit Agreements (as defined below), and (v) the First Lien/Second Lien Intercreditor Agreement dated April 1, 2014 between Holdings, the Lead Borrower, and the collateral agents under the Term Credit Agreements (the "First Lien/Second Lien Intercreditor Agreement" and collectively, the "Collateral Agreements").
Covenants and Other Matters
The ABL Credit Agreement requires that we comply with a number of covenants, as well as certain financial tests. During the existence of an event of default or when we fail to maintain excess availability of at least the greater of $15.0 million or 10% of the line cap, the consolidated fixed charge coverage ratio of the most recently completed period of four consecutive quarters must be 1.00 to 1.00 or higher. The covenants also limit, in certain circumstances, our ability to take a variety of actions, including:
- •
- incur indebtedness;
133
- •
- create or maintain liens on property or assets;
- •
- make investments, loans and advances;
- •
- engage in acquisitions, mergers, consolidations and asset sales;
- •
- redeem debt;
- •
- pay dividends and distributions; and
- •
- enter into transactions with affiliates.
The Lead Borrowers' future compliance with its financial covenants under the ABL Credit Agreement will depend on its ability to maintain sufficient liquidity, generate earnings and manage its assets effectively. The ABL Credit Agreement also has various non-financial covenants, both requiring the ABL Borrowers to refrain from taking certain future actions (as described above) and requiring each of the ABL Borrowers to take certain actions, such as keeping in good standing its corporate existence, maintaining insurance, and providing the bank lending group with financial information on a timely basis. The ABL Credit Agreement also contains certain customary representations and warranties and events of default, including among other things payment defaults, breach of representations and warranties, covenant defaults, cross-defaults to certain indebtedness, certain events of bankruptcy, certain events under ERISA, material judgments, actual or asserted failure of any material guaranty or security document supporting the ABL Credit Agreement to be in force and effect, and change of control. If such an event of default occurs, the administrative agent under the ABL Credit Agreement would be entitled to take various actions, including the acceleration of amounts due under the ABL Facility and all actions permitted to be taken by a secured creditor.
Term Loan Facilities
General
The Lead Borrower entered into (i) the First Lien Facility, pursuant to a First Lien Credit Agreement (the "First Lien Credit Agreement"), with Holdings, the other guarantors party thereto, the lenders party thereto, and Credit Suisse AG, as administrative agent and collateral agent and (ii) the Second Lien Facility, pursuant to a Second Lien Credit Agreement (the "Second Lien Credit Agreement" and, together with the First Lien Credit Agreement, the "Term Loan Credit Agreements"), with Holdings, the other guarantors party thereto, the lenders party thereto, and Credit Suisse AG, as administrative agent and collateral agent. The Term Loan Facilities also permit us to add one or more incremental term loans up to $100 million (shared between the First Lien Facility and the Second Lien Facility) plus additional amounts subject to our compliance with, with respect to the First Lien Facility, a secured first lien leverage ratio test, and, with respect to the Second Lien Facility, a secured leverage ratio test.
The Term Loan Facilities provide for term loans of up to (i) $390.0 million under the First Lien Facility (the "First Lien Loan") and (ii) $160.0 million under the Second Lien Facility (the "Second Lien Loan" and, together with the First Lien Loan, the "Term Loans"). The First Lien Loan amortizes in nominal quarterly installments equal to 0.25% of the original aggregate principal amount of the First Lien Loan and matures on April 1, 2021. The Second Lien Loan has no amortization and matures on April 1, 2022.
As of April 30, 2015, we had $386.1 million outstanding under the First Lien Facility and $160.0 million outstanding under the Second Lien Facility.
134
Interest
Term Loans bear interest at a rate per annum equal to, at our option, either (a) adjusted LIBOR (subject to a floor of 1.00%) plus the applicable rate or (b) base rate (determined by reference to the greatest of the prime rate published by Credit Suisse AG, the federal funds effective rate plus 0.5% and one-month LIBOR plus 1%) plus the applicable rate. The applicable rates (i) under the First Lien Facility are 3.75% for LIBOR loans and 2.75% for base rate loans and (ii) under the Second Lien Facility are 6.75% for LIBOR loans and 5.75% for base rate loans.
Optional and Mandatory Prepayments
At our option, the First Lien Loan may be prepaid at any time, in whole or in part, without a premium or penalty, with notice to the administrative agent, and the Second Lien Loan may be prepaid at any time (but subject to the restrictions contained in the First Lien/Second Lien Intercreditor Agreement), in whole or in part, with notice to the administrative agent at, in the case of voluntary prepayments and certain mandatory prepayments, a price equal to 101% of the principal amount of loans prepaid on or after April 1, 2015, but prior to April 1, 2016 and 100% of the principal amount of loans prepaid on or after April 1, 2016, plus, in each case, accrued and unpaid interest, if any, to the repayment date. In addition, subject to the satisfaction of certain conditions, we are permitted to offer our lenders to repurchase loans held by them under the Term Loan Facilities at a discount.
Under certain circumstances and subject to certain exceptions, the Term Loan Facilities will be subject to mandatory prepayments in the amount equal to: (x) 100% of the net proceeds of certain assets sales and issuances or incurrence of non-permitted indebtedness and (y) 50% of annual excess cash flow (generally defined as net income, after elimination of all non-cash items, minus (i) amounts of internally generated cash spent on capital expenditures, as well as certain debt repayments, investments and restricted payments, (ii) non-recurring, unusual and extraordinary cash charges and (iii) increases (or plus decreases) in net working capital over the relevant period) for any fiscal year, such percentage to decrease to 25% or 0% upon the attainment as of the end of such fiscal year of total leverage ratios of 5.50:1.00 and 5.00:1.00, respectively.
Guarantee and Collateral
Our obligations in respect of the Term Loan Facilities are guaranteed by Holdings and each of our existing and newly acquired or created wholly-owned domestic restricted subsidiaries. Our obligations under the Term Loan Facilities, as well as obligations to the Term Loan Facilities lenders and their affiliates under certain secured hedge agreements, are secured by a first priority lien on the Term Loan Priority Collateral, and a second priority lien (or, in the case of the Second Lien Facility, a third priority lien) on the ABL Priority Collateral, as further detailed in the Collateral Agreements. As between the First Lien Facility and the Second Lien Facility, liens securing the Second Lien Loan are junior and subordinated to the lien securing the First Lien Loan.
Covenants and Other Matters
The Term Loan Credit Agreements have various non-financial covenants, customary representations and warranties, events of defaults and remedies, substantially similar to those described in respect of the ABL Credit Agreement above. There are no financial maintenance covenants in the Term Loan Credit Agreements.
135
SHARES ELIGIBLE FOR FUTURE SALE
The sale of a substantial amount of our common stock in the public market after this offering could adversely affect the prevailing market price of our common stock. Furthermore, because % of our common stock outstanding prior to the consummation of this offering will be subject to the contractual and legal restrictions on resale described below, the sale of a substantial amount of common stock in the public market after these restrictions lapse could adversely affect the prevailing market price of our common stock and our ability to raise equity capital in the future.
Upon completion of this offering, we expect to have outstanding an aggregate of shares of our common stock, assuming no exercise of outstanding options and assuming that the underwriters have not exercised their option to purchase additional shares. All of the shares of common stock sold in this offering will be freely transferable without restriction or further registration under the Securities Act (other than restrictions pursuant to lock-up agreements entered into by participants in the directed share program) by persons other than "affiliates," as that term is defined in Rule 144 under the Securities Act. Generally, the balance of our outstanding common stock are "restricted securities" within the meaning of Rule 144 under the Securities Act, subject to the limitations and restrictions that are described below. Common stock purchased by our affiliates will be "restricted securities" under Rule 144. Restricted securities may be sold in the public market only if registered or if they qualify for an exemption from registration under Rule 144 or Rule 701 under the Securities Act. These rules are summarized below.
Upon the expiration of the lock-up agreements described below 180 days after the date of this prospectus, and subject to the provisions of Rule 144, an additional shares will be available for sale in the public market. The sale of these restricted securities is subject, in the case of shares held by affiliates, to the volume restrictions contained in those rules.
Lock-up Agreements
In connection with this offering, we, our directors and executive officers and stockholders currently representing substantially all of the outstanding shares of our common stock will agree with the underwriters to enter into lock-up agreements described in "Underwriting," pursuant to which shares of our common stock outstanding after this offering will be restricted from immediate resale in accordance with the terms of such lock-up agreements without the prior written consent of Barclays Capital Inc. and Credit Suisse Securities (USA) LLC. Under these agreements, subject to limited exceptions, neither we nor any of our directors or executive officers or these stockholders may dispose of, hedge or otherwise transfer the economic consequences of ownership of any shares of common stock or securities convertible into or exchangeable or exercisable for shares of common stock. These restrictions will be in effect for a period of 180 days after the date of this prospectus. Certain transfers or dispositions can be made sooner, provided the transferee becomes bound to the terms of the lock-up.
Rule 144
In general, under Rule 144 as in effect on the date of this prospectus, beginning 90 days after the consummation of this offering, a person (or persons whose common stock is required to be aggregated), who is an affiliate, and who has beneficially owned our common stock for at least six months is entitled to sell in any three-month period a number of shares that does not exceed the greater of:
- •
- 1% of the number of shares then outstanding, which will equal approximately shares immediately after consummation of this offering; or
136
- •
- the average weekly trading volume in our shares on during the four calendar weeks preceding the filing of a notice on Form 144 with respect to such a sale.
Sales by our affiliates under Rule 144 are also subject to manner of sale provisions and notice requirements and to the availability of current public information about us. An "affiliate" is a person that directly, or indirectly through one or more intermediaries, controls or is controlled by, or is under common control with an issuer.
Under Rule 144, a person (or persons whose shares are aggregated) who is not deemed to have been an affiliate of ours at any time during the 90 days preceding a sale, and who has beneficially owned the shares proposed to be sold for at least six months (including the holding period of any prior owner other than an affiliate), would be entitled to sell those shares subject only to availability of current public information about us, and after beneficially owning such shares for at least 12 months, would be entitled to sell an unlimited number of shares without restriction. To the extent that our affiliates sell their common stock, other than pursuant to Rule 144 or a registration statement, the purchaser's holding period for the purpose of effecting a sale under Rule 144 commences on the date of transfer from the affiliate.
Rule 701
In general, under Rule 701 as in effect on the date of this prospectus, any of our employees, directors, officers, consultants or advisors who purchased shares from us in reliance on Rule 701 in connection with a compensatory stock or option plan or other written agreement before the effective date of this offering, or who purchased shares from us after that date upon the exercise of options granted before that date, are eligible to resell such shares 90 days after the effective date of this offering in reliance upon Rule 144. If such person is not an affiliate, such sale may be made subject only to the manner of sale provisions of Rule 144. If such a person is an affiliate, such sale may be made under Rule 144 without compliance with the holding period requirement, but subject to the other Rule 144 restrictions described above.
Stock Plans
We intend to file a registration statement or statements on Form S-8 under the Securities Act covering shares of common stock reserved for issuance under our new omnibus incentive plan and pursuant to all option grants made prior to this offering under the stock option plan. Subject to lock-up arrangements, these registration statements are expected to be filed as soon as practicable after the closing date of this offering. Shares issued upon the exercise of stock options after the effective date of the applicable Form S-8 registration statement will be eligible for resale in the public market without restriction, subject to Rule 144 limitations applicable to affiliates and the lock-up agreements described above.
Registration Rights
Following this offering, some of our stockholders will, under some circumstances, have the right to require us to register their shares for future sale. See "Certain Relationships and Related Party Transactions—Registration Rights Agreement."
137
MATERIAL U.S. FEDERAL TAX CONSIDERATIONS FOR NON-U.S. HOLDERS OF OUR COMMON STOCK
The following is a summary of the material U.S. federal income and estate tax consequences of the ownership and disposition of our common stock that is being issued pursuant to this offering. This summary is limited to Non-U.S. Holders (as defined below) that hold our common stock as a capital asset (generally, property held for investment) for U.S. federal income tax purposes. This summary does not discuss all of the aspects of U.S. federal income and estate taxation that may be relevant to a Non-U.S. Holder in light of the Non-U.S. Holder's particular investment or other circumstances. Accordingly, all prospective Non-U.S. Holders should consult their own tax advisors with respect to the U.S. federal, state, local and non-U.S. tax consequences of the ownership and disposition of our common stock.
This summary is based on provisions of the U.S. Internal Revenue Code of 1986, as amended (which we refer to as the "Code"), applicable U.S. Treasury regulations and administrative and judicial interpretations, all as in effect or in existence on the date of this prospectus. Subsequent developments in U.S. federal income or estate tax law, including changes in law or differing interpretations, which may be applied retroactively, could alter the U.S. federal income and estate tax consequences of owning and disposing of our common stock as described in this summary. There can be no assurance that the Internal Revenue Service (the "IRS") will not take a contrary position with respect to one or more of the tax consequences described herein and we have not obtained, nor do we intend to obtain, a ruling from the IRS with respect to the U.S. federal income or estate tax consequences of the ownership or disposition of our common stock.
As used in this summary, the term "Non-U.S. Holder" means a beneficial owner of our common stock that is not, for U.S. federal income tax purposes:
- •
- an individual who is a citizen or resident of the United States;
- •
- a corporation (or other entity treated as a corporation for U.S. federal income tax purposes) created or organized in or under the laws of the United States, any state thereof, or the District of Columbia;
- •
- an entity or arrangement treated as a partnership;
- •
- an estate whose income is includible in gross income for U.S. federal income tax purposes regardless of its source; or
- •
- a trust, if (1) a U.S. court is able to exercise primary supervision over the trust's administration and one or more "United States persons" (within the meaning of the Code) has the authority to control all of the trust's substantial decisions, or (2) the trust has a valid election in effect under applicable U.S. Treasury regulations to be treated as a United States person.
If an entity or arrangement treated as a partnership for U.S. federal income tax purposes holds our common stock, the tax treatment of a partner in such a partnership generally will depend upon the status of the partner, the activities of the partnership and certain determinations made at the partner level. Partnerships, and partners in partnerships, that hold our common stock should consult their own tax advisors as to the particular U.S. federal income and estate tax consequences of owning and disposing of our common stock that are applicable to them.
138
This summary does not consider any specific facts or circumstances that may apply to a Non-U.S. Holder and does not address any special tax rules that may apply to particular Non-U.S. Holders, such as:
- •
- a Non-U.S. Holder that is a financial institution, insurance company, tax-exempt organization, pension plan, broker, dealer or trader in stocks, securities or currencies, U.S. expatriate, controlled foreign corporation or passive foreign investment company;
- •
- a Non-U.S. Holder holding our common stock as part of a conversion, constructive sale, wash sale or other integrated transaction or a hedge, straddle or synthetic security;
- •
- a Non-U.S. Holder that holds or receives our common stock pursuant to the exercise of any employee stock option or otherwise as compensation; or
- •
- a Non-U.S. Holder that at any time owns, directly, indirectly or constructively, 5% or more of our outstanding common stock.
In addition, this summary does not address any U.S. state or local, or non-U.S. or other tax consequences, or any U.S. federal income or estate tax consequences for beneficial owners of a Non-U.S. Holder, including shareholders of a controlled foreign corporation or passive foreign investment company that hold our common stock.
Each Non-U.S. Holder should consult its own tax advisor regarding the U.S. federal, state, local and non-U.S. income and other tax consequences of owning and disposing of our common stock.
Distributions on Our Common Stock
As discussed under "Dividend Policy" above, we do not intend to pay cash dividends on our common stock for the foreseeable future. If we make distributions of cash or property (other than certain pro rata distributions of our common stock) with respect to our common stock, any such distributions generally will constitute dividends for U.S. federal income tax purposes to the extent paid from our current or accumulated earnings and profits, as determined under U.S. federal income tax principles. If a distribution exceeds our current and accumulated earnings and profits, the excess will be treated as a nontaxable return of capital to the extent of the Non-U.S. Holder's adjusted tax basis in its common stock and will reduce (but not below zero) such Non-U.S. Holder's adjusted tax basis in its common stock. Any remaining excess will be treated as gain from a disposition of our common stock subject to the tax treatment described below in "Sales or Other Dispositions of Our Common Stock."
Distributions on our common stock that are treated as dividends, and that are not effectively connected with a Non-U.S. Holder's conduct of a trade or business in the United States, generally will be subject to withholding of U.S. federal income tax at a rate of 30%. A Non-U.S. Holder may be eligible for a lower rate under an applicable income tax treaty between the United States and its jurisdiction of tax residence. In order to claim the benefit of an applicable income tax treaty, a Non-U.S. Holder will be required to provide to the applicable withholding agent a properly executed IRS Form W-8BEN or W-8BEN-E (or other applicable form) in accordance with the applicable certification and disclosure requirements. Special rules apply to partnerships and other pass-through entities and these certification and disclosure requirements also may apply to beneficial owners of partnerships and other pass-through entities that hold our common stock.
Distributions on our common stock that are treated as dividends, and that are effectively connected with a Non-U.S. Holder's conduct of a trade or business in the United States will be taxed on a net income basis at the regular graduated rates and in the manner applicable to United States persons (unless the Non-U.S. Holder is eligible for and properly claims the benefit of an applicable income tax treaty and the dividends are not attributable to a permanent establishment or fixed base maintained by the Non-U.S. Holder in the United States, in which case the Non-U.S. Holder may be
139
eligible for a lower rate under an applicable income tax treaty between the United States and its jurisdiction of tax residence). Dividends that are effectively connected with a Non-U.S. Holder's conduct of a trade or business in the United States will not be subject to the withholding of U.S. federal income tax discussed above if the Non-U.S. Holder provides to the applicable withholding agent a properly executed IRS Form W-8ECI (or other applicable form) in accordance with the applicable certification and disclosure requirements. A Non-U.S. Holder that is treated as a corporation for U.S. federal income tax purposes may also be subject to a "branch profits" tax at a 30% rate (or a lower rate if the Non-U.S. Holder is eligible for a lower rate under an applicable income tax treaty) on the Non-U.S. Holder's earnings and profits (attributable to dividends on our common stock or otherwise) that are effectively connected with the Non-U.S. Holder's conduct of a trade or business within the United States, subject to certain adjustments.
The certifications described above must be provided to the applicable withholding agent prior to the payment of dividends and must be updated periodically. A Non-U.S. Holder may obtain a refund or credit of any excess amounts withheld by timely filing an appropriate claim for a refund with the IRS. Non-U.S. Holders should consult their own tax advisors regarding their eligibility for benefits under a relevant income tax treaty and the manner of claiming such benefits.
The foregoing discussion is subject to the discussion below under "Backup Withholding and Information Reporting" and "FATCA Withholding."
Sales or Other Dispositions of Our Common Stock
A Non-U.S. Holder generally will not be subject to U.S. federal income tax (including withholding thereof) on any gain recognized on sales or other dispositions of our common stock unless:
- •
- the gain is effectively connected with the Non-U.S. Holder's conduct of a trade or business in the United States (and, if required by an applicable income tax treaty, is attributable to a permanent establishment or fixed base maintained by the Non-U.S. Holder in the United States); in this case, the gain will be subject to U.S. federal income tax on a net income basis at the regular graduated rates and in the manner applicable to United States persons (unless an applicable income tax treaty provides otherwise) and, if the Non-U.S. Holder is treated as a corporation for U.S. federal income tax purposes, the "branch profits tax" described above may also apply;
- •
- the Non-U.S. Holder is an individual who is present in the United States for more than 182 days in the taxable year of the disposition and meets certain other requirements; in this case, except as otherwise provided by an applicable income tax treaty, the gain, which may be offset by certain U.S. source capital losses, generally will be subject to a flat 30% U.S. federal income tax, even though the Non-U.S. Holder is not considered a resident of the United States under the Code; or
- •
- we are or have been a "United States real property holding corporation" for U.S. federal income tax purposes at any time during the shorter of (i) the five-year period ending on the date of disposition and (ii) the period that the Non-U.S. Holder held our common stock.
Generally, a corporation is a "United States real property holding corporation" if the fair market value of its "United States real property interests" equals or exceeds 50% of the sum of the fair market value of its worldwide real property interests plus its other assets used or held for use in a trade or business. We believe that we are not currently, and we do not anticipate becoming in the future, a United States real property holding corporation. However, because the determination of whether we are a United States real property holding corporation is made from time to time and depends on the relative fair market values of our assets, there can be no assurance in this regard. If we were a United States real property holding corporation, the tax relating to disposition of stock in a United States real
140
property holding corporation generally will not apply to a Non-U.S. Holder whose holdings, direct, indirect and constructive, constituted 5% or less of our common stock at all times during the applicable period, provided that our common stock is "regularly traded on an established securities market" (as provided in applicable U.S. Treasury regulations) at any time during the calendar year in which the disposition occurs. However, no assurance can be provided that our common stock will be regularly traded on an established securities market for purposes of the rules described above. Non-U.S. Holders should consult their own tax advisors regarding the possible adverse U.S. federal income tax consequences to them if we are, or were to become, a United States real property holding corporation.
The foregoing discussion is subject to the discussion below under "Backup Withholding and Information Reporting" and "FATCA Withholding."
Federal Estate Tax
Our common stock that is owned (or treated as owned) by an individual who is not a U.S. citizen or resident of the United States (as specially defined for U.S. federal estate tax purposes) at the time of death will be included in the individual's gross estate for U.S. federal estate tax purposes, unless an applicable estate tax or other treaty provides otherwise and, therefore, may be subject to U.S. federal estate tax.
Backup Withholding and Information Reporting
Backup withholding (currently at a rate of 28%) will not apply to payments of dividends on our common stock to a Non-U.S. Holder if the Non-U.S. Holder provides to the applicable withholding agent a properly executed IRS Form W-8BEN or W-8BEN-E (or other applicable form) certifying under penalties of perjury that the Non-U.S. Holder is not a United States person, or otherwise qualifies for an exemption. However, the applicable withholding agent generally will be required to report to the IRS and to such Non-U.S. Holder payments of dividends on our common stock and the amount of U.S. federal income tax, if any, withheld with respect to those payments. Copies of the information returns reporting such dividends and any withholding may also be made available to the tax authorities in the country in which the Non-U.S. Holder resides under the provisions of a treaty or agreement.
The gross proceeds from sales or other dispositions of our common stock may be subject, in certain circumstances discussed below, to U.S. backup withholding and information reporting. If a Non-U.S. Holder sells or otherwise disposes of our common stock outside the United States through a non-U.S. office of a non-U.S. broker and the sale or disposition proceeds are paid to the Non-U.S. Holder outside the United States, then the U.S. backup withholding and information reporting requirements generally will not apply to that payment. However, U.S. information reporting, but not U.S. backup withholding, will apply to a payment of sale or disposition proceeds, even if that payment is made outside the United States, if a Non-U.S. Holder sells our common stock through a non-U.S. office of a broker that is a United States person or has certain enumerated connections with the United States, unless the broker has documentary evidence in its files that the Non-U.S. Holder is not a United States person and certain other conditions are met or the Non-U.S. Holder otherwise qualifies for an exemption.
If a Non-U.S. Holder receives payments of the proceeds of sales or other dispositions of our common stock to or through a U.S. office of a broker, the payment will be subject to both U.S. backup withholding and information reporting unless the Non-U.S. Holder provides to the broker a properly executed IRS Form W-8BEN or W-8BEN-E (or other applicable form) certifying under penalties of perjury that the Non-U.S. Holder is not a United States person, or otherwise qualifies for an exemption.
141
Backup withholding is not an additional tax. Any amounts withheld under the backup withholding rules may be credited against the Non-U.S. Holder's U.S. federal income tax liability (which may result in the Non-U.S. Holder being entitled to a refund), provided that the required information is timely furnished to the IRS.
FATCA Withholding
The Foreign Account Tax Compliance Act and related Treasury guidance (commonly referred to as "FATCA") impose U.S. federal withholding tax at a rate of 30% on payments to certain foreign entities of (i) U.S.-source dividends (including dividends paid on our common stock) and (ii) after December 31, 2016, the gross proceeds from the sale or other disposition of property that produces U.S.-source dividends (including sales or other dispositions of our common stock). This withholding tax applies to a foreign entity, whether acting as a beneficial owner or an intermediary, unless such foreign entity complies with (i) certain information reporting requirements regarding its U.S. account holders and its U.S. owners and (ii) certain withholding obligations regarding certain payments to its account holders and certain other persons. Accordingly, the entity through which a Non-U.S. Holder holds its common stock will affect the determination of whether such withholding is required. Non-U.S. Holders are encouraged to consult their tax advisors regarding FATCA.
142
Under the terms and subject to the conditions contained in an underwriting agreement, dated , 2015 we have agreed to sell to the underwriters named below, for whom Barclays Capital Inc. and Credit Suisse Securities (USA) LLC are acting as representatives, the following respective numbers of shares of common stock:
Underwriter | Number of Shares | |
|---|---|---|
Barclays Capital Inc. | ||
Credit Suisse Securities (USA) LLC | ||
RBC Capital Markets, LLC | ||
Robert W. Baird & Co. Incorporated | ||
Wells Fargo Securities, LLC | ||
SunTrust Robinson Humphrey, Inc. | ||
| | | |
Total | ||
| | | |
| | | |
| | | |
The underwriting agreement provides that the underwriters are obligated to purchase all the shares of common stock in the offering if any are purchased, other than those shares covered by the over-allotment option described below. The underwriting agreement also provides that if an underwriter defaults the purchase commitments of non-defaulting underwriters may be increased or the offering may be terminated.
We have granted to the underwriters a 30-day option to purchase on a pro rata basis up to additional shares at the initial public offering price less the underwriting discounts and commissions. The option may be exercised only to cover any over-allotments of common stock.
The underwriters propose to offer the shares of common stock initially at the public offering price on the cover page of this prospectus and to selling group members at that price less a selling concession of $ per share. After the initial public offering the representatives may change the public offering price and concession and discount to broker/dealers.
The following table summarizes the compensation and estimated expenses we will pay:
| | Per Share | Total | |||||||||||
|---|---|---|---|---|---|---|---|---|---|---|---|---|---|
| | Without Over-allotment | With Over-allotment | Without Over-allotment | With Over-allotment | |||||||||
Underwriting Discounts and Commissions paid by us | $ | $ | $ | $ | |||||||||
We estimate that our out of pocket expenses for this offering will be approximately $ . We have agreed to reimburse the underwriters for expenses of approximately $ related to clearance of this offering with the Financial Industry Regulatory Authority, Inc., or FINRA.
The underwriters have informed us that they do not expect sales to accounts over which the underwriters have discretionary authority to exceed 5% of the shares of common stock being offered.
We have agreed that we will not offer, sell, contract to sell, pledge or otherwise dispose of, directly or indirectly, or file with the Securities and Exchange Commission a registration statement under the Securities Act of 1933 (the "Securities Act") relating to, any shares of our common stock or securities convertible into or exchangeable or exercisable for any shares of our common stock, or publicly disclose the intention to make any offer, sale, pledge, disposition or filing, without the prior written consent of the representatives for a period of 180 days after the date of this prospectus, except grants of employee stock options pursuant to the terms of the Option Plan and issuances pursuant to the exercise of
143
employee stock options outstanding on the date hereof. However, in the event that either (1) during the last 17 days of the "lock-up" period, we release earnings results or material news or a material event relating to us occurs or (2) prior to the expiration of the 'lock-up' period, we announce that we will release earnings results during the 16-day period beginning on the last day of the "lock-up" period, then in either case the expiration of the "lock-up" will be extended until the expiration of the 18-day period beginning on the date of the release of the earnings results or the occurrence of the material news or event, as applicable, unless the representatives waive, in writing, such an extension.
Our officers, directors and holders of substantially all of our common stock have agreed, subject to certain exceptions, that they will not offer, sell, contract to sell, pledge or otherwise dispose of, directly or indirectly, any shares of our common stock or securities convertible into or exchangeable or exercisable for any shares of our common stock, enter into a transaction that would have the same effect, or enter into any swap, hedge or other arrangement that transfers, in whole or in part, any of the economic consequences of ownership of our common stock, whether any of these transactions are to be settled by delivery of our common stock or other securities, in cash or otherwise, or publicly disclose the intention to make any offer, sale, pledge or disposition, or to enter into any transaction, swap, hedge or other arrangement, without, in each case, the prior written consent of the representatives for a period of 180 days after the date of this prospectus. However, in the event that either (1) during the last 17 days of the "lock-up" period, we release earnings results or material news or a material event relating to us occurs or (2) prior to the expiration of the "lock-up" period, we announce that we will release earnings results during the 16-day period beginning on the last day of the "lock-up" period, then in either case the expiration of the "lock-up" will be extended until the expiration of the 18-day period beginning on the date of the release of the earnings results or the occurrence of the material news or event, as applicable, unless the representatives waive, in writing, such an extension.
The underwriters have reserved for sale at the initial public offering price up to shares of the common stock for employees, directors and other persons associated with us who have expressed an interest in purchasing common stock in the offering. The number of shares available for sale to the general public in the offering will be reduced to the extent these persons purchase the reserved shares. Any reserved shares not so purchased will be offered by the underwriters to the general public on the same terms as the other shares.
We have agreed to indemnify the underwriters against liabilities under the Securities Act, or contribute to payments that the underwriters may be required to make in that respect.
We intend to apply to list our shares of common stock on , under the symbol "GMS".
In connection with the offering the underwriters may engage in stabilizing transactions, over-allotment transactions, syndicate covering transactions, and penalty bids in accordance with Regulation M under the Exchange Act.
- •
- Stabilizing transactions permit bids to purchase the underlying security so long as the stabilizing bids do not exceed a specified maximum.
- •
- Over-allotment involves sales by the underwriters of shares in excess of the number of shares the underwriters are obligated to purchase, which creates a syndicate short position. The short position may be either a covered short position or a naked short position. In a covered short position, the number of shares over-allotted by the underwriters is not greater than the number of shares that they may purchase in the over-allotment option. In a naked short position, the number of shares involved is greater than the number of shares in the over-allotment option. The underwriters may close out any covered short position by either exercising their over-allotment option and/or purchasing shares in the open market.
144
- •
- Syndicate covering transactions involve purchases of the common stock in the open market after the distribution has been completed in order to cover syndicate short positions. In determining the source of shares to close out the short position, the underwriters will consider, among other things, the price of shares available for purchase in the open market as compared to the price at which they may purchase shares through the over-allotment option. If the underwriters sell more shares than could be covered by the over-allotment option, a naked short position, the position can only be closed out by buying shares in the open market. A naked short position is more likely to be created if the underwriters are concerned that there could be downward pressure on the price of the shares in the open market after pricing that could adversely affect investors who purchase in the offering.
- •
- Penalty bids permit the representatives to reclaim a selling concession from a syndicate member when the common stock originally sold by the syndicate member is purchased in a stabilizing or syndicate covering transaction to cover syndicate short positions.
These stabilizing transactions, syndicate covering transactions and penalty bids may have the effect of raising or maintaining the market price of our common stock or preventing or retarding a decline in the market price of the common stock. As a result the price of our common stock may be higher than the price that might otherwise exist in the open market. These transactions may be effected on or otherwise and, if commenced, may be discontinued at any time.
Prior to this offering, there has been no public market for our common stock. The initial public offering price will be determined by negotiations between us and the representatives. In determining the initial public offering price, we and the representatives expect to consider a number of factors including:
- •
- the information set forth in this prospectus and otherwise available to the representatives;
- •
- our prospects and the history and prospects for the industry in which we compete;
- •
- an assessment of our management;
- •
- our prospects for future earnings;
- •
- the general condition of the securities markets at the time of this offering;
- •
- the recent market prices of, and demand for, publicly traded common stock of generally comparable companies; and
- •
- other factors deemed relevant by the underwriters and us.
A prospectus in electronic format may be made available on the web sites maintained by one or more of the underwriters, or selling group members, if any, participating in this offering and one or more of the underwriters participating in this offering may distribute prospectuses electronically. The representatives may agree to allocate a number of shares to underwriters and selling group members for sale to their online brokerage account holders. Internet distributions will be allocated by the underwriters and selling group members that will make internet distributions on the same basis as other allocations.
The underwriters and their respective affiliates are full-service financial institutions engaged in various activities, which may include securities trading, commercial and investment banking, financial advisory, investment management, investment research, principal investment, hedging, financing and brokerage activities.
145
We expect that the underwriters and their respective affiliates will continue to perform various financial advisory, investment banking and lending services for us or our affiliates, from time to time in the future, for which they may receive customary fees and commissions. In the ordinary course of their various business activities, the underwriters and their respective affiliates may also make or hold a broad array of investments and actively trade debt and equity securities (or related derivative securities) and financial instruments (including bank loans) for their own account and for the accounts of their customers and may at any time hold long and short positions in such securities and instruments. Such investment and securities activities may involve our securities and instruments (directly, as collateral securing other obligations or otherwise). The underwriters and their respective affiliates may also make investment recommendations and/or publish or express independent research views in respect of such securities or instruments and may at any time hold, or recommend to clients that they acquire, long and/or short positions in such securities and instruments. In addition, certain of the underwriters or their respective affiliates, including affiliates of Credit Suisse Securities (USA) LLC, as administrative agent, collateral agent, documentation agent, joint lead arranger and joint bookrunner, RBC Capital Markets, LLC, as syndication agent and a joint lead arranger and joint bookrunner, Wells Fargo Securities, LLC, as administrative agent and collateral agent, and SunTrust Robinson Humphrey, Inc., as a documentation agent, are lenders or agents or managers for the lenders under the ABL Facility and the Term Loan Facilities.
Notice to Prospective Investors in the United Kingdom
This document and any other materials in relation to the shares described herein are only being distributed to and are only directed at persons in the UK who are qualified investors within the meaning of Article 2(1)(e) of the Prospectus Directive who are also: (i) investment professionals falling within Article 19(5) of the Financial Services and Markets Act 2000 (Financial Promotion) Order 2005, or the Order, or (ii) high net worth entities, and other persons to whom it may lawfully be communicated, falling with Article 49(2)(a) to (d) of the Order (all such persons together being referred to as "relevant persons"). The shares are only available to, and any invitation, offer or agreement to subscribe, purchase or otherwise acquire such shares will be engaged in only with, relevant persons. This document and its contents should not be distributed, published or reproduced (in whole or in part) or disclosed by recipients to any other person in the UK. Any person who is not a relevant person should not act or rely on this document or any of its contents.
Notice to Prospective Investors in Switzerland
The shares may not be publicly offered in Switzerland and will not be listed on the SIX Swiss Exchange, or SIX, or on any other stock exchange or regulated trading facility in Switzerland. This document does not constitute a prospectus within the meaning of, and has been prepared without regard to, the disclosure standards for issuance prospectuses under art. 652a or art. 1156 of the Swiss Code of Obligations or the disclosure standards for listing prospectuses under art. 27 ff. of the SIX Listing Rules or the listing rules of any other stock exchange or regulated trading facility in Switzerland. Neither this document nor any other offering or marketing material relating to the shares or the offering may be publicly distributed or otherwise made publicly available in Switzerland.
Neither this document nor any other offering or marketing material relating to the offering, us or the shares have been or will be filed with or approved by any Swiss regulatory authority. In particular, this document will not be filed with, and the offer of shares will not be supervised by, the Swiss Financial Market Supervisory Authority, or FINMA, and the offer of shares has not been and will not be authorized under the Swiss Federal Act on Collective Investment Schemes, or CISA. The investor protection afforded to acquirers of interests in collective investment schemes under the CISA does not extend to acquirers of shares.
146
Notice to Prospective Investors in the European Economic Area
In relation to each Member State of the European Economic Area which has implemented the Prospectus Directive, each a "Relevant Member State", from and including the date on which the European Union Prospectus Directive, or the Prospectus Directive, was implemented in that Relevant Member State, or the Relevant Implementation Date, an offer of shares described in this prospectus may not be made to the public in that Relevant Member State prior to the publication of a prospectus in relation to the shares which has been approved by the competent authority in that Relevant Member State or, where appropriate, approved in another Relevant Member State and notified to the competent authority in that Relevant Member State, all in accordance with the Prospectus Directive, except that, with effect from and including the Relevant Implementation Date, an offer of shares described in this prospectus may be made to the public in that Relevant Member State at any time:
- (a)
- to any legal entity which is a qualified investor as defined in the Prospectus Directive;
- (b)
- to fewer than 150, natural or legal persons (other than qualified investors as defined in the Prospectus Directive), subject to obtaining the prior consent of the relevant dealer or dealers nominated by us for any such offer; or
- (c)
- in any other circumstances falling within Article 3(2) of the Prospectus Directive,
provided that no such offer of shares referred to in (a) to (c) above shall require the Company or the relevant dealer or dealers nominated by the Company to publish a prospectus pursuant to Article 3 of the Prospectus Directive or a supplemental prospectus pursuant to Article 16 of the Prospectus Directive and each person who initially subscribes for any shares or to whom any offer is made will be deemed to have represented, warranted and agreed to and with the relevant dealer or dealers nominated by the Company and the Company that it is a qualified investor within the meaning of the law in that Member State implementing Article 2(1)(e) of the Prospectus Directive.
For the purposes of this provision, the expression an "offer of shares to the public" in relation to any shares in any Relevant Member State means the communication in any form and by any means of sufficient information on the terms of the offer and the shares to be offered so as to enable an investor to decide to purchase or subscribe the shares, as the same may be varied in that Member State by any measure implementing the Prospectus Directive in that Member State, and the expression "Prospectus Directive" means Directive 2003/71/EC (as amended, including by Directive 2010/73/EU), and includes any relevant implementing measure in the Relevant Member State.
147
The validity of the shares of common stock offered hereby will be passed upon for us by Fried, Frank, Harris, Shriver & Jacobson LLP, New York, New York. Fried, Frank, Harris, Shriver & Jacobson LLP owns an indirect interest in less than 1% of our common stock through limited partnership interests in funds associated with AEA. Debevoise & Plimpton LLP, New York, New York is acting as counsel to the underwriters.
The consolidated financial statements as of April 30, 2015 and 2014 (Successor) and for the fiscal year ended April 30, 2015 (Successor), for the period from April 1, 2014 to April 30, 2014 (Successor), for the period from May 1, 2013 to March 31, 2014 (Predecessor) and for the fiscal year ended April 30, 2013 (Predecessor), included in this prospectus, have been so included in reliance on the reports of PricewaterhouseCoopers LLP, an independent registered public accounting firm, given on their authority as experts in accounting and auditing.
WHERE YOU CAN FIND MORE INFORMATION
We have filed with the SEC a registration statement on Form S-1, including exhibits and schedules, under the Securities Act with respect to the common stock to be sold in this offering. As allowed by SEC rules, this prospectus, which constitutes a part of the registration statement, does not contain all of the information set forth in the registration statement or the exhibits and schedules that are part of the registration statement. For further information about us and our common stock, you should refer to the registration statement, including all amendments, supplements, schedules and exhibits thereto.
Statements contained in this prospectus regarding the contents of any contract or any other document that is filed as an exhibit to the registration statement are not necessarily complete, and each such statement is qualified in all respects by reference to the full text of such contract or other document filed as an exhibit to the registration statement.
You may read, without charge, and copy, at prescribed rates, all or any portion of the registration statement or any reports, statements or other information we file with or furnish to the SEC at the SEC's Public Reference Room at 100 F Street, N.E., Washington, DC 20549. You may also obtain copies of the documents at prescribed rates by writing to the Public Reference Section of the SEC. Please call the SEC at 1-800-SEC-0330 to obtain information on the operation of the Public Reference Room. In addition, the SEC maintains an internet site that contains reports, proxy and information statements, and other information regarding issuers that file electronically with the SEC. You can review the registration statement, as well as our future SEC filings, by accessing the SEC's website at www.sec.gov. You may also request copies of those documents, at no cost to you, by contacting us at the following address:
GMS Inc.
100 Crescent Centre Parkway, Suite 800
Tucker, Georgia 30084
Attention: Chief Financial Officer
(800) 392-4619
As a result of this offering, we will become subject to the information and reporting requirements of the Securities Exchange Act and will file annual, quarterly and current reports, proxy statements and other information with the SEC. You can request copies of these documents, for a copying fee, by writing to the SEC. We intend to furnish our stockholders with annual reports containing financial statements audited by our independent auditors.
148
GMS Inc.
INDEX TO CONSOLIDATED FINANCIAL STATEMENTS
| | Page | |
|---|---|---|
Reports of Independent Registered Public Accounting Firm | F-2 | |
Consolidated Financial Statements | ||
Consolidated Balance Sheets April 30, 2015 and 2014 | F-4 | |
Consolidated Statements of Operations and Comprehensive Income (Loss) Year Ended April 30, 2015, Period From April 1, 2014 to April 30, 2014 (Successor), Period From May 1, 2013 to March 31, 2014 (Predecessor), and Year Ended April 30, 2013 | F-5 | |
Consolidated Statements of Stockholders' Equity (Deficit) Year Ended April 30, 2015, Period From April 1, 2014 to April 30, 2014 (Successor), Period From May 1, 2013 to March 31, 2014 (Predecessor), and Year Ended April 30, 2013 | F-6 | |
Consolidated Statements of Cash Flows Year Ended April 30, 2015, Period From April 1, 2014 to April 30, 2014 (Successor), Period From May 1, 2013 to March 31, 2014 (Predecessor), and Year Ended April 30, 2013 | F-7 | |
Notes to Consolidated Financial Statements Year Ended April 30, 2015, Period From April 1, 2014 to April 30, 2014 (Successor), Period From May 1, 2013 to March 31, 2014 (Predecessor), and Year Ended April 30, 2013 | F-8 |
F-1
Report of Independent Registered Public Accounting Firm
To the Board of Directors and Stockholders of
GMS Inc.
In our opinion, the accompanying consolidated balance sheets as of April 30, 2015 and April 30, 2014 and the related consolidated statements of operations and comprehensive income (loss), of stockholders' equity (deficit) and of cash flows for the year ended April 30, 2015 and for the period from April 1, 2014 to April 30, 2014 present fairly, in all material respects, the financial position of GMS Inc. and its subsidiaries (Successor) as of April 30, 2015 and April 30, 2014 and the results of their operations and their cash flows for the year ended April 30, 2015 and for the period from April 1, 2014 to April 30, 2014 in conformity with accounting principles generally accepted in the United States of America. These financial statements are the responsibility of the Company's management. Our responsibility is to express an opinion on these financial statements based on our audits. We conducted our audits of these statements in accordance with the standards of the Public Company Accounting Oversight Board (United States). Those standards require that we plan and perform the audit to obtain reasonable assurance about whether the financial statements are free of material misstatement. An audit includes examining, on a test basis, evidence supporting the amounts and disclosures in the financial statements, assessing the accounting principles used and significant estimates made by management, and evaluating the overall financial statement presentation. We believe that our audits provide a reasonable basis for our opinion.
/s/ PricewaterhouseCoopers LLP
Atlanta, Georgia
July 28, 2015
F-2
Report of Independent Registered Public Accounting Firm
To the Board of Directors and Stockholders of
Gypsum Management and Supply, Inc.
In our opinion, the accompanying consolidated statements of operations and comprehensive income (loss), of stockholders' equity (deficit) and of cash flows for the period from May 1, 2013 to March 31, 2014 and for the year ended April 30, 2013 present fairly, in all material respects, the results of operations and cash flows of Gypsum Management and Supply, Inc. and its subsidiaries (Predecessor) for the period from May 1, 2013 to March 31, 2014 and for the year ended April 30, 2013 in conformity with accounting principles generally accepted in the United States of America. These financial statements are the responsibility of the Company's management. Our responsibility is to express an opinion on these financial statements based on our audits. We conducted our audits of these statements in accordance with the standards of the Public Company Accounting Oversight Board (United States). Those standards require that we plan and perform the audit to obtain reasonable assurance about whether the financial statements are free of material misstatement. An audit includes examining, on a test basis, evidence supporting the amounts and disclosures in the financial statements, assessing the accounting principles used and significant estimates made by management, and evaluating the overall financial statement presentation. We believe that our audits provide a reasonable basis for our opinion.
/s/ PricewaterhouseCoopers LLP
Atlanta, Georgia
July 28, 2015
F-3
GMS Inc.
Consolidated Balance Sheets
April 30, 2015 and 2014
(in thousands of dollars, except share data)
| | April 30, 2015 | April 30, 2014 | |||||
|---|---|---|---|---|---|---|---|
Assets | |||||||
Current assets: | |||||||
Cash and cash equivalents | $ | 12,284 | $ | 32,662 | |||
Trade accounts and notes receivable, net of allowances of $8,633 and $2,752, respectively | 214,321 | 188,612 | |||||
Inventories, net | 147,603 | 135,309 | |||||
Deferred income tax assets, net | 9,836 | 14,200 | |||||
Prepaid expenses and other current assets | 42,936 | 19,222 | |||||
| | | | | | | | |
Total current assets | 426,980 | 390,005 | |||||
| | | | | | | | |
Property and equipment, net | 158,824 | 173,211 | |||||
Goodwill | 342,411 | 320,736 | |||||
Intangible assets, net | 215,762 | 213,619 | |||||
Other assets | 10,599 | 24,780 | |||||
| | | | | | | | |
Total assets | $ | 1,154,576 | $ | 1,122,351 | |||
| | | | | | | | |
| | | | | | | | |
| | | | | | | | |
Liabilities and Stockholders' Equity | |||||||
Current liabilities: | |||||||
Accounts payable | $ | 77,834 | $ | 70,106 | |||
Accrued compensation and employee benefits | 48,069 | 35,829 | |||||
Other accrued expenses and current liabilities | 57,172 | 30,516 | |||||
Current portion of long-term debt | 6,759 | 6,085 | |||||
Revolving credit facility | 16,950 | — | |||||
| | | | | | | | |
Total current liabilities | 206,784 | 142,536 | |||||
| | | | | | | | |
Non-current liabilities: | |||||||
Long-term debt, less current portion | 533,275 | 532,700 | |||||
Deferred income taxes, net | 65,371 | 89,293 | |||||
Other liabilities | 23,222 | 28,674 | |||||
Liabilities to noncontrolling interest holders, less current portion | 28,452 | 29,714 | |||||
| | | | | | | | |
Total liabilities | 857,104 | 822,917 | |||||
| | | | | | | | |
Commitments and contingencies | |||||||
Stockholders' equity: | |||||||
Common stock, $0.01 par value, authorized 5,000,000 shares; 3,224,838 and 3,183,870 shares issued and outstanding at April 30, 2015 and 2014, respectively | 32 | 32 | |||||
Additional paid-in capital | 330,180 | 318,355 | |||||
Accumulated deficit | (32,750 | ) | (18,953 | ) | |||
Accumulated other comprehensive income | 10 | — | |||||
| | | | | | | | |
Total stockholders' equity | 297,472 | 299,434 | |||||
| | | | | | | | |
Total liabilities and stockholders' equity | $ | 1,154,576 | $ | 1,122,351 | |||
| | | | | | | | |
| | | | | | | | |
| | | | | | | | |
The accompanying notes are an integral part of these consolidated financial statements.
F-4
GMS Inc.
Consolidated Statements of Operations and Comprehensive Income (Loss)
Year Ended April 30, 2015, Period From April 1, 2014 to April 30, 2014 (Successor), Period From
May 1, 2013 to March 31, 2014 (Predecessor), and Year Ended April 30, 2013
(in thousands of dollars, except for share and per share data)
| | Successor | | Predecessor | ||||||||||||
|---|---|---|---|---|---|---|---|---|---|---|---|---|---|---|---|
| | Year Ended April 30, 2015 | April 1 - April 30, 2014 | | May 1, 2013 - March 31, 2014 | Year Ended April 30, 2013 | ||||||||||
| | | ||||||||||||||
| | | ||||||||||||||
Net sales | $ | 1,570,085 | $ | 127,332 | $ | 1,226,008 | $ | 1,161,610 | |||||||
Cost of sales (exclusive of depreciation and amortization shown separately below) | 1,091,114 | 97,955 | 853,020 | 824,331 | |||||||||||
| | | | | | | | | | | | | | | | |
Gross profit | 478,971 | 29,377 | 372,988 | 337,279 | |||||||||||
| | | | | | | | | | | | | | | | |
Operating expenses: | |||||||||||||||
Selling, general and administrative | 396,155 | 46,052 | 352,930 | 295,289 | |||||||||||
Depreciation and amortization | 64,165 | 6,336 | 12,253 | 11,627 | |||||||||||
| | | | | | | | | | | | | | | | |
Total operating expenses | 460,320 | 52,388 | 365,183 | 306,916 | |||||||||||
| | | | | | | | | | | | | | | | |
Operating income (loss) | 18,651 | (23,011 | ) | 7,805 | 30,363 | ||||||||||
Other (expense) income: | |||||||||||||||
Interest expense | (36,396 | ) | (2,954 | ) | (4,226 | ) | (4,413 | ) | |||||||
Change in fair value of financial instruments | (2,494 | ) | — | — | — | ||||||||||
Change in fair value of mandatorily redeemable common shares | — | — | (200,004 | ) | (198,212 | ) | |||||||||
Other income, net | 1,916 | 149 | 2,187 | 1,169 | |||||||||||
| | | | | | | | | | | | | | | | |
Total other (expense), net | (36,974 | ) | (2,805 | ) | (202,043 | ) | (201,456 | ) | |||||||
| | | | | | | | | | | | | | | | |
(Loss) before taxes | (18,323 | ) | (25,816 | ) | (194,238 | ) | (171,093 | ) | |||||||
(Benefit from) provision for income taxes | (4,526 | ) | (6,863 | ) | 6,623 | 11,534 | |||||||||
| | | | | | | | | | | | | | | | |
Net (loss) | $ | (13,797 | ) | $ | (18,953 | ) | $ | (200,861 | ) | $ | (182,627 | ) | |||
| | | | | | | | | | | | | | | | |
| | | | | | | | | | | | | | | | |
| | | | | | | | | | | | | | | | |
Weighted average shares outstanding: | |||||||||||||||
Basic and diluted | 3,194,566 | 3,183,870 | |||||||||||||
Basic and diluted (loss) earnings per share | $ | (4.32 | ) | $ | (5.95 | ) | |||||||||
| | | | | | | | | | | | | | | | |
| | | | | | | | | | | | | | | | |
| | | | | | | | | | | | | | | | |
Comprehensive (loss): | |||||||||||||||
Net (loss) | $ | (13,797 | ) | $ | (18,953 | ) | $ | (200,861 | ) | $ | (182,627 | ) | |||
Increase in fair value of financial instrument, net of tax | 10 | — | — | — | |||||||||||
| | | | | | | | | | | | | | | | |
Comprehensive (loss) | $ | (13,787 | ) | $ | (18,953 | ) | $ | (200,861 | ) | $ | (182,627 | ) | |||
| | | | | | | | | | | | | | | | |
| | | | | | | | | | | | | | | | |
| | | | | | | | | | | | | | | | |
The accompanying notes are an integral part of these consolidated financial statements.
F-5
GMS Inc.
Consolidated Statements of Stockholders' Equity (Deficit)
Year Ended April 30, 2015, Period From April 1, 2014 to April 30, 2014 (Successor),
Period From May 1, 2013 to March 31, 2014 (Predecessor), and Year Ended April 30, 2013
(in thousands of dollars, except share data)
| | Common Stock | | | Accumulated Other Comprehensive Income | | ||||||||||||||
|---|---|---|---|---|---|---|---|---|---|---|---|---|---|---|---|---|---|---|---|
| | Additional Paid-in Capital | Accumulated Deficit | Total Stockholders' Equity (Deficit) | ||||||||||||||||
| | Shares | Amount | |||||||||||||||||
Predecessor | |||||||||||||||||||
Balances at May 1, 2012 | — | $ | — | $ | — | $ | (84,630 | ) | $ | — | $ | (84,630 | ) | ||||||
Net (loss) | (182,627 | ) | — | (182,627 | ) | ||||||||||||||
Spin off of subsidiary | (7,589 | ) | — | (7,589 | ) | ||||||||||||||
| | | | | | | | | | | | | | | | | | | | |
Balances at April 30, 2013 | — | $ | — | $ | — | $ | (274,846 | ) | $ | — | $ | (274,846 | ) | ||||||
Net (loss) | (200,861 | ) | — | (200,861 | ) | ||||||||||||||
| | | | | | | | | | | | | | | | | | | | |
Balances at March 31, 2014 | — | $ | — | $ | — | $ | (475,707 | ) | $ | — | $ | (475,707 | ) | ||||||
| | | | | | | | | | | | | | | | | | | | |
| | | | | | | | | | | | | | | | | | | | |
| | | | | | | | | | | | | | | | | | | | |
| | | | | | | | | | | | | | | | | | | | |
Successor | |||||||||||||||||||
Balances at April 1, 2014 | — | $ | — | $ | — | $ | — | $ | — | $ | — | ||||||||
Capital contribution | 3,183,870 | 32 | 318,355 | — | — | 318,387 | |||||||||||||
Net (loss) | — | — | — | (18,953 | ) | — | (18,953 | ) | |||||||||||
| | | | | | | | | | | | | | | | | | | | |
Balances at April 30, 2014 | 3,183,870 | $ | 32 | $ | 318,355 | $ | (18,953 | ) | $ | — | $ | 299,434 | |||||||
Net (loss) | — | — | — | (13,797 | ) | — | (13,797 | ) | |||||||||||
Sales of common stock | 40,968 | — | 5,370 | — | — | 5,370 | |||||||||||||
Equity-based compensation | — | — | 6,455 | — | — | 6,455 | |||||||||||||
Increase in fair value of financial instrument, net of tax | — | — | — | — | 10 | 10 | |||||||||||||
| | | | | | | | | | | | | | | | | | | | |
Balances at April 30, 2015 | 3,224,838 | $ | 32 | $ | 330,180 | $ | (32,750 | ) | $ | 10 | $ | 297,472 | |||||||
| | | | | | | | | | | | | | | | | | | | |
| | | | | | | | | | | | | | | | | | | | |
| | | | | | | | | | | | | | | | | | | | |
The accompanying notes are an integral part of these consolidated financial statements.
F-6
GMS Inc.
Consolidated Statements of Cash Flows
Year Ended April 30, 2015, Period From April 1, 2014 to April 30, 2014 (Successor), Period From
May 1, 2013 to March 31, 2014 (Predecessor), and Year Ended April 30, 2013
(in thousands of dollars)
| | Successor | | Predecessor | ||||||||||||
|---|---|---|---|---|---|---|---|---|---|---|---|---|---|---|---|
| | Year Ended April 30, 2015 | April 1 - April 30, 2014 | | May 1, 2013 - March 31, 2014 | Year Ended April 30, 2013 | ||||||||||
| | | ||||||||||||||
| | | ||||||||||||||
Cash flows from operating activities: | |||||||||||||||
Net (loss) | $ | (13,797 | ) | $ | (18,953 | ) | $ | (200,861 | ) | $ | (182,627 | ) | |||
Adjustments to reconcile net (loss) to net cash provided by (used in) operating activities: | |||||||||||||||
Depreciation and amortization of property and equipment | 32,208 | 3,818 | 12,215 | 11,656 | |||||||||||
Accretion and amortization of debt discount and deferred financing fees | 3,374 | 275 | 516 | 563 | |||||||||||
Amortization of intangible assets | 31,957 | 2,518 | 38 | 72 | |||||||||||
Change in fair value of mandatorily redeemable common shares | — | — | 200,004 | 198,212 | |||||||||||
Provision for losses on accounts and notes receivable | (233 | ) | 856 | 1,262 | 2,067 | ||||||||||
Provision for obsolescence of inventory | 1,077 | — | — | — | |||||||||||
Equity-based compensation | 9,012 | 113 | 1,940 | 1,384 | |||||||||||
Loss (gain) on sales of assets | 916 | 170 | (1,762 | ) | (2,231 | ) | |||||||||
Loss (gain) on fair value of financial instruments | 2,494 | — | (208 | ) | 313 | ||||||||||
Deferred income tax (benefit) expense | (19,564 | ) | (6,893 | ) | (7,097 | ) | 41 | ||||||||
Loss on impairment of property and equipment | 173 | — | 728 | — | |||||||||||
Prepaid expenses and other assets | 1,989 | (7,138 | ) | (342 | ) | (6,986 | ) | ||||||||
Accrued compensation and employee benefits | 8,204 | 3,434 | 9,721 | 463 | |||||||||||
Other accrued expenses and liabilities | 9,170 | 7,561 | 47,612 | 9,846 | |||||||||||
Liabilities to noncontrolling interest holders | 1,862 | 40 | 737 | (1,356 | ) | ||||||||||
Income taxes | (905 | ) | (757 | ) | (850 | ) | 1,773 | ||||||||
| | | | | | | | | | | | | | | | |
| 67,937 | (14,956 | ) | 63,653 | 33,190 | |||||||||||
Changes in primary working capital components: | |||||||||||||||
Trade accounts and notes receivable | (11,649 | ) | (18,120 | ) | (9,640 | ) | (24,255 | ) | |||||||
Inventories | (4,610 | ) | 9,861 | (19,286 | ) | (5,630 | ) | ||||||||
Accounts payable | (3,655 | ) | 8,290 | 1,332 | 10,011 | ||||||||||
| | | | | | | | | | | | | | | | |
Cash provided by (used in) operating activities | 48,023 | (14,925 | ) | 36,059 | 13,316 | ||||||||||
| | | | | | | | | | | | | | | | |
Cash flows from investing activities: | |||||||||||||||
Purchases of property and equipment | (13,940 | ) | (434 | ) | (7,736 | ) | (16,923 | ) | |||||||
Proceeds from sale of assets | 3,807 | 161 | 4,411 | 2,502 | |||||||||||
Purchase of financial instruments | (4,638 | ) | — | — | — | ||||||||||
Acquisition of Gypsum Management and Supply, Inc., net of cash acquired | — | (703,027 | ) | — | — | ||||||||||
Acquisitions of businesses, net of cash acquired | (66,695 | ) | — | (5,046 | ) | — | |||||||||
| | | | | | | | | | | | | | | | |
Cash used in investing activities | (81,466 | ) | (703,300 | ) | (8,371 | ) | (14,421 | ) | |||||||
| | | | | | | | | | | | | | | | |
Cash flows from financing activities: | |||||||||||||||
Repayments on the revolving credit facility | (303,099 | ) | — | (531,918 | ) | (348,065 | ) | ||||||||
Borrowings from the revolving credit facility | 320,049 | — | 518,113 | 357,588 | |||||||||||
Proceeds from term loans | — | 546,450 | — | — | |||||||||||
Debt issuance costs | — | (19,359 | ) | — | — | ||||||||||
Payments of principal on long-term debt | (3,927 | ) | (11 | ) | (292 | ) | (1,416 | ) | |||||||
Principal repayments of capital lease obligations | (4,327 | ) | (301 | ) | (3,312 | ) | (2,794 | ) | |||||||
Proceeds from payments of stockholder notes | — | — | 463 | 62 | |||||||||||
Proceeds from sales of common stock | 5,370 | 224,108 | — | — | |||||||||||
Payments of contingent considerations | (1,001 | ) | — | — | — | ||||||||||
| | | | | | | | | | | | | | | | |
Cash provided by (used in) financing activities | 13,065 | 750,887 | (16,946 | ) | 5,375 | ||||||||||
| | | | | | | | | | | | | | | | |
(Decrease) increase in cash and cash equivalents | (20,378 | ) | 32,662 | 10,742 | 4,270 | ||||||||||
Balance, beginning of period | 32,662 | — | 13,383 | 9,113 | |||||||||||
| | | | | | | | | | | | | | | | |
Balance, end of period | $ | 12,284 | $ | 32,662 | $ | 24,125 | $ | 13,383 | |||||||
| | | | | | | | | | | | | | | | |
| | | | | | | | | | | | | | | | |
| | | | | | | | | | | | | | | | |
Supplemental cash flow disclosures: | |||||||||||||||
Cash paid for income taxes | $ | 16,111 | $ | 410 | $ | 15,018 | $ | 9,653 | |||||||
Cash paid for interest | 31,720 | 2,595 | 3,710 | 3,850 | |||||||||||
Supplemental schedule of noncash activities: | |||||||||||||||
Assets acquired under capital lease | $ | 5,211 | $ | 353 | $ | 3,880 | $ | 4,089 | |||||||
Issuance of installment notes associated with equity-based compensation liability awards | 1,644 | — | 795 | 3,829 | |||||||||||
Conversion of Predecessor interests | — | 94,247 | — | — | |||||||||||
Increase to other assets and decrease to property and equipment | 1,837 | — | — | 3,532 | |||||||||||
Non-cash property and equipment adjustments | 115 | — | (112 | ) | (564 | ) | |||||||||
Spin-off of subsidiary | — | — | — | (7,578 | ) | ||||||||||
Increase in insurance claims payable and insurance recoverable | 6,350 | — | — | 20,000 | |||||||||||
The accompanying notes are an integral part of these consolidated financial statements.
F-7
GMS Inc.
Notes to Consolidated Financial Statements
Year Ended April 30, 2015, Period From April 1, 2014 to April 30, 2014 (Successor),
Period From May 1, 2013 to March 31, 2014 (Predecessor), and Year Ended April 30, 2013
(in thousands of dollars, except for share and per share data)
1. Basis of Presentation, Business and Summary of Significant Accounting Policies
The terms "we," "our," "us", "Successor" or the "Company" refer to GMS Inc. and its subsidiaries. When such terms are used in this manner throughout the notes to the consolidated financial statements, they are in reference only to the corporation, GMS Inc. and its subsidiaries, and are not used in reference to the Board of Directors, corporate officers, management, or any individual employee or group of employees.
On April 1, 2014, GYP Holdings I Corp., or the Successor, acquired, through its wholly-owned entities, GYP Holdings II Corp. and GYP Holdings III Corp., all of the capital stock of Gypsum Management and Supply, Inc. (the "Predecessor"). Successor is majority owned by certain affiliates of AEA Investors LP, or "AEA", and certain of our other stockholders. We refer to this acquisition as the "Acquisition" and April 1, 2014 as the "Acquisition Date". We were previously known as GYP Holdings I Corp. and changed our name to GMS Inc. on July 6, 2015.
As a result of the Acquisition and resulting change in control and changes due to the impact of purchase accounting, we are required to present separately the operating results for the Predecessor periods ending on or prior to March 31, 2014 and the Successor periods beginning on or after April 1, 2014. References throughout the notes to "Successor 2015" relate to the fiscal year ended April 30, 2015, references throughout the notes to "Successor 2014" relate to the one month ended April 30, 2014, references throughout the notes to "Predecessor 2014" relate to the eleven months ended March 31, 2014 and references throughout the notes to "Predecessor 2013" relate to the fiscal year ended April 30, 2013. The results of the Successor are not comparable to the results of the Predecessor.
We have no independent operations and our only asset is our investment in the Predecessor.
Business
Founded in 1971, we are a distributor of specialty building products including wallboard, suspended ceilings systems, or ceilings, steel framing and other complementary specialty building products. We purchase products from a large number of manufacturers and then distribute these goods to a customer base consisting of wallboard and ceilings contractors and homebuilders, and to a lesser extent, general contractors and individuals. We have created a national footprint with more than 155 branches across 36 states.
Principles of Consolidation
The Consolidated Financial Statements present the results of operations, financial position and cash flows of the Company and its subsidiaries. All material intercompany balances and transactions have been eliminated. Results of operations of businesses acquired are included from their respective dates of acquisition.
Use of Estimates
The preparation of financial statements in conformity with accounting principles generally accepted in the United States of America ("GAAP") requires management to make estimates and assumptions that affect the reported amounts of assets and liabilities and disclosure of contingent assets and
F-8
GMS Inc.
Notes to Consolidated Financial Statements (Continued)
Year Ended April 30, 2015, Period From April 1, 2014 to April 30, 2014 (Successor),
Period From May 1, 2013 to March 31, 2014 (Predecessor), and Year Ended April 30, 2013
(in thousands of dollars, except for share and per share data)
1. Basis of Presentation, Business and Summary of Significant Accounting Policies (Continued)
liabilities at the date of the financial statements and the reported amounts of revenues and expenses during the reporting period. Actual results could differ from those estimates.
Revenue Recognition
We recognize revenue at the point of sale or upon delivery to the customer's site when the following four basic criteria are met:
- •
- persuasive evidence of an arrangement exists;
- •
- delivery has occurred or services have been rendered;
- •
- the price to the buyer is fixed or determinable; and
- •
- collectibility is reasonably assured.
Revenue, net of estimated returns and allowances, is recognized when sales transactions occur and title is passed, the related product is delivered, and includes any applicable shipping and handling costs invoiced to the customer. The expense related to such costs is included in "Selling, general and administrative" expenses in the accompanying Consolidated Statements of Operations and Comprehensive Income (Loss).
Cost of Sales
"Cost of sales" reflects the direct cost of goods purchased from third parties, rebates earned from vendors, adjustments for inventory reserves, and the cost of inbound freight.
Operating Expenses
"Operating expenses" include "Selling, general and administrative" expenses and "Depreciation and amortization". "Selling, general and administrative" expenses include expenses related to the delivery and warehousing of our products, as well as employee compensation and benefits expenses for employees in our branches and yard support center, as well as other administrative expenses, such as legal, accounting, and IT costs. The Company recorded delivery fees of $128,381, $9,727, $99,822, and $96,469 for Successor 2015, Successor 2014, Predecessor 2014, and Predecessor 2013, respectively. "Depreciation and amortization" expenses include depreciation expense on our property and equipment as well as amortization expense on our finite lived intangible assets.
Cash and Cash Equivalents
The Company considers all highly liquid investments with a maturity of three months or less when purchased to be cash equivalents. The carrying values of cash and cash equivalents approximate their fair values due to the short-term nature of these investments.
Trade Accounts Receivable
We maintain allowances for doubtful accounts for estimated losses due to the failure of our customers to make required payments, as well as allowances for sales returns and cash discounts.
F-9
GMS Inc.
Notes to Consolidated Financial Statements (Continued)
Year Ended April 30, 2015, Period From April 1, 2014 to April 30, 2014 (Successor),
Period From May 1, 2013 to March 31, 2014 (Predecessor), and Year Ended April 30, 2013
(in thousands of dollars, except for share and per share data)
1. Basis of Presentation, Business and Summary of Significant Accounting Policies (Continued)
Our estimate of the allowance for doubtful accounts is based on an assessment of individual past due accounts, historical write-off experience, accounts receivable aging, customer disputes and the business environment. Account balances are written off when the potential for recovery is considered remote. Our estimates for cash discounts and returns are based on an analysis of historical writeoffs. Based on our evaluation, we have established estimated reserves for uncollectible accounts, returns and cash discounts of $8,633 and $2,752 as of April 30, 2015 and 2014, respectively.
Inventories
"Inventories, net" consist of materials purchased for resale, and include wallboard, ceilings, steel framing and other specialty building products. The cost of our inventories is determined by the moving average cost method, which approximates the first-in, first-out approach. We monitor our inventory levels by branch and record provisions for excess inventories based on slower moving inventory. We define excess inventory as the amount of inventory on hand in excess of the historical usage, excluding items purchased in the last 12 months. We then review our most recent history of sales and adjustments of such excess inventory and apply our judgment as to forecasted demand and other factors, including liquidation value, to determine the required adjustments to net realizable value. In addition, at the end of each year, we evaluate our inventory at each branch and write off and dispose of obsolete products. Our inventories are generally not susceptible to technological obsolescence.
Vendor Rebates
Typical arrangements with our vendors provide for us to receive a rebate of a specified amount after we achieve any of a number of measures generally related to the volume of our purchases over a period of time. We reserve these rebates to effectively reduce our cost of sales in the period in which we sell the product. Throughout the year, we estimate the amount of rebates receivable for the periodic programs based upon the expected level of purchases. We accrue for the receipt of vendor rebates based on purchases and also reduce inventory to reflect the deferral of cost of sales.
Property and Equipment
"Property and equipment, net" is recorded at cost. Buildings, furniture, fixtures and equipment are depreciated using the straight-line method over the estimated useful lives of the assets. Expenditures for improvements and betterments, which extend the useful lives of assets, are capitalized while maintenance and repairs are charged to expense as incurred. Property and equipment obtained through acquisition are stated at estimated fair market value as of the acquisition date, and are depreciated over their estimated remaining useful lives. Gains and losses related to the sale of property and equipment are recorded as "Selling, general and administrative" expenses.
F-10
GMS Inc.
Notes to Consolidated Financial Statements (Continued)
Year Ended April 30, 2015, Period From April 1, 2014 to April 30, 2014 (Successor),
Period From May 1, 2013 to March 31, 2014 (Predecessor), and Year Ended April 30, 2013
(in thousands of dollars, except for share and per share data)
1. Basis of Presentation, Business and Summary of Significant Accounting Policies (Continued)
In the Successor and Predecessor periods, property and equipment is depreciated and amortized using the following estimated useful lives:
| | Life (years) | |
|---|---|---|
Buildings | 25 - 39 | |
Leasehold improvements | 1 - 15 | |
Furniture, fixtures, and automobiles | 3 - 5 | |
Warehouse and delivery equipment | 4 - 5 | |
Assets held under capital lease | 2 - 11 |
Leased property and equipment meeting capital lease criteria are capitalized at the lower of the present value of the related lease payments or the fair value of the leased asset at the inception of the lease. Leasehold improvements and assets under capital leases are amortized using the straight-line method over the shorter of their estimated useful lives or the initial term of the related lease.
Long-lived assets to be held and used are reviewed for impairment whenever facts and circumstances indicate that the carrying amount of an asset may not be recoverable. For impairment testing of long-lived assets, we identify asset groups at the lowest level for which identifiable cash flows are largely independent of the cash flows for other groups of assets and liabilities. Recoverability of assets to be held and used is measured by a comparison of the carrying amount of an asset to estimated undiscounted future cash flows expected to be generated by the assets. If the carrying amount of an asset exceeds its estimated future cash flows, an impairment charge is recognized by the amount by which the carrying amount of the asset exceeds the estimated fair value of the asset.
Assets are classified as held for sale if the Company commits to a plan to sell the asset within one year and actively markets the asset in its current condition for a price that is reasonable in comparison to its estimated fair value. Assets held for sale are stated at lower of depreciated cost or estimated fair value less expected disposition costs and recorded within "Prepaid expenses and other current assets".
During Successor 2015 and Predecessor 2014, the Company recognized impairment losses of $173 and $728, respectively, related to land and buildings held for sale. These losses were included in "Selling, general and administrative" expenses in the Consolidated Statements of Operations and Comprehensive Income (Loss) in Successor 2015 and Predecessor 2014. The Company did not recognize any impairments in Successor 2014.
Goodwill
Goodwill represents the excess of purchase price over fair value of net assets acquired. We do not amortize goodwill, but do assess the recoverability of goodwill in the fourth quarter of each fiscal year or whenever events or circumstances indicate that it is "more likely than not" that the fair value of a reporting unit had dropped below its carrying value. For the fiscal 2015, full year 2014 and fiscal 2013 annual impairment tests, the fair values of our identified reporting units were estimated using a discounted cash flow ("DCF") analysis and a market comparable method, with each method being
F-11
GMS Inc.
Notes to Consolidated Financial Statements (Continued)
Year Ended April 30, 2015, Period From April 1, 2014 to April 30, 2014 (Successor),
Period From May 1, 2013 to March 31, 2014 (Predecessor), and Year Ended April 30, 2013
(in thousands of dollars, except for share and per share data)
1. Basis of Presentation, Business and Summary of Significant Accounting Policies (Continued)
equally weighted in the calculation. There were no goodwill impairment charges recorded. See Note 6, Goodwill and Intangible Assets, for a complete description of the Company's goodwill.
Intangible Assets
The Company typically uses an income method to estimate the fair value of "Intangible assets", which is based on forecasts of the expected future cash flows attributable to the respective assets. Significant estimates and assumptions inherent in the valuations reflect a consideration of other marketplace participants and include the amount and timing of future cash flows (including expected growth rates and profitability), the underlying product or technology life cycles, the economic barriers to entry and the discount rate applied to the cash flows. Unanticipated market or macroeconomic events and circumstances may occur that could affect the accuracy or validity of the estimates and assumptions.
Determining the useful life of an intangible asset also requires judgment. Certain intangibles are expected to have indefinite lives based on their history and the Company's plans to continue to support and build the acquired brands. Other acquired intangible assets such as customer relationships and other brand or trade names are expected to have definite useful lives. All of the Company's customer-related intangibles are expected to have determinable useful lives. The costs of determinable-lived intangibles are amortized over their estimated lives.
Deferred Financing Costs
The Company capitalizes debt issuance costs and amortizes them over the term of the related debt. The Company uses the straight-line method to amortize debt issuance costs related to the ABL Facility (as defined below) while the effective interest method is used to amortize debt issuance costs related to the Term Loan Facilities (as defined below). Amortization of debt issuance costs is recorded in "Interest expense" within the Consolidated Statements of Operations and Comprehensive Income (Loss). Lender and third party deferred financing costs are reported as a reduction of the Term Loan Facilities of $13,311 and $15,473 as of April 30, 2015 and 2014, respectively, in the Consolidated Balance Sheets. Lender and third party deferred financing costs related to the ABL Facility are reported as an asset of $2,949 and $3,675 as of April 30, 2015 and 2014, respectively, in the Consolidated Balance Sheets. Amortization of these costs was $2,907, $235, $516, and $563 in Successor 2015, Successor 2014, Predecessor 2014, and Predecessor 2013, respectively.
Derivative Instruments
The FASB issued ASC 815 "Derivatives and hedging" which establishes accounting and reporting standards for derivative instruments. ASC 815 requires an entity to recognize all derivatives as either assets or liabilities and measure those instruments at fair value. Derivatives that do not qualify as a hedge must be adjusted to fair value in earnings. If the derivative does qualify as a hedge under ASC 815, changes in the fair value will either be offset against the change in fair value of the hedged assets, liabilities or firm commitments or recognized in accumulated other comprehensive income until the hedged item is recognized in earnings. The ineffective portion of a hedge's change in fair value will be immediately recognized in earnings.
F-12
GMS Inc.
Notes to Consolidated Financial Statements (Continued)
Year Ended April 30, 2015, Period From April 1, 2014 to April 30, 2014 (Successor),
Period From May 1, 2013 to March 31, 2014 (Predecessor), and Year Ended April 30, 2013
(in thousands of dollars, except for share and per share data)
1. Basis of Presentation, Business and Summary of Significant Accounting Policies (Continued)
We enter into interest rate derivative agreements, commonly referred to as caps or swaps, with the objective of minimizing the risks and costs associated with financing activities, as well as to maintain an appropriate mix of fixed-and floating-rate debt. These agreements are contracts to exchange variable-rate for fixed-interest rate payments over the life of the agreements.
For derivative instruments designated as hedges per ASC 815, we record the effective portions of changes in their fair value, net of taxes, in "Comprehensive (loss) income" to the extent the derivative is considered perfectly effective in achieving offsetting changes in fair value or cash flows attributable to the risk being hedged, until the hedged item is recognized in earnings (commonly referred to as the "hedge accounting" method).
The effectiveness of the hedges is periodically assessed by management during the lives of the hedges by: 1) comparing the current terms of the hedges with the related hedged debt to assure they continue to coincide and 2) evaluating the ability of the counterparties to the hedges to honor their obligations under the hedges. Any ineffective portions of the hedges are recognized in earnings through interest expense, financing costs and other expenses.
During the year ended April 30, 2015, we elected to designate a derivative instrument as a cash flow hedge in accordance with ASC 815. This instrument is a an interest rate cap on quarterly resetting 3-month LIBOR, based on a strike rate of 2.0% and payable quarterly. This instrument effectively caps the interest rate at 5.75% on an initial notional amount of $275,000 of our variable rate debt obligation under the 2014 facilities, or any replacement facility with similar terms. The interest rate cap was purchased for $4,638 on October 31, 2014, designated as a hedge on January 31, 2015, and expires on October 31, 2018.
This derivative instrument is recorded in the Consolidated Balance Sheet as of April 30, 2015 as an asset at its fair value of $2,160 within "Other assets". The valuation of this instrument was determined using widely accepted valuation techniques including a discounted cash flow analysis on the expected cash flows of the derivative. This analysis reflected the contractual terms of the derivatives, including the period to maturity, and used observable market-based inputs, including interest rate curves and implied volatilities.
The decrease in fair value of the instrument from the purchase date to the date of hedge designation was $2,494 and is reflected in earnings through "Change in fair value of financial instruments" on the Consolidated Statements of Operations and Comprehensive Income (Loss). The increase in fair value from the effective hedge date to the year ended April 30, 2015 was $10 and was recorded in "Increase in fair value of financial instruments" in "Comprehensive (loss) income". The Company believes there have been no material changes in the creditworthiness of the counterparty to this cap agreement and believes the risk of nonperformance by such party is minimal.
We consider the interest rate cap to be a Level 2 fair value measurement for which market-based pricing inputs are observable. Generally, we obtain our Level 2 pricing inputs from our counterparties. Substantially all of these assumptions are observable in the marketplace throughout the full term of the instrument, can be derived from observable data or are supported by observable levels at which transactions are executed in the marketplace.
F-13
GMS Inc.
Notes to Consolidated Financial Statements (Continued)
Year Ended April 30, 2015, Period From April 1, 2014 to April 30, 2014 (Successor),
Period From May 1, 2013 to March 31, 2014 (Predecessor), and Year Ended April 30, 2013
(in thousands of dollars, except for share and per share data)
1. Basis of Presentation, Business and Summary of Significant Accounting Policies (Continued)
For derivatives that do not qualify or are not designated as hedging instruments for accounting purposes, changes in fair value are recorded in current period earnings (commonly referred to as the "mark-to-market" method). During Predecessor 2013, the Company entered into an interest-rate swap agreement as a fixed-rate payor to mitigate interest-rate risk associated with floating interest rate borrowings under the ABL Facility on an initial notional amount of $35,000. Per the terms of the contract, the Predecessor received fixed interest of 0.69 percent in exchange for floating interest indexed to the one-month LIBOR rate. Changes in fair value resulted in a gain of $208 for Predecessor 2014 and a loss of $313 in Predecessor 2013. These gains and losses are recognized in the Consolidated Statements of Operations and Comprehensive Income (Loss), in "Other income, net". At April 30, 2013, the fair value of the interest rate swap reported on the Consolidated Balance Sheets in "Other liabilities" was $313. The interest rate swap was terminated in Predecessor 2014 with a penalty of $105 and interest of $16 and is recorded in "Other income, net" in the Consolidated Statements of Operations and Comprehensive Income (Loss). We consider the interest rate swap to be a Level 2 fair value measurement for which market-based pricing inputs are observable.
Insurance Liabilities
The Company is self-insured for certain losses related to medical claims. The Company has deductible-based insurance policies for certain losses related to general liability, automobile and workers' compensation. The deductible amount is $500. The Company has stop-loss coverage to limit the exposure arising from claims. The coverage consists of a primary layer and an excess layer. The primary layer of coverage is from $500 to $2,000 and the excess layer covers claims from $2,000 to $100,000. The expected ultimate cost for claims incurred as of the balance sheet date is not discounted and is recognized as a liability. Insurance losses for claims filed and claims incurred but not reported are accrued based upon estimates of the aggregate liability for uninsured claims using loss development factors and actuarial assumptions followed in the insurance industry and historical loss development experience.
At April 30, 2015 and 2014, the aggregate liabilities for medical self-insurance were $2,468 and $1,916, respectively, and are recorded in "Other liabilities" within the Consolidated Balance Sheets. At April 30, 2015 and 2014, reserves for general liability, automobile and workers' compensation totaled approximately $36,808 and $31,224 respectively, and are recorded in "Other accrued expenses and current liabilities" and "Other liabilities" in the Consolidated Balance Sheets, the majority of which relate to an insured automobile claim, subject to a $500 deductible. In fiscal 2015, the claim was settled by our insurance carrier in the amount of approximately $26,300 and was paid by our insurance carrier in full, subject to the deductible, subsequent to the April 30, 2015 balance sheet date. At April 30, 2015 and 2014, recoveries for general liability, automobile and workers' compensation, totaled approximately $30,714 and $25,460, respectively and are recorded in "Prepaid expenses and other current assets" and "Other assets" in the Consolidated Balance Sheets.
Income Taxes
Income taxes are accounted for in accordance with ASC 740 "Income Taxes," which requires the use of the asset and liability method. Deferred tax assets and liabilities are recognized based on the
F-14
GMS Inc.
Notes to Consolidated Financial Statements (Continued)
Year Ended April 30, 2015, Period From April 1, 2014 to April 30, 2014 (Successor),
Period From May 1, 2013 to March 31, 2014 (Predecessor), and Year Ended April 30, 2013
(in thousands of dollars, except for share and per share data)
1. Basis of Presentation, Business and Summary of Significant Accounting Policies (Continued)
difference between the financial statement carrying amounts of existing assets and liabilities and their respective tax bases. Inherent in the measurement of deferred balances are certain judgments and interpretations of existing tax law and published guidance as applicable to our operations.
We evaluate our deferred tax assets to determine if valuation allowances are required. In assessing the realizability of deferred tax assets, we consider both positive and negative evidence in determining whether it is more likely than not that some portion or all of the deferred tax assets will not be realized. The primary negative evidence considered includes the cumulative operating losses generated in prior periods. The primary positive evidence considered includes the reversal of deferred tax liabilities related to depreciation and amortization that would occur within the same jurisdiction and during the carry-forward period necessary to absorb the federal and state net operating losses and other deferred tax assets. The reversal of such liabilities would utilize the federal and state net operating losses and other deferred tax assets.
We record amounts for uncertain tax positions that management believes are supportable, but are potentially subject to successful challenge by the applicable taxing authority. Consequently, changes in our assumptions and judgments could materially affect amounts recognized related to income tax uncertainties and may affect our results of operations or financial position. We believe our assumptions for estimates are reasonable, although actual results may have a positive or negative material impact on the balances of such tax positions. Historically, the variation of estimates to actual results is not significant and material variation is not expected in the future.
Credit and Economic Risk
The Company's sources of liquidity have been and are expected to be cash from operating activities, available cash balances and the ABL Facility and the Term Loan Facilities. Financial instruments that potentially subject the Company to significant concentrations of credit risk consist principally of cash and cash equivalents and trade accounts and notes receivable. The Company assesses the credit standing of counterparties as considered necessary. The Company routinely assesses the financial strength of its customers and generally does not require collateral. Concentrations of credit risk with respect to trade accounts receivable are limited due to the large number of entities comprising the Company's customer base. The Company provides for doubtful accounts based on historical experience and when current conditions indicate that collection is doubtful. Accounts are written off when deemed uncollectible. In certain situations, the Company provides the customer with the right of product return; we have established a reserve for returns based on historic returns. The Company does not enter into financial instruments for trading or speculative purposes.
The Company purchases a majority of its inventories from a select group of vendors. Without these vendors, the Company's ability to acquire inventory would be significantly impaired.
Fair Value of Financial Instruments
Fair value is the price that would be received to sell an asset or paid to transfer a liability in the principal or most advantageous market in an orderly transaction between market participants on the measurement date. The carrying values of cash and cash equivalents, receivables, accounts payable,
F-15
GMS Inc.
Notes to Consolidated Financial Statements (Continued)
Year Ended April 30, 2015, Period From April 1, 2014 to April 30, 2014 (Successor),
Period From May 1, 2013 to March 31, 2014 (Predecessor), and Year Ended April 30, 2013
(in thousands of dollars, except for share and per share data)
1. Basis of Presentation, Business and Summary of Significant Accounting Policies (Continued)
other current liabilities and accrued interest approximates fair value due to its short-term nature. Based on borrowing rates available to the Company for loans with similar terms, the carrying values of the ABL Facility and other debt approximates fair value. The Term Loan Facilities approximates fair value as the debt was issued on the Acquisition Date and interest rates have not changed significantly.
Accounting guidance establishes a three-level hierarchy, which requires an entity to maximize the use of observable inputs and minimize the use of unobservable inputs when measuring fair value. The valuation hierarchy is based upon the transparency of inputs to the valuation of an asset or liability on the measurement date. The three levels are defined as follows:
| Level 1 | Inputs to the valuation methodology are quoted prices (unadjusted) for an identical asset or liability in an active market. | |
| Level 2 | Inputs to the valuation methodology include quoted prices for a similar asset or liability in an active market or model-derived valuations in which all significant inputs are observable for substantially the full term of the asset or liability. | |
| Level 3 | Inputs to the valuation methodology are unobservable and significant to the fair value measurement of the asset or liability. |
Advertising Expense
The cost of advertising is expensed as incurred and presented within "Selling, general and administrative" expenses in the Consolidated Statements of Operations and Comprehensive Income (Loss). The Company incurred approximately $1,805, $114, $1,282, and $1,249 in advertising costs in Successor 2015, Successor 2014, Predecessor 2014, and Predecessor 2013, respectively.
Equity-Based Compensation
We account for stock options granted to employees and directors by recording compensation expense based on the award's fair value, estimated on the date of grant using the Black-Scholes option-pricing model. Equity-based compensation expense is recognized on a schedule that approximates the graded vesting of the awards.
Determining the fair value of stock options under the Black-Scholes option-pricing model requires judgment, including estimating the fair value per share of our common stock, volatility, expected term of the awards, dividend yield and risk-free interest rate. The assumptions used in calculating the fair value of stock options represent our best estimates, based on management's judgment and subjective future expectations. These estimates involve inherent uncertainties. If any of the assumptions used in the model change significantly, share-based compensation recorded for future awards may differ materially from that recorded for awards granted previously.
We estimate potential forfeitures of stock options and adjust share-based compensation expense accordingly. The estimate of forfeitures is adjusted over the requisite service period to the extent that actual forfeitures differ from prior estimates. We estimate forfeitures based upon our historical experience with employee turnover, and, at each period, review the estimated forfeiture rate and make changes as factors affecting the forfeiture rate calculations and assumptions changes.
F-16
GMS Inc.
Notes to Consolidated Financial Statements (Continued)
Year Ended April 30, 2015, Period From April 1, 2014 to April 30, 2014 (Successor),
Period From May 1, 2013 to March 31, 2014 (Predecessor), and Year Ended April 30, 2013
(in thousands of dollars, except for share and per share data)
1. Basis of Presentation, Business and Summary of Significant Accounting Policies (Continued)
Stock Appreciation Rights, Deferred Compensation and Liabilities to Noncontrolling Interest Holders
Certain subsidiaries have equity based compensation agreements with the subsidiary's employees and minority shareholders. These agreements are stock appreciation rights, deferred compensation agreements, and liabilities to noncontrolling interest holders. Since these agreements are typically settled in cash or notes, and do not meet the criteria established by ASC 718, "Compensation—Stock Compensation" to be accounted for in "Stockholders' equity", they are accounted for as liability awards. See Note 15.
Net (Loss) Earnings Per Share
Basic (loss) earnings per share is computed by dividing net (loss) income by the weighted-average number of outstanding common shares for the period. Diluted (loss) earnings per share reflects the potential dilution that could occur if instruments that may require the issuance of common shares in the future were settled and the underlying common shares were issued. Diluted (loss) earnings per share is computed by increasing the weighted-average number of outstanding common shares computed in basic (loss) earnings per share to include the dilutive effect of stock options and other equity-based instruments held by the Company's employees and directors during each period. In periods of net loss, the number of shares used to calculate diluted earnings per share is the same as basic earnings per share.
Diluted net (loss) earnings per common share equals basic (net) loss earnings per common share for the Successor 2015 and Successor 2014 periods, as the effect of stock options and other equity-based instruments (collectively "stock-based compensation securities") are anti-dilutive because the Company incurred losses from continuing operations in those periods. During Successor 2015 and Successor 2014, stock-based compensation securities were excluded from the calculation of diluted (loss) earnings per share because their effect would have been anti-dilutive.
Recent Accounting Pronouncements
Presentation of an unrecognized tax benefit—In July 2013, the Financial Accounting Standards Board ("FASB") issued Accounting Standards Update ("ASU") No. 2013-11, "Presentation of an Unrecognized Tax Benefit When a Net Operating Loss Carry-forward, a Similar Tax Loss, or a Tax Credit Carry-forward Exists" ("ASU 2013-11"), which resolves diversity in practice on the financial statement presentation of an unrecognized tax benefit when a net operating loss carry-forward, a similar tax loss, or a tax credit carry-forward exists. An unrecognized tax benefit, or a portion of an unrecognized tax benefit, should be presented in the financial statements as a reduction to a deferred tax asset for a net operating loss carry-forward, a similar tax loss, or a tax credit carryforward, except in certain situations, as defined in ASU 2013-11. The amendments in ASU 2013-11 are effective prospectively for fiscal years, and interim periods within those years, beginning after December 15, 2013. The Company adopted ASU 2013-11 on May 1, 2014. The adoption of this standard did not materially impact the Company's financial position, results of operations, or cash flows.
Discontinued operations—In April 2014, the FASB issued ASU No. 2014-08, "Reporting Discontinued Operations and Disclosure of Disposals of Components of an Entity" ("ASU 2014-08"). The amended guidance requires that a disposal representing a strategic shift that has (or will have) a
F-17
GMS Inc.
Notes to Consolidated Financial Statements (Continued)
Year Ended April 30, 2015, Period From April 1, 2014 to April 30, 2014 (Successor),
Period From May 1, 2013 to March 31, 2014 (Predecessor), and Year Ended April 30, 2013
(in thousands of dollars, except for share and per share data)
1. Basis of Presentation, Business and Summary of Significant Accounting Policies (Continued)
major effect on an entity's financial results or a business activity classified as held for sale should be reported as discontinued operations. The amendments also expand the disclosure requirements for discontinued operations and add new disclosures for individually significant dispositions that do not qualify as discontinued operations. The amendments are effective prospectively for fiscal years, and interim reporting periods within those years, beginning on or after December 15, 2014 (early adoption is permitted only for disposals that have not been previously reported). The impact on the Company of adopting ASU 2014-08 will depend on the nature and size of future disposals, if any, of a component of the Company after the effective date. The Company has elected to early adopt ASU2014-08 effective May 1, 2014. As a result of the adoption of this standard, the classification of a disposal made in fiscal 2015 that did not represent a strategic shift in the Company's direction or have a major impact on the Company's financial position or results of operations was not reported as a discontinued operation.
Revenue recognition—In May 2014, the FASB issued ASU No. 2014-09, "Revenue from Contracts with Customers" ("ASU 2014-09"). The amended guidance outlines a single comprehensive revenue model for entities to use in accounting for revenue arising from contracts with customers. The guidance supersedes most current revenue recognition guidance, including industry-specific guidance. The core principle of the revenue model is that "an entity recognizes revenue to depict the transfer of promised goods or services to customers in an amount that reflects the consideration to which the entity expects to be entitled in exchange for those goods or services." Entities have the option of using either a full retrospective or modified approach to adopt the guidance. ASU 2014-09 is effective for fiscal years, and interim reporting periods within those years, beginning after December 15, 2017 (early adoption is not permitted). The Company is currently evaluating the impact of adopting ASU 2014-09.
Going Concern—In August 2014 the FASB issued ASU 2014-15, "Disclosure of Uncertainties about an Entity's Ability to Continue as a Going Concern", which requires management to evaluate whether there are conditions or events that raise substantial doubt about an organization's ability to continue as a going concern and to provide related footnote disclosures. ASU 2014-15 is effective for interim and annual reporting periods beginning after December 15, 2016. Early adoption is permitted. The Company is currently evaluating the impact the adoption of this ASU will have on its Consolidated Financial Statements.
Debt Issuance Costs—In April 2015, the FASB issued ASU 2015-03, "Simplifying the Presentation of Debt Issuance Costs," which changes the presentation of debt issuance costs in financial statements. Under the ASU, an entity presents such costs in the balance sheet as a direct deduction from the related debt liability rather than as an asset. Amortization of the costs is reported as interest expense. The guidance is effective prospectively for fiscal years, and interim reporting periods within those years, beginning on or after December 15, 2015. Early adoption is permitted and upon adoption, the guidance must be applied retroactively to all periods presented in the financial statements. Management has elected early adoption of the standard and retroactively applied to all periods presented in the financial statements.
2. Acquisition of Gypsum Management and Supply, Inc.
On the Acquisition Date, the Company acquired all of the outstanding common shares of Gypsum Management and Supply, Inc. (Predecessor) for a purchase price of $821,045. The Acquisition has been
F-18
GMS Inc.
Notes to Consolidated Financial Statements (Continued)
Year Ended April 30, 2015, Period From April 1, 2014 to April 30, 2014 (Successor),
Period From May 1, 2013 to March 31, 2014 (Predecessor), and Year Ended April 30, 2013
(in thousands of dollars, except for share and per share data)
2. Acquisition of Gypsum Management and Supply, Inc. (Continued)
accounted for using the acquisition method of accounting, in accordance with ASC 805, "Business Combinations," which requires that assets acquired and liabilities assumed be recognized at their fair values as of the acquisition date. The consideration transferred was funded with approximately $224,000 cash from AEA and co-investors, approximately $503,000 from the Term Loan Facilities and $94,279 of interests that rolled over from certain members of Predecessor management and noncontrolling interest holders. The table below summarizes the consideration transferred to acquire Gypsum Management and Supply, Inc. which includes cash and certain noncontrolling interests in subsidiaries of Gypsum Management and Supply, Inc.:
Consideration Transferred
Cash consideration and issuance of debt | $ | 726,766 | ||
Conversion of Predecessor interests | 94,279 | |||
| | | | | |
Total consideration | $ | 821,045 | ||
| | | | | |
| | | | | |
| | | | | |
The identified assets acquired and liabilities assumed based on their estimated fair value at the Acquisition Date are as follows:
| | Final purchase price allocation | |||
|---|---|---|---|---|
Cash and cash equivalents | $ | 23,740 | ||
Trade accounts and notes receivable | 169,867 | |||
Inventories | 146,044 | |||
Prepaid expenses and other current assets | 18,200 | |||
Intangible assets | 216,182 | |||
Property and equipment | 176,623 | |||
Other assets | 19,541 | |||
Current portion of long-term debt | (2,185 | ) | ||
Accounts payable | (62,116 | ) | ||
Accrued compensation and employee benefits | (41,357 | ) | ||
Other accrued expenses and current liabilities | (15,399 | ) | ||
Deferred income tax liabilities | (81,987 | ) | ||
Long-term debt, less current portion | (5,583 | ) | ||
Other liabilities | (31,588 | ) | ||
Liabilities to noncontrolling interest holders | (29,673 | ) | ||
| | | | | |
Total identifiable net assets | $ | 500,309 | ||
| | | | | |
| | | | | |
| | | | | |
Goodwill | $ | 320,736 | ||
| | | | | |
The Company acquired intangible assets of $216,182. See Note 6 to the Consolidated Financial Statements for the summary of the fair value estimates of the identifiable intangible assets and their useful lives.
The $320,736 of goodwill represents the cost in excess of fair value of net assets acquired and is attributable to the entrepreneurial culture and leading market position of Predecessor and the expected
F-19
GMS Inc.
Notes to Consolidated Financial Statements (Continued)
Year Ended April 30, 2015, Period From April 1, 2014 to April 30, 2014 (Successor),
Period From May 1, 2013 to March 31, 2014 (Predecessor), and Year Ended April 30, 2013
(in thousands of dollars, except for share and per share data)
2. Acquisition of Gypsum Management and Supply, Inc. (Continued)
significant growth of the business. The fair value was determined based on market participant assumptions using common valuation techniques. The goodwill is not deductible for income tax purposes.
The Company incurred Acquisition-related costs of $68,801, of which $837, $16,155 and $51,809 were incurred in Successor 2015, Successor 2014 and Predecessor 2014, respectively, and are included in "Selling, general and administrative" expenses in the Consolidated Statements of Operations and Comprehensive Income (Loss).
3. Business Acquisitions
The Company operates in a highly fragmented industry. A key component of the Company's strategy is growth through acquisition that expands its geographic coverage, provides complementary lines of business and increases its market share.
The Company has accounted for all business combinations using the purchase method, in accordance with ASC 805, to record a new cost basis for the assets acquired and liabilities assumed. The Company recorded, based on a preliminary purchase price allocation, intangible assets representing client relationships, tradenames, and excess of purchase price over the estimated fair value of the tangible assets acquired and liabilities assumed as "Goodwill" in the accompanying Consolidated Financial Statements. The goodwill is attributable to synergies achieved through the streamlining of operations combined with improved margins attainable through increased market presence. The results of operations are reflected in the Consolidated Financial Statements of the Company from the date of acquisition.
- (a)
- 2015 Acquisitions
In fiscal 2015, the Company completed the following acquisitions, with an aggregate purchase price of $73,394, comprised of $66,709 net cash consideration and $6,685 of contingent consideration. In connection with these acquisitions, the Company incurred transaction costs of $945 in the year ended April 30, 2015. This is included in "Selling, general and administrative" expenses in the Company's accompanying Consolidated Statements of Operations and Comprehensive Income (Loss). The purpose of these acquisitions was to expand the geographical coverage of the Company and grow the business. These acquisitions increased net sales by $44,380 and operating income by $967 for the year ended April 30, 2015.
Company name | Form of acquisition | Date of acquisition | ||
|---|---|---|---|---|
| Contractors' Choice Supply, Inc. | Purchase of net assets | August 1, 2014 | ||
| Drywall Supply, Inc. | Purchase of net assets | October 1, 2014 | ||
| Allsouth Drywall Supply Company | Purchase of net assets | November 24, 2014 | ||
| Serrano Supply, Inc. | Purchase of net assets | February 2, 2015 | ||
| Ohio Valley Building Products, LLC | Purchase of net assets | February 16, 2015 | ||
| J&B Materials, Inc. | Purchase of net assets | March 16, 2015 |
F-20
GMS Inc.
Notes to Consolidated Financial Statements (Continued)
Year Ended April 30, 2015, Period From April 1, 2014 to April 30, 2014 (Successor),
Period From May 1, 2013 to March 31, 2014 (Predecessor), and Year Ended April 30, 2013
(in thousands of dollars, except for share and per share data)
3. Business Acquisitions (Continued)
The preliminary allocation of consideration for these acquisitions is summarized as follows:
| | Preliminary purchase price allocation | |||
|---|---|---|---|---|
Trade accounts and notes receivable | $ | 14,935 | ||
Inventories | 8,760 | |||
Property and equipment | 5,116 | |||
Other assets | 76 | |||
Tradenames | 3,260 | |||
Customer relationships | 30,840 | |||
Goodwill | 21,675 | |||
Liabilities assumed | (11,268 | ) | ||
| | | | | |
Purchase price | $ | 73,394 | ||
| | | | | |
| | | | | |
| | | | | |
Goodwill of $21,675 and other intangible assets of $34,100 are expected to be deductible for U.S. federal income tax purposes. The Company believes that information gathered to date provides a reasonable basis for estimating the fair values of assets acquired and liabilities assumed but the Company is waiting for additional information necessary to finalize those fair values. Thus, the provisional measurements of fair value set forth above are subject to change. Such changes are not expected to be significant. The Company expects to complete the purchase price allocation as soon as practicable but no later than one year from the date of such acquisitions. The pro forma impact of these acquisitions is not presented as it is not considered material to our Consolidated Financial Statements.
(b) 2014 Acquisitions
In full year 2014, the Company completed the following acquisitions, with an aggregate purchase price of $5,518, comprised entirely of cash consideration. In connection with these 2014 acquisitions, the Company incurred transaction costs of $120 in full year 2014. These amounts are reported in "Selling, general and administrative" expenses in the Company's accompanying Consolidated Statements of Operations and Comprehensive Income (Loss). The purpose of these acquisitions was to expand the geographical coverage of the Company and grow the business. These acquisitions increased net sales by $14,112 for full year 2014 and operating income by $103 for fiscal 2014.
Company name | Form of acquisition | Date of acquisition | ||
|---|---|---|---|---|
Sun Valley Supply, Inc. | Purchase of net assets | August 1, 2013 | ||
Dakota Gypsum | Purchase of net assets | August 19, 2013 |
F-21
GMS Inc.
Notes to Consolidated Financial Statements (Continued)
Year Ended April 30, 2015, Period From April 1, 2014 to April 30, 2014 (Successor),
Period From May 1, 2013 to March 31, 2014 (Predecessor), and Year Ended April 30, 2013
(in thousands of dollars, except for share and per share data)
3. Business Acquisitions (Continued)
The final allocation of consideration for these acquisitions is summarized as follows:
| | Final purchase price allocation | |||
|---|---|---|---|---|
Trade accounts and notes receivable | $ | 1,679 | ||
Inventories | 1,402 | |||
Property and equipment | 773 | |||
Assets acquired and liabilities assumed, net | 19 | |||
Goodwill | 1,645 | |||
| | | | | |
Purchase price | $ | 5,518 | ||
| | | | | |
| | | | | |
| | | | | |
In full year 2014, the Company finalized the purchase price allocation and recorded adjustments to contingent considerations resulting in a decrease in total consideration paid of $560. Goodwill of $1,645 is expected to be deductible for U.S. federal income tax purposes. The pro forma impact of these acquisitions is not presented as it is not considered material to our Consolidated Financial Statements.
4. Prepaid expenses and other current assets
"Prepaid expenses and other current assets" at April 30, 2015 and 2014 consists of the following:
| | April 30, 2015 | April 30, 2014 | |||||
|---|---|---|---|---|---|---|---|
Insurance recoveries | $ | 27,854 | $ | 9,070 | |||
Assets held for sale(1) | 8,721 | 5,686 | |||||
Refundable income taxes | 1,662 | 757 | |||||
Prepaid rent | 923 | 851 | |||||
Prepaid insurance and payroll taxes | 721 | 479 | |||||
Taxes, tags and licenses | 688 | 285 | |||||
Prepaid supplies | 463 | 304 | |||||
Management fee | 375 | 375 | |||||
Prepaid rebates | — | 361 | |||||
Other | 1,529 | 1,054 | |||||
| | | | | | | | |
| $ | 42,936 | $ | 19,222 | ||||
| | | | | | | | |
| | | | | | | | |
| | | | | | | | |
- (1)
- As of April 30, 2015 and 2014, certain land, buildings and building improvements met the held for sale criteria and have been included as a component of capitalized other current assets. Upon meeting the held for sale criteria, we no longer depreciated these assets.
F-22
GMS Inc.
Notes to Consolidated Financial Statements (Continued)
Year Ended April 30, 2015, Period From April 1, 2014 to April 30, 2014 (Successor),
Period From May 1, 2013 to March 31, 2014 (Predecessor), and Year Ended April 30, 2013
(in thousands of dollars, except for share and per share data)
5. Property and Equipment
"Property and equipment" at April 30, 2015 and 2014 consists of the following:
| | April 30, 2015 | April 30, 2014 | |||||
|---|---|---|---|---|---|---|---|
Land | $ | 49,984 | $ | 49,651 | |||
Buildings and leasehold improvements | 75,153 | 67,844 | |||||
Machinery and equipment | 66,946 | 58,812 | |||||
Construction in progress | 2,047 | 1,658 | |||||
| | | | | | | | |
Total property and equipment | 194,130 | 177,965 | |||||
| | | | | | | | |
Less accumulated depreciation and amortization | 35,306 | 4,754 | |||||
| | | | | | | | |
Total property and equipment, net of accumulated depreciation and amortization | $ | 158,824 | $ | 173,211 | |||
| | | | | | | | |
| | | | | | | | |
| | | | | | | | |
"Depreciation and amortization" expense for property and equipment was $32,208, $3,818, $12,215, and $11,656 for Successor 2015, Successor 2014, Predecessor 2014 and Predecessor 2013, respectively.
6. Goodwill and Intangible Assets
"Goodwill" at April 30, 2015 and 2014 consists of the following:
| | Carrying Amount | |||
|---|---|---|---|---|
Balance at April 1, 2014 | $ | — | ||
Acquisition of Gypsum Management and Supply, Inc. (Note 2) | 320,736 | |||
| | | | | |
Balance at April 30, 2014 | 320,736 | |||
| | | | | |
Goodwill acquired during the year (Note 3) | 21,675 | |||
| | | | | |
Balance at April 30, 2015 | $ | 342,411 | ||
| | | | | |
| | | | | |
| | | | | |
The Company's definite lived intangible assets as of April 30, 2015 and 2014 consist of the following:
| | | | April 30, 2015 | ||||||||||||
|---|---|---|---|---|---|---|---|---|---|---|---|---|---|---|---|
| | | Weighted average amortization period | |||||||||||||
| | Estimated useful lives (years) | Gross carrying amount | Accumulated amortization | Net carrying value | |||||||||||
Amortizable intangible assets: | |||||||||||||||
Customer relationships | 8 - 13 | 11.0 | $ | 179,471 | $ | 33,610 | $ | 145,861 | |||||||
Definite lived tradenames | 20 | — | 3,260 | 51 | 3,209 | ||||||||||
Vendor agreement | 8 | — | 5,644 | 765 | 4,879 | ||||||||||
Leasehold interests | 8 - 13 | 10.9 | 496 | 51 | 445 | ||||||||||
| | | | | | | | | | | | | | | | |
Totals | $ | 188,871 | $ | 34,477 | $ | 154,394 | |||||||||
| | | | | | | | | | | | | | | | |
| | | | | | | | | | | | | | | | |
| | | | | | | | | | | | | | | | |
F-23
GMS Inc.
Notes to Consolidated Financial Statements (Continued)
Year Ended April 30, 2015, Period From April 1, 2014 to April 30, 2014 (Successor),
Period From May 1, 2013 to March 31, 2014 (Predecessor), and Year Ended April 30, 2013
(in thousands of dollars, except for share and per share data)
6. Goodwill and Intangible Assets (Continued)
| | | | April 30, 2014 | ||||||||||||
|---|---|---|---|---|---|---|---|---|---|---|---|---|---|---|---|
| | | Weighted average amortization period | |||||||||||||
| | Estimated useful lives (years) | Gross carrying amount | Accumulated amortization | Net carrying value | |||||||||||
Amortizable intangible assets: | |||||||||||||||
Customer relationships | 8 - 13 | 10.7 | $ | 148,631 | $ | 2,457 | $ | 146,174 | |||||||
Vendor agreement | 8 | — | 5,644 | 59 | 5,585 | ||||||||||
Leasehold interests | 8 - 13 | 10.9 | 496 | 4 | 492 | ||||||||||
| | | | | | | | | | | | | | | | |
Totals | $ | 154,771 | $ | 2,520 | $ | 152,251 | |||||||||
| | | | | | | | | | | | | | | | |
| | | | | | | | | | | | | | | | |
| | | | | | | | | | | | | | | | |
The Company's indefinite lived intangible assets consist of tradenames which have a carrying amount of $61,368 as of April 30, 2015 and 2014.
Amortization expense related to intangible assets was $31,957, $2,518, $38, and $72 in Successor 2015, Successor 2014, Predecessor 2014, and Predecessor 2013, respectively, and is recorded in "Depreciation and amortization" expense in the Consolidated Statements of Operations and Comprehensive Income (Loss). The estimated aggregate amortization expense for each of the five succeeding fiscal years and thereafter is expected to be as follows:
| | Customer relationships | Tradenames | Vendor agreement | Leasehold interests | Total | |||||||||||
|---|---|---|---|---|---|---|---|---|---|---|---|---|---|---|---|---|
Years ending April 30: | ||||||||||||||||
2016 | $ | 33,987 | $ | 163 | $ | 706 | $ | 47 | $ | 34,903 | ||||||
2017 | 27,934 | 163 | 706 | 47 | 28,850 | |||||||||||
2018 | 22,205 | 163 | 706 | 47 | 23,121 | |||||||||||
2019 | 17,371 | 163 | 706 | 47 | 18,287 | |||||||||||
2020 | 13,043 | 163 | 706 | 47 | 13,959 | |||||||||||
Thereafter | 31,321 | 2,394 | 1,349 | 210 | 35,274 | |||||||||||
| | | | | | | | | | | | | | | | | |
Total | $ | 145,861 | $ | 3,209 | $ | 4,879 | $ | 445 | $ | 154,394 | ||||||
| | | | | | | | | | | | | | | | | |
| | | | | | | | | | | | | | | | | |
| | | | | | | | | | | | | | | | | |
F-24
GMS Inc.
Notes to Consolidated Financial Statements (Continued)
Year Ended April 30, 2015, Period From April 1, 2014 to April 30, 2014 (Successor),
Period From May 1, 2013 to March 31, 2014 (Predecessor), and Year Ended April 30, 2013
(in thousands of dollars, except for share and per share data)
7. Other Assets
"Other assets" at April 30, 2015 and 2014 consists of the following:
| | April 30, 2015 | April 30, 2014 | |||||
|---|---|---|---|---|---|---|---|
Deferred financing fees | $ | 2,949 | $ | 3,675 | |||
Insurance recoveries | 2,860 | 16,390 | |||||
Derivative financial instrument | 2,160 | — | |||||
Notes receivable | 1,108 | 1,486 | |||||
Deposits | 1,076 | 969 | |||||
Investments and non-operating real estate | 213 | 1,823 | |||||
Cash surrender value of officers' life insurance | 144 | 139 | |||||
Other | 89 | 298 | |||||
| | | | | | | | |
| $ | 10,599 | $ | 24,780 | ||||
| | | | | | | | |
| | | | | | | | |
| | | | | | | | |
8. Other Accrued Expenses and Current Liabilities
"Other accrued expenses and current liabilities" at April 30, 2015 and 2014 consist of the following:
| | April 30, 2015 | April 30, 2014 | |||||
|---|---|---|---|---|---|---|---|
Insurance related liabilities | $ | 33,427 | $ | 13,378 | |||
Sales taxes payable | 7,309 | 6,550 | |||||
Contingent liabilities to sellers | 4,821 | 4,821 | |||||
Contingent consideration | 2,358 | 476 | |||||
Accrued rebates | 1,676 | 1,731 | |||||
Accrued interest | 1,420 | 42 | |||||
Accrued professional services fees | 1,287 | 438 | |||||
Real estate and personal property taxes | 1,082 | 1,016 | |||||
Deferred revenue | 784 | 321 | |||||
Accrued franchise tax | 376 | 470 | |||||
Other | 2,632 | 1,273 | |||||
| | | | | | | | |
| $ | 57,172 | $ | 30,516 | ||||
| | | | | | | | |
| | | | | | | | |
| | | | | | | | |
F-25
GMS Inc.
Notes to Consolidated Financial Statements (Continued)
Year Ended April 30, 2015, Period From April 1, 2014 to April 30, 2014 (Successor),
Period From May 1, 2013 to March 31, 2014 (Predecessor), and Year Ended April 30, 2013
(in thousands of dollars, except for share and per share data)
9. Long-Term Debt
"Long-term debt" at April 30, 2015 and 2014 consists of the following:
| | April 30, 2015 | April 30, 2014 | |||||
|---|---|---|---|---|---|---|---|
First Lien Term Loan due 2021(1)(2) | $ | 376,180 | $ | 378,379 | |||
Second Lien Term Loan due 2022(3)(4) | 153,585 | 152,638 | |||||
Capital lease obligation, at an annual rate of 5.25%, due in monthly installments through August 2022 (see Note 17) | 8,628 | 7,744 | |||||
Installment notes at fixed rates up to 2.7%, due in monthly and annual installments through August 2015 | 1,641 | 24 | |||||
| | | | | | | | |
| 540,034 | 538,785 | ||||||
Less: Current portion | 6,759 | 6,085 | |||||
| | | | | | | | |
Total long-term debt | $ | 533,275 | $ | 532,700 | |||
| | | | | | | | |
| | | | | | | | |
| | | | | | | | |
- (1)
- Net of unamortized discount of $1,640 and $1,927 as of April 30, 2015 and 2014, respectively.
- (2)
- Net of deferred financing costs of $8,280 and $9,694 as of April 30, 2015 and 2014, respectively.
- (3)
- Net of unamortized discount of $1,384 and $1,583 as of April 30, 2015 and 2014, respectively.
- (4)
- Net of deferred financing costs of $5,031 and $5,779 as of April 30, 2015 and 2014, respectively.
Acquisition Debt (Successor)
On April 1, 2014, the Company's wholly-owned subsidiaries, GYP Holdings II Corp., as parent guarantor (in such capacity, "Holdings"), and GYP Holdings III Corp., as borrower (in such capacity, the "Borrower" and, together with Holdings and the Subsidiary Guarantors (as defined below), the "Loan Parties"), entered into a senior secured first lien term loan facility (the "First Lien Facility") and a senior secured second lien term loan facility (the "Second Lien Facility" and, together with the First Lien Facility, the "Term Loan Facilities") in the aggregate amount of $550,000 to acquire Gypsum Management and Supply, Inc. The proceeds from the Term Loan Facilities were used to (i) repay all amounts outstanding under the 2010 Credit Facility in the amount of $86,120, (ii) pay the acquisition purchase price and (iii) pay related fees and expenses.
The Term Loan Facility consists of a First Lien Term Loan and a Second Lien Term Loan (respectively, the "First Term Loan" and "Second Term Loan" and collectively, the "Term Loans"). The First Term Loan was issued in an original aggregate principal amount of $388,050 (net of $1,950 of original issue discount). The Second Term Loan was issued in an original aggregate principal amount of $158,400 (net of $1,600 of original issue discount). At April 30, 2015, the borrowing interest rate for the First Term Loan and Second Term Loan was 4.75% and 7.75%, respectively. Accrued interest, presented within "Other accrued expenses and current liabilities" in our Consolidated Balance Sheets, was $1,119 and $86 at April 30, 2015 and 2014, respectively. Cash paid for interest was $30,251 and $2,491 for Successor 2015 and Successor 2014, respectively. The First Lien Facility permits the Borrower to add one or more incremental term loans up to a fixed amount of $100,000 (shared with the Second Term Loan) plus a certain amount depending on a secured first lien leverage ratio test
F-26
GMS Inc.
Notes to Consolidated Financial Statements (Continued)
Year Ended April 30, 2015, Period From April 1, 2014 to April 30, 2014 (Successor),
Period From May 1, 2013 to March 31, 2014 (Predecessor), and Year Ended April 30, 2013
(in thousands of dollars, except for share and per share data)
9. Long-Term Debt (Continued)
included in the First Lien Facility. The Second Lien Facility permits the Borrower to add one or more incremental term loans up to a fixed amount of $100,000 (shared with the First Lien Facility) plus a certain amount depending on a secured leverage ratio test included in the Second Lien Facility. The First Term Loan bears interest at LIBOR (subject to a floor of 1.00%) plus a borrowing margin of 3.75%. The Second Term Loan bears interest at LIBOR (subject to a floor of 1.00%) plus a borrowing margin of 6.75%. The First Term Loan amortizes in nominal quarterly installments of $975, or 0.25% of the original aggregate principal amount of the First Term Loan and matures on April 1, 2021. The Second Term Loan has no amortization and matures on April 1, 2022. Provided that the individual affected lenders agree accordingly, the maturities of the Term Loans may, upon the Borrower's request and without the consent of any other lender, be extended.
Asset Based Lending Facility (Successor)
The Asset Based Lending Credit Facility (the "ABL Facility"), entered into on April 1, 2014, provides for revolving loans and the issuance of letters of credit up to a maximum aggregate principal amount of $200,000 (subject to availability under a borrowing base). GYP Holdings III Corp. is the lead borrower (in such capacity, the "Lead Borrower"). Extensions of credit under the ABL Facility will be limited by a borrowing base calculated periodically based on specified percentages of the value of eligible inventory and eligible accounts receivable, subject to certain reserves and other adjustments. As of April 30, 2015, the Company had $171,688 of available borrowings and $16,950 in short-term swing line borrowings outstanding under the ABL Facility as presented within "Revolving credit facility" under "Current Liabilities" on the Consolidated Balance Sheets. As of April 30, 2015 and 2014, there was $280 and $0 accrued interest payable, respectively on the facility. In Successor 2015 and Successor 2014, we paid interest and other fees on the facility of $941 and $76, respectively. The ABL Facility also permits the Company to request increases in the amount of the revolving, swing line and letter of credit facilities up to an aggregate maximum amount of $300,000 for the total commitments under the ABL Facility (including all incremental commitments).
At the Company's option, the interest rates applicable to the loans under the ABL Facility are based at LIBOR or base rate plus, in each case, an applicable margin. The margins applicable for each elected interest rate are subject to a pricing grid, as defined in the ABL Facility agreement, based on average daily availability for the most recent fiscal quarter. The applicable rate of interest for fiscal 2015 was 3.75%. The ABL Facility also contains an unused commitment fee subject to utilization, as included in the ABL Facility agreement.
The ABL Facility will mature on April 1, 2019 unless the individual affected lenders agree to extend the maturity of their respective loans under the ABL Facility upon the Company's request and without the consent of any other lender.
Collateral under the ABL Facility and Term Loan Facilities
The ABL Facility is collateralized by (a) first priority perfected liens on the following assets of the Loan Parties: (i) accounts receivable; (ii) inventory; (iii) deposit accounts; (iv) cash and cash equivalents; (v) tax refunds and tax payments; (vi) chattel paper and (vii) documents, instruments, general intangibles, securities accounts, books and records, proceeds and supporting obligations related
F-27
GMS Inc.
Notes to Consolidated Financial Statements (Continued)
Year Ended April 30, 2015, Period From April 1, 2014 to April 30, 2014 (Successor),
Period From May 1, 2013 to March 31, 2014 (Predecessor), and Year Ended April 30, 2013
(in thousands of dollars, except for share and per share data)
9. Long-Term Debt (Continued)
to each of the foregoing, subject to certain exceptions (collectively, "ABL Priority Collateral") and (b) third priority perfected liens on the remaining assets of the Loan Parties not constituting ABL Priority Collateral, subject to customary exceptions (collectively, "Term Priority Collateral").
The First Lien Facility and the Second Lien Facility are collateralized by (a) first priority liens and second priority liens, respectively, on the Term Priority Collateral and (b) second priority liens and third priority liens, respectively, on the ABL Priority Collateral, subject to customary exceptions.
Prepayments under the ABL Facility and Term Loan Facilities
The Term Loans may be prepaid at any time without penalty, except that the Second Term Loan is subject to a 1% prepayment premium on voluntary prepayments and certain mandatory prepayments made prior to April 1, 2016. Under certain circumstances and subject to certain exceptions, the Term Loan Facilities will be subject to mandatory prepayments in the amount equal to:
- •
- 100% of the net proceeds of certain assets sales and issuances or incurrences of nonpermitted indebtedness; and
- •
- 50% of annual excess cash flow for any fiscal year, such percentage to decrease to 25% or 0% depending on the attainment of certain total leverage ratio targets.
As of April 30, 2015 there was no prepayment required related to excess cash flow.
The ABL Facility may be prepaid at the Company's option at any time without premium or penalty and will be subject to mandatory prepayment if the outstanding ABL Facility exceeds the lesser of the (i) borrowing base and (ii) the aggregate amount of commitments. Mandatory prepayments do not result in a permanent reduction of the lenders' commitments under the ABL Facility.
Guarantees
Holdings guarantees the payment obligations under the ABL Facility and the Term Loan Facilities. Certain of Holdings' subsidiaries (i) guarantee the payment obligations under the Term Loan Facilities (in such capacity, the "Subsidiary Guarantors") and (ii) are co-borrowers under the ABL Facility.
Covenants under the ABL Facility and Term Loan Facilities
The ABL Facility contains certain affirmative covenants, including financial and other reporting requirements. The Company is in compliance with all such covenants at April 30, 2015.
The Term Loan Facilities contain a number of covenants that limit the ability of the Borrower and its restricted subsidiaries, as described in the Term Loan Facilities, to: incur more indebtedness; pay dividends, redeem stock or make other distributions; make investments; create restrictions on the ability of the Company's restricted subsidiaries to pay dividends to the Company or make other intercompany transfers; create liens securing indebtedness; transfer or sell assets; merge or consolidate; enter into certain transactions with the Company's affiliates; and prepay or amend the terms of certain indebtedness. The Company is in compliance with all restrictive covenants at April 30, 2015.
F-28
GMS Inc.
Notes to Consolidated Financial Statements (Continued)
Year Ended April 30, 2015, Period From April 1, 2014 to April 30, 2014 (Successor),
Period From May 1, 2013 to March 31, 2014 (Predecessor), and Year Ended April 30, 2013
(in thousands of dollars, except for share and per share data)
9. Long-Term Debt (Continued)
Events of Default under the ABL Facility and Term Loan Facilities
The ABL Facility and Term Loan Facilities also provide for customary events of default, including non-payment of principal, interest or fees, violation of covenants, material inaccuracy of representations or warranties, specified cross default to other material indebtedness, certain bankruptcy events, certain ERISA events, material invalidity of guarantees or security interest, material judgments and changes of control.
Asset Based Lending Facility (Predecessor)
During Predecessor 2013, the Company utilized its existing revolving credit agreement with certain financial institutions ("the 2010 Credit Facility"). The revolving credit agreement was collateralized by substantially all of the borrower's trade receivables and inventories. Maximum borrowings available under the arrangement were $175,000 plus the value of a $10,100 amortizing amount. The 2010 Credit Facility matured on March 6, 2017 unless terminated. So long as no event of default occurred, the facility contained a provision allowing the borrower to request the right to increase the maximum borrowings up to $275,000, in minimum increments of $10,000, subject to approval of the financial institutions. Borrowings under the facility bore interest at (i) the base rate plus the applicable margin in effect, as defined, or (ii) the adjusted LIBOR rate plus the applicable margin in effect, as defined. At April 30, 2013, outstanding borrowings under the agreement were $99,880 with a weighted average interest rate of 2.57%.
In conjunction with the Acquisition of the Predecessor, the outstanding balance of the 2010 Credit Facility was paid in full and unamortized deferred financing charges of $1,641 were written off as part of the purchase price accounting.
Debt Maturities
As of April 30, 2015, the scheduled quarterly principal payments of long-term debt, excluding capital leases and installment notes are as follows:
| | First Lien Term Loan | Second Lien Term Loan | Total | |||||||
|---|---|---|---|---|---|---|---|---|---|---|
Years ending April 30, | ||||||||||
2016 | $ | 3,900 | $ | — | $ | 3,900 | ||||
2017 | 3,900 | — | 3,900 | |||||||
2018 | 3,900 | — | 3,900 | |||||||
2019 | 3,900 | — | 3,900 | |||||||
2020 | 3,900 | — | 3,900 | |||||||
Thereafter | 366,600 | 160,000 | 526,600 | |||||||
| | | | | | | | | | | |
| $ | 386,100 | $ | 160,000 | $ | 546,100 | |||||
| | | | | | | | | | | |
| | | | | | | | | | | |
| | | | | | | | | | | |
F-29
GMS Inc.
Notes to Consolidated Financial Statements (Continued)
Year Ended April 30, 2015, Period From April 1, 2014 to April 30, 2014 (Successor),
Period From May 1, 2013 to March 31, 2014 (Predecessor), and Year Ended April 30, 2013
(in thousands of dollars, except for share and per share data)
9. Long-Term Debt (Continued)
Installment Notes
The installment notes as of April 30, 2015 represent notes for subsidiary stock repurchases from shareholders and a note for the payout of stock appreciation rights. The installment notes as of April 30, 2014 represent an outstanding note for payout of the stock appreciation rights. See Note 15.
10. Predecessor Mandatorily Redeemable Common Shares
Prior to the Acquisition, our founders owned one hundred percent of the outstanding shares of Gypsum Management and Supply, Inc. (Predecessor). These shares had certain redemption features which provided that upon the death or disability of the shareholder or termination of his employment, Predecessor would be required to purchase these shares at their then current fair values. Pursuant to this provision, these shares were deemed to be mandatorily redeemable and, as such, were required to be reflected as a liability at their estimated fair values at the end of any reporting period. Changes in fair value are reflected as "Change in fair value of mandatorily redeemable common shares" on our Consolidated Statements of Operations and Comprehensive Income (Loss). Fair value was estimated based on common valuation techniques. On April 1, 2014, all outstanding shares were acquired or converted into the equity of GMS Inc. at the Acquisition Date.
The following table sets forth a roll forward of the Level 3 fair values of the Predecessor's mandatorily redeemable common shares. These techniques were based on a combination of a discounted cash flow analysis, which was determined using management's projections, and a market comparable method.
| | Mandatorily Redeemable Common Shares | |||
|---|---|---|---|---|
Balance as of May 1, 2011 | $ | 252,464 | ||
Increase in fair value | 8,952 | |||
| | | | | |
Balance as of April 30, 2012 | 261,416 | |||
Increase in fair value | 198,212 | |||
| | | | | |
Balance as of April 30, 2013 | 459,628 | |||
Increase in fair value | 200,004 | |||
| | | | | |
Balance as of March 31, 2014 | 659,632 | |||
Acquisition of Predecessor equity interests by GMS Inc. | (659,632 | ) | ||
| | | | | |
Balance as of March 31, 2014 | — | |||
| | | | | |
| | | | | |
| | | | | |
11. Retirement Plan
The Company maintains a defined contribution retirement plan for its employees. Participants are allowed to choose from a 401(k) of mutual funds in order to designate how both employer and employee contributions are invested. Under the plan, the Company matches 25% of each employee's contributions on the first 4% of the employee's compensation contributed. The Company contributed
F-30
GMS Inc.
Notes to Consolidated Financial Statements (Continued)
Year Ended April 30, 2015, Period From April 1, 2014 to April 30, 2014 (Successor),
Period From May 1, 2013 to March 31, 2014 (Predecessor), and Year Ended April 30, 2013
(in thousands of dollars, except for share and per share data)
11. Retirement Plan (Continued)
$1,120, $86, $891, and $920 in Successor 2015, Successor 2014, Predecessor 2014, and Predecessor 2013, respectively.
12. Income Taxes
Income tax (benefit) expense for Successor 2015, Successor 2014, Predecessor 2014, and Predecessor 2013 consists of the following:
| | Successor | | Predecessor | ||||||||||||
|---|---|---|---|---|---|---|---|---|---|---|---|---|---|---|---|
| | Year Ended April 30, 2015 | April 1 - April 30, 2014 | | May 1, 2013 - March 31, 2014 | Year Ended April 30, 2013 | ||||||||||
Current federal | $ | 11,638 | $ | (2 | ) | $ | 13,498 | $ | 9,918 | ||||||
Current state | 2,688 | — | 3,176 | 1,500 | |||||||||||
| | | | | | | | | | | | | | | | |
Total current | 14,326 | (2 | ) | 16,674 | 11,418 | ||||||||||
| | | | | | | | | | | | | | | | |
Deferred federal | (17,492 | ) | (7,382 | ) | (8,711 | ) | (5 | ) | |||||||
Deferred state | (1,360 | ) | 521 | (1,340 | ) | 121 | |||||||||
| | | | | | | | | | | | | | | | |
Total deferred | (18,852 | ) | (6,861 | ) | (10,051 | ) | 116 | ||||||||
| | | | | | | | | | | | | | | | |
| $ | (4,526 | ) | $ | (6,863 | ) | $ | 6,623 | $ | 11,534 | ||||||
| | | | | | | | | | | | | | | | |
| | | | | | | | | | | | | | | | |
| | | | | | | | | | | | | | | | |
Total income tax (benefit) expense from continuing operations differed from the amount computed by applying the federal statutory rate of 35% for Successor 2015, Successor 2014, Predecessor 2014, and Predecessor 2013 due to the following:
| | Successor | | Predecessor | ||||||||||||
|---|---|---|---|---|---|---|---|---|---|---|---|---|---|---|---|
| | Year Ended April 30, 2015 | April 1 - April 30, 2014 | | May 1, 2013 - March 31, 2014 | Year Ended April 30, 2013 | ||||||||||
Federal income taxes at statutory rate | $ | (6,413 | ) | $ | (9,036 | ) | $ | (67,983 | ) | $ | (59,882 | ) | |||
State income taxes, net of federal income tax benefit | 1,629 | 192 | 1,383 | 429 | |||||||||||
Change in fair value of mandatorily redeemable common shares | — | — | 70,001 | 69,373 | |||||||||||
Net change in valuation allowance | (1,134 | ) | 100 | (279 | ) | 74 | |||||||||
Nondeductible meals & entertainment | 462 | 35 | 354 | 327 | |||||||||||
Redeemable noncontrolling interests | 550 | 14 | 816 | 684 | |||||||||||
Nondeductible transaction costs | — | 1,891 | 2,232 | — | |||||||||||
Other permanent differences | 88 | 9 | 104 | 96 | |||||||||||
Other | 292 | (68 | ) | (5 | ) | 433 | |||||||||
| | | | | | | | | | | | | | | | |
Total | $ | (4,526 | ) | $ | (6,863 | ) | $ | 6,623 | $ | 11,534 | |||||
| | | | | | | | | | | | | | | | |
| | | | | | | | | | | | | | | | |
| | | | | | | | | | | | | | | | |
Income taxes for financial reporting purposes differ from the amount computed by applying the statutory federal rate primarily due to the effect of state income taxes, net of federal benefit, permanent differences, the release of valuation allowance related to certain state net operating losses, and non-deductible non-cash debt related charges.
F-31
GMS Inc.
Notes to Consolidated Financial Statements (Continued)
Year Ended April 30, 2015, Period From April 1, 2014 to April 30, 2014 (Successor),
Period From May 1, 2013 to March 31, 2014 (Predecessor), and Year Ended April 30, 2013
(in thousands of dollars, except for share and per share data)
12. Income Taxes (Continued)
The tax effects of temporary differences, which give rise to deferred income taxes as of April 30, 2015 and 2014 are as follows:
| | April 30, 2015 | April 30, 2014 | |||||
|---|---|---|---|---|---|---|---|
Current deferred income tax assets: | |||||||
Allowances on accounts and notes receivable | $ | 5,454 | $ | 5,602 | |||
Accrued payroll and related costs | 1,772 | 3,102 | |||||
Insurance reserves | 1,204 | 1,107 | |||||
Inventory costs | 1,702 | 1,212 | |||||
Federal net operating loss carry-forward | — | 3,985 | |||||
Other | 1,650 | 2,147 | |||||
| | | | | | | | |
Total current deferred income tax assets | 11,782 | 17,155 | |||||
Less: Valuation allowance | (57 | ) | (913 | ) | |||
| | | | | | | | |
Total current deferred income tax assets | 11,725 | 16,242 | |||||
| | | | | | | | |
Current deferred income tax liabilities: | |||||||
Rebates | (1,889 | ) | (1,486 | ) | |||
Other | — | (556 | ) | ||||
| | | | | | | | |
Total current deferred income tax liabilities | (1,889 | ) | (2,042 | ) | |||
| | | | | | | | |
Current deferred income tax assets, net | $ | 9,836 | $ | 14,200 | |||
| | | | | | | | |
| | | | | | | | |
| | | | | | | | |
Non-current deferred income tax assets: | |||||||
Interest rate swap | $ | 56 | $ | 30 | |||
Deferred rent | 82 | — | |||||
Equity compensation | 2,402 | — | |||||
Deferred compensation | 3,981 | 3,380 | |||||
Derivative instrument | 886 | — | |||||
Noncompete agreements | 317 | 360 | |||||
State net operating loss carry-forwards | 1,031 | 1,781 | |||||
Other | 2,019 | 1,312 | |||||
| | | | | | | | |
Total non-current deferred income tax assets | 10,774 | 6,863 | |||||
Less: Valuation allowance | (86 | ) | (364 | ) | |||
| | | | | | | | |
Non-current deferred income tax assets | 10,688 | 6,499 | |||||
Non-current deferred income tax liabilities: | |||||||
Depreciation | (12,652 | ) | (20,438 | ) | |||
Amortization on intangible assets | (63,181 | ) | (75,181 | ) | |||
Capital | (226 | ) | (173 | ) | |||
| | | | | | | | |
Total non-current deferred tax liabilities | (76,059 | ) | (95,792 | ) | |||
| | | | | | | | |
Non-current deferred income tax liabilities, net | $ | (65,371 | ) | $ | (89,293 | ) | |
| | | | | | | | |
| | | | | | | | |
| | | | | | | | |
F-32
GMS Inc.
Notes to Consolidated Financial Statements (Continued)
Year Ended April 30, 2015, Period From April 1, 2014 to April 30, 2014 (Successor),
Period From May 1, 2013 to March 31, 2014 (Predecessor), and Year Ended April 30, 2013
(in thousands of dollars, except for share and per share data)
12. Income Taxes (Continued)
In Successor 2015, Successor 2014 and Predecessor 2014, the Company generated certain state net operating loss carry-forwards which are available for use against taxable income in each respective state. The Company had state net operating losses available for carry-forward of $23,596 and $43,661 in Successor 2015 and Successor 2014, respectively, which expire through the fiscal year ending in 2035.
As a result of the Acquisition, a significant change in the ownership of the Company occurred which, pursuant to The Internal Revenue Code, Section 382, will limit on an annual basis the Company's ability to utilize a portion of its state NOLs. The Company's state NOLs will continue to be available to offset taxable income and tax liabilities (until such NOLs are either used or expire) subject to the Section 382 annual limitation. If the annual limitation amount is not fully utilized in a particular tax year, then the unused portion from that particular tax year will be added to the annual limitation in subsequent years. Based on the Section 382 analysis performed the company expects approximately $93 of state NOLs to expire unutilized and, therefore, has recorded a valuation allowance against the deferred tax asset.
Deferred tax assets and liabilities are computed by applying the federal and state income tax rates in effect to the gross amounts of temporary differences and other tax attributes, such as net operating loss carry-forwards. In assessing if the deferred tax assets will be realized, the Company considers whether it is more likely than not that some or all of these deferred tax assets will be realized. The ultimate realization of deferred tax assets is dependent upon the generation of future taxable income during the period in which these deductible temporary differences reverse. As of April 30, 2015, except as noted in the following paragraph, the Company believes that it is more likely than not that all of its deferred tax assets relating to separate company state return filings will be realized.
Management makes an assessment to determine if its deferred tax assets are more likely than not to be realized. Valuation allowances are established in the event that management believes that it is more likely than not the related tax benefits will not be realized. The valuation allowance primarily relates to state credits and state net operating loss carry forwards. During 2015, the valuation allowance decreased by $1,134 which is primarily due to increased profitability. During the month ended April 30, 2014 the valuation allowance increased by $100, during the eleven months ended March 31, 2014, the valuation allowance decreased by $279, and during the year ended April 30, 2013 the valuation allowance increased by $74.
As of April 30, 2015 and 2014, the Company does not have any uncertain tax positions. The Company's policy for recording penalties and interest related to uncertain tax positions is to record these amounts in "Selling, general and administrative" expense. The tax credits, carryforwards and net operating losses expire from 2016 to 2035.
At April 30, 2015, Successor 2015, Successor 2014, and Predecessor 2014 remain subject to examination by the U.S. Internal Revenue Service. In states in which the Company conducts business, the statute of limitation periods for examination generally vary from three to four years. Certain years from which net operating losses are still being carried forward remain subject to examination by the taxing authorities. The Company regularly assesses the potential outcomes of future examinations to
F-33
GMS Inc.
Notes to Consolidated Financial Statements (Continued)
Year Ended April 30, 2015, Period From April 1, 2014 to April 30, 2014 (Successor),
Period From May 1, 2013 to March 31, 2014 (Predecessor), and Year Ended April 30, 2013
(in thousands of dollars, except for share and per share data)
12. Income Taxes (Continued)
ensure the Company's provision for income taxes is sufficient. The Company recognizes liabilities based on estimates of whether additional taxes will be due and believes that no reserves are necessary as of April 30, 2015 and 2014.
13. Stockholders' Equity
Successor Stockholders' Equity
The Company authorized 5,000,000 shares of $0.01 par value common stock of which 3,224,838 and 3,183,870 were outstanding at April 30, 2015 and 2014, respectively.
14. Equity-Based Compensation
General
The Company has a 2014 GYP Holdings I Corp. Stock Option Plan, (the "Plan") that provides for granting of stock options and other equity awards. The Plan authorizes 353,556 shares of common stock for issuance. The stock options vest over a four year period and have a 10-year term. The plan is designed to motivate and retain individuals who are responsible for the attainment of our primary long-term performance goals. The plan provides a means whereby our employees and directors develop a sense of proprietorship and personal involvement in our development and financial success and encourage them to devote their best efforts to our business. The Company accounts for share-based awards in accordance with ASC 718. ASC 718 requires measurement of compensation cost for all share-based awards at fair value on the grant date (or measurement date if different) and recognition of compensation expense, net of estimated forfeitures, over the requisite service period for awards expected to vest.
Stock Option Awards
We utilize the Black-Scholes option-pricing model to estimate the grant-date fair value of all stock options. The Black-Scholes option-pricing model requires the use of weighted average assumptions for estimated expected volatility, estimated expected term of stock options, risk-free rate, estimated expected dividend yield, and the fair value of the underlying common stock at the date of grant. Because we do not have sufficient history to estimate the expected volatility of our common stock price, expected volatility is based on the average volatility of peer public entities that are similar in size and industry. We estimate the expected term of all stock options based on previous history of exercises. The risk-free rate is based on the U.S. Treasury yield curve in effect at the time of grant for the expected term of the stock option. The expected dividend yield is 0% as we have not declared any common stock dividends to date and do not expect to declare common stock dividends in the near future. The fair value of the underlying common stock at the date of grant was determined based on a valuation of our common stock. We estimate forfeitures based on our historical analysis of actual stock option forfeitures and employee turnover. Actual forfeitures are recorded when incurred and estimated
F-34
GMS Inc.
Notes to Consolidated Financial Statements (Continued)
Year Ended April 30, 2015, Period From April 1, 2014 to April 30, 2014 (Successor),
Period From May 1, 2013 to March 31, 2014 (Predecessor), and Year Ended April 30, 2013
(in thousands of dollars, except for share and per share data)
14. Equity-Based Compensation (Continued)
forfeitures are reviewed and adjusted at least annually. The weighted average assumptions used in the Black-Scholes option-pricing model for the year ended April 30, 2015 are set forth below:
| | April 30, 2015 | |||
|---|---|---|---|---|
Volatility | 59.54 | % | ||
Expected life (years) | 6.0 | |||
Risk-free interest rate | 1.78 | % | ||
Dividend yield | — | % | ||
In fiscal 2015, the Company accounted for 278,013 stock option awards issued to employees that vest based on service only. The weighted average grant date fair value of each stock option was $48.06 and the aggregate fair value of options outstanding was $13,361 and the aggregate fair value of options vested was $2,228. All of these awards vest over a four-year period. Additionally, all these options could vest earlier in the event of a change in control, merger or other acquisition. This expense is recorded on an accelerated basis over the requisite service period of each separate vesting tranche. Share-based compensation expense related to stock option awards was $6,455 for the year ended April 30, 2015 and was included as a component of "Selling, general and administrative" expenses in our Consolidated Statements of Operations and Comprehensive Income (Loss). The Company also recognized related income tax benefits of $2,402. At April 30, 2015, the unrecognized compensation expense related to stock option awards was $5,570 with a remaining weighted average life of 3.1 years.
A summary of stock option activity for the year ended April 30, 2015 follows:
| | Number of options | Weighted average exercise price | Weighted average remaining contractual life (years) | Aggregate intrinsic value | |||||||||
|---|---|---|---|---|---|---|---|---|---|---|---|---|---|
Outstanding at April 30, 2014 | — | — | |||||||||||
| | | | | | | | | | | | | | |
Options granted | 278,013 | $ | 127.29 | ||||||||||
Options exercised | — | — | |||||||||||
Options forfeited | — | — | |||||||||||
Options expired | — | — | |||||||||||
| | | | | | | | | | | | | | |
Outstanding at April 30, 2015 | 278,013 | $ | 127.29 | 9.07 | $ | 12,027 | |||||||
| | | | | | | | | | | | | | |
Exercisable at April 30, 2015 | 49,084 | $ | 125.00 | 8.91 | $ | 2,236 | |||||||
Expected to vest after April 30, 2015 | 228,929 | $ | 127.78 | 9.10 | $ | 9,791 | |||||||
F-35
GMS Inc.
Notes to Consolidated Financial Statements (Continued)
Year Ended April 30, 2015, Period From April 1, 2014 to April 30, 2014 (Successor),
Period From May 1, 2013 to March 31, 2014 (Predecessor), and Year Ended April 30, 2013
(in thousands of dollars, except for share and per share data)
14. Equity-Based Compensation (Continued)
Aggregate intrinsic value represents the fair value of the underlying common stock at the date of grant, which was determined based on a valuation of our common stock in excess of the weighted average exercise price multiplied by the number of options outstanding or exercisable. Options expected to vest are unvested shares net of expected forfeitures.
Subsidiaries' Stock Option Plans
Certain subsidiaries of the Company granted stock options to certain employees prior to Predecessor 2014 under various plans (the "Subsidiary Plans"). The options were valued based on the underlying common stock changes from year to year and compensation expense was recognized over the vesting period. Compensation expense recognized in Successor 2014, Predecessor 2014, and Predecessor 2013, was $1, $27 and $82, respectively. All stock options awarded under the Subsidiary Plans were exercised or expired prior to April 30, 2015.
Exercisable and partially vested stock options are presented as a component of Liabilities to noncontrolling interest holders within the Consolidated Balance Sheets of $369 at April 30, 2014.
15. Stock Appreciation Rights, Deferred Compensation and Redeemable Noncontrolling Interests
Certain Subsidiaries have equity based compensation agreements with certain of the Subsidiary's employees and minority shareholders. These agreements are stock appreciation rights, deferred compensation agreements, and liabilities to noncontrolling interest holders. Since these agreements are typically settled in cash or notes, and do not meet the criteria established by ASC 718 to be accounted for in "Stockholders' Equity", they are accounted for as liability awards. A summary of these arrangements follows:
Stock appreciation rights—Certain subsidiaries have granted stock appreciation rights to certain employees under which payments are dependent on the appreciation in the book value per share, adjusted for certain provisions, of the applicable subsidiary. Settlements of the awards can be made in a combination of cash or installment notes, generally paid over four years, upon a triggering event. Vesting periods vary by grant date and range from fiscal 2016 to fiscal 2018. Current liabilities related to these plans of $1,050 and $446 were recorded as components of "Accrued compensation and employee benefits" at April 30, 2015 and 2014, respectively. The remaining liabilities related to these plans of $7,019 and $5,386 were recorded as components of "Other liabilities" at April 30, 2015 and 2014, respectively. The Company recorded stock compensation expense related to these awards of $2,268, $80, $1,288 and $1,061 in Successor 2015, Successor 2014, Predecessor 2014, and Predecessor 2013, respectively, and is included as a component of "Selling, general and administrative" expenses in our Consolidated Statements of Operations and Comprehensive Income (Loss). In Successor 2015 and Successor and Predecessor 2014, there were no forfeitures or exercises of stock appreciation rights.
F-36
GMS Inc.
Notes to Consolidated Financial Statements (Continued)
Year Ended April 30, 2015, Period From April 1, 2014 to April 30, 2014 (Successor),
Period From May 1, 2013 to March 31, 2014 (Predecessor), and Year Ended April 30, 2013
(in thousands of dollars, except for share and per share data)
15. Stock Appreciation Rights, Deferred Compensation and Redeemable Noncontrolling Interests (Continued)
Deferred compensation—Subsidiaries' shareholders have entered into other deferred compensation agreements that granted the shareholders a payment based on a percentage in excess of book value, adjusted for certain provisions, upon an occurrence as defined in the related agreements, which are called "Buy-Sell" agreements. Current liabilities related to these plans of $11 and $15 were recorded as components of "Accrued compensation and employee benefits" at April 30, 2015 and 2014, respectively. The remaining liabilities related to these plans of $3,479 and $3,262 were recorded as components of "Other liabilities" at April 30, 2015 and 2014, respectively. The Company recorded stock compensation expense related to these agreements of $289, $31, $626 and $241 in Successor 2015, Successor 2014, Predecessor 2014 and Predecessor 2013, respectively, and is included as a component of "Selling, general and administrative" expenses in our Consolidated Statements of Operations and Comprehensive Income (Loss). These instruments are redeemed in cash, usually in annual installments generally over the five years following termination of employment.
Liabilities to noncontrolling interest holders—As described in Note 1, noncontrolling interests were issued to certain employees of the subsidiaries. All of the noncontrolling interest awards are subject to mandatory redemption on termination of employment for any reason. These instruments are redeemed in cash, usually in annual installments generally over the five years following termination of employment.
Liabilities related to these agreements are classified as share-based liability awards and are measured at intrinsic value under ASC 718. Intrinsic value is determined to be the stated redemption value of the shares. Under the terms of the employee agreements, the redemption value is determined based on the book value of the subsidiary, as adjusted for certain items. The aggregate redemption values of this obligation as of April 30, 2015 and 2014 were $30,039 and $29,714, respectively. Amounts expected to be paid in the next year are included in "Accrued compensation and employee benefits" and "Current portion of long-term debt" at April 30, 2015 in amounts of $1,587 and $307, respectively. At April 30, 2014, no amounts were currently due.
Under accounting in ASC 718, the change in the redemption values of these awards is recognized as compensation expense in "Selling, general and administrative" expenses in the Consolidated Statements of Operations and Comprehensive Income (Loss). Compensation expense of $1,570, $40, $2,331 and $1,954 was recognized related to these awards in Successor 2015, Successor 2014, Predecessor 2014, and Predecessor 2013, respectively.
In connection with the Acquisition, noncontrolling interest holders had the option to convert their interests in the subsidiaries into the Company. Noncontrolling interests of $32,545 were converted into the Company's Common Shares at the date of the Acquisition.
Upon the termination of employment or other triggering events including death or disability of the noncontrolling stockholders in the Company's subsidiaries, we are obligated to purchase, or redeem, the noncontrolling interests at either an agreed upon price or a formula value provided in the stockholder agreements. This formula value is typically based on the book value per share of the subsidiary's equity, including certain adjustments. At April 30, 2015, the estimated redemption value,
F-37
GMS Inc.
Notes to Consolidated Financial Statements (Continued)
Year Ended April 30, 2015, Period From April 1, 2014 to April 30, 2014 (Successor),
Period From May 1, 2013 to March 31, 2014 (Predecessor), and Year Ended April 30, 2013
(in thousands of dollars, except for share and per share data)
15. Stock Appreciation Rights, Deferred Compensation and Redeemable Noncontrolling Interests (Continued)
assuming the Company was to elect to repurchase all of the noncontrolling ownership interests, approximates the carrying value of noncontrolling interests in the accompanying Consolidated Balance Sheets.
In Successor 2015, Successor 2014, Predecessor 2014, and Predecessor 2013, the Company redeemed or repurchased interests in amounts of $1,537, $0, $998, and $4,334, respectively. These interests were redeemed through a combination of cash payments and installment notes payable.
Investment in Subsidiaries
At April 30, 2015 and 2014, all subsidiaries are greater than 80%-owned.
16. Transactions With Related Parties
The Company leases office and warehouse facilities from partnerships owned by certain stockholders of GMS Inc. and its subsidiaries. At April 30, 2015, these leases had expiration dates through fiscal 2020. Rent expense related to these leases included in the accompanying Consolidated Financial Statements approximated $1,041, $77, $854, and $919 for Successor 2015, Successor 2014, Predecessor 2014 and Predecessor 2013, respectively, and are recorded in "Selling, general and administrative" expenses. At April 30, 2015, future minimum payments under the terms of the leases aggregated $4,270.
The Company purchases inventories from its former subsidiary, Southern Wall Products, Inc. ("SWP"), on a continuing basis. Certain stockholders of the Company are stockholders of SWP, which was spun-off from Gypsum Management and Supply, Inc. on August 31, 2012. The Company purchased inventory from SWP for distribution in the amount of $11,926, $1,037, $10,033 and $9,674 in Successor 2015, Successor 2014, Predecessor 2014 and Predecessor 2013, respectively. Amounts due to SWP for purchases of inventory for distribution as of April 30, 2015 and 2014 were $943 and $1,053, respectively, and are included in "Accounts payable". Purchases between Gypsum Management and Supply, Inc. and SWP prior to the spin-off were accounted for as intercompany transactions and eliminated in consolidation.
The Company has a management agreement in place with AEA Investors LP. The agreement requires the Company to pay AEA an annual management fee of $2,250 per year following the Acquisition for advisory and consulting services. The fee is payable in quarterly installments of $563 in advance of the upcoming calendar quarter on the first day, and is included in "Selling, general and administrative" expenses in the Consolidated Statements of Operations and Comprehensive Income (Loss).
F-38
GMS Inc.
Notes to Consolidated Financial Statements (Continued)
Year Ended April 30, 2015, Period From April 1, 2014 to April 30, 2014 (Successor),
Period From May 1, 2013 to March 31, 2014 (Predecessor), and Year Ended April 30, 2013
(in thousands of dollars, except for share and per share data)
17. Commitments and Contingencies
Lease Commitments
The Company is obligated under certain capital leases covering our fleet of vehicles as well as one facility. The fleet vehicle leases have terms ranging from one to four years and the facility lease has a term of 11 years. The carrying value of property and equipment under capital leases was $8,555 and $7,676 at April 30, 2015 and 2014, respectively. Amortization of assets held under capital leases is $4,320, $309, $3,398 and $2,867 in Successor 2015, Successor 2014, Predecessor 2014 and Predecessor 2013, respectively, included with depreciation expense on the Consolidated Statements of Operations and Comprehensive Income (Loss).
The Company also leases certain noncancelable operating leases, primarily office and warehouse facilities and equipment. These leases generally contain renewal options for periods ranging from one to five years. Rent expense for operating leases, which may have escalating rents over the terms of the leases, is recorded on a straight-line basis over the minimum lease terms. Rent expense under operating leases, including amounts paid to affiliated partnerships, approximated $29,910, $1,458, $19,878 and $18,802 for Successor 2015, Successor 2014, Predecessor 2014 and Predecessor 2013, respectively. As existing leases expire, the Company anticipates such leases will be renewed or replaced with other leases that are substantially similar in terms and rental amounts which are consistent with market rates at the time of renewal.
At April 30, 2015, the approximate amounts of the annual future minimum lease payments under noncancelable operating leases, including amounts payable to affiliated partnerships, and future maturities of capital lease obligations are as follows:
| | Capital | Operating | |||||
|---|---|---|---|---|---|---|---|
Year Ended April 30, | |||||||
2016 | $ | 3,826 | $ | 29,891 | |||
2017 | 2,523 | 27,605 | |||||
2018 | 989 | 24,232 | |||||
2019 | 400 | 17,735 | |||||
2020 | 322 | 11,388 | |||||
Thereafter | 568 | 12,382 | |||||
| | | | | | | | |
| $ | 8,628 | $ | 123,233 | ||||
| | | | | | | | |
Less: Current portion | (3,826 | ) | |||||
| | | | | | | | |
Long-term capitalized lease obligations | $ | 4,802 | |||||
| | | | | | | | |
| | | | | | | | |
| | | | | | | | |
Litigation, Claims and Assessment
The Company is a defendant in various lawsuits and administrative actions associated with personal injuries, claims of former employees, and other events arising in the normal course of business. As discussed in Note 1 "—Insurance Liabilities", the Company records liabilities for these claims, and assets for amounts recoverable from the insurer, for these claims covered by insurance.
F-39
GMS Inc.
Notes to Consolidated Financial Statements (Continued)
Year Ended April 30, 2015, Period From April 1, 2014 to April 30, 2014 (Successor),
Period From May 1, 2013 to March 31, 2014 (Predecessor), and Year Ended April 30, 2013
(in thousands of dollars, except for share and per share data)
18. Segments
The Company applies the provisions of ASC Topic 280, "Segment Reporting." ASC 280, which is based on a management approach to segment reporting, establishes requirements to report selected segment information quarterly and to report annually entity-wide disclosures about products, major customers and the geographies in which the entity holds material assets and reports revenue. An operating segment is defined as a component that engages in business activities whose operating results are reviewed by the chief operating decision maker ("CODM") and for which discrete financial information is available. For purposes of evaluation under these segment reporting principles, the CODM assesses the Company's ongoing performance based on the periodic review of net sales, Adjusted EBITDA and certain other measures for each of the operating segments. Based on the provisions of ASC 280, the Company has determined that it has seven operating segments. These operating segments are based on the six geographic divisions, which are Central, Northeast, Southern, Southeast, Southwest and Western, and Tool Source Warehouse, Inc. Due to similarities between the geographic operating segments, we have aggregated them into one reportable segment in accordance with ASC 280. The accounting policies of the operating segments are the same as those described in the summary of significant policies. In addition to our reportable segment, the Company's consolidated results include "other," and is comprised of corporate activities and Tool Source Warehouse, Inc., which functions primarily as an internal distributor of tools. Net sales, Adjusted EBITDA and certain other measures for the reportable segment and total continuing operations for the periods indicated are as follows:
| | Successor April 30, 2015 | | ||||||||||||||
|---|---|---|---|---|---|---|---|---|---|---|---|---|---|---|---|---|
| | April 30, 2015 | |||||||||||||||
| | | | Depreciation & amortization | Adjusted EBITDA | ||||||||||||
| | Net sales | Gross profit | Total assets | |||||||||||||
Geographic divisions | $ | 1,545,686 | $ | 474,363 | $ | 63,877 | $ | 113,311 | $ | 1,143,104 | ||||||
Other | 24,399 | 4,608 | 288 | 549 | 11,472 | |||||||||||
| | | | | | | | | | | | | | | | | |
| $ | 1,570,085 | $ | 478,971 | $ | 64,165 | $ | 113,860 | $ | 1,154,576 | |||||||
| | | | | | | | | | | | | | | | | |
| | | | | | | | | | | | | | | | | |
| | | | | | | | | | | | | | | | | |
| | Successor April 1 - April 30, 2014 | | ||||||||||||||
|---|---|---|---|---|---|---|---|---|---|---|---|---|---|---|---|---|
| | April 30, 2014 | |||||||||||||||
| | | | Depreciation & amortization | Adjusted EBITDA | ||||||||||||
| | Net sales | Gross profit | Total assets | |||||||||||||
Geographic divisions | $ | 125,620 | $ | 29,164 | $ | 6,316 | $ | 8,468 | $ | 1,114,973 | ||||||
Other | 1,712 | 213 | 20 | (96 | ) | 7,378 | ||||||||||
| | | | | | | | | | | | | | | | | |
| $ | 127,332 | $ | 29,377 | $ | 6,336 | $ | 8,372 | $ | 1,122,351 | |||||||
| | | | | | | | | | | | | | | | | |
| | | | | | | | | | | | | | | | | |
| | | | | | | | | | | | | | | | | |
| | Predecessor May 1 - March 31, 2014 | ||||||||||||
|---|---|---|---|---|---|---|---|---|---|---|---|---|---|
| | Net sales | Gross profit | Depreciation & amortization | Adjusted EBITDA | |||||||||
Geographic divisions | $ | 1,208,777 | $ | 370,235 | $ | 12,048 | $ | 79,040 | |||||
Other | 17,231 | 2,753 | 205 | (350 | ) | ||||||||
| | | | | | | | | | | | | | |
| $ | 1,226,008 | $ | 372,988 | $ | 12,253 | $ | 78,690 | ||||||
| | | | | | | | | | | | | | |
| | | | | | | | | | | | | | |
| | | | | | | | | | | | | | |
F-40
GMS Inc.
Notes to Consolidated Financial Statements (Continued)
Year Ended April 30, 2015, Period From April 1, 2014 to April 30, 2014 (Successor),
Period From May 1, 2013 to March 31, 2014 (Predecessor), and Year Ended April 30, 2013
(in thousands of dollars, except for share and per share data)
18. Segments (Continued)
| | Predecessor April 30, 2013 | April 30, 2013 | ||||||||||||||
|---|---|---|---|---|---|---|---|---|---|---|---|---|---|---|---|---|
| | | | Depreciation & amortization | Adjusted EBITDA | ||||||||||||
| | Net sales | Gross profit | Total assets | |||||||||||||
Geographic divisions | $ | 1,141,794 | $ | 334,081 | $ | 11,423 | $ | 57,294 | $ | 488,231 | ||||||
Other | 19,816 | 3,198 | 204 | 217 | 6,395 | |||||||||||
| | | | | | | | | | | | | | | | | |
| $ | 1,161,610 | $ | 337,279 | $ | 11,627 | $ | 57,511 | $ | 494,626 | |||||||
| | | | | | | | | | | | | | | | | |
| | | | | | | | | | | | | | | | | |
| | | | | | | | | | | | | | | | | |
Reconciliation to consolidated financial statements:
| | Successor | | Predecessor | | ||||||||||||
|---|---|---|---|---|---|---|---|---|---|---|---|---|---|---|---|---|
| | Year Ended April 30, 2015 | April 1 - April 30, 2014 | | May 1, 2013 - March 31, 2014 | Year Ended April 30, 2013 | | ||||||||||
Adjusted EBITDA | $ | 113,860 | $ | 8,372 | $ | 78,690 | $ | 57,511 | ||||||||
Interest expense | (36,396 | ) | (2,954 | ) | (4,226 | ) | (4,413 | ) | ||||||||
Change in fair value of mandatorily redeemable common shares | — | — | (200,004 | ) | (198,212 | ) | ||||||||||
Interest income | 1,010 | 76 | 846 | 798 | ||||||||||||
Income tax benefit (expense) | 4,526 | 6,863 | (6,623 | ) | (11,534 | ) | ||||||||||
Depreciation expense | (32,208 | ) | (3,818 | ) | (12,224 | ) | (11,665 | ) | ||||||||
Amortization expense | (31,957 | ) | (2,518 | ) | (38 | ) | (72 | ) | ||||||||
Executive compensation | — | (20 | ) | (2,427 | ) | (13,420 | ) | |||||||||
Stock appreciation rights expense | (2,268 | ) | (80 | ) | (1,288 | ) | (1,061 | ) | ||||||||
Redeemable noncontrolling interests | (1,859 | ) | (71 | ) | (2,957 | ) | (2,195 | ) | ||||||||
Equity-based compensation | (6,455 | ) | (1 | ) | (27 | ) | (82 | ) | ||||||||
Acquisition related costs | (837 | ) | (16,155 | ) | (51,809 | ) | (230 | ) | ||||||||
Severance and other costs for discontinued operations and closed branches | (413 | ) | — | — | 30 | |||||||||||
Transaction costs (acquisitions and other) | (1,891 | ) | — | — | — | |||||||||||
(Loss) gain on disposal of assets | (1,089 | ) | (170 | ) | 1,034 | 2,231 | ||||||||||
Management fee to related party | (2,250 | ) | (188 | ) | — | — | ||||||||||
Effects of fair value adjustments to inventory | (5,012 | ) | (8,289 | ) | — | — | ||||||||||
Interest rate swap and cap mark-to-market | (2,494 | ) | — | 192 | (313 | ) | ||||||||||
Contributions from acquisitions | (8,064 | ) | ||||||||||||||
| | | | | | | | | | | | | | | | | |
Net (Loss) | $ | (13,797 | ) | $ | (18,953 | ) | $ | (200,861 | ) | $ | (182,627 | ) | ||||
| | | | | | | | | | | | | | | | | |
| | | | | | | | | | | | | | | | | |
| | | | | | | | | | | | | | | | | |
The Company does not earn revenues or have long-lived assets located in foreign countries. In accordance with the enterprise-wide disclosure requirements of ASC 280, the Company's net sales from
F-41
GMS Inc.
Notes to Consolidated Financial Statements (Continued)
Year Ended April 30, 2015, Period From April 1, 2014 to April 30, 2014 (Successor),
Period From May 1, 2013 to March 31, 2014 (Predecessor), and Year Ended April 30, 2013
(in thousands of dollars, except for share and per share data)
18. Segments (Continued)
external customers by main product lines are as follows for Successor 2015, Successor 2014, Predecessor 2014, and Predecessor 2013, respectively:
| | Successor | | Predecessor | ||||||||||||
|---|---|---|---|---|---|---|---|---|---|---|---|---|---|---|---|
| | Year Ended April 30, 2015 | April 1 - April 30, 2014 | | May 1, 2013 - March 31, 2014 | Year Ended April 30, 2013 | ||||||||||
Wallboard | $ | 718,102 | $ | 58,529 | $ | 544,272 | $ | 468,644 | |||||||
Ceilings | 278,749 | 23,559 | 233,440 | 253,951 | |||||||||||
Steel | 243,173 | 19,365 | 197,173 | 198,377 | |||||||||||
Other products | 330,061 | 25,879 | 251,123 | 240,638 | |||||||||||
| | | | | | | | | | | | | | | | |
Total net sales | $ | 1,570,085 | $ | 127,332 | $ | 1,226,008 | $ | 1,161,610 | |||||||
| | | | | | | | | | | | | | | | |
| | | | | | | | | | | | | | | | |
| | | | | | | | | | | | | | | | |
19. Condensed Parent Company Financial Information
On a standalone basis, the Company has no material assets or operations other than its ownership in GYP Holdings II Corp., which in turn has no material assets or operations other than its ownership in GYP Holdings III Corp. GYP Holdings III Corp. is the Lead Borrower under the ABL Facility and the Borrower under the Term Loan Facilities, all of which contain significant restrictions on the Company's ability to obtain funds from GYP Holdings III Corp. or any of GYP Holdings III Corp.'s subsidiaries through dividends, loans or advances. Accordingly, the following condensed financial information has been presented on a "Parent-only" basis.
Under a "Parent-only" presentation, the Company's investments in its consolidated subsidiaries are presented under the equity method of accounting using the same accounting principles and policies described in the notes to the Consolidated Financial Statements.
The following table presents the financial position of the Company as of April 30, 2015 and 2014, and the results of operations for the Successor 2015 and Successor 2014.
F-42
GMS Inc.
Notes to Consolidated Financial Statements (Continued)
Year Ended April 30, 2015, Period From April 1, 2014 to April 30, 2014 (Successor),
Period From May 1, 2013 to March 31, 2014 (Predecessor), and Year Ended April 30, 2013
(in thousands of dollars, except for share and per share data)
19. Condensed Parent Company Financial Information (Continued)
GMS Inc.
Condensed Parent Company Balance Sheets
| | April 30, 2015 | April 30, 2014 | |||||
|---|---|---|---|---|---|---|---|
Investment in subsidiary | $ | 297,472 | $ | 299,434 | |||
| | | | | | | | |
Total assets | 297,472 | 299,434 | |||||
| | | | | | | | |
| | | | | | | | |
| | | | | | | | |
Stockholders' equity: | |||||||
Common stock, $0.01 par value, authorized 5,000,000 shares; 3,224,838 and 3,183,870 shares issued and outstanding at April 30, 2015 and 2014, respectively | 32 | 32 | |||||
Additional paid-in capital | 330,180 | 318,355 | |||||
Accumulated deficit | (32,750 | ) | (18,953 | ) | |||
Accumulated other comprehensive income | 10 | — | |||||
| | | | | | | | |
Total stockholders' equity | $ | 297,472 | $ | 299,434 | |||
| | | | | | | | |
| | | | | | | | |
| | | | | | | | |
GMS Inc.
Condensed Parent Company Statements of Operations and Comprehensive Income (Loss)
| | Year Ended April 30, 2015 | April 1 - April 30, 2014 | |||||
|---|---|---|---|---|---|---|---|
Net loss in subsidiaries | $ | (13,797 | ) | $ | (18,953 | ) | |
Net loss | $ | (13,797 | ) | $ | (18,953 | ) | |
Comprehensive loss | $ | (13,787 | ) | $ | (18,953 | ) | |
Weighted average shares | 3,194,566 | 3,183,870 | |||||
Net loss per share | $ | (4.32 | ) | $ | (5.95 | ) | |
GMS Inc.
Condensed Parent Company Statements of Cash Flows
| | Year Ended April 30, 2015 | April 1 - April 30, 2014 | |||||
|---|---|---|---|---|---|---|---|
Net cash provided by operating activities | $ | — | $ | — | |||
Net cash used in investing activities | — | (224,108 | ) | ||||
Net cash provided by financing activities | $ | — | $ | 224,108 | |||
At April 30, 2015, restricted net assets of the Company's consolidated subsidiaries approximated $295,972. During Successor 2015, Successor 2014, Predecessor 2014 and Predecessor 2013, the Company's consolidated subsidiaries did not pay any cash dividends to the Company.
F-43
GMS Inc.
Notes to Consolidated Financial Statements (Continued)
Year Ended April 30, 2015, Period From April 1, 2014 to April 30, 2014 (Successor),
Period From May 1, 2013 to March 31, 2014 (Predecessor), and Year Ended April 30, 2013
(in thousands of dollars, except for share and per share data)
20. Valuation and Qualifying Accounts
Allowance for Doubtful Accounts Rollforward
| | Balance at beginning of period | Provision | Charged to other accounts(a) | Deductions | Balance at end of period | |||||||||||
|---|---|---|---|---|---|---|---|---|---|---|---|---|---|---|---|---|
Fiscal Year Ended April 30, 2015 | (2,752 | ) | (5,828 | ) | (1,158 | ) | 1,105 | (8,633 | ) | |||||||
One Month Ended April 30, 2014—Successor | — | (1,593 | ) | (1,600 | ) | 441 | (2,752 | ) | ||||||||
| | | | | | | | | | | | | | | | | |
Eleven Months Ended March 31, 2014—Predecessor | (17,066 | ) | (1,599 | ) | 79 | 2,625 | (15,961 | ) | ||||||||
Fiscal Year Ended April 30, 2013 | (16,699 | ) | (2,206 | ) | (23 | ) | 1,862 | (17,066 | ) | |||||||
- (a)
- Charged to other accounts represents the net increase (decrease) for specifically reserved accounts, as well as the net change in reserves for sales discounts, service charges and sales returns.
Valuation Allowance on Deferred Tax Assets Rollforward
| | Balance at beginning of period | Additions charged to costs and expenses | Deductions | Balance at end of period | |||||||||
|---|---|---|---|---|---|---|---|---|---|---|---|---|---|
Fiscal Year Ended April 30, 2015 | (1,276 | ) | (67 | ) | 1,200 | (143 | ) | ||||||
One Month Ended April 30, 2014—Successor | (1,396 | ) | (1 | ) | 121 | (1,276 | ) | ||||||
| | | | | | | | | | | | | | |
Eleven Months Ended March 31, 2014—Predecessor | (1,676 | ) | (816 | ) | 1,096 | (1,396 | ) | ||||||
Fiscal Year Ended April 30, 2013 | (1,603 | ) | (187 | ) | 114 | (1,676 | ) | ||||||
21. Subsequent Event
The Company has evaluated subsequent events through July 28, 2015, which is the date these financial statements were issued.
F-44

Through and including , 2015 (the 25th day after the date of this prospectus), all dealers effecting transactions in these securities, whether or not participating in this offering, may be required to deliver a prospectus. This is in addition to a dealer's obligation to deliver a prospectus when acting as an underwriter and with respect to an unsold allotment or subscription.
PART II
INFORMATION NOT REQUIRED IN PROSPECTUS
Item 13. Other Expenses of Issuance and Distribution
The following table sets forth all the costs and expenses, other than underwriting discounts, payable in connection with the sale of the shares of common stock being registered hereby. Except as otherwise noted, the Registrant will pay all of the costs and expenses set forth in the following table. All amounts shown below are estimates, except the SEC registration fee, the FINRA filing fee and the stock exchange listing fee:
| | Amount | |||
|---|---|---|---|---|
SEC registration fee | $ | 23,240 | ||
FINRA filing fee | 30,500 | |||
Stock exchange listing fee | * | |||
Printing and engraving expenses | * | |||
Legal fees and expenses | * | |||
Accounting fees and expenses | * | |||
Blue Sky fees and expenses | * | |||
Transfer agent and registrar fees | * | |||
Miscellaneous expenses | * | |||
| | | | | |
Total | $ | * | ||
| | | | | |
| | | | | |
| | | | | |
- *
- To be filed by amendment.
Item 14. Indemnification of Directors and Officers
Section 102 of the Delaware law allows a corporation to eliminate the personal liability of a director to the corporation or its stockholders for monetary damages for breach of fiduciary duty as a director, except in cases where the director breached his or her duty of loyalty to the corporation or its stockholders, failed to act in good faith, engaged in intentional misconduct or a knowing violation of the law, willfully or negligently authorized the unlawful payment of a dividend or approved an unlawful stock redemption or repurchase or obtained an improper personal benefit. The registrant's certificate of incorporation contains a provision which eliminates directors' personal liability as set forth above.
The registrant's certificate of incorporation and by-laws provide in effect that the registrant shall indemnify its directors and officers to the extent permitted by the Delaware law. Section 145 of the Delaware law provides that a Delaware corporation has the power to indemnify its directors, officers, employees and agents in certain circumstances. Subsection (a) of Section 145 of the Delaware law empowers a corporation to indemnify any director, officer, employee or agent, or former director, officer, employee or agent, who was or is a party or is threatened to be made a party to any threatened, pending or completed action, suit or proceeding, whether civil, criminal, administrative or investigative (other than an action by or in the right of the corporation), against expenses (including attorneys' fees), judgments, fines and amounts paid in settlement actually and reasonably incurred in connection with such action, suit or proceeding provided that such director, officer, employee or agent acted in good faith and in a manner he or she reasonably believed to be in or not opposed to the best interests of the corporation, and, with respect to any criminal action or proceeding, provided that such director, officer, employee or agent had no reasonable cause to believe that his or her conduct was unlawful.
Subsection (b) of Section 145 of the Delaware law empowers a corporation to indemnify any director, officer, employee or agent, or former director, officer, employee or agent, who was or is a party or is threatened to be made a party to any threatened, pending or completed action or suit by or in the right of the corporation to procure a judgment in its favor by reason of the fact that such person
II-1
acted in any of the capacities set forth above, against expenses (including attorneys' fees) actually and reasonably incurred in connection with the defense or settlement of such action or suit provided that such person acted in good faith and in a manner he or she reasonably believed to be in or not opposed to the best interests of the corporation, except that no indemnification may be made in respect of any claim, issue or matter as to which such person shall have been adjudged to be liable to the corporation unless and only to the extent that the Court of Chancery shall determine that despite the adjudication of liability such person is fairly and reasonably entitled to indemnity for such expenses which the court shall deem proper.
Section 145 further provides that to the extent that a director or officer or employee of a corporation has been successful in the defense of any action, suit or proceeding referred to in subsections (a) and (b) or in the defense of any claim, issue or matter therein, he or she shall be indemnified against expenses (including attorneys' fees) actually and reasonably incurred by him or her in connection therewith; that indemnification provided by Section 145 shall not be deemed exclusive of any other rights to which the party seeking indemnification may be entitled; and the corporation is empowered to purchase and maintain insurance on behalf of a director, officer, employee or agent of the corporation against any liability asserted against him or her or incurred by him or her in any such capacity or arising out of his or her status as such whether or not the corporation would have the power to indemnify him or her against such liabilities under Section 145; and that, unless indemnification is ordered by a court, the determination that indemnification under subsections (a) and (b) of Section 145 is proper because the director, officer, employee or agent has met the applicable standard of conduct under such subsections shall be made by (1) a majority vote of the directors who are not parties to such action, suit or proceeding, even though less than a quorum, or (2) if there are no such directors, or if such directors so direct, by independent legal counsel in a written opinion, or (3) by the stockholders.
The registrant has in effect insurance policies for general officers' and directors' liability insurance covering all of its officers and directors.
Item 15. Recent Sales of Unregistered Securities
During the three years preceding the filing of this registration statement, we have issued the following securities which were not registered under the Securities Act of 1933, as amended (all share numbers before the proposed split):
In connection with the closing of the Acquisition, on April 1, 2014, we issued 3,183,870 shares of our common stock. From the closing of the Acquisition to , 2015 we have issued an additional shares of our common stock.
During the past three years, we issued options to purchase an aggregate of 278,013 shares of common stock under the Option Plan.
The issuances of the securities in the transactions described above were deemed to be exempt from registration under the Securities Act in reliance upon Section 4(a)(2) of the Securities Act and/or Rules 506 and 701 promulgated thereunder. The securities were issued directly by the registrant and did not involve a public offering or general solicitation. The recipients of such securities represented their intentions to acquire the securities for investment purposes only and not with a view to, or for sale in connection with, any distribution thereof.
Item 16. Exhibits and Financial Statement Schedules
(a) Exhibits.
See the Exhibit Index attached to this registration statement, which is incorporated by reference herein.
II-2
(b) Financial Statement Schedules.
Schedules not listed above have been omitted because the information required to be set forth therein is not applicable or is shown in the financial statements or the notes thereto.
The undersigned registrant hereby undertakes to provide to the underwriters at the closing specified in the underwriting agreement certificates in such denominations and registered in such names as required by the underwriters to permit prompt delivery to each purchaser.
Insofar as indemnification for liabilities arising under the Securities Act of 1933 may be permitted to directors, officers and controlling persons of the registrant pursuant to the foregoing provisions, or otherwise, the registrant has been advised that in the opinion of the Securities and Exchange Commission such indemnification is against public policy as expressed in the Securities Act and is, therefore, unenforceable. In the event that a claim for indemnification against such liabilities (other than the payment by the registrant of expenses incurred or paid by a director, officer or controlling person of the registrant in the successful defense of any action, suit or proceeding) is asserted by such director, officer or controlling person in connection with the securities being registered, the registrant will, unless in the opinion of its counsel the matter has been settled by controlling precedent, submit to a court of appropriate jurisdiction the question whether such indemnification by it is against public policy as expressed in the Securities Act and will be governed by the final adjudication of such issue.
The undersigned registrant hereby undertakes that:
(1) For purposes of determining any liability under the Securities Act of 1933, the information omitted from the form of prospectus filed as part of this registration statement in reliance upon Rule 430A and contained in a form of prospectus filed by the registrant pursuant to Rule 424(b)(1) or (4) or 497(h) under the Securities Act shall be deemed to be part of this registration statement as of the time it was declared effective.
(2) For the purpose of determining any liability under the Securities Act of 1933, each post-effective amendment that contains a form of prospectus shall be deemed to be a new registration statement relating to the securities offered therein, and the offering of such securities at that time shall be deemed to be the initial bona fide offering thereof.
(3) For the purpose of determining liability of the registrant under the Securities Act of 1933 to any purchaser in the initial distribution of the securities, the undersigned registrant undertakes that in a primary offering of securities of the undersigned registrant pursuant to this registration statement, regardless of the underwriting method used to sell the securities to the purchaser, if the securities are offered or sold to such purchaser by means of any of the following communications, the undersigned registrant will be a seller to the purchaser and will be considered to offer or sell such securities to such purchaser:
(i) Any preliminary prospectus or prospectus of the undersigned registrant relating to the offering required to be filed pursuant to Rule 424 under the Securities Act;
(ii) Any free writing prospectus relating to the offering prepared by or on behalf of the undersigned registrant or used or referred to by the undersigned registrant;
(iii) The portion of any other free writing prospectus relating to the offering containing material information about the undersigned registrant or its securities provided by or on behalf of the undersigned registrant; and
(iv) Any other communication that is an offer in the offering made by the undersigned registrant to the purchaser.
II-3
Pursuant to the requirements of the Securities Act of 1933, as amended, the registrant has duly caused this Registration Statement to be signed on its behalf by the undersigned, thereunto duly authorized, in the City of Tucker, State of Georgia, on this 1st day of September, 2015.
| GMS INC. | ||||
By: | /s/ H. DOUGLAS GOFORTH H. Douglas Goforth Chief Financial Officer | |||
Pursuant to the requirements of the Securities Act of 1933, this registration statement has been signed below by the following persons in the capacities and on the dates indicated.
Signature | Title | Date | ||||
|---|---|---|---|---|---|---|
| * G. Michael Callahan, Jr. | Chief Executive Officer, President and Director (Principal Executive Officer) | September 1, 2015 | ||||
/s/ H. DOUGLAS GOFORTH H. Douglas Goforth | Chief Financial Officer (Principal Financial Officer) | September 1, 2015 | ||||
* Richard Alan Adams | Chief Accounting Officer (Principal Accounting Officer) | September 1, 2015 | ||||
* Richard K. Mueller | Chairman of the Board | September 1, 2015 | ||||
* Peter C. Browning | Director | September 1, 2015 | ||||
* Justin de La Chapelle | Director | September 1, 2015 | ||||
* John J. Gavin | Director | September 1, 2015 | ||||
II-4
Signature | Title | Date | ||||
|---|---|---|---|---|---|---|
| * Theron I. Gilliam | Director | September 1, 2015 | ||||
* Brian R. Hoesterey | Director | September 1, 2015 | ||||
* Ronald R. Ross | Director | September 1, 2015 | ||||
* J. Louis Sharpe | Director | September 1, 2015 | ||||
* J. David Smith | Director | September 1, 2015 | ||||
*By: | /s/ H. DOUGLAS GOFORTH H. Douglas Goforth Attorney-in-fact | |||||
II-5
| Exhibit No. | Exhibit Description | ||
|---|---|---|---|
| 1.1 | * | Form of Underwriting Agreement. | |
3.1 | * | Amended and Restated Certificate of Incorporation of the Company, currently in effect. | |
3.2 | * | Form of Amended and Restated Certificate of Incorporation of the Company, to be effective upon the closing of this offering. | |
3.3 | * | By-laws of the Company, currently in effect. | |
3.4 | * | Form of Amended and Restated By-laws of the Company, to be effective upon the closing of this offering. | |
4.1 | * | Specimen Common Stock Certificate of the Company. | |
5.1 | * | Opinion of Fried, Frank, Harris, Shriver & Jacobson LLP. | |
10.1 | * | Stock Purchase Agreement, by and among GYP Holdings III Corp., Gypsum Management and Supply, Inc. and each of the persons set forth on Schedule A attached thereto as sellers, dated February 11, 2014. | |
10.2 | * | Management Agreement, by and among the Company, GYP Holdings III Corp. and AEA Investors LP, dated April 1, 2014. | |
10.3 | * | Registration Rights Agreement, by and among the Company, certain affiliates of AEA Investors LP and certain investors identified on the signature page thereto, dated April 1, 2014. | |
10.4 | * | Stockholders' Agreement, by and among the Company, certain affiliates of AEA Investors LP and certain investors identified on the signature page thereto, dated April 1, 2014. | |
10.5 | * | ABL Credit Agreement, among GYP Holdings III Corp., the entities listed on Schedule I thereto, GYP Holdings II Corp., Wells Fargo Bank, N.A., the other lenders party thereto, Royal Bank of Canada, Credit Suisse Securities (USA) LLC, UBS Securities LLC, SunTrust Bank and RBC Capital Markets, LLC, dated April 1, 2014. | |
10.6 | * | First Lien Credit Agreement, among GYP Holdings III Corp., the entities listed on Schedule I thereto, GYP Holdings II Corp., Wells Fargo Bank, N.A., the other lenders party thereto, Royal Bank of Canada, Credit Suisse Securities (USA) LLC, UBS Securities LLC, SunTrust Bank and RBC Capital Markets, LLC, dated April 1, 2014. | |
10.7 | * | Second Lien Credit Agreement, among GYP Holdings III Corp., the entities listed on Schedule I thereto, GYP Holdings II Corp., Wells Fargo Bank, N.A., the other lenders party thereto, Royal Bank of Canada, Credit Suisse Securities (USA) LLC, UBS Securities LLC, SunTrust Bank and RBC Capital Markets, LLC, dated April 1, 2014. | |
10.8 | *† | Amended and Restated Employment Agreement, by and between G. Michael Callahan, Jr. and the Company, dated August 28, 2015. | |
10.9 | *† | Employment Agreement, by and between Richard Alan Adams and the Company, dated April 1, 2014. | |
10.10 | *† | Amended and Restated Employment Agreement, by and between Richard K. Mueller and the Company, dated May 1, 2014. | |
II-6
| Exhibit No. | Exhibit Description | ||
|---|---|---|---|
| 10.11 | *† | Employment Agreement, by and between H. Douglas Goforth and the Company, dated August 12, 2014. | |
10.12 | *† | Employment Agreement, by and between Stephen K. Barker and the Company, dated April 1, 2014. | |
10.13 | *† | Separation Agreement, by and between Stephen K. Barker and the Company, dated May 11, 2014. | |
10.14 | *† | Option Exercise and Stock Purchase Agreement by and between Stephen K. Barker and the Company, dated June 1, 2015. | |
10.15 | *† | 2014 GMS Inc. Stock Option Plan, effective April 1, 2014. | |
10.16 | *† | Form of Nonqualified Stock Option Agreement. | |
10.17 | *† | GMS Inc. Annual Incentive Plan. | |
21.1 | * | List of subsidiaries of GMS Inc. | |
23.1 | Consent of PricewaterhouseCoopers LLP, independent registered public accounting firm. | ||
23.2 | * | Consent of Fried, Frank, Harris, Shriver & Jacobson LLP (included in Exhibit 5.1). | |
24.1 | ** | Power of Attorney. | |
- *
- To be filed by amendment.
- **
- Previously filed.
- †
- Indicates a management contract or compensatory plan or arrangement.
II-7