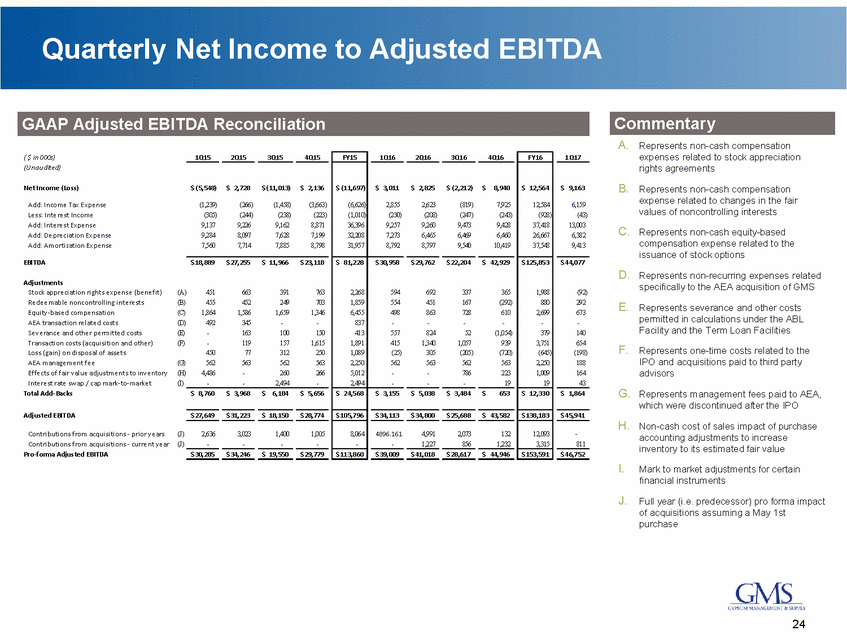
Quarterly Net Income to Adjusted EBITDA Commentary A. Represents non-cash compensation expenses related to stock appreciation rights agreements ( $ in 000s) (Unaudited) B. Net Income (Loss) Represents non-cash compensation expense related to changes in the fair values of noncontrolling interests Add: Income Tax Expense Less: Interest Income Add: Interest Expense Add: Depreciation Expense Add: Amortization Expense C. Represents non-cash equity-based compensation expense related to the issuance of stock options EBITDA D. Represents non-recurring expenses related specifically to the AEA acquisition of GMS Adjustments Stock appreciation rights expense (benefit) Redeemable noncontrolling interests Equity-based compensation AEA transaction related costs Severance and other permitted costs Transaction costs (acquisition and other) Loss (gain) on disposal of assets AEA management fee Effects of fair value adjustments to inventory Interest rate swap / cap mark-to-market Total Add-Backs (A) 451 663 391 763 (B) (C) (D) (E) (F) E. Represents severance and other costs permitted in calculations under the ABL Facility and the Term Loan Facilities F. Represents one-time costs related to the IPO and acquisitions paid to third party advisors (G) (H) (I) G. Represents management fees paid to AEA, which were discontinued after the IPO Adjusted EBITDA H. Non-cash cost of sales impact of purchase accounting adjustments to increase inventory to its estimated fair value Contributions from acquisitions - prior years (J) Contributions from acquisitions - current year (J) Pro-forma Adjusted EBITDA I. Mark to market adjustments for certain financial instruments J. Full year (i.e. predecessor) pro forma impact of acquisitions assuming a May 1st purchase 24 1Q152Q153Q154Q15 FY15 1Q162Q163Q164Q16 FY16 1Q17 $ 9,163 6,159 (43) 13,003 6,382 9,413 $ 44,077 (92) 292 673 - 140 654 (198) 188 164 43 $ 1,864 $ 45,941 - 811 $ 46,752 $ (5,548) $ 2,728 $ (11,013) $ 2,136 (1,239) (266) (1,458) (3,663) (305) (244) (238) (223) 9,137 9,226 9,162 8,871 9,284 8,097 7,628 7,199 7,560 7,714 7,885 8,798 $ (11,697) (6,626) (1,010) 36,396 32,208 31,957 $ 3,011 $ 2,825 $ (2,212) $ 8,940 2,855 2,623 (819) 7,925 (230) (208) (247) (243) 9,257 9,260 9,473 9,428 7,273 6,465 6,469 6,460 8,792 8,797 9,540 10,419 $ 12,564 12,584 (928) 37,418 26,667 37,548 $ 18,889 $ 27,255 $ 11,966 $ 23,118 455 452 249 703 1,864 1,586 1,659 1,346 492 345 - - - 163 100 150 - 119 157 1,615 450 77 312 250 562 563 562 563 4,486 - 260 266 - - 2,494 - $ 81,228 2,268 1,859 6,455 837 413 1,891 1,089 2,250 5,012 2,494 $ 30,958 $ 29,762 $ 22,204 $ 42,929 594 692 337 365 554 451 167 (292) 498 863 728 610 - - - - 557 824 52 (1,054) 415 1,340 1,057 939 (25) 305 (205) (720) 562 563 562 563 - - 786 223 - - - 19 $ 125,853 1,988 880 2,699 - 379 3,751 (645) 2,250 1,009 19 $ 8,760 $ 3,968 $ 6,184 $ 5,656 $ 24,568 $ 3,155 $ 5,038 $ 3,484 $653 $ 12,330 $ 27,649 $ 31,223 $ 18,150 $ 28,774 $ 105,796 $ 34,113 $ 34,800 $ 25,688 $ 43,582 $ 138,183 2,636 3,023 1,400 1,005 - - - - 8,064 - 4896.1614,991 2,073 132 - 1,227 856 1,232 12,093 3,315 $ 30,285 $ 34,246 $ 19,550 $ 29,779 $ 113,860 $ 39,009 $ 41,018 $ 28,617 $ 44,946 $ 153,591 GAAP Adjusted EBITDA Reconciliation