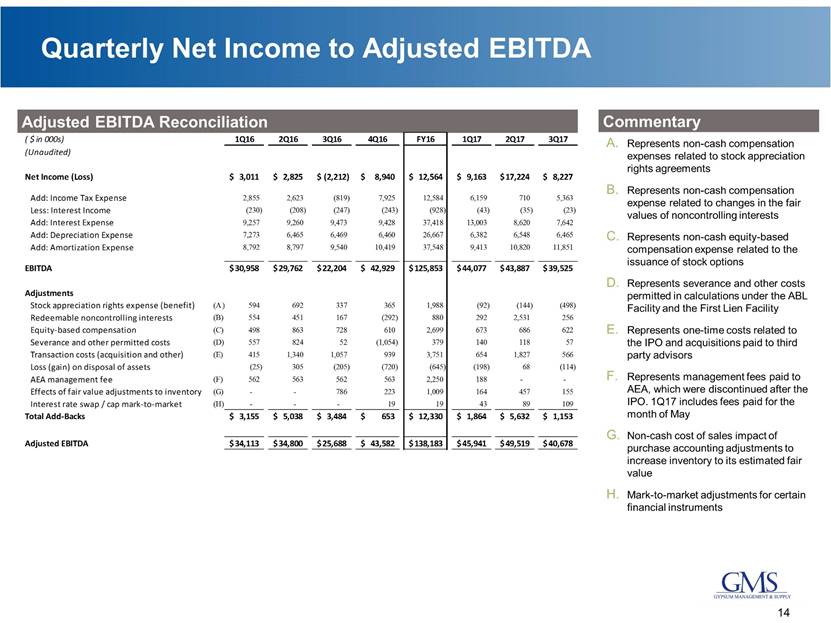
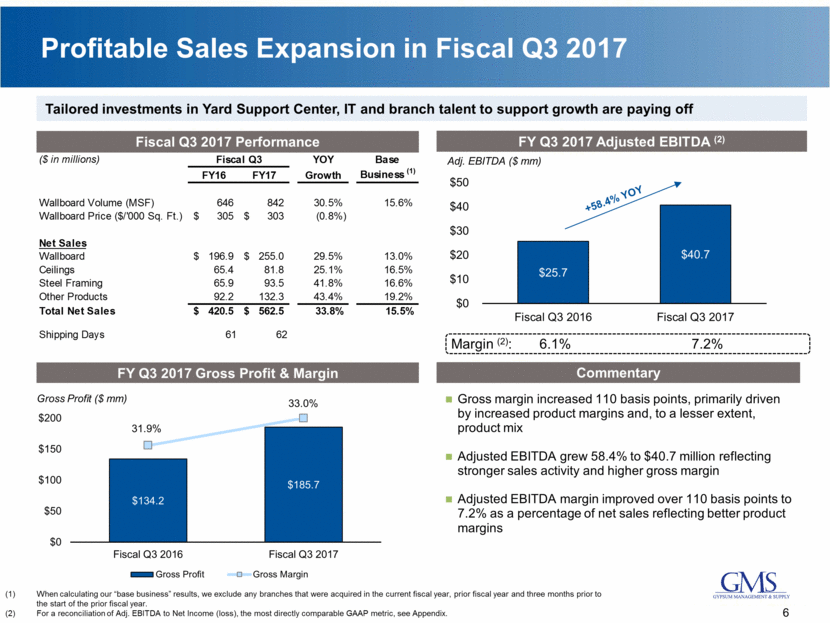
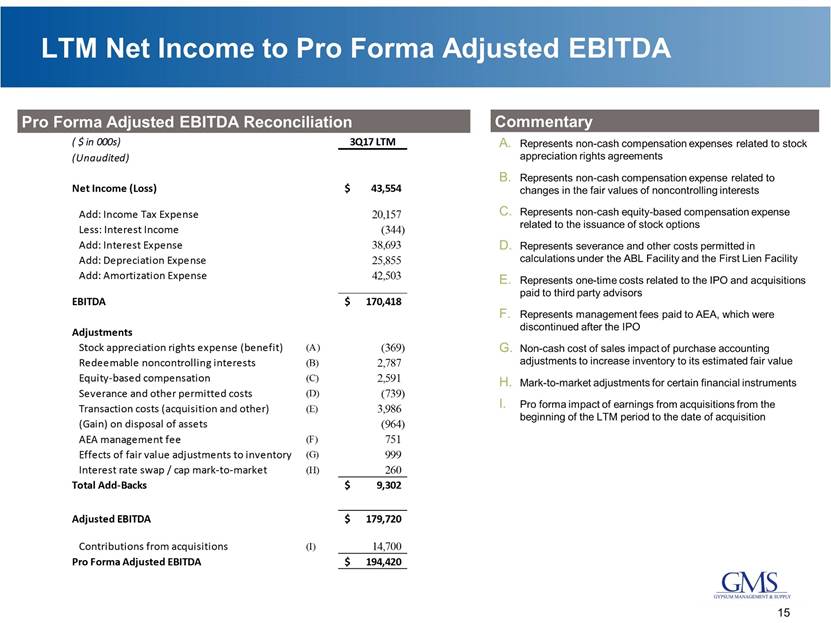
Quarterly Net Income to Adjusted EBITDA Adjusted EBITDA Reconciliation Commentary Represents non-cash compensation expenses related to stock appreciation rights agreements Represents non-cash compensation expense related to changes in the fair values of noncontrolling interests Represents non-cash equity-based compensation expense related to the issuance of stock options Represents severance and other costs permitted in calculations under the ABL Facility and the Term Loan Facilities Represents one-time costs related to the IPO and acquisitions paid to third party advisors Represents management fees paid to AEA, which were discontinued after the IPO. 1Q17 includes fees paid for the month of May Non-cash cost of sales impact of purchase accounting adjustments to increase inventory to its estimated fair value Mark-to-market adjustments for certain financial instruments 14 ( $ in 000s) 1Q16 2Q16 3Q16 4Q16 FY16 1Q17 2Q17 3Q17 (Unaudited) Net Income (Loss) 3,011 $ 2,825 $ (2,212) $ 8,940 $ 12,564 $ 9,163 $ 17,224 $ 8,227 $ Add: Income Tax Expense 2,855 2,623 (819) 7,925 12,584 6,159 710 5,363 Less: Interest Income (230) (208) (247) (243) (928) (43) (35) (23) Add: Interest Expense 9,257 9,260 9,473 9,428 37,418 13,003 8,620 7,642 Add: Depreciation Expense 7,273 6,465 6,469 6,460 26,667 6,382 6,548 6,465 Add: Amortization Expense 8,792 8,797 9,540 10,419 37,548 9,413 10,820 11,851 EBITDA 30,958 $ 29,762 $ 22,204 $ 42,929 $ 125,853 $ 44,077 $ 43,887 $ 39,525 $ Adjustments Stock appreciation rights expense (benefit) (A) 594 692 337 365 1,988 (92) (144) (498) Redeemable noncontrolling interests (B) 554 451 167 (292) 880 292 2,531 256 Equity-based compensation (C) 498 863 728 610 2,699 673 686 622 Severance and other permitted costs (D) 557 824 52 (1,054) 379 140 118 57 Transaction costs (acquisition and other) (E) 415 1,340 1,057 939 3,751 654 1,827 566 Loss (gain) on disposal of assets (25) 305 (205) (720) (645) (198) 68 (114) AEA management fee (F) 562 563 562 563 2,250 188 - - Effects of fair value adjustments to inventory (G) - - 786 223 1,009 164 457 155 Interest rate swap / cap mark-to-market (H) - - - 19 19 43 89 109 Total Add-Backs 3,155 $ 5,038 $ 3,484 $ 653 $ 12,330 $ 1,864 $ 5,632 $ 1,153 $ Adjusted EBITDA 34,113 $ 34,800 $ 25,688 $ 43,582 $ 138,183 $ 45,941 $ 49,519 $ 40,678 $