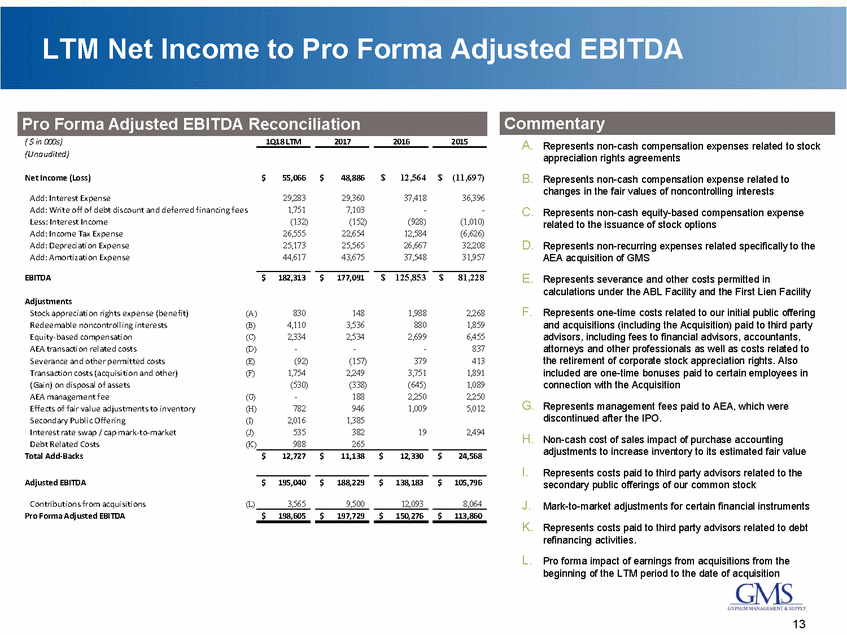
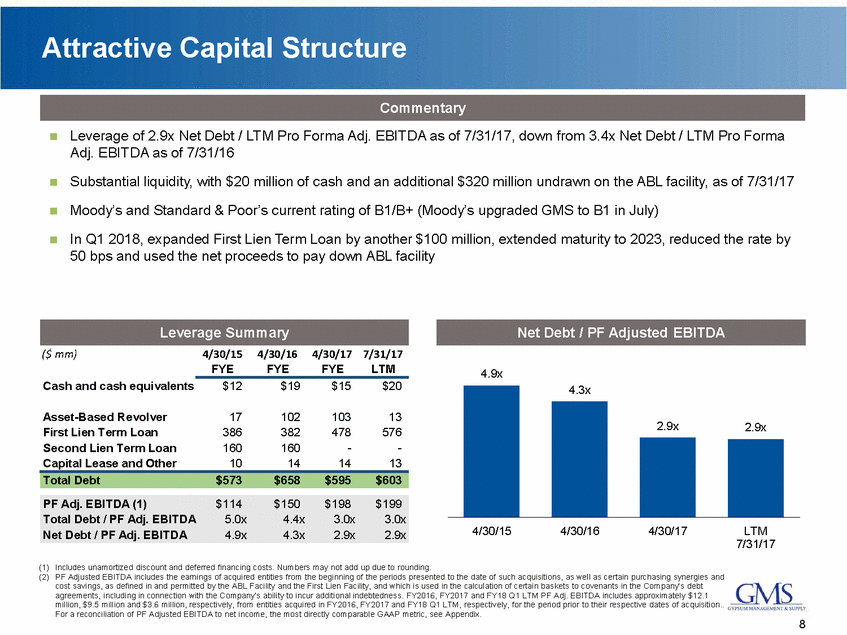
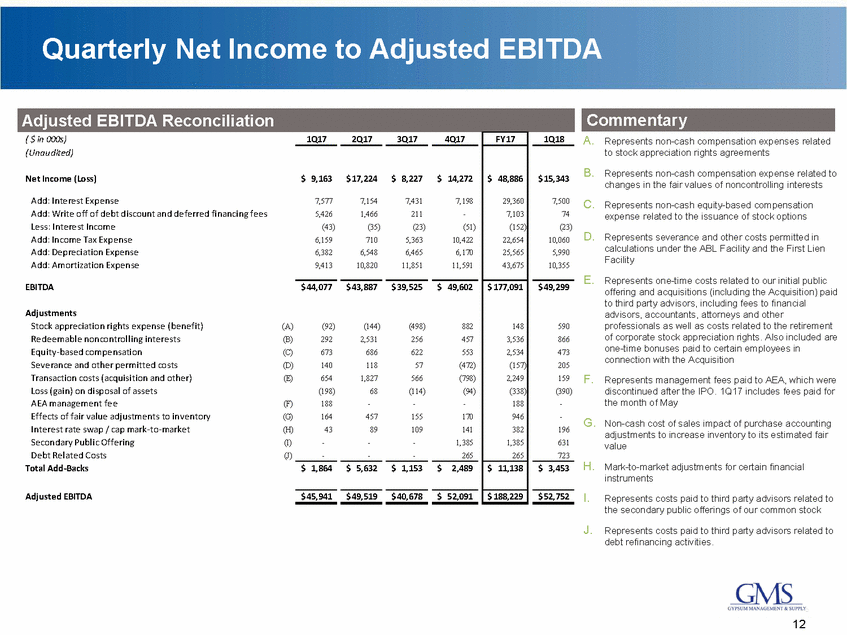
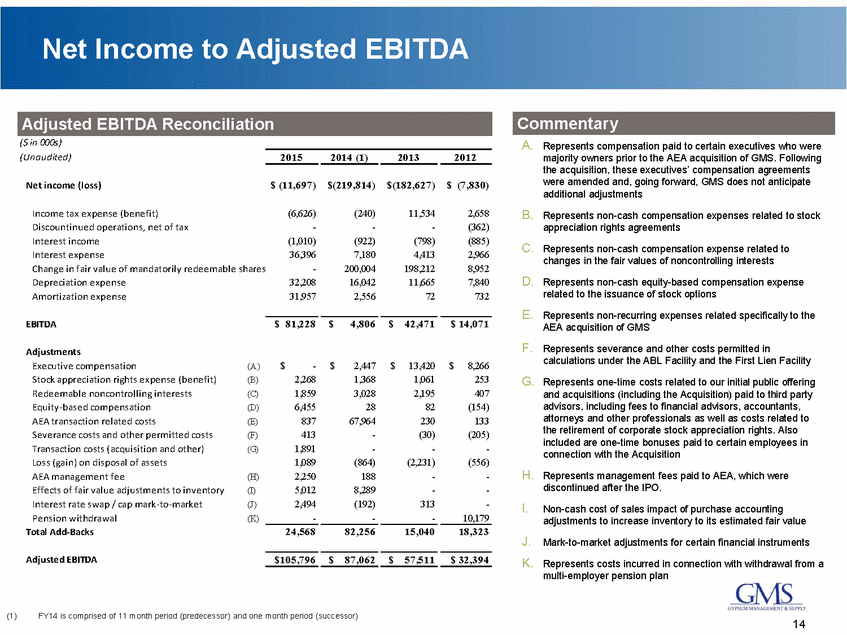
LTM Net Income to Pro Forma Adjusted EBITDA Commentary ( $ in 000s) (Unaudited) 1Q18 LTM 2017 2016 2015 A. Represents non-cash compensation expenses related to stock appreciation rights agreements $ 12,564 $ (11,697) B. Net Income (Loss) $ 55,066 $ 48,886 Represents non-cash compensation expense related to changes in the fair values of noncontrolling interests Add: Interest Expense Add: Write off of debt discount and deferred financing fees Less: Interest Income Add: Income Tax Expense Add: Depreciation Expense Add: Amortization Expense 29,283 1,751 (132) 26,555 25,173 44,617 29,360 7,103 (152) 22,654 25,565 43,675 37,418 - (928) 12,584 26,667 37,548 36,396 - (1,010) (6,626) 32,208 31,957 C. Represents non-cash equity-based compensation expense related to the issuance of stock options D. Represents non-recurring expenses related specifically to the AEA acquisition of GMS $ 125,853 $ 81,228 E. EBITDA $ 182,313 $ 177,091 Represents severance and other costs permitted in calculations under the ABL Facility and the First Lien Facility Adjustments Stock appreciation rights expense (benefit) Redeemable noncontrolling interests Equity-based compensation AEA transaction related costs Severance and other permitted costs Transaction costs (acquisition and other) (Gain) on disposal of assets AEA management fee Effects of fair value adjustments to inventory Secondary Public Offering Interest rate swap / cap mark-to-market Debt Related Costs Total Add-Backs F. Represents one-time costs related to our initial public offering and acquisitions (including the Acquisition) paid to third party advisors, including fees to financial advisors, accountants, attorneys and other professionals as well as costs related to the retirement of corporate stock appreciation rights. Also included are one-time bonuses paid to certain employees in connection with the Acquisition 830 4,110 2,334 - (92) 1,754 (530) - 782 2,016 535 988 148 3,536 2,534 - (157) 2,249 (338) 188 946 1,385 382 265 1,988 880 2,699 - 379 3,751 (645) 2,250 1,009 2,268 1,859 6,455 837 413 1,891 1,089 2,250 5,012 (A) (B) (C) (D) (E) (F) (G) (H) (I) (J) (K) G. Represents management fees paid to AEA, which were discontinued after the IPO. 19 2,494 H. Non-cash cost of sales impact of purchase accounting adjustments to increase inventory to its estimated fair value $ 12,727 $ 11,138 $ 12,330 $ 24,568 I. Represents costs paid to third party advisors related to the secondary public offerings of our common stock Adjusted EBITDA $ 195,040 $ 188,229 $ 138,183 $ 105,796 Contributions from acquisitions Pro Forma Adjusted EBITDA 3,565 9,500 12,093 8,064 J. K. (L) Mark-to-market adjustments for certain financial instruments $ 198,605 $ 197,729 $ 150,276 $ 113,860 Represents costs paid to third party advisors related to debt refinancing activities. L. Pro forma impact of earnings from acquisitions from the beginning of the LTM period to the date of acquisition 13 Pro Forma Adjusted EBITDA Reconciliation