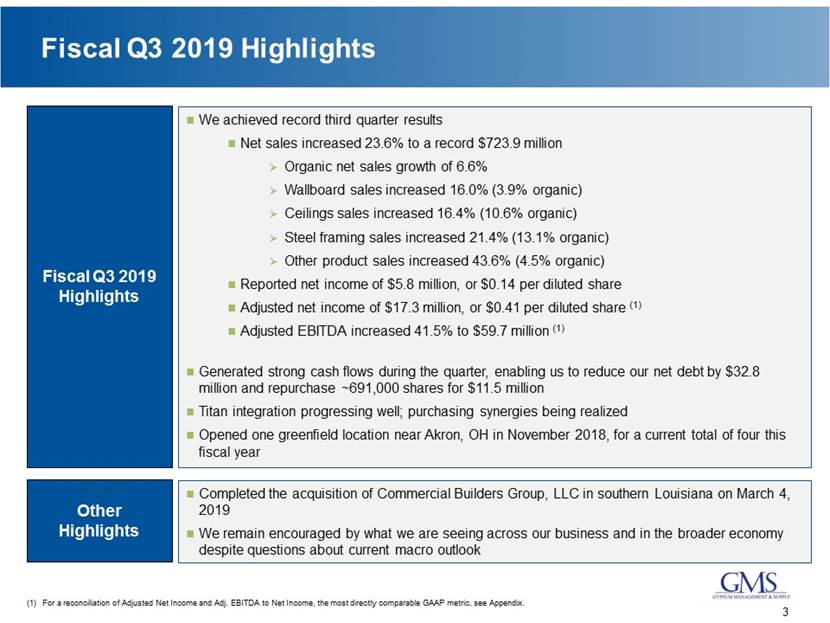
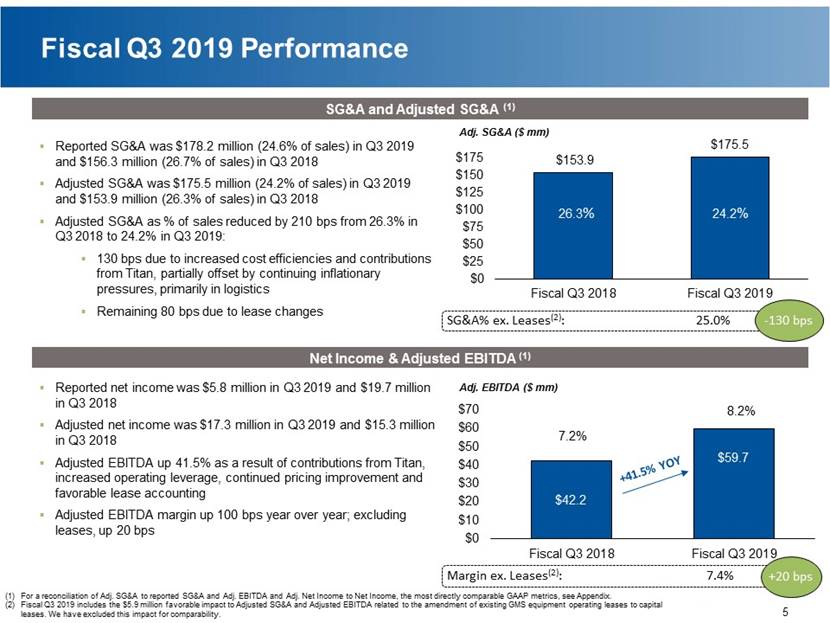
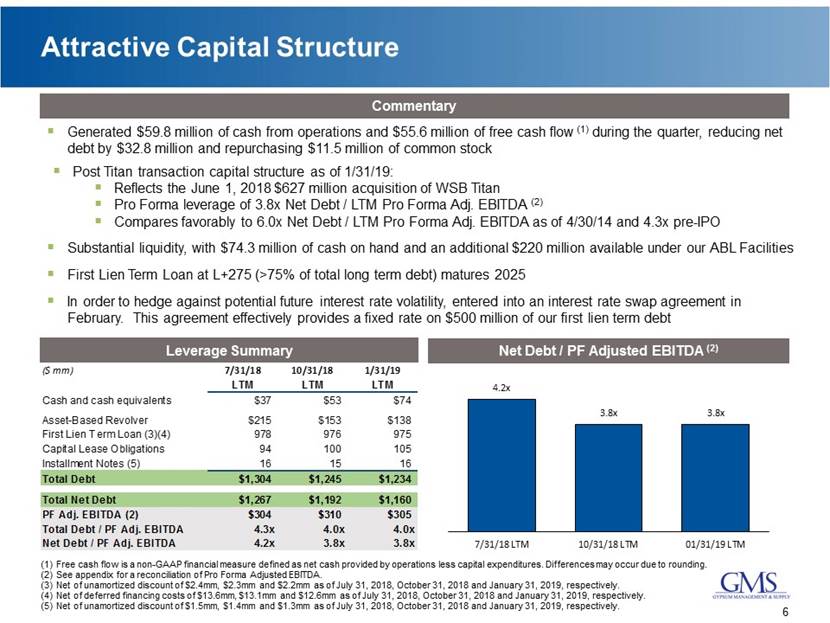
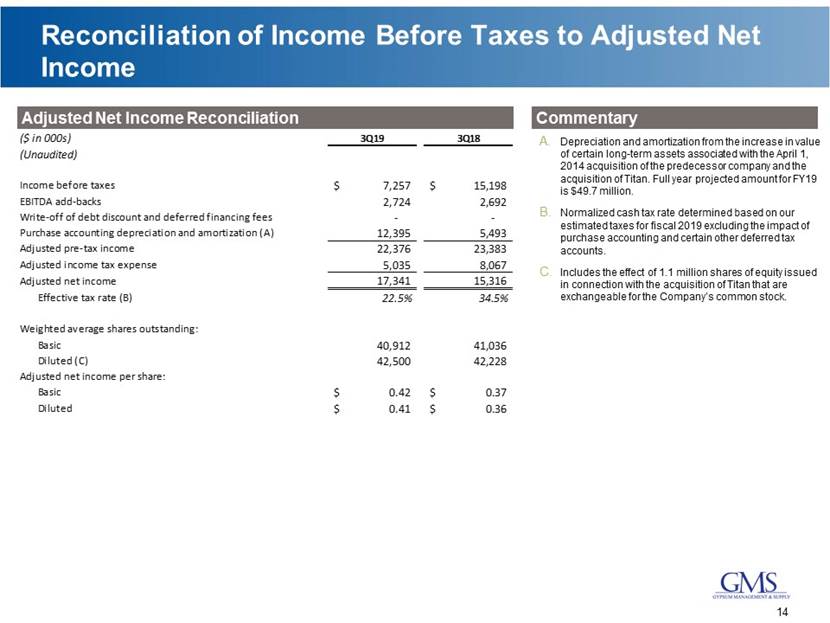
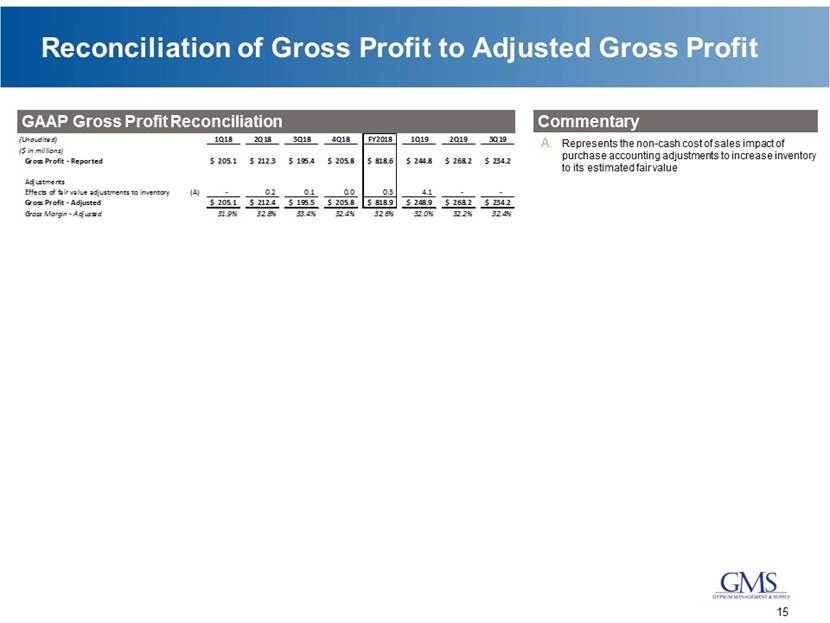
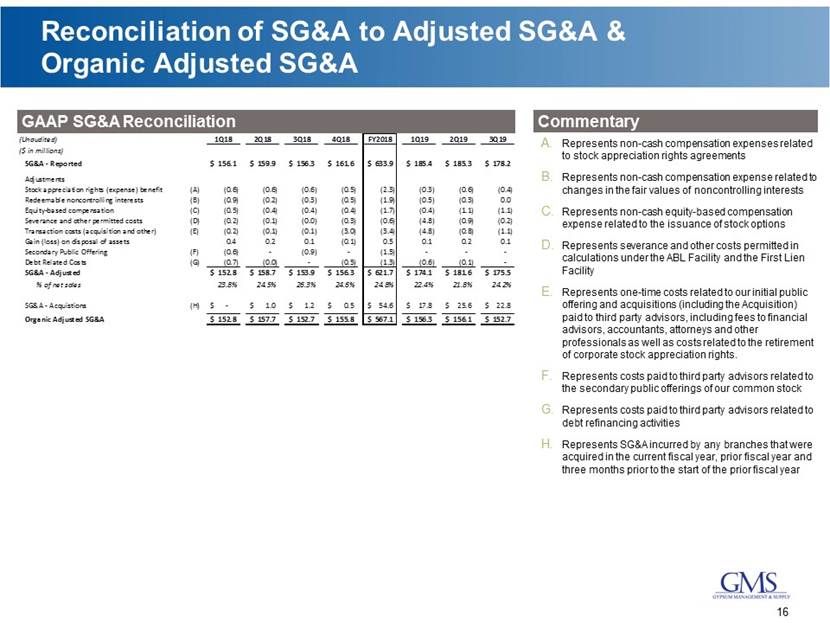
Quarterly Net Income to Adjusted EBITDA Adjusted EBITDA Reconciliation Commentary Represents non-cash compensation expenses related to stock appreciation rights agreements Represents non-cash compensation expense related to changes in the fair values of noncontrolling interests Represents non-cash equity-based compensation expense related to the issuance of share-based awards Represents severance and other costs permitted in calculations under the ABL Facility and the First Lien Facility Represents one-time costs related to our initial public offering and acquisitions paid to third party advisors, including fees to financial advisors, accountants, attorneys and other professionals as well as costs related to the retirement of corporate stock appreciation rights. Represents the non-cash cost of sales impact of purchase accounting adjustments to increase inventory to its estimated fair value Represents mark-to-market adjustments for certain financial instruments Represents costs paid to third party advisors related to the secondary public offerings of our common stock Represents costs paid to third party advisors related to debt refinancing activities 12 ( $ in 000s) 1Q18 2Q18 3Q18 4Q18 FY18 1Q19 2Q19 3Q19 (Unaudited) Net Income 15,343 $ 18,023 $ 19,686 $ 9,919 $ 62,971 $ 8,650 $ 24,912 $ 5,815 $ Add: Interest Expense 7,500 7,917 7,871 8,107 31,395 16,188 19,182 19,526 Add: Write off of debt discount and deferred financing fees 74 - - - 74 - - - Less: Interest Income (23) (26) (44) (84) (177) (236) 203 (10) Add: Income Tax Expense (Benefit) 10,060 9,983 (4,488) 5,328 20,883 2,836 8,059 1,442 Add: Depreciation Expense 5,990 6,023 6,009 6,054 24,075 10,610 11,538 11,919 Add: Amortization Expense 10,355 10,690 10,481 9,928 41,455 15,712 19,249 18,301 EBITDA 49,299 $ 52,610 $ 39,515 $ 39,252 $ 180,676 $ 53,760 $ 83,143 $ 56,993 $ Adjustments Stock appreciation rights expense (A) 590 642 631 455 2,318 334 649 442 Redeemable noncontrolling interests (B) 866 164 340 498 1,868 531 282 (35) Equity-based compensation (C) 473 375 430 418 1,696 404 1,094 1,140 Severance and other permitted costs (D) 205 113 8 256 582 4,836 882 229 Transaction costs (acquisition and other) (E) 159 88 75 3,049 3,370 4,753 841 1,066 (Gain) loss on disposal of assets (390) (207) (51) 139 (509) (121) (173) (118) Effects of fair value adjustments to inventory (F) - 187 89 48 324 4,129 - - Change in fair value of financial instruments (G) 196 238 276 5,415 6,125 6,019 376 - Secondary public offerings (H) 631 - 894 - 1,525 - - - Debt transaction costs (I) 723 35 - 527 1,285 627 51 - Total Add-Backs 3,453 $ 1,635 $ 2,691 $ 10,805 $ 18,582 $ 21,512 $ 4,002 $ 2,724 $ Adjusted EBITDA (as reported) 52,752 $ 54,245 $ 42,207 $ 50,057 $ 199,258 $ 75,272 $ 87,145 $ 59,717 $

