Exhibit 99.1

Raymond James Institutional Investors Conference March 8, 2022
2 Safe Harbor and B asis of Presentation Forward - Looking Statement Safe Harbor — This presentation includes “forward - looking statements” within the meaning of the Private Securities Litigation Reform Act of 1995. You can generally identify forward - looking statements by the Company’s use of forward - looking terminology such as “anticipate,” “bel ieve,” “confident,” “continue,” “could,” “estimate,” “expect,” “intend,” “may,” “might,” “plan,” “potential,” “predict,” “seek,” or “should,” or the negative thereof or other variations th ere on or comparable terminology. In particular, statements about the markets in which GMS operates and or our products, including potential growth in those markets, the economy generally, action s t aken to optimize our operations and align our business consistent with demand, our ability to continue successfully navigating the evolving operating environment and executing our bus iness, strategic initiatives and priorities and growth potential including platform expansion, product availability, our ability to manage price inflation, capital structure, prici ng, net sales growth, organic sales growth, gross margins, incremental EBITDA and Adjusted EBITDA, cost discipline, operating leverage, interest expense, tax rates, capital expenditure s, and free cash flow, cash flow generation and working capital management, future financial performance and liquidity, the ability of the Company to grow stronger, productive and p rof itable, and the ability to deliver growth, value creation and long - term success contained in this presentation may be considered forward - looking statements. Statements about our expectations , beliefs, plans, strategies, objectives, prospects, assumptions or future events or performance may be considered forward - looking statements. The Company has based forward - looking statements on its current expectations, assumptions, estimates and projections. While the Company believes these expectations, assumptions, estimates and projections ar e reasonable, such forward - looking statements are only predictions and involve known and unknown risks and uncertainties, many of which are beyond its control, including curre nt public health issues that may affect the Company’s business. Forward - looking statements involve risks and uncertainties, including, but not limited to, those described in the “Ris k Factors” section in the Company’s most recent Annual Report on Form 10 - K, and in its other periodic reports filed with the SEC. In addition, the statements in this release are made as of March 8, 2022. The Company undertakes no obligation to update any of the forward - looking statements made herein, whether as a result of new information, future events, changes in e xpectation or otherwise. These forward - looking statements should not be relied upon as representing the Company’s views as of any date subsequent to March 8, 2022. Use of Non - GAAP and Adjusted Financial Information — To supplement GAAP financial information, we use adjusted measures of operating results which are non - GAAP measures. This non - GAAP adjusted financial information is provided as additional information for investors. These adjusted results exclude certain costs, expenses, gains and losses, and we believe their exclusion can enhance an overall understanding of our past financial performance and also our prospects for the fu ture. These adjustments to our GAAP results are made with the intent of providing both management and investors a more complete understanding of our operating performance by excl udi ng non - recurring, infrequent or other non - cash charges that are not believed to be material to the ongoing performance of our business. The presentation of this additional inf ormation is not meant to be considered in isolation or as a substitute for GAAP measures of net income, diluted earnings per share or net cash provided by (used in) operating activities pr epared in accordance with generally accepted accounting principles in the United States. Please see the Appendix to this presentation for a further discussion on these non - GAAP measure s and a reconciliation of these non - GAAP measures to the most directly comparable GAAP measures. Raymond James Conference March 8, 2022

3 LTM Q322 Net Sales $ 4.3 B LTM Q322 Adj. EBITDA* $ 503.9 M Market Cap $ 2.2 B Leading Brands 50+ Distribution locations across the U.S. & Canada 290+ GMS at a Glance ~6,500 Employees NYSE Ticker Symbol GMS Tool Sales, Rentals & Service Centers 90+ *For a reconciliation of Adjusted EBITDA margin to the most directly comparable GAAP metrics, see Appendix.

4 Attractive Market Dynamics GMS is well - positioned to benefit from favorable fundamentals that support growth and demand for our products Strong residential market demand Low interest rate environment Demographics support future growth in housing Lack of existing homes for sale supports new home demand Favorable pricing environment Early positive indicators in commercial Raymond James Conference March 8, 2022
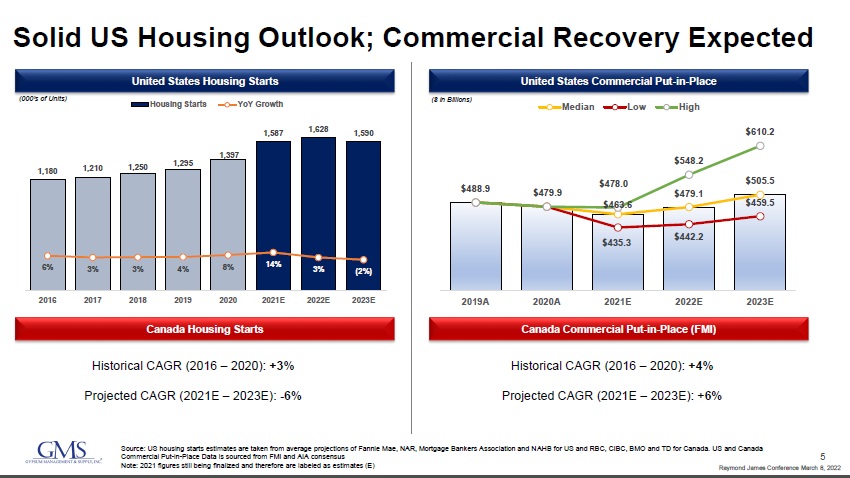
5 $479.9 $463.6 $479.1 $505.5 $488.9 $435.3 $442.2 $459.5 $478.0 $548.2 $610.2 2019A 2020A 2021E 2022E 2023E Median Low High 1,180 1,210 1,250 1,295 1,397 1,587 1,628 1,590 6% 3% 3% 4% 8% 14% 3% (2%) 2016 2017 2018 2019 2020 2021E 2022E 2023E Housing Starts YoY Growth United States Housing Starts (000’s of Units) United States Commercial Put - in - Place ($ in Billions) Canada Housing Starts Canada Commercial Put - in - Place (FMI) Historical CAGR (2016 – 2020): +3% Projected CAGR (2021E – 2023E): - 6% Historical CAGR (2016 – 2020): + 4 % Projected CAGR (2021E – 2023E): + 6% Source: US housing starts estimates are taken from average projections of Fannie Mae, NAR, Mortgage Bankers Association and N AHB for US and RBC, CIBC, BMO and TD for Canada. US and Canada Commercial Put - in - Place Data is sourced from FMI and AIA consensus Note: 2021 figures still being finalized and therefore are labeled as estimates (E) Solid US Housing Outlook; Commercial Recovery Expected Raymond James Conference March 8, 2022
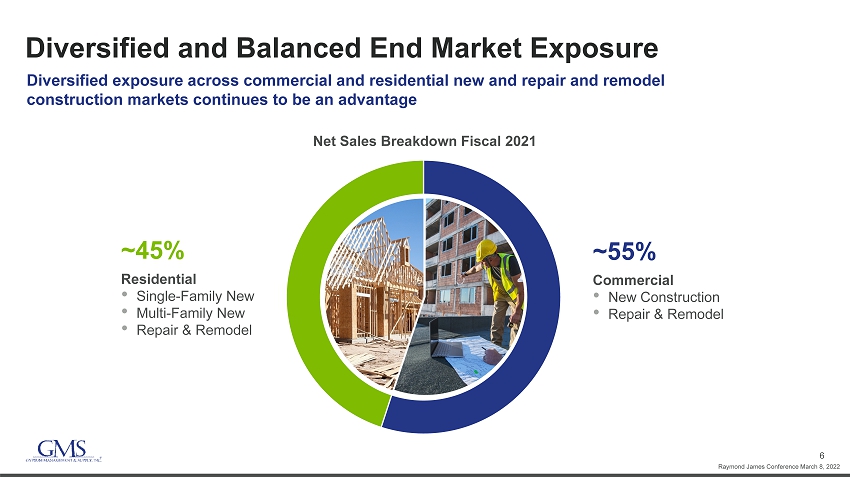
6 Diversified and Balanced End Market Exposure Net Sales Breakdown Fiscal 2021 Diversified exposure across commercial and residential new and repair and remodel construction markets continues to be an advantage Residential • Single - Family New • Multi - Family New • Repair & Remodel ~45% Commercial • New Construction • Repair & Remodel ~55% Raymond James Conference March 8, 2022
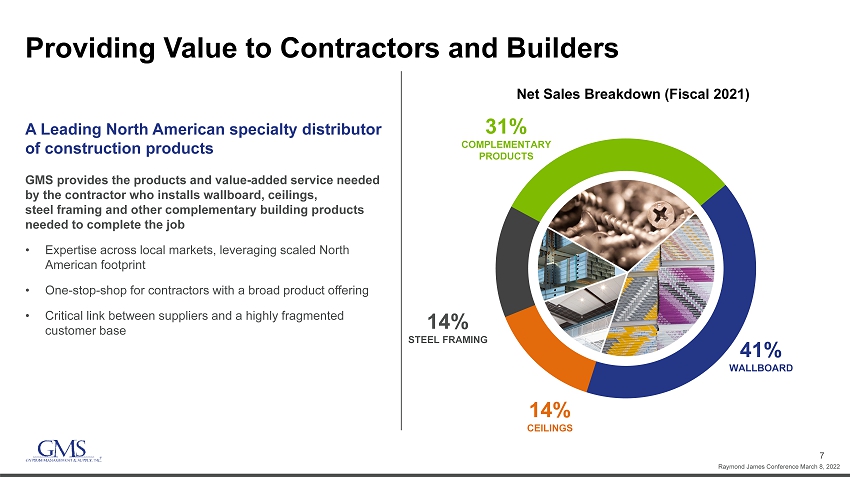
7 Providing Value to Contractors and Builders A Leading North American specialty distributor of construction products GMS provides the products and value - added service needed by the contractor who installs wallboard, ceilings, steel framing and other complementary building products needed to complete the job • Expertise across local markets, leveraging scaled North American footprint • One - stop - shop for contractors with a broad product offering • Critical link between suppliers and a highly fragmented customer base Net Sales Breakdown (Fiscal 2021) 41% WALLBOARD 14% STEEL FRAMING 14% CEILINGS 31% COMPLEMENTARY PRODUCTS Raymond James Conference March 8, 2022

8 Local Go - To - Market Strategy with Scale Benefits GMS distribution locations USA and Canada GMS’s model provides for the customer intimacy of a local business plus significant economies of scale, while maintaining high service levels and an entrepreneurial culture • Combines the benefits of a local “go - to - market” strategy with economics of scale • Integrated North American platform operated through over 50 highly - respected local brands Raymond James Conference March 8, 2022
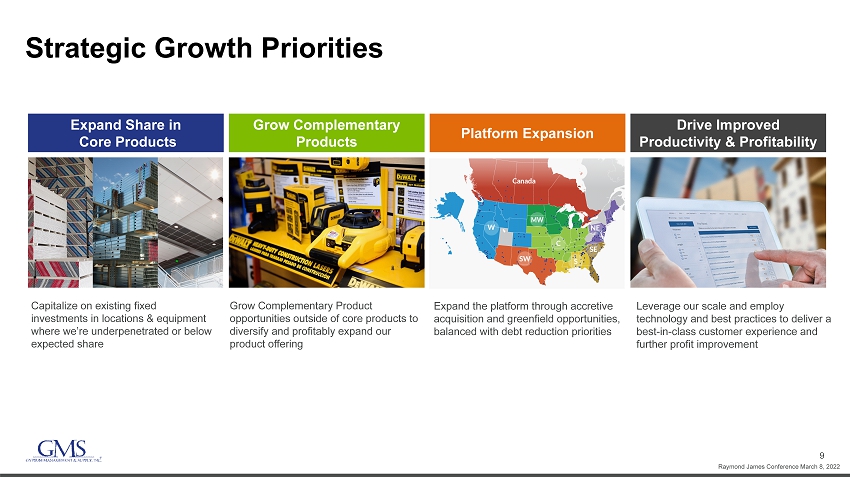
9 Strategic Growth Priorities Capitalize on existing fixed investments in locations & equipment where we’re underpenetrated or below expected share Grow Complementary Product opportunities outside of core products to diversify and profitably expand our product offering Expand the platform through accretive acquisition and greenfield opportunities, balanced with debt reduction priorities Leverage our scale and employ technology and best practices to deliver a best - in - class customer experience and further profit improvement Expand Share in Core Products Grow Complementary Products Platform Expansion Drive Improved Productivity & Profitability Raymond James Conference March 8, 2022

10 CAGR FY - 16 through LTM Q322 : Net Sales: Adjusted EBITDA*: Proven Track Record of Growth & Improved Profitability *For a reconciliation of Adjusted EBITDA and Adjusted EBITDA margin to the most directly comparable GAAP metrics, see Appendi x. $1,858 $2,319 $2,511 $3,116 $3,241 $3,299 $4,278 7.4% 8.1% 7.9% 9.5% 9.2% 9.7% 11.8% FY-16 FY-17 FY-18 FY-19 FY-20 FY-21 LTM-Q322 Net Sales Adj. EBITDA Margin* $ millions 15.6% 25.2% Raymond James Conference March 8, 2022

11 Attractive Capital Structure Supports Strategic Initiatives • Substantial liquidity, with $87.0 million of cash on hand and an additional $183.2 million available under our revolving credit facilities as of 1/31/2022 • No near - term debt maturities • “Through the Cycle” objective of Free Cash Flow 1 : 40% - 50% of Adjusted EBITDA 1 ‒ Note: Fiscal 2022 Free Cash Flow expected to be below this level due to elevated inventory balances as GMS works to ensure pr odu ct availability for its customers. $89.9 2.9 x 2.5 x 2.7 x 2.4 x 2.3 1/31/21 4/30/21 7/31/21 10/31/21 1/31/2022 $11 $45 $36 $384 $501 $359 2022 2023 2024 2025 2026 Thereafter LTM Net Debt / PF Adjusted EBITDA 1 Debt 2 Maturity Schedule as of 1/31/2022 $ in millions 1. For detail, including a reconciliation of Pro Forma Adjusted EBITDA to net income, the most directly comparable GAAP metric, see Appendix. 2. As of the quarter ended January 31, 2022; Debt includes First Lien Term Loan, ABL Facility, Senior Notes, Finance Leases & In sta llment Notes. Raymond James Conference March 8, 2022

12 GMS is Well - Positioned Now and for the Long - Term Industry leader with local expertise and broad North American scale Superior safety track record and logistics execution Breadth of product offerings, with growing complementary product opportunities Strong balance sheet , substantial liquidity and expected strong long term cash flow generation to support future growth Differentiated service model with professional sales force delivering best - in - class customer service Successfully executing on strategic priorities to capitalize on long - term growth opportunities Hein – can you please replace this picture with the one of the guy accepting drywall thru the window? Also – I’m not sure if I like the numbers off to the left on this slide. Do you think there’s some sort of icon or something that might look better?
13 Appendix
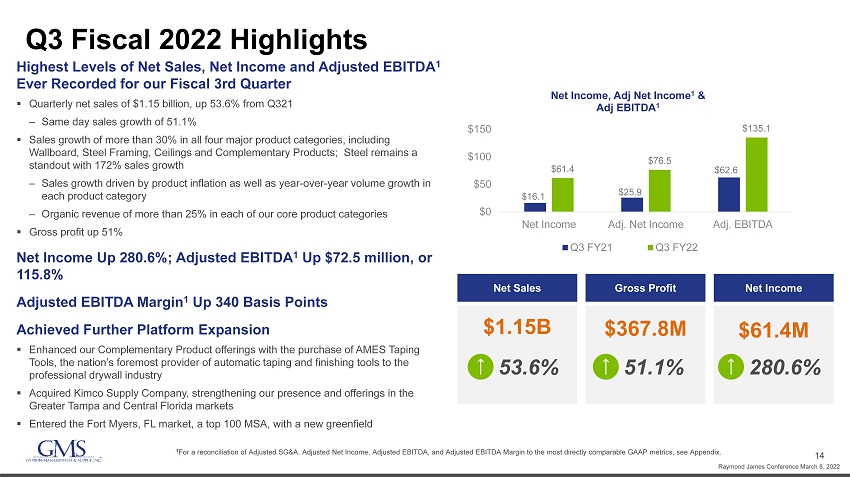
14 Q3 Fiscal 2022 Highlights Highest Levels of Net Sales, Net Income and Adjusted EBITDA 1 Ever Recorded for our Fiscal 3rd Quarter ▪ Quarterly net sales of $1.15 billion, up 53.6% from Q321 ‒ Same day sales growth of 51.1% ▪ Sales growth of more than 30% in all four major product categories, including Wallboard, Steel Framing, Ceilings and Complementary Products; Steel remains a standout with 172% sales growth ‒ Sales growth driven by product inflation as well as year - over - year volume growth in each product category ‒ Organic revenue of more than 25% in each of our core product categories ▪ Gross profit up 51% Net Income Up 280.6%; Adjusted EBITDA 1 Up $72.5 million, or 115.8% Adjusted EBITDA Margin 1 Up 340 Basis Points Achieved Further Platform Expansion ▪ Enhanced our Complementary Product offerings with the purchase of AMES Taping Tools, the nation’s foremost provider of automatic taping and finishing tools to the professional drywall industry ▪ Acquired Kimco Supply Company, strengthening our presence and offerings in the Greater Tampa and Central Florida markets ▪ Entered the Fort Myers, FL market, a top 100 MSA, with a new greenfield 1 For a reconciliation of Adjusted SG&A, Adjusted Net Income, Adjusted EBITDA, and Adjusted EBITDA Margin to the most directly com parable GAAP metrics, see Appendix. $16.1 $25.9 $62.6 $61.4 $76.5 $135.1 $0 $50 $100 $150 Net Income Adj. Net Income Adj. EBITDA Net Income, Adj Net Income 1 & Adj EBITDA 1 Q3 FY21 Q3 FY22 Net Sales Gross Profit Net Income $1.15B $367.8M $61.4M 53.6% 51.1% 280.6% Raymond James Conference March 8, 2022
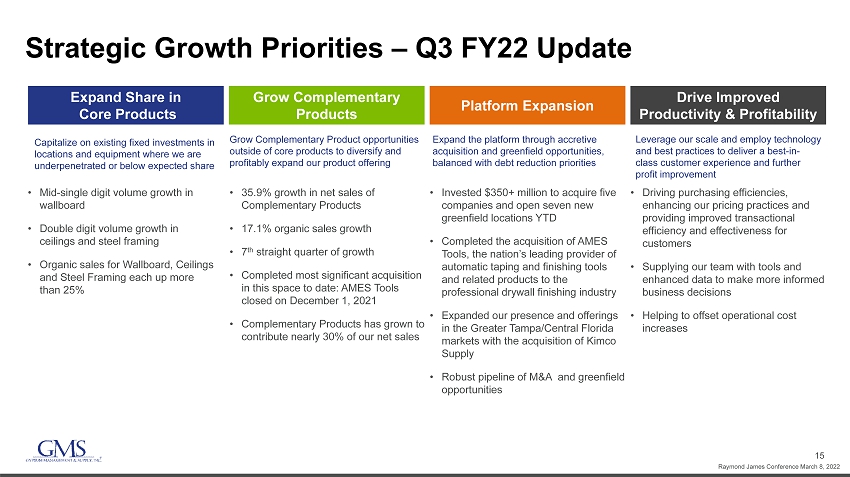
15 Strategic Growth Priorities – Q3 FY22 Update Capitalize on existing fixed investments in locations and equipment where we are underpenetrated or below expected share Grow Complementary Product opportunities outside of core products to diversify and profitably expand our product offering Expand the platform through accretive acquisition and greenfield opportunities, balanced with debt reduction priorities Leverage our scale and employ technology and best practices to deliver a best - in - class customer experience and further profit improvement • Mid - single digit volume growth in wallboard • Double digit volume growth in ceilings and steel framing • Organic sales for Wallboard, Ceilings and Steel Framing each up more than 25% • 35.9% growth in net sales of Complementary Products • 17.1% organic sales growth • 7 th straight quarter of growth • Completed most significant acquisition in this space to date: AMES Tools closed on December 1, 2021 • Complementary Products has grown to contribute nearly 30% of our net sales • Invested $350+ million to acquire five companies and open seven new greenfield locations YTD • Completed the acquisition of AMES Tools, the nation’s leading provider of automatic taping and finishing tools and related products to the professional drywall finishing industry • Expanded our presence and offerings in the Greater Tampa/Central Florida markets with the acquisition of Kimco Supply • Robust pipeline of M&A and greenfield opportunities • Driving purchasing efficiencies, enhancing our pricing practices and providing improved transactional efficiency and effectiveness for customers • Supplying our team with tools and enhanced data to make more informed business decisions • Helping to offset operational cost increases Expand Share in Core Products Grow Complementary Products Platform Expansion Drive Improved Productivity & Profitability Raymond James Conference March 8, 2022

16 20% 19% 16% 45% 31% 14% 14% 41% Continuing to Diversify and Profitably Expand Offerings Successfully Growing Complementary Products • Wallboard: Used to finish the interior walls and ceilings in residential, commercial and institutional construction projects • Ceilings: Suspended ceiling systems primarily comprised of mineral fiber, ceiling tile and grid. Architectural specialty ceilings systems • Steel Framing: Steel framing products for interior walls. Sold into commercial applications, typically as part of a package with wallboard, ceilings and other products • Primarily consists of complementary construction products, including joint compound, tools and fasteners, safety products, lumber & other wood products and insulation Core Offerings Complementary Products 2014 Net Sales: $1.4B NET SALES BREAKDOWN (FISCAL 2014) 2021 Net Sales: $3.3B NET SALES BREAKDOWN (FISCAL 2021) Complementary Products Ceilings Steel Framing Wallboard Up from 20% to 31% of sales from FY2014 to FY2021 Raymond James Conference March 8, 2022

17 Track Record of Successful Platform Expansion Date Acquisition/Greenfield Locations Strategic Rationale Dec - 21 ▪ 85 US Locations ▪ Diversified core products with complementary product offerings Dec - 21 ▪ 2 US Locations (Florida) ▪ Added market density in a top 20 MSA while adding extensive growth to complementary products throughout the legacy Gator Gypsum, Inc. footprint Aug - 21 ▪ Omaha, NE ▪ Expanded complementary product offering and expertise throughout the Greater Nebraska market Jul - 21 ▪ 10 US Locations (9 CA, 1 NV) ▪ Strategic expansion in several Top 100 metro areas in California, while providing entry into the attractive Las Vegas market Jun - 21 Architectural Coating Distributors, Inc ▪ Cleveland, OH ▪ Strategic expansion into northern Ohio market with EIFS - focused distributor; further develops complementary products category Jan - 22 Fort Myers, FL ▪ Fort Myers, FL ▪ Fills whitespace for GMS in this top 100 MSA Jul - 21 Denver, CO ▪ Denver, CO ▪ Established dedicated facility focused on growth of ceilings business in Colorado Jul - 21 Jackson, MS ▪ Jackson, MS ▪ Added first location in Mississippi and entered a top 100 MSA Jun - 21 Scarborough, ON ▪ Scarborough, ON ▪ Enhanced market density and service capabilities in the Greater Toronto Area Completed 70+ acquisitions and greenfields since May 2014. All U.S. GSD locations are fully integrated into GMS platform Since August 2014, GMS has acquired 39 companies representing a total of ~115 distribution locations and 85 retail storefronts Since August 2014, GMS has opened additional 40+ organic greenfield locations , complementing acquisition strategy Select Recent GMS Expansion Raymond James Conference March 8, 2022
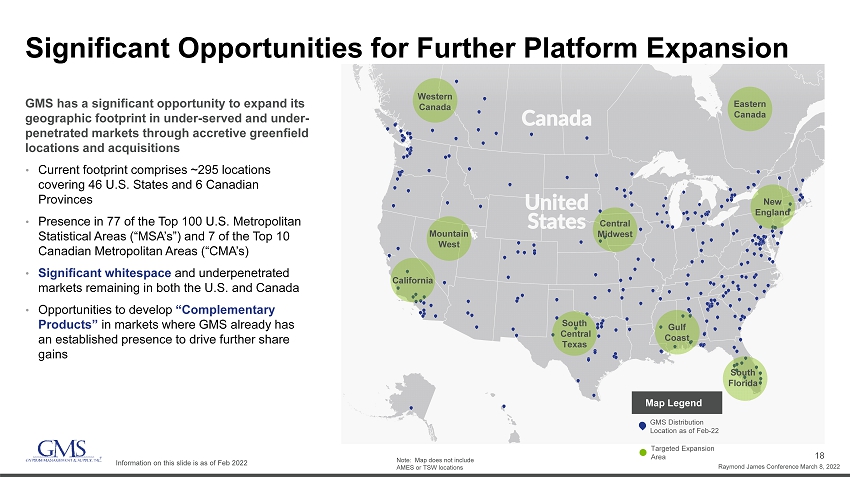
18 Significant Opportunities for Further Platform Expansion GMS has a significant opportunity to expand its geographic footprint in under - served and under - penetrated markets through accretive greenfield locations and acquisitions • Current footprint comprises ~295 locations covering 46 U.S. States and 6 Canadian Provinces • Presence in 77 of the Top 100 U.S. Metropolitan Statistical Areas (“MSA’s”) and 7 of the Top 10 Canadian Metropolitan Areas (“CMA’s) • Significant whitespace and underpenetrated markets remaining in both the U.S. and Canada • Opportunities to develop “Complementary Products” in markets where GMS already has an established presence to drive further share gains GMS Distribution Location as of Feb - 22 Targeted Expansion Area Note: Map does not include AMES or TSW locations Map Legend Information on this slide is as of Feb 2022 California Mountain West Western Canada South Central Texas Central Midwest Gulf Coast South Florida New England Eastern Canada Raymond James Conference March 8, 2022
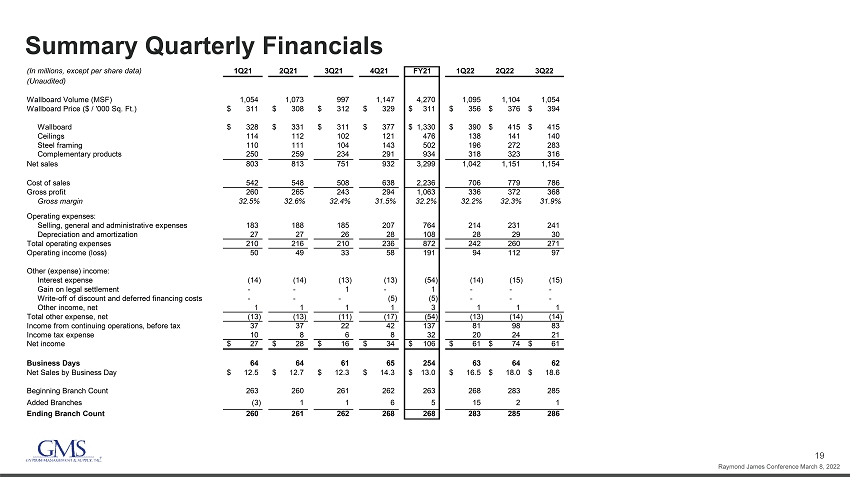
19 Summary Quarterly Financials (In millions, except per share data) 1Q21 2Q21 3Q21 4Q21 FY21 1Q22 2Q22 3Q22 (Unaudited) Wallboard Volume (MSF) 1,054 1,073 997 1,147 4,270 1,095 1,104 1,054 Wallboard Price ($ / '000 Sq. Ft.) 311$ 308$ 312$ 329$ 311$ 356$ 376$ 394$ Wallboard 328$ 331$ 311$ 377$ 1,330$ 390$ 415$ 415$ Ceilings 114 112 102 121 476 138 141 140 Steel framing 110 111 104 143 502 196 272 283 Complementary products 250 259 234 291 934 318 323 316 Net sales 803 813 751 932 3,299 1,042 1,151 1,154 Cost of sales 542 548 508 638 2,236 706 779 786 Gross profit 260 265 243 294 1,063 336 372 368 Gross margin 32.5% 32.6% 32.4% 31.5% 32.2% 32.2% 32.3% 31.9% Operating expenses: Selling, general and administrative expenses 183 188 185 207 764 214 231 241 Depreciation and amortization 27 27 26 28 108 28 29 30 Total operating expenses 210 216 210 236 872 242 260 271 Operating income (loss) 50 49 33 58 191 94 112 97 Other (expense) income: Interest expense (14) (14) (13) (13) (54) (14) (15) (15) Gain on legal settlement - - 1 - 1 - - - Write-off of discount and deferred financing costs - - - (5) (5) - - - Other income, net 1 1 1 1 3 1 1 1 Total other expense, net (13) (13) (11) (17) (54) (13) (14) (14) Income from continuing operations, before tax 37 37 22 42 137 81 98 83 Income tax expense 10 8 6 8 32 20 24 21 Net income 27$ 28$ 16$ 34$ 106$ 61$ 74$ 61$ Business Days 64 64 61 65 254 63 64 62 Net Sales by Business Day 12.5$ 12.7$ 12.3$ 14.3$ 13.0$ 16.5$ 18.0$ 18.6$ Beginning Branch Count 263 260 261 262 263 268 283 285 Added Branches (3) 1 1 6 5 15 2 1 Ending Branch Count 260 261 262 268 268 283 285 286 Raymond James Conference March 8, 2022
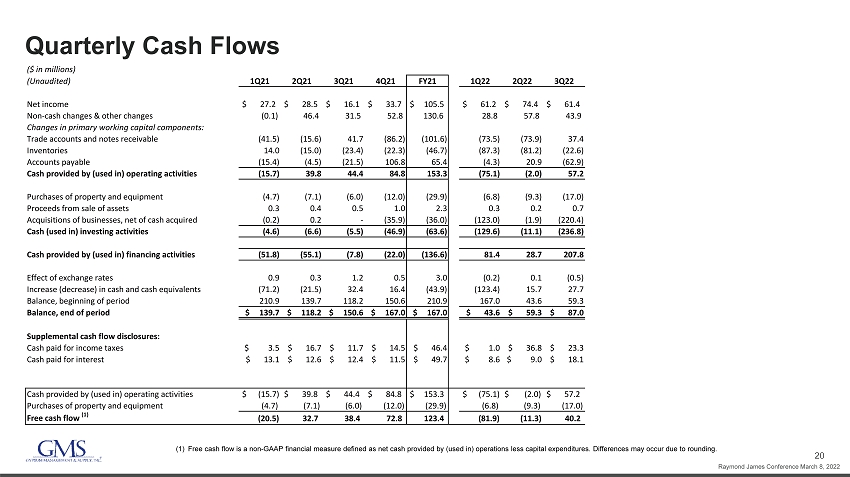
20 Quarterly Cash Flows (1) Free cash flow is a non - GAAP financial measure defined as net cash provided by (used in) operations less capital expenditures. D ifferences may occur due to rounding. Raymond James Conference March 8, 2022 ($ in millions) (Unaudited) 1Q21 2Q21 3Q21 4Q21 FY21 1Q22 2Q22 3Q22 Net income $ 27.2 $ 28.5 $ 16.1 $ 33.7 $ 105.5 $ 61.2 $ 74.4 $ 61.4 Non-cash changes & other changes (0.1) 46.4 31.5 52.8 130.6 28.8 57.8 43.9 Changes in primary working capital components: Trade accounts and notes receivable (41.5) (15.6) 41.7 (86.2) (101.6) (73.5) (73.9) 37.4 Inventories 14.0 (15.0) (23.4) (22.3) (46.7) (87.3) (81.2) (22.6) Accounts payable (15.4) (4.5) (21.5) 106.8 65.4 (4.3) 20.9 (62.9) Cash provided by (used in) operating activities (15.7) 39.8 44.4 84.8 153.3 (75.1) (2.0) 57.2 Purchases of property and equipment (4.7) (7.1) (6.0) (12.0) (29.9) (6.8) (9.3) (17.0) Proceeds from sale of assets 0.3 0.4 0.5 1.0 2.3 0.3 0.2 0.7 Acquisitions of businesses, net of cash acquired (0.2) 0.2 - (35.9) (36.0) (123.0) (1.9) (220.4) Cash (used in) investing activities (4.6) (6.6) (5.5) (46.9) (63.6) (129.6) (11.1) (236.8) Cash provided by (used in) financing activities (51.8) (55.1) (7.8) (22.0) (136.6) 81.4 28.7 207.8 Effect of exchange rates 0.9 0.3 1.2 0.5 3.0 (0.2) 0.1 (0.5) Increase (decrease) in cash and cash equivalents (71.2) (21.5) 32.4 16.4 (43.9) (123.4) 15.7 27.7 Balance, beginning of period 210.9 139.7 118.2 150.6 210.9 167.0 43.6 59.3 Balance, end of period $ 139.7 $ 118.2 $ 150.6 $ 167.0 $ 167.0 $ 43.6 $ 59.3 $ 87.0 Supplemental cash flow disclosures: Cash paid for income taxes $ 3.5 $ 16.7 $ 11.7 $ 14.5 $ 46.4 $ 1.0 $ 36.8 $ 23.3 Cash paid for interest $ 13.1 $ 12.6 $ 12.4 $ 11.5 $ 49.7 $ 8.6 $ 9.0 $ 18.1 Cash provided by (used in) operating activities $ (15.7) $ 39.8 $ 44.4 $ 84.8 $ 153.3 $ (75.1) $ (2.0) $ 57.2 Purchases of property and equipment (4.7) (7.1) (6.0) (12.0) (29.9) (6.8) (9.3) (17.0) Free cash flow (1) (20.5) 32.7 38.4 72.8 123.4 (81.9) (11.3) 40.2

21 Q3 2022 Net Sales 1. Organic net sales growth calculation excludes net sales of acquired businesses until first anniversary of acquisition date an d i mpact of foreign currency translation. ($ in millions) (Unaudited) FY22 FY21 Reported Organic (1) Organic (1) 1,063.0$ 751.2$ Acquisitions 87.7 - Fx Impact 2.9 - Total Net Sales 1,153.6$ 751.2$ 53.6% 41.5% Wallboard 415.1$ 311.1$ 33.4% 28.1% Ceilings 139.9 103.7 34.9% 26.8% Steel Framing 282.8 104.0 172.0% 151.0% Other Products 315.8 232.4 35.9% 17.1% Total Net Sales 1,153.6$ 751.2$ 53.6% 41.5% Fiscal Q3 Variance Raymond James Conference March 8, 2022
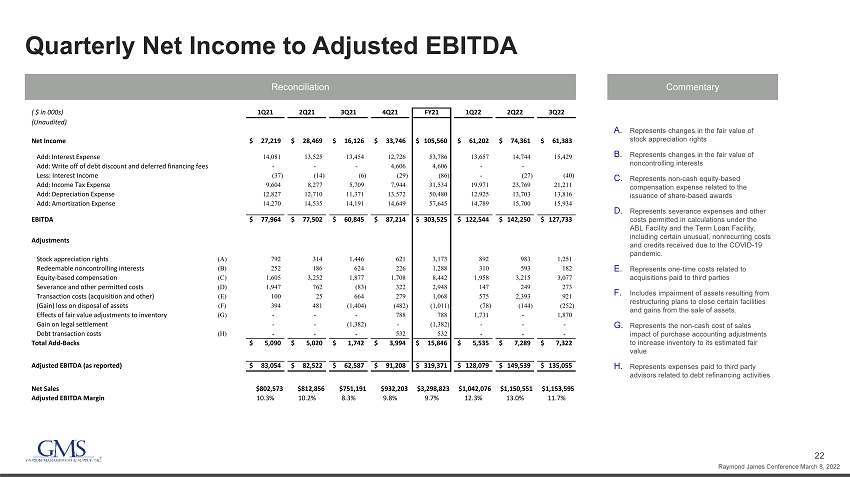
22 Quarterly Net Income to Adjusted EBITDA Reconciliation Commentary A. Represents changes in the fair value of stock appreciation rights B. Represents changes in the fair value of noncontrolling interests C. Represents non - cash equity - based compensation expense related to the issuance of share - based awards D. Represents severance expenses and other costs permitted in calculations under the ABL Facility and the Term Loan Facility, including certain unusual, nonrecurring costs and credits received due to the COVID - 19 pandemic. E. Represents one - time costs related to acquisitions paid to third parties F. Includes impairment of assets resulting from restructuring plans to close certain facilities and gains from the sale of assets. G. Represents the non - cash cost of sales impact of purchase accounting adjustments to increase inventory to its estimated fair value H. Represents expenses paid to third party advisors related to debt refinancing activities ( $ in 000s) 1Q21 2Q21 3Q21 4Q21 FY21 1Q22 2Q22 3Q22 (Unaudited) Net Income 27,219$ 28,469$ 16,126$ 33,746$ 105,560$ 61,202$ 74,361$ 61,383$ Add: Interest Expense 14,081 13,525 13,454 12,726 53,786 13,657 14,744 15,429 Add: Write off of debt discount and deferred financing fees - - - 4,606 4,606 - - Less: Interest Income (37) (14) (6) (29) (86) - (27) (40) Add: Income Tax Expense 9,604 8,277 5,709 7,944 31,534 19,971 23,769 21,211 Add: Depreciation Expense 12,827 12,710 11,371 13,572 50,480 12,925 13,703 13,816 Add: Amortization Expense 14,270 14,535 14,191 14,649 57,645 14,789 15,700 15,934 EBITDA 77,964$ 77,502$ 60,845$ 87,214$ 303,525$ 122,544$ 142,250$ 127,733$ Adjustments Stock appreciation rights (A) 792 314 1,446 621 3,173 892 983 1,251 Redeemable noncontrolling interests (B) 252 186 624 226 1,288 310 593 182 Equity-based compensation (C) 1,605 3,252 1,877 1,708 8,442 1,958 3,215 3,077 Severance and other permitted costs (D) 1,947 762 (83) 322 2,948 147 249 273 Transaction costs (acquisition and other) (E) 100 25 664 279 1,068 575 2,393 921 (Gain) loss on disposal of assets (F) 394 481 (1,404) (482) (1,011) (78) (144) (252) Effects of fair value adjustments to inventory (G) - - - 788 788 1,731 - 1,870 Gain on legal settlement - - (1,382) - (1,382) - - - Debt transaction costs (H) - - - 532 532 - - - Total Add-Backs 5,090$ 5,020$ 1,742$ 3,994$ 15,846$ 5,535$ 7,289$ 7,322$ Adjusted EBITDA (as reported) 83,054$ 82,522$ 62,587$ 91,208$ 319,371$ 128,079$ 149,539$ 135,055$ Net Sales $802,573 $812,856 $751,191 $932,203 $3,298,823 $1,042,076 $1,150,551 $1,153,595 Adjusted EBITDA Margin 10.3% 10.2% 8.3% 9.8% 9.7% 12.3% 13.0% 11.7% Raymond James Conference March 8, 2022

23 Net Income to Pro Forma Adjusted EBITDA Reconciliation Commentary A. Represents changes in the fair value of stock appreciation rights B. Represents changes in the fair value of noncontrolling interests C. Represents non - cash equity - based compensation expense related to the issuance of share - based awards D. Represents severance expenses and other costs permitted in calculations under the ABL Facility and the Term Loan Facility, including certain unusual, nonrecurring costs and credits received due to the COVID - 19 pandemic. E. Represents one - time costs related to our initial public offering and acquisitions paid to third party advisors as well as costs related to the retirement of corporate stock appreciation rights F. Represents management fees paid to AEA, which were discontinued after the IPO G. Represents the non - cash cost of sales impact of purchase accounting adjustments to increase inventory to its estimated fair value H. Represents mark - to - market adjustments for derivative financial instruments I. Represents one - time costs related to our secondary offerings paid to third party advisors J. Represents expenses paid to third party advisors related to debt refinancing activities K. Pro forma impact of earnings from acquisitions from the beginning of the LTM period to the date of acquisition, including synergies Raymond James Conference March 8, 2022 ( $ in 000s) LTM Q3 FY22 2021 2020 2019 2018 2017 2016 (Unaudited) Net Income 230,692$ 105,560$ 23,381$ 56,002$ 62,971$ 48,886$ 12,564$ Add: Interest Expense 56,556 53,786 67,718 73,677 31,395 29,360 37,418 Add: Write off of debt discount and deferred financing fees 4,606 4,606 1,331 - 74 7,103 - Less: Interest Income (96) (86) (88) (66) (177) (152) (928) Add: Income Tax Expense 72,895 31,534 22,944 14,039 20,883 22,654 12,584 Add: Depreciation Expense 54,016 50,480 51,332 46,456 24,075 25,565 26,667 Add: Amortization Expense 61,072 57,645 65,201 71,003 41,455 43,675 37,548 EBITDA 479,741$ 303,525$ 231,819$ 261,111$ 180,676$ 177,091$ 125,853$ Adjustments Impairment of goodwill - - 63,074 - - - Stock appreciation rights (A) 3,747 3,173 1,572 2,730 2,318 148 1,988 Redeemable noncontrolling interests (B) 1,311 1,288 520 1,188 1,868 3,536 880 Equity-based compensation (C) 9,958 8,442 7,060 3,906 1,695 2,534 2,699 Severance and other permitted costs (D) 991 2,948 5,733 8,152 581 (157) 379 Transaction costs (acquisition and other) (E) 4,168 1,068 2,414 7,858 3,370 2,249 3,751 (Gain) loss on disposal of assets (956) (1,011) 658 (525) (509) (338) (645) AEA management fee (F) - - - - - 188 2,250 Effects of fair value adjustments to inventory (G) 4,389 788 575 4,176 324 946 1,009 Gain on legal settlement - (1,382) (14,029) - - - - Change in fair value of financial instruments (H) - - - 6,395 6,125 382 19 Secondary public offerings (I) - - 363 - 1,525 1,385 - Debt transaction costs (J) 532 532 - 678 1,285 265 - Total Add-Backs 24,140$ 15,846$ 67,940$ 34,558$ 18,582$ 11,138$ 12,330$ Adjusted EBITDA (as reported) 503,881$ 319,371$ 299,759$ 295,669$ 199,258$ 188,229$ 138,183$ Contributions from acquisitions (K) 30,073 4,948 1,480 6,717 1,280 9,500 12,093 Pro Forma Adjusted EBITDA 533,954$ 324,319$ 301,239$ 302,386$ 200,538$ 197,729$ 150,276$

24 Income Before Taxes to Adjusted Net Income Reconciliation Commentary A. Depreciation and amortization from the increase in value of certain long - term assets associated with the April 1, 2014 acquisition of the predecessor company and amortization of intangible assets from the acquisitions of Titan, Westside Building Materials, and AMES Taping Tools B. Normalized cash tax rate determined based on our estimated taxes excluding the impact of purchase accounting and certain other deferred tax amounts. ($ in 000s) 3Q22 3Q21 (Unaudited) Income before taxes 82,594$ 21,835$ EBITDA add-backs 7,322 1,742 Purchase accounting depreciation and amortization (A) 11,424 9,798 Adjusted pre-tax income 101,340 33,375 Adjusted income tax expense 24,828 7,510 Adjusted net income 76,512$ 25,865$ Effective tax rate (B) 24.5% 22.5% Weighted average shares outstanding: Basic 43,094 42,726 Diluted 43,945 43,361 Adjusted net income per share: Basic 1.78$ 0.61$ Diluted 1.74$ 0.60$ Raymond James Conference March 8, 2022

25 Reported SG&A to Adjusted SG&A Reconciliation Commentary A. Represents changes in the fair value of stock appreciation rights B. Represents changes in the fair value of noncontrolling interests C. Represents non - cash equity - based compensation expense related to the issuance of share - based awards D. Represents severance expenses and other costs permitted in calculations under the ABL Facility and the Term Loan Facility, including certain unusual, nonrecurring costs and credits received due to the COVID - 19 pandemic. E. Represents one - time costs related to acquisitions paid to third parties. (Unaudited) 1Q21 2Q21 3Q21 4Q21 FY2021 1Q22 2Q22 3Q22 ($ in millions) SG&A - Reported 183.1$ 188.4$ 184.8$ 207.3$ 763.6$ 214.1$ 230.5$ 241.0$ Adjustments Stock appreciation rights (A) (0.8) (0.3) (1.4) (0.6) (3.2) (0.9) (1.0) (1.3) Redeemable noncontrolling interests (B) (0.3) (0.2) (0.6) (0.2) (1.3) (0.3) (0.6) (0.2) Equity-based compensation (C) (1.6) (3.3) (1.9) (1.7) (8.4) (2.0) (3.2) (3.1) Severance and other permitted costs (D) (1.9) (0.8) 0.1 (0.3) (2.9) (0.2) (0.3) (0.3) Transaction costs (acquisition and other) (E) (0.1) (0.0) (0.7) (0.3) (1.1) (0.6) (2.4) (0.9) Gain on disposal of assets (0.4) (0.5) 1.4 0.5 1.0 0.1 0.1 0.3 Debt transaction costs - - - (0.5) (0.5) - - - SG&A - Adjusted 178.1$ 183.3$ 181.7$ 204.2$ 747.3$ 210.3$ 223.2$ 235.6$ % of net sales 22.2% 22.5% 24.2% 21.9% 22.7% 20.2% 19.4% 20.4% Raymond James Conference March 8, 2022

26 Leverage Summary (1) Net of unamortized discount of $1.4 mm, $0.6 mm, $0.6 mm , $0.5 mm and $0.5mm as of January 31,2021, April 30,2021, July 31, 2021, October 31, 2021, and January 31, 2022 respectively. (2) Net of deferred financing costs of $7.6 mm, $4.1 mm, $3.9 mm, $3.6 mm and $3.4mm as of January 31,2021, April 30,2021, July 31, 2021, October 31, 2021, and January 31, 2022 respectively. (3) Net of deferred financing costs of $5.3 mm, $5.2 mm, and $5.0 mm as of July 31, 2021, October 31, 2021, and January 31, 2022 res pectively. (4) Net of unamortized discount of $0.8 mm, $0.7 mm, $0.7 mm, $0. 6 mm. and $0.5 mm as of January 31,2021, April 30,2021, July 31, 2021, October 31, 2021, and January 31, 2022 respectively. (5) For a reconciliation Pro Forma Adjusted EBITDA to net income, the most directly comparable GAAP metric, see Appendix. ($ mm) 1/31/21 4/30/21 7/31/21 10/31/21 1/31/22 LTM LTM LTM LTM LTM Cash and cash equivalents $151 $167 $44 $59 $87 Revolving Credit Facilities $0 $0 $92 $141 $359 First Lien Term Loan (1)(2) 860 505 504 503 502 Senior Notes (3) - 345 345 345 345 Capital Lease Obligations 122 118 113 112 113 Installment Notes & Other (4) 12 10 9 8 7 Total Debt $994 $978 $1,063 $1,108 $1,326 Total Net Debt $844 $811 $1,019 $1,049 $1,239 PF Adj. EBITDA (5) $292 $324 $380 $442 $534 Total Debt / PF Adj. EBITDA 3.4x 3.0x 2.8x 2.5x 2.5x Net Debt / PF Adj. EBITDA 2.9x 2.5x 2.7x 2.4x 2.3x Raymond James Conference March 8, 2022