Exhibit 99.2
Q3 2023 Earnings Call March 2, 2023
2 Safe Harbor and B asis of Presentation Forward - Looking Statement Safe Harbor — This presentation includes “forward - looking statements” within the meaning of the Private Securities Litigation Reform Act of 1995. You can generally identify forward - looking statements by the Company’s use of forward - looking terminology such as “anticipate,” “bel ieve,” “confident,” “continue,” “could,” “estimate,” “expect,” “intend,” “may,” “might,” “plan,” “potential,” “predict,” “seek,” or “should,” or the negative thereof or other variations th ere on or comparable terminology. In particular, statements about the markets in which GMS operates and our products, including potential growth in those markets and products, the economy general ly, our ability to continue successfully navigating the evolving operating environment and executing our business, strategic initiatives and priorities and growth potential, future M&A and greenfields , product availability, inflation, capital structure, pricing, volumes, net sales, organic sales, gross margins, incremental EBITDA, Adjusted EBITDA, Adjusted EBITDA ma rgi n, interest expense, tax rates, capital expenditures, free cash flow, cash flow generation and working capital management, future financial performance and liquidity, the ability of the Company to grow stronger, the ability to deliver growth, value creation and long - term success, and the Company’s cost reduction initiatives and results thereof contained in this present ation may be considered forward - looking statements. Statements about our expectations, beliefs, plans, strategies, objectives, prospects, assumptions or future events or perform anc e may be considered forward - looking statements. The Company has based forward - looking statements on its current expectations, assumptions, estimates and projections. While the Comp any believes these expectations, assumptions, estimates and projections are reasonable, such forward - looking statements are only predictions and involve known and unknown ris ks and uncertainties, many of which are beyond its control, including current public health issues that may affect the Company’s business. Forward - looking statements involve risks and uncertainties, including, but not limited to, those described in the “Risk Factors” section in the Company’s most recent Annual Report on Form 10 - K, and in its other periodic repor ts filed with the SEC. In addition, the statements in this release are made as of March 2, 2023. The Company undertakes no obligation to update any of the forward - looking statements made herein, whether as a result of new information, future events, changes in expectation or otherwise. These forward - looking statements should not be relied upon as representing t he Company’s views as of any date subsequent to March 2, 2023. Use of Non - GAAP and Adjusted Financial Information — To supplement GAAP financial information, we use adjusted measures of operating results which are non - GAAP measures. This non - GAAP adjusted financial information is provided as additional information for investors. These adjusted results exclude certain costs, expenses, gains and losses, and we believe their exclusion can enhance an overall understanding of our past financial performance and also our prospects for the fu ture. These adjustments to our GAAP results are made with the intent of providing both management and investors a more complete understanding of our operating performance by excl udi ng non - recurring, infrequent or other non - cash charges that are not believed to be material to the ongoing performance of our business. The presentation of this additional inf ormation is not meant to be considered in isolation or as a substitute for GAAP measures of net income, diluted earnings per share or net cash provided by (used in) operating activities pr epared in accordance with generally accepted accounting principles in the United States. Please see the Appendix to this presentation for a further discussion on these non - GAAP measure s and a reconciliation of these non - GAAP measures to the most directly comparable GAAP measures.
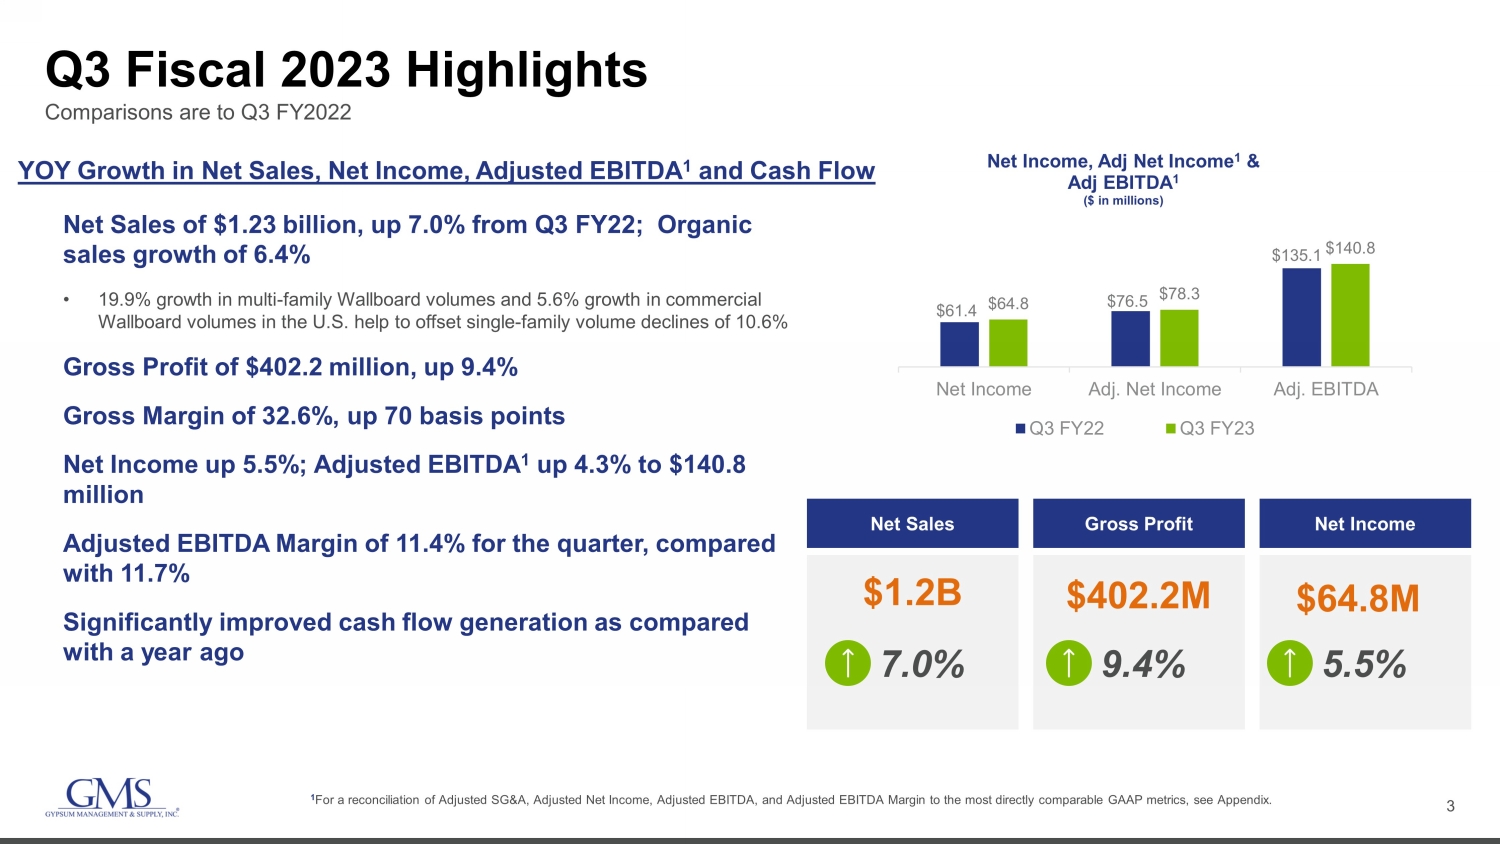
3 Q3 Fiscal 2023 Highlights Net Sales of $1.23 billion, up 7.0% from Q3 FY22; Organic sales growth of 6.4% • 19.9% growth in multi - family Wallboard volumes and 5.6% growth in commercial Wallboard volumes in the U.S. help to offset single - family volume declines of 10.6% Gross Profit of $402.2 million, up 9.4% Gross Margin of 32.6%, up 70 basis points Net Income up 5.5%; Adjusted EBITDA 1 up 4.3% to $140.8 million Adjusted EBITDA Margin of 11.4% for the quarter, compared with 11.7% Significantly improved cash flow generation as compared with a year ago 1 For a reconciliation of Adjusted SG&A, Adjusted Net Income, Adjusted EBITDA, and Adjusted EBITDA Margin to the most directly com parable GAAP metrics, see Appendix. $61.4 $76.5 $135.1 $64.8 $78.3 $140.8 Net Income Adj. Net Income Adj. EBITDA Net Income, Adj Net Income 1 & Adj EBITDA 1 ($ in millions) Q3 FY22 Q3 FY23 Net Sales Gross Profit Net Income $1.2B $402.2M $64.8M 7.0% 9.4% 5.5% Comparisons are to Q3 FY2022 YOY Growth in Net Sales, Net Income, Adjusted EBITDA 1 and Cash Flow
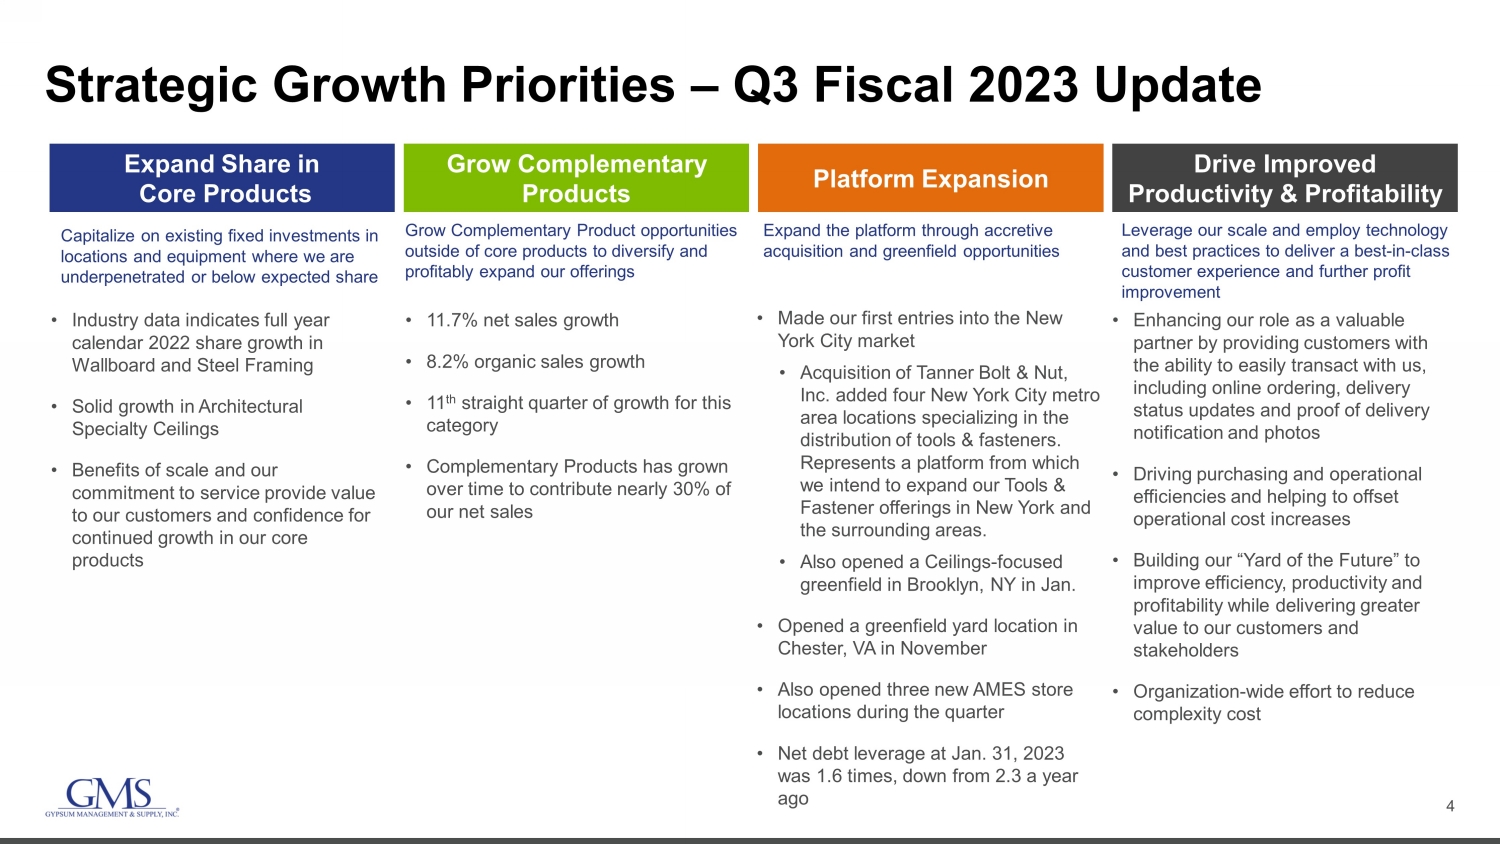
4 Strategic Growth Priorities – Q3 Fiscal 2023 Update Capitalize on existing fixed investments in locations and equipment where we are underpenetrated or below expected share Grow Complementary Product opportunities outside of core products to diversify and profitably expand our offerings Expand the platform through accretive acquisition and greenfield opportunities Leverage our scale and employ technology and best practices to deliver a best - in - class customer experience and further profit improvement • Industry data indicates full year calendar 2022 share growth in Wallboard and Steel Framing • Solid growth in Architectural Specialty Ceilings • Benefits of scale and our commitment to service provide value to our customers and confidence for continued growth in our core products • 11.7% net sales growth • 8.2% organic sales growth • 11 th straight quarter of growth for this category • Complementary Products has grown over time to contribute nearly 30% of our net sales • Made our first entries into the New York City market • Acquisition of Tanner Bolt & Nut, Inc. added four New York City metro area locations specializing in the distribution of tools & fasteners. Represents a platform from which we intend to expand our Tools & Fastener offerings in New York and the surrounding areas. • Also opened a Ceilings - focused greenfield in Brooklyn, NY in Jan. • Opened a greenfield yard location in Chester, VA in November • Also opened three new AMES store locations during the quarter • Net debt leverage at Jan. 31, 2023 was 1.6 times, down from 2.3 a year ago • Enhancing our role as a valuable partner by providing customers with the ability to easily transact with us, including online ordering, delivery status updates and proof of delivery notification and photos • Driving purchasing and operational efficiencies and helping to offset operational cost increases • Building our “Yard of the Future” to improve efficiency, productivity and profitability while delivering greater value to our customers and stakeholders • Organization - wide effort to reduce complexity cost Expand Share in Core Products Grow Complementary Products Platform Expansion Drive Improved Productivity & Profitability
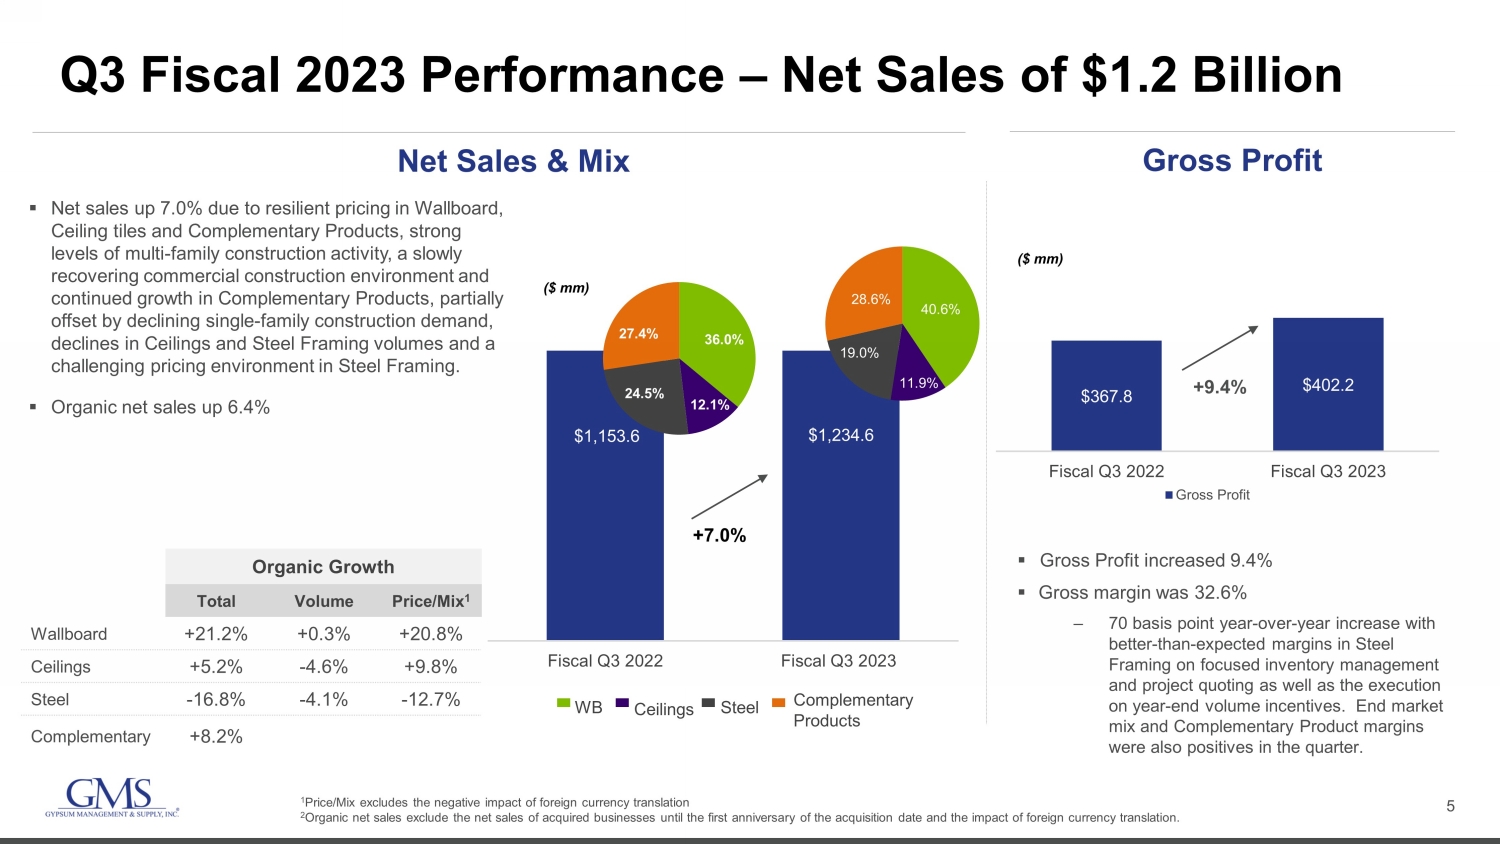
5 Q3 Fiscal 2023 Performance – Net Sales of $1.2 Billion $367.8 $402.2 $200 $250 $300 $350 $400 $450 Fiscal Q3 2022 Fiscal Q3 2023 Gross Profit Net Sales & Mix Gross Profit ▪ Gross Profit increased 9.4% ▪ Gross margin was 32.6% ‒ 70 basis point year - over - year increase with better - than - expected margins in Steel Framing on focused inventory management and project quoting as well as the execution on year - end volume incentives. End market mix and Complementary Product margins were also positives in the quarter. ▪ Net sales up 7.0% due to resilient pricing in Wallboard, Ceiling tiles and Complementary Products, strong levels of multi - family construction activity, a slowly recovering commercial construction environment and continued growth in Complementary Products, partially offset by declining single - family construction demand, declines in Ceilings and Steel Framing volumes and a challenging pricing environment in Steel Framing. ▪ Organic net sales up 6.4% Organic Growth Total Volume Price/Mix 1 Wallboard +21.2% +0.3% +20.8% Ceilings +5.2% - 4.6% +9.8% Steel - 16.8% - 4.1% - 12.7% Complementary +8.2% $1,153.6 $1,234.6 Fiscal Q3 2022 Fiscal Q3 2023 +7.0% 36.0% 12.1% 24.5% 27.4% 40.6% 11.9% 19.0% 28.6% WB Ceilings Steel Complementary Products ($ mm) ($ mm) +9.4% 1 Price/Mix excludes the negative impact of foreign currency translation 2 Organic net sales exclude the net sales of acquired businesses until the first anniversary of the acquisition date and the im pac t of foreign currency translation.
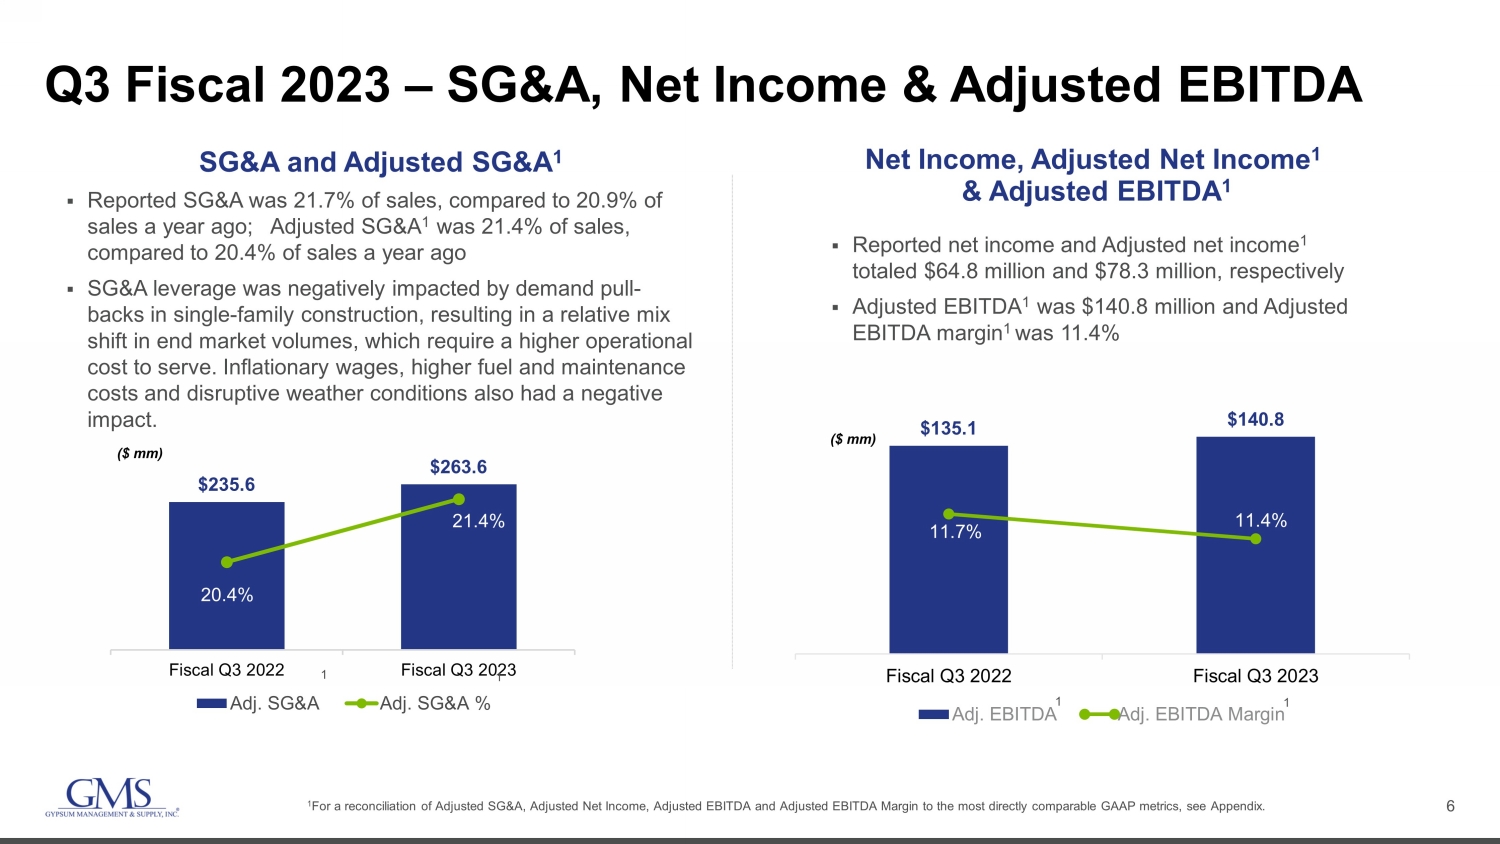
6 $135.1 $140.8 11.7% 11.4% Fiscal Q3 2022 Fiscal Q3 2023 Adj. EBITDA Adj. EBITDA Margin ($ mm) $235.6 $263.6 20.4% 21.4% 19.0% 19.5% 20.0% 20.5% 21.0% 21.5% 22.0% $0 $50 $100 $150 $200 $250 $300 Fiscal Q3 2022 Fiscal Q3 2023 Adj. SG&A Adj. SG&A % ($ mm) Q3 Fiscal 2023 – SG&A, Net Income & Adjusted EBITDA 1 For a reconciliation of Adjusted SG&A, Adjusted Net Income, Adjusted EBITDA and Adjusted EBITDA Margin to the most directly c omp arable GAAP metrics, see Appendix. SG&A and Adjusted SG&A 1 ▪ Reported SG&A was 21.7% of sales, compared to 20.9% of sales a year ago; Adjusted SG&A 1 was 21.4% of sales, compared to 20.4% of sales a year ago ▪ SG&A leverage was negatively impacted by demand pull - backs in single - family construction, resulting in a relative mix shift in end market volumes, which require a higher operational cost to serve. Inflationary wages, higher fuel and maintenance costs and disruptive weather conditions also had a negative impact. Net Income, Adjusted Net Income 1 & Adjusted EBITDA 1 ▪ Reported net income and Adjusted net income 1 totaled $64.8 million and $78.3 million, respectively ▪ Adjusted EBITDA 1 was $140.8 million and Adjusted EBITDA margin 1 was 11.4% 1 1 1 1
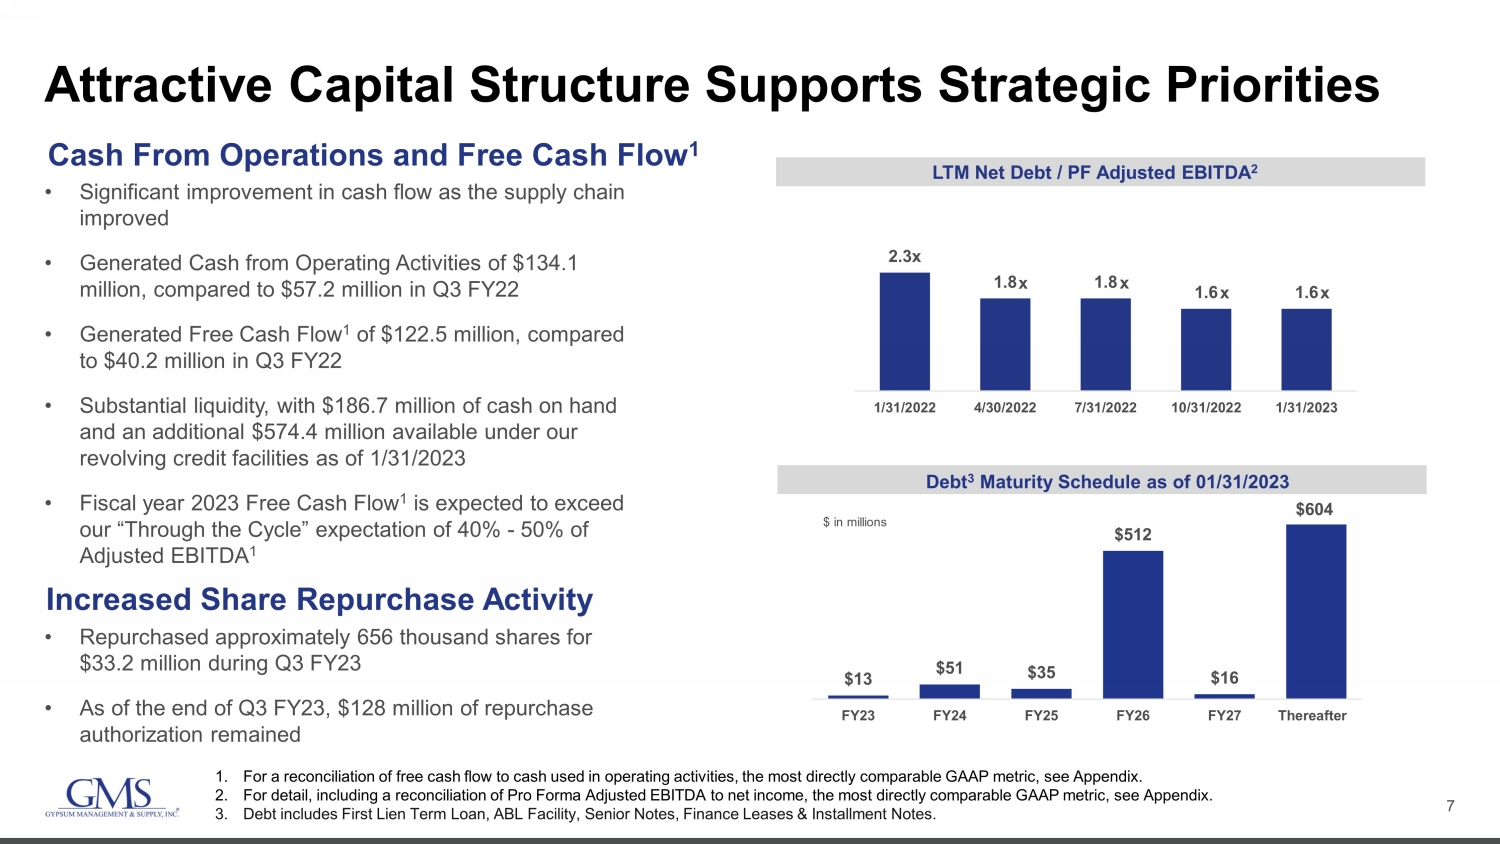
7 Attractive Capital Structure Supports Strategic Priorities • Significant improvement in cash flow as the supply chain improved • Generated Cash from Operating Activities of $134.1 million, compared to $57.2 million in Q3 FY22 • Generated Free Cash Flow 1 of $122.5 million, compared to $40.2 million in Q3 FY22 • Substantial liquidity, with $186.7 million of cash on hand and an additional $574.4 million available under our revolving credit facilities as of 1/31/2023 • Fiscal year 2023 Free Cash Flow 1 is expected to exceed our “Through the Cycle” expectation of 40% - 50% of Adjusted EBITDA 1 • Repurchased approximately 656 thousand shares for $33.2 million during Q3 FY23 • As of the end of Q3 FY23, $128 million of repurchase authorization remained Cash From Operations and Free Cash Flow 1 $89.9 2.3 x 1.8 1.8 1.6 1.6 1/31/2022 4/30/2022 7/31/2022 10/31/2022 1/31/2023 $13 $51 $35 $512 $16 $604 FY23 FY24 FY25 FY26 FY27 Thereafter LTM Net Debt / PF Adjusted EBITDA 2 Debt 3 Maturity Schedule as of 01/31/2023 $ in millions 1. For a reconciliation of free cash flow to cash used in operating activities, the most directly comparable GAAP metric, see Ap pen dix. 2. For detail, including a reconciliation of Pro Forma Adjusted EBITDA to net income, the most directly comparable GAAP metric, see Appendix. 3. Debt includes First Lien Term Loan, ABL Facility, Senior Notes, Finance Leases & Installment Notes. x x x Increased Share Repurchase Activity x

8 GMS is Well Positioned across Commercial and Residential Markets with Scale and Balanced Product Mix • Continue to see high levels of multi - family residential activity • Further deterioration of single - family residential demand is expected in the near - term; Extent and duration of decline is uncertain, but recent comments from some large public builders are encouraging • Year - over - year improvement in commercial construction activity expected in near - term • Favorable demographics in an underbuilt industry provides support for the medium - to long - term • Opened 31 greenfield locations and completed 13 strategic acquisitions since the start of fiscal 2020 to enhance customer service, drive growth in product offerings and improve efficiencies, all while reducing our net debt leverage ratio from 3.6x at April 30, 2019 to 1.6x at January 31, 2023 • Continuing to modernize and upgrade fleet, adding safety features to protect employees and customers and for risk management benefits • Technology investments to automate work has led to increased productivity, making us better operators • Lowering complexity costs in the business Strategic Investments Position GMS for Near - Term Industry Dynamics & Long - Term Success Industry Fundamentals Support Outlook Greenfield and Acquisition totals are calculated since the start of fiscal 2020 through January 31, 2023
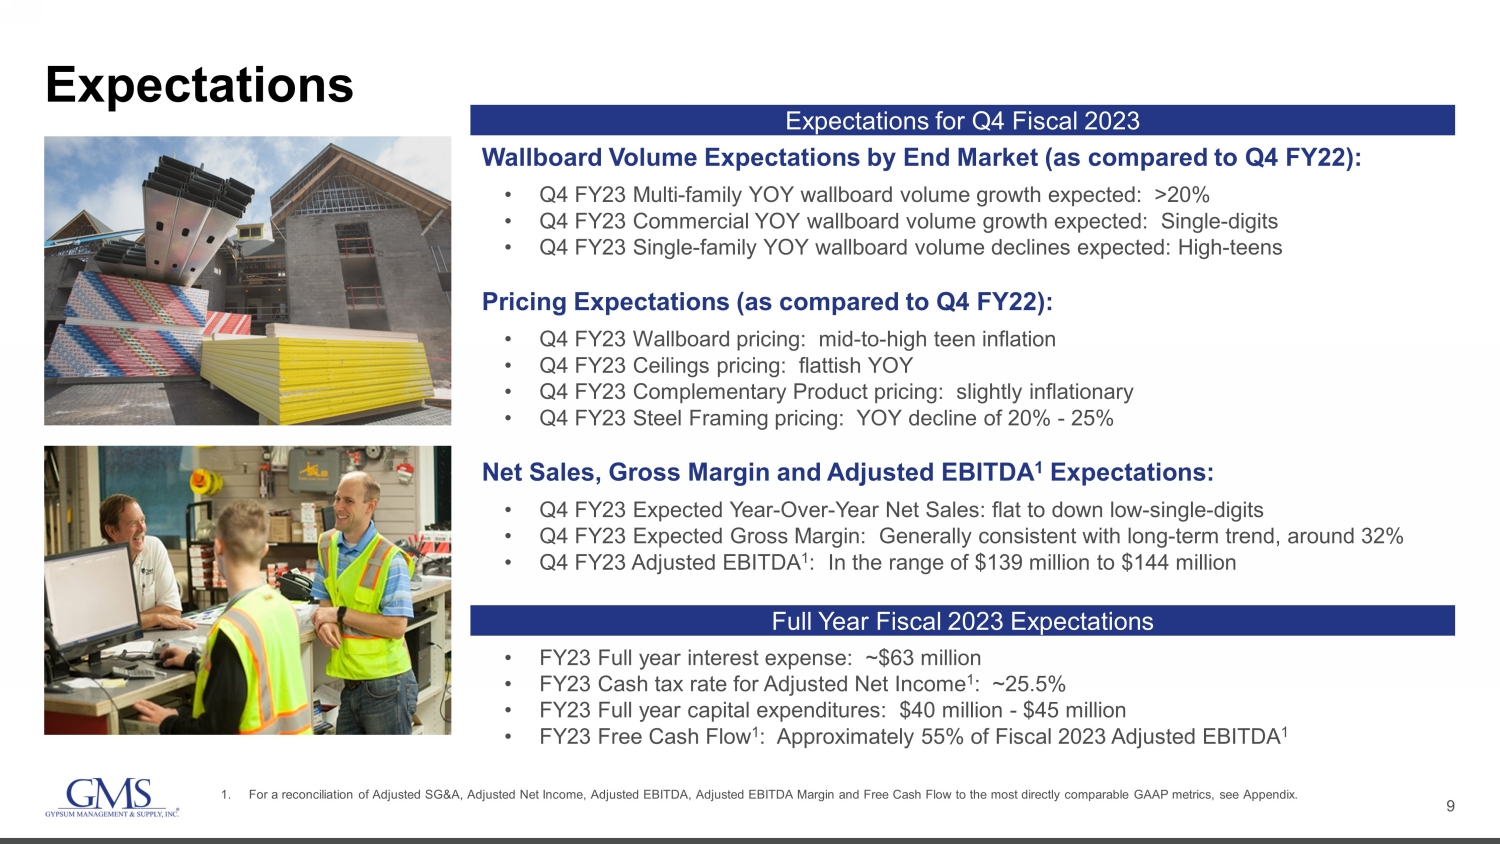
9 Expectations 1. For a reconciliation of Adjusted SG&A, Adjusted Net Income, Adjusted EBITDA, Adjusted EBITDA Margin and Free Cash Flow to the mo st directly comparable GAAP metrics, see Appendix. Expectations for Q4 Fiscal 2023 Wallboard Volume Expectations by End Market (as compared to Q4 FY22): • Q4 FY23 Multi - family YOY wallboard volume growth expected: >20% • Q4 FY23 Commercial YOY wallboard volume growth expected: Single - digits • Q4 FY23 Single - family YOY wallboard volume declines expected: High - teens Pricing Expectations (as compared to Q4 FY22): • Q4 FY23 Wallboard pricing: mid - to - high teen inflation • Q4 FY23 Ceilings pricing: flattish YOY • Q4 FY23 Complementary Product pricing: slightly inflationary • Q4 FY23 Steel Framing pricing: YOY decline of 20% - 25% Net Sales, Gross Margin and Adjusted EBITDA 1 Expectations: • Q4 FY23 Expected Year - Over - Year Net Sales: flat to down low - single - digits • Q4 FY23 Expected Gross Margin: Generally consistent with long - term trend, around 32% • Q4 FY23 Adjusted EBITDA 1 : In the range of $139 million to $144 million • FY23 Full year interest expense: ~$63 million • FY23 Cash tax rate for Adjusted Net Income 1 : ~25.5% • FY23 Full year capital expenditures: $40 million - $45 million • FY23 Free Cash Flow 1 : Approximately 55% of Fiscal 2023 Adjusted EBITDA 1 Full Year Fiscal 2023 Expectations
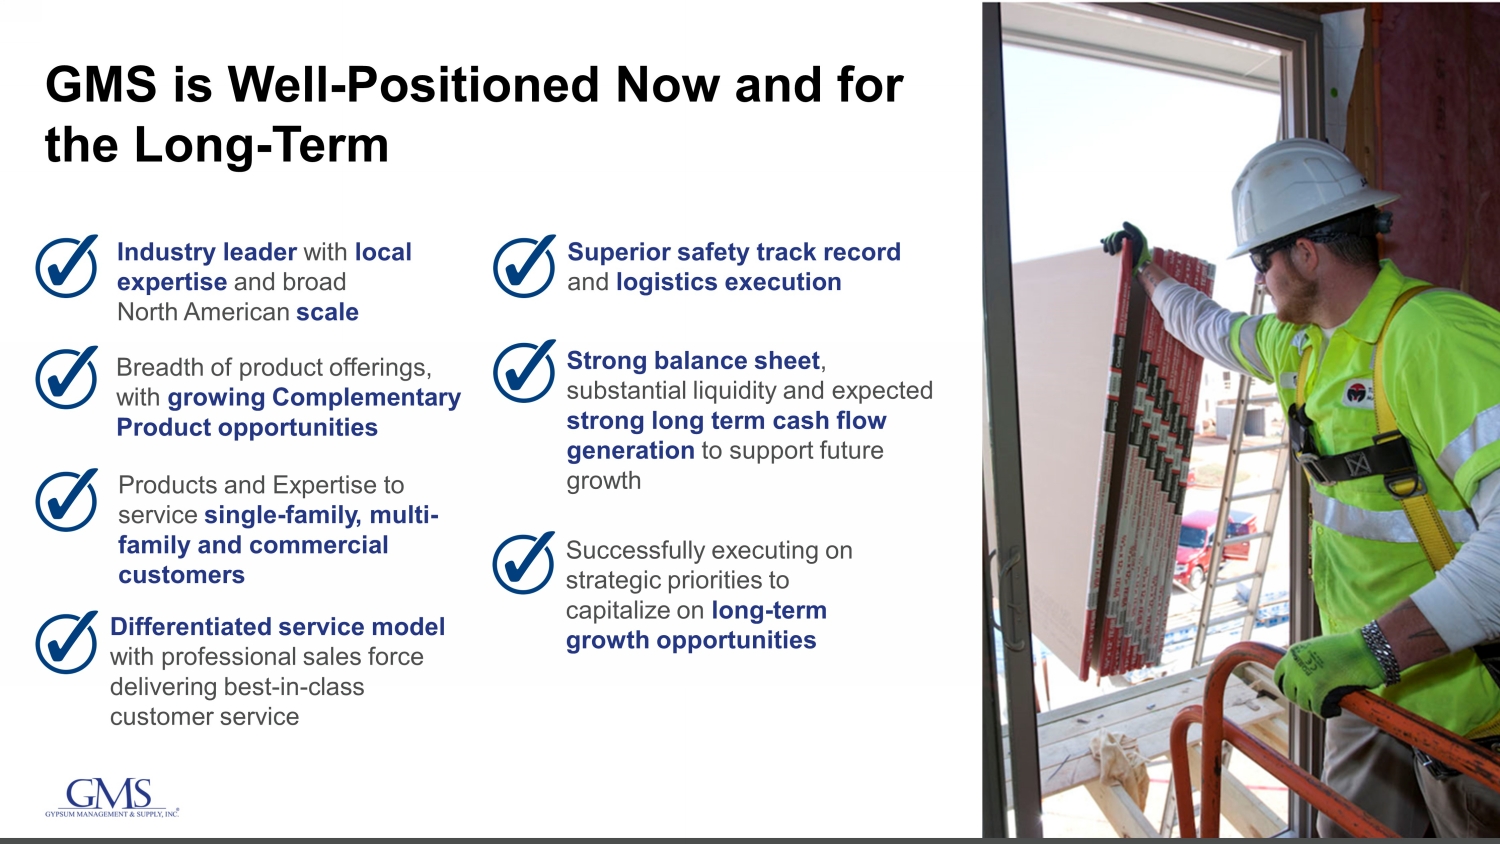
10 GMS is Well - Positioned Now and for the Long - Term Industry leader with local expertise and broad North American scale Superior safety track record and logistics execution Breadth of product offerings, with growing Complementary Product opportunities Strong balance sheet , substantial liquidity and expected strong long term cash flow generation to support future growth Differentiated service model with professional sales force delivering best - in - class customer service Successfully executing on strategic priorities to capitalize on long - term growth opportunities Hein – can you please replace this picture with the one of the guy accepting drywall thru the window? Also – I’m not sure if I like the numbers off to the left on this slide. Do you think there’s some sort of icon or something that might look better? Products and Expertise to service single - family, multi - family and commercial customers
11 Appendix
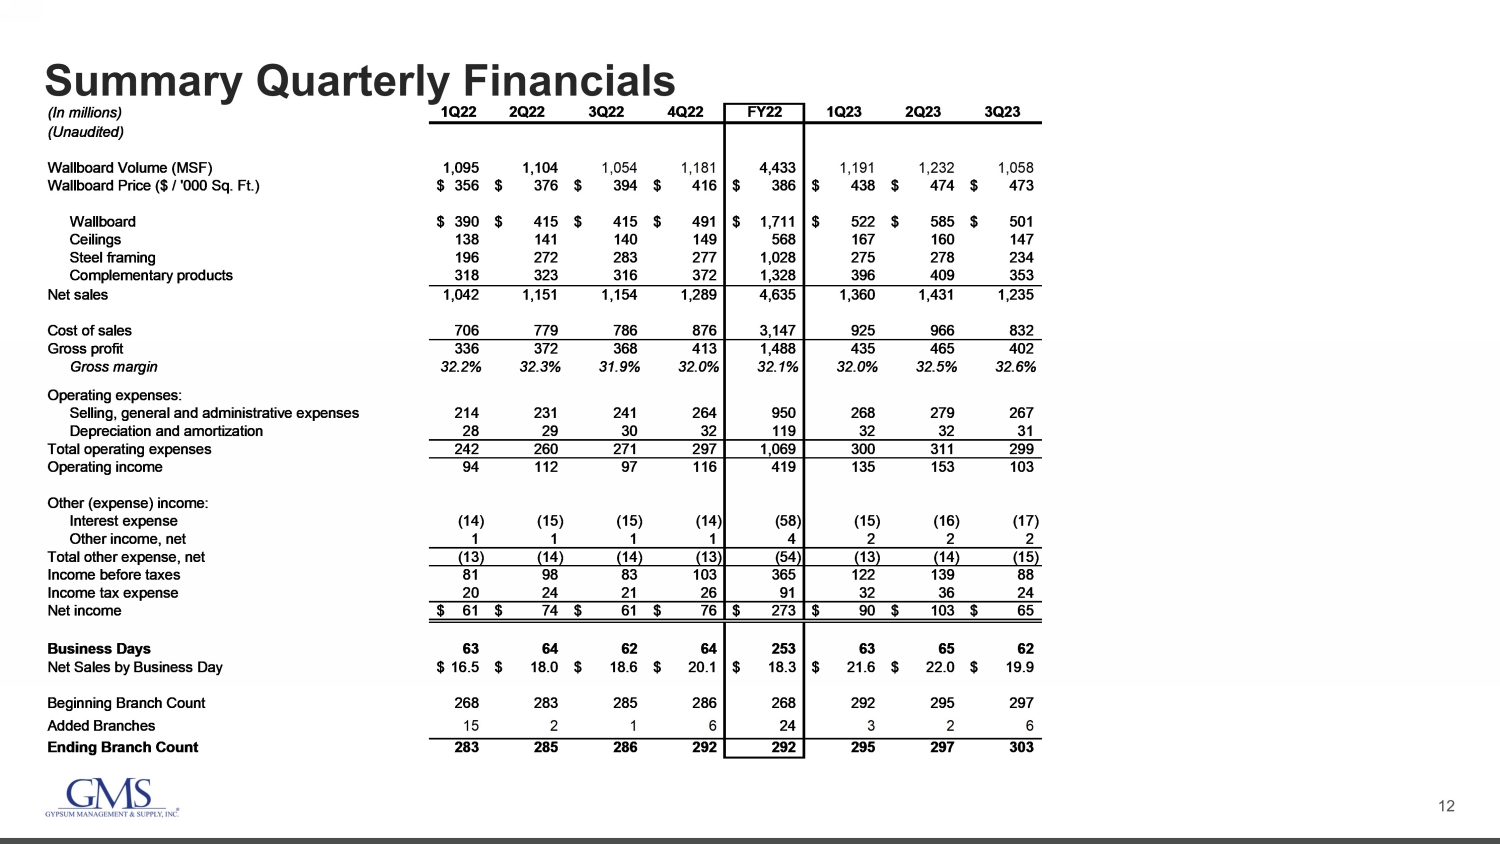
12 Summary Quarterly Financials (In millions) 1Q22 2Q22 3Q22 4Q22 FY22 1Q23 2Q23 3Q23 (Unaudited) Wallboard Volume (MSF) 1,095 1,104 1,054 1,181 4,433 1,191 1,232 1,058 Wallboard Price ($ / '000 Sq. Ft.) 356$ 376$ 394$ 416$ 386$ 438$ 474$ 473$ Wallboard 390$ 415$ 415$ 491$ 1,711$ 522$ 585$ 501$ Ceilings 138 141 140 149 568 167 160 147 Steel framing 196 272 283 277 1,028 275 278 234 Complementary products 318 323 316 372 1,328 396 409 353 Net sales 1,042 1,151 1,154 1,289 4,635 1,360 1,431 1,235 Cost of sales 706 779 786 876 3,147 925 966 832 Gross profit 336 372 368 413 1,488 435 465 402 Gross margin 32.2% 32.3% 31.9% 32.0% 32.1% 32.0% 32.5% 32.6% Operating expenses: Selling, general and administrative expenses 214 231 241 264 950 268 279 267 Depreciation and amortization 28 29 30 32 119 32 32 31 Total operating expenses 242 260 271 297 1,069 300 311 299 Operating income 94 112 97 116 419 135 153 103 Other (expense) income: Interest expense (14) (15) (15) (14) (58) (15) (16) (17) Other income, net 1 1 1 1 4 2 2 2 Total other expense, net (13) (14) (14) (13) (54) (13) (14) (15) Income before taxes 81 98 83 103 365 122 139 88 Income tax expense 20 24 21 26 91 32 36 24 Net income 61$ 74$ 61$ 76$ 273$ 90$ 103$ 65$ Business Days 63 64 62 64 253 63 65 62 Net Sales by Business Day 16.5$ 18.0$ 18.6$ 20.1$ 18.3$ 21.6$ 22.0$ 19.9$ Beginning Branch Count 268 283 285 286 268 292 295 297 Added Branches 15 2 1 6 24 3 2 6 Ending Branch Count 283 285 286 292 292 295 297 303
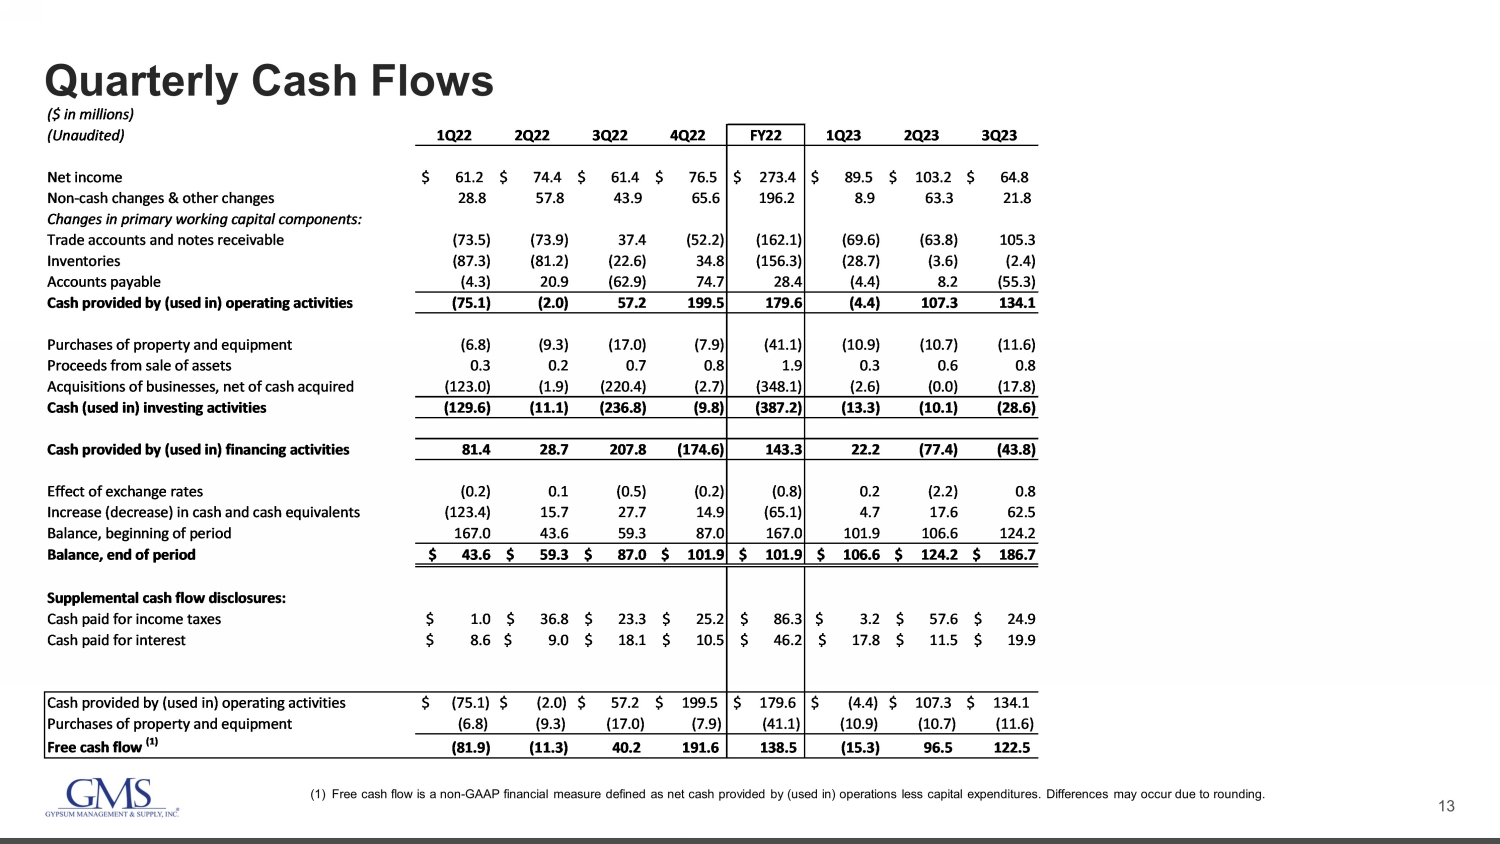
13 Quarterly Cash Flows (1) Free cash flow is a non - GAAP financial measure defined as net cash provided by (used in) operations less capital expenditures. D ifferences may occur due to rounding. ($ in millions) (Unaudited) 1Q22 2Q22 3Q22 4Q22 FY22 1Q23 2Q23 3Q23 Net income $ 61.2 $ 74.4 $ 61.4 $ 76.5 $ 273.4 $ 89.5 $ 103.2 $ 64.8 Non-cash changes & other changes 28.8 57.8 43.9 65.6 196.2 8.9 63.3 21.8 Changes in primary working capital components: Trade accounts and notes receivable (73.5) (73.9) 37.4 (52.2) (162.1) (69.6) (63.8) 105.3 Inventories (87.3) (81.2) (22.6) 34.8 (156.3) (28.7) (3.6) (2.4) Accounts payable (4.3) 20.9 (62.9) 74.7 28.4 (4.4) 8.2 (55.3) Cash provided by (used in) operating activities (75.1) (2.0) 57.2 199.5 179.6 (4.4) 107.3 134.1 Purchases of property and equipment (6.8) (9.3) (17.0) (7.9) (41.1) (10.9) (10.7) (11.6) Proceeds from sale of assets 0.3 0.2 0.7 0.8 1.9 0.3 0.6 0.8 Acquisitions of businesses, net of cash acquired (123.0) (1.9) (220.4) (2.7) (348.1) (2.6) (0.0) (17.8) Cash (used in) investing activities (129.6) (11.1) (236.8) (9.8) (387.2) (13.3) (10.1) (28.6) Cash provided by (used in) financing activities 81.4 28.7 207.8 (174.6) 143.3 22.2 (77.4) (43.8) Effect of exchange rates (0.2) 0.1 (0.5) (0.2) (0.8) 0.2 (2.2) 0.8 Increase (decrease) in cash and cash equivalents (123.4) 15.7 27.7 14.9 (65.1) 4.7 17.6 62.5 Balance, beginning of period 167.0 43.6 59.3 87.0 167.0 101.9 106.6 124.2 Balance, end of period $ 43.6 $ 59.3 $ 87.0 $ 101.9 $ 101.9 $ 106.6 $ 124.2 $ 186.7 Supplemental cash flow disclosures: Cash paid for income taxes $ 1.0 $ 36.8 $ 23.3 $ 25.2 $ 86.3 $ 3.2 $ 57.6 $ 24.9 Cash paid for interest $ 8.6 $ 9.0 $ 18.1 $ 10.5 $ 46.2 $ 17.8 $ 11.5 $ 19.9 Cash provided by (used in) operating activities $ (75.1) $ (2.0) $ 57.2 $ 199.5 $ 179.6 $ (4.4) $ 107.3 $ 134.1 Purchases of property and equipment (6.8) (9.3) (17.0) (7.9) (41.1) (10.9) (10.7) (11.6) Free cash flow (1) (81.9) (11.3) 40.2 191.6 138.5 (15.3) 96.5 122.5
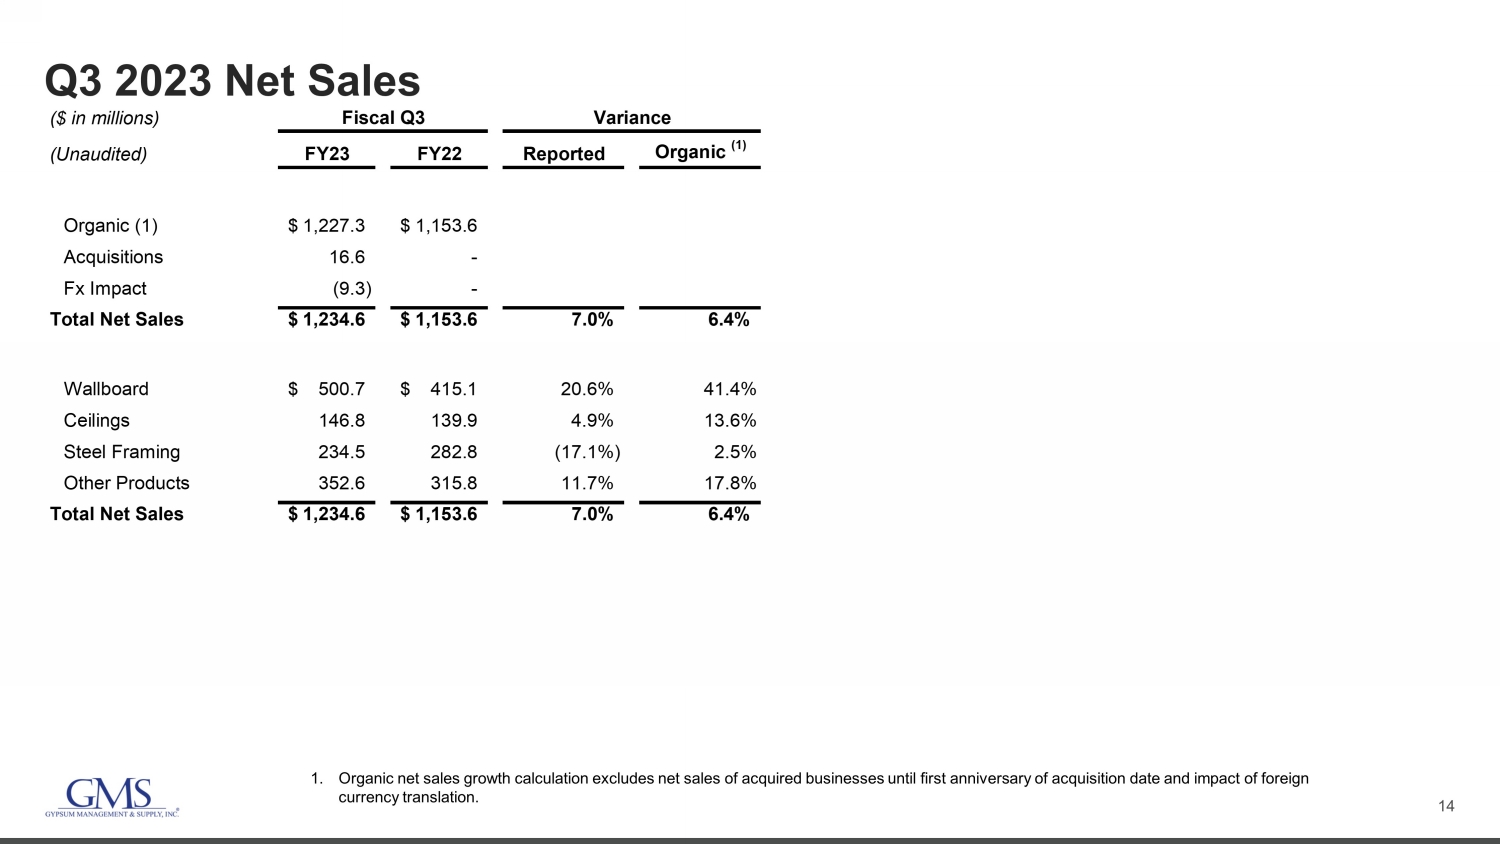
14 Q3 2023 Net Sales 1. Organic net sales growth calculation excludes net sales of acquired businesses until first anniversary of acquisition date an d i mpact of foreign currency translation. ($ in millions) (Unaudited) FY23 FY22 Reported Organic (1) Organic (1) 1,227.3$ 1,153.6$ Acquisitions 16.6 - Fx Impact (9.3) - Total Net Sales 1,234.6$ 1,153.6$ 7.0% 6.4% Wallboard 500.7$ 415.1$ 20.6% 41.4% Ceilings 146.8 139.9 4.9% 13.6% Steel Framing 234.5 282.8 (17.1%) 2.5% Other Products 352.6 315.8 11.7% 17.8% Total Net Sales 1,234.6$ 1,153.6$ 7.0% 6.4% Fiscal Q3 Variance
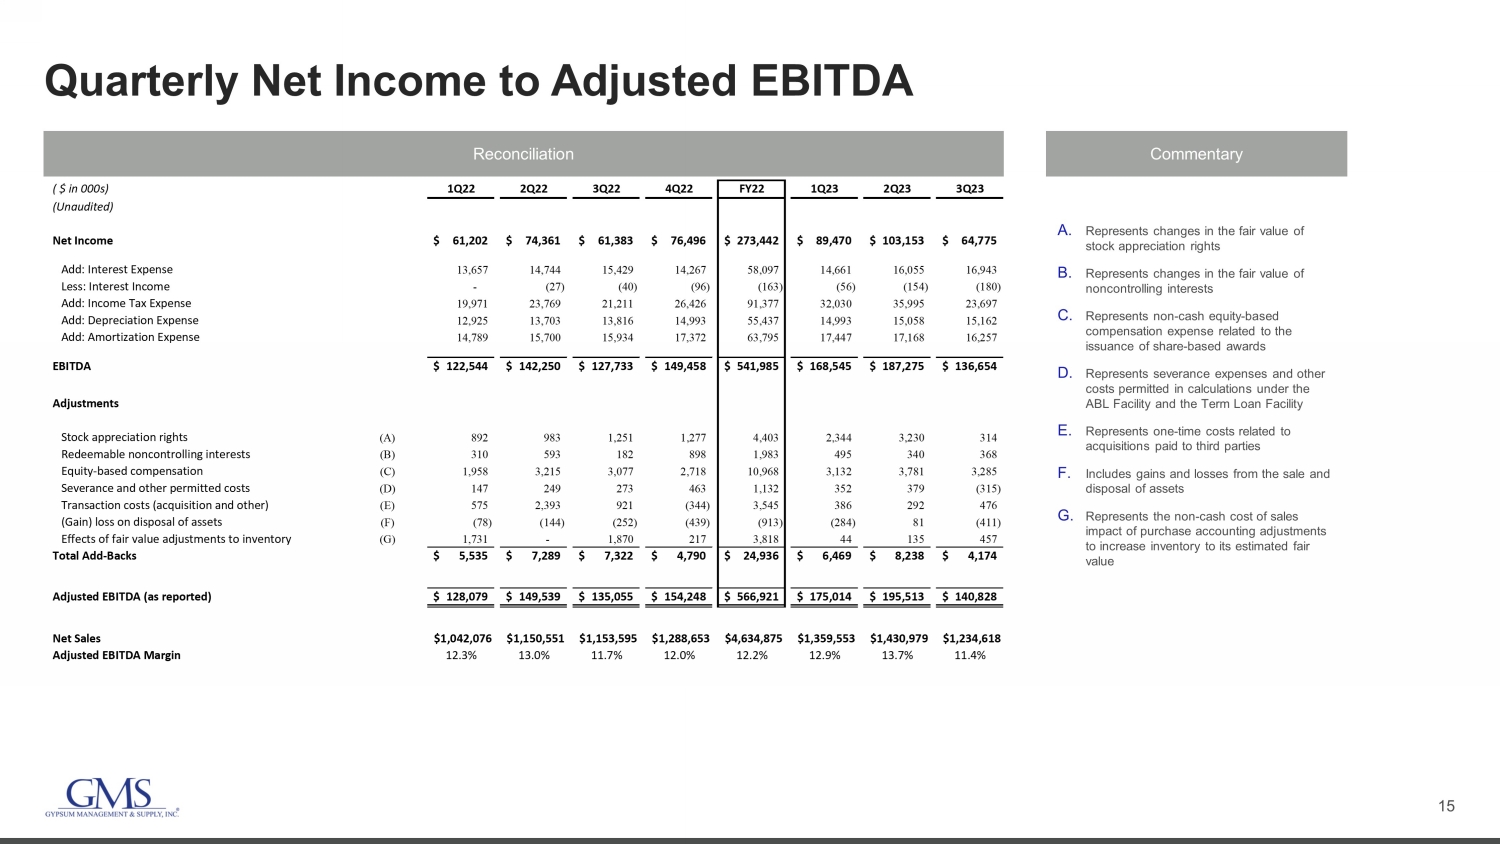
15 Quarterly Net Income to Adjusted EBITDA Reconciliation Commentary A. Represents changes in the fair value of stock appreciation rights B. Represents changes in the fair value of noncontrolling interests C. Represents non - cash equity - based compensation expense related to the issuance of share - based awards D. Represents severance expenses and other costs permitted in calculations under the ABL Facility and the Term Loan Facility E. Represents one - time costs related to acquisitions paid to third parties F. Includes gains and losses from the sale and disposal of assets G. Represents the non - cash cost of sales impact of purchase accounting adjustments to increase inventory to its estimated fair value ( $ in 000s) 1Q22 2Q22 3Q22 4Q22 FY22 1Q23 2Q23 3Q23 (Unaudited) Net Income 61,202$ 74,361$ 61,383$ 76,496$ 273,442$ 89,470$ 103,153$ 64,775$ Add: Interest Expense 13,657 14,744 15,429 14,267 58,097 14,661 16,055 16,943 Less: Interest Income - (27) (40) (96) (163) (56) (154) (180) Add: Income Tax Expense 19,971 23,769 21,211 26,426 91,377 32,030 35,995 23,697 Add: Depreciation Expense 12,925 13,703 13,816 14,993 55,437 14,993 15,058 15,162 Add: Amortization Expense 14,789 15,700 15,934 17,372 63,795 17,447 17,168 16,257 EBITDA 122,544$ 142,250$ 127,733$ 149,458$ 541,985$ 168,545$ 187,275$ 136,654$ Adjustments Stock appreciation rights (A) 892 983 1,251 1,277 4,403 2,344 3,230 314 Redeemable noncontrolling interests (B) 310 593 182 898 1,983 495 340 368 Equity-based compensation (C) 1,958 3,215 3,077 2,718 10,968 3,132 3,781 3,285 Severance and other permitted costs (D) 147 249 273 463 1,132 352 379 (315) Transaction costs (acquisition and other) (E) 575 2,393 921 (344) 3,545 386 292 476 (Gain) loss on disposal of assets (F) (78) (144) (252) (439) (913) (284) 81 (411) Effects of fair value adjustments to inventory (G) 1,731 - 1,870 217 3,818 44 135 457 Total Add-Backs 5,535$ 7,289$ 7,322$ 4,790$ 24,936$ 6,469$ 8,238$ 4,174$ Adjusted EBITDA (as reported) 128,079$ 149,539$ 135,055$ 154,248$ 566,921$ 175,014$ 195,513$ 140,828$ Net Sales $1,042,076 $1,150,551 $1,153,595 $1,288,653 $4,634,875 $1,359,553 $1,430,979 $1,234,618 Adjusted EBITDA Margin 12.3% 13.0% 11.7% 12.0% 12.2% 12.9% 13.7% 11.4%
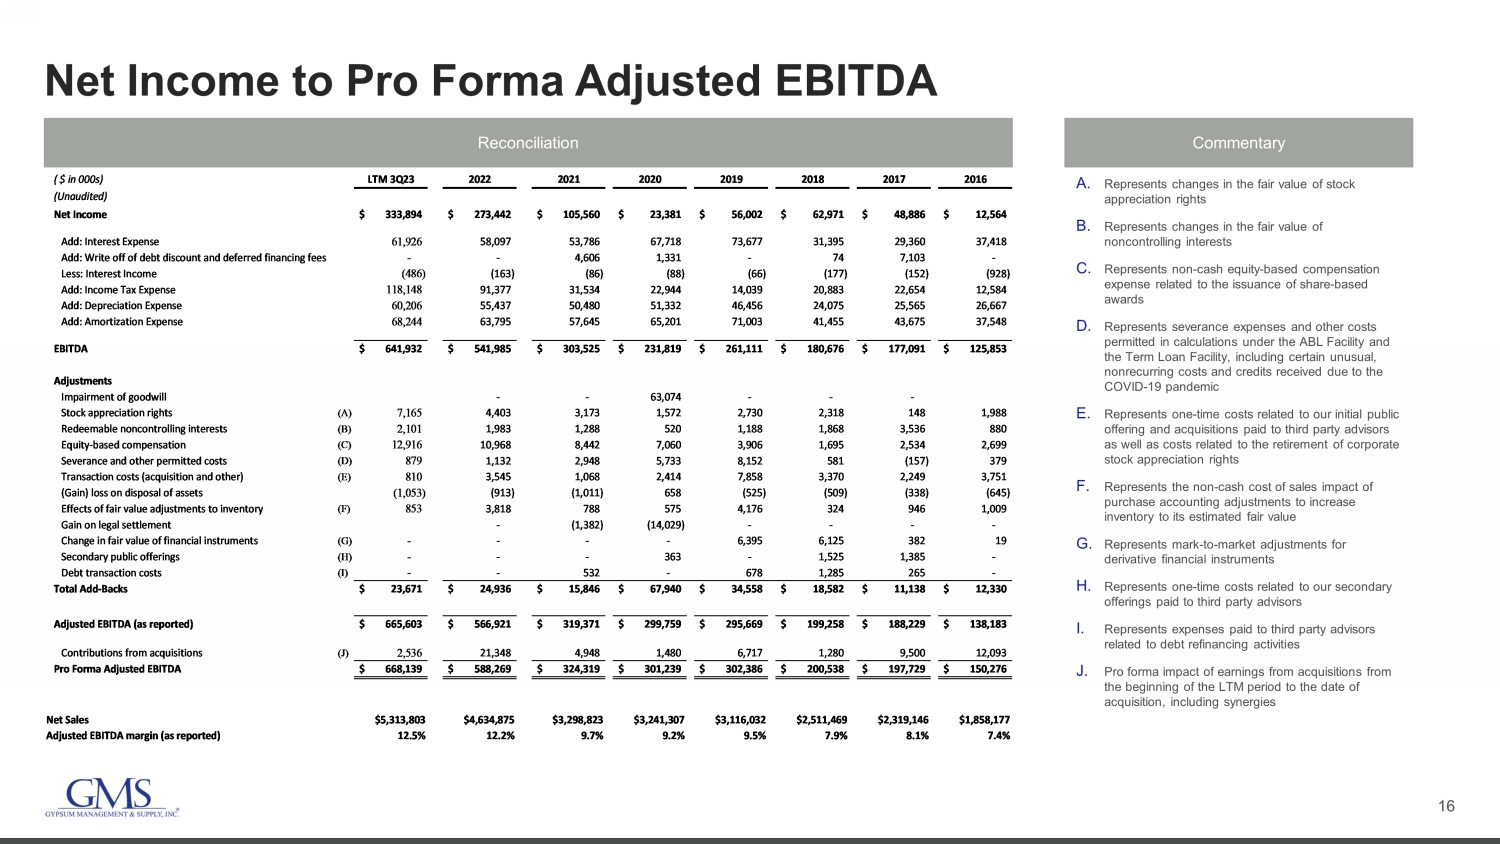
16 Net Income to Pro Forma Adjusted EBITDA Reconciliation Commentary A. Represents changes in the fair value of stock appreciation rights B. Represents changes in the fair value of noncontrolling interests C. Represents non - cash equity - based compensation expense related to the issuance of share - based awards D. Represents severance expenses and other costs permitted in calculations under the ABL Facility and the Term Loan Facility, including certain unusual, nonrecurring costs and credits received due to the COVID - 19 pandemic E. Represents one - time costs related to our initial public offering and acquisitions paid to third party advisors as well as costs related to the retirement of corporate stock appreciation rights F. Represents the non - cash cost of sales impact of purchase accounting adjustments to increase inventory to its estimated fair value G. Represents mark - to - market adjustments for derivative financial instruments H. Represents one - time costs related to our secondary offerings paid to third party advisors I. Represents expenses paid to third party advisors related to debt refinancing activities J. Pro forma impact of earnings from acquisitions from the beginning of the LTM period to the date of acquisition, including synergies ( $ in 000s) LTM 3Q23 2022 2021 2020 2019 2018 2017 2016 (Unaudited) Net Income 333,894$ 273,442$ 105,560$ 23,381$ 56,002$ 62,971$ 48,886$ 12,564$ Add: Interest Expense 61,926 58,097 53,786 67,718 73,677 31,395 29,360 37,418 Add: Write off of debt discount and deferred financing fees - - 4,606 1,331 - 74 7,103 - Less: Interest Income (486) (163) (86) (88) (66) (177) (152) (928) Add: Income Tax Expense 118,148 91,377 31,534 22,944 14,039 20,883 22,654 12,584 Add: Depreciation Expense 60,206 55,437 50,480 51,332 46,456 24,075 25,565 26,667 Add: Amortization Expense 68,244 63,795 57,645 65,201 71,003 41,455 43,675 37,548 EBITDA 641,932$ 541,985$ 303,525$ 231,819$ 261,111$ 180,676$ 177,091$ 125,853$ Adjustments Impairment of goodwill - - 63,074 - - - Stock appreciation rights (A) 7,165 4,403 3,173 1,572 2,730 2,318 148 1,988 Redeemable noncontrolling interests (B) 2,101 1,983 1,288 520 1,188 1,868 3,536 880 Equity-based compensation (C) 12,916 10,968 8,442 7,060 3,906 1,695 2,534 2,699 Severance and other permitted costs (D) 879 1,132 2,948 5,733 8,152 581 (157) 379 Transaction costs (acquisition and other) (E) 810 3,545 1,068 2,414 7,858 3,370 2,249 3,751 (Gain) loss on disposal of assets (1,053) (913) (1,011) 658 (525) (509) (338) (645) Effects of fair value adjustments to inventory (F) 853 3,818 788 575 4,176 324 946 1,009 Gain on legal settlement - (1,382) (14,029) - - - - Change in fair value of financial instruments (G) - - - - 6,395 6,125 382 19 Secondary public offerings (H) - - - 363 - 1,525 1,385 - Debt transaction costs (I) - - 532 - 678 1,285 265 - Total Add-Backs 23,671$ 24,936$ 15,846$ 67,940$ 34,558$ 18,582$ 11,138$ 12,330$ Adjusted EBITDA (as reported) 665,603$ 566,921$ 319,371$ 299,759$ 295,669$ 199,258$ 188,229$ 138,183$ Contributions from acquisitions (J) 2,536 21,348 4,948 1,480 6,717 1,280 9,500 12,093 Pro Forma Adjusted EBITDA 668,139$ 588,269$ 324,319$ 301,239$ 302,386$ 200,538$ 197,729$ 150,276$ Net Sales $5,313,803 $4,634,875 $3,298,823 $3,241,307 $3,116,032 $2,511,469 $2,319,146 $1,858,177 Adjusted EBITDA margin (as reported) 12.5% 12.2% 9.7% 9.2% 9.5% 7.9% 8.1% 7.4%
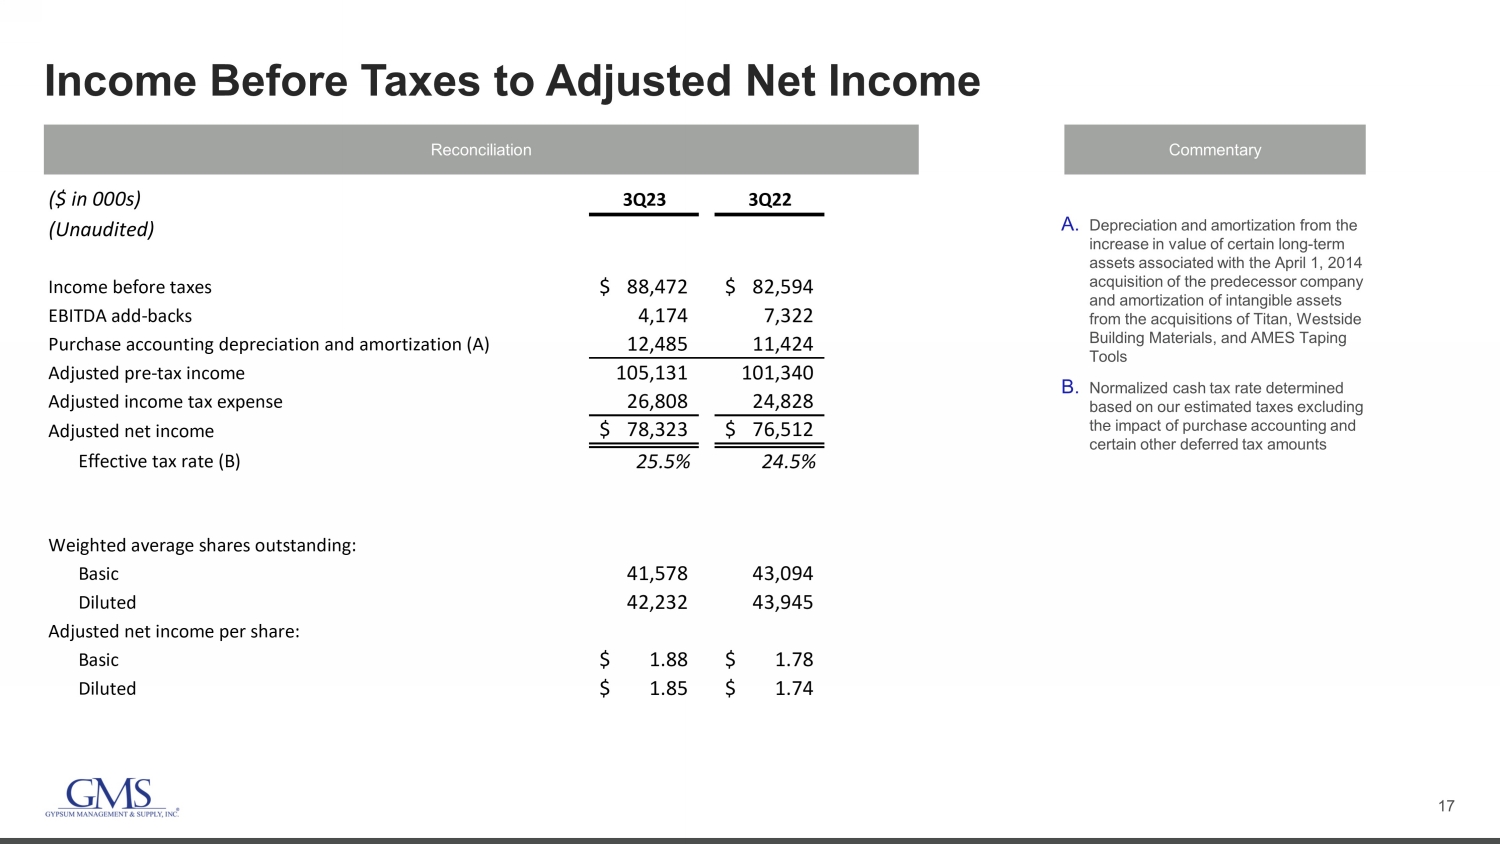
17 Income Before Taxes to Adjusted Net Income Reconciliation Commentary A. Depreciation and amortization from the increase in value of certain long - term assets associated with the April 1, 2014 acquisition of the predecessor company and amortization of intangible assets from the acquisitions of Titan, Westside Building Materials, and AMES Taping Tools B. Normalized cash tax rate determined based on our estimated taxes excluding the impact of purchase accounting and certain other deferred tax amounts ($ in 000s) 3Q23 3Q22 (Unaudited) Income before taxes 88,472$ 82,594$ EBITDA add-backs 4,174 7,322 Purchase accounting depreciation and amortization (A) 12,485 11,424 Adjusted pre-tax income 105,131 101,340 Adjusted income tax expense 26,808 24,828 Adjusted net income 78,323$ 76,512$ Effective tax rate (B) 25.5% 24.5% Weighted average shares outstanding: Basic 41,578 43,094 Diluted 42,232 43,945 Adjusted net income per share: Basic 1.88$ 1.78$ Diluted 1.85$ 1.74$
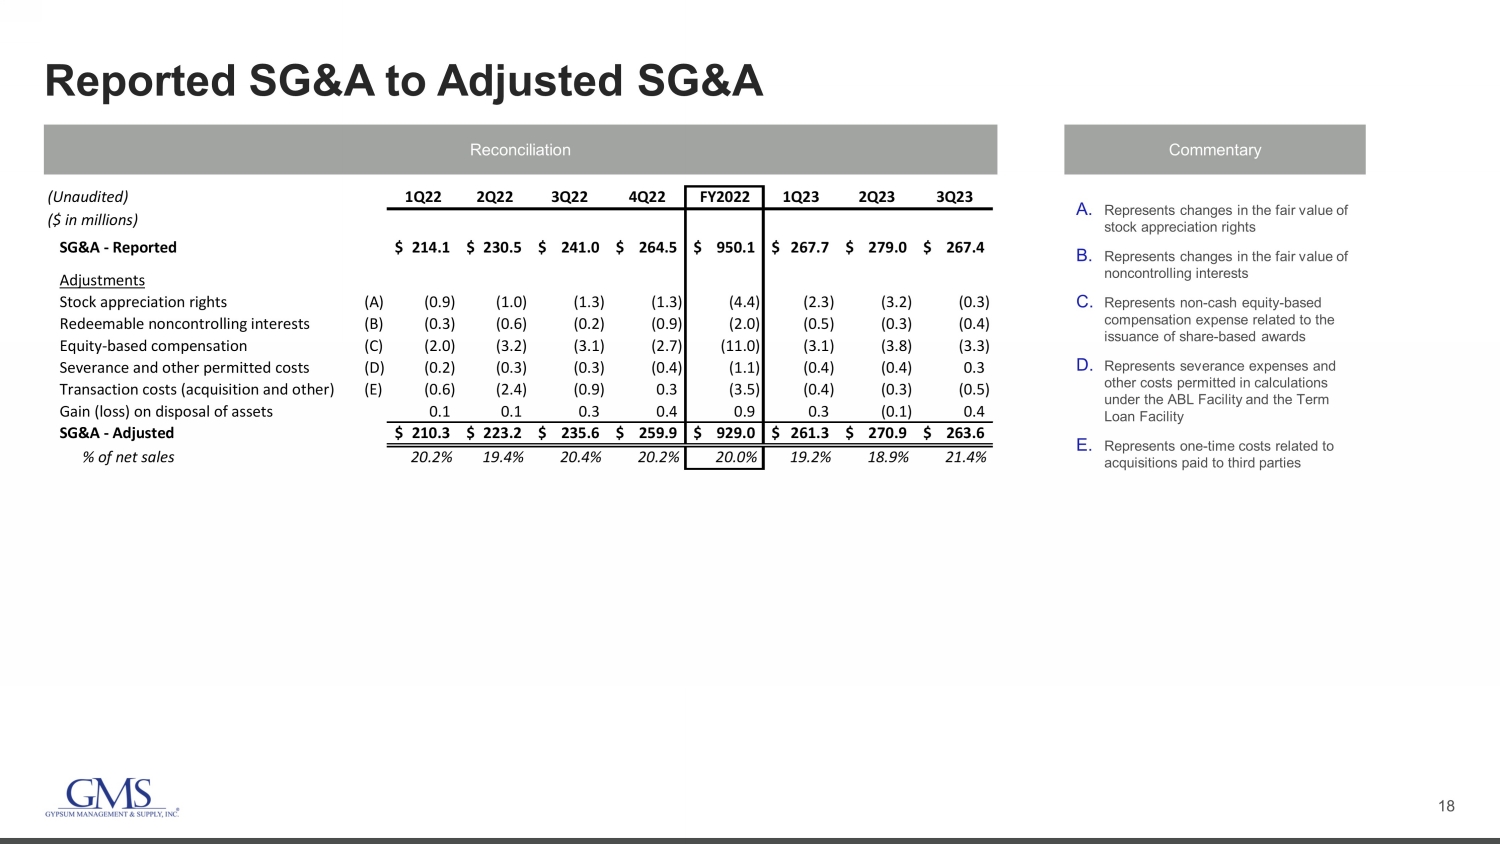
18 Reported SG&A to Adjusted SG&A Reconciliation Commentary A. Represents changes in the fair value of stock appreciation rights B. Represents changes in the fair value of noncontrolling interests C. Represents non - cash equity - based compensation expense related to the issuance of share - based awards D. Represents severance expenses and other costs permitted in calculations under the ABL Facility and the Term Loan Facility E. Represents one - time costs related to acquisitions paid to third parties (Unaudited) 1Q22 2Q22 3Q22 4Q22 FY2022 1Q23 2Q23 3Q23 ($ in millions) SG&A - Reported 214.1$ 230.5$ 241.0$ 264.5$ 950.1$ 267.7$ 279.0$ 267.4$ Adjustments Stock appreciation rights (A) (0.9) (1.0) (1.3) (1.3) (4.4) (2.3) (3.2) (0.3) Redeemable noncontrolling interests (B) (0.3) (0.6) (0.2) (0.9) (2.0) (0.5) (0.3) (0.4) Equity-based compensation (C) (2.0) (3.2) (3.1) (2.7) (11.0) (3.1) (3.8) (3.3) Severance and other permitted costs (D) (0.2) (0.3) (0.3) (0.4) (1.1) (0.4) (0.4) 0.3 Transaction costs (acquisition and other) (E) (0.6) (2.4) (0.9) 0.3 (3.5) (0.4) (0.3) (0.5) Gain (loss) on disposal of assets 0.1 0.1 0.3 0.4 0.9 0.3 (0.1) 0.4 SG&A - Adjusted 210.3$ 223.2$ 235.6$ 259.9$ 929.0$ 261.3$ 270.9$ 263.6$ % of net sales 20.2% 19.4% 20.4% 20.2% 20.0% 19.2% 18.9% 21.4%
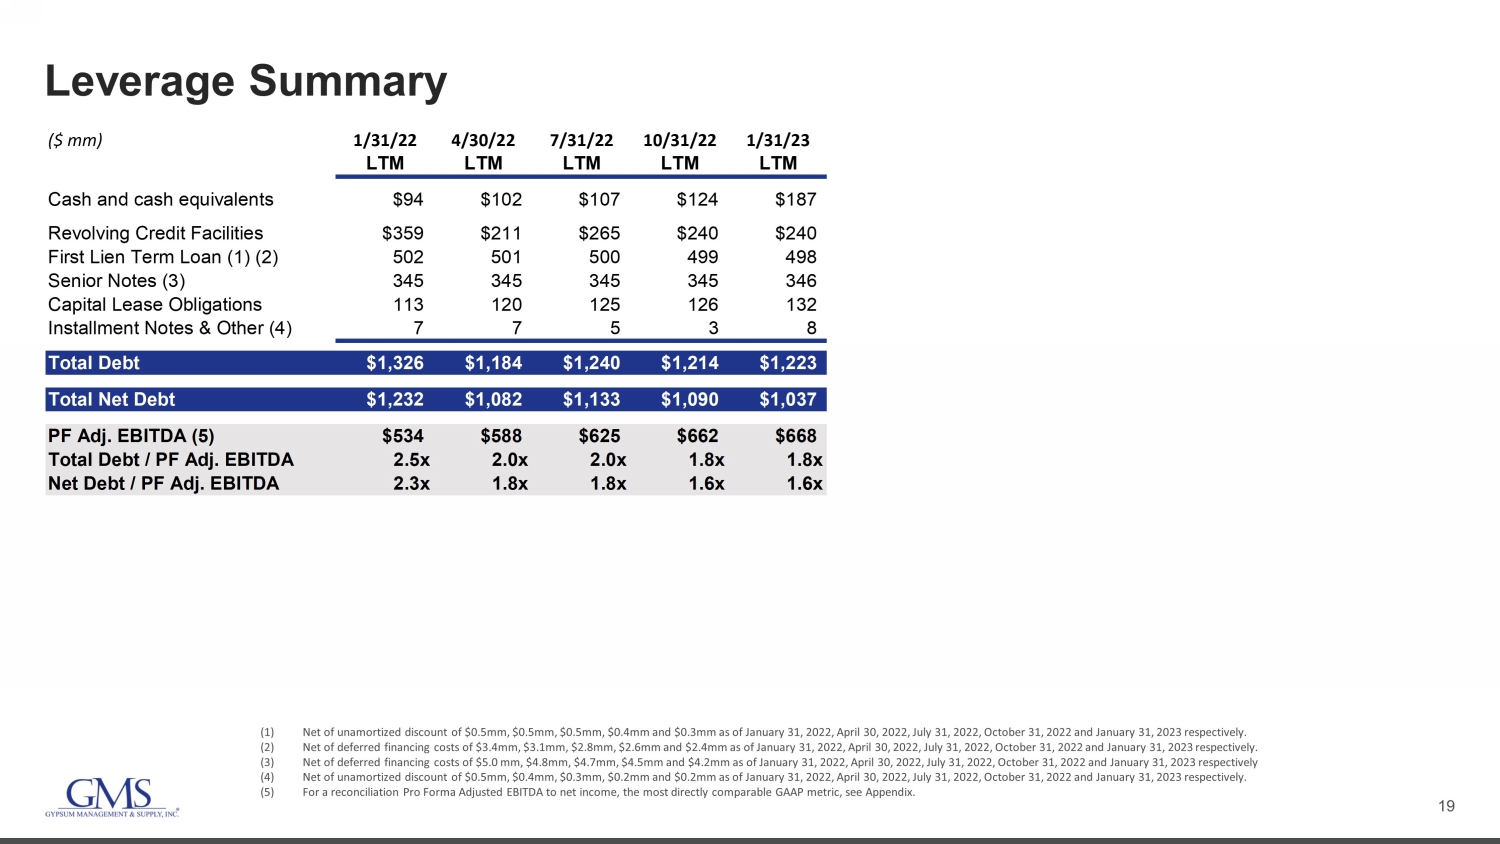
19 Leverage Summary (1) Net of unamortized discount of $0.5mm, $0.5mm, $0.5mm, $0.4mm and $0.3mm as of January 31, 2022, April 30, 2022, July 31, 202 2, October 31, 2022 and January 31, 2023 respectively. (2) Net of deferred financing costs of $3.4mm, $3.1mm, $2.8mm, $2.6mm and $2.4mm as of January 31, 2022, April 30, 2022, July 31, 20 22, October 31, 2022 and January 31, 2023 respectively. (3) Net of deferred financing costs of $5.0 mm, $4.8mm, $4.7mm, $4.5mm and $4.2mm as of January 31, 2022, April 30, 2022, July 31 , 2 022, October 31, 2022 and January 31, 2023 respectively (4) Net of unamortized discount of $0.5mm, $0.4mm, $0.3mm, $0.2mm and $0.2mm as of January 31, 2022, April 30, 2022, July 31, 202 2, October 31, 2022 and January 31, 2023 respectively. (5) For a reconciliation Pro Forma Adjusted EBITDA to net income, the most directly comparable GAAP metric, see Appendix. ($ mm) 1/31/22 4/30/22 7/31/22 10/31/22 1/31/23 LTM LTM LTM LTM LTM Cash and cash equivalents $94 $102 $107 $124 $187 Revolving Credit Facilities $359 $211 $265 $240 $240 First Lien Term Loan (1) (2) 502 501 500 499 498 Senior Notes (3) 345 345 345 345 346 Capital Lease Obligations 113 120 125 126 132 Installment Notes & Other (4) 7 7 5 3 8 Total Debt $1,326 $1,184 $1,240 $1,214 $1,223 Total Net Debt $1,232 $1,082 $1,133 $1,090 $1,037 PF Adj. EBITDA (5) $534 $588 $625 $662 $668 Total Debt / PF Adj. EBITDA 2.5x 2.0x 2.0x 1.8x 1.8x Net Debt / PF Adj. EBITDA 2.3x 1.8x 1.8x 1.6x 1.6x