UNITED STATES
SECURITIES AND EXCHANGE COMMISSION
WASHINGTON, D.C. 20549
FORM N-CSR
CERTIFIED SHAREHOLDER REPORT OF REGISTERED MANAGEMENT
INVESTMENT COMPANIES
Investment Company Act file number 811-22943
Oppenheimer Emerging Markets Innovators Fund
(Exact name of registrant as specified in charter)
6803 South Tucson Way, Centennial, Colorado 80112-3924
(Address of principal executive offices) (Zip code)
Cynthia Lo Bessette
OFI Global Asset Management, Inc.
225 Liberty Street, New York, New York 10281-1008
(Name and address of agent for service)
Registrant’s telephone number, including area code: (303) 768-3200
Date of fiscal year end: August 31
Date of reporting period: 2/28/2018
Item 1. Reports to Stockholders.
Table of Contents
Class A Shares
AVERAGE ANNUAL TOTAL RETURNS AT 2/28/18
| | | | | | |
| | | Class A Shares of the Fund | | |
| | | Without Sales Charge | | With Sales Charge | | MSCI Emerging
Markets Mid Cap Index |
| 6-Month | | 12.41% | | 5.95% | | 8.75% |
| 1-Year | | 35.53 | | 27.73 | | 25.57 |
| Since Inception (6/30/14) | | 5.13 | | 3.45 | | 3.79 |
Performance data quoted represents past performance, which does not guarantee future results. The investment return and principal value of an investment in the Fund will fluctuate so that an investor’s shares, when redeemed, may be worth more or less than their original cost. Fund returns include changes in share price, reinvested distributions, and a 5.75% maximum applicable sales charge except where “without sales charge” is indicated. Current performance may be lower or higher than the performance quoted. Returns do not consider capital gains or income taxes on an individual’s investment. Returns for periods of less than one year are cumulative and not annualized. For performance data current to the most recent month-end, visit oppenheimerfunds.com or call 1.800.CALL OPP (225.5677). See Fund prospectuses and summary prospectuses for more information on share classes and sales charges.
|
| 2 OPPENHEIMER EMERGING MARKETS INNOVATORS FUND |
Fund Performance Discussion
The Fund’s Class A shares (without sales charge) returned 12.41% during the six-month reporting period ended February 28, 2018. In comparison, the MSCI Emerging Markets Mid Cap Index (the “Index”) returned 8.75%.
The Fund’s largest sector overweights at period end were: Consumer (Discretionary and Staples), Health Care and Information Technology. We continue to believe that these sectors represent the highest concentration of innovation within the small-and mid-cap universe in the emerging markets (“EM”). The Fund’s biggest underweights were in Industrials, Materials, Utilities and Real Estate. Except for very unique circumstances, we believe these sectors are less attractive to investors in small- and mid-cap EM companies. This is because many of the dominant businesses in these sectors benefit from cost or borrowing advantages arising from size. For example, many of the winning Industrials companies have production cost advantages arising from economies of scale. Utilities are a low growth area, often filled with state-run enterprises or companies that benefit substantially from state intervention. This makes them less attractive from a growth perspective.
During the reporting period, the Fund’s outperformance versus the Index was primarily due to stock selection in the Health Care sector. Other positive contributors to performance versus the Index included the Fund’s overweight position in Consumer (Discretionary and Staples), its lack of
exposure to Utilities, and its underweight position in Industrials, where stock selection also benefitted. Underperforming sectors included Financials and Information Technology, due primarily to less favorable stock selection, along with Energy, where the Fund’s lack of exposure hurt relative performance.
In terms of countries, as of the end of the reporting period, the Fund’s highest country allocations included China, India, Taiwan, South Korea, and Brazil. Since inception, the Fund has favored Asia versus Latin America or Africa. We believe that Asian markets have more innovative businesses to own within the high profit sectors (Health Care, Information Technology, and Consumer) that the Fund targets. During the reporting period, stock selection in South Korea, India and Malaysia contributed positively to the Fund’s performance versus the Index. Less favorable stock selection in Taiwan and Poland detracted from performance, as did an underweight position in China.
MARKET OVERVIEW
Emerging markets (EM) ended 2017 up a cumulative 77% off their lows in 2016 as measured by the MSCI EM Index, significantly outperforming their developed market
|
| 3 OPPENHEIMER EMERGING MARKETS INNOVATORS FUND |
counterparts. Volatility returned to close the reporting period, as concerns over rising interest rates and inflation resulted in the first market correction since 2016 in February 2018. However, we continue to believe that EM equities have the potential to further outperform U.S. equities as business cycles are less advanced in much of the developing world. Unlike 2016 and 2017, where momentum styles outperformed, we believe this is the point in the EM equity market cycle where fundamental stock pickers can generate meaningful alpha as focus turns to companies that have the ability to generate sustainable corporate earnings growth.
FUND REVIEW
Top contributors to performance this reporting period included Celltrion, Inc., Biocon Limited and My E.G. Services Bhd.
Celltrion is a South Korean biosimilar drug maker. It was among the first companies to get European or Food and Drug Administration (“FDA”) approvals for its versions of blockbuster biologic drugs. It has two biosimilar drugs approved in Europe (a copy of Remicade to treat autoimmune diseases and a copy of Rituxan to treat Non-Hodgkin’s Lymphoma). Its Remicade biosimilar is approved in the U.S. It is expected that by 2019, Celltrion will have received approvals for biosimilars that replicate drugs earning $50 billion per year. The stock price surged in the fourth quarter
of 2017 on the back of strong third quarter earnings, a recommendation by the Committee for Medicinal Products for Human Use of the European Medicines Agency (the European equivalent of the FDA) that Celltrion’s biosimilar Herceptin be approved by the European regulators, and the expectation for more drug approvals in the first half of 2018. In fact, in February 2018, Celltrion’s Herzuma received EU approval for early breast cancer, metastatic breast cancer, and metastatic gastric cancer.
Biocon is an Indian Biopharma company that makes active pharmaceutical ingredients and generic drugs. In addition to its strong chemical drug portfolios, we believe Biocon has one of the strongest biosimilar drug platforms in the world, with a potential addressable market of roughly U.S. $60 billion globally. We believe biosimilars, which are near-replicas of biological drugs coming off-patent, offer the best chance to increase drug accessibility in the EM world and reduce healthcare costs without compromising treatment quality in the U.S. In the fourth quarter of 2017, Biocon received approval from the FDA for its biosimilar version of Herceptin to treat breast cancer. This is Biocon’s first major biosimilar approval from a Western health regulator. We believe it is game changing because it validates Biocon’s biosimilar capabilities. We think it increases the likelihood of an approval of its biosimilar Herceptin in Europe and future approvals of
|
| 4 OPPENHEIMER EMERGING MARKETS INNOVATORS FUND |
the rest of its biosimilar pipeline, which includes versions of Neulasta to treat chemotherapy-induced neutropenia and Glargine, a long-acting insulin.
My E.G. Services Bhd is a Malaysian company that generates revenue by allowing customers to complete mandatory government forms online, including foreign worker registration, testing and issuance of drivers’ licenses, motor vehicle insurance renewal, and replacement of Malaysian ID cards My E.G. services benefits the government by increasing compliance and benefits customers through convenience and, ideally, lower costs. The company’s ability to deliver on expectations has made it a strong partner for the government as various agencies launch new initiatives. My E.G. has also been able to leverage its large database of customers to facilitate the introduction of additional products and services. An example would be the launch in late 2017 of a lodging facility that can accommodate up to 1600 foreign workers. We believe that My E.G.’s innovative approach to addressing seemingly mundane issues will continue to open up new avenues for growth.
Detractors from performance this reporting period included Largan Precision Co., Ltd., KRUK S.A. and Gentera, S.A.B. de C.V.
Largan is a maker of lenses for smartphone cameras. We believe Largan has the best design technology and best production yield for plastic lenses in the industry. The company sold off on the back of weak iPhone X sales
and the resulting impact this had on October and November revenues. Apple is its largest customer. There is also speculation that the entrance of competitor AAC into the camera lens market and improving yields at Sunny Optical (both also owned by the Fund) could cause Largan’s high gross margins to undergo compression. However, we believe Largan is cheaply priced given its potential to post solid growth on the back of more powerful optical zoom, solid large-aperture lens adoption, and successful penetration into 3D sensing in 2019. We remain positive about Largan’s long-term earnings growth prospects.
KRUK is a Polish debt collection company that specializes in amicable settlements. It offers indebted individuals a new payment schedule rather than threatening litigation proceedings. Currently about two-thirds of its cash recoveries come from voluntary repayment. Poland still accounts for the majority of the business, but KRUK is growing in Romania and Italy. The Italian market is four times larger than Poland and Romania combined. Delays in turning around the company’s Italian business and the need to take a significant writedown there has weighed on the stock. The problem has been primarily been in older portfolios, with new portfolios doing well and in some cases exceeding expectations.
Gentera is a Mexican non-bank financial that offers small working capital loans to affinity groups. Its shares experienced volatility in the closing months of the reporting period on the back of disappointing
|
| 5 OPPENHEIMER EMERGING MARKETS INNOVATORS FUND |
earnings. The company saw a decline in loan growth, largely a result of the efforts to improve asset quality. Gentera has taken steps to address the issue that will play out over time. We believe that the company still has opportunities for growth in an underpenetrated segment of the market. Additionally, we expect that the company’s strong capital position will give it flexibility to deliver solid returns for shareholders.
STRATEGY & OUTLOOK
Political, institutional, and governance reforms have created perhaps the best backdrop for growth and new business formation that has ever existed in the history of the EM. As a result, the EM universe has changed. It now provides investors with more choices and allows them to be better positioned for structural growth. We believe this evolution has not been fully captured by the indices, which are market-cap weighted and, therefore, backward-looking. In our opinion, the lack of focus on the transformational growth areas within EM provides a great opportunity for active managers to create long-term value.
The Fund was conceived with the thesis that an increasingly large number of attractive growth opportunities in the EM are found in the mid- and small-cap universe. Often these companies are overlooked by investors who have primarily focused on large-cap EM stocks, which dominate the index funds and ETFs.
We use innovation as a mental model to help identify the companies creating differentiated businesses with long-term durable competitive advantages. “Innovation” in our context can be a product, brand, business model or strategic differentiation that creates an entirely new market (this is what we call transformational innovation) or allows for rapid market share gains within an existing market.
Our focus on investing in innovation naturally leads us to overweights in high profit sectors like Health Care, Information Technology and Consumer. We believe that many innovative opportunities are missed by investors who choose to access EM strictly via U.S., Japanese or Western European companies that sell into the EM. While these investments will capture some of the upswing in EM consumption, we believe they will entirely miss the upside available to investors who are able to successfully identify the talented entrepreneurs who exist in these nations. In essence, they are only reaping a small portion of the benefits of the long-term EM growth story.
Despite some of the macro turbulence, things are generally better than they have ever been for a large swath of the roughly 6 billion people who live in most of the emerging and frontier markets. Affluence is broadly higher, literacy levels are at an all-time high, and corporate governance standards and practices are improving. All this feeds innovation
|
| 6 OPPENHEIMER EMERGING MARKETS INNOVATORS FUND |
and boosts aspirations, while providing a backdrop for businesses seeking to move up the value-chain towards more complex, high-margin products and services.
|
| 7 OPPENHEIMER EMERGING MARKETS INNOVATORS FUND |
Top Holdings and Allocations
TOP TEN GEOGRAPHICAL HOLDINGS
| | | | |
China | | | 21.5 | % |
India | | | 12.3 | |
Taiwan | | | 12.3 | |
Brazil | | | 7.6 | |
United States | | | 7.6 | |
South Korea | | | 7.2 | |
South Africa | | | 7.0 | |
Malaysia | | | 3.5 | |
Mexico | | | 2.2 | |
Argentina | | | 2.0 | |
Portfolio holdings and allocation are subject to change. Percentages are as of February 28, 2018, and are based on total market value of investments.
TOP TEN COMMON STOCK HOLDINGS
| | | | |
Biocon Ltd. | | | 2.9 | % |
My EG Services Bhd | | | 2.9 | |
Medy-Tox, Inc. | | | 2.4 | |
TAL Education Group, ADR | | | 2.3 | |
Discovery Ltd. | | | 2.0 | |
China Lodging Group Ltd., Sponsored ADR | | | 1.9 | |
AAC Technologies Holdings, Inc. | | | 1.9 | |
Vipshop Holdings Ltd., ADR | | | 1.8 | |
Sunny Optical Technology Group Co. Ltd. | | | 1.7 | |
Airtac International Group | | | 1.5 | |
Portfolio holdings and allocations are subject to change. Percentages are as of February 28, 2018, and are based on net assets. For more current Fund holdings, please visit oppenheimerfunds.com.
SECTOR ALLOCATION
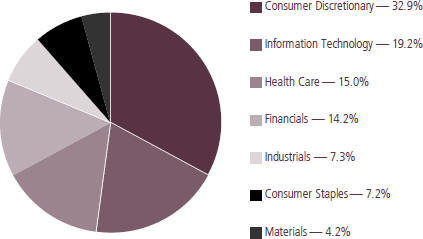
Portfolio holdings and allocations are subject to change. Percentages are as of February 28, 2018, and are based on the total market value of investments.
|
| 8 OPPENHEIMER EMERGING MARKETS INNOVATORS FUND |
Share Class Performance
AVERAGE ANNUAL TOTAL RETURNS WITHOUT SALES CHARGE AS OF 2/28/18
| | | | | | | | | | | | | | | | |
| | | Inception
Date | | | 6-Month | | | 1-Year | | | Since
Inception | |
Class A (EMIAX) | | | 6/30/14 | | | | 12.41 | % | | | 35.53 | % | | | 5.13 | % |
Class C (EMVCX) | | | 6/30/14 | | | | 12.00 | | | | 34.45 | | | | 4.32 | |
Class I (EMVIX) | | | 6/30/14 | | | | 12.62 | | | | 36.15 | | | | 5.62 | |
Class R (EMIRX) | | | 6/30/14 | | | | 12.26 | | | | 35.10 | | | | 4.85 | |
Class Y (EMIYX) | | | 6/30/14 | | | | 12.52 | | | | 35.76 | | | | 5.40 | |
AVERAGE ANNUAL TOTAL RETURNS WITH SALES CHARGE AS OF 2/28/18
| | | | | | | | | | | | | | | | |
| | | Inception
Date | | | 6-Month | | | 1-Year | | | Since
Inception | |
Class A (EMIAX) | | | 6/30/14 | | | | 5.95 | % | | | 27.73 | % | | | 3.45 | % |
Class C (EMVCX) | | | 6/30/14 | | | | 11.00 | | | | 33.45 | | | | 4.32 | |
Class I (EMVIX) | | | 6/30/14 | | | | 12.62 | | | | 36.15 | | | | 5.62 | |
Class R (EMIRX) | | | 6/30/14 | | | | 12.26 | | | | 35.10 | | | | 4.85 | |
Class Y (EMIYX) | | | 6/30/14 | | | | 12.52 | | | | 35.76 | | | | 5.40 | |
Performance data quoted represents past performance, which does not guarantee future results. The investment return and principal value of an investment in the Fund will fluctuate so that an investor’s shares, when redeemed, may be worth more or less than their original cost. Current performance may be lower or higher than the performance quoted. Returns do not consider capital gains or income taxes on an individual’s investment. For performance data current to the most recent month-end, visit oppenheimerfunds.com or call 1.800.CALL OPP (225.5677). Fund returns include changes in share price, reinvested distributions, and the applicable sales charge: for Class A shares, the current maximum initial sales charge of 5.75%; and for Class C shares, the contingent deferred sales charge of 1% for the 1-year period. There is no sales charge for Class I, Class R and Class Y shares. Returns for periods of less than one year are cumulative and not annualized. See Fund prospectuses and summary prospectuses for more information on share classes and sales charges.
The Fund’s performance is compared to the performance of the MSCI Emerging Markets Mid Cap Index, which is designed to measure performance of mid-capitalization, global emerging market equities. The Index is unmanaged and cannot be purchased directly by investors. While index comparisons may be useful to provide a benchmark for the Fund’s performance, it must be noted that the Fund’s investments are not limited to the investments comprising the Index. Index performance includes reinvestment of income, but does not reflect transaction costs, fees, expenses or taxes. Index performance is shown for illustrative purposes only as a benchmark for the Fund’s performance, and does not predict or depict performance of the Fund. The Fund’s performance reflects the effects of the Fund’s business and operating expenses.
The views in the Fund Performance Discussion represent the opinions of this Fund’s portfolio managers and are not intended as investment advice or to predict or depict the performance of any investment. These views are as of the close of business on February 28, 2018, and are
|
| 9 OPPENHEIMER EMERGING MARKETS INNOVATORS FUND |
subject to change based on subsequent developments. The Fund’s portfolio and strategies are subject to change.
Before investing in any of the Oppenheimer funds, investors should carefully consider a fund’s investment objectives, risks, charges and expenses. Fund prospectuses and summary prospectuses contain this and other information about the funds, and may be obtained by asking your financial advisor, visiting oppenheimerfunds.com, or calling 1.800.CALL OPP (225.5677). Read prospectuses and summary prospectuses carefully before investing.
Shares of Oppenheimer funds are not deposits or obligations of any bank, are not guaranteed by any bank, are not insured by the FDIC or any other agency, and involve investment risks, including the possible loss of the principal amount invested.
|
| 10 OPPENHEIMER EMERGING MARKETS INNOVATORS FUND |
Fund Expenses
Fund Expenses. As a shareholder of the Fund, you incur two types of costs: (1) transaction costs, which may include sales charges (loads) on purchase payments and/or contingent deferred sales charges on redemptions; and (2) ongoing costs, including management fees; distribution and service fees; and other Fund expenses. These examples are intended to help you understand your ongoing costs (in dollars) of investing in the Fund and to compare these costs with the ongoing costs of investing in other mutual funds.
The examples are based on an investment of $1,000.00 invested at the beginning of the period and held for the entire 6-month period ended February 28, 2018.
Actual Expenses. The first section of the table provides information about actual account values and actual expenses. You may use the information in this section for the class of shares you hold, together with the amount you invested, to estimate the expense that you paid over the period. Simply divide your account value by $1,000.00 (for example, an $8,600.00 account value divided by $1,000.00 = 8.60), then multiply the result by the number in the first section under the heading entitled “Expenses Paid During 6 Months Ended February 28, 2018” to estimate the expenses you paid on your account during this period.
Hypothetical Example for Comparison Purposes. The second section of the table provides information about hypothetical account values and hypothetical expenses based on the Fund’s actual expense ratio for each class of shares, and an assumed rate of return of 5% per year for each class before expenses, which is not the Fund’s actual return. The hypothetical account values and expenses may not be used to estimate the actual ending account balance or expenses you paid for the period. You may use this information to compare the ongoing costs of investing in the Fund and other funds. To do so, compare this 5% hypothetical example for the class of shares you hold with the 5% hypothetical examples that appear in the shareholder reports of the other funds.
Please note that the expenses shown in the table are meant to highlight your ongoing costs only and do not reflect any transactional costs, such as front-end or contingent deferred sales charges (loads). Therefore, the “hypothetical” section of the table is useful in comparing ongoing costs only, and will not help you determine the relative total costs of owning different funds. In addition, if these transactional costs were included, your costs would have been higher.
|
| 11 OPPENHEIMER EMERGING MARKETS INNOVATORS FUND |
| | | | | | |
| Actual | | Beginning Account Value September 1, 2017 | | Ending Account Value February 28, 2018 | | Expenses Paid During 6 Months Ended February 28, 2018 |
| Class A | | $ 1,000.00 | | $ 1,124.10 | | $ 8.99 |
| Class C | | 1,000.00 | | 1,120.00 | | 12.90 |
| Class I | | 1,000.00 | | 1,126.20 | | 6.61 |
| Class R | | 1,000.00 | | 1,122.60 | | 10.31 |
| Class Y | | 1,000.00 | | 1,125.20 | | 7.67 |
| | |
Hypothetical (5% return before expenses) | | | | |
| Class A | | 1,000.00 | | 1,016.36 | | 8.53 |
| Class C | | 1,000.00 | | 1,012.69 | | 12.25 |
| Class I | | 1,000.00 | | 1,018.60 | | 6.28 |
| Class R | | 1,000.00 | | 1,015.12 | | 9.79 |
| Class Y | | 1,000.00 | | 1,017.60 | | 7.28 |
Expenses are equal to the Fund’s annualized expense ratio for that class, multiplied by the average account value over the period, multiplied by 181/365 (to reflect the one-half year period). Those annualized expense ratios, excluding indirect expenses from affiliated funds, based on the 6-month period ended February 28, 2018 are as follows:
| | | | | | | | |
| Class | | Expense Ratios | | | | |
| Class A | | | 1.70% | | | | | |
| Class C | | | 2.44 | | | | | |
| Class I | | | 1.25 | | | | | |
| Class R | | | 1.95 | | | | | |
| Class Y | | | 1.45 | | | | | |
The expense ratios reflect voluntary and/or contractual waivers and/or reimbursements of expenses by the Fund’s Manager and Transfer Agent. Some of these undertakings may be modified or terminated at any time, as indicated in the Fund’s prospectus. The “Financial Highlights” tables in the Fund’s financial statements, included in this report, also show the gross expense ratios, without such waivers or reimbursements and reduction to custodian expenses, if applicable.
|
| 12 OPPENHEIMER EMERGING MARKETS INNOVATORS FUND |
STATEMENT OF INVESTMENTS February 28, 2018 Unaudited
| | | | | | | | |
| | | Shares | | | Value | |
| Common Stocks—92.8% | | | | | | | | |
| Consumer Discretionary—30.6% | | | | | |
| Auto Components—2.7% | | | | | | | | |
Cub Elecparts, Inc. | | | 372,671 | | | $ | 4,335,725 | |
Hota Industrial | | | | | | | | |
Manufacturing Co. Ltd. | | | 1,084,449 | | | | 4,743,471 | |
Minth Group Ltd. | | | 636,000 | | | | 3,733,632 | |
| | | | | | | | |
| | | | | | | | 12,812,828 | |
| Automobiles—1.2% | | | | | | | | |
Brilliance China Automotive Holdings Ltd. | | | 2,122,000 | | | | 5,685,303 | |
| Diversified Consumer Services—7.5% | | | | | |
Bright Scholar | | | | | | | | |
Education Holdings Ltd., ADR1 | | | 192,440 | | | | 3,483,164 | |
China Maple Leaf | | | | | | | | |
Educational Systems Ltd. | | | 3,740,000 | | | | 4,727,164 | |
Curro Holdings Ltd.1 | | | 673,475 | | | | 1,989,718 | |
Four Seasons | | | | | | | | |
Education Cayman, Inc., ADR | | | 240,890 | | | | 1,903,031 | |
Fu Shou Yuan | | | | | | | | |
International Group Ltd.2 | | | 5,691,000 | | | | 4,998,818 | |
| New Oriental Education & Technology Group, Inc., Sponsored ADR | | | 73,920 | | | | 6,755,549 | |
Stadio Holdings Ltd.1 | | | 1,846,751 | | | | 1,056,956 | |
TAL Education Group, ADR | | | 286,880 | | | | 10,832,589 | |
| | | | | | | | |
| | | | | | | | 35,746,989 | |
| Hotels, Restaurants & Leisure—6.0% | | | | | |
Alsea SAB de CV | | | 1,403,083 | | | | 4,782,971 | |
| China Lodging Group Ltd., Sponsored ADR | | | 60,775 | | | | 9,231,722 | |
DP Eurasia NV1,3 | | | 1,063,750 | | | | 3,126,009 | |
Jollibee Foods Corp. | | | 425,123 | | | | 2,431,004 | |
Mandarin Oriental International Ltd. | | | 1,208,300 | | | | 2,613,442 | |
Minor International PCL | | | 683,900 | | | | 876,099 | |
| | | | | | | | |
| | | Shares | | | Value | |
| Hotels, Restaurants & Leisure (Continued) | | | | | |
Syngene | | | | | | | | |
International Ltd.3 | | | 619,133 | | | $ | 5,527,910 | |
| | | | | | | | |
| | | | | | | | 28,589,157 | |
| Household Durables—1.1% | | | | | | | | |
| Hangzhou Robam Appliances Co. Ltd., Cl. A | | | 306,900 | | | | 1,942,986 | |
Nien Made Enterprise Co. Ltd. | | | 158,000 | | | | 1,531,935 | |
Symphony Ltd. | | | 75,203 | | | | 2,025,678 | |
| | | | | | | | |
| | | | | | | | 5,500,599 | |
| Internet & Catalog Retail—2.6% | | | | | | | | |
Despegar.com Corp.1 | | | 128,410 | | | | 3,646,844 | |
Vipshop Holdings Ltd., ADR1 | | | 497,510 | | | | 8,651,699 | |
| | | | | | | | |
| | | | | | | | 12,298,543 | |
| Media—1.4% | | | | | | | | |
Smiles Fidelidade SA | | | 250,000 | | | | 6,489,266 | |
| Specialty Retail—6.2% | | | | | | | | |
Ace Hardware Indonesia Tbk PT | | | 56,693,800 | | | | 5,486,267 | |
Beauty Community PCL | | | 7,244,200 | | | | 4,880,414 | |
Bermaz Auto Bhd | | | 2,696,950 | | | | 1,466,139 | |
Clicks Group Ltd. | | | 377,328 | | | | 5,381,428 | |
Foschini Group Ltd. (The) | | | 255,872 | | | | 4,612,670 | |
JUMBO SA | | | 213,519 | | | | 3,870,208 | |
Man Wah Holdings Ltd. | | | 4,376,400 | | | | 4,041,805 | |
| | | | | | | | |
| | | | | | | | 29,738,931 | |
| Textiles, Apparel & Luxury Goods—1.9% | |
Arvind Ltd. | | | 901,359 | | | | 5,693,796 | |
Eclat Textile Co. Ltd. | | | 96,427 | | | | 1,018,095 | |
HOSA International Ltd. | | | 6,382,000 | | | | 2,356,570 | |
| | | | | | | | |
| | | | | | | | 9,068,461 | |
| Consumer Staples—6.7% | | | | | | | | |
| Food & Staples Retailing—3.9% | | | | | |
Jeronimo Martins SGPS SA | | | 189,212 | | | | 3,923,221 | |
Philippine Seven Corp. | | | 335,692 | | | | 755,152 | |
President Chain Store Corp. | | | 242,000 | | | | 2,403,825 | |
|
| 13 OPPENHEIMER EMERGING MARKETS INNOVATORS FUND |
STATEMENT OF INVESTMENTS Unaudited / Continued
| | | | | | | | |
| | | Shares | | | Value | |
| Food & Staples Retailing (Continued) | |
Raia Drogasil SA | | | 238,000 | | | $ | 5,698,395 | |
SPAR Group Ltd. (The) | | | 320,817 | | | | 5,936,163 | |
| | | | | | | | |
| | | | | | | | 18,716,756 | |
| Food Products—0.8% | | | | | | | | |
Kaveri Seed Co. Ltd. | | | 377,653 | | | | 2,882,514 | |
Vietnam Dairy Products JSC | | | 122,910 | | | | 1,049,217 | |
| | | | | | | | |
| | | | | | | | 3,931,731 | |
| Personal Products—2.0% | | | | | | | | |
Cosmax, Inc. | | | 40,494 | | | | 4,753,443 | |
Karex Bhd | | | 6,124,550 | | | | 1,615,246 | |
TCI Co. Ltd. | | | 273,000 | | | | 3,012,207 | |
| | | | | | | | |
| | | | | | | | 9,380,896 | |
| Financials—13.2% | | | | | | | | |
| Commercial Banks—5.1% | | | | | | | | |
BGEO Group plc | | | 131,784 | | | | 6,127,337 | |
Capitec Bank Holdings Ltd. | | | 66,758 | | | | 4,658,899 | |
| Commercial International Bank Egypt SAE | | | 771,902 | | | | 3,374,339 | |
Credicorp Ltd. | | | 4,940 | | | | 1,069,263 | |
| Equity Group Holdings Ltd. | | | 5,411,328 | | | | 2,350,818 | |
| Grupo Financiero Galicia SA, ADR | | | 38,470 | | | | 2,421,302 | |
OTP Bank plc | | | 97,834 | | | | 4,353,548 | |
| | | | | | | | |
| | | | | | | | 24,355,506 | |
| Consumer Finance—2.6% | | | | | | | | |
| Cholamandalam Investment & Finance Co. Ltd. | | | 97,470 | | | | 2,192,661 | |
Gentera SAB de CV | | | 4,005,370 | | | | 3,272,179 | |
KRUK SA | | | 43,025 | | | | 2,659,170 | |
| Shriram Transport Finance Co. Ltd. | | | 209,087 | | | | 4,253,882 | |
| | | | | | | | |
| | | | | | | | 12,377,892 | |
| Diversified Financial Services—1.3% | |
| B3 SA-Brasil Bolsa Balcao | | | 187,000 | | | | 1,475,543 | |
| Chailease Holding Co. Ltd. | | | 420,000 | | | | 1,387,368 | |
Moscow Exchange (The) | | | 1,735,086 | | | | 3,440,413 | |
| | | | | | | | |
| | | | | | | 6,303,324 | |
| | | | | | | | |
| | | Shares | | | Value | |
| Insurance—2.0% | | | | | | | | |
Discovery Ltd. | | | 629,878 | | | $ | 9,520,056 | |
| Real Estate Management & Development—2.2% | |
Emaar Malls PJSC | | | 3,014,166 | | | | 1,736,280 | |
| Iguatemi Empresa de Shopping Centers SA | | | 368,100 | | | | 4,476,969 | |
Oberoi Realty Ltd. | | | 527,745 | | | | 4,146,217 | |
| | | | | | | | |
| | | | | | | | 10,359,466 | |
| Health Care—13.9% | | | | | | | | |
| Biotechnology—9.2% | | | | | | | | |
3SBio, Inc.1,3 | | | 2,593,500 | | | | 4,886,530 | |
Biocon Ltd. | | | 1,466,452 | | | | 14,077,089 | |
| Celltrion Healthcare Co. Ltd.1 | | | 13,148 | | | | 1,437,250 | |
Medy-Tox, Inc. | | | 21,118 | | | | 11,715,062 | |
Seegene, Inc.1 | | | 176,104 | | | | 5,540,716 | |
Taiwan Liposome Co. Ltd.1 | | | 210,000 | | | | 780,588 | |
| Wuxi Biologics Cayman, Inc.1,3 | | | 818,500 | | | | 5,636,483 | |
| | | | | | | | |
| | | | | | | | 44,073,718 | |
| Health Care Providers & Services—3.2% | |
Bumrungrad Hospital PCL | | | 261,100 | | | | 1,771,777 | |
Fleury SA | | | 367,600 | | | | 3,071,541 | |
NMC Health plc | | | 93,200 | | | | 4,386,399 | |
Odontoprev SA | | | 1,061,900 | | | | 5,007,142 | |
| Sinopharm Group Co. Ltd., Cl. H | | | 225,200 | | | | 992,075 | |
| | | | | | | | |
| | | | | | | | 15,228,934 | |
| Life Sciences Tools & Services—0.2% | | | | | |
Samsung Biologics Co. Ltd.1,3 | | | 2,088 | | | | 860,286 | |
| Pharmaceuticals—1.3% | | | | | | | | |
Caregen Co. Ltd. | | | 28,965 | | | | 2,274,065 | |
Celltrion, Inc.1 | | | 12,269 | | | | 3,925,845 | |
| | | | | | | | |
| | | | | | | | 6,199,910 | |
| Industrials—6.7% | | | | | | | | |
| Air Freight & Couriers—0.6% | | | | | | | | |
| Kerry Logistics Network Ltd. | | | 2,265,500 | | | | 3,070,294 | |
| Commercial Services & Supplies—0.4% | | | | | |
| Sunny Friend Environmental Technology Co. Ltd. | | | 267,000 | | | | 2,111,197 | |
|
| 14 OPPENHEIMER EMERGING MARKETS INNOVATORS FUND |
| | | | | | | | |
| | | Shares | | | Value | |
| Electrical Equipment—0.6% | | | | | | | | |
Voltronic Power Technology Corp. | | | 167,700 | | | $ | 2,852,006 | |
| Industrial Conglomerates—0.5% | | | | | | | | |
John Keells Holdings plc | | | 2,306,889 | | | | 2,383,164 | |
| Machinery—2.1% | | | | | | | | |
Airtac International Group | | | 408,093 | | | | 7,288,282 | |
Grupo Rotoplas SAB de CV1 | | | 1,690,213 | | | | 2,576,926 | |
| | | | | | | | |
| | | | | | | | 9,865,208 | |
| Professional Services—0.6% | | | | | | | | |
Sporton International, Inc. | | | 562,876 | | | | 2,987,816 | |
| Road & Rail—1.3% | | | | | | | | |
Localiza Rent a Car SA | | | 743,075 | | | | 5,936,544 | |
| Transportation Infrastructure—0.6% | | | | | | | | |
| International Container Terminal Services, Inc. | | | 1,426,990 | | | | 3,000,785 | |
| Information Technology—17.8% | | | | | | | | |
| Electronic Equipment, Instruments, & Components—4.9% | |
AAC Technologies Holdings, Inc. | | | 459,500 | | | | 9,087,185 | |
KCE Electronics PCL | | | 577,200 | | | | 1,284,789 | |
Largan Precision Co. Ltd. | | | 39,720 | | | | 4,879,888 | |
| Sunny Optical Technology Group Co. Ltd. | | | 496,000 | | | | 8,235,363 | |
| | | | | | | | |
| | | | | | | | 23,487,225 | |
| Internet Software & Services—1.0% | | | | | | | | |
Baozun, Inc., Sponsored ADR1 | | | 139,350 | | | | 4,899,546 | |
| IT Services—4.7% | | | | | | | | |
Mindtree Ltd. | | | 252,138 | | | | 3,116,298 | |
My EG Services Bhd | | | 20,049,650 | | | | 13,634,724 | |
Voltas Ltd. | | | 586,067 | | | | 5,459,325 | |
| | | | | | | | |
| | | | | | | | 22,210,347 | |
| Semiconductors & Semiconductor Equipment—3.2% | |
ASMedia Technology, Inc. | | | 237,000 | | | | 2,584,671 | |
| | | | | | | | |
| | | Shares | | | Value | |
| Semiconductors & Semiconductor Equipment (Continued) | |
eMemory Technology, Inc. | | | 526,000 | | | $ | 6,925,588 | |
Himax Technologies, Inc., ADR | | | 382,639 | | | | 3,126,160 | |
LandMark Optoelectronics Corp. | | | 221,000 | | | | 2,799,807 | |
| | | | | | | | |
| | | | | | | | 15,436,226 | |
| Software—3.3% | | | | | | | | |
Globant SA1 | | | 114,280 | | | | 5,951,703 | |
Linx SA | | | 666,300 | | | | 3,894,907 | |
Logo Yazilim Sanayi Ve Ticaret AS1 | | | 148,075 | | | | 2,131,591 | |
NCSoft Corp. | | | 10,160 | | | | 3,475,607 | |
| | | | | | | | |
| | | | | | | | 15,453,808 | |
| Technology Hardware, Storage & Peripherals—0.7% | |
Catcher Technology Co. Ltd. | | | 283,000 | | | | 3,373,277 | |
| Materials—3.9% | | | | | | | | |
| Chemicals—1.0% | | | | | | | | |
Coromandel International Ltd. | | | 552,263 | | | | 4,696,002 | |
| Construction Materials—2.9% | | | | | | | | |
Dalmia Bharat Ltd. | | | 58,951 | | | | 2,351,509 | |
Indocement Tunggal Prakarsa Tbk PT | | | 1,689,000 | | | | 2,690,664 | |
| Loma Negra Compania Industrial Argentina SA, Sponsored ADR1 | | | 157,590 | | | | 3,430,734 | |
Lucky Cement Ltd. | | | 639,109 | | | | 3,468,843 | |
Shree Cement Ltd. | | | 7,798 | | | | 1,984,558 | |
| | | | | | | | |
| | | | | | | 13,926,308 | |
| | | | | | | | |
Total Common Stocks (Cost $328,286,102) | | | | | | | 442,928,305 | |
| | |
| | | | | | | | |
| Preferred Stock—0.3% | | | | | | | | |
| Banco Davivienda SA, Preference (Cost $1,458,659) | | | 150,600 | | | | 1,560,962 | |
|
| 15 OPPENHEIMER EMERGING MARKETS INNOVATORS FUND |
STATEMENT OF INVESTMENTS Unaudited / Continued
| | | | | | | | |
| | | Shares | | | Value | |
| Investment Company—6.3% | | | | | | | | |
Oppenheimer | | | | | | | | |
Institutional | | | | | | | | |
Government Money | | | | | | | | |
Market Fund, Cl. | | | | | | | | |
E, 1.31%4,5 (Cost | | | | | | | | |
$30,081,656) | | | 30,081,656 | | | $ | 30,081,656 | |
| | | | | | | | |
| Total | | | | | | | | |
Investments, at Value (Cost | | | | | | | | |
| $359,826,417) | | | 99.4% | | | | 474,570,923 | |
| Net Other Assets | | | | | | | | |
| (Liabilities) | | | 0.6 | | | | 3,018,034 | |
| | | | |
| Net Assets | | | 100.0% | | | $ | 477,588,957 | |
| | | | |
Footnotes to Statement of Investments
1. Non-income producing security.
2. Restricted security. The aggregate value of restricted securities at period end was $4,998,818, which represents 1.05% of the Fund’s net assets. See Note 4 of the accompanying Notes. Information concerning restricted securities is as follows:
| | | | | | | | | | | | | | | | |
| Security | | Acquisition
Dates | | | Cost | | | Value | | | Unrealized
Appreciation/
(Depreciation) | |
Fu Shou Yuan International Group Ltd. | | | 9/25/15-2/26/18 | | | $ | 4,128,295 | | | $ | 4,998,818 | | | $ | 870,523 | |
3. Represents securities sold under Rule 144A, which are exempt from registration under the Securities Act of 1933, as amended. These securities have been determined to be liquid under guidelines established by the Board of Trustees. These securities amount to $20,037,218 or 4.20% of the Fund’s net assets at period end.
4. Rate shown is the 7-day yield at period end.
5. Is or was an affiliate, as defined in the Investment Company Act of 1940, as amended, at or during the reporting period, by virtue of the Fund owning at least 5% of the voting securities of the issuer or as a result of the Fund and the issuer having the same investment adviser. Transactions during the reporting period in which the issuer was an affiliate are as follows:
| | | | | | | | | | | | | | | | |
| |
| Shares
August 31, 2017 |
| |
| Gross
Additions |
| | | Gross | | | | Shares | |
| | | | | ReductionsFebruary 28, 2018 | |
Oppenheimer Institutional Government Money Market Fund, Cl. E | | | 22,905,184 | | | | 64,267,595 | | | | 57,091,123 | | | | 30,081,656 | |
| | | | |
| | | Value | | | Income | | | Realized
Gain (Loss) | | | Change in
Unrealized
Gain (Loss) | |
Oppenheimer Institutional Government Money Market Fund, Cl. E | | $ | 30,081,656 | | | $ | 146,961 | | | $ | — | | | $ | — | |
Distribution of investments representing geographic holdings, as a percentage of total investments at value, is as follows:
| | | | |
| Geographic Holdings | | Value | | Percent |
China | | $ 102,081,214 | | 21.5% |
|
| 16 OPPENHEIMER EMERGING MARKETS INNOVATORS FUND |
| | | | | | | | |
| Geographic Holdings (Continued) | | Value | | | | Percent | | |
India | | $ 58,407,438 | | | | 12.3% | | |
Taiwan | | 58,141,905 | | | | 12.3 | | |
Brazil | | 36,050,308 | | | | 7.6 | | |
United States | | 36,033,358 | | | | 7.6 | | |
South Korea | | 33,982,275 | | | | 7.2 | | |
South Africa | | 33,155,891 | | | | 7.0 | | |
Malaysia | | 16,716,109 | | | | 3.5 | | |
Mexico | | 10,632,076 | | | | 2.2 | | |
Argentina | | 9,498,880 | | | | 2.0 | | |
Thailand | | 8,813,079 | | | | 1.9 | | |
Indonesia | | 8,176,930 | | | | 1.7 | | |
Philippines | | 6,186,941 | | | | 1.3 | | |
Georgia | | 6,127,337 | | | | 1.3 | | |
United Arab Emirates | | 6,122,679 | | | | 1.3 | | |
Hong Kong | | 5,683,735 | | | | 1.2 | | |
Hungary | | 4,353,548 | | | | 0.9 | | |
Portugal | | 3,923,221 | | | | 0.8 | | |
Greece | | 3,870,208 | | | | 0.8 | | |
Pakistan | | 3,468,843 | | | | 0.7 | | |
Russia | | 3,440,414 | | | | 0.7 | | |
Egypt | | 3,374,339 | | | | 0.7 | | |
Netherlands | | 3,126,010 | | | | 0.7 | | |
Poland | | 2,659,170 | | | | 0.6 | | |
Sri Lanka | | 2,383,165 | | | | 0.5 | | |
Kenya | | 2,350,818 | | | | 0.5 | | |
Turkey | | 2,131,591 | | | | 0.5 | | |
Colombia | | 1,560,962 | | | | 0.3 | | |
Peru | | 1,069,263 | | | | 0.2 | | |
Vietnam | | 1,049,216 | | | | 0.2 | | |
Total | | $ 474,570,923 | | | | 100.0% | | |
| | | | | | | | |
See accompanying Notes to Financial Statements.
|
| 17 OPPENHEIMER EMERGING MARKETS INNOVATORS FUND |
STATEMENT OF ASSETS AND LIABILITIES February 28, 2018 Unaudited
| | | | |
| Assets | | | | |
| Investments, at value—see accompanying statement of investments: | | | | |
Unaffiliated companies (cost $329,744,761) | | $ | 444,489,267 | |
Affiliated companies (cost $30,081,656) | | | 30,081,656 | |
| | | | |
| | | | 474,570,923 | |
Cash | | | 876,053 | |
Cash—foreign currencies (cost $25,942) | | | 31,449 | |
Receivables and other assets: | | | | |
Shares of beneficial interest sold | | | 2,872,455 | |
Investments sold | | | 614,971 | |
Dividends | | | 204,597 | |
Other | | | 90,496 | |
| | | | |
Total assets | | | 479,260,944 | |
| | | | |
| Liabilities | | | | |
| Payables and other liabilities: | | | | |
Investments purchased | | | 706,049 | |
Foreign capital gains tax | | | 686,328 | |
Shares of beneficial interest redeemed | | | 152,635 | |
Distribution and service plan fees | | | 32,905 | |
Shareholder communications | | | 7,794 | |
Trustees’ compensation | | | 3,597 | |
Other | | | 82,679 | |
| | | | |
Total liabilities | | | 1,671,987 | |
| Net Assets | | $ | 477,588,957 | |
| | | | |
| | | | |
| Composition of Net Assets | | | | |
Par value of shares of beneficial interest | | $ | 39,805 | |
Additional paid-in capital | | | 386,456,324 | |
Accumulated net investment loss | | | (4,195,663) | |
Accumulated net realized loss on investments and foreign currency transactions | | | (18,777,768) | |
Net unrealized appreciation on investments and translation of assets and liabilities denominated in foreign currencies | | | 114,066,259 | |
| | | | |
| Net Assets | | $ | 477,588,957 | |
| | | | |
|
| 18 OPPENHEIMER EMERGING MARKETS INNOVATORS FUND |
| | | | |
| Net Asset Value Per Share | | | | |
Class A Shares: | | | | |
| |
| Net asset value and redemption price per share (based on net assets of $127,860,266 and 10,682,498 shares of beneficial interest outstanding) | | $ | 11.97 | |
| Maximum offering price per share (net asset value plus sales charge of 5.75% of offering price) | | $ | 12.70 | |
| |
| Class C Shares: | | | | |
| |
| Net asset value, redemption price (excludes applicable contingent deferred sales charge) and offering price per share (based on net assets of $42,990,357 and 3,683,609 shares of beneficial interest outstanding) | | $ | 11.67 | |
| |
| Class I Shares: | | | | |
| |
| Net asset value, redemption price and offering price per share (based on net assets of | | | | |
| $45,426,425 and 3,747,454 shares of beneficial interest outstanding) | | $ | 12.12 | |
| |
| Class R Shares: | | | | |
| |
| Net asset value, redemption price (excludes applicable contingent deferred sales charge) and offering price per share (based on net assets of $6,410,134 and 539,686 shares of beneficial interest outstanding) | | $ | 11.88 | |
| |
| Class Y Shares: | | | | |
| |
| Net asset value, redemption price and offering price per share (based on net assets of | | | | |
| $254,901,775 and 21,151,917 shares of beneficial interest outstanding) | | $ | 12.05 | |
See accompanying Notes to Financial Statements.
|
| 19 OPPENHEIMER EMERGING MARKETS INNOVATORS FUND |
STATEMENT
OF OPERATIONS For the Six Months Ended February 28, 2018 Unaudited
| | | | |
| Investment Income | | | | |
Dividends: | | | | |
Unaffiliated companies (net of foreign withholding taxes of $175,075) | | $ | 1,592,401 | |
Affiliated companies | | | 146,961 | |
Interest | | | 251 | |
| | | | |
Total investment income | | | 1,739,613 | |
| | | | |
| Expenses | | | | |
Management fees | | | 2,257,284 | |
Distribution and service plan fees: | | | | |
Class A | | | 124,155 | |
Class C | | | 178,406 | |
Class R | | | 12,180 | |
Transfer and shareholder servicing agent fees: | | | | |
Class A | | | 106,874 | |
Class C | | | 37,665 | |
Class I | | | 4,741 | |
Class R | | | 5,177 | |
Class Y | | | 230,559 | |
Shareholder communications: | | | | |
Class A | | | 2,976 | |
Class C | | | 1,168 | |
Class I | | | 235 | |
Class R | | | 268 | |
Class Y | | | 3,932 | |
Custodian fees and expenses | | | 99,581 | |
Borrowing fees | | | 6,036 | |
Trustees’ compensation | | | 2,538 | |
Other | | | 95,987 | |
| | | | |
Total expenses | | | 3,169,762 | |
Less reduction to custodian expenses | | | (216) | |
Less waivers and reimbursements of expenses | | | (36,436) | |
| | | | |
Net expenses | | | 3,133,110 | |
| | | | |
| Net Investment Loss | | | (1,393,497) | |
| Realized and Unrealized Gain (Loss) | | | | |
Net realized gain (loss) on: | | | | |
Investment transactions unaffiliated companies | | | 14,517,318 | |
Foreign currency transactions | | | (136,193) | |
| | | | |
Net realized gain | | | 14,381,125 | |
Net change in unrealized appreciation/depreciation on: | | | | |
Investment transactions unaffiliated companies | | | 32,635,048 | |
Translation of assets and liabilities denominated in foreign currencies | | | 3,897 | |
| | | | |
Net change in unrealized appreciation/depreciation | | | 32,638,945 | |
| | | | |
| Net Increase in Net Assets Resulting from Operations | | $ | 45,626,573 | |
| | | | |
See accompanying Notes to Financial Statements.
|
| 20 OPPENHEIMER EMERGING MARKETS INNOVATORS FUND |
STATEMENTS OF CHANGES IN NET ASSETS
| | | | | | |
| | | Six Months Ended
February 28, 2018
(Unaudited) | | | Year Ended
August 31, 2017 |
|
| Operations | | | | | | |
| Net investment loss | | $ | (1,393,497 | ) | | $ (611,545) |
|
| Net realized gain (loss) | | | 14,381,125 | | | (5,062,618) |
|
| Net change in unrealized appreciation/depreciation | | | 32,638,945 | | | 54,232,478 |
| | | |
| Net increase in net assets resulting from operations | | | 45,626,573 | | | 48,558,315 |
| | | | | | |
|
| Dividends and/or Distributions to Shareholders | | | | | | |
| Dividends from net investment income: | | | | | | |
| Class A | | | (197,900 | ) | | — |
| Class C | | | — | | | — |
| Class I | | | (158,922 | ) | | — |
| Class R | | | (3,421 | ) | | — |
| Class Y | | | (823,022 | ) | | — |
| | | |
| | | (1,183,265 | ) | | — |
| | | | | | |
|
| Beneficial Interest Transactions | | | | | | |
| Net increase in net assets resulting from beneficial interest transactions: | | | | | | |
| Class A | | | 32,003,980 | | | 7,257,912 |
| Class C | | | 8,781,609 | | | 6,089,056 |
| Class I | | | 18,261,006 | | | 13,671,254 |
| Class R | | | 2,228,577 | | | 1,392,693 |
| Class Y | | | 36,632,116 | | | 2,316,762 |
| | | |
| | | 97,907,288 | | | 30,727,677 |
| | | | | | |
|
| Net Assets | | | | | | |
| Total increase | | | 142,350,596 | | | 79,285,992 |
|
| Beginning of period | | | 335,238,361 | | | 255,952,369 |
| | | |
| End of period (including accumulated net investment loss of $4,195,663 and $1,618,901, respectively) | | $ | 477,588,957 | | | $ 335,238,361 |
| | | |
See accompanying Notes to Financial Statements.
|
| 21 OPPENHEIMER EMERGING MARKETS INNOVATORS FUND |
FINANCIAL HIGHLIGHTS
| | | | | | | | | | | | | | | | | | |
| Class A | | Six Months
Ended
February 28,
2018
(Unaudited) | | | Year Ended
August 31,
2017 | | | Year Ended
August 31,
2016 | | | Year Ended
August 31,
2015 | | | Period
Ended
August 29,
20141,2 |
|
| Per Share Operating Data | | | | | | | | | | | | | | | | | | |
| Net asset value, beginning of period | | | $10.67 | | | | $8.87 | | | | $8.22 | | | | $9.93 | | | $10.00 |
|
| Income (loss) from investment operations: | | | | | | | | | | | | | | | | | | |
| Net investment income (loss)3 | | | (0.05) | | | | (0.03) | | | | (0.03) | | | | (0.02) | | | 0.02 |
| Net realized and unrealized gain (loss) | | | 1.37 | | | | 1.83 | | | | 0.68 | | | | (1.67) | | | (0.09) |
| | | |
| Total from investment operations | | | 1.32 | | | | 1.80 | | | | 0.65 | | | | (1.69) | | | (0.07) |
|
| Dividends and/or distributions to shareholders: | | | | | | | | | | | | | | | | | | |
| Dividends from net investment income | | | (0.02) | | | | 0.00 | | | | 0.00 | | | | (0.01) | | | 0.00 |
| Distributions from net realized gain | | | 0.00 | | | | 0.00 | | | | 0.00 | | | | (0.01) | | | 0.00 |
| | | |
| Total dividends and/or distributions to shareholders | | | (0.02) | | | | 0.00 | | | | 0.00 | | | | (0.02) | | | 0.00 |
|
| Net asset value, end of period | | | $11.97 | | | | $10.67 | | | | $8.87 | | | | $8.22 | | | $9.93 |
| | | |
| | | | | | | | | | | | | | | | | | |
|
| Total Return, at Net Asset Value4 | | | 12.41% | | | | 20.29% | | | | 7.91% | | | | (17.10)% | | | (0.70)% |
| | | | | | | | | | | | | | | | | | |
|
| Ratios/Supplemental Data | | | | | | | | | | | | | | | | | | |
| Net assets, end of period (in thousands) | | | $127,860 | | | | $84,324 | | | | $64,713 | | | | $41,993 | | | $60,956 |
|
| Average net assets (in thousands) | | | $102,904 | | | | $65,566 | | | | $55,666 | | | | $61,498 | | | $56,084 |
|
| Ratios to average net assets:5 | | | | | | | | | | | | | | | | | | |
| Net investment income (loss) | | | (0.81)% | | | | (0.35)% | | | | (0.31)% | | | | (0.21)% | | | 1.37% |
| Expenses excluding specific expenses listed below | | | 1.71% | | | | 1.77% | | | | 1.75% | | | | 1.71% | | | 1.75% |
| Interest and fees from borrowings | | | 0.00%6 | | | | 0.00%6 | | | | 0.00%6 | | | | 0.00%6 | | | 0.00% |
| | | |
| Total expenses | | | 1.71%7 | | | | 1.77%7 | | | | 1.75%7 | | | | 1.71%7 | | | 1.75% |
| Expenses after payments, waivers and/or reimbursements and reduction to custodian expenses | | | 1.70% | | | | 1.70% | | | | 1.71% | | | | 1.70% | | | 1.65% |
|
| Portfolio turnover rate | | | 14% | | | | 23% | | | | 26% | | | | 34% | | | 3% |
1. For the period from June 30, 2014 (commencement of operations) to August 29, 2014.
2. Represents the last business day of the Fund’s reporting period.
3. Per share amounts calculated based on the average shares outstanding during the period.
4. Assumes an initial investment on the business day before the first day of the fiscal period, with all dividends and distributions reinvested in additional shares on the reinvestment date, and redemption at the net asset value calculated on the last business day of the fiscal period. Sales charges are not reflected in the total returns. Total returns are not annualized for periods less than one full year. Returns do not reflect the deduction of taxes that a shareholder would pay on fund distributions or the redemption of fund shares.
5. Annualized for periods less than one full year.
6. Less than 0.005%.
7. Total expenses including indirect expenses from affiliated fund fees and expenses were as follows:
| | | | | | |
| | Six Months Ended February 28, 2018 | | | 1.72% | |
| | Year Ended August 31, 2017 | | | 1.78% | |
| | Year Ended August 31, 2016 | | | 1.76% | |
| | Year Ended August 31, 2015 | | | 1.72% | |
See accompanying Notes to Financial Statements.
|
| 22 OPPENHEIMER EMERGING MARKETS INNOVATORS FUND |
| | | | | | | | | | | | | | | | | | |
| Class C | | Six Months
Ended
February 28,
2018
(Unaudited) | | | Year Ended
August 31,
2017 | | | Year Ended
August 31,
2016 | | | Year Ended
August 31,
2015 | | | Period
Ended
August 29,
20141,2 |
|
| Per Share Operating Data | | | | | | | | | | | | | | | | | | |
| Net asset value, beginning of period | | | $10.42 | | | | $8.74 | | | | $8.16 | | | | $9.92 | | | $10.00 |
|
| Income (loss) from investment operations: | | | | | | | | | | | | | | | | | | |
| Net investment loss3 | | | (0.09) | | | | (0.10) | | | | (0.09) | | | | (0.08) | | | (0.00)4 |
| Net realized and unrealized gain (loss) | | | 1.34 | | | | 1.78 | | | | 0.67 | | | | (1.67) | | | (0.08) |
| | | |
| Total from investment operations | | | 1.25 | | | | 1.68 | | | | 0.58 | | | | (1.75) | | | (0.08) |
|
| Dividends and/or distributions to shareholders: | | | | | | | | | | | | | | | | | | |
| Dividends from net investment income | | | 0.00 | | | | 0.00 | | | | 0.00 | | | | 0.00 | | | 0.00 |
| Distributions from net realized gain | | | 0.00 | | | | 0.00 | | | | 0.00 | | | | (0.01) | | | 0.00 |
| | | |
| Total dividends and/or distributions to shareholders | | | 0.00 | | | | 0.00 | | | | 0.00 | | | | (0.01) | | | 0.00 |
|
| Net asset value, end of period | | | $11.67 | | | | $10.42 | | | | $8.74 | | | | $8.16 | | | $9.92 |
| | | |
| | | | | | | | | | | | | | | | | | |
|
| Total Return, at Net Asset Value5 | | | 12.00% | | | | 19.22% | | | | 7.24% | | | | (17.80)% | | | (0.80)% |
| | | | | | | | | | | | | | | | | | |
|
| Ratios/Supplemental Data | | | | | | | | | | | | | | | | | | |
| Net assets, end of period (in thousands) | | | $42,990 | | | | $30,168 | | | | $19,616 | | | | $10,795 | | | $2,987 |
|
| Average net assets (in thousands) | | | $36,189 | | | | $22,635 | | | | $15,335 | | | | $7,615 | | | $1,591 |
|
| Ratios to average net assets:6 | | | | | | | | | | | | | | | | | | |
| Net investment loss | | | (1.56)% | | | | (1.11)% | | | | (1.10)% | | | | (0.88)% | | | (0.31)% |
| Expenses excluding specific expenses listed below | | | 2.46% | | | | 2.52% | | | | 2.50% | | | | 2.69% | | | 2.56% |
| Interest and fees from borrowings | | | 0.00%7 | | | | 0.00%7 | | | | 0.00%7 | | | | 0.00%7 | | | 0.00% |
| | | |
| Total expenses | | | 2.46%8 | | | | 2.52%8 | | | | 2.50%8 | | | | 2.69%8 | | | 2.56% |
| Expenses after payments, waivers and/or reimbursements and reduction to custodian expenses | | | 2.44% | | | | 2.50% | | | | 2.49% | | | | 2.50% | | | 2.42% |
|
| Portfolio turnover rate | | | 14% | | | | 23% | | | | 26% | | | | 34% | | | 3% |
1. For the period from June 30, 2014 (commencement of operations) to August 29, 2014.
2. Represents the last business day of the Fund’s reporting period.
3. Per share amounts calculated based on the average shares outstanding during the period.
4. Less than $0.005 per share.
5. Assumes an initial investment on the business day before the first day of the fiscal period, with all dividends and distributions reinvested in additional shares on the reinvestment date, and redemption at the net asset value calculated on the last business day of the fiscal period. Sales charges are not reflected in the total returns. Total returns are not annualized for periods less than one full year. Returns do not reflect the deduction of taxes that a shareholder would pay on fund distributions or the redemption of fund shares.
6. Annualized for periods less than one full year.
7. Less than 0.005%.
8. Total expenses including indirect expenses from affiliated fund fees and expenses were as follows:
| | | | | | |
| | Six Months Ended February 28, 2018 | | | 2.47% | |
| | Year Ended August 31, 2017 | | | 2.53% | |
| | Year Ended August 31, 2016 | | | 2.51% | |
| | Year Ended August 31, 2015 | | | 2.70% | |
See accompanying Notes to Financial Statements.
|
| 23 OPPENHEIMER EMERGING MARKETS INNOVATORS FUND |
FINANCIAL HIGHLIGHTS Continued
| | | | | | | | | | | | | | | | | | | | |
| Class I | | Six Months
Ended
February 28,
2018
(Unaudited) | | | Year Ended
August 31,
2017 | | | Year Ended
August 31,
2016 | | | Year Ended
August 31,
2015 | | | Period
Ended
August 29,
20141,2 | |
Per Share Operating Data | | | | | | | | | | | | | | | | | | | | |
| Net asset value, beginning of period | | | $10.82 | | | | $8.96 | | | | $8.26 | | | | $9.94 | | | | $10.00 | |
| Income (loss) from investment operations: | | | | | | | | | | | | | | | | | | | | |
| Net investment income (loss)3 | | | (0.02) | | | | 0.03 | | | | 0.06 | | | | 0.05 | | | | 0.03 | |
Net realized and unrealized gain (loss) | | | 1.38 | | | | 1.83 | | | | 0.64 | | | | (1.70) | | | | (0.09) | |
| | | | |
| Total from investment operations | | | 1.36 | | | | 1.86 | | | | 0.70 | | | | (1.65) | | | | (0.06) | |
| Dividends and/or distributions to shareholders: | | | | | | | | | | | | | | | | | | | | |
| Dividends from net investment income | | | (0.06) | | | | 0.00 | | | | 0.00 | | | | (0.02) | | | | 0.00 | |
Distributions from net realized gain | | | 0.00 | | | | 0.00 | | | | 0.00 | | | | (0.01) | | | | 0.00 | |
| | | | |
| Total dividends and/or distributions to shareholders | | | (0.06) | | | | 0.00 | | | | 0.00 | | | | (0.03) | | | | 0.00 | |
| Net asset value, end of period | | | $12.12 | | | | $10.82 | | | | $8.96 | | | | $8.26 | | | | $9.94 | |
| | | | |
| | | | | | | | | | | | | | | | | | | | |
| Total Return, at Net Asset Value4 | | | 12.62% | | | | 20.89% | | | | 8.35% | | | | (16.68)% | | | | (0.60)% | |
| | | | | | | | | | | | | | | | | | | | |
| Ratios/Supplemental Data | | | | | | | | | | | | | | | | | | | | |
| Net assets, end of period (in thousands) | | | $45,427 | | | | $23,879 | | | | $7,332 | | | | $102 | | | | $10 | |
| Average net assets (in thousands) | | | $32,079 | | | | $11,916 | | | | $2,128 | | | | $64 | | | | $11 | |
| Ratios to average net assets:5 | | | | | | | | | | | | | | | | | | | | |
| Net investment income (loss) | | | (0.38)% | | | | 0.30% | | | | 0.65% | | | | 0.54% | | | | 1.58% | |
| Expenses excluding specific expenses listed below | | | 1.28% | | | | 1.32% | | | | 1.33% | | | | 1.60% | | | | 1.41% | |
Interest and fees from borrowings | | | 0.00%6 | | | | 0.00%6 | | | | 0.00%6 | | | | 0.00%6 | | | | 0.00% | |
| | | | |
| Total expenses | | | 1.28%7 | | | | 1.32%7 | | | | 1.33%7 | | | | 1.60%7 | | | | 1.41% | |
| Expenses after payments, waivers and/or reimbursements and reduction to custodian expenses | | | 1.25% | | | | 1.25% | | | | 1.24% | | | | 1.25% | | | | 1.17% | |
Portfolio turnover rate | | | 14% | | | | 23% | | | | 26% | | | | 34% | | | | 3% | |
1. For the period from June 30, 2014 (commencement of operations) to August 29, 2014.
2. Represents the last business day of the Fund’s reporting period.
3. Per share amounts calculated based on the average shares outstanding during the period.
4. Assumes an initial investment on the business day before the first day of the fiscal period, with all dividends and distributions reinvested in additional shares on the reinvestment date, and redemption at the net asset value calculated on the last business day of the fiscal period. Sales charges are not reflected in the total returns. Total returns are not annualized for periods less than one full year. Returns do not reflect the deduction of taxes that a shareholder would pay on fund distributions or the redemption of fund shares.
5. Annualized for periods less than one full year.
6. Less than 0.005%.
7. Total expenses including indirect expenses from affiliated fund fees and expenses were as follows:
| | | | |
| | Six Months Ended February 28, 2018 | | 1.29% |
| | Year Ended August 31, 2017 | | 1.33% |
| | Year Ended August 31, 2016 | | 1.34% |
| | Year Ended August 31, 2015 | | 1.61% |
See accompanying Notes to Financial Statements.
|
| 24 OPPENHEIMER EMERGING MARKETS INNOVATORS FUND |
| | | | | | | | | | | | | | | | | | | | |
| Class R | | Six Months
Ended
February 28,
2018
(Unaudited) | | | Year Ended
August 31,
2017 | | | Year Ended
August 31,
2016 | | | Year Ended
August 31,
2015 | | | Period
Ended
August 29,
20141,2 | |
| |
| Per Share Operating Data | | | | | | | | | | | | | | | | | | | | |
| Net asset value, beginning of period | | | $10.59 | | | | $8.83 | | | | $8.20 | | | | $9.93 | | | | $10.00 | |
| |
| Income (loss) from investment operations: | | | | | | | | | | | | | | | | | | | | |
| Net investment income (loss)3 | | | (0.06) | | | | (0.05) | | | | (0.05) | | | | (0.03) | | | | 0.004 | |
| Net realized and unrealized gain (loss) | | | 1.36 | | | | 1.81 | | | | 0.68 | | | | (1.69) | | | | (0.07) | |
| | | | |
| Total from investment operations | | | 1.30 | | | | 1.76 | | | | 0.63 | | | | (1.72) | | | | (0.07) | |
| |
| Dividends and/or distributions to shareholders: | | | | | | | | | | | | | | | | | | | | |
| Dividends from net investment income | | | (0.01) | | | | 0.00 | | | | 0.00 | | | | 0.00 | | | | 0.00 | |
| Distributions from net realized gain | | | 0.00 | | | | 0.00 | | | | 0.00 | | | | (0.01) | | | | 0.00 | |
| | | | |
| Total dividends and/or distributions to shareholders | | | (0.01) | | | | 0.00 | | | | 0.00 | | | | (0.01) | | | | 0.00 | |
| |
| Net asset value, end of period | | | $11.88 | | | | $10.59 | | | | $8.83 | | | | $8.20 | | | | $9.93 | |
| | | | |
| | | | | | | | | | | | | | | | | | | | |
| |
| Total Return, at Net Asset Value5 | | | 12.26% | | | | 19.93% | | | | 7.68% | | | | (17.38)% | | | | (0.70)% | |
| | | | | | | | | | | | | | | | | | | | |
| |
| Ratios/Supplemental Data | | | | | | | | | | | | | | | | | | | | |
| Net assets, end of period (in thousands) | | | $6,410 | | | | $3,606 | | | | $1,692 | | | | $966 | | | | $127 | |
| |
| Average net assets (in thousands) | | | $4,991 | | | | $2,336 | | | | $1,253 | | | | $555 | | | | $47 | |
| |
| Ratios to average net assets:6 | | | | | | | | | | | | | | | | | | | | |
| Net investment income (loss) | | | (1.08)% | | | | (0.55)% | | | | (0.60)% | | | | (0.36)% | | | | 0.07% | |
| Expenses excluding specific expenses listed below | | | 1.96% | | | | 2.03% | | | | 2.02% | | | | 2.24% | | | | 2.05% | |
| Interest and fees from borrowings | | | 0.00%7 | | | | 0.00%7 | | | | 0.00%7 | | | | 0.00%7 | | | | 0.00% | |
| | | | |
| Total expenses | | | 1.96%8 | | | | 2.03%8 | | | | 2.02%8 | | | | 2.24%8 | | | | 2.05% | |
| Expenses after payments, waivers and/or reimbursements and reduction to custodian expenses | | | 1.95% | | | | 2.00% | | | | 2.00% | | | | 2.00% | | | | 1.93% | |
| |
| Portfolio turnover rate | | | 14% | | | | 23% | | | | 26% | | | | 34% | | | | 3% | |
1. For the period from June 30, 2014 (commencement of operations) to August 29, 2014.
2. Represents the last business day of the Fund’s reporting period.
3. Per share amounts calculated based on the average shares outstanding during the period.
4. Less than $0.005 per share.
5. Assumes an initial investment on the business day before the first day of the fiscal period, with all dividends and distributions reinvested in additional shares on the reinvestment date, and redemption at the net asset value calculated on the last business day of the fiscal period. Sales charges are not reflected in the total returns. Total returns are not annualized for periods less than one full year. Returns do not reflect the deduction of taxes that a shareholder would pay on fund distributions or the redemption of fund shares.
6. Annualized for periods less than one full year.
7. Less than 0.005%.
8. Total expenses including indirect expenses from affiliated fund fees and expenses were as follows:
| | | | |
| | Six Months Ended February 28, 2018 | | 1.97% |
| | Year Ended August 31, 2017 | | 2.04% |
| | Year Ended August 31, 2016 | | 2.03% |
| | Year Ended August 31, 2015 | | 2.25% |
See accompanying Notes to Financial Statements.
|
| 25 OPPENHEIMER EMERGING MARKETS INNOVATORS FUND |
FINANCIAL HIGHLIGHTS Continued
| | | | | | | | | | | | | | | | | | | | |
| Class Y | | Six Months
Ended
February 28,
2018
(Unaudited) | | | Year Ended
August 31,
2017 | | | Year Ended
August 31,
2016 | | | Year Ended
August 31,
2015 | | | Period
Ended
August 29,
20141,2 | |
| |
| Per Share Operating Data | | | | | | | | | | | | | | | | | | | | |
| Net asset value, beginning of period | | | $10.75 | | | | $8.92 | | | | $8.24 | | | | $9.94 | | | | $10.00 | |
| |
| Income (loss) from investment operations: | | | | | | | | | | | | | | | | | | | | |
| Net investment income (loss)3 | | | (0.03) | | | | (0.01) | | | | (0.00)4 | | | | 0.01 | | | | 0.01 | |
| Net realized and unrealized gain (loss) | | | 1.37 | | | | 1.84 | | | | 0.68 | | | | (1.68) | | | | (0.07) | |
| | | | |
| Total from investment operations | | | 1.34 | | | | 1.83 | | | | 0.68 | | | | (1.67) | | | | (0.06) | |
| |
| Dividends and/or distributions to shareholders: | | | | | | | | | | | | | | | | | | | | |
| Dividends from net investment income | | | (0.04) | | | | 0.00 | | | | 0.00 | | | | (0.02) | | | | 0.00 | |
| Distributions from net realized gain | | | 0.00 | | | | 0.00 | | | | 0.00 | | | | (0.01) | | | | 0.00 | |
| | | | |
| Total dividends and/or distributions to shareholders | | | (0.04) | | | | 0.00 | | | | 0.00 | | | | (0.03) | | | | 0.00 | |
| |
| Net asset value, end of period | | | $12.05 | | | | $10.75 | | | | $8.92 | | | | $8.24 | | | | $9.94 | |
| | | | |
| | | | | | | | | | | | | | | | | | | | |
| |
| Total Return, at Net Asset Value5 | | | 12.52% | | | | 20.52% | | | | 8.25% | | | | (16.92)% | | | | (0.60)% | |
| | | | | | | | | | | | | | | | | | | | |
| |
| Ratios/Supplemental Data | | | | | | | | | | | | | | | | | | | | |
| Net assets, end of period (in thousands) | | | $254,902 | | | | $193,261 | | | | $162,599 | | | | $68,697 | | | | $12,062 | |
| |
| Average net assets (in thousands) | | | $221,151 | | | | $153,808 | | | | $128,076 | | | | $38,619 | | | | $6,734 | |
| |
| Ratios to average net assets:6 | | | | | | | | | | | | | | | | | | | | |
| Net investment income (loss) | | | (0.56)% | | | | (0.10)% | | | | (0.03)% | | | | 0.14% | | | | 0.38% | |
| Expenses excluding specific expenses listed below | | | 1.46% | | | | 1.52% | | | | 1.50% | | | | 1.72% | | | | 1.59% | |
| Interest and fees from borrowings | | | 0.00%7 | | | | 0.00%7 | | | | 0.00%7 | | | | 0.00%7 | | | | 0.00% | |
| | | | |
| Total expenses | | | 1.46%8 | | | | 1.52%8 | | | | 1.50%8 | | | | 1.72%8 | | | | 1.59% | |
| Expenses after payments, waivers and/or reimbursements and reduction to custodian expenses | | | 1.45% | | | | 1.45% | | | | 1.45% | | | | 1.45% | | | | 1.40% | |
| |
| Portfolio turnover rate | | | 14% | | | | 23% | | | | 26% | | | | 34% | | | | 3% | |
1. For the period from June 30, 2014 (commencement of operations) to August 29, 2014.
2. Represents the last business day of the Fund’s reporting period.
3. Per share amounts calculated based on the average shares outstanding during the period.
4. Less than $0.005 per share.
5. Assumes an initial investment on the business day before the first day of the fiscal period, with all dividends and distributions reinvested in additional shares on the reinvestment date, and redemption at the net asset value calculated on the last business day of the fiscal period. Sales charges are not reflected in the total returns. Total returns are not annualized for periods less than one full year. Returns do not reflect the deduction of taxes that a shareholder would pay on fund distributions or the redemption of fund shares.
6. Annualized for periods less than one full year.
7. Less than 0.005%.
8. Total expenses including indirect expenses from affiliated fund fees and expenses were as follows:
| | | | |
| | Six Months Ended February 28, 2018 | | 1.47% |
| | Year Ended August 31, 2017 | | 1.53% |
| | Year Ended August 31, 2016 | | 1.51% |
| | Year Ended August 31, 2015 | | 1.73% |
See accompanying Notes to Financial Statements.
|
| 26 OPPENHEIMER EMERGING MARKETS INNOVATORS FUND |
NOTES TO FINANCIAL STATEMENTS February 28, 2018 Unaudited
1. Organization
Oppenheimer Emerging Markets Innovators Fund (the “Fund”) is a diversified open-end management investment company registered under the Investment Company Act of 1940 (“1940 Act”), as amended. The Fund’s investment objective is to seek capital appreciation. The Fund’s investment adviser is OFI Global Asset Management, Inc. (“OFI Global” or the “Manager”), a wholly-owned subsidiary of OppenheimerFunds, Inc. (“OFI” or the “Sub-Adviser”). The Manager has entered into a sub-advisory agreement with OFI.
The Fund offers Class A, Class C, Class I, Class R and Class Y shares. Class A shares are sold at their offering price, which is normally net asset value plus a front-end sales charge. Class C and Class R shares are sold without a front-end sales charge but may be subject to a contingent deferred sales charge (“CDSC”). Class R shares are sold only through retirement plans. Retirement plans that offer Class R shares may impose charges on those accounts. Class I and Class Y shares are sold to certain institutional investors or intermediaries without either a front-end sales charge or a CDSC, however, the intermediaries may impose charges on their accountholders who beneficially own Class I and Class Y shares. All classes of shares have identical rights and voting privileges with respect to the Fund in general and exclusive voting rights on matters that affect that class alone. Earnings, net assets and net asset value per share may differ due to each class having its own expenses, such as transfer and shareholder servicing agent fees and shareholder communications, directly attributable to that class. Class A, C and R shares have separate distribution and/or service plans under which they pay fees. Class I and Class Y shares do not pay such fees.
The following is a summary of significant accounting policies followed in the Fund’s preparation of financial statements in accordance with accounting principles generally accepted in the United States (“U.S. GAAP”).
2. Significant Accounting Policies
Security Valuation. All investments in securities are recorded at their estimated fair value, as described in Note 3.
Foreign Currency Translation. The books and records of the Fund are maintained in U.S. dollars. Any foreign currency amounts are translated into U.S. dollars on the following basis:
(1) Value of investment securities, other assets and liabilities — at the exchange rates prevailing at Market Close as described in Note 3.
(2) Purchases and sales of investment securities, income and expenses — at the rates of exchange prevailing on the respective dates of such transactions.
Although the net assets and the values are presented at the foreign exchange rates at Market Close, the Fund does not isolate the portion of the results of operations resulting from changes in foreign exchange rates on investments from the fluctuations arising from changes in prices of securities held. Such fluctuations are included with the net realized and unrealized gains or losses from investments shown in the Statement of Operations.
For securities, which are subject to foreign withholding tax upon disposition, realized gains or losses on such securities are recorded net of foreign withholding tax.
|
| 27 OPPENHEIMER EMERGING MARKETS INNOVATORS FUND |
NOTES TO FINANCIAL STATEMENTS Unaudited / Continued
2. Significant Accounting Policies (Continued)
Reported net realized foreign exchange gains or losses arise from sales of foreign currencies, currency gains or losses realized between the trade and settlement dates on securities transactions, the difference between the amounts of dividends, interest, and foreign withholding tax reclaims recorded on the Fund’s books, and the U.S. dollar equivalent of the amounts actually received or paid. Net unrealized foreign exchange gains and losses arise from changes in the value of assets and liabilities other than investments in securities, resulting from changes in the exchange rate.
Allocation of Income, Expenses, Gains and Losses. Income, expenses (other than those attributable to a specific class), gains and losses are allocated on a daily basis to each class of shares based upon the relative proportion of net assets represented by such class. Operating expenses directly attributable to a specific class are charged against the operations of that class.
Dividends and Distributions to Shareholders. Dividends and distributions to shareholders, which are determined in accordance with income tax regulations and may differ from U.S. GAAP, are recorded on the ex-dividend date. Income and capital gain distributions, if any, are declared and paid annually or at other times as determined necessary by the Manager.
The tax character of distributions is determined as of the Fund’s fiscal year end. Therefore, a portion of the Fund’s distributions made to shareholders prior to the Fund’s fiscal year end may ultimately be categorized as a tax return of capital.
Investment Income. Dividend income is recorded on the ex-dividend date or upon ex-dividend notification in the case of certain foreign dividends where the ex-dividend date may have passed. Non-cash dividends included in dividend income, if any, are recorded at the fair value of the securities received. Withholding taxes on foreign dividends, if any, and capital gains taxes on foreign investments, if any, have been provided for in accordance with the Fund’s understanding of the applicable tax rules and regulations. Interest income, if any, is recognized on an accrual basis. Discount and premium, which are included in interest income on the Statement of Operations, are amortized or accreted daily.
Custodian Fees. “Custodian fees and expenses” in the Statement of Operations may include interest expense incurred by the Fund on any cash overdrafts of its custodian account during the period. Such cash overdrafts may result from the effects of failed trades in portfolio securities and from cash outflows resulting from unanticipated shareholder redemption activity. The Fund pays interest to its custodian on such cash overdrafts, to the extent they are not offset by positive cash balances maintained by the Fund, at a rate equal to the Federal Funds Rate plus 2.00%. The “Reduction to custodian expenses” line item, if applicable, represents earnings on cash balances maintained by the Fund during the period. Such interest expense and other custodian fees may be paid with these
|
| 28 OPPENHEIMER EMERGING MARKETS INNOVATORS FUND |
2. Significant Accounting Policies (Continued)
Security Transactions. Security transactions are recorded on the trade date. Realized gains and losses on securities sold are determined on the basis of identified cost.
Indemnifications. The Fund’s organizational documents provide current and former Trustees and officers with a limited indemnification against liabilities arising in connection with the performance of their duties to the Fund. In the normal course of business, the Fund may also enter into contracts that provide general indemnifications. The Fund’s maximum exposure under these arrangements is unknown as this would be dependent on future claims that may be made against the Fund. The risk of material loss from such claims is considered remote.
Federal Taxes. The Fund intends to comply with provisions of the Internal Revenue Code applicable to regulated investment companies and to distribute substantially all of its investment company taxable income to shareholders. Therefore, no federal income or excise tax provision is required. The Fund files income tax returns in U.S. federal and applicable state jurisdictions. The statute of limitations on the Fund’s tax return filings generally remains open for the three preceding fiscal reporting period ends. The Fund has analyzed its tax positions for the fiscal year ended August 31, 2017, including open tax years, and does not believe there are any uncertain tax positions requiring recognition in the Fund’s financial statements.
During the fiscal year ended August 31, 2017, the Fund did not utilize any capital loss carryforwards to offset capital gains realized in that fiscal year. Details of the fiscal year ended August 31, 2017 capital loss carryforwards are included in the table below. Capital loss carryforwards with no expiration, if any, must be utilized prior to those with expiration dates. Capital losses with no expiration will be carried forward to future years if not offset by gains.
| | |
| Expiring | | |
| No expiration | | $ 33,090,275 |
At period end, it is estimated that the capital loss carryforwards would be $18,709,150, which will not expire. The estimated capital loss carryforward represents the carryforward as of the end of the last fiscal year, increased or decreased by capital losses or gains realized in the first six months of the current fiscal year. During the reporting period, it is estimated that the Fund will utilize $14,381,125 of capital loss carryforward to offset realized capital gains.
Net investment income (loss) and net realized gain (loss) may differ for financial statement and tax purposes. The character of dividends and distributions made during the fiscal year from net investment income or net realized gains are determined in accordance with federal income tax requirements, which may differ from the character of net investment income or net realized gains presented in those financial statements in accordance with U.S. GAAP. Also, due to timing of dividends and distributions, the fiscal year in which amounts are distributed may differ from the fiscal year in which the income or net realized gain was recorded by the Fund.
The aggregate cost of securities and other investments and the composition of unrealized appreciation and depreciation of securities and other investments for federal income tax purposes at period end are noted in the following table. The primary difference between
|
| 29 OPPENHEIMER EMERGING MARKETS INNOVATORS FUND |
NOTES TO FINANCIAL STATEMENTS Unaudited / Continued
2. Significant Accounting Policies (Continued)
book and tax appreciation or depreciation of securities and other investments, if applicable, is attributable to the tax deferral of losses or tax realization of financial statement unrealized gain or loss.
| | | | |
Federal tax cost of securities | | $ | 359,926,468 | |
Federal tax cost of other investments | | | 25,942 | |
| | | | |
Total federal tax cost | | $ | 359,952,410 | |
| | | | |
Gross unrealized appreciation | | $ | 132,501,802 | |
Gross unrealized depreciation | | | (18,535,594) | |
| | | | |
Net unrealized appreciation | | $ | 113,966,208 | |
| | | | |
Use of Estimates. The preparation of financial statements in conformity with U.S. GAAP requires management to make estimates and assumptions that affect the reported amounts of assets and liabilities and disclosure of contingent assets and liabilities at the date of the financial statements and the reported amounts of increases and decreases in net assets from operations during the reporting period. Actual results could differ from those estimates.
3. Securities Valuation
The Fund calculates the net asset value of its shares as of 4:00 P.M. Eastern time, on each day the New York Stock Exchange (the “Exchange”) is open for trading, except in the case of a scheduled early closing of the Exchange, in which case the Fund will calculate net asset value of the shares as of the scheduled early closing time of the Exchange.
The Fund’s Board has adopted procedures for the valuation of the Fund’s securities and has delegated the day-to-day responsibility for valuation determinations under those procedures to the Manager. The Manager has established a Valuation Committee which is responsible for determining a fair valuation for any security for which market quotations are not readily available. The Valuation Committee’s fair valuation determinations are subject to review, approval and ratification by the Fund’s Board at least quarterly or more frequently, if necessary.
Valuation Methods and Inputs
Securities are valued primarily using unadjusted quoted market prices, when available, as supplied by third party pricing services or broker-dealers.
The following methodologies are used to determine the market value or the fair value of the types of securities described below:
Equity securities traded on a securities exchange (including exchange-traded derivatives other than futures and futures options) are valued based on the official closing price on the principal exchange on which the security is traded, as identified by the Manager, prior to the time when the Fund’s assets are valued. If the official closing price is unavailable, the security is valued at the last sale price on the principal exchange on which it is traded, or if no sales occurred, the security is valued at the mean between the quoted bid and asked prices. Over-the-counter equity securities are valued at the last published sale price, or if no sales occurred,
|
| 30 OPPENHEIMER EMERGING MARKETS INNOVATORS FUND |
3. Securities Valuation (Continued)
at the mean between the quoted bid and asked prices. Events occurring after the close of trading on foreign exchanges may result in adjustments to the valuation of foreign securities to more accurately reflect their fair value as of the time when the Fund’s assets are valued.
Shares of a registered investment company that are not traded on an exchange are valued at that investment company’s net asset value per share.
Securities for which market quotations are not readily available, or when a significant event has occurred that would materially affect the value of the security, are fair valued either (i) by a standardized fair valuation methodology applicable to the security type or the significant event as previously approved by the Valuation Committee and the Fund’s Board or (ii) as determined in good faith by the Manager’s Valuation Committee. The Valuation Committee considers all relevant facts that are reasonably available, through either public information or information available to the Manager, when determining the fair value of a security. Those standardized fair valuation methodologies include, but are not limited to, valuing securities at the last sale price or initially at cost and subsequently adjusting the value based on: changes in company specific fundamentals, changes in an appropriate securities index, or changes in the value of similar securities which may be further adjusted for any discounts related to security-specific resale restrictions. When possible, such methodologies use observable market inputs such as unadjusted quoted prices of similar securities, observable interest rates, currency rates and yield curves. The methodologies used for valuing securities are not necessarily an indication of the risks associated with investing in those securities nor can it be assured that the Fund can obtain the fair value assigned to a security if it were to sell the security.
Classifications
Each investment asset or liability of the Fund is assigned a level at measurement date based on the significance and source of the inputs to its valuation. Various data inputs may be used in determining the value of each of the Fund’s investments as of the reporting period end.
These data inputs are categorized in the following hierarchy under applicable financial accounting standards:
1) Level 1-unadjusted quoted prices in active markets for identical assets or liabilities (including securities actively traded on a securities exchange)
2) Level 2-inputs other than unadjusted quoted prices that are observable for the asset or liability (such as unadjusted quoted prices for similar assets and market corroborated inputs such as interest rates, prepayment speeds, credit risks, etc.)
3) Level 3-significant unobservable inputs (including the Manager’s own judgments about assumptions that market participants would use in pricing the asset or liability).
The inputs used for valuing securities are not necessarily an indication of the risks associated with investing in those securities.
The Fund classifies each of its investments in investment companies which are publicly offered as Level 1. Investment companies that are not publicly offered, if any, are classified as Level 2 in the fair value hierarchy.
|
| 31 OPPENHEIMER EMERGING MARKETS INNOVATORS FUND |
NOTES TO FINANCIAL STATEMENTS Unaudited / Continued
3. Securities Valuation (Continued)
The table below categorizes amounts that are included in the Fund’s Statement of Assets and Liabilities at period end based on valuation input level:
| | | | | | | | | | | | | | | | |
| | | Level 1—
Unadjusted
Quoted Prices | | | Level 2—
Other Significant
Observable Inputs | | | Level 3—
Significant
Unobservable
Inputs | | | Value | |
Assets Table | | | | | | | | | | | | | | | | |
Investments, at Value: | | | | | | | | | | | | | | | | |
Common Stocks | | | | | | | | | | | | | | | | |
Consumer Discretionary | | $ | 49,287,569 | | | $ | 96,642,508 | | | $ | — | | | $ | 145,930,077 | |
Consumer Staples | | | 5,698,395 | | | | 26,330,988 | | | | — | | | | 32,029,383 | |
Financials | | | 12,715,256 | | | | 50,200,988 | | | | — | | | | 62,916,244 | |
Health Care | | | 8,078,683 | | | | 58,284,165 | | | | — | | | | 66,362,848 | |
Industrials | | | 11,514,255 | | | | 20,692,759 | | | | — | | | | 32,207,014 | |
Information Technology | | | 17,872,316 | | | | 66,988,113 | | | | — | | | | 84,860,429 | |
Materials | | | 3,430,734 | | | | 15,191,576 | | | | — | | | | 18,622,310 | |
Preferred Stock | | | 1,560,962 | | | | — | | | | — | | | | 1,560,962 | |
Investment Company | | | 30,081,656 | | | | — | | | | — | | | | 30,081,656 | |
Total Assets | | $ | 140,239,826 | | | $ | 334,331,097 | | | $ | — | | | $ | 474,570,923 | |
Forward currency exchange contracts and futures contracts, if any, are reported at their unrealized appreciation/depreciation at measurement date, which represents the change in the contract’s value from trade date. All additional assets and liabilities included in the above table are reported at their market value at measurement date.
4. Investments and Risks
Risks of Foreign Investing. The Fund may invest in foreign securities which are subject to special risks. Securities traded in foreign markets may be less liquid and more volatile than those traded in U.S. markets. Foreign issuers are usually not subject to the same accounting and disclosure requirements that U.S. companies are subject to, which may make it difficult for the Fund to evaluate a foreign company’s operations or financial condition. A change in the value of a foreign currency against the U.S. dollar will result in a change in the U.S. dollar value of investments denominated in that foreign currency and in the value of any income or distributions the Fund may receive on those investments. The value of foreign investments may be affected by exchange control regulations, foreign taxes, higher transaction and other costs, delays in the settlement of transactions, changes in economic or monetary policy in the United States or abroad, expropriation or nationalization of a company’s assets, or other political and economic factors. In addition, due to the inter-relationship of global economies and financial markets, changes in political and economic factors in one country or region could adversely affect conditions in another country or region. Investments in foreign securities may also expose the Fund to time-zone arbitrage risk. Foreign securities may trade on weekends or other days when the Fund does not price its shares. At times, the Fund may emphasize investments in a particular country or region and may be subject to greater risks from adverse events that occur in that country or region. Foreign securities and foreign currencies held in foreign banks and securities depositories may be subject to limited or no regulatory oversight.
|
| 32 OPPENHEIMER EMERGING MARKETS INNOVATORS FUND |
4. Investments and Risks (Continued)
Investments in Affiliated Funds. The Fund is permitted to invest in other mutual funds advised by the Manager (“Affiliated Funds”). Affiliated Funds are open-end management investment companies registered under the 1940 Act, as amended. The Manager is the investment adviser of, and the Sub-Adviser provides investment and related advisory services to, the Affiliated Funds. When applicable, the Fund’s investments in Affiliated Funds are included in the Statement of Investments. Shares of Affiliated Funds are valued at their net asset value per share. As a shareholder, the Fund is subject to its proportional share of the Affiliated Funds’ expenses, including their management fee. The Manager will waive fees and/ or reimburse Fund expenses in an amount equal to the indirect management fees incurred through the Fund’s investment in the Affiliated Funds.
Each of the Affiliated Funds in which the Fund invests has its own investment risks, and those risks can affect the value of the Fund’s investments and therefore the value of the Fund’s shares. To the extent that the Fund invests more of its assets in one Affiliated Fund than in another, the Fund will have greater exposure to the risks of that Affiliated Fund.
Investments in Money Market Instruments. The Fund is permitted to invest its free cash balances in money market instruments to provide liquidity or for defensive purposes. The Fund may invest in money market instruments by investing in Class E shares of Oppenheimer Institutional Government Money Market Fund (“IGMMF”), which is an Affiliated Fund. IGMMF is regulated as a money market fund under the 1940 Act, as amended. The Fund may also invest in money market instruments directly or in other affiliated or unaffiliated money market funds.
Restricted Securities. At period end, investments in securities included issues that are restricted. A restricted security may have a contractual restriction on its resale and is valued under methods approved by the Board of Trustees as reflecting fair value. Securities that are restricted are marked with an applicable footnote on the Statement of Investments. Restricted securities are reported on a schedule following the Statement of Investments.
Equity Security Risk. Stocks and other equity securities fluctuate in price. The value of the Fund’s portfolio may be affected by changes in the equity markets generally. Equity markets may experience significant short-term volatility and may fall sharply at times. Different markets may behave differently from each other and U.S. equity markets may move in the opposite direction from one or more foreign stock markets. Adverse events in any part of the equity or fixed-income markets may have unexpected negative effects on other market segments.
The prices of individual equity securities generally do not all move in the same direction at the same time and a variety of factors can affect the price of a particular company’s securities. These factors may include, but are not limited to, poor earnings reports, a loss of customers, litigation against the company, general unfavorable performance of the company’s sector or industry, or changes in government regulations affecting the company or its industry.
|
| 33 OPPENHEIMER EMERGING MARKETS INNOVATORS FUND |
NOTES TO FINANCIAL STATEMENTS Unaudited / Continued
5. Market Risk Factors
The Fund’s investments in securities and/or financial derivatives may expose the Fund to various market risk factors:
Commodity Risk. Commodity risk relates to the change in value of commodities or commodity indexes as they relate to increases or decreases in the commodities market. Commodities are physical assets that have tangible properties. Examples of these types of assets are crude oil, heating oil, metals, livestock, and agricultural products.
Credit Risk. Credit risk relates to the ability of the issuer of debt to meet interest and principal payments, or both, as they come due. In general, lower-grade, higher-yield debt securities are subject to credit risk to a greater extent than lower-yield, higher-quality securities.
Equity Risk. Equity risk relates to the change in value of equity securities as they relate to increases or decreases in the general market.
Foreign Exchange Rate Risk. Foreign exchange rate risk relates to the change in the U.S. dollar value of a security held that is denominated in a foreign currency. The U.S. dollar value of a foreign currency denominated security will decrease as the dollar appreciates against the currency, while the U.S. dollar value will increase as the dollar depreciates against the currency.
Interest Rate Risk. Interest rate risk refers to the fluctuations in value of fixed-income securities resulting from the inverse relationship between price and yield. For example, an increase in general interest rates will tend to reduce the market value of already issued fixed-income investments, and a decline in general interest rates will tend to increase their value. In addition, debt securities with longer maturities, which tend to have higher yields, are subject to potentially greater fluctuations in value from changes in interest rates than obligations with shorter maturities.
Volatility Risk. Volatility risk refers to the magnitude of the movement, but not the direction of the movement, in a financial instrument’s price over a defined time period. Large increases or decreases in a financial instrument’s price over a relative time period typically indicate greater volatility risk, while small increases or decreases in its price typically indicate lower volatility risk.
6. Shares of Beneficial Interest
The Fund has authorized an unlimited number of $0.001 par value shares of beneficial interest of each class. Transactions in shares of beneficial interest were as follows:
| | | | | | | | | | | | | | | | |
| | | Six Months Ended February 28, 2018 | | | Year Ended August 31, 2017 | |
| | | Shares | | | Amount | | | Shares | | | Amount | |
| Class A | | | | | | | | | | | | | | | | |
| Sold | | | 4,079,912 | | | $ | 46,772,583 | | | | 4,263,685 | | | $ | 40,141,206 | |
| Dividends and/or distributions reinvested | | | 17,800 | | | | 197,218 | | | | — | | | | — | |
| Redeemed | | | (1,317,814 | ) | | | (14,965,821 | ) | | | (3,653,512 | ) | | | (32,883,294 | ) |
| Net increase | | | 2,779,898 | | | $ | 32,003,980 | | | | 610,173 | | | $ | 7,257,912 | |
| | | | | | | | | | | | | | | | |
|
| 34 OPPENHEIMER EMERGING MARKETS INNOVATORS FUND |
6. Shares of Beneficial Interest (Continued)
| | | | | | | | | | | | | | | | |
| | | Six Months Ended February 28, 2018 | | | Year Ended August 31, 2017 | |
| | | Shares | | | Amount | | | Shares | | | Amount | |
| Class C | | | | | | | | | | | | | | | | |
| Sold | | | 1,035,160 | | | $ | 11,528,097 | | | | 1,261,934 | | | $ | 11,564,282 | |
| Dividends and/or distributions reinvested | | | — | | | | — | | | | — | | | | — | |
| Redeemed | | | (246,127 | ) | | | (2,746,488 | ) | | | (612,702 | ) | | | (5,475,226 | ) |
| Net increase | | | 789,033 | | | $ | 8,781,609 | | | | 649,232 | | | $ | 6,089,056 | |
| | | | | | | | | | | | | | | | |
| | | | | | | | | | | | | | | | | |
| Class I | | | | | | | | | | | | | | | | |
| Sold | | | 1,617,769 | | | $ | 19,157,348 | | | | 1,481,536 | | | $ | 14,514,625 | |
| Dividends and/or distributions reinvested | | | 13,686 | | | | 153,282 | | | | — | | | | — | |
| Redeemed | | | (91,127 | ) | | | (1,049,624 | ) | | | (93,129 | ) | | | (843,371 | ) |
| Net increase | | | 1,540,328 | | | $ | 18,261,006 | | | | 1,388,407 | | | $ | 13,671,254 | |
| | | | | | | | | | | | | | | | |
| | | | | | | | | | | | | | | | | |
| Class R | | | | | | | | | | | | | | | | |
| Sold | | | 240,810 | | | $ | 2,705,543 | | | | 179,831 | | | $ | 1,675,204 | |
| Dividends and/or distributions reinvested | | | 310 | | | | 3,408 | | | | — | | | | — | |
| Redeemed | | | (42,000 | ) | | | (480,374 | ) | | | (30,846 | ) | | | (282,511 | ) |
| Net increase | | | 199,120 | | | $ | 2,228,577 | | | | 148,985 | | | $ | 1,392,693 | |
| | | | | | | | | | | | | | | | |
| | | | | | | | | | | | | | | | | |
| Class Y | | | | | | | | | | | | | | | | |
| Sold | | | 5,023,060 | | | $ | 58,025,116 | | | | 7,981,978 | | | $ | 75,061,814 | |
| Dividends and/or distributions reinvested | | | 73,150 | | | | 814,889 | | | | — | | | | — | |
| Redeemed | | | (1,921,586 | ) | | | (22,207,889 | ) | | | (8,238,836 | ) | | | (72,745,052 | ) |
| Net increase (decrease) | | | 3,174,624 | | | $ | 36,632,116 | | | | (256,858 | ) | | $ | 2,316,762 | |
| | | | | | | | | | | | | | | | |
7. Purchases and Sales of Securities
The aggregate cost of purchases and proceeds from sales of securities, other than short-term obligations and investments in IGMMF, for the reporting period were as follows:
| | | | | | | | |
| | | Purchases | | | Sales | |
| Investment securities | | $ | 138,487,468 | | | $ | 53,199,001 | |
8. Fees and Other Transactions with Affiliates
Management Fees. Under the investment advisory agreement, the Fund pays the Manager a management fee based on the daily net assets of the Fund at an annual rate as shown in the following table:
| | | | |
| Fee Schedule | | | |
| Up to $500 million | | | 1.15% | |
| Next $500 million | | | 1.10 | |
| Next $4 billion | | | 1.05 | |
| Over $5 billion | | | 1.00 | |
The Fund’s effective management fee for the reporting period was 1.15% of average annual net assets before any applicable waivers.
|
| 35 OPPENHEIMER EMERGING MARKETS INNOVATORS FUND |
NOTES TO FINANCIAL STATEMENTS Unaudited / Continued
8. Fees and Other Transactions with Affiliates (Continued)
Sub-Adviser Fees. The Manager has retained the Sub-Adviser to provide the day-to-day portfolio management of the Fund. Under the Sub-Advisory Agreement, the Manager pays the Sub-Adviser an annual fee in monthly installments, equal to a percentage of the investment management fee collected by the Manager from the Fund, which shall be calculated after any investment management fee waivers. The fee paid to the Sub-Adviser is paid by the Manager, not by the Fund.
Transfer Agent Fees. OFI Global (the “Transfer Agent”) serves as the transfer and shareholder servicing agent for the Fund. The Fund pays the Transfer Agent a fee based on annual net assets, which shall be calculated after any applicable fee waivers. Fees incurred and average net assets for each class with respect to these services are detailed in the Statement of Operations and Financial Highlights, respectively.
Sub-Transfer Agent Fees. The Transfer Agent has retained Shareholder Services, Inc., a wholly-owned subsidiary of OFI (the “Sub-Transfer Agent”), to provide the day-to-day transfer agent and shareholder servicing of the Fund. Under the Sub-Transfer Agency Agreement, the Transfer Agent pays the Sub-Transfer Agent an annual fee in monthly installments, equal to a percentage of the transfer agent fee collected by the Transfer Agent from the Fund, which shall be calculated after any applicable fee waivers. The fee paid to the Sub-Transfer Agent is paid by the Transfer Agent, not by the Fund.
Trustees’ Compensation. The Fund’s Board of Trustees (“Board”) has adopted a compensation deferral plan for Independent Trustees that enables Trustees to elect to defer receipt of all or a portion of the annual compensation they are entitled to receive from the Fund. For purposes of determining the amount owed to the Trustees under the plan, deferred amounts are treated as though equal dollar amounts had been invested in shares of the Fund or in other Oppenheimer funds selected by the Trustees. The Fund purchases shares of the funds selected for deferral by the Trustees in amounts equal to his or her deemed investment, resulting in a Fund asset equal to the deferred compensation liability. Such assets are included as a component of “Other” within the asset section of the Statement of Assets and Liabilities. Deferral of Trustees’ fees under the plan will not affect the net assets of the Fund and will not materially affect the Fund’s assets, liabilities or net investment income per share. Amounts will be deferred until distributed in accordance with the compensation deferral plan.
Distribution and Service Plan (12b-1) Fees. Under its General Distributor’s Agreement with the Fund, OppenheimerFunds Distributor, Inc. (the “Distributor”) acts as the Fund’s principal underwriter in the continuous public offering of the Fund’s classes of shares.
Service Plan for Class A Shares. The Fund has adopted a Service Plan (the “Plan”) for Class A shares pursuant to Rule 12b-1 under the 1940 Act. Under the Plan, the Fund reimburses the Distributor for a portion of its costs incurred for services provided to accounts that hold Class A shares. Reimbursement is made periodically at an annual rate of up to
|
| 36 OPPENHEIMER EMERGING MARKETS INNOVATORS FUND |
8. Fees and Other Transactions with Affiliates (Continued)
0.25% of the daily net assets of Class A shares of the Fund. The Distributor currently uses all of those fees to pay dealers, brokers, banks and other financial institutions periodically for providing personal service and maintenance of accounts of their customers that hold Class A shares. Any unreimbursed expenses the Distributor incurs with respect to Class A shares in any fiscal year cannot be recovered in subsequent periods. Fees incurred by the Fund under the Plan are detailed in the Statement of Operations.
Distribution and Service Plans for Class C and Class R Shares. The Fund has adopted Distribution and Service Plans (the “Plans”) for Class C and Class R shares pursuant to Rule 12b-1 under the 1940 Act to compensate the Distributor for distributing those share classes, maintaining accounts and providing shareholder services. Under the Plans, the Fund pays the Distributor an annual asset-based sales charge of 0.75% on Class C shares’ daily net assets and 0.25% on Class R shares’ daily net assets. The Fund also pays a service fee under the Plans at an annual rate of 0.25% of daily net assets. The Plans continue in effect from year to year only if the Fund’s Board of Trustees votes annually to approve their continuance at an in person meeting called for that purpose. Fees incurred by the Fund under the Plans are detailed in the Statement of Operations.
Sales Charges. Front-end sales charges and CDSC do not represent expenses of the Fund. They are deducted from the proceeds of sales of Fund shares prior to investment or from redemption proceeds prior to remittance, as applicable. The sales charges retained by the Distributor from the sale of shares and the CDSC retained by the Distributor on the redemption of shares is shown in the following table for the period indicated.
| | | | | | | | | | | | | | | | |
| Six Months Ended | | Class A
Front-End
Sales Charges
Retained by
Distributor | | | Class A
Contingent
Deferred
Sales Charges
Retained by
Distributor | | | Class C
Contingent
Deferred
Sales Charges
Retained by
Distributor | | | Class R
Contingent
Deferred
Sales Charges
Retained by
Distributor | |
| February 28, 2018 | | | $58,659 | | | | $304 | | | | $1,948 | | | | $— | |
Waivers and Reimbursements of Expenses. The Manager has contractually agreed to waive fees and/or reimburse expenses to limit the Fund’s “Expenses after payments, waivers and/or reimbursements and reduction to custodian expenses” (excluding any applicable dividend expense, taxes, interest and fees from borrowing, any subsidiary expenses, Acquired Fund Fees and Expenses, brokerage commissions, unusual and infrequent expenses, interest and fees from borrowing, and certain other Fund expenses) so that, as percentages of average daily net assets, those expenses will not exceed the annual rate of 1.70% for Class A shares, 2.50% for Class C shares, 1.25% for Class I shares, 2.00% for Class R shares and 1.45% for Class Y shares.
During the reporting period, the Manager waived fees and/or reimbursed the Fund as follows:
|
| 37 OPPENHEIMER EMERGING MARKETS INNOVATORS FUND |
NOTES TO FINANCIAL STATEMENTS Unaudited / Continued
8. Fees and Other Transactions with Affiliates (Continued)
| | | | |
| Class A | | | $864 | |
| Class I | | | 3,271 | |
| Class Y | | | 2,214 | |
This fee waiver and/or expense reimbursement may not be amended or withdrawn for one year from the date of the Fund’s prospectus, unless approved by the Board.
Effective for the period January 1, 2017 through December 31, 2017, the Transfer
Agent voluntarily waived and/or reimbursed Fund expenses in an amount equal to 0.015% of average annual net assets for Classes A, C, R and Y.
During the reporting period, the Transfer Agent waived fees and/or reimbursed the Fund for transfer agent and shareholder servicing agent fees as follows:
| | | | |
| Class A | | | $4,685 | |
| Class C | | | 1,678 | |
| Class R | | | 225 | |
| Class Y | | | 10,413 | |
The Manager will waive fees and/or reimburse Fund expenses in an amount equal to the indirect management fees incurred through the Fund’s investment in IGMMF. During the reporting period, the Manager waived fees and/or reimbursed the Fund $13,086 for IGMMF management fees. This fee waiver and/or expense reimbursement may not be amended or withdrawn for one year from the date of the Fund’s prospectus, unless approved by the Board.
9. Borrowings and Other Financing
Joint Credit Facility. A number of mutual funds managed by the Manager participate in a $1.875 billion revolving credit facility (the “Facility”) intended to provide short-term financing, if necessary, subject to certain restrictions in connection with atypical redemption activity. Expenses and fees related to the Facility are paid by the participating funds and are disclosed separately or as other expenses on the Statement of Operations. The Fund did not utilize the Facility during the reporting period.
|
| 38 OPPENHEIMER EMERGING MARKETS INNOVATORS FUND |
BOARD APPROVAL OF THE FUND’S INVESTMENT ADVISORY
AND SUB-ADVISORY AGREEMENTS Unaudited
The Fund has entered into an investment advisory agreement with OFI Global Asset Management, Inc. (“OFI Global” or the “Adviser”), a wholly-owned subsidiary of OppenheimerFunds, Inc. (“OFI” or the “Sub-Adviser”) (“OFI Global” and “OFI” together the “Managers”) and OFI Global has entered into a sub-advisory agreement with OFI whereby OFI provides investment sub-advisory services to the Fund (collectively, the “Agreements”). Each year, the Board of Trustees (the “Board”), including a majority of the independent Trustees, is required to determine whether to approve the terms of the Agreements and the renewal thereof. The Investment Company Act of 1940, as amended, requires that the Board request and evaluate, and that the Managers provide, such information as may be reasonably necessary to evaluate the terms of the Agreements. The Board employs an independent consultant to prepare a report that provides information, including comparative information that the Board requests for that purpose. In addition to in-person meetings focused on this evaluation, the Board receives information throughout the year regarding Fund services, fees, expenses and performance.
The Managers and the independent consultant provided information to the Board on the following factors: (i) the nature, quality and extent of the Managers’ services, (ii) the comparative investment performance of the Fund and the Managers, (iii) the fees and expenses of the Fund, including comparative fee and expense information, (iv) the profitability of the Managers and their affiliates, including an analysis of the cost of providing services, (v) whether economies of scale are realized as the Fund grows and whether fee levels reflect these economies of scale for Fund investors and (vi) other benefits to the Managers from their relationship with the Fund. The Board was aware that there are alternatives to retaining the Managers.
Outlined below is a summary of the principal information considered by the Board as well as the Board’s conclusions.
Nature, Quality and Extent of Services. The Board considered information about the nature, quality and extent of the services provided to the Fund and information regarding the Managers’ key personnel who provide such services. The Managers’ duties include providing the Fund with the services of the portfolio managers and the Sub-Adviser’s investment team, who provide research, analysis and other advisory services in regard to the Fund’s investments; and securities trading services. OFI Global is responsible for oversight of third-party service providers; monitoring compliance with applicable Fund policies and procedures and adherence to the Fund’s investment restrictions; risk management; and oversight of the Sub-Adviser. OFI Global is also responsible for providing certain administrative services to the Fund. Those services include providing and supervising all administrative and clerical personnel who are necessary in order to provide effective corporate administration for the Fund; compiling and maintaining records with respect to the Fund’s operations; preparing and filing reports required by the U.S. Securities and Exchange Commission; preparing periodic reports regarding the operations of the Fund for its shareholders; preparing proxy materials for shareholder meetings; and preparing the registration statements required by federal and state securities laws for the sale of the Fund’s shares. OFI Global also provides the Fund with office space, facilities and equipment.
|
| 39 OPPENHEIMER EMERGING MARKETS INNOVATORS FUND |
BOARD APPROVAL OF THE FUND’S INVESTMENT ADVISORY
AND SUB-ADVISORY AGREEMENTS Unaudited / Continued
The Board also considered the quality of the services provided and the quality of the Managers’ resources that are available to the Fund. The Board took account of the fact that the Sub-Adviser has over fifty years of experience as an investment adviser and that its assets under management rank it among the top mutual fund managers in the United States. The Board evaluated the Managers’ advisory, administrative, accounting, legal, compliance and risk management services, among other services, and information the Board has received regarding the experience and professional qualifications of the Managers’ key personnel and the size and functions of its staff. In its evaluation of the quality of the portfolio management services provided, the Board considered the experience of Heidi Heikenfeld and Justin Leverenz, the portfolio managers for the Fund, and the Sub-Adviser’s investment team and analysts. The Board members also considered the totality of their experiences with the Managers as directors or trustees of the Fund and other funds advised by the Managers. The Board considered information regarding the quality of services provided by affiliates of the Managers, which the Board members have become knowledgeable about through their experiences with the Managers and in connection with the review or renewal of the Fund’s service agreements or service providers. The Board concluded, in light of the Managers’ experience, reputation, personnel, operations and resources that the Fund benefits from the services provided under the Agreements.
Investment Performance of the Managers and the Fund. Throughout the year, the Managers provided information on the investment performance of the Fund, the Adviser and the Sub-Adviser, including comparative performance information. The Board also reviewed information, prepared by the Managers and by the independent consultant, comparing the Fund’s historical performance to relevant benchmarks or market indices and to the performance of other retail funds in the diversified emerging markets category. The Board noted that the Fund’s one-year performance was below its category median.
Fees and Expenses of the Fund. The Board reviewed the fees paid to the Adviser and the other expenses borne by the Fund. The Board also considered the comparability of the fees charged and the services provided to the Fund to the fees and services for other clients or accounts advised by the Adviser. The independent consultant provided comparative data in regard to the fees and expenses of the Fund and other retail front-end load diversified emerging markets funds with comparable asset levels and distribution features. After discussions with the Board, the Adviser has contractually agreed to waive fees and/or reimburse the Fund so that the total annual fund operating expenses, excluding certain expenses, as a percentage of average daily net assets will not exceed the following annual rates: 1.70% for Class A shares, 2.50% for Class C shares, 1.25% for Class I shares, 2.00% for Class R shares and 1.45% for Class Y shares as calculated on the daily net assets of the Fund. This contractual fee waiver and/or expense reimbursement may not be amended or withdrawn for one year from the date of the Fund’s prospectus, unless approved by the Board. The Board noted that the Fund’s contractual management fee and total expenses were lower than its peer group median and higher than its category median.
Economies of Scale and Profits Realized by the Managers. The Board considered information regarding the Managers’ costs in serving as the Fund’s investment adviser and sub-adviser, including the costs associated with the personnel and systems necessary
|
| 40 OPPENHEIMER EMERGING MARKETS INNOVATORS FUND |
to manage the Fund, and information regarding the Managers’ profitability from their relationship with the Fund. The Board also considered that the Managers must be able to pay and retain experienced professional personnel at competitive rates to provide quality services to the Fund. The Board reviewed whether the Managers may realize economies of scale in managing and supporting the Fund. The Board noted that the Fund currently has management fee breakpoints, which are intended to share with Fund shareholders economies of scale that may exist as the Fund’s assets grow.
Other Benefits to the Managers. In addition to considering the profits realized by the Managers, the Board considered information that was provided regarding the direct and indirect benefits the Managers receive as a result of their relationship with the Fund, including compensation paid to the Managers’ affiliates and research provided to the Adviser in connection with permissible brokerage arrangements (soft dollar arrangements).
Conclusions. These factors were also considered by the independent Trustees meeting separately from the full Board, assisted by experienced counsel to the Fund and to the independent Trustees. Fund counsel and the independent Trustees’ counsel are independent of the Managers within the meaning and intent of the Securities and Exchange Commission Rules.
Based on its review of the information it received and its evaluations described above, the Board, including a majority of the independent Trustees, decided to continue the Agreements through September 30, 2018. In arriving at its decision, the Board did not identify any factor or factors as being more important than others, but considered all of the above information, and considered the terms and conditions of the Agreements, including the management fees, in light of all the surrounding circumstances.
|
| 41 OPPENHEIMER EMERGING MARKETS INNOVATORS FUND |
PORTFOLIO PROXY VOTING POLICIES AND GUIDELINES;
UPDATES TO STATEMENT OF INVESTMENTS Unaudited
The Fund has adopted Portfolio Proxy Voting Policies and Guidelines under which the Fund votes proxies relating to securities (“portfolio proxies”) held by the Fund. A description of the Fund’s Portfolio Proxy Voting Policies and Guidelines is available (i) without charge, upon request, by calling the Fund toll-free at 1.800.CALL OPP (225.5677), (ii) on the Fund’s website at www.oppenheimerfunds.com, and (iii) on the SEC’s website at www.sec.gov. In addition, the Fund is required to file Form N-PX, with its complete proxy voting record for the 12 months ended June 30th, no later than August 31st of each year. The Fund’s voting record is available (i) without charge, upon request, by calling the Fund toll-free at 1.800.CALL OPP (225.5677), and (ii) in the Form N-PX filing on the SEC’s website at www.sec.gov.
The Fund files its complete schedule of portfolio holdings with the SEC for the first quarter and the third quarter of each fiscal year on Form N-Q. The Fund’s Form N-Q filings are available on the SEC’s website at www.sec.gov. Those forms may be reviewed and copied at the SEC’s Public Reference Room in Washington, D.C. Information on the operation of the Public Reference Room may be obtained by calling 1-800-SEC-0330.
Householding—Delivery of Shareholder Documents
This is to inform you about OppenheimerFunds’ “householding” policy. If more than one member of your household maintains an account in a particular fund, OppenheimerFunds will mail only one copy of the fund’s prospectus (or, if available, the fund’s summary prospectus), annual and semiannual report and privacy policy. The consolidation of these mailings, called householding, benefits your fund through reduced mailing expense, and benefits you by reducing the volume of mail you receive from OppenheimerFunds. Householding does not affect the delivery of your account statements.
Please note that we will continue to household these mailings for as long as you remain an OppenheimerFunds shareholder, unless you request otherwise. If you prefer to receive multiple copies of these materials, please call us at 1.800.CALL-OPP (225-5677). You may also notify us in writing or via email. We will begin sending you individual copies of the prospectus (or, if available, the summary prospectus), reports and privacy policy within 30 days of receiving your request to stop householding.
|
| 42 OPPENHEIMER EMERGING MARKETS INNOVATORS FUND |
DISTRIBUTION SOURCES Unaudited
For any distribution that took place over the last six months of the Fund’s reporting period, the table below details on a per-share basis the percentage of the Fund’s total distribution payment amount that was derived from the following sources: net income, net profit from the sale of securities, and other capital sources. Other capital sources represent a return of capital. A return of capital may occur, for example, when some or all of the money that you invested in the Fund is paid back to you. A return of capital distribution does not necessarily reflect the Fund’s investment performance and should not be confused with “yield” or “income.” You should not draw any conclusions about each Fund’s investment performance from the amounts of these distributions. This information is based upon income and capital gains using generally accepted accounting principles as of the date of each distribution. Because the Fund is actively managed, the relative amount of the Fund’s total distributions derived from various sources over the calendar year may change. Please note that this information should not be used for tax reporting purposes as the tax character of distributable income may differ from the amounts used for this notification. You will receive IRS tax forms in the first quarter of each calendar year detailing the actual amount of the taxable and non-taxable portion of distributions paid to you during the tax year.
For the most current information, please go to oppenheimerfunds.com. Select your Fund, and scroll down to the ‘Dividends’ table under ‘Analytics’. The Fund’s latest distribution information will be followed by the sources of any distribution, updated daily.
| | | | | | | | | | | | | | | | |
| Fund Name | | Pay
Date | | | Net Income | | | Net Profit
from Sale | | | Other
Capital
Sources | |
| Oppenheimer Emerging Markets Innovators Fund | | | 12/4/17 | | | | 0.0% | | | | 0.0% | | | | 100.0% | |
|
| 43 OPPENHEIMER EMERGING MARKETS INNOVATORS FUND |
OPPENHEIMER EMERGING MARKETS INNOVATORS FUND
| | |
| Trustees and Officers | | Brian F. Wruble, Chairman of the Board of Trustees and Trustee |
| | Beth Ann Brown, Trustee |
| | Edmund P. Giambastiani, Jr., Trustee |
| | Elizabeth Krentzman, Trustee |
| | Mary F. Miller, Trustee |
| | Joel W. Motley, Trustee |
| | Joanne Pace, Trustee |
| | Daniel S. Vandivort, Trustee |
| | Heidi Heikenfeld, Vice President |
| | Justin Leverenz, Vice President |
| | Arthur P. Steinmetz, Trustee, President and Principal Executive Officer |
| | Cynthia Lo Bessette, Secretary and Chief Legal Officer |
| | Jennifer Foxson, Vice President and Chief Business Officer |
| | Mary Ann Picciotto, Chief Compliance Officer and Chief Anti-Money |
| | Laundering Officer |
| | Brian S. Petersen, Treasurer and Principal Financial & Accounting Officer |
| |
| Manager | | OFI Global Asset Management, Inc. |
| |
| Sub-Adviser | | OppenheimerFunds, Inc. |
| |
| Distributor | | OppenheimerFunds Distributor, Inc. |
| |
Transfer and Shareholder
Servicing Agent | | OFI Global Asset Management, Inc. |
| |
| Sub-Transfer Agent | | Shareholder Services, Inc. DBA OppenheimerFunds Services |
| |
Independent Registered
Public Accounting Firm | | KPMG LLP |
| |
| Legal Counsel | | Kramer Levin Naftalis & Frankel LLP |
| |
| | The financial statements included herein have been taken from the records of the Fund without examination of those records by the independent registered public accounting firm. |
© 2018 OppenheimerFunds, Inc. All rights reserved.
|
| 44 OPPENHEIMER EMERGING MARKETS INNOVATORS FUND |
PRIVACY NOTICE
As an Oppenheimer fund shareholder, you are entitled to know how we protect your personal information and how we limit its disclosure.
Information Sources
We obtain non-public personal information about our shareholders from the following sources:
| ● | | Applications or other forms. |
| ● | | When you create a user ID and password for online account access. |
| ● | | When you enroll in eDocs Direct,SM our electronic document delivery service. |
| ● | | Your transactions with us, our affiliates or others. |
| ● | | Technologies on our website, including: “cookies” and web beacons, which are used to collect data on the pages you visit and the features you use. |
If you visit oppenheimerfunds.com and do not log on to the secure account information areas, we do not obtain any personal information about you. When you do log on to a secure area, we do obtain your user ID and password to identify you. We also use this information to provide you with products and services you have requested, to inform you about products and services that you may be interested in and assist you in other ways.
We do not collect personal information through our website unless you willingly provide it to us, either directly by email or in those areas of the website that request information. In order to update your personal information (including your mailing address, email address and phone number) you must first log on and visit your user profile.
If you have set your browser to warn you before accepting cookies, you will receive the warning message with each cookie. You can refuse cookies by turning them off in your browser. However, doing so may limit your access to certain sections of our website.
We use cookies to help us improve and manage our website. For example, cookies help us recognize new versus repeat visitors to the site, track the pages visited, and enable some special features on the website. This data helps us provide better service for our website visitors.
Protection of Information
We do not disclose any non-public personal information (such as names on a customer list) about current or former customers to anyone, except as permitted by law.
Disclosure of Information
Copies of confirmations, account statements and other documents reporting activity in your fund accounts are made available to your financial advisor (as designated by you). We may also use details about you and your investments to help us, our financial service affiliates, or firms that jointly market their financial products and services with ours, to better serve your investment needs or suggest educational material that may be of interest to you. If this requires us to provide you with an opportunity to “opt in” or “opt out” of such information sharing with a firm not affiliated with us, you will receive notification on how to do so, before any such sharing takes place.
Right of Refusal
We will not disclose your personal information to unaffiliated third parties (except as permitted by law), unless we first offer you a reasonable opportunity to refuse or “opt out” of such disclosure.
|
| 45 OPPENHEIMER EMERGING MARKETS INNOVATORS FUND |
PRIVACY NOTICE Continued
Internet Security and Encryption
In general, the email services provided by our website are encrypted and provide a secure and private means of communication with us. To protect your own privacy, confidential and/ or personal information should only be communicated via email when you are advised that you are using a secure website.
As a security measure, we do not include personal or account information in non-secure emails, and we advise you not to send such information to us in non-secure emails. Instead, you may take advantage of the secure features of our website to encrypt your email correspondence. To do this, you will need to use a browser that supports Secure Sockets Layer (SSL) protocol.
| ● | | All transactions conducted via our websites, including redemptions, exchanges and purchases, are secured by the highest encryption standards available. SSL is used to establish a secure connection between your PC and OppenheimerFunds’ server. It transmits information in an encrypted and scrambled format. |
| ● | | Encryption is achieved through an electronic scrambling technology that uses a “key” to code and then decode the data. Encryption acts like the cable converter box you may have on your television set. It scrambles data with a secret code so that no one can make sense of it while it is being transmitted. When the data reaches its destination, the same software unscrambles the data. |
| ● | | You can exit the secure area by closing your browser or, for added security, you can use the Log Out button before you close your browser. |
Other Security Measures
We maintain physical, electronic and procedural safeguards to protect your personal account information. Our employees and agents have access to that information only so that they may offer you products or provide services, for example, when responding to your account questions.
How You Can Help
You can also do your part to keep your account information private and to prevent unauthorized transactions. If you obtain a user ID and password for your account, safeguard that information. Strengthening your online credentials–your online security profile–typically your user name, password, and security questions and answers, can be one of your most important lines of defense on the Internet. For additional information on how you can help prevent identity theft, visit https://www.oppenheimerfunds.com/security.
Who We Are
This joint notice describes the privacy policies of the Oppenheimer funds, OppenheimerFunds, Inc., each of its investment adviser subsidiaries, OppenheimerFunds Distributor, Inc. and OFI Global Trust Co. It applies to all Oppenheimer fund accounts you presently have, or may open in the future, using your Social Security number—whether or not you remain a shareholder of our funds. This notice was last updated as of November 2017. In the event it is updated or changed, we will post an updated notice on our website at oppenheimerfunds.com. If you have any questions about this privacy policy, email us by clicking on the Contact Us section of our website at oppenheimerfunds.com, write to us at P.O. Box 5270, Denver, CO 80217-5270, or call us at 800 CALL OPP (225 5677).
|
| 46 OPPENHEIMER EMERGING MARKETS INNOVATORS FUND |
THIS PAGE INTENTIONALLY LEFT BLANK.
|
| 47 OPPENHEIMER EMERGING MARKETS INNOVATORS FUND |

Visit us at oppenheimerfunds.com for 24-hr access to account information and transactions or call us at 800.CALL OPP (800.225.5677) for 24-hr automated information and automated transactions. Representatives also available Mon–Fri 8am-8pm ET.
| | |
Visit Us | | |
oppenheimerfunds.com | | |
| |
Call Us | | |
800 225 5677 | | |
| |
Follow Us | | |

| | Oppenheimer funds are distributed by OppenheimerFunds Distributor, Inc. 225 Liberty Street, New York, NY 10281-1008 © 2018 OppenheimerFunds Distributor, Inc. All rights reserved. RS1607.001.0218 April 24, 2018 |
Item 2. Code of Ethics.
Not applicable to semiannual reports.
Item 3. Audit Committee Financial Expert.
Not applicable to semiannual reports.
Item 4. Principal Accountant Fees and Services.
Not applicable to semiannual reports.
Item 5. Audit Committee of Listed Registrants
Not applicable.
Item 6. Schedule of Investments.
a) Not applicable. The complete schedule of investments is included in Item 1 of this Form N-CSR.
b) Not applicable.
Item 7. Disclosure of Proxy Voting Policies and Procedures for Closed-End Management Investment Companies.
Not applicable.
Item 8. Portfolio Managers of Closed-End Management Investment Companies.
Not applicable.
Item 9. Purchases of Equity Securities by Closed-End Management Investment Company and Affiliated Purchasers.
Not applicable.
Item 10. Submission of Matters to a Vote of Security Holders.
The Fund’s Governance Committee Provisions with Respect to Nominations of Directors/Trustees to the Respective Boards
None
Item 11. Controls and Procedures.
Based on their evaluation of the registrant’s disclosure controls and procedures (as defined in rule 30a-3(c) under the Investment Company Act of 1940 (17 CFR 270.30a-3(c)) as of 2/28/2018, the registrant’s principal executive officer and principal financial officer found the registrant’s disclosure controls and procedures to provide reasonable assurances that information required to be disclosed by the registrant in the reports that it files under the Securities Exchange Act of 1934 (a) is accumulated and communicated to registrant’s management, including its principal executive officer and principal financial officer, to allow timely decisions regarding required disclosure, and (b) is recorded, processed, summarized and reported, within the time
periods specified in the rules and forms adopted by the U.S. Securities and Exchange Commission.
There have been no changes in the registrant’s internal controls over financial reporting that occurred during the registrant’s second fiscal quarter of the period covered by this report that have materially affected, or are reasonably likely to materially affect, the registrant’s internal control over financial reporting.
Item 12. Disclosure of Securities Lending Activities for Closed-End Management Investment Companies.
Not applicable.
Item 13. Exhibits.
| (a) | (1) Exhibit attached hereto. |
(2) Exhibits attached hereto.
SIGNATURES
Pursuant to the requirements of the Securities Exchange Act of 1934 and the Investment Company Act of 1940, the registrant has duly caused this report to be signed on its behalf by the undersigned, thereunto duly authorized.
Oppenheimer Emerging Markets Innovators Fund
| | |
| By: | | /s/ Arthur P. Steinmetz |
| | Arthur P. Steinmetz |
| | Principal Executive Officer |
| Date: | | 4/20/2018 |
Pursuant to the requirements of the Securities Exchange Act of 1934 and the Investment Company Act of 1940, this report has been signed below by the following persons on behalf of the registrant and in the capacities and on the dates indicated.
| | |
| By: | | /s/ Arthur P. Steinmetz |
| | Arthur P. Steinmetz |
| | Principal Executive Officer |
| Date: | | 4/20/2018 |
| | |
| By: | | /s/ Brian S. Petersen |
| | Brian S. Petersen |
| | Principal Financial Officer |
| Date: | | 4/20/2018 |