Free signup for more
- Track your favorite companies
- Receive email alerts for new filings
- Personalized dashboard of news and more
- Access all data and search results
Filing tables
Filing exhibits
PKST similar filings
- 18 Apr 23 Peakstone Realty Trust Announces Webcast to Discuss Recent Listing
- 17 Apr 23 Entry into a Material Definitive Agreement
- 11 Apr 23 Entry into a Material Definitive Agreement
- 24 Mar 23 Peakstone Realty Trust Reports 2022 Fourth Quarter and Full Year Results
- 20 Mar 23 Departure of Directors or Certain Officers
- 10 Mar 23 Amendments to Articles of Incorporation or Bylaws
- 24 Feb 23 Entry into a Material Definitive Agreement
Filing view
External links
Exhibit 99.2

Supplemental Information Fourth Quarter 2022
Table of Contents Page Company Highlights 4 Financial Information 9 Debt & Capitalization 21 Leasing Activity & Asset Management 26 NAV Component Summary 29 Property Information 31 Portfolio Characteristics 36 Notes & Definitions 56 2

Company Highlights
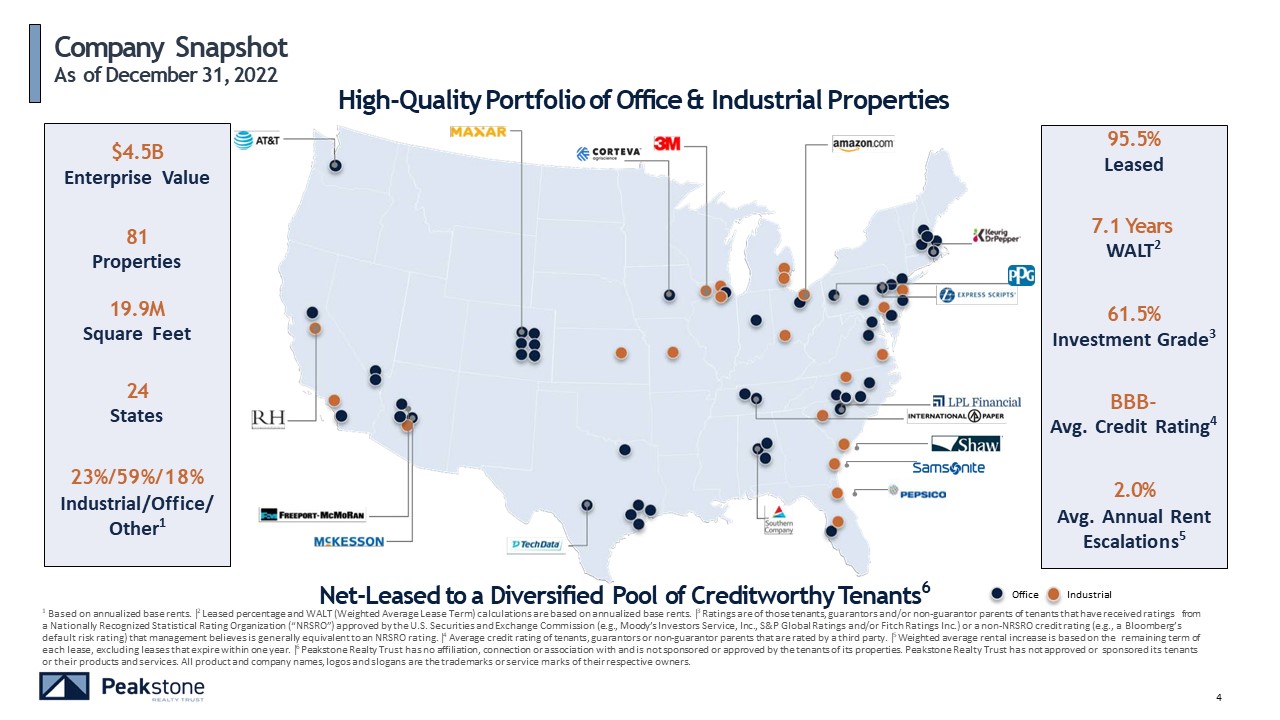
High-Quality Portfolio of Office & Industrial Properties Net-Leased to a Diversified Pool of Creditworthy Tenants6 $4.5B Enterprise Value 81 Properties 19.9M Square Feet 24 States 23%/59%/18% Industrial/Office/ Other1 95.5% Leased 7.1 Years WALT2 61.5% Investment Grade3 BBB- Avg. Credit Rating4 2.0% Avg. Annual Rent Escalations5 1 Based on annualized base rents. | 2 Leased percentage and WALT (Weighted Average Lease Term) calculations are based on annualized base rents. | 3 Ratings are of those tenants, guarantors and/or non-guarantor parents of tenants that have received ratings from a Nationally Recognized Statistical Rating Organization (“NRSRO”) approved by the U.S. Securities and Exchange Commission (e.g., Moody’s Investors Service, Inc., S&P Global Ratings and/or Fitch Ratings Inc.) or a non-NRSRO credit rating (e.g., a Bloomberg’s default risk rating) that management believes is generally equivalent to an NRSRO rating. | 4 Average credit rating of tenants, guarantors or non-guarantor parents that are rated by a third party. | 5 Weighted average rental increase is based on the remaining term of each lease, excluding leases that expire within one year. | 6 Peakstone Realty Trust has no affiliation, connection or association with and is not sponsored or approved by the tenants of its properties. Peakstone Realty Trust has not approved or sponsored its tenants or their products and services. All product and company names, logos and slogans are the trademarks or service marks of their respective owners. Office Industrial Company Snapshot As of December 31, 2022 4
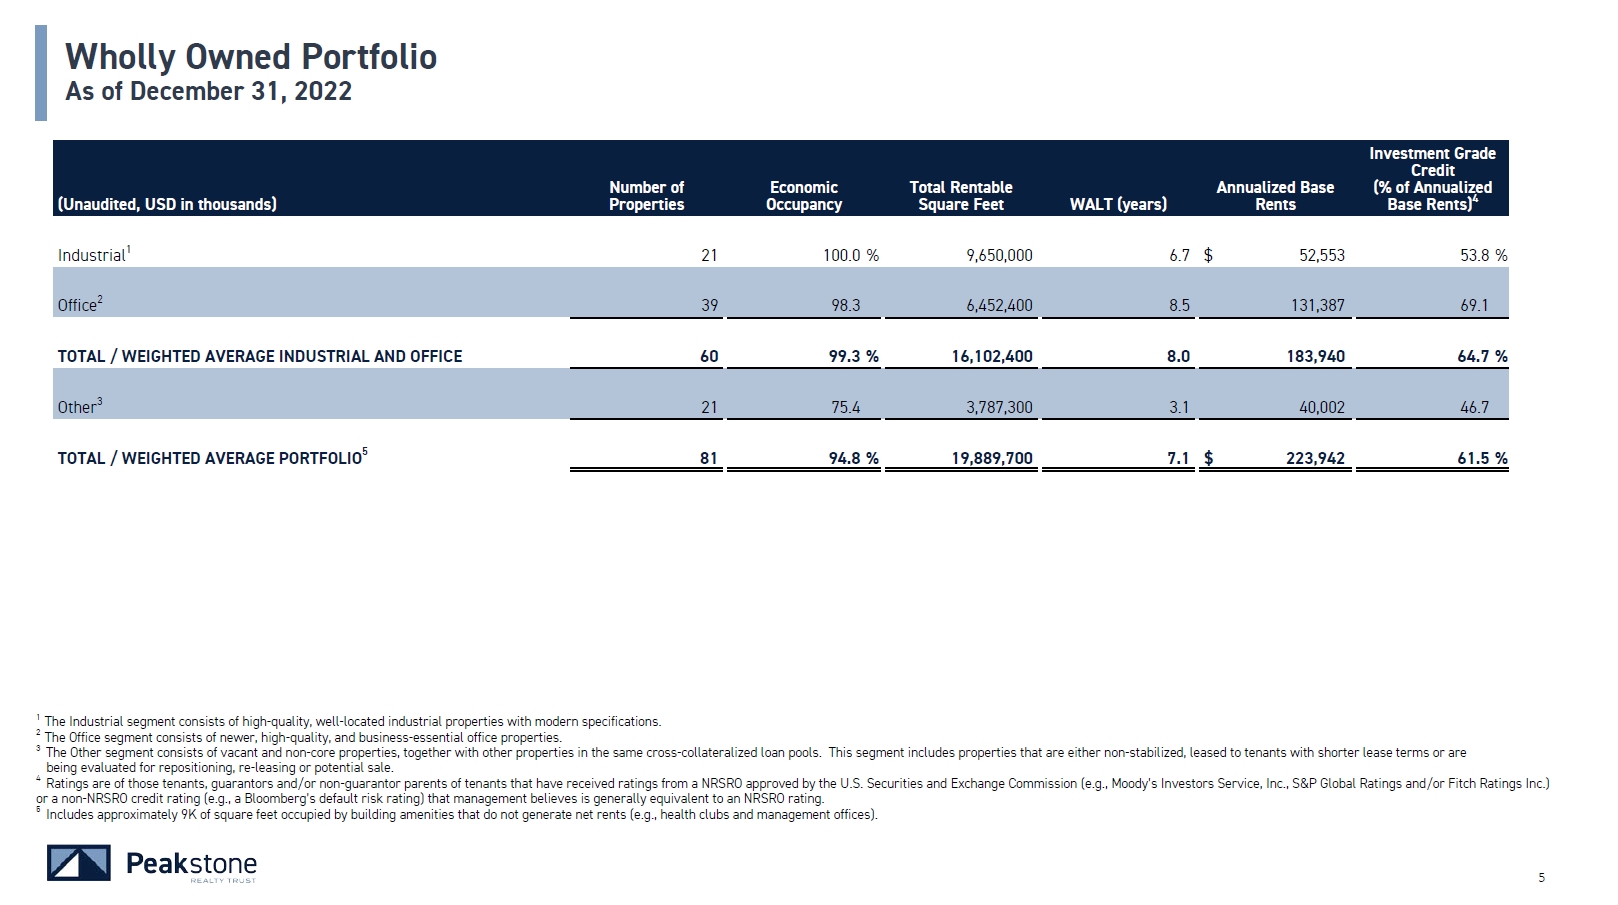
(Unaudited, USD in thousands) Number of Properties Economic Occupancy Total Rentable Square Feet WALT (years) Annualized Base Rents Investment Grade Credit (% of Annualized Base Rents)4 Industrial1 21 100.0 % 9,650,000 6.7 $ 52,553 53.8 % Office2 39 98.3 6,452,400 8.5 131,387 69.1 TOTAL / WEIGHTED AVERAGE INDUSTRIAL AND OFFICE 60 99.3 % 16,102,400 8.0 183,940 64.7 % Other3 21 75.4 3,787,300 3.1 40,002 46.7 TOTAL / WEIGHTED AVERAGE PORTFOLIO5 81 94.8 % 19,889,700 7.1 $ 223,942 61.5 % 4 1 The Industrial segment consists of high-quality, well-located industrial properties with modern specifications. 2 The Office segment consists of newer, high-quality, and business-essential office properties. 3 The Other segment consists of vacant and non-core properties, together with other properties in the same cross-collateralized loan pools. This segment includes properties that are either non-stabilized, leased to tenants with shorter lease terms or are being evaluated for repositioning, re-leasing or potential sale. 4 Ratings are of those tenants, guarantors and/or non-guarantor parents of tenants that have received ratings from a NRSRO approved by the U.S. Securities and Exchange Commission (e.g., Moody’s Investors Service, Inc., S&P Global Ratings and/or Fitch Ratings Inc.) or a non-NRSRO credit rating (e.g., a Bloomberg’s default risk rating) that management believes is generally equivalent to an NRSRO rating. 5 Includes approximately 9K of square feet occupied by building amenities that do not generate net rents (e.g., health clubs and management offices). Wholly Owned Portfolio As of December 31, 2022
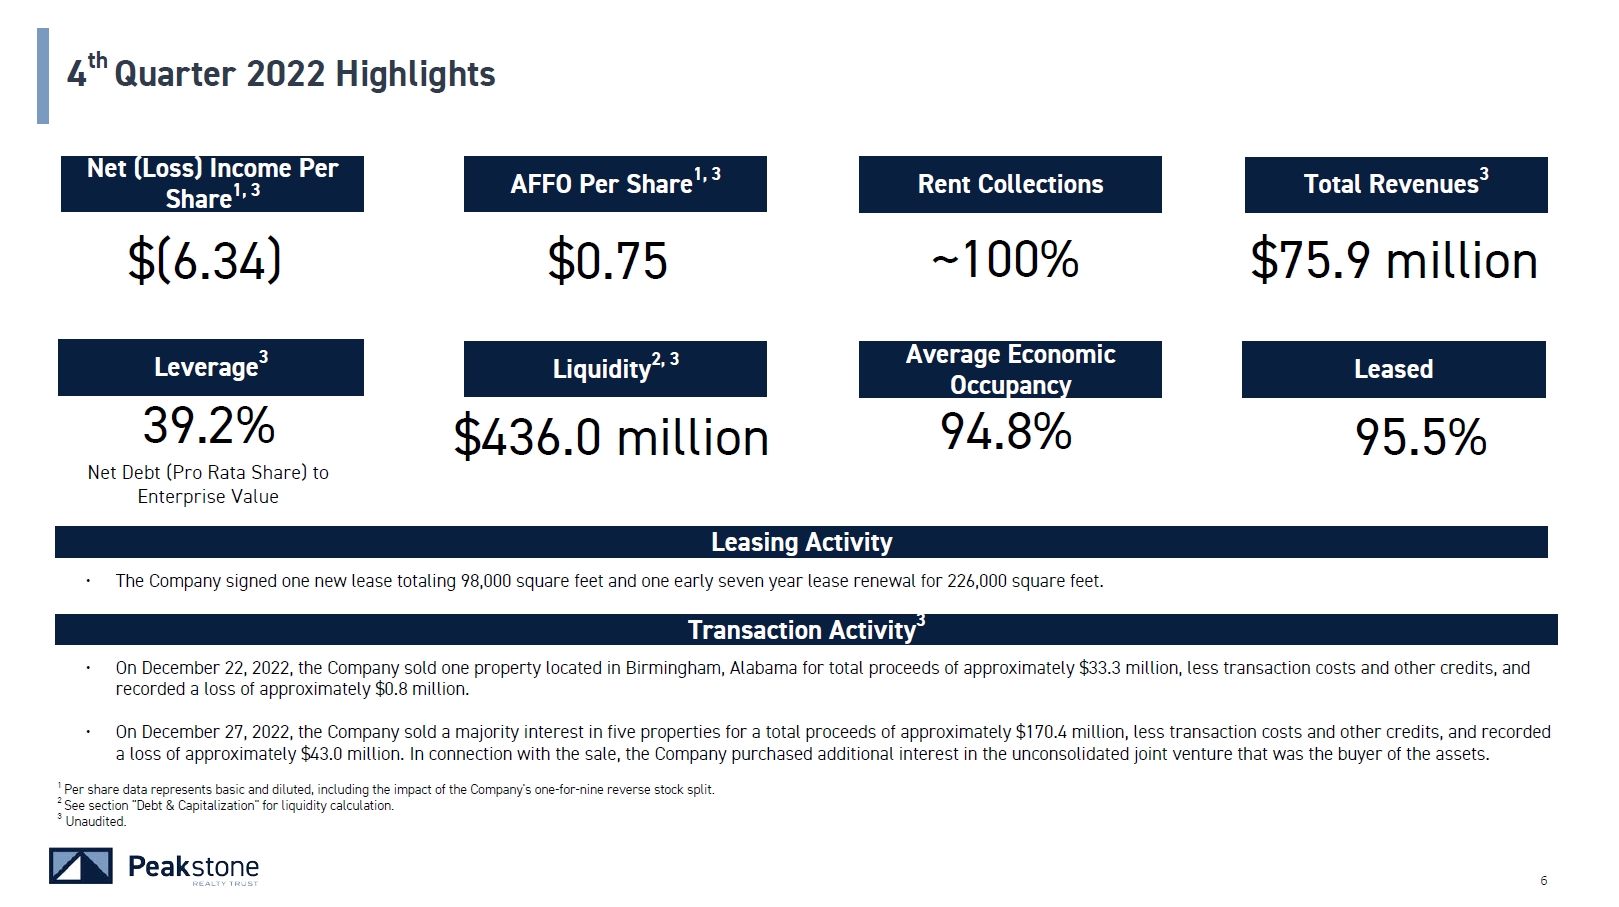
Leverage3 4 Leasing Activity 39.2% Net Debt (Pro Rata Share) to Enterprise Value $0.75 AFFO Per Share1, 3 ~100% Rent Collections $75.9 million Total Revenues3 Liquidity2, 3 The Company signed one new lease totaling 98,000 square feet and one early seven year lease renewal for 226,000 square feet. 94.8% Average Economic Occupancy Transaction Activity3 On December 22, 2022, the Company sold one property located in Birmingham, Alabama for total proceeds of approximately $33.3 million, less transaction costs and other credits, and recorded a loss of approximately $0.8 million. On December 27, 2022, the Company sold a majority interest in five properties for a total proceeds of approximately $170.4 million, less transaction costs and other credits, and recorded a loss of approximately $43.0 million. In connection with the sale, the Company purchased additional interest in the unconsolidated joint venture. 1 Per share data represents basic and diluted, including the impact of the Company's one-for-nine reverse stock split. 2 See section "Debt & Capitalization" for liquidity calculation. 3 Unaudited. 4th Quarter 2022 Highlights Net (Loss) Income Per Share1, 3 $(6.34) Leased $436.0 million 95.5%
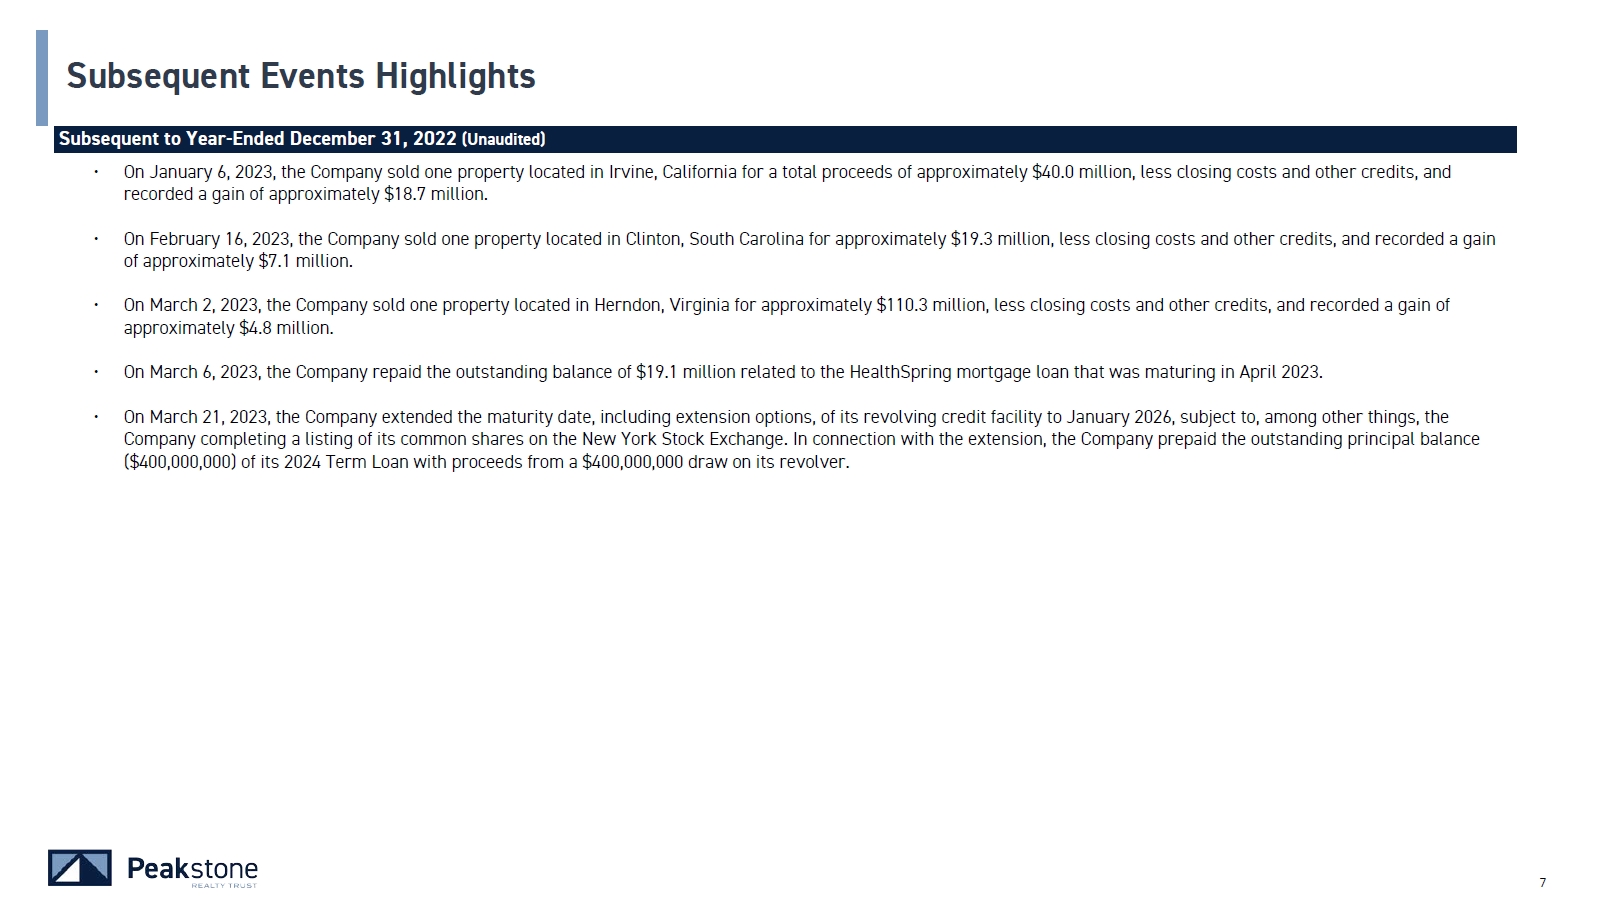
Subsequent Events Highlights Subsequent to Year-Ended December 31, 2022 (Unaudited) 4 On January 6, 2023, the Company sold one property located in Irvine, California for a total proceeds of approximately $40.0 million, less closing costs and other credits, and recorded a gain of approximately $18.7 million. On February 16, 2023, the Company sold one property located in Clinton, South Carolina for approximately $19.3 million, less closing costs and other credits, and recorded a gain of approximately $7.1 million. On March 2, 2023, the Company sold one property located in Herndon, Virginia for approximately $110.3 million, less closing costs and other credits, and recorded a gain of approximately $4.8 million. On March 6, 2023, the Company repaid the outstanding balance of $19.1 million related to the HealthSpring mortgage loan that was maturing in April 2023. On March 21, 2023, the Company extended the maturity date, including extension options, of its revolving credit facility to January 2026, subject to, among other things, the Company completing a listing of its common shares on the New York Stock Exchange. In connection with the extension, the Company prepaid the outstanding principal balance ($400,000,000) of its 2024 Term Loan.
Financial Information
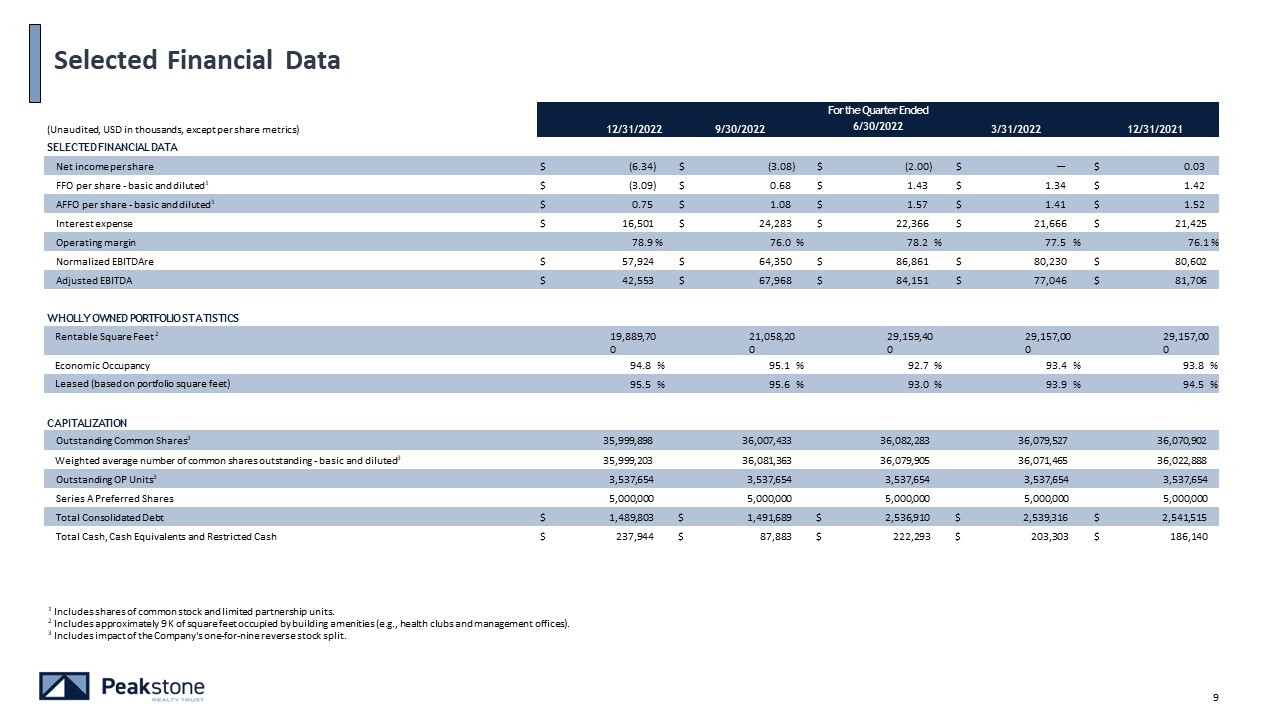
1 Includes shares of common stock and limited partnership units. 2 Includes approximately 9K of square feet occupied by building amenities (e.g., health clubs and management offices). 3 Includes impact of the Company's one-for-nine reverse stock split. 10 Selected Financial Data (Unaudited, USD in thousands, except per share metrics) 12/31/2022 9/30/2022 For the Quarter Ended 6/30/2022 3/31/2022 12/31/2021 SELECTED FINANCIAL DATA Net income per share $ (6.34) $ (3.08) $ (2.00) $ — $ 0.03 FFO per share - basic and diluted1 $ (3.09) $ 0.68 $ 1.43 $ 1.34 $ 1.42 AFFO per share - basic and diluted1 $ 0.75 $ 1.08 $ 1.57 $ 1.41 $ 1.52 Interest expense $ 16,501 $ 24,283 $ 22,366 $ 21,666 $ 21,425 Operating margin 78.9 % 76.0 % 78.2 % 77.5 % 76.1 % Normalized EBITDAre $ 57,924 $ 64,350 $ 86,861 $ 80,230 $ 80,602 Adjusted EBITDA $ 42,553 $ 67,968 $ 84,151 $ 77,046 $ 81,706 WHOLLY OWNED PORTFOLIO STATISTICS Rentable Square Feet 2 19,889,700 21,058,200 29,159,400 29,157,000 29,157,000 Economic Occupancy 94.8 % 95.1 % 92.7 % 93.4 % 93.8 % Leased (based on portfolio square feet) 95.5 % 95.6 % 93.0 % 93.9 % 94.5 % CAPITALIZATION Outstanding Common Shares3 35,999,898 36,007,433 36,082,283 36,079,527 36,070,902 Weighted average number of common shares outstanding - basic and diluted3 35,999,203 36,081,363 36,079,905 36,071,465 36,022,888 Outstanding OP Units3 3,537,654 3,537,654 3,537,654 3,537,654 3,537,654 Series A Preferred Shares 5,000,000 5,000,000 5,000,000 5,000,000 5,000,000 Total Consolidated Debt $ 1,489,803 $ 1,491,689 $ 2,536,910 $ 2,539,316 $ 2,541,515 Total Cash, Cash Equivalents and Restricted Cash $ 237,944 $ 87,883 $ 222,293 $ 203,303 $ 186,140
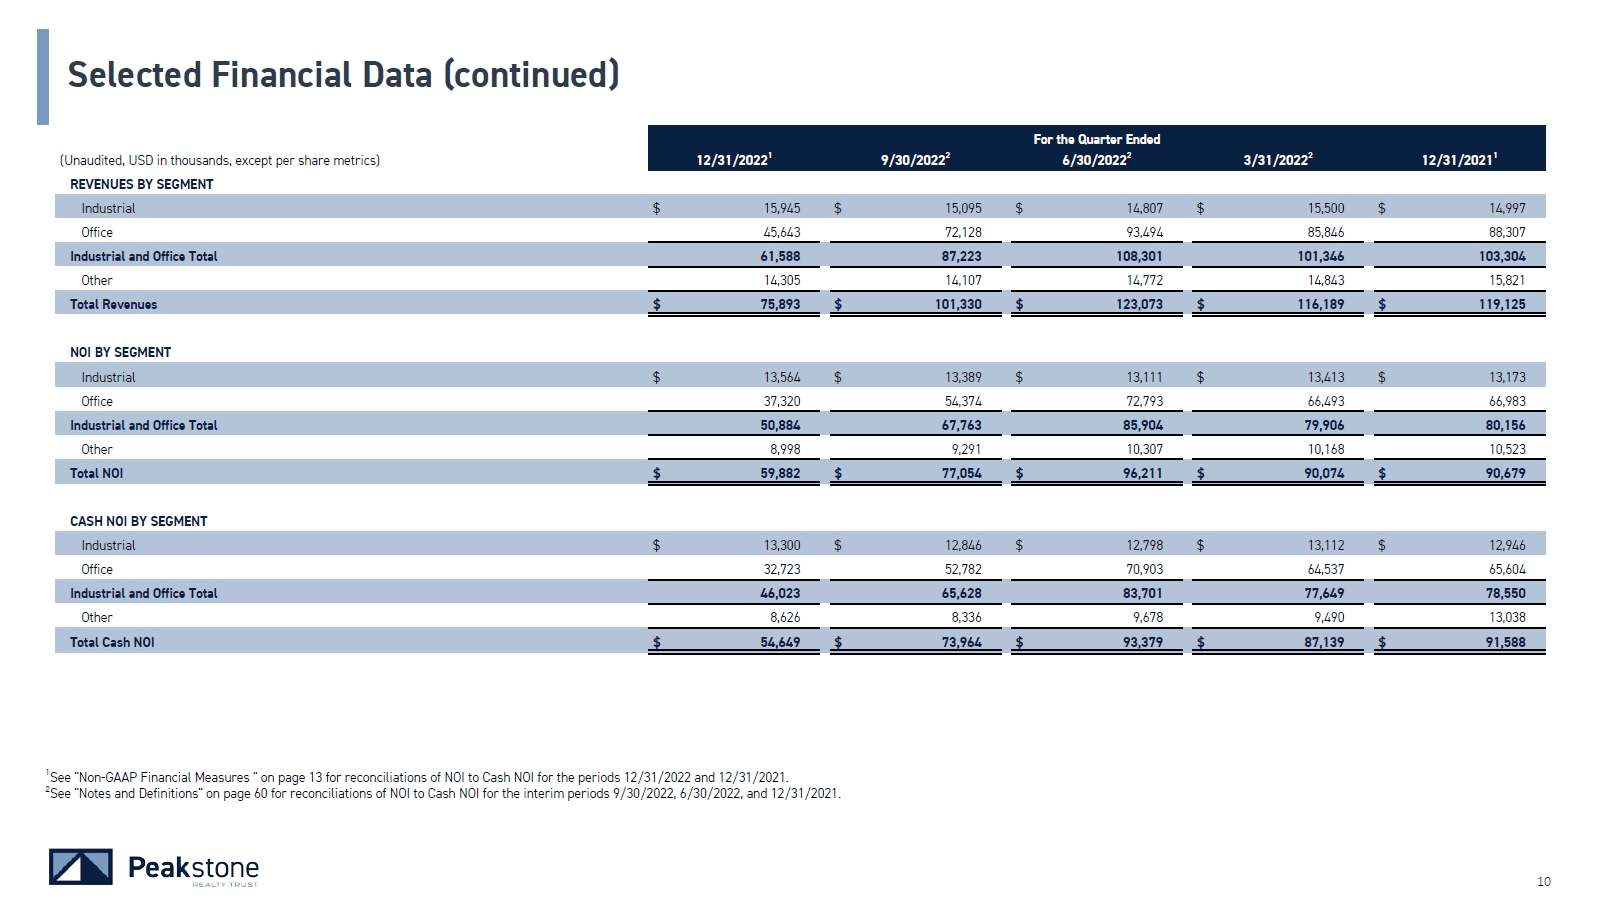
Selected Financial Data (continued) (Unaudited, USD in thousands, except per share metrics) 12/31/20221 9/30/20222 For the Quarter Ended 6/30/20222 3/31/20222 12/31/20211 REVENUES BY SEGMENT Industrial $ 15,945 $ 15,095 $ 14,807 $ 15,500 $ 14,997 Office 45,643 72,128 93,494 85,846 88,307 Industrial and Office Total 61,588 87,223 108,301 101,346 103,304 Other 14,305 14,107 14,772 14,843 15,821 Total Revenues $ 75,893 $ 101,330 $ 123,073 $ 116,189 $ 119,125 NOI BY SEGMENT Industrial $ 13,564 $ 13,389 $ 13,111 $ 13,413 $ 13,173 Office 37,320 54,374 72,793 66,493 66,983 Industrial and Office Total 50,884 67,763 85,904 79,906 80,156 Other 8,998 9,291 10,307 10,168 10,523 Total NOI $ 59,882 $ 77,054 $ 96,211 $ 90,074 $ 90,679 CASH NOI BY SEGMENT Industrial $ 13,300 $ 12,846 $ 12,798 $ 13,112 $ 12,946 Office 32,723 52,782 70,903 64,537 65,604 Industrial and Office Total 46,023 65,628 83,701 77,649 78,550 Other 8,626 8,336 9,678 9,490 13,038 Total Cash NOI $ 54,649 $ 73,964 $ 93,379 $ 87,139 $ 91,588 10 1See "Non-GAAP Financial Measures " on page 13 for reconciliations of NOI to Cash NOI for the periods 12/31/2022 and 12/31/2021. 2See "Notes and Definitions" on page 60 for reconciliations of NOI to Cash NOI for the interim periods 9/30/2022, 6/30/2022, and 12/31/2021.
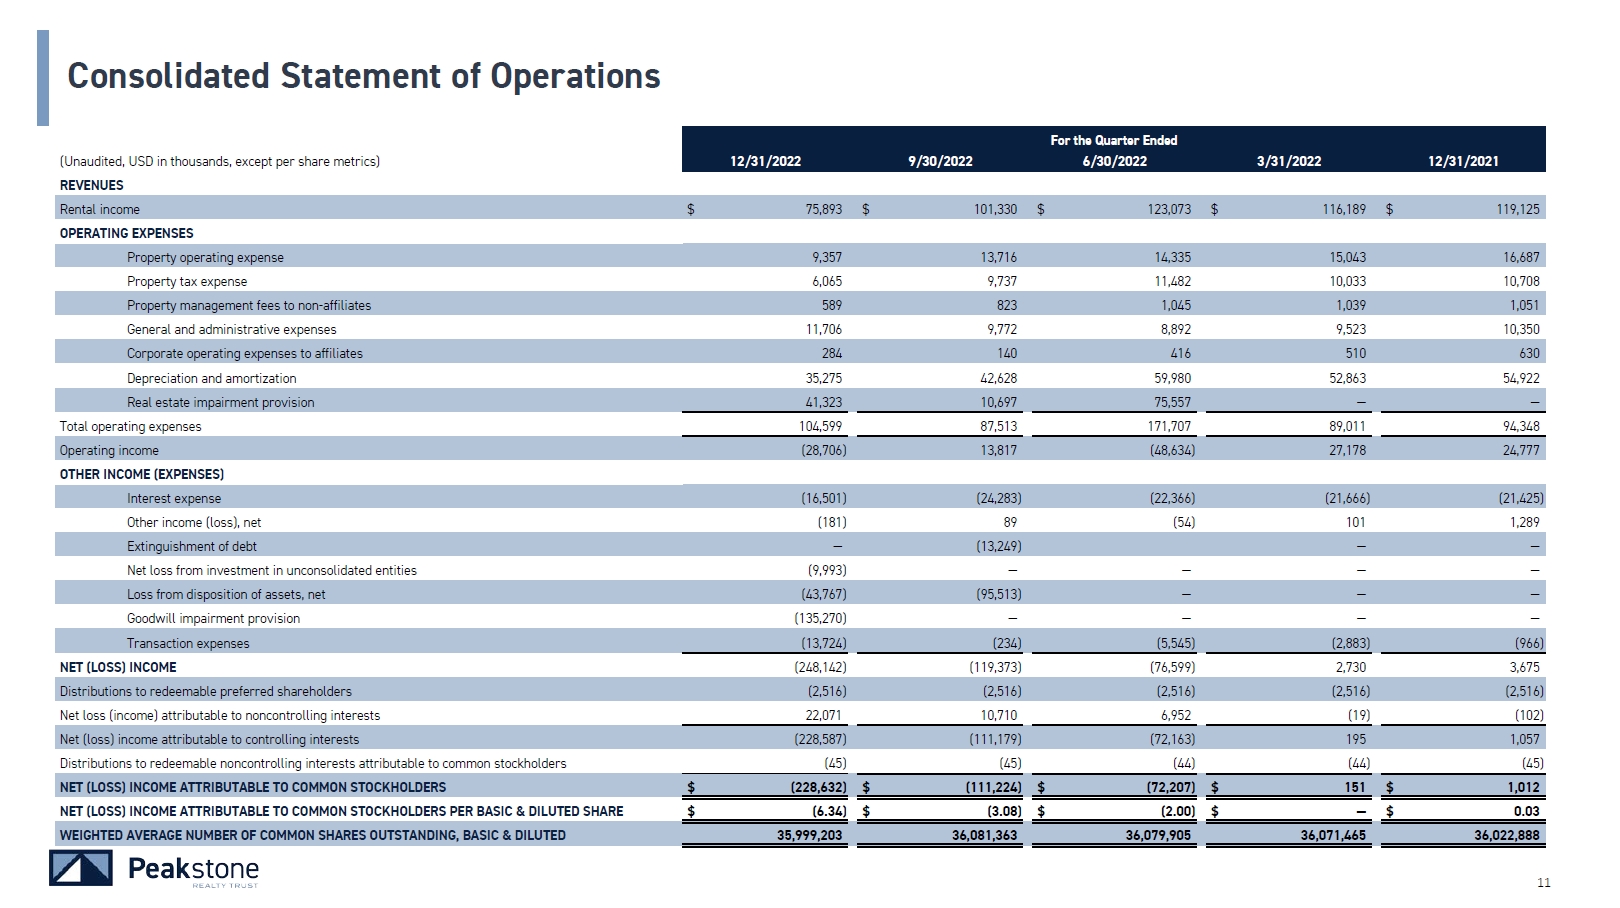
Operating income (28,706) 13,817 (48,634) 27,178 24,777 OTHER INCOME (EXPENSES) Interest expense (16,501) (24,283) (22,366) (21,666) (21,425) Other income (loss), net (181) 89 (54) 101 1,289 Extinguishment of debt — (13,249) — — Net loss from investment in unconsolidated entities (9,993) — — — — Loss from disposition of assets, net (43,767) (95,513) — — — Goodwill impairment provision (135,270) — — — — Transaction expenses (13,724) (234) (5,545) (2,883) (966) NET (LOSS) INCOME (248,142) (119,373) (76,599) 2,730 3,675 Distributions to redeemable preferred shareholders (2,516) (2,516) (2,516) (2,516) (2,516) Net loss (income) attributable to noncontrolling interests 22,071 10,710 6,952 (19) (102) Net (loss) income attributable to controlling interests (228,587) (111,179) (72,163) 195 1,057 Distributions to redeemable noncontrolling interests attributable to common stockholders (45) (45) (44) (44) (45) NET (LOSS) INCOME ATTRIBUTABLE TO COMMON STOCKHOLDERS $ (228,632) $ (111,224) $ (72,207) $ 151 $ 1,012 NET (LOSS) INCOME ATTRIBUTABLE TO COMMON STOCKHOLDERS PER BASIC & DILUTED SHARE $ (6.34) $ (3.08) $ (2.00) $ — $ 0.03 WEIGHTED AVERAGE NUMBER OF COMMON SHARES OUTSTANDING, BASIC & DILUTED 35,999,203 36,081,363 36,079,905 36,071,465 36,022,888 Consolidated Statement of Operations (Unaudited, USD in thousands, except per share metrics) 12/31/2022 9/30/2022 For the Quarter Ended 6/30/2022 3/31/2022 12/31/2021 REVENUES Rental income $ 75,893 $ 101,330 $ 123,073 $ 116,189 $ 119,125 OPERATING EXPENSES Property operating expense 9,357 13,716 14,335 15,043 16,687 Property tax expense 6,065 9,737 11,482 10,033 10,708 Property management fees to non-affiliates 589 823 1,045 1,039 1,051 General and administrative expenses 11,706 9,772 8,892 9,523 10,350 Corporate operating expenses to affiliates 284 140 416 510 630 Depreciation and amortization 35,275 42,628 59,980 52,863 54,922 Real estate impairment provision 41,323 10,697 75,557 — — Total operating expenses 104,599 87,513 171,707 89,011 94,348 10

Consolidated Balance Sheet (Unaudited, USD in thousands) 12/31/2022 9/30/2022 As of 6/30/2022 3/31/2022 12/31/2021 ASSETS Cash and cash equivalents $ 233,180 $ 75,838 $ 202,655 $ 184,209 $ 168,618 Restricted cash 4,764 12,045 19,638 19,094 17,522 Real estate Land 327,408 380,998 573,306 584,291 584,291 Building and improvements 2,631,965 2,865,548 4,029,828 4,107,554 4,104,782 Tenant origination and absorption cost 535,889 598,662 853,542 876,324 876,324 Construction in progress 1,994 2,795 4,581 3,081 4,763 TOTAL REAL ESTATE 3,497,256 3,848,003 5,461,257 5,571,250 5,570,160 Less accumulated depreciation and amortization (644,639) (682,814) (1,066,176) (1,044,790) (993,323) Total Real estate, net 2,852,617 3,165,189 4,395,081 4,526,460 4,576,837 Investments in unconsolidated entities 178,647 194,485 — — — Intangible assets, net 33,861 35,281 40,179 41,784 43,100 Deferred rent 79,572 81,156 111,507 112,195 108,896 Deferred leasing costs, net 26,507 26,268 48,835 43,422 44,505 Goodwill 94,678 229,948 229,948 229,948 229,948 Due from affiliates — 226 226 276 271 Right of use asset 35,453 35,894 39,997 40,362 39,482 Interest rate swap asset 41,404 42,724 21,905 17,133 3,456 Other assets 31,877 35,347 39,045 35,435 40,382 Real estate assets and other assets held for sale, net 20,816 — — — — TOTAL ASSETS $ 3,633,376 $ 3,934,401 $ 5,149,016 $ 5,250,318 $ 5,273,017 10

Consolidated Balance Sheet (continued) (Unaudited, USD in thousands) 12/31/2022 9/30/2022 As of 6/30/2022 3/31/2022 12/31/2021 LIABILITIES AND EQUITY Debt, net $ 1,485,402 $ 1,486,783 $ 2,529,228 $ 2,531,067 $ 2,532,377 Restricted reserves 627 7,150 8,417 8,465 8,644 Interest rate swap liability — — — 4,926 25,108 Distributions payable 12,402 12,111 12,078 12,393 12,396 Due to affiliates 1,458 1,636 1,690 2,532 2,418 Intangible liabilities, net 20,658 22,989 27,420 29,175 30,626 Lease liability 46,519 46,598 52,244 52,088 50,896 Accrued expenses and other liabilities 80,175 85,096 110,815 103,669 109,121 TOTAL LIABILITIES 1,647,241 1,662,363 2,741,892 2,744,315 2,771,586 Perpetual convertible preferred shares 125,000 125,000 125,000 125,000 125,000 Noncontrolling interests subject to redemption 3,812 3,812 4,671 4,671 4,768 STOCKHOLDERS’ EQUITY Common Stock 36 325 325 325 36 Additional paid-in capital 2,948,600 2,952,618 2,954,932 2,953,256 2,952,261 Cumulative distributions (1,036,678) (1,007,957) (979,028) (950,635) (922,562) Accumulated earnings (269,926) (41,293) 69,927 142,134 141,983 Accumulated other comprehensive loss 40,636 40,097 21,078 12,204 (18,708) TOTAL STOCKHOLDERS’ EQUITY 1,682,668 1,943,790 2,067,234 2,157,284 2,153,010 Noncontrolling interests 174,655 199,436 210,219 219,048 218,653 TOTAL EQUITY 1,857,323 2,143,226 2,277,453 2,376,332 2,371,663 TOTAL LIABILITIES AND EQUITY $ 3,633,376 $ 3,934,401 $ 5,149,016 $ 5,250,318 $ 5,273,017 10
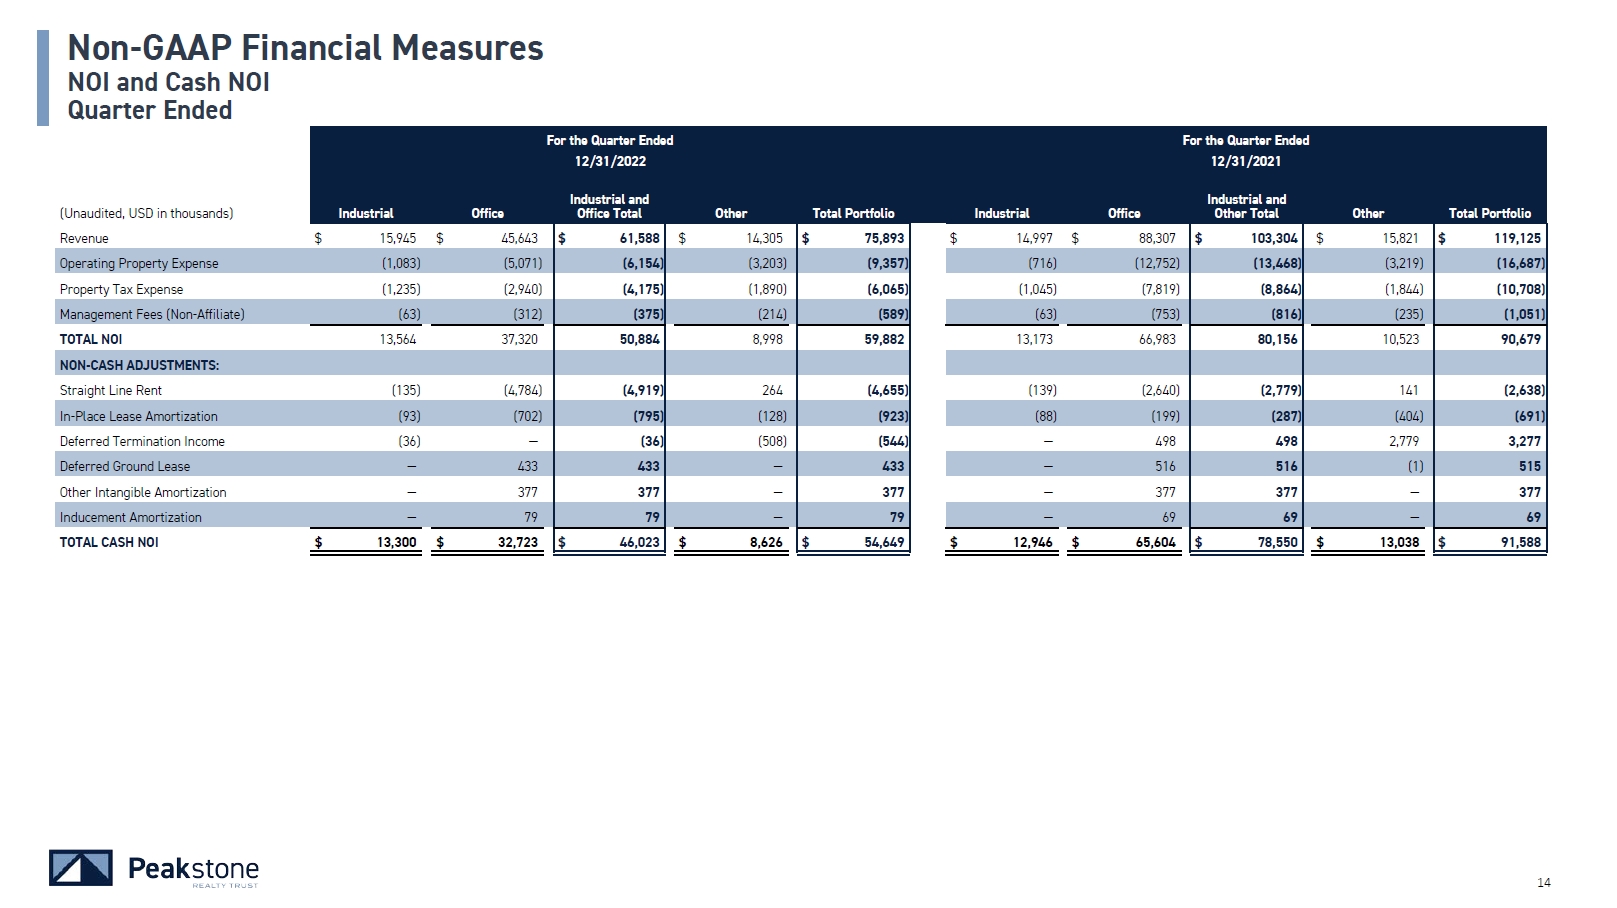
For the Quarter Ended 12/31/2022 For the Quarter Ended 12/31/2021 (Unaudited, USD in thousands) Industrial Office Industrial and Office Total Other Total Portfolio Industrial Office Industrial and Other Total Other Total Portfolio Revenue $ 15,945 $ 45,643 $ 61,588 $ 14,305 $ 75,893 Operating Property Expense (1,083) (5,071) (6,154) (3,203) (9,357) Property Tax Expense (1,235) (2,940) (4,175) (1,890) (6,065) Management Fees (Non-Affiliate) (63) (312) (375) (214) (589) TOTAL NOI 13,564 37,320 50,884 8,998 59,882 NON-CASH ADJUSTMENTS: Straight Line Rent (135) (4,784) (4,919) 264 (4,655) In-Place Lease Amortization (93) (702) (795) (128) (923) Deferred Termination Income (36) — (36) (508) (544) Deferred Ground Lease — 433 433 — 433 Other Intangible Amortization — 377 377 — 377 Inducement Amortization — 79 79 — 79 TOTAL CASH NOI $ 13,300 $ 32,723 $ 46,023 $ 8,626 $ 54,649 $ 14,997 $ 88,307 $ 103,304 $ 15,821 $ 119,125 (716) (12,752) (13,468) (3,219) (16,687) (1,045) (7,819) (8,864) (1,844) (10,708) (63) (753) (816) (235) (1,051) 13,173 66,983 80,156 10,523 90,679 (139) (2,640) (2,779) 141 (2,638) (88) (199) (287) (404) (691) — 498 498 2,779 3,277 — 516 516 (1) 515 — 377 377 — 377 — 69 69 — 69 $ 12,946 $ 65,604 $ 78,550 $ 13,038 $ 91,588 Non-GAAP Financial Measures 10 NOI and Cash NOI Quarter Ended
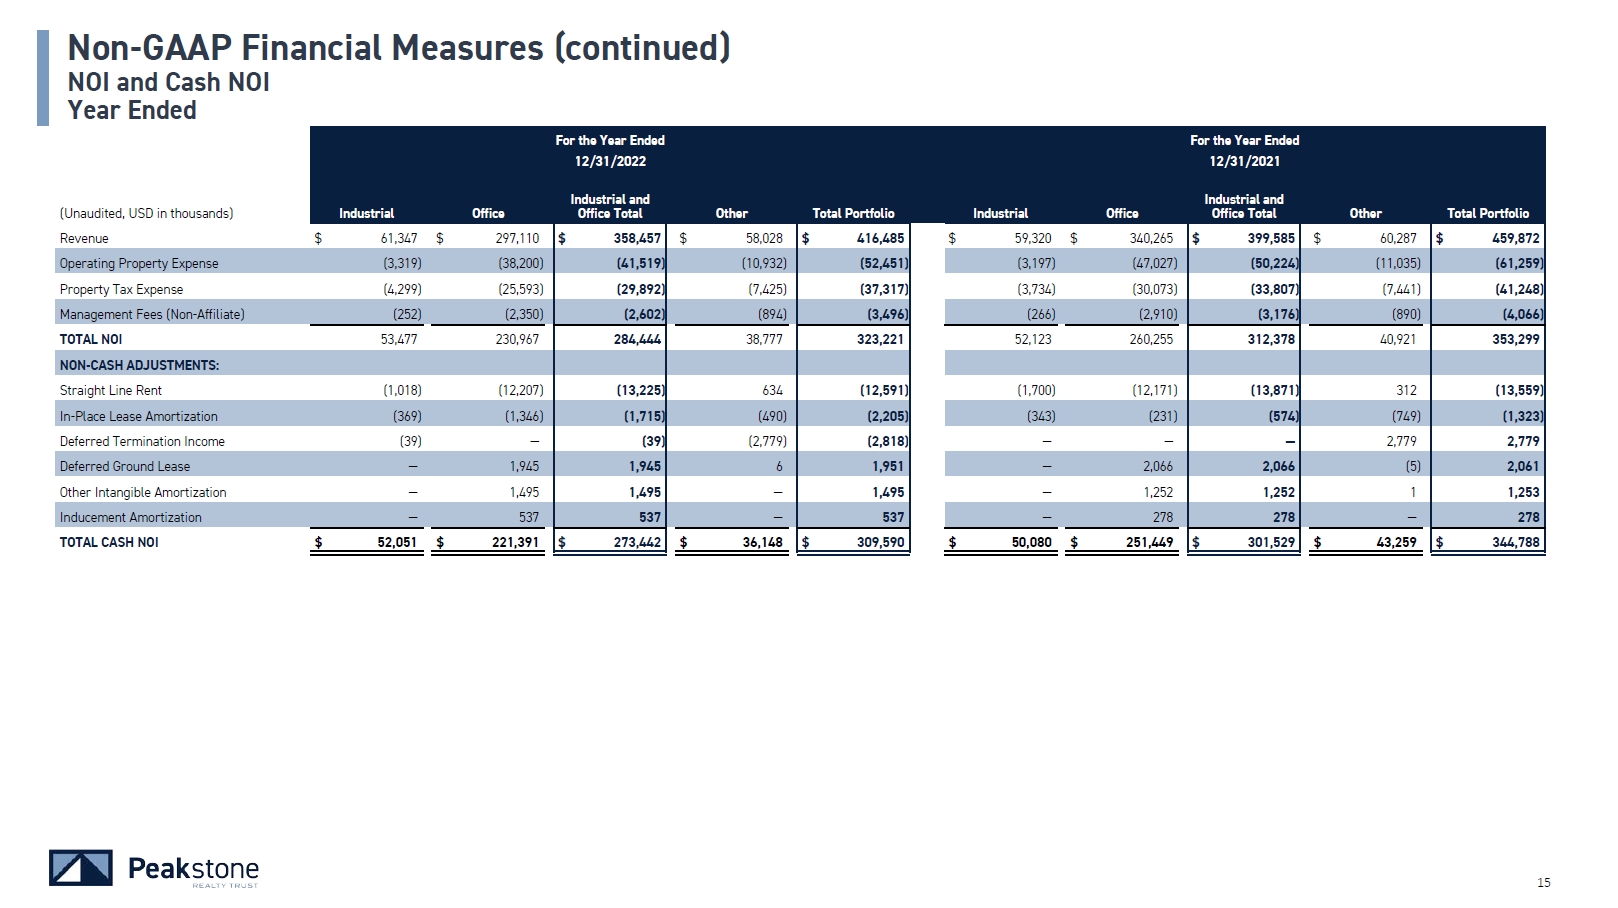
For the Year Ended 12/31/2022 For the Year Ended 12/31/2021 (Unaudited, USD in thousands) Industrial Office Industrial and Office Total Other Total Portfolio Industrial Office Industrial and Office Total Other Total Portfolio Revenue $ 61,347 $ 297,110 $ 358,457 $ 58,028 $ 416,485 Operating Property Expense (3,319) (38,200) (41,519) (10,932) (52,451) Property Tax Expense (4,299) (25,593) (29,892) (7,425) (37,317) Management Fees (Non-Affiliate) (252) (2,350) (2,602) (894) (3,496) TOTAL NOI 53,477 230,967 284,444 38,777 323,221 NON-CASH ADJUSTMENTS: Straight Line Rent (1,018) (12,207) (13,225) 634 (12,591) In-Place Lease Amortization (369) (1,346) (1,715) (490) (2,205) Deferred Termination Income (39) — (39) (2,779) (2,818) Deferred Ground Lease — 1,945 1,945 6 1,951 Other Intangible Amortization — 1,495 1,495 — 1,495 Inducement Amortization — 537 537 — 537 TOTAL CASH NOI $ 52,051 $ 221,391 $ 273,442 $ 36,148 $ 309,590 $ 59,320 $ 340,265 $ 399,585 $ 60,287 $ 459,872 (3,197) (47,027) (50,224) (11,035) (61,259) (3,734) (30,073) (33,807) (7,441) (41,248) (266) (2,910) (3,176) (890) (4,066) 52,123 260,255 312,378 40,921 353,299 (1,700) (12,171) (13,871) 312 (13,559) (343) (231) (574) (749) (1,323) — — — 2,779 2,779 — 2,066 2,066 (5) 2,061 — 1,252 1,252 1 1,253 — 278 278 — 278 $ 50,080 $ 251,449 $ 301,529 $ 43,259 $ 344,788 Non-GAAP Financial Measures (continued) 10 NOI and Cash NOI Year Ended

1 The decrease in same store quarter-to-date Cash NOI of $5.7 million is primarily driven by a $3.2 million decrease in cash termination income quarter over quarter. Non-GAAP Financial Measures (continued) For the Quarter Ended For the Year Ended (Unaudited, USD in thousands) 12/31/2022 12/31/2021 12/31/2022 12/31/2021 CASH NOI ALLOCATION Industrial $ 13,300 $ 12,946 $ 52,051 $ 50,080 Office 32,723 65,604 221,391 251,449 Industrial and Office Total $ 46,023 $ 78,550 $ 273,442 $ 301,529 Other 8,626 13,038 36,148 43,259 TOTAL CASH NOI $ 54,649 $ 91,588 $ 309,590 $ 344,788 SAME STORE CASH NOI ADJUSTMENTS Recently acquired properties — — (56,044) (45,360) Recently disposed properties (3,960) (35,117) (93,296) (140,269) Operating Partnership 10 5 32 27 TOTAL SAME STORE CASH NOI ADJUSTMENTS (3,950) (35,112) (149,308) (185,602) TOTAL SAME STORE CASH NOI $ 50,699 $ 56,476 $ 160,282 $ 159,186 SAME STORE CASH NOI Industrial $ 13,298 $ 12,982 $ 48,734 $ 47,648 Office 28,763 30,443 77,743 70,028 Industrial and Office Total $ 42,061 $ 43,425 $ 126,477 $ 117,676 Other 8,638 13,051 33,805 41,510 TOTAL SAME STORE CASH NOI $ 50,699 $ 56,476 $ 160,282 $ 159,186 Change in Same Store Cash NOI ($)1 $ (5,777) $ 1,096 Change in Same Store Cash NOI (%)1 (10.2)% 0.7 % NUMBER OF SAME STORE PROPERTIES 81 63 TOTAL SAME STORE SQUARE FEET 19,889,600 16,853,900 SAME STORE ECONOMIC OCCUPANCY 94.8 % 93.9 % 10 Same Store NOI and Cash NOI
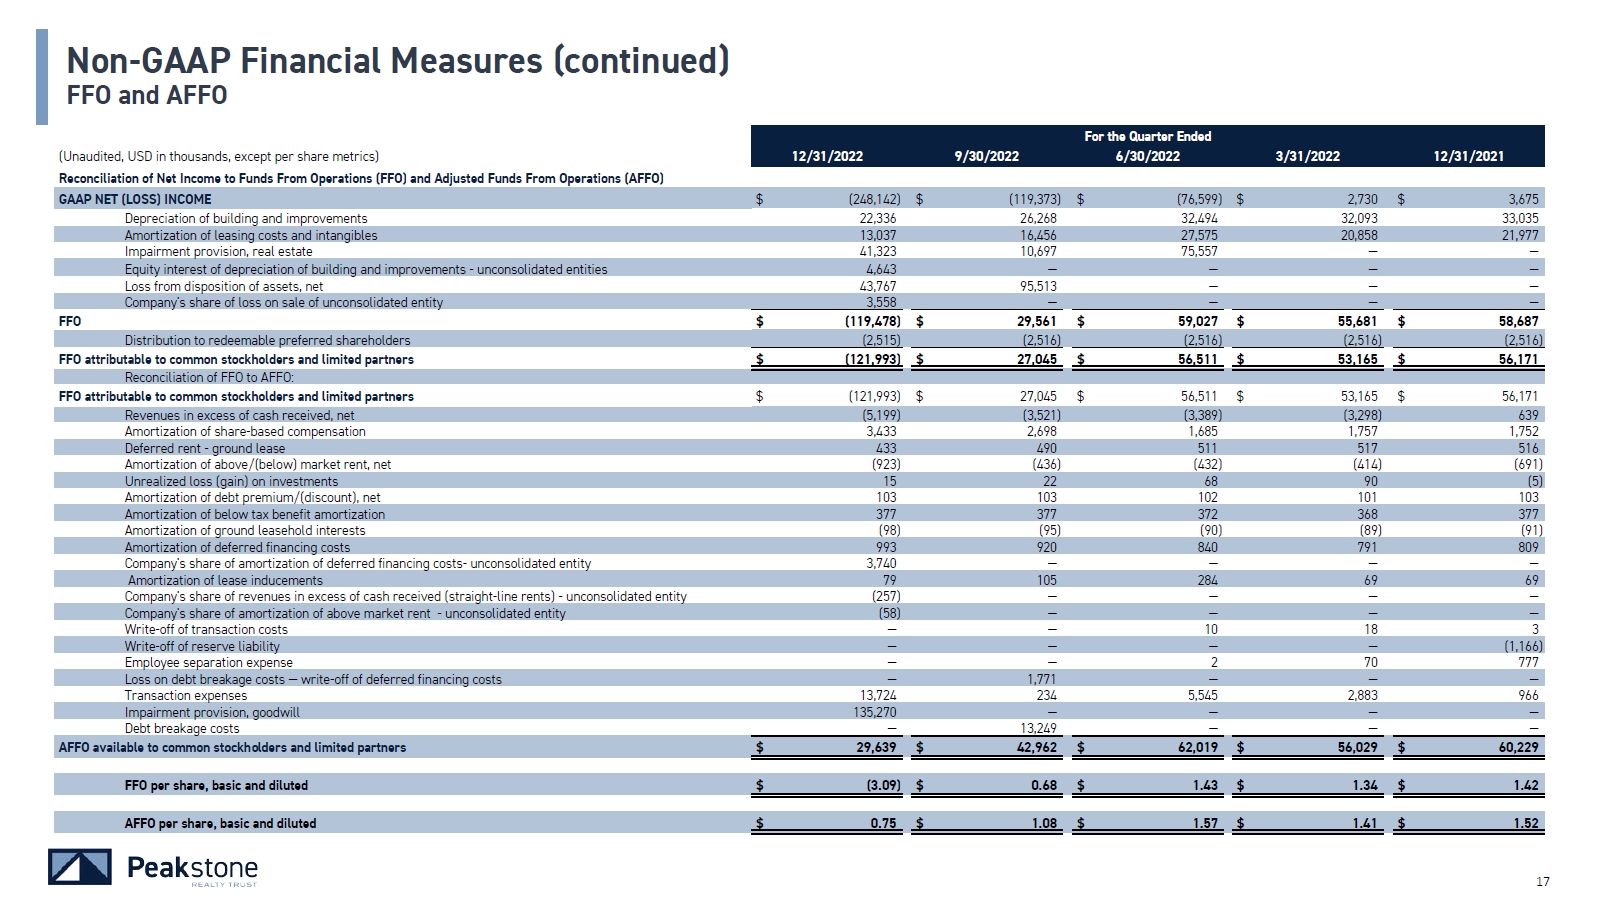
FFO $ (119,478) $ 29,561 $ 59,027 $ 55,681 $ 58,687 Distribution to redeemable preferred shareholders (2,515) (2,516) (2,516) (2,516) (2,516) FFO attributable to common stockholders and limited partners $ (121,993) $ 27,045 $ 56,511 $ 53,165 $ 56,171 Reconciliation of FFO to AFFO: FFO attributable to common stockholders and limited partners $ (121,993) $ 27,045 $ 56,511 $ 53,165 $ 56,171 Revenues in excess of cash received, net (5,199) (3,521) (3,389) (3,298) 639 Amortization of share-based compensation 3,433 2,698 1,685 1,757 1,752 Deferred rent - ground lease 433 490 511 517 516 Amortization of above/(below) market rent, net (923) (436) (432) (414) (691) Unrealized loss (gain) on investments 15 22 68 90 (5) Amortization of debt premium/(discount), net 103 103 102 101 103 Amortization of below tax benefit amortization 377 377 372 368 377 Amortization of ground leasehold interests (98) (95) (90) (89) (91) Amortization of deferred financing costs 993 920 840 791 809 Company's share of amortization of deferred financing costs- unconsolidated entity 3,740 — — — — Amortization of lease inducements 79 105 284 69 69 Company's share of revenues in excess of cash received (straight-line rents) - unconsolidated entity (257) — — — — Company's share of amortization of above market rent - unconsolidated entity (58) — — — — Write-off of transaction costs — — 10 18 3 Write-off of reserve liability — — — — (1,166) Employee separation expense — — 2 70 777 Loss on debt breakage costs — write-off of deferred financing costs — 1,771 — — — Transaction expenses 13,724 234 5,545 2,883 966 Impairment provision, goodwill 135,270 — — — — Debt breakage costs — 13,249 — — — AFFO available to common stockholders and limited partners $ 29,639 $ 42,962 $ 62,019 $ 56,029 $ 60,229 FFO per share, basic and diluted $ (3.09) $ 0.68 $ 1.43 $ 1.34 $ 1.42 AFFO per share, basic and diluted $ 0.75 $ 1.08 $ 1.57 $ 1.41 $ 1.52 10 Non-GAAP Financial Measures (continued) FFO and AFFO (Unaudited, USD in thousands, except per share metrics) 12/31/2022 9/30/2022 For the Quarter Ended 6/30/2022 3/31/2022 12/31/2021 Reconciliation of Net Income to Funds From Operations (FFO) and Adjusted Funds From Operations (AFFO) GAAP NET (LOSS) INCOME $ (248,142) $ (119,373) $ (76,599) $ 2,730 $ 3,675 Depreciation of building and improvements 22,336 26,268 32,494 32,093 33,035 Amortization of leasing costs and intangibles 13,037 16,456 27,575 20,858 21,977 Impairment provision, real estate 41,323 10,697 75,557 — — Equity interest of depreciation of building and improvements - unconsolidated entities 4,643 — — — — Loss from disposition of assets, net 43,767 95,513 — — — Company's share of loss on sale of unconsolidated entity 3,558 — — — —
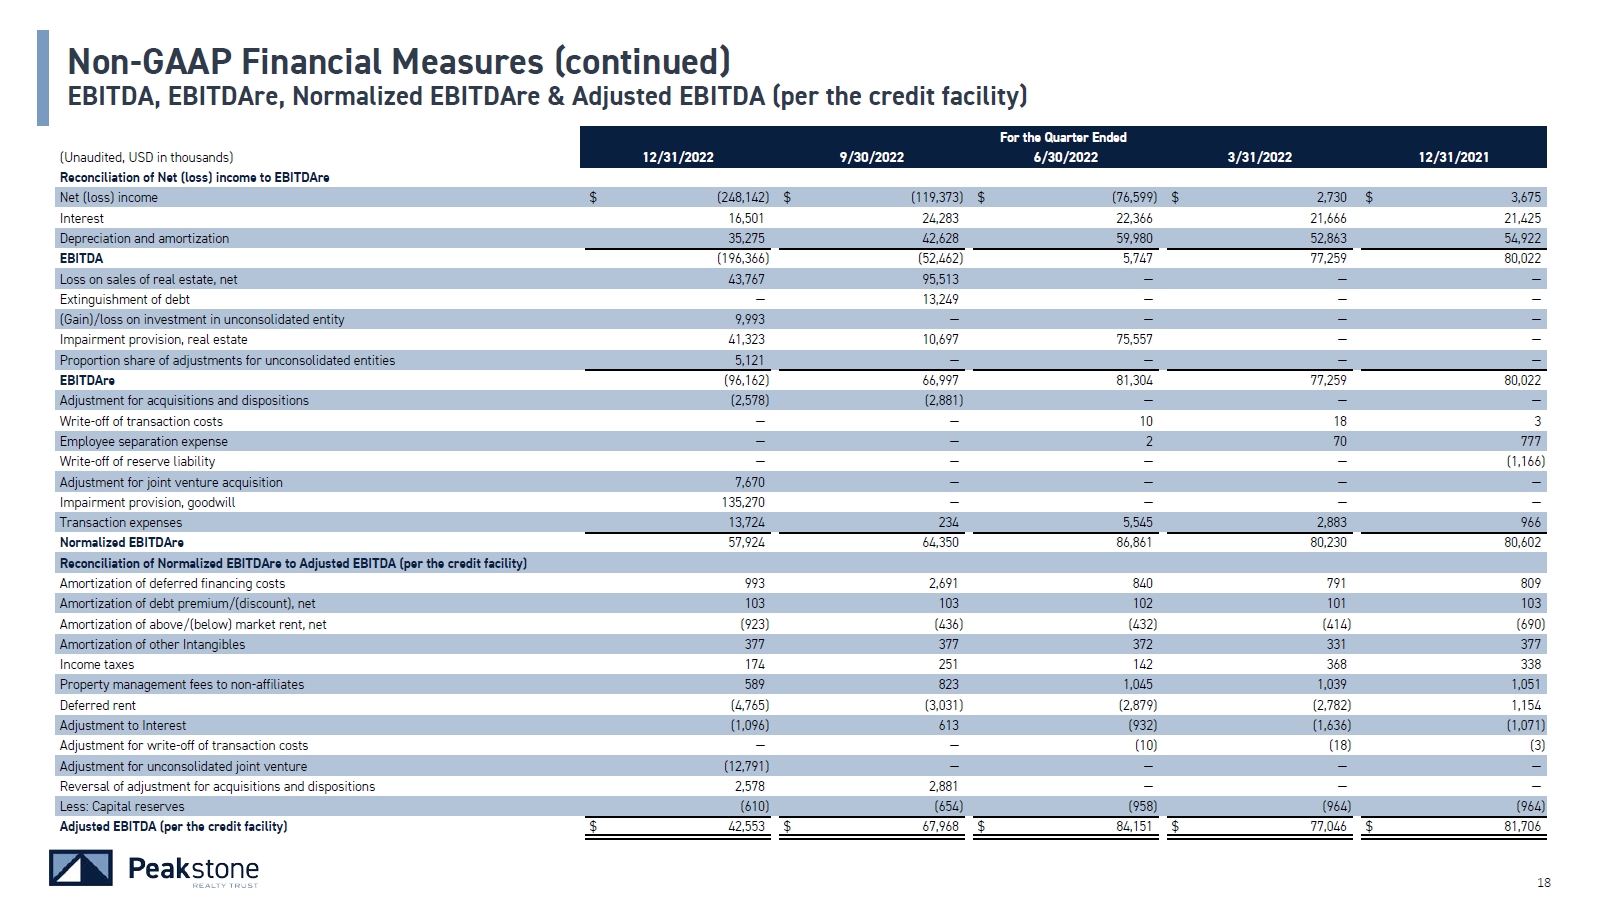
Non-GAAP Financial Measures (continued) EBITDA, EBITDAre, Normalized EBITDAre & Adjusted EBITDA (per the credit facility) (Unaudited, USD in thousands) 12/31/2022 9/30/2022 For the Quarter Ended 6/30/2022 3/31/2022 12/31/2021 Reconciliation of Net (loss) income to EBITDAre Net (loss) income $ (248,142) $ (119,373) $ (76,599) $ 2,730 $ 3,675 Interest 16,501 24,283 22,366 21,666 21,425 Depreciation and amortization 35,275 42,628 59,980 52,863 54,922 EBITDA (196,366) (52,462) 5,747 77,259 80,022 Loss on sales of real estate, net 43,767 95,513 — — — Extinguishment of debt — 13,249 — — — (Gain)/loss on investment in unconsolidated entity 9,993 — — — — Impairment provision, real estate 41,323 10,697 75,557 — — Proportion share of adjustments for unconsolidated entities 5,121 — — — — EBITDAre (96,162) 66,997 81,304 77,259 80,022 Adjustment for acquisitions and dispositions (2,578) (2,881) — — — Write-off of transaction costs — — 10 18 3 Employee separation expense — — 2 70 777 Write-off of reserve liability — — — — (1,166) Adjustment for joint venture acquisition 7,670 — — — — Impairment provision, goodwill 135,270 — — — — Transaction expenses 13,724 234 5,545 2,883 966 Normalized EBITDAre 57,924 64,350 86,861 80,230 80,602 Reconciliation of Normalized EBITDAre to Adjusted EBITDA (per the credit facility) Amortization of deferred financing costs 993 2,691 840 791 809 Amortization of debt premium/(discount), net 103 103 102 101 103 Amortization of above/(below) market rent, net (923) (436) (432) (414) (690) Amortization of other Intangibles 377 377 372 331 377 Income taxes 174 251 142 368 338 Property management fees to non-affiliates 589 823 1,045 1,039 1,051 Deferred rent (4,765) (3,031) (2,879) (2,782) 1,154 Adjustment to Interest (1,096) 613 (932) (1,636) (1,071) Adjustment for write-off of transaction costs — — (10) (18) (3) Adjustment for unconsolidated joint venture (12,791) — — — — Reversal of adjustment for acquisitions and dispositions 2,578 2,881 — — — Less: Capital reserves (610) (654) (958) (964) (964) Adjusted EBITDA (per the credit facility) $ 42,553 $ 67,968 $ 84,151 $ 77,046 $ 81,706 10

Industrial $ 358 0.6 % $ — — % $ — — % $ — — % $ 52 0.1 % Office 776 1.3 409 0.6 882 0.9 1,082 1.2 1,230 1.4 Total Industrial and Office $ 1,134 1.9 % $ 409 0.6 % $ 882 0.9 % $ 1,082 1.2 % $ 1,282 1.5 % Other 12 — 2 — — — 1 — 450 0.4 Total Maintenance Capital Expenditures $ 1,147 1.9 % $ 411 0.6 % $ 882 0.9 % $ 1,083 1.2 % $ 1,732 1.9 % Value Enhancing Expenditures by segment: Industrial $ — — % $ 5,879 7.9 % $ 8 — % $ 2 — % $ — — % Office 1,799 3.0 — — 2,714 2.8 414 0.5 286 0.3 Total Industrial and Office $ 1,799 3.0 % $ 5,879 7.9 % $ 2,722 2.8 % $ 416 0.5 % $ 286 0.3 % Other 548 0.9 1,926 2.6 — — 781 0.9 106 0.1 Total Value Enhancing Expenditures $ 2,347 3.9 % $ 7,727 10.5 % $ 2,722 2.8 % $ 1,197 1.4 % $ 391 0.4 % Total Capital Expenditures $ 3,494 5.8 % $ 8,138 11.1 % $ 3,604 3.7 % $ 2,280 2.6 % $ 2,123 2.3 % 10 Capital Expenditures Summary (Cash Basis) (Unaudited, USD in thousands) 12/31/2022 % of NOI1 9/30/2022 % of NOI1 For the Quarter Ended 6/30/2022 % of NOI1 3/31/2022 % of NOI1 12/31/2021 % of NOI1 Maintenance Capital Expenditures by segment: 1 Represents percentage of capital expenditures compared to segment NOI
Debt & Capitalization
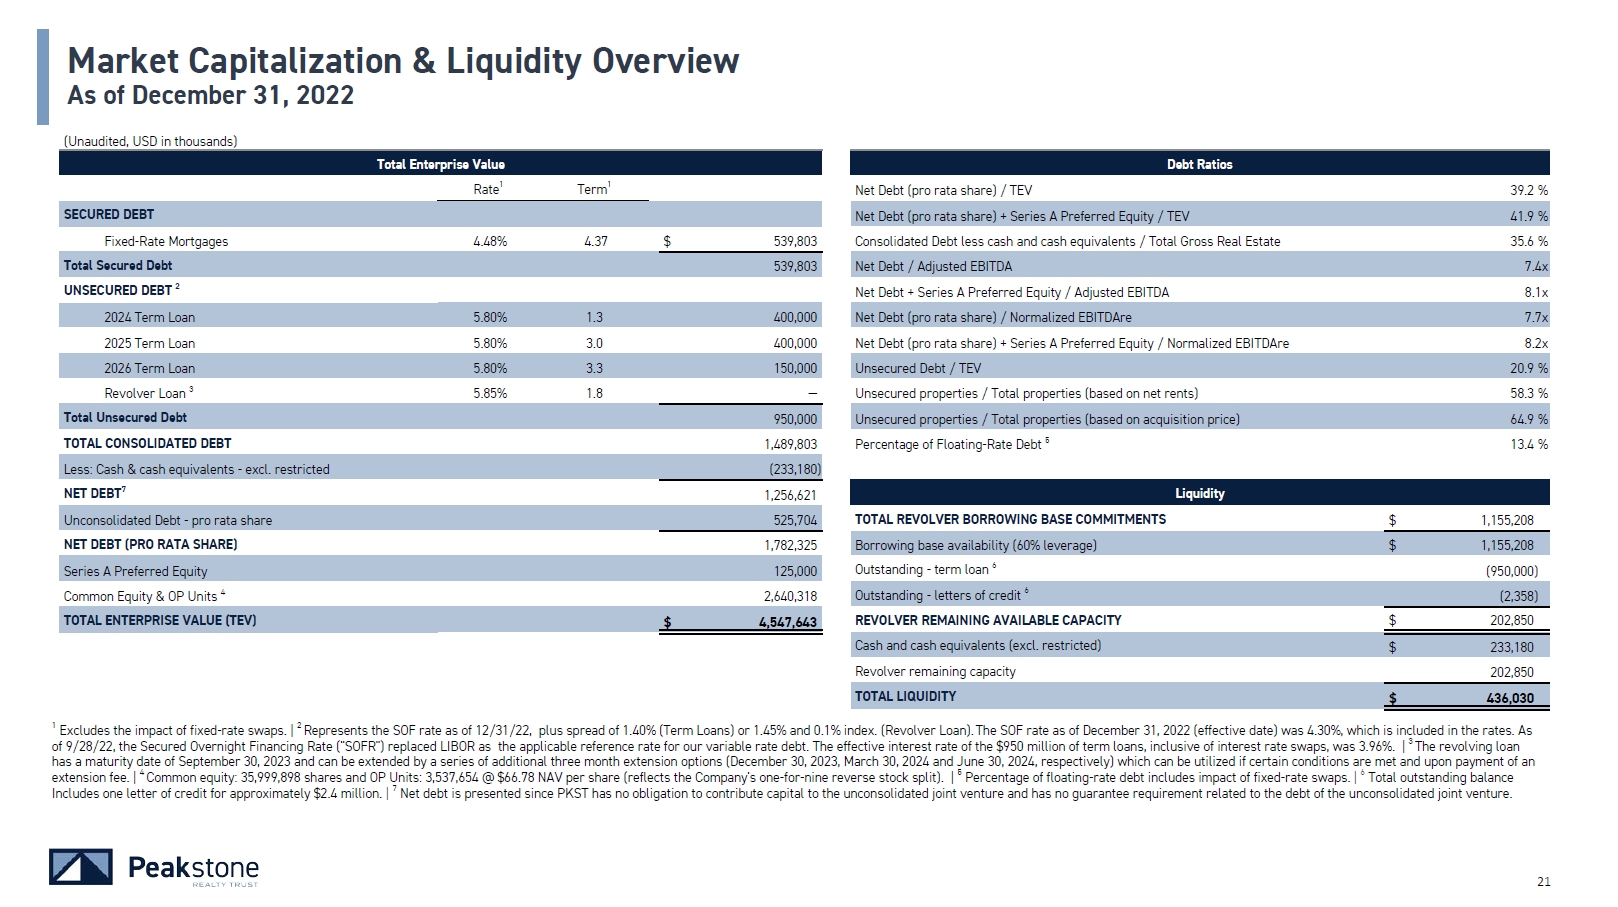
1 Excludes the impact of fixed-rate swaps. | 2 Represents the SOF rate as of 12/31/22, plus spread of 1.40% (Term Loans) or 1.45% and 0.1% index. (Revolver Loan). The SOF rate as of December 31, 2022 (effective date) was 4.30%, which is included in the rates. As of 9/28/22, the Secured Overnight Financing Rate ("SOFR") replaced LIBOR as the applicable reference rate for our variable rate debt. | 3 The revolving loan has a maturity date of September 30, 2023 and can be extended by a series of additional three month extension options (December 30, 2023, March 30, 2024 and June 30, 2024, respectively) which can be utilized if certain conditions are met and upon payment of an extension fee. | 4 Common equity: 35,999,898 shares and OP Units: 3,537,654 @ $66.78 NAV per share (reflects the Company's one-for-nine reverse stock split). | 5 Percentage of floating-rate debt includes impact of fixed-rate swaps. | 6 Total outstanding balance Includes one letter of credit for approximately $2.4 million. | 7 Net debt is presented since PKST has no obligation to contribute capital to the unconsolidated joint venture and has no guarantee requirement related to the debt of the unconsolidated joint venture. Net Debt (pro rata share) + Series A Preferred Equity / TEV 41.9 % Consolidated Debt less cash and cash equivalents / Total Gross Real Estate 35.6 % Net Debt / Adjusted EBITDA 7.4x Net Debt + Series A Preferred Equity / Adjusted EBITDA 8.1x Net Debt (pro rata share) / Normalized EBITDAre 7.7x Net Debt (pro rata share) + Series A Preferred Equity / Normalized EBITDAre 8.2x Unsecured Debt / TEV 20.9 % Unsecured properties / Total properties (based on net rents) 58.3 % Unsecured properties / Total properties (based on acquisition price) 64.9 % Percentage of Floating-Rate Debt 5 13.4 % Total Enterprise Value Debt Ratios Rate1 Term1 Net Debt (pro rata share) / TEV 39.2 % Liquidity TOTAL REVOLVER BORROWING BASE COMMITMENTS $ 1,155,208 SECURED DEBT Fixed-Rate Mortgages 4.48% 4.37 $ 539,803 Total Secured Debt 539,803 UNSECURED DEBT 2 2024 Term Loan 5.80% 1.3 400,000 2025 Term Loan 5.80% 3.0 400,000 2026 Term Loan 5.80% 3.3 150,000 Revolver Loan 3 5.85% 1.8 — Total Unsecured Debt 950,000 TOTAL CONSOLIDATED DEBT 1,489,803 Less: Cash & cash equivalents - excl. restricted (233,180) NET DEBT7 1,256,621 Unconsolidated Debt - pro rata share 525,704 NET DEBT (PRO RATA SHARE) 1,782,325 Series A Preferred Equity 125,000 Common Equity & OP Units 4 2,640,318 TOTAL ENTERPRISE VALUE (TEV) $ 4,547,643 Borrowing base availability (60% leverage) $ 1,155,208 Outstanding - term loan 6 (950,000) Outstanding - letters of credit 6 (2,358) REVOLVER REMAINING AVAILABLE CAPACITY $ 202,850 Cash and cash equivalents (excl. restricted) $ 233,180 Revolver remaining capacity 202,850 TOTAL LIQUIDITY $ 436,030 Market Capitalization & Liquidity Overview 21 As of December 31, 2022 (Unaudited, USD in thousands)

12/31/2022 9/30/2022 As of 6/30/2022 3/31/2022 12/31/2021 (Unaudited, USD in thousands) SECURED FIXED-RATE DEBT Mortgage borrowings on wholly owned portfolio $ 539,803 $ 541,689 $ 1,013,410 $ 1,015,816 $ 1,018,015 Total Secured Fixed-Rate Debt 539,803 541,689 1,013,410 1,015,816 1,018,015 UNSECURED FLOATING-RATE DEBT Revolving Credit Facility: Revolver Loan — — 373,500 373,500 373,500 2023 Term Loan — — 200,000 200,000 200,000 2024 Term Loan 400,000 400,000 400,000 400,000 400,000 2025 Term Loan 400,000 400,000 400,000 400,000 400,000 2026 Term Loan 150,000 150,000 150,000 150,000 150,000 Total Unsecured Floating-Rate Debt 950,000 950,000 1,523,500 1,523,500 1,523,500 TOTAL CONSOLIDATED DEBT $ 1,489,803 $ 1,491,689 $ 2,536,910 $ 2,539,316 $ 2,541,515 Net Debt (pro rata share) to Enterprise Value ratio 39.2 % 40.4 % 45.7 % 41.1 % 41.3 % Fixed charge coverage (pro rata share)1 2.0x 2.2x 3.4x 3.3x 3.1x Fixed charge coverage (consolidated) 2.2x 2.2x 3.4x 3.3x 3.1x Unsecured leverage ratio 20.9 % 21.0 % 30.0 % 26.6 % 26.5 % Interest coverage ratio (pro rata share)1 2.2x 2.7x 3.9x 3.9x 4.0x Interest coverage ratio (consolidated) 2.8x 2.7x 3.9x 3.9x 4.0x 21 1Joint venture reporting commenced in Q4'22 due to Office Joint Venture forming in Q3'22 and one quarter reporting lag. Debt Summary
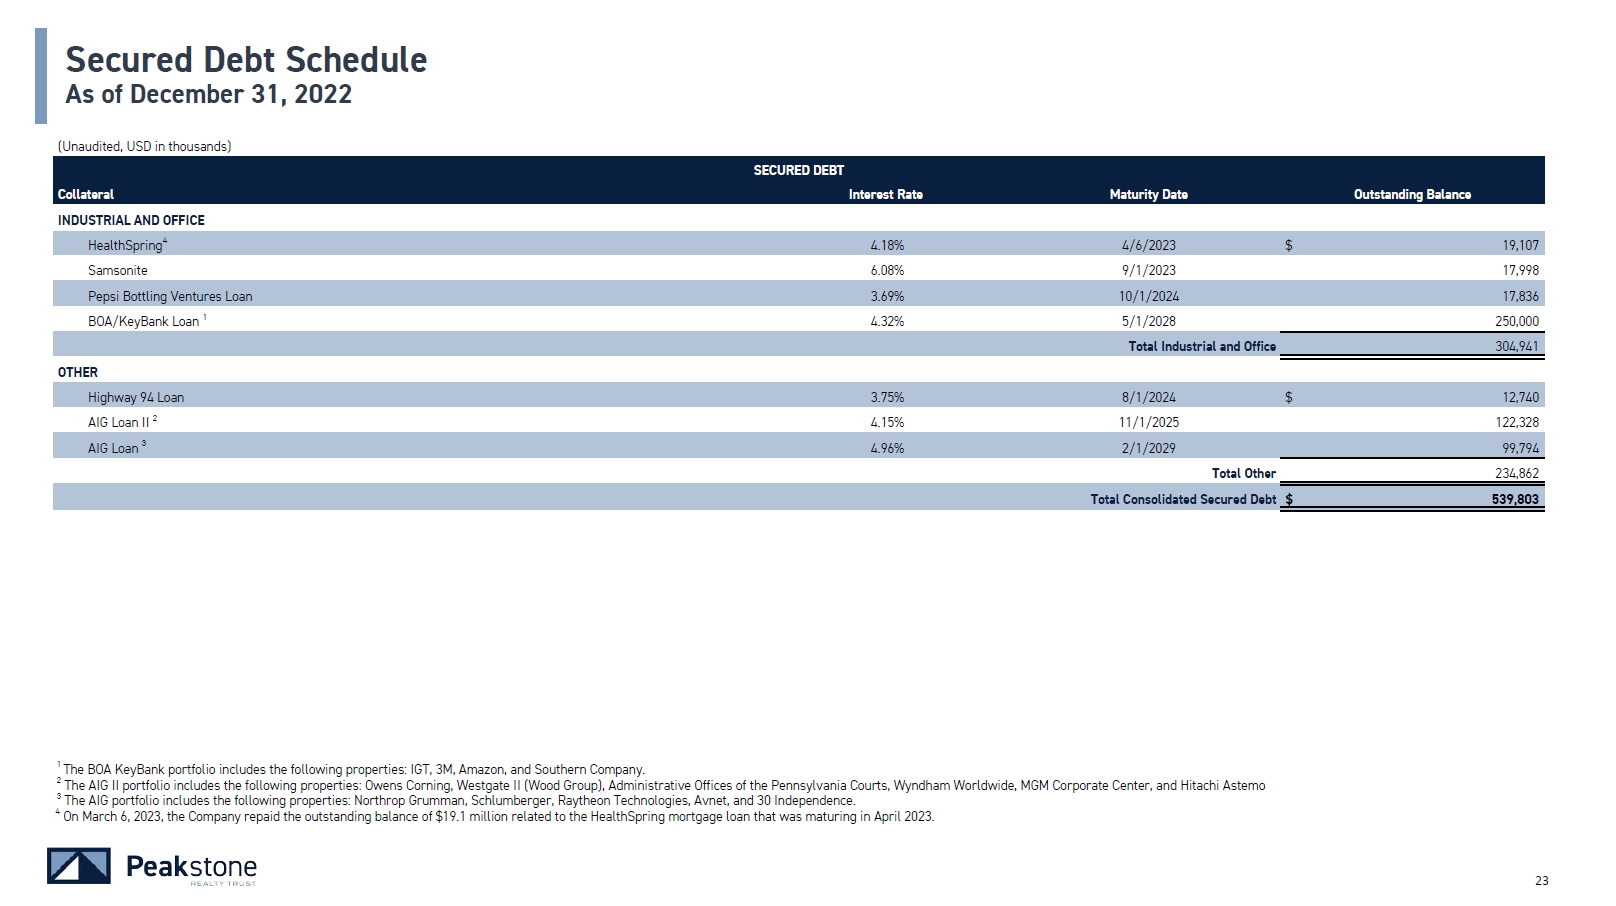
(Unaudited, USD in thousands) Collateral SECURED DEBT Interest Rate Maturity Date Outstanding Balance INDUSTRIAL AND OFFICE HealthSpring4 4.18% 4/6/2023 $ 19,107 Samsonite 6.08% 9/1/2023 17,998 Pepsi Bottling Ventures Loan 3.69% 10/1/2024 17,836 BOA/KeyBank Loan 1 4.32% 5/1/2028 250,000 Total Industrial and Office 304,941 OTHER Highway 94 Loan 3.75% 8/1/2024 $ 12,740 AIG Loan II 2 4.15% 11/1/2025 122,328 AIG Loan 3 4.96% 2/1/2029 99,794 Total Other 234,862 Total Consolidated Secured Debt $ 539,803 1 The BOA KeyBank portfolio includes the following properties: IGT, 3M, Amazon, and Southern Company. 2 The AIG II portfolio includes the following properties: Owens Corning, Westgate II (Wood Group), Administrative Offices of the Pennsylvania Courts, Wyndham Worldwide, MGM Corporate Center, and Hitachi Astemo 3 The AIG portfolio includes the following properties: Northrop Grumman, Schlumberger, Raytheon Technologies, Avnet, and 30 Independence. 4 On March 6, 2023, the Company repaid the outstanding balance of $19.1 million related to the HealthSpring mortgage loan that was maturing in April 2023. 21 Secured Debt Schedule As of December 31, 2022
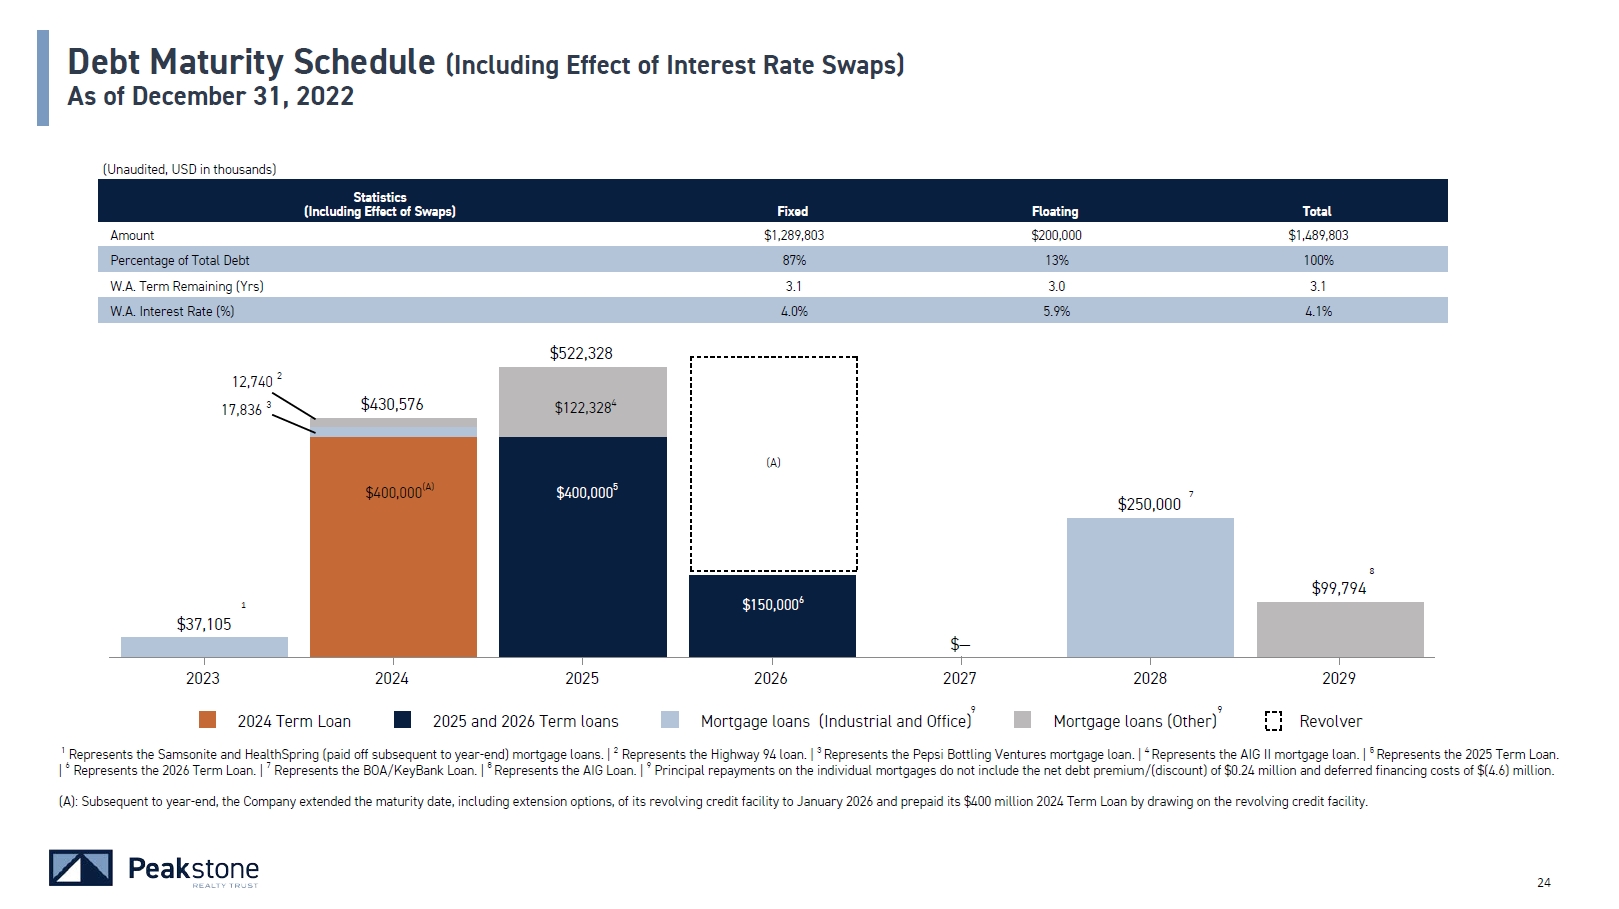
$37,105 $— $430,576 $522,328 $99,794 2023 2024 2025 2026 2027 2028 2029 (Unaudited, USD in thousands) Statistics (Including Effect of Swaps) Fixed Floating Total Amount $1,289,803 $200,000 $1,489,803 Percentage of Total Debt 87% 13% 100% W.A. Term Remaining (Yrs) 3.1 3.0 3.1 W.A. Interest Rate (%) 4.0% 5.9% 4.1% 7 $250,000 8 $122,3284 $400,0005 $400,000(A) 1 12,740 2 17,836 3 Debt Maturity Schedule (Including Effect of Interest Rate Swaps) As of December 31, 2022 $150,0006 (A) 9 9 2024 Term Loan 2025 and 2026 Term loans Mortgage loans (Industrial and Office) Mortgage loans (Other) Revolver 1 Represents the Samsonite and HealthSpring (paid off subsequent to year-end) mortgage loans. | 2 Represents the Highway 94 loan. | 3 Represents the Pepsi Bottling Ventures mortgage loan. | 4 Represents the AIG II mortgage loan. | 5 Represents the 2025 Term Loan. | 6 Represents the 2026 Term Loan. | 7 Represents the BOA/KeyBank Loan. | 8 Represents the AIG Loan. | 9 Principal repayments on the individual mortgages do not include the net debt premium/(discount) of $0.24 million and deferred financing costs of $(4.6) million. (A): Subsequent to year-end, the Company extended the maturity date, including extension options, of its revolving credit facility to January 2026 and prepaid its $400 million 2024 Term Loan by drawing on the revolving credit facility. 21
Leasing Activity & Asset Management
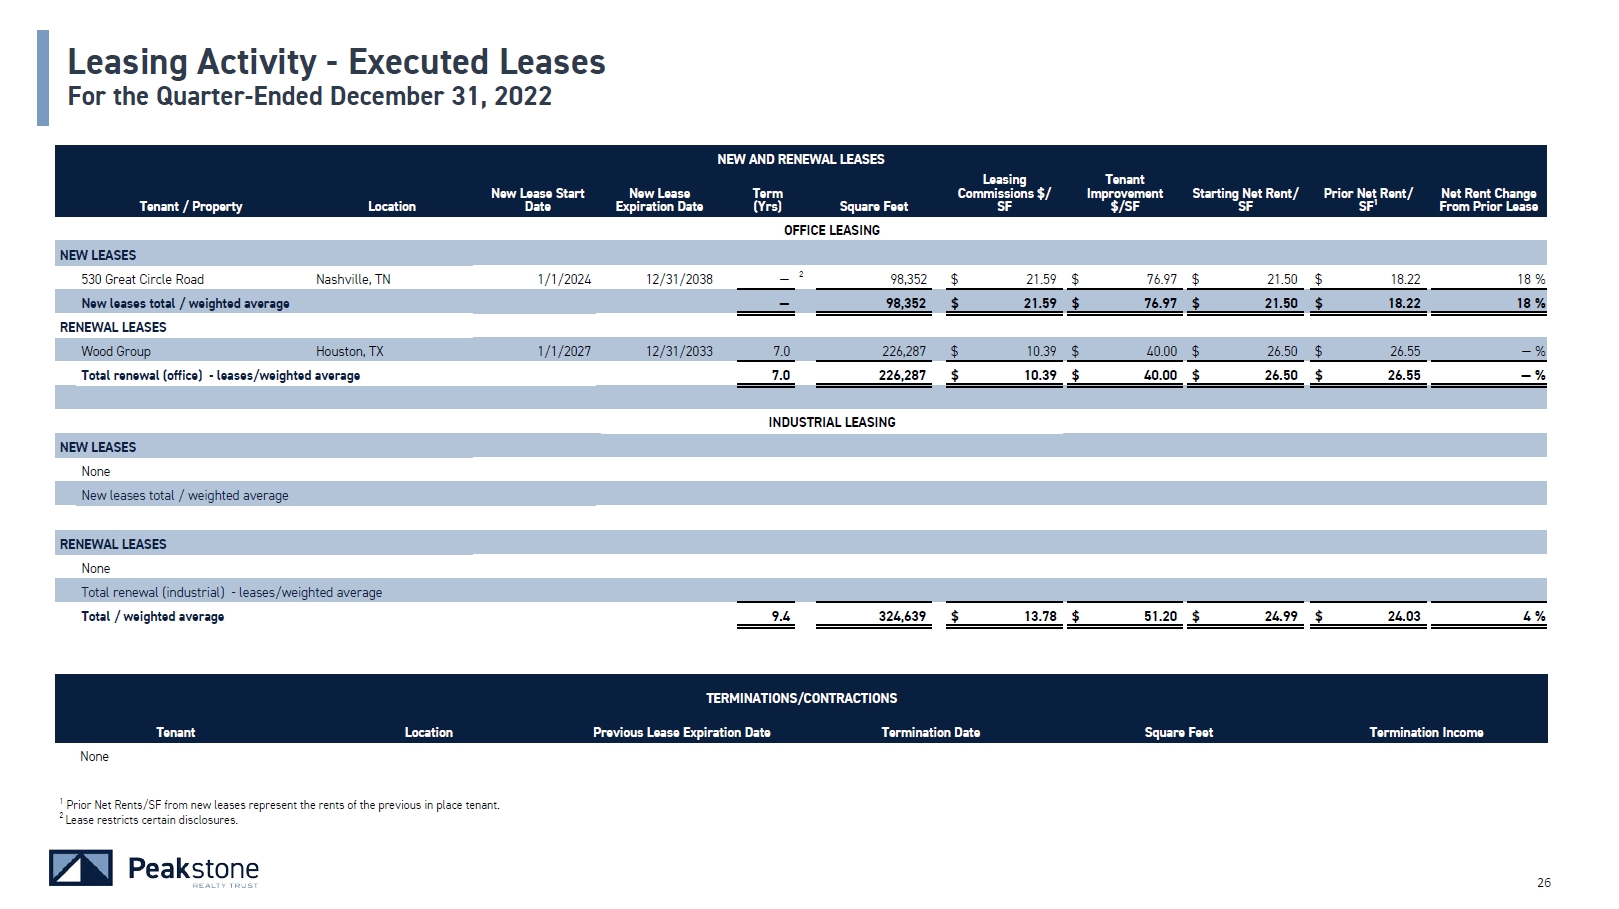
NEW LEASES 530 Great Circle Road Nashville, TN 1/1/2024 12/31/2038 — 2 98,352 $ 21.59 $ 76.97 $ 21.50 $ 18.22 18 % New leases total / weighted average — 98,352 $ 21.59 $ 76.97 $ 21.50 $ 18.22 18 % RENEWAL LEASES Wood Group Houston, TX 1/1/2027 12/31/2033 7.0 226,287 $ 10.39 $ 40.00 $ 26.50 $ 26.55 — % Total renewal (office) - leases/weighted average 7.0 226,287 $ 10.39 $ 40.00 $ 26.50 $ 26.55 — % NEW AND RENEWAL LEASES Tenant / Property Location New Lease Start New Lease Date Expiration Date Term (Yrs) Square Feet Leasing Commissions $/ SF Tenant Improvement $/SF Starting Net Rent/ SF Prior Net Rent/ SF1 Net Rent Change From Prior Lease OFFICE LEASING INDUSTRIAL LEASING NEW LEASES None New leases total / weighted average RENEWAL LEASES None Total renewal (industrial) - leases/weighted average Total / weighted average 9.4 324,639 $ 13.78 $ 51.20 $ 24.99 $ 24.03 4 % Tenant 26 Location TERMINATIONS/CONTRACTIONS Previous Lease Expiration Date Termination Date Square Feet Termination Income None 1 Prior Net Rents/SF from new leases represent the rents of the previous in place tenant. 2 Lease restricts certain disclosures. Leasing Activity - Executed Leases For the Quarter-Ended December 31, 2022
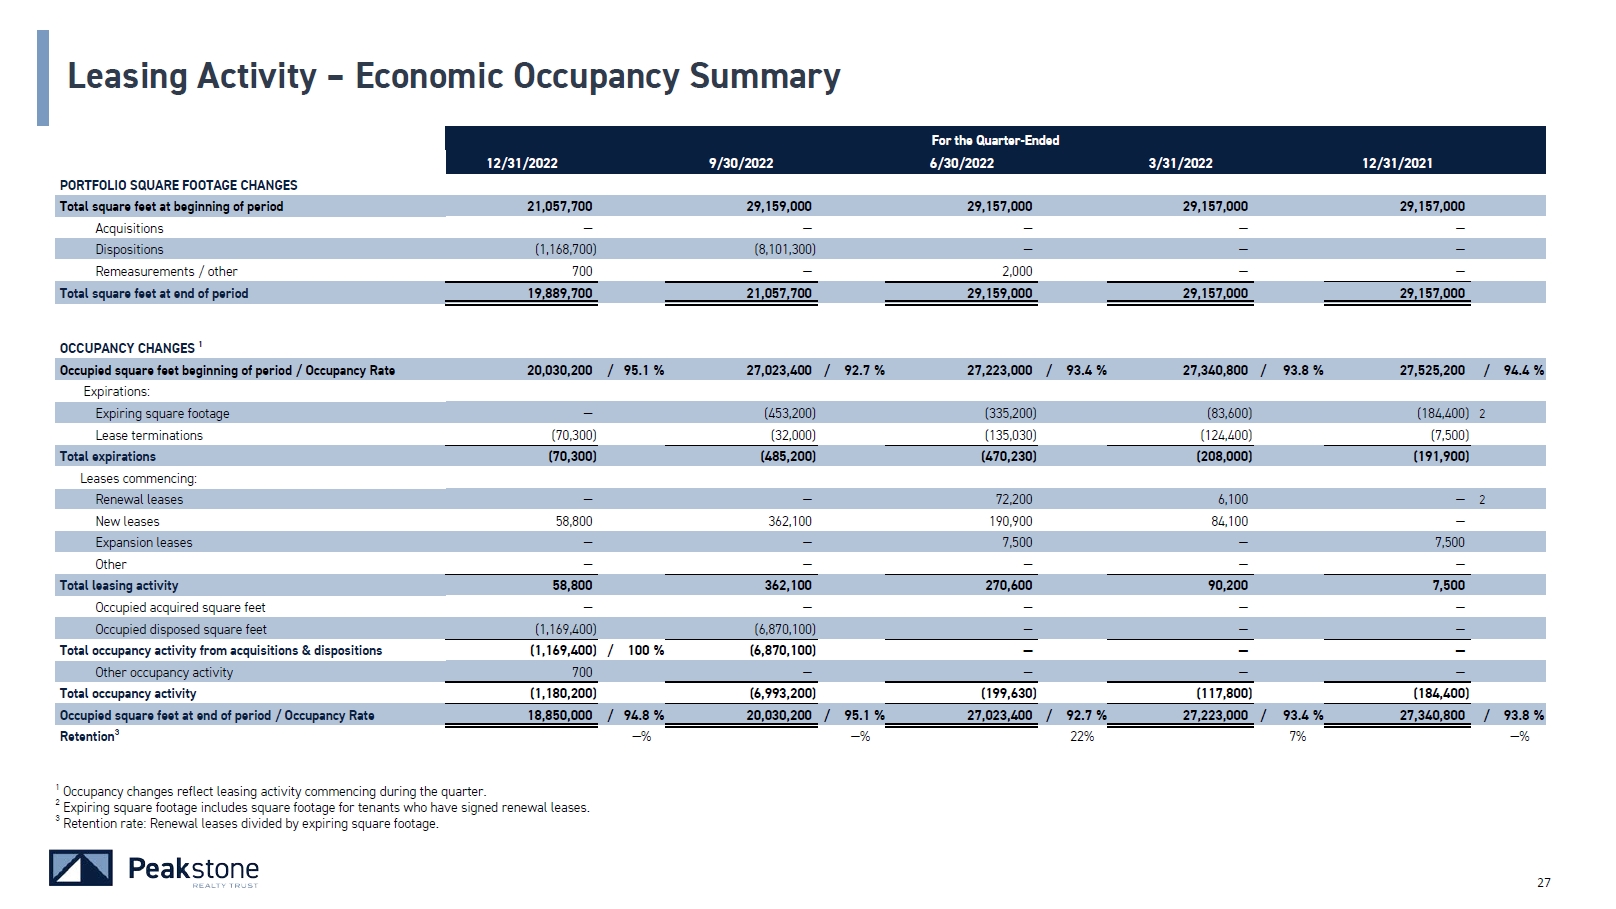
1 Occupancy changes reflect leasing activity commencing during the quarter. 2 Expiring square footage includes square footage for tenants who have signed renewal leases. 3 Retention rate: Renewal leases divided by expiring square footage. 26 For the Quarter-Ended 12/31/2022 9/30/2022 6/30/2022 3/31/2022 12/31/2021 PORTFOLIO SQUARE FOOTAGE CHANGES Total square feet at beginning of period 21,057,700 29,159,000 29,157,000 29,157,000 29,157,000 Acquisitions — — — — — Dispositions (1,168,700) (8,101,300) — — — Remeasurements / other 700 — 2,000 — — Total square feet at end of period 19,889,700 21,057,700 29,159,000 29,157,000 29,157,000 OCCUPANCY CHANGES 1 Occupied square feet beginning of period / Occupancy Rate 20,030,200 / 95.1 % 27,023,400 / 92.7 % 27,223,000 / 93.4 % 27,340,800 / 93.8 % 27,525,200 / 94.4 % Expirations: Expiring square footage — (453,200) (335,200) (83,600) (184,400) 2 Lease terminations (70,300) (32,000) (135,030) (124,400) (7,500) Total expirations (70,300) (485,200) (470,230) (208,000) (191,900) Leases commencing: Renewal leases — — 72,200 6,100 — 2 New leases 58,800 362,100 190,900 84,100 — Expansion leases — — 7,500 — 7,500 Other — — — — — Total leasing activity 58,800 362,100 270,600 90,200 7,500 Occupied acquired square feet — — — — — Occupied disposed square feet (1,169,400) (6,870,100) — — — Total occupancy activity from acquisitions & dispositions (1,169,400) / 100 % (6,870,100) — — — Other occupancy activity 700 — — — — Total occupancy activity (1,180,200) (6,993,200) (199,630) (117,800) (184,400) Occupied square feet at end of period / Occupancy Rate 18,850,000 / 94.8 % 20,030,200 / 95.1 % 27,023,400 / 92.7 % 27,223,000 / 93.4 % 27,340,800 / 93.8 % Retention3 —% —% 22% 7% —% Leasing Activity – Economic Occupancy Summary
NAV Component Summary
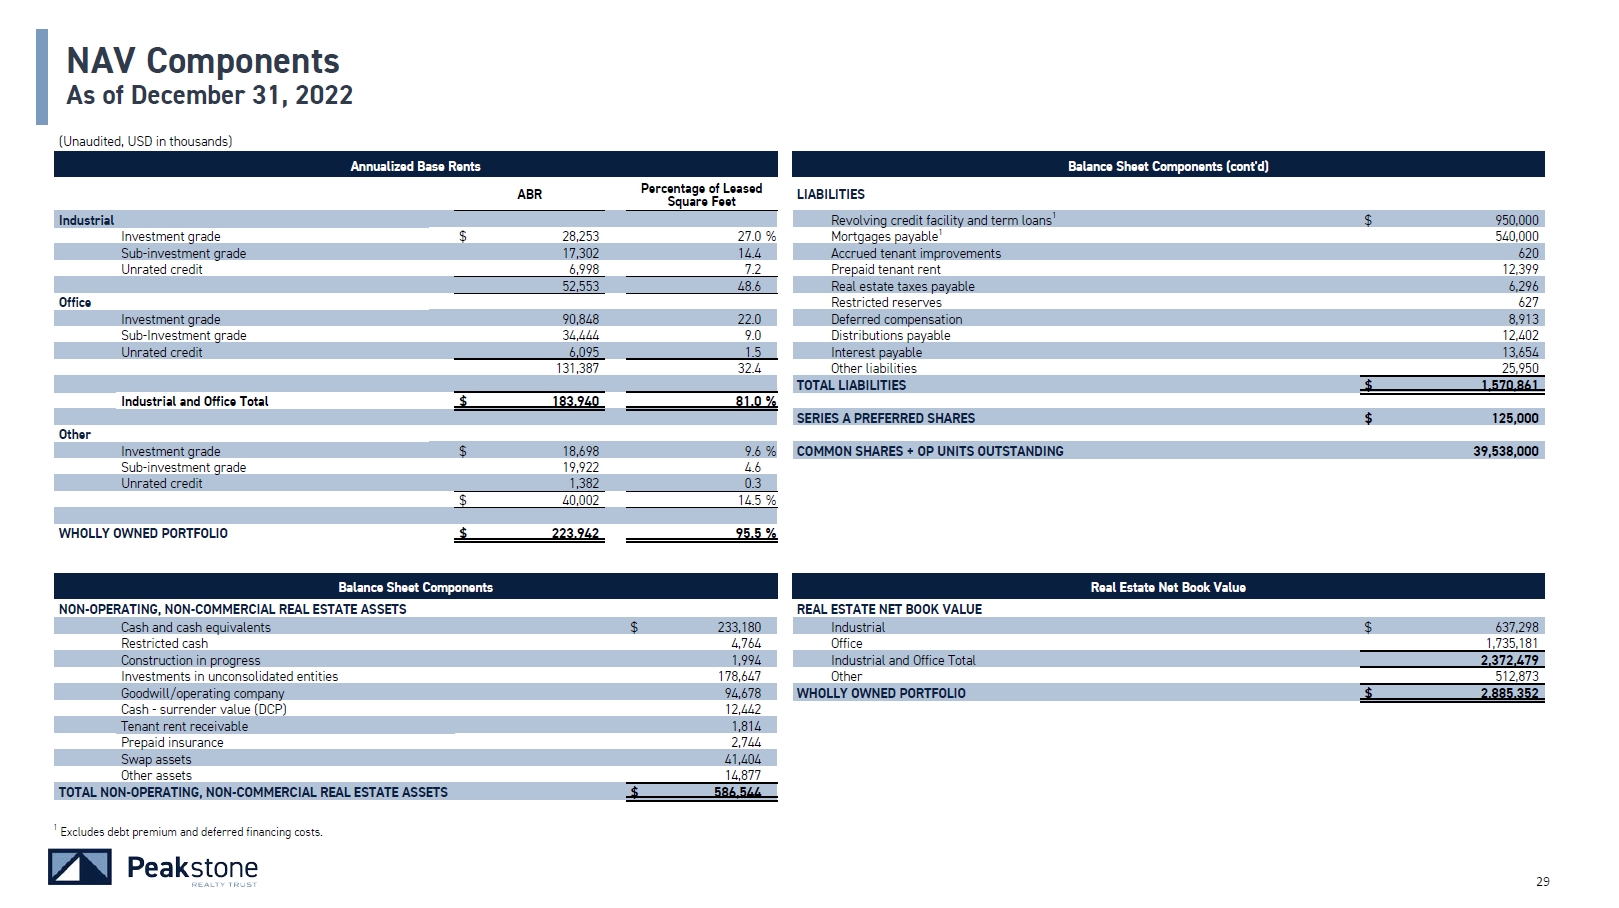
29 Annualized Base Rents Balance Sheet Components (cont'd) ABR Percentage of Leased Square Feet LIABILITIES Industrial Revolving credit facility and term loans1 $ 950,000 Investment grade $ 28,253 27.0 % Mortgages payable1 540,000 WHOLLY OWNED PORTFOLIO $ 223,942 95.5 % Balance Sheet Components Real Estate Net Book Value NON-OPERATING, NON-COMMERCIAL REAL ESTATE ASSETS REAL ESTATE NET BOOK VALUE Sub-investment grade 17,302 14.4 Accrued tenant improvements 620 Unrated credit 6,998 7.2 Prepaid tenant rent 12,399 52,553 48.6 Real estate taxes payable 6,296 Office Restricted reserves 627 Investment grade 90,848 22.0 Deferred compensation 8,913 Sub-Investment grade 34,444 9.0 Distributions payable 12,402 Unrated credit 6,095 1.5 Interest payable 13,654 131,387 32.4 Other liabilities 25,950 TOTAL LIABILITIES $ 1,570,861 Industrial and Office Total $ 183,940 81.0 % SERIES A PREFERRED SHARES $ 125,000 Other Investment grade $ 18,698 9.6 % COMMON SHARES + OP UNITS OUTSTANDING 39,538,000 Sub-investment grade 19,922 4.6 Unrated credit 1,382 0.3 $ 40,002 14.5 % Cash and cash equivalents $ 233,180 Industrial $ 637,298 Restricted cash 4,764 Office 1,735,181 Construction in progress 1,994 Industrial and Office Total 2,372,479 Investments in unconsolidated entities 178,647 Other 512,873 Goodwill/operating company 94,678 WHOLLY OWNED PORTFOLIO $ 2,885,352 Cash - surrender value (DCP) 12,442 Tenant rent receivable 1,814 Prepaid insurance 2,744 Swap assets 41,404 Other assets 14,877 TOTAL NON-OPERATING, NON-COMMERCIAL REAL ESTATE ASSETS $ 586,544 1 Excludes debt premium and deferred financing costs. NAV Components As of December 31, 2022 (Unaudited, USD in thousands)
Property Information
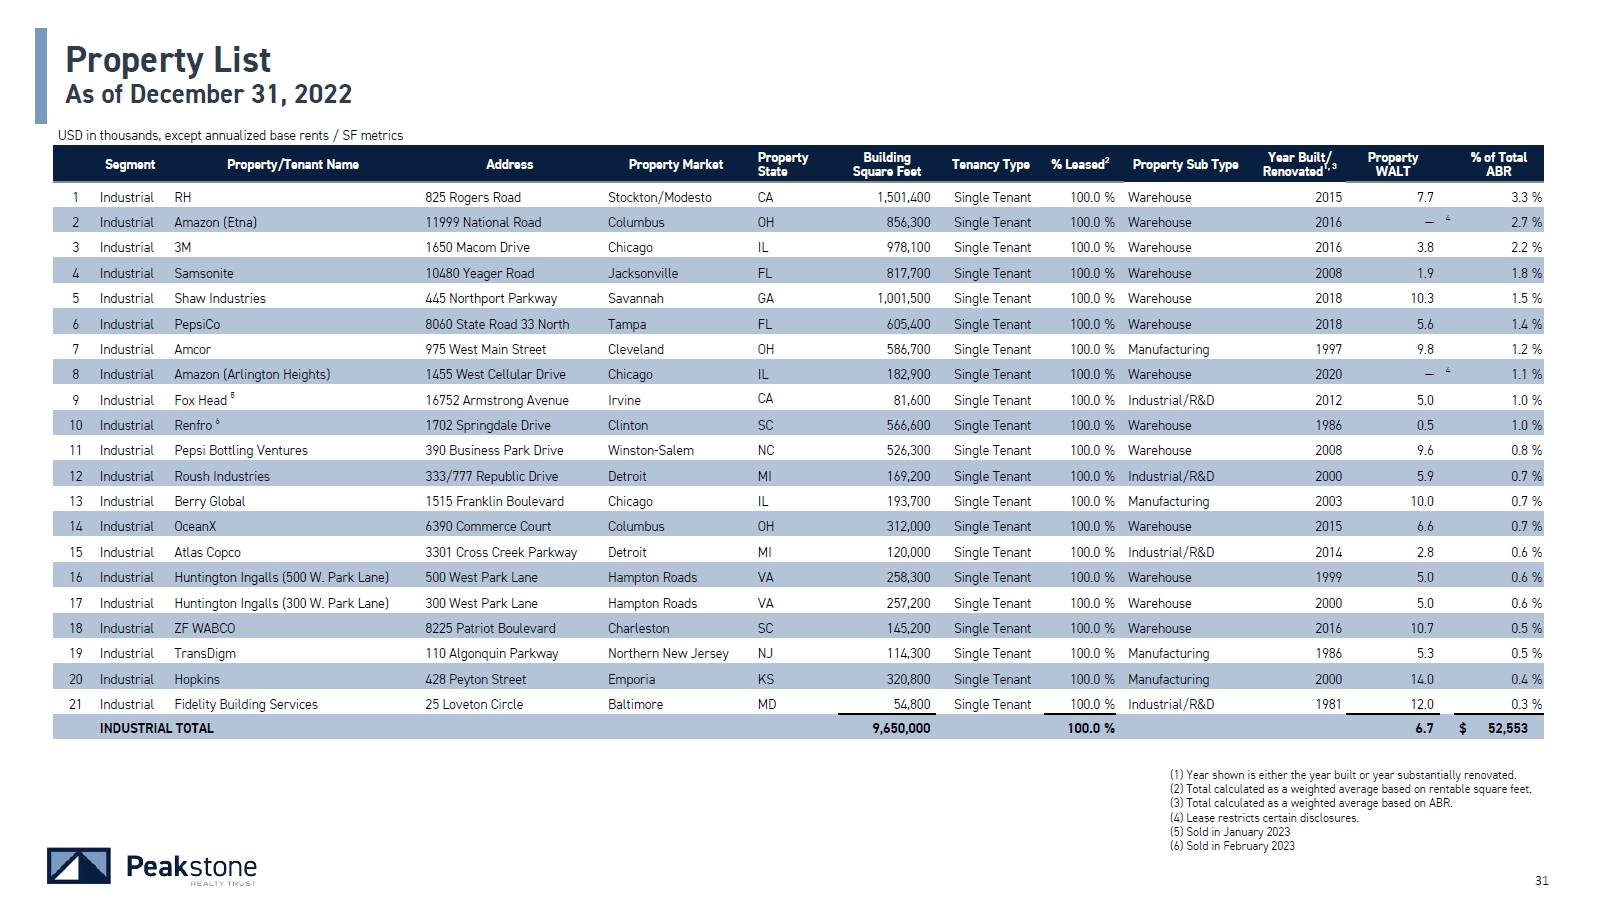
3 Industrial 3M 1650 Macom Drive Chicago IL 978,100 Single Tenant 100.0 % Warehouse 2016 3.8 2.2 % 4 Industrial Samsonite 10480 Yeager Road Jacksonville FL 817,700 Single Tenant 100.0 % Warehouse 2008 1.9 1.8 % 5 Industrial Shaw Industries 445 Northport Parkway Savannah GA 1,001,500 Single Tenant 100.0 % Warehouse 2018 10.3 1.5 % 6 Industrial PepsiCo 8060 State Road 33 North Tampa FL 605,400 Single Tenant 100.0 % Warehouse 2018 5.6 1.4 % 7 Industrial Amcor 975 West Main Street Cleveland OH 586,700 Single Tenant 100.0 % Manufacturing 1997 9.8 1.2 % 8 Industrial Amazon (Arlington Heights) 1455 West Cellular Drive Chicago IL 182,900 Single Tenant 100.0 % Warehouse 2020 — 4 1.1 % 9 Industrial Fox Head 5 16752 Armstrong Avenue Irvine CA 81,600 Single Tenant 100.0 % Industrial/R&D 2012 5.0 1.0 % 10 Industrial Renfro 6 1702 Springdale Drive Clinton SC 566,600 Single Tenant 100.0 % Warehouse 1986 0.5 1.0 % 11 Industrial Pepsi Bottling Ventures 390 Business Park Drive Winston-Salem NC 526,300 Single Tenant 100.0 % Warehouse 2008 9.6 0.8 % 12 Industrial Roush Industries 333/777 Republic Drive Detroit MI 169,200 Single Tenant 100.0 % Industrial/R&D 2000 5.9 0.7 % 13 Industrial Berry Global 1515 Franklin Boulevard Chicago IL 193,700 Single Tenant 100.0 % Manufacturing 2003 10.0 0.7 % 14 Industrial OceanX 6390 Commerce Court Columbus OH 312,000 Single Tenant 100.0 % Warehouse 2015 6.6 0.7 % 15 Industrial Atlas Copco 3301 Cross Creek Parkway Detroit MI 120,000 Single Tenant 100.0 % Industrial/R&D 2014 2.8 0.6 % 16 Industrial Huntington Ingalls (500 W. Park Lane) 500 West Park Lane Hampton Roads VA 258,300 Single Tenant 100.0 % Warehouse 1999 5.0 0.6 % 17 Industrial Huntington Ingalls (300 W. Park Lane) 300 West Park Lane Hampton Roads VA 257,200 Single Tenant 100.0 % Warehouse 2000 5.0 0.6 % 18 Industrial ZF WABCO 8225 Patriot Boulevard Charleston SC 145,200 Single Tenant 100.0 % Warehouse 2016 10.7 0.5 % 19 Industrial TransDigm 110 Algonquin Parkway Northern New Jersey NJ 114,300 Single Tenant 100.0 % Manufacturing 1986 5.3 0.5 % 20 Industrial Hopkins 428 Peyton Street Emporia KS 320,800 Single Tenant 100.0 % Manufacturing 2000 14.0 0.4 % 21 Industrial Fidelity Building Services 25 Loveton Circle Baltimore MD 54,800 Single Tenant 100.0 % Industrial/R&D 1981 12.0 0.3 % INDUSTRIAL TOTAL 9,650,000 100.0 % 6.7 $ 52,553 Address Property Market Property State Building Square Feet Property Sub Type Renovated Year Built/ 1, 3 Property WALT % of Total ABR 825 Rogers Road Stockton/Modesto CA 1,501,400 Warehouse 2015 7.7 3.3 % 11999 National Road Columbus OH 856,300 Tenancy Type % Leased2 Single Tenant 100.0 % Single Tenant 100.0 % Warehouse 2016 — 4 2.7 % Year shown is either the year built or year substantially renovated. Total calculated as a weighted average based on rentable square feet. Total calculated as a weighted average based on ABR. Lease restricts certain disclosures. Sold in January 2023 Sold in February 2023 31 Property List As of December 31, 2022 USD in thousands, except annualized base rents / SF metrics Segment Property/Tenant Name Industrial RH Industrial Amazon (Etna)
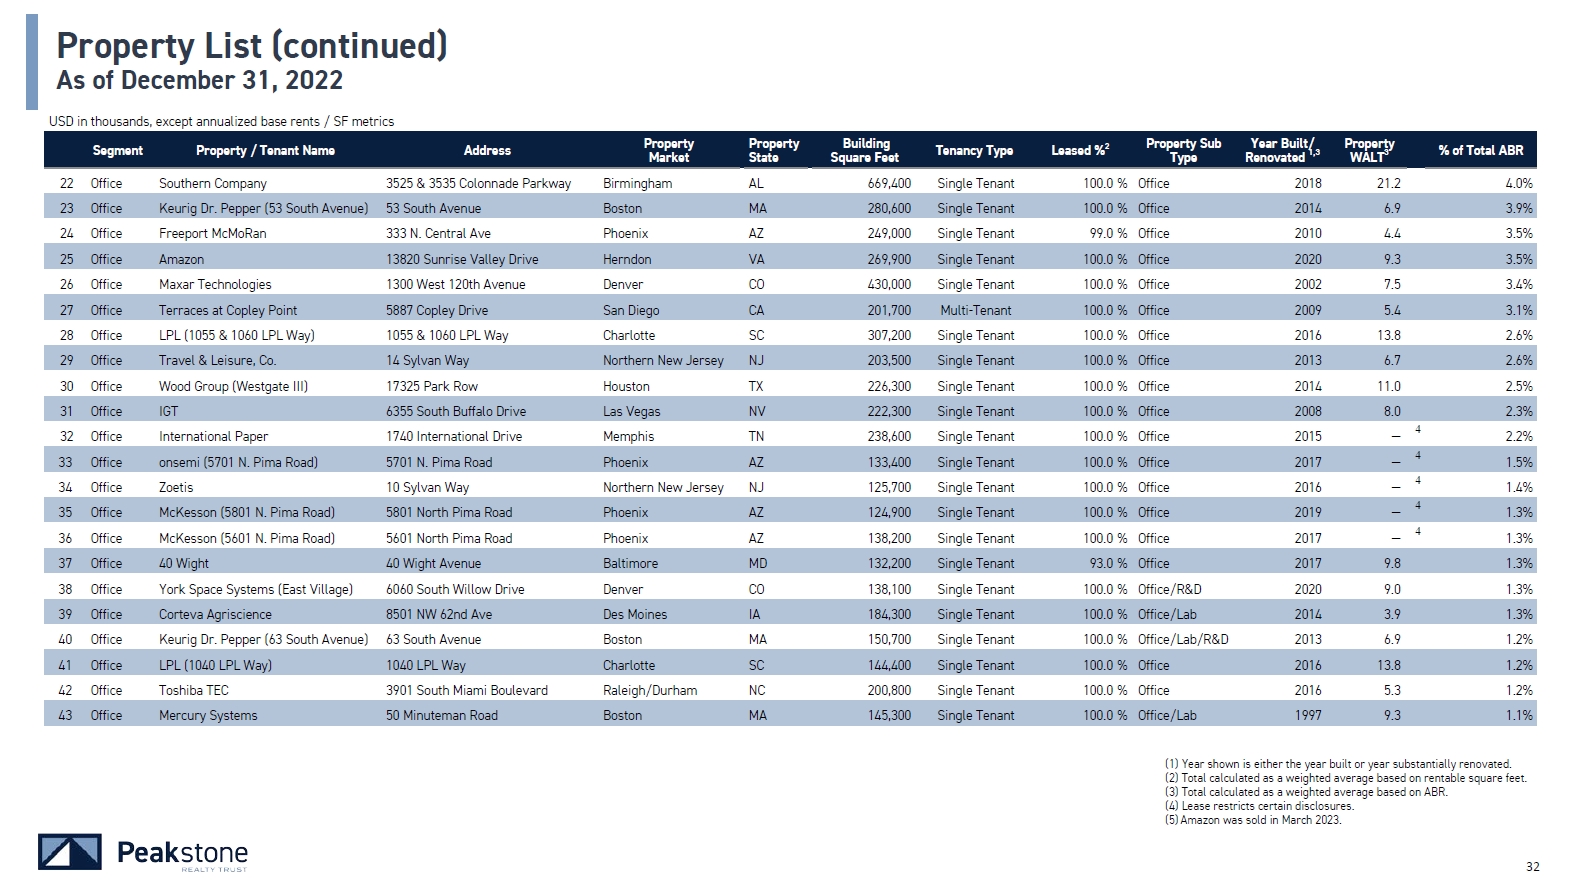
23 Office Keurig Dr. Pepper (53 South Avenue) 53 South Avenue Boston MA 280,600 Single Tenant 100.0 % Office 2014 6.9 3.9% 24 Office Freeport McMoRan 333 N. Central Ave Phoenix AZ 249,000 Single Tenant 99.0 % Office 2010 4.4 3.5% 25 Office Amazon 13820 Sunrise Valley Drive Herndon VA 269,900 Single Tenant 100.0 % Office 2020 9.3 3.5% 26 Office Maxar Technologies 1300 West 120th Avenue Denver CO 430,000 Single Tenant 100.0 % Office 2002 7.5 3.4% 27 Office Terraces at Copley Point 5887 Copley Drive San Diego CA 201,700 Multi-Tenant 100.0 % Office 2009 5.4 3.1% 28 Office LPL (1055 & 1060 LPL Way) 1055 & 1060 LPL Way Charlotte SC 307,200 Single Tenant 100.0 % Office 2016 13.8 2.6% 29 Office Travel & Leisure, Co. 14 Sylvan Way Northern New Jersey NJ 203,500 Single Tenant 100.0 % Office 2013 6.7 2.6% 30 Office Wood Group (Westgate III) 17325 Park Row Houston TX 226,300 Single Tenant 100.0 % Office 2014 11.0 2.5% 31 Office IGT 6355 South Buffalo Drive Las Vegas NV 222,300 Single Tenant 100.0 % Office 2008 8.0 2.3% 32 Office International Paper 1740 International Drive Memphis TN 238,600 Single Tenant 100.0 % Office 2015 7.0+ 4 2.2% 33 Office onsemi (5701 N. Pima Road) 5701 N. Pima Road Phoenix AZ 133,400 Single Tenant 100.0 % Office 2017 — 4 1.5% 34 Office Zoetis 10 Sylvan Way Northern New Jersey NJ 125,700 Single Tenant 100.0 % Office 2016 — 4 1.4% 35 Office McKesson (5801 N. Pima Road) 5801 North Pima Road Phoenix AZ 124,900 Single Tenant 100.0 % Office 2019 — 4 1.3% 36 Office McKesson (5601 N. Pima Road) 5601 North Pima Road Phoenix AZ 138,200 Single Tenant 100.0 % Office 2017 — 4 1.3% 37 Office 40 Wight 40 Wight Avenue Baltimore MD 132,200 Single Tenant 93.0 % Office 2017 9.8 1.3% 38 Office York Space Systems (East Village) 6060 South Willow Drive Denver CO 138,100 Single Tenant 100.0 % Office/R&D 2020 9.0 1.3% 39 Office Corteva Agriscience 8501 NW 62nd Ave Des Moines IA 184,300 Single Tenant 100.0 % Office/Lab 2014 3.9 1.3% 40 Office Keurig Dr. Pepper (63 South Avenue) 63 South Avenue Boston MA 150,700 Single Tenant 100.0 % Office/Lab/R&D 2013 6.9 1.2% 41 Office LPL (1040 LPL Way) 1040 LPL Way Charlotte SC 144,400 Single Tenant 100.0 % Office 2016 13.8 1.2% 42 Office Toshiba TEC 3901 South Miami Boulevard Raleigh/Durham NC 200,800 Single Tenant 100.0 % Office 2016 5.3 1.2% 43 Office Mercury Systems 50 Minuteman Road Boston MA 145,300 Single Tenant 100.0 % Office/Lab 1997 9.3 1.1% Address Property Market Property State Building Square Feet Tenancy Type Leased %2 Property Sub Type Renovated Year Built/ 1,3 WALT Property 3 % of Total ABR 22 Office Southern Company 3525 & 3535 Colonnade Parkway Birmingham AL 669,400 Single Tenant 100.0 % Office 2018 21.2 4.0% Property List (continued) 31 As of December 31, 2022 USD in thousands, except annualized base rents / SF metrics Segment Property / Tenant Name Year shown is either the year built or year substantially renovated. Total calculated as a weighted average based on rentable square feet. Total calculated as a weighted average based on ABR. Lease restricts certain disclosures. Amazon was sold in March 2023.
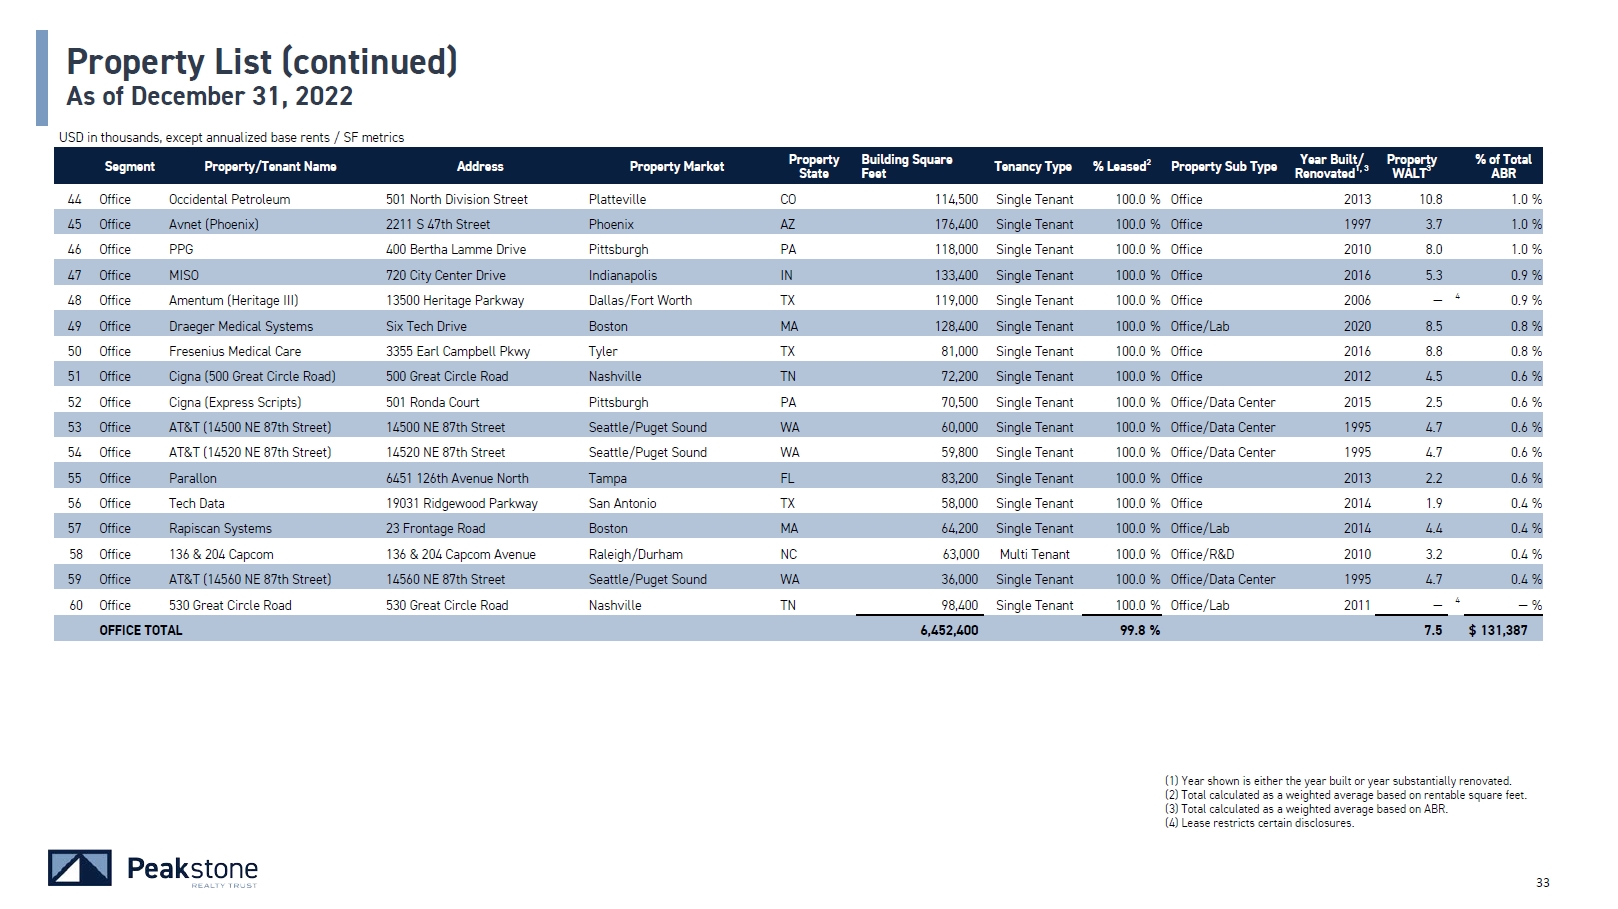
45 Office Avnet (Phoenix) 2211 S 47th Street Phoenix AZ 176,400 Single Tenant 100.0 % Office 1997 3.7 1.0 % 46 Office PPG 400 Bertha Lamme Drive Pittsburgh PA 118,000 Single Tenant 100.0 % Office 2010 8.0 1.0 % 47 Office MISO 720 City Center Drive Indianapolis IN 133,400 Single Tenant 100.0 % Office 2016 5.3 0.9 % 48 Office Amentum (Heritage III) 13500 Heritage Parkway Dallas/Fort Worth TX 119,000 Single Tenant 100.0 % Office 2006 — 4 0.9 % 49 Office Draeger Medical Systems Six Tech Drive Boston MA 128,400 Single Tenant 100.0 % Office/Lab 2020 8.5 0.8 % 50 Office Fresenius Medical Care 3355 Earl Campbell Pkwy Tyler TX 81,000 Single Tenant 100.0 % Office 2016 8.8 0.8 % 51 Office Cigna (500 Great Circle Road) 500 Great Circle Road Nashville TN 72,200 Single Tenant 100.0 % Office 2012 4.5 0.6 % 52 Office Cigna (Express Scripts) 501 Ronda Court Pittsburgh PA 70,500 Single Tenant 100.0 % Office/Data Center 2015 2.5 0.6 % 53 Office AT&T (14500 NE 87th Street) 14500 NE 87th Street Seattle/Puget Sound WA 60,000 Single Tenant 100.0 % Office/Data Center 1995 4.7 0.6 % 54 Office AT&T (14520 NE 87th Street) 14520 NE 87th Street Seattle/Puget Sound WA 59,800 Single Tenant 100.0 % Office/Data Center 1995 4.7 0.6 % 55 Office Parallon 6451 126th Avenue North Tampa FL 83,200 Single Tenant 100.0 % Office 2013 2.2 0.6 % 56 Office Tech Data 19031 Ridgewood Parkway San Antonio TX 58,000 Single Tenant 100.0 % Office 2014 1.9 0.4 % 57 Office Rapiscan Systems 23 Frontage Road Boston MA 64,200 Single Tenant 100.0 % Office/Lab 2014 4.4 0.4 % 58 Office 136 & 204 Capcom 136 & 204 Capcom Avenue Raleigh/Durham NC 63,000 Multi Tenant 100.0 % Office/R&D 2010 3.2 0.4 % 59 Office AT&T (14560 NE 87th Street) 14560 NE 87th Street Seattle/Puget Sound WA 36,000 Single Tenant 100.0 % Office/Data Center 1995 4.7 0.4 % 60 Office 530 Great Circle Road 530 Great Circle Road Nashville TN 98,400 Single Tenant 100.0 % Office/Lab 2011 — 4 — % OFFICE TOTAL 6,452,400 99.8 % 7.5 $ 131,387 31 Property Market Property State Building Square Feet Renovated WALT Year Built/ Property 1, 3 3 % of Total ABR Platteville CO 114,500 Tenancy Type % Leased2 Property Sub Type Single Tenant 100.0 % Office 2013 10.8 1.0 % Year shown is either the year built or year substantially renovated. Total calculated as a weighted average based on rentable square feet. Total calculated as a weighted average based on ABR. Lease restricts certain disclosures. Property List (continued) As of December 31, 2022 USD in thousands, except annualized base rents / SF metrics Segment Property/Tenant Name Address 44 Office Occidental Petroleum 501 North Division Street
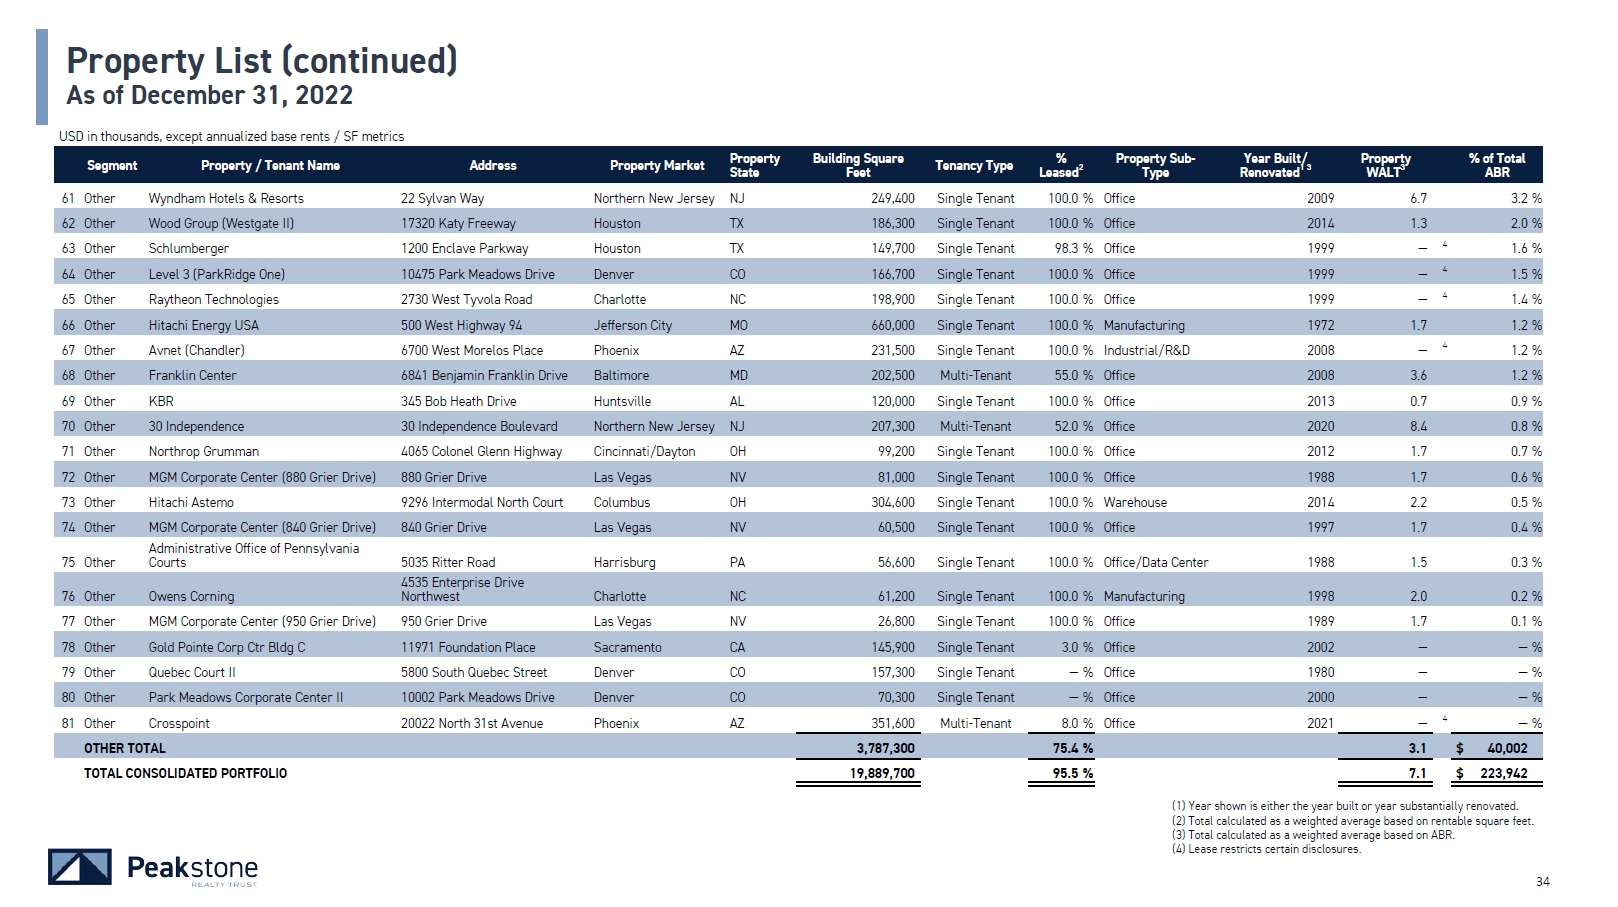
Address Property Market Property State Building Square Feet Tenancy Type % Leased 2 Property Sub- Type Renovated Year Built/ 1 3 WALT Property 3 % of Total ABR 61 Other Wyndham Hotels & Resorts 22 Sylvan Way Northern New Jersey NJ 249,400 Single Tenant 100.0 % Office 2009 6.7 3.2 % 62 Other Wood Group (Westgate II) 17320 Katy Freeway Houston TX 186,300 Single Tenant 100.0 % Office 2014 1.3 2.0 % 63 Other Schlumberger 1200 Enclave Parkway Houston TX 149,700 Single Tenant 98.3 % Office 1999 — 4 1.6 % 64 Other Level 3 (ParkRidge One) 10475 Park Meadows Drive Denver CO 166,700 Single Tenant 100.0 % Office 1999 — 4 1.5 % 65 Other Raytheon Technologies 2730 West Tyvola Road Charlotte NC 198,900 Single Tenant 100.0 % Office 1999 — 4 1.4 % 66 Other Hitachi Energy USA 500 West Highway 94 Jefferson City MO 660,000 Single Tenant 100.0 % Manufacturing 1972 1.7 1.2 % 67 Other Avnet (Chandler) 6700 West Morelos Place Phoenix AZ 231,500 Single Tenant 100.0 % Industrial/R&D 2008 — 4 1.2 % 68 Other Franklin Center 6841 Benjamin Franklin Drive Baltimore MD 202,500 Multi-Tenant 55.0 % Office 2008 3.6 1.2 % 69 Other KBR 345 Bob Heath Drive Huntsville AL 120,000 Single Tenant 100.0 % Office 2013 0.7 0.9 % 70 Other 30 Independence 30 Independence Boulevard Northern New Jersey NJ 207,300 Multi-Tenant 52.0 % Office 2020 8.4 0.8 % 71 Other Northrop Grumman 4065 Colonel Glenn Highway Cincinnati/Dayton OH 99,200 Single Tenant 100.0 % Office 2012 1.7 0.7 % 72 Other MGM Corporate Center (880 Grier Drive) 880 Grier Drive Las Vegas NV 81,000 Single Tenant 100.0 % Office 1988 1.7 0.6 % 73 Other Hitachi Astemo 9296 Intermodal North Court Columbus OH 304,600 Single Tenant 100.0 % Warehouse 2014 2.2 0.5 % 74 Other MGM Corporate Center (840 Grier Drive) 840 Grier Drive Las Vegas NV 60,500 Single Tenant 100.0 % Office 1997 1.7 0.4 % 75 Other Administrative Office of Pennsylvania Courts 5035 Ritter Road Harrisburg PA 56,600 Single Tenant 100.0 % Office/Data Center 1988 1.5 0.3 % 76 Other Owens Corning 4535 Enterprise Drive Northwest Charlotte NC 61,200 Single Tenant 100.0 % Manufacturing 1998 2.0 0.2 % 77 Other MGM Corporate Center (950 Grier Drive) 950 Grier Drive Las Vegas NV 26,800 Single Tenant 100.0 % Office 1989 1.7 0.1 % 78 Other Gold Pointe Corp Ctr Bldg C 11971 Foundation Place Sacramento CA 145,900 Single Tenant 3.0 % Office 2002 — — % 79 Other Quebec Court II 5800 South Quebec Street Denver CO 157,300 Single Tenant — % Office 1980 — — % 80 Other Park Meadows Corporate Center II 10002 Park Meadows Drive Denver CO 70,300 Single Tenant — % Office 2000 — — % 81 Other Crosspoint 20022 North 31st Avenue Phoenix AZ 351,600 Multi-Tenant 8.0 % Office 2021 — 4 — % OTHER TOTAL 3,787,300 75.4 % 3.1 $ 40,002 TOTAL CONSOLIDATED PORTFOLIO 19,889,700 95.5 % 7.1 $ 223,942 31 Property List (continued) As of December 31, 2022 USD in thousands, except annualized base rents / SF metrics Segment Property / Tenant Name Year shown is either the year built or year substantially renovated. Total calculated as a weighted average based on rentable square feet. Total calculated as a weighted average based on ABR. Lease restricts certain disclosures.

Portfolio Characteristics
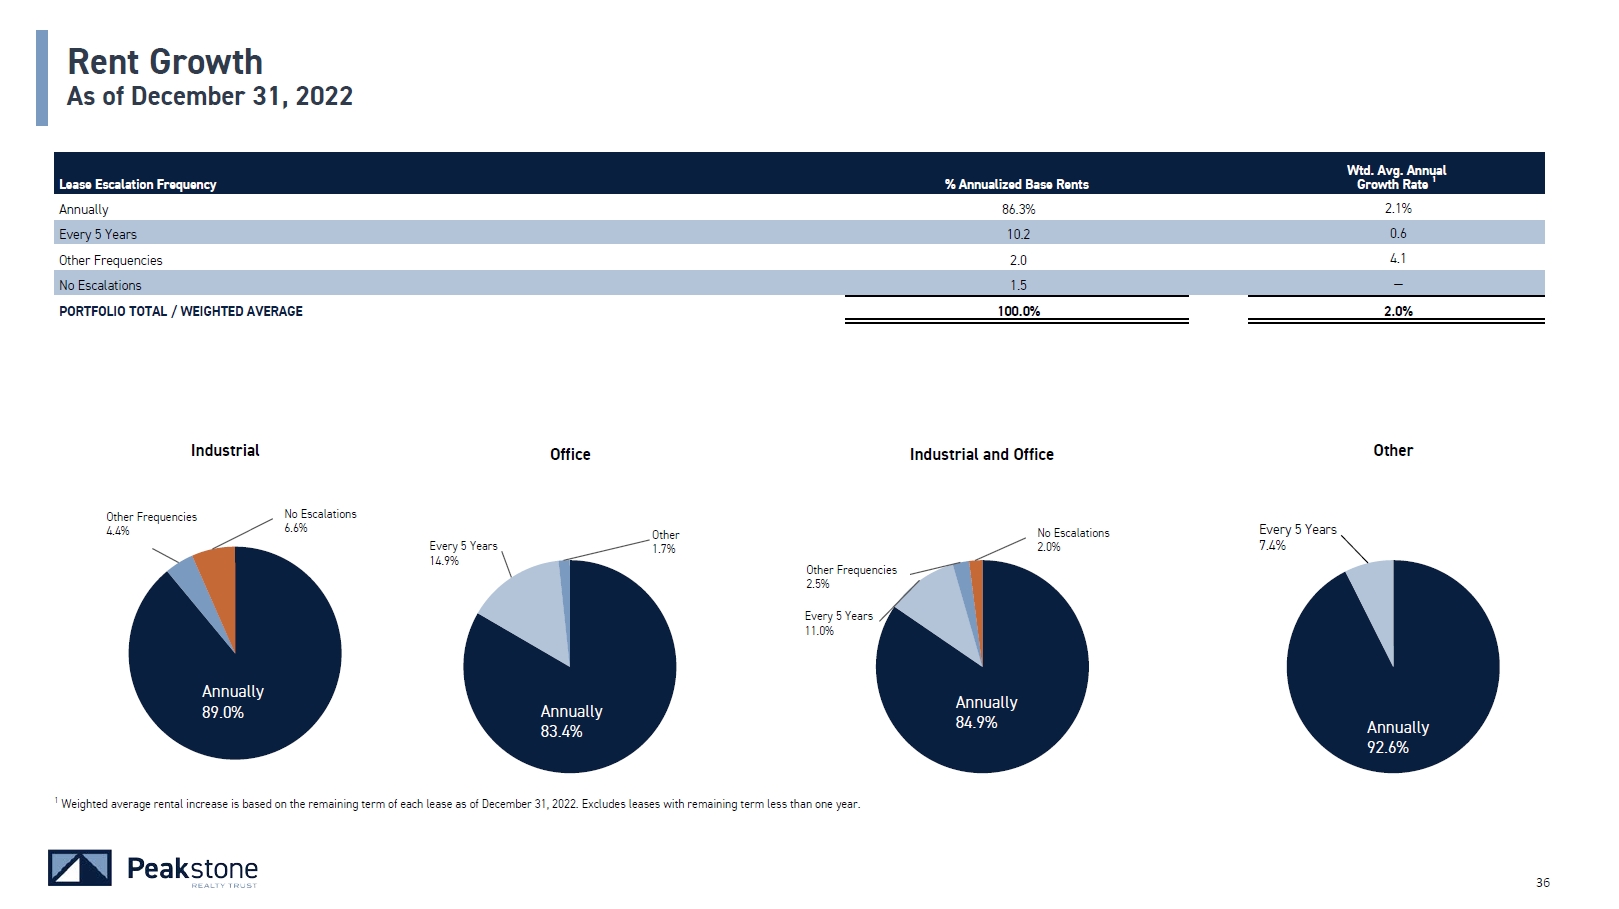
1 Weighted average rental increase is based on the remaining term of each lease as of December 31, 2022. Excludes leases with remaining term less than one year. Lease Escalation Frequency Annually % Annualized Base Rents 86.3% Growth Rate 1 2.1% Every 5 Years 10.2 0.6 Other Frequencies 2.0 4.1 No Escalations 1.5 — PORTFOLIO TOTAL / WEIGHTED AVERAGE 100.0% 2.0% Wtd. Avg. Annual Rent Growth As of December 31, 2022 Annually 84.9% Every 5 Years 11.0% Other Frequencies 2.5% No Escalations 2.0% Annually 89.0% Other Frequencies 4.4% No Escalations 6.6% Annually 92.6% Every 5 Years 7.4% Annually 83.4% 36 Every 5 Years 14.9% Other 1.7% Industrial Industrial and Office Office Other
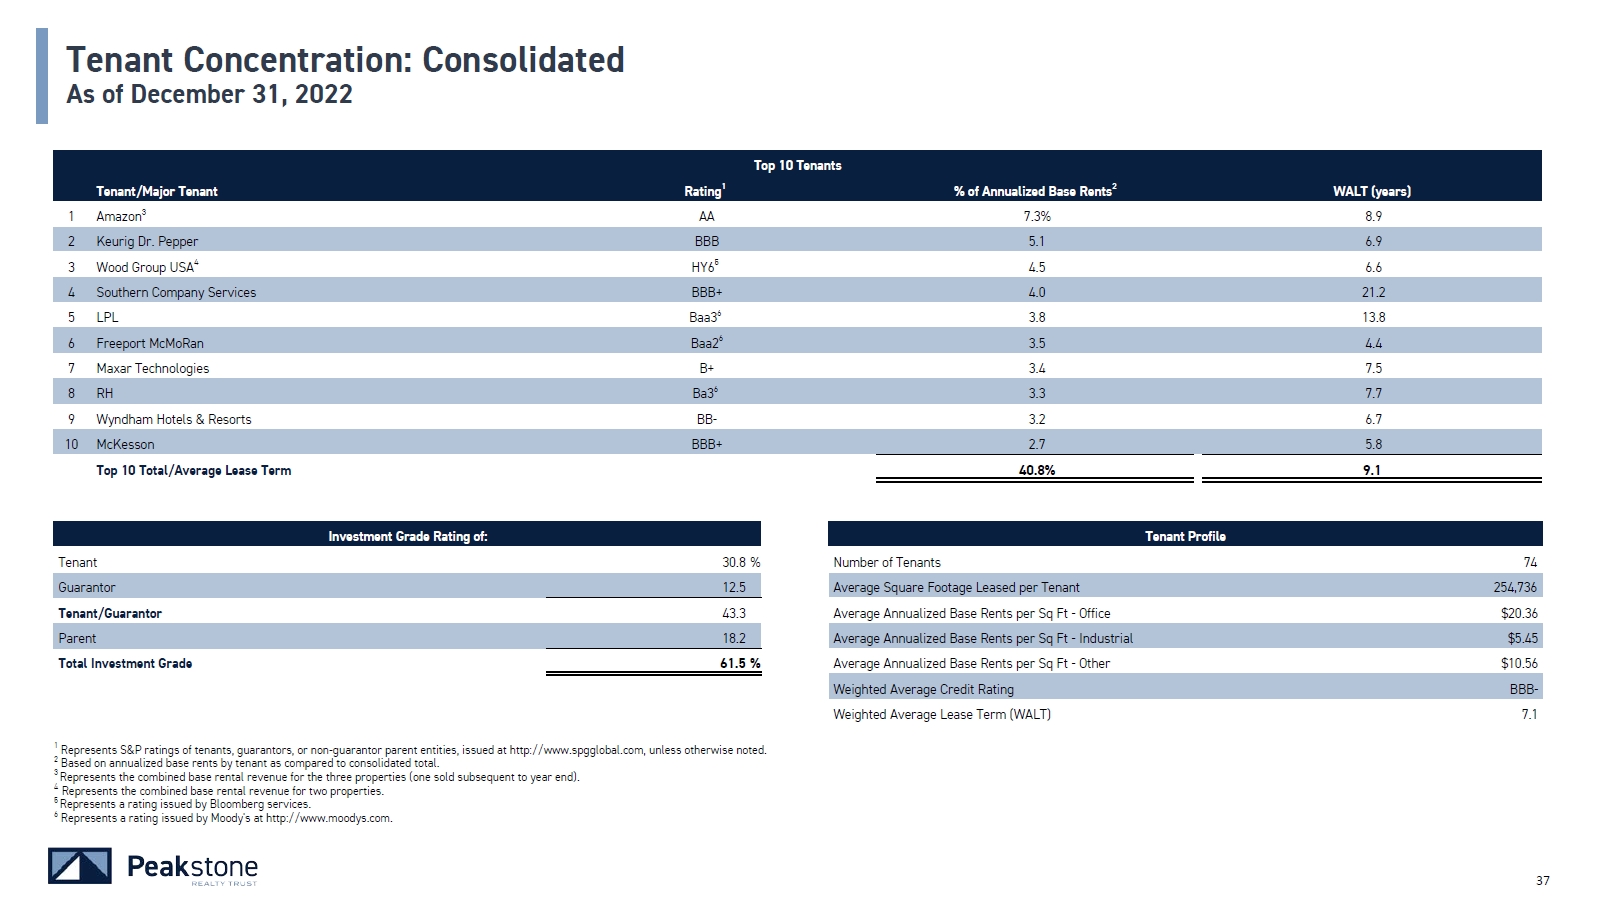
Tenant/Major Tenant Rating1 Top 10 Tenants % of Annualized Base Rents2 WALT (years) 1 Amazon3 AA 7.3% 8.9 2 Keurig Dr. Pepper BBB 5.1 6.9 3 Wood Group USA4 HY65 4.5 6.6 4 Southern Company Services BBB+ 4.0 21.2 5 LPL Baa36 3.8 13.8 6 Freeport McMoRan Baa26 3.5 4.4 7 Maxar Technologies B+ 3.4 7.5 8 RH Ba36 3.3 7.7 9 Wyndham Hotels & Resorts BB- 3.2 6.7 10 McKesson BBB+ 2.7 5.8 Top 10 Total/Average Lease Term 40.8% 9.1 Investment Grade Rating of: Tenant Profile Tenant 30.8 % Guarantor 12.5 Number of Tenants 74 Average Square Footage Leased per Tenant 254,736 Tenant/Guarantor 43.3 Parent 18.2 Average Annualized Base Rents per Sq Ft - Office $20.36 Average Annualized Base Rents per Sq Ft - Industrial $5.45 Total Investment Grade 61.5 % Average Annualized Base Rents per Sq Ft - Other $10.56 Weighted Average Credit Rating BBB- Weighted Average Lease Term (WALT) 7.1 Tenant Concentration: Consolidated As of December 31, 2022 36 1 Represents S&P ratings of tenants, guarantors, or non-guarantor parent entities, issued at http://www.spgglobal.com, unless otherwise noted. 2 Based on annualized base rents by tenant as compared to consolidated total. 3 Represents the combined base rental revenue for the three properties (one sold subsequent to year end). 4 Represents the combined base rental revenue for two properties. 5 Represents a rating issued by Bloomberg services. 6 Represents a rating issued by Moody's at http://www.moodys.com.

Tenant/Major Tenant Rating1 Top 10 Tenants % of Annualized Base Rents2 WALT (years) 1 Amazon AA 8.9% 8.9 2 Keurig Dr. Pepper BBB 6.2 5.3 3 Southern Company BBB+ 4.9 21.2 4 LPL Baa34 4.6 13.8 5 Freeport McMoran Baa24 4.3 4.4 6 Maxar Technologies B+ 4.1 7.5 7 RH Ba34 4.0 7.7 8 McKesson BBB+ 3.2 5.8 9 Travel & Leisure, Co. BB- 3.1 6.7 10 Wood Group HY63 3.0 11.0 Top 10 Total/Average Lease Term 46.3% 9.4 Investment Grade Rating of: Tenant Profile Tenant 32.1 % Guarantor 13.7 Number of Tenants 54 Average Square Footage Leased per Tenant 296,159 Tenant/Guarantor 45.8 Parent 18.9 Average Annualized Base Rents per Sq Ft: Industrial and Office $11.42 Weighted Average Lease Term (WALT) 8.0 Total Investment Grade 64.7 % Weighted Average Credit Rating BBB Tenant Concentration: Industrial and Office As of December 31, 2022 36 1 Represents S&P ratings of tenants, guarantors, or non-guarantor parent entities, issued at http://www.spgglobal.com, unless otherwise noted. 2 Based on annualized base rents by tenant for industrial and office segments. 3 Represents a rating issued by Bloomberg services. 4 Represents a rating issued by Moody's at http://www.moodys.com.

Tenant/Major Tenant Rating1 Top 10 Tenants % of Annualized Base Rents2 WALT (years) 1 Amazon AA 16.1% 8.6 2 RH Ba34 14.0 7.7 3 3M Company A+ 9.3 3.8 4 Samsonite Ba24 7.7 1.9 5 Shaw Industries AA 6.3 10.3 6 PepsiCo A+ 6.0 5.6 7 Amcor BBB 5.1 9.8 8 Huntington Ingalls BBB- 4.8 5.0 9 Fox Head6 BB 4.2 5.0 10 Renfro Corporation6 NR 4.1 0.5 Top 10 Total/Average Lease Term 77.6% 6.3 Investment Grade Rating of: Tenant Profile Tenant 9.3 % Guarantor 18.7 Number of Tenants 19 Average Square Footage Leased per Tenant 507,895 Tenant/Guarantor 28.0 Parent 25.8 Average Annualized Base Rents per Sq Ft: Industrial $5.45 Weighted Average Lease Term (WALT) 6.7 Total Investment Grade 53.8 % Weighted Average Credit Rating BBB Tenant Concentration: Industrial As of December 31, 2022 36 1 Represents S&P ratings of tenants, guarantors, or non-guarantor parent entities, issued at http://www.spgglobal.com, unless otherwise noted. 2 Based on annualized base rents by tenant for industrial segment. 3 Represents a rating issued by Bloomberg services. 4 Represents a rating issued by Moody's at http://www.moodys.com. 5 Indicates that the tenant is not rated by the major credit agencies used. 6 Assets were sold subsequent to year-end December 31, 2022.
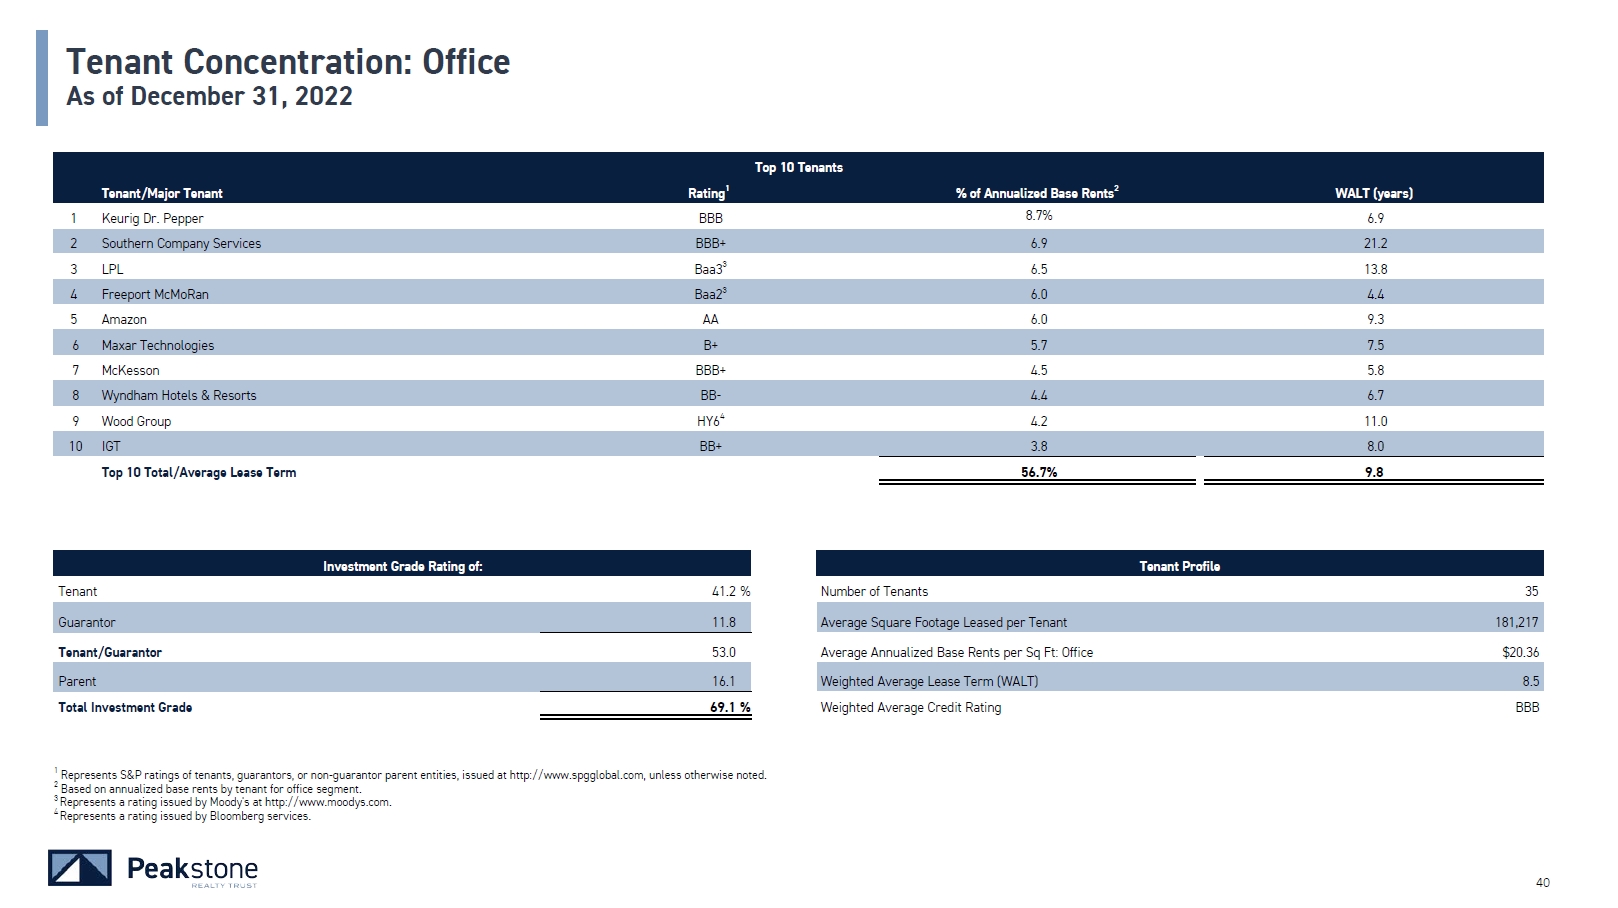
Tenant/Major Tenant Rating1 Top 10 Tenants % of Annualized Base Rents2 WALT (years) 1 Keurig Dr. Pepper BBB 8.7% 6.9 2 Southern Company Services BBB+ 6.9 21.2 3 LPL Baa33 6.5 13.8 4 Freeport McMoRan Baa23 6.0 4.4 5 Amazon AA 6.0 9.3 6 Maxar Technologies B+ 5.7 7.5 7 McKesson BBB+ 4.5 5.7 8 Wyndham Hotels & Resorts BB- 4.4 6.7 9 Wood Group HY64 4.2 11.0 10 IGT BB+ 3.8 8.0 Top 10 Total/Average Lease Term 56.7% 9.8 Investment Grade Rating of: Tenant Profile Tenant 41.2 % Number of Tenants 35 Guarantor 11.8 Average Square Footage Leased per Tenant 181,217 Tenant/Guarantor 53.0 Parent 16.1 Total Investment Grade 69.1 % Average Annualized Base Rents per Sq Ft: Office $20.36 Weighted Average Lease Term (WALT) 8.5 Weighted Average Credit Rating BBB Tenant Concentration: Office As of December 31, 2022 36 1 Represents S&P ratings of tenants, guarantors, or non-guarantor parent entities, issued at http://www.spgglobal.com, unless otherwise noted. 2 Based on annualized base rents by tenant for office segment. 3 Represents a rating issued by Moody's at http://www.moodys.com. 4 Represents a rating issued by Bloomberg services.
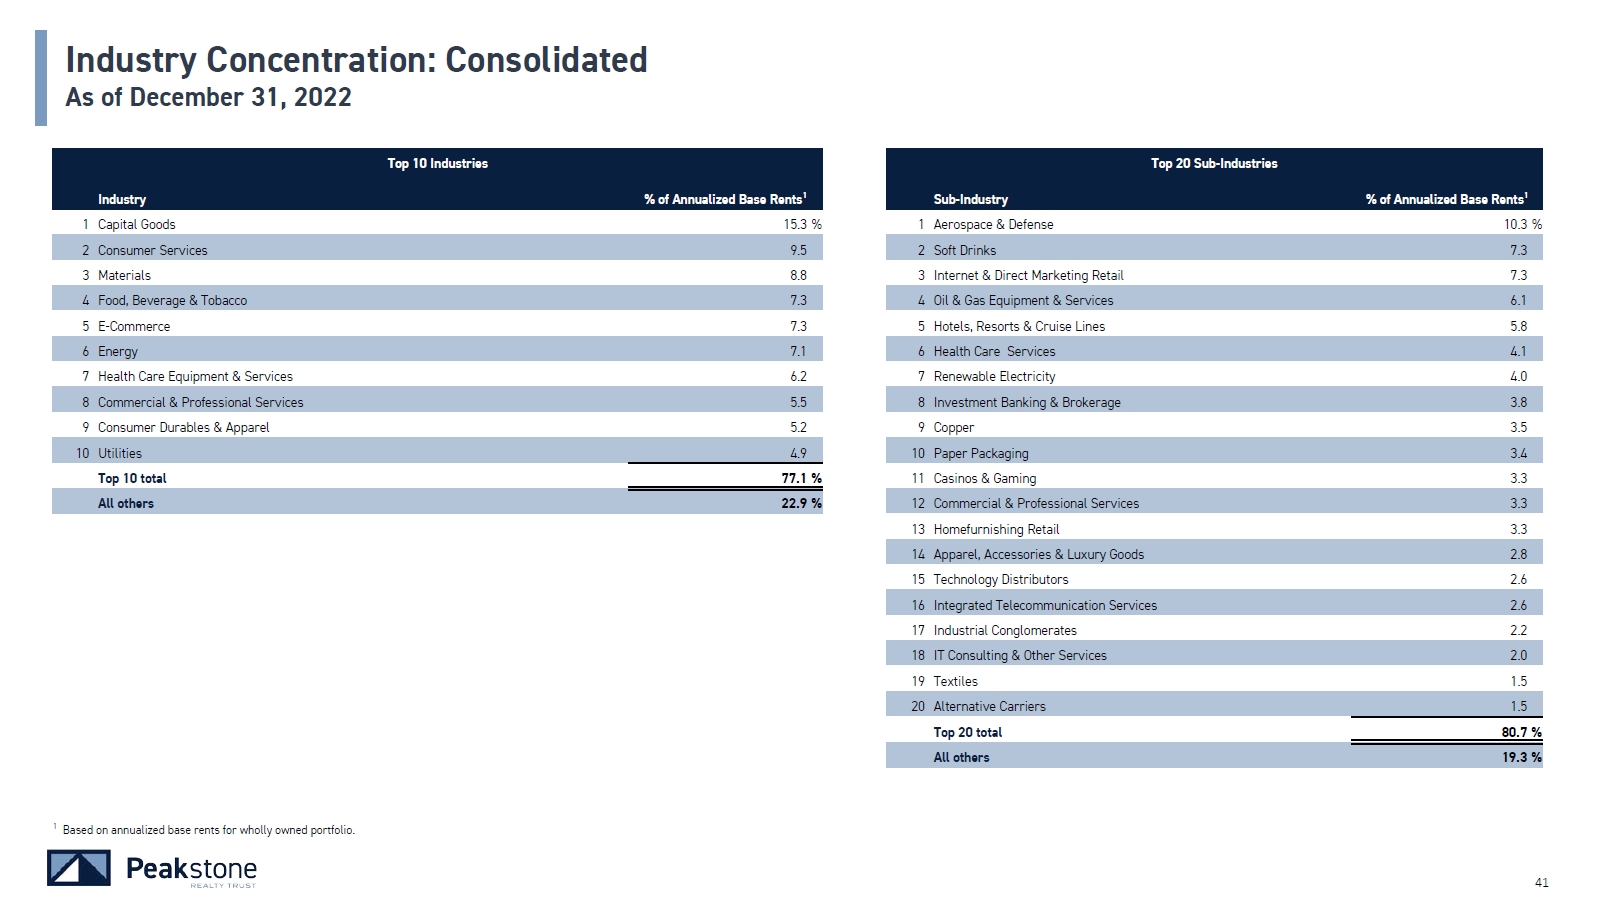
Industry Concentration: Consolidated As of December 31, 2022 36 Industry Top 10 Industries % of Annualized Base Rents1 Top 20 Sub-Industries Sub-Industry % of Annualized Base Rents1 1 Capital Goods 15.3 % 1 Aerospace & Defense 10.3 % 2 Consumer Services 9.5 2 Soft Drinks 7.3 3 Materials 8.8 3 Internet & Direct Marketing Retail 7.3 4 Food, Beverage & Tobacco 7.3 4 Oil & Gas Equipment & Services 6.1 5 E-Commerce 7.3 5 Hotels, Resorts & Cruise Lines 5.8 6 Energy 7.1 6 Health Care Services 4.1 7 Health Care Equipment & Services 6.2 7 Renewable Electricity 4.0 8 Commercial & Professional Services 5.5 8 Investment Banking & Brokerage 3.8 9 Consumer Durables & Apparel 5.2 9 Copper 3.5 10 Utilities 4.9 10 Paper Packaging 3.4 Top 10 total 77.1 % 11 Casinos & Gaming 3.3 All others 22.9 % 12 Commercial & Professional Services 3.3 13 Homefurnishing Retail 3.3 14 Apparel, Accessories & Luxury Goods 2.8 15 Technology Distributors 2.6 16 Integrated Telecommunication Services 2.6 17 Industrial Conglomerates 2.2 18 IT Consulting & Other Services 2.0 19 Textiles 1.5 20 Alternative Carriers 1.5 Top 20 total 80.7 % All others 19.3 % 1 Based on annualized base rents for wholly owned portfolio.
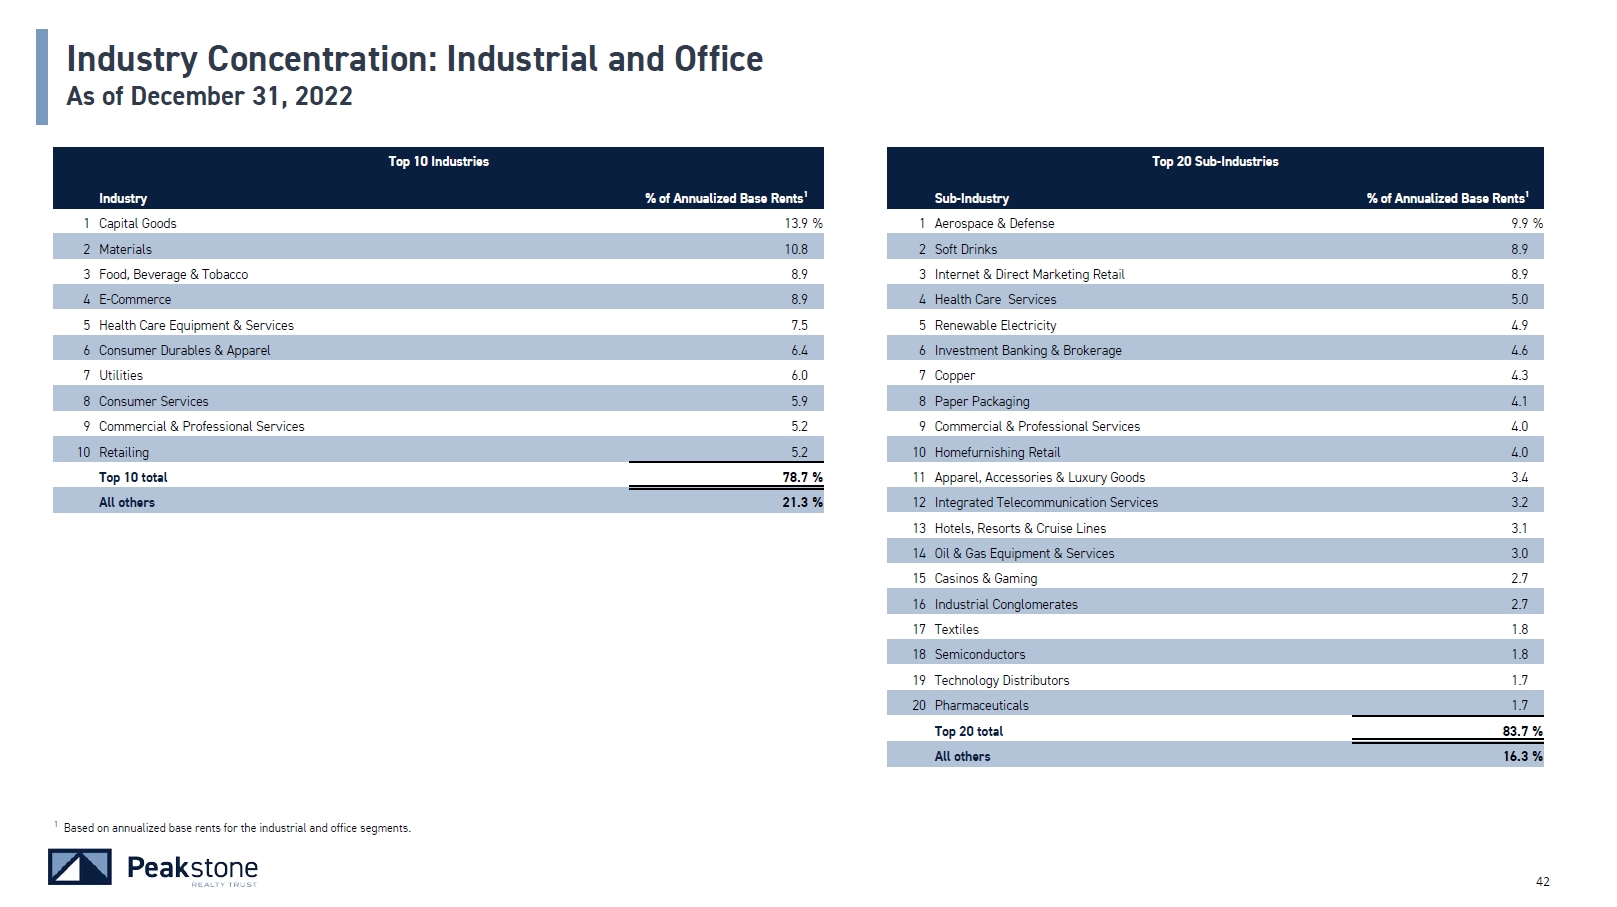
Industry Concentration: Industrial and Office As of December 31, 2022 2 Materials 10.8 3 Food, Beverage & Tobacco 8.9 4 E-Commerce 8.9 5 Health Care Equipment & Services 7.5 6 Consumer Durables & Apparel 6.4 7 Utilities 6.0 8 Consumer Services 5.9 9 Commercial & Professional Services 5.2 10 Retailing 5.2 Top 10 total 78.7 % All others 21.3 % 36 2 Soft Drinks 8.9 3 Internet & Direct Marketing Retail 8.9 4 Health Care Services 5.0 5 Renewable Electricity 4.9 6 Investment Banking & Brokerage 4.6 7 Copper 4.3 8 Paper Packaging 4.1 9 Commercial & Professional Services 4.0 10 Homefurnishing Retail 4.0 11 Apparel, Accessories & Luxury Goods 3.4 12 Integrated Telecommunication Services 3.2 13 Hotels, Resorts & Cruise Lines 3.1 14 Oil & Gas Equipment & Services 3.0 15 Casinos & Gaming 2.7 16 Industrial Conglomerates 2.7 17 Textiles 1.8 18 Semiconductors 1.8 19 Technology Distributors 1.7 20 Pharmaceuticals 1.7 Top 20 total 83.7 % All others 16.3 % Top 10 Industries Top 20 Sub-Industries Industry % of Annualized Base Rents1 Sub-Industry % of Annualized Base Rents1 1 Capital Goods 13.9 % 1 Aerospace & Defense 9.9 % 1 Based on annualized base rents for the industrial and office segments.

Industry Concentration: Industrial As of December 31, 2022 2 Capital Goods 20.9 3 E-Commerce 16.1 4 Retailing 14.0 5 Food, Beverage & Tobacco 9.6 6 Materials 7.9 7 Automobiles & Components 5.0 8 Commercial & Professional Services 4.1 Top 8 total 100.0 % All others — % 36 2 Homefurnishing Retail 14.0 3 Apparel, Accessories & Luxury Goods 11.8 4 Soft Drinks 9.6 5 Industrial Conglomerates 9.3 6 Aerospace & Defense 6.9 7 Textiles 6.3 8 Paper Packaging 5.1 9 Leisure Products 4.2 10 Diversified Support Services 4.2 11 Auto Components 3.2 12 Metal & Glass Containers 2.8 13 Industrial Machinery 2.6 14 Construction Machinery & Heavy Trucks 2.1 15 Auto Parts & Equipment 1.8 Top 15 total 100.0 % All others — % Top 8 Industries Top 15 Industries Industry % of Annualized Base Rents1 Sub-Industry % of Annualized Base Rents1 1 Consumer Durables & Apparel 22.4 % 1 Internet & Direct Marketing Retail 16.1 % 1 Based on annualized base rents for industrial segment.
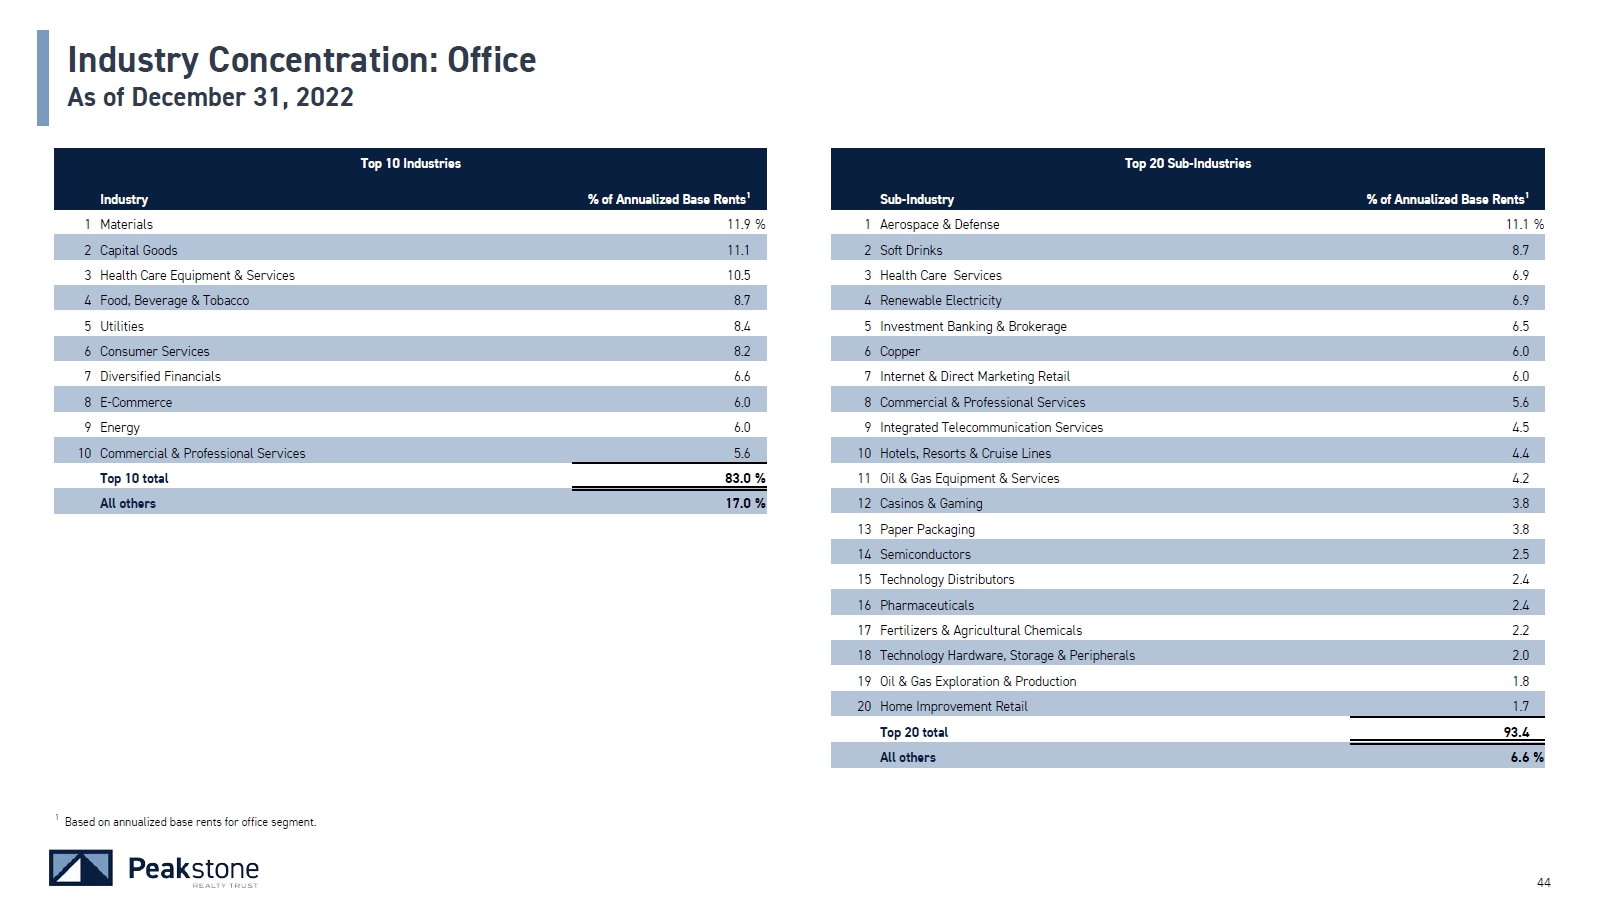
Industry Concentration: Office As of December 31, 2022 2 Capital Goods 11.1 3 Health Care Equipment & Services 10.5 4 Food, Beverage & Tobacco 8.7 5 Utilities 8.4 6 Consumer Services 8.2 7 Diversified Financials 6.6 8 E-Commerce 6.0 9 Energy 6.0 10 Commercial & Professional Services 5.6 Top 10 total 83.0 % All others 17.0 % 36 2 Soft Drinks 8.7 3 Health Care Services 6.9 4 Renewable Electricity 6.9 5 Investment Banking & Brokerage 6.5 6 Copper 6.0 7 Internet & Direct Marketing Retail 6.0 8 Commercial & Professional Services 5.6 9 Integrated Telecommunication Services 4.5 10 Hotels, Resorts & Cruise Lines 4.4 11 Oil & Gas Equipment & Services 4.2 12 Casinos & Gaming 3.8 13 Paper Packaging 3.8 14 Semiconductors 2.5 15 Technology Distributors 2.4 16 Pharmaceuticals 2.4 17 Fertilizers & Agricultural Chemicals 2.2 18 Technology Hardware, Storage & Peripherals 2.0 19 Oil & Gas Exploration & Production 1.8 20 Home Improvement Retail 1.7 Top 20 total 93.4 All others 6.6 % Top 10 Industries Top 20 Sub-Industries Industry % of Annualized Base Rents1 Sub-Industry % of Annualized Base Rents1 1 Materials 11.9 % 1 Aerospace & Defense 11.1 % 1 Based on annualized base rents for office segment.
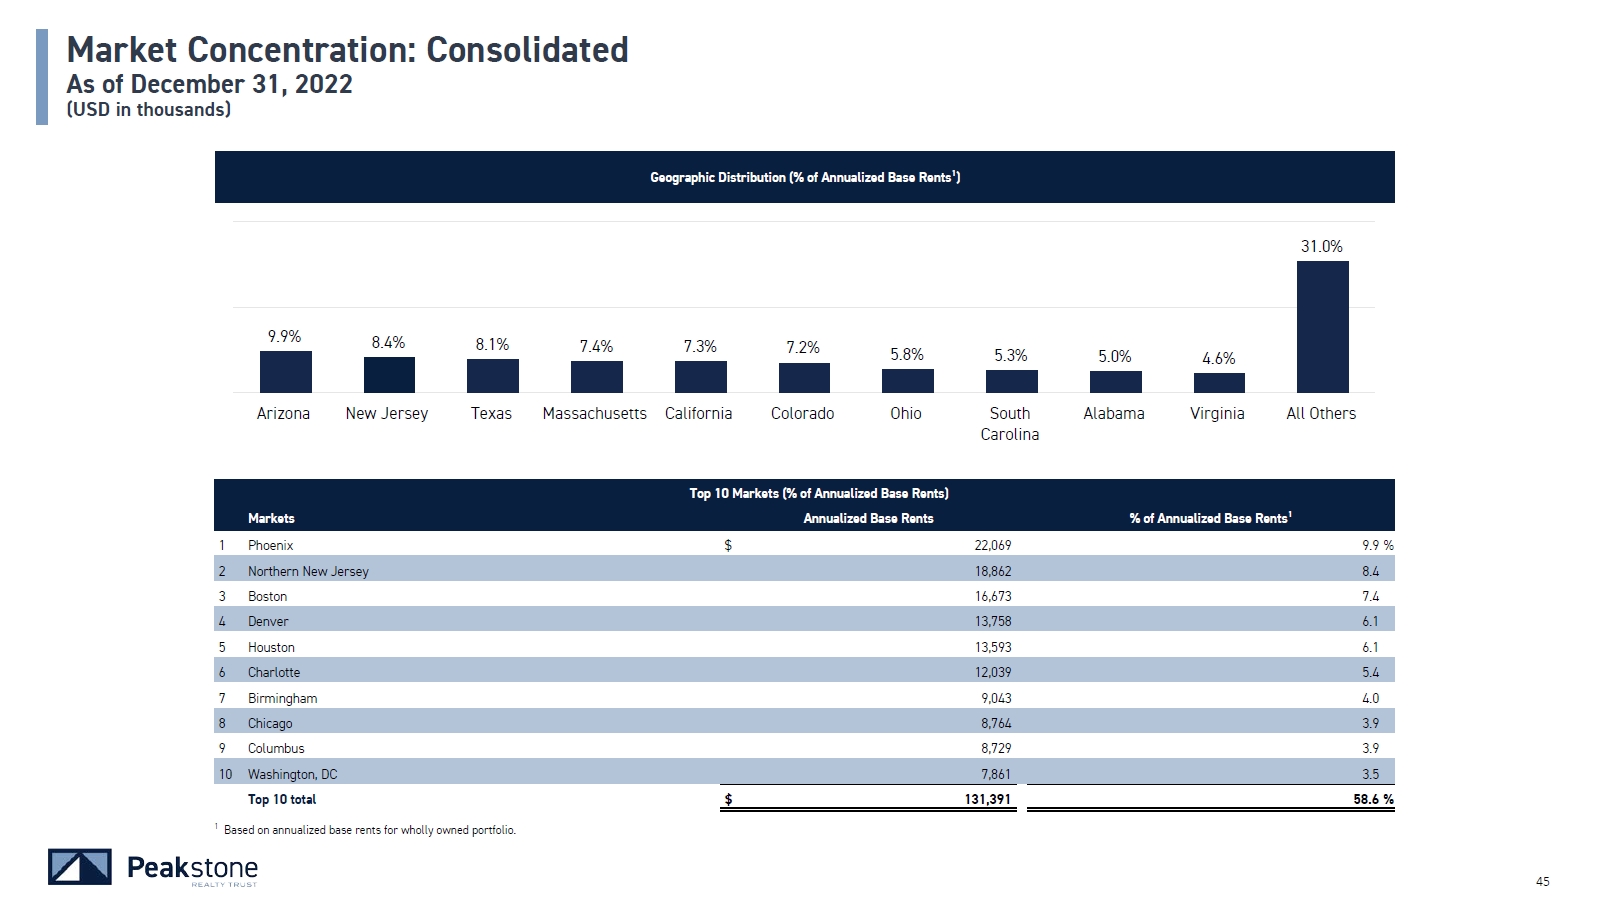
Geographic Distribution (% of Annualized Base Rents1) Market Concentration: Consolidated As of December 31, 2022 (USD in thousands) Top 10 Markets (% of Annualized Base Rents) Markets Annualized Base Rents % of Annualized Base Rents1 1 Phoenix $ 22,069 9.9 % 2 Northern New Jersey 18,862 8.4 3 Boston 16,673 7.4 4 Denver 13,758 6.1 5 Houston 13,593 6.1 6 Charlotte 12,039 5.4 7 Birmingham 9,043 4.0 8 Chicago 8,764 3.9 9 Columbus 8,729 3.9 10 Washington, DC 7,861 3.5 Top 10 total $ 131,391 58.6 % 9.9% 36 8.4% 8.1% 7.4% 7.3% 7.2% 5.8% 5.3% 5.0% 4.6% 31.0% Arizona New Jersey Texas Massachusetts California Colorado Ohio South Carolina Alabama Virginia All Others 1 Based on annualized base rents for wholly owned portfolio.

Geographic Distribution (% of Annualized Base Rents1) Market Concentration: Industrial and Office As of December 31, 2022 (USD in thousands) Top 10 Markets (% of Annualized Base Rents) Markets Annualized Base Rents % of Annualized Base Rents1 1 Phoenix $ 19,345 10.5 % 2 Boston 16,673 9.1 3 Denver 10,436 5.7 4 Northern New Jersey 9,913 5.4 5 Birmingham 9,043 4.9 6 Chicago 8,764 4.8 7 Charlotte 8,552 4.6 8 Washington, DC 7,861 4.3 9 Columbus 7,557 4.1 10 Stockton/Modesto 7,340 4.0 Top 10 total $ 105,484 57.4 % 10.5% 36 9.1% 8.9% 6.9% 6.4% 5.6% 5.6% 5.5% 5.4% 4.9% 31.1% Arizona Massachusetts California Colorado South Carolina Virginia Ohio Texas New Jersey Alabama All Others 1 Based on annualized base rents for the industrial and office segments.
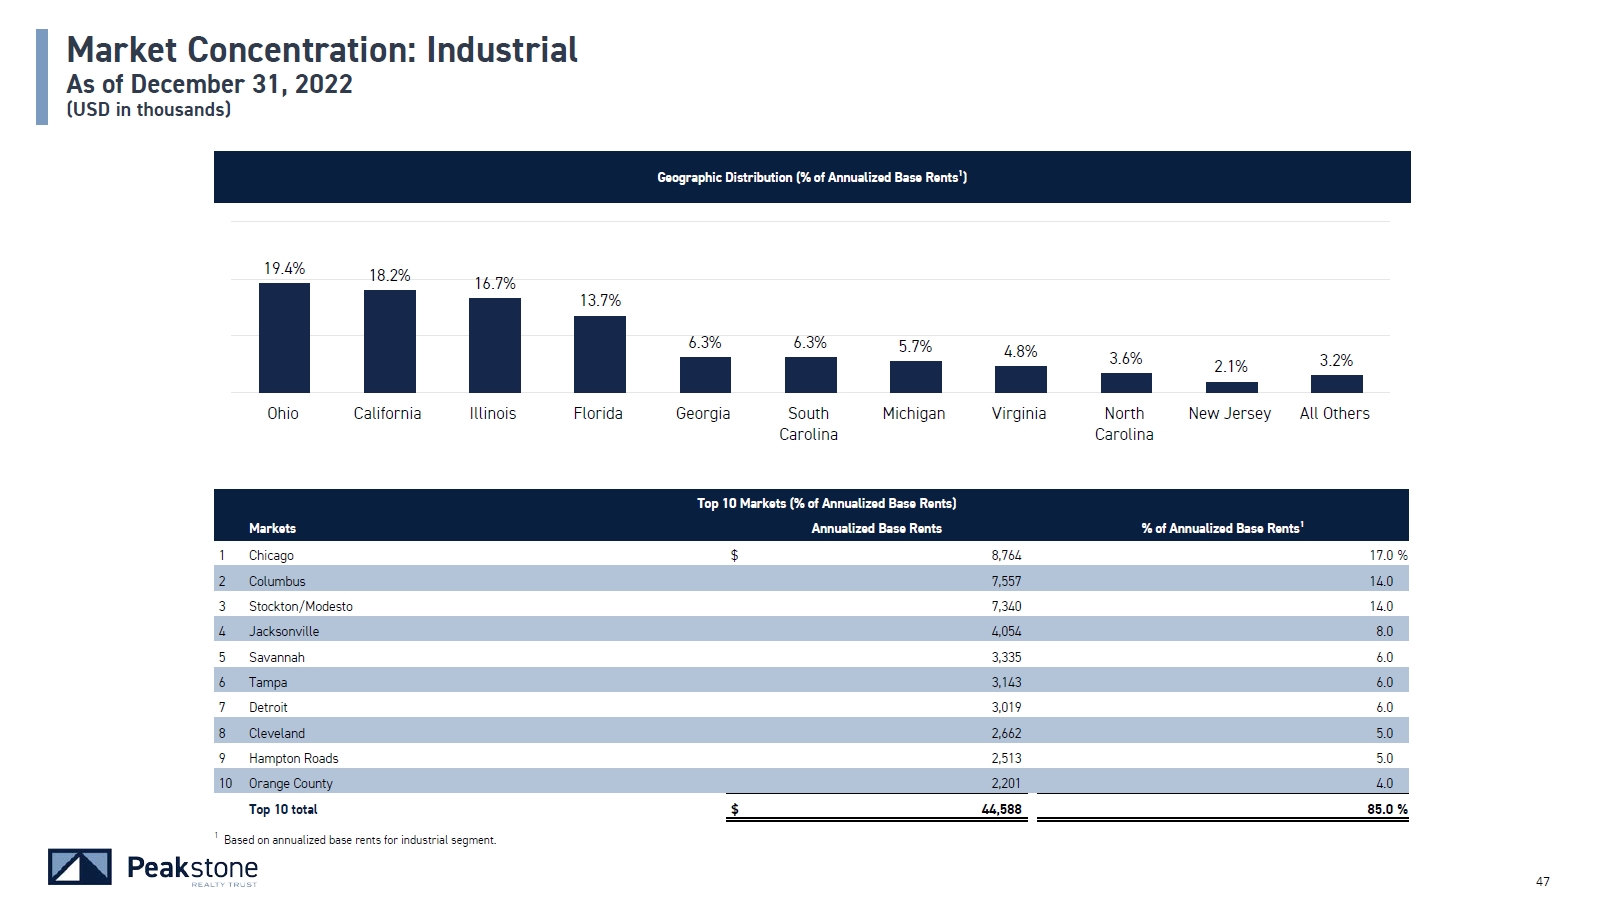
Geographic Distribution (% of Annualized Base Rents1) Market Concentration: Industrial As of December 31, 2022 (USD in thousands) Markets Top 10 Markets (% of Annualized Base Rents) Annualized Base Rents % of Annualized Base Rents1 1 Chicago $ 8,764 17.0 % 2 Columbus 7,557 14.0 3 Stockton/Modesto 7,340 14.0 4 Jacksonville 4,054 8.0 5 Savannah 3,335 6.0 6 Tampa 3,143 6.0 7 Detroit 3,019 6.0 8 Cleveland 2,662 5.0 9 Hampton Roads 2,513 5.0 10 Orange County 2,201 4.0 Top 10 total $ 44,588 85.0 % 19.4% 36 18.2% 16.7% 13.7% 6.3% 6.3% 5.7% 4.8% 3.6% 2.1% 3.2% Ohio California Illinois Florida Georgia South Carolina Michigan Virginia North Carolina New Jersey All Others 1 Based on annualized base rents for industrial segment.
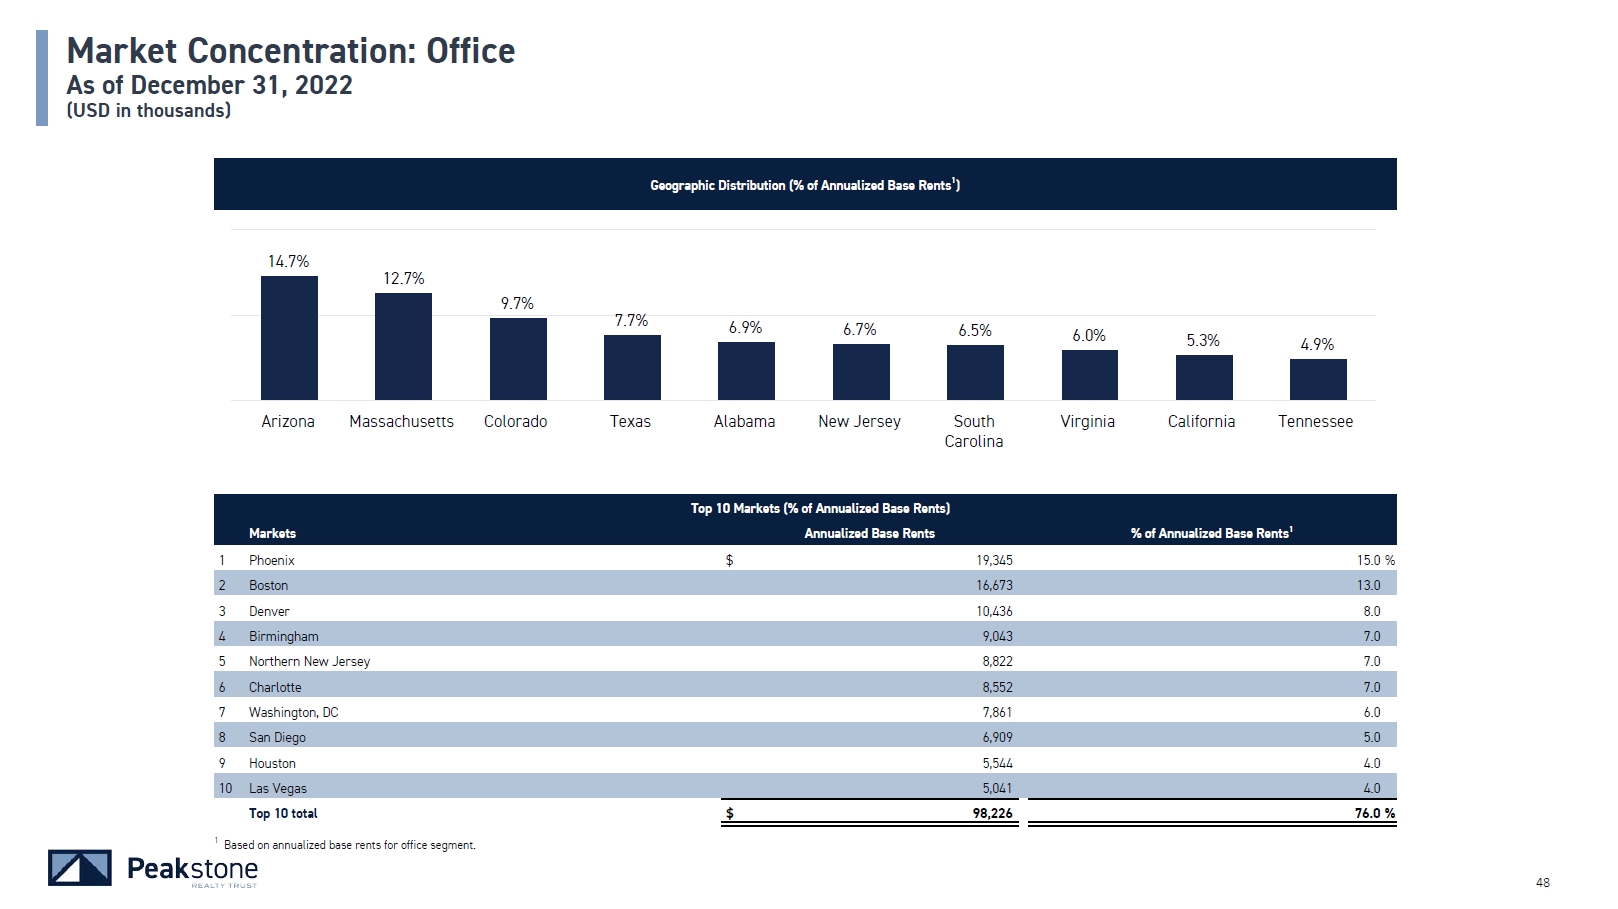
Geographic Distribution (% of Annualized Base Rents1) Market Concentration: Office As of December 31, 2022 (USD in thousands) Top 10 Markets (% of Annualized Base Rents) Markets Annualized Base Rents % of Annualized Base Rents1 1 Phoenix $ 19,345 15.0 % 2 Boston 16,673 13.0 3 Denver 10,436 8.0 4 Birmingham 9,043 7.0 5 Northern New Jersey 8,822 7.0 6 Charlotte 8,552 7.0 7 Washington, DC 7,861 6.0 8 San Diego 6,909 5.0 9 Houston 5,544 4.0 10 Las Vegas 5,041 4.0 Top 10 total $ 98,226 76.0 % 14.7% 12.7% 9.7% 1 Based on annualized base rents for office segment. 48 7.7% 6.9% 6.7% 6.5% 6.0% 5.3% 4.9% Arizona Massachusetts Colorado Texas Alabama New Jersey South Carolina Virginia California Tennessee
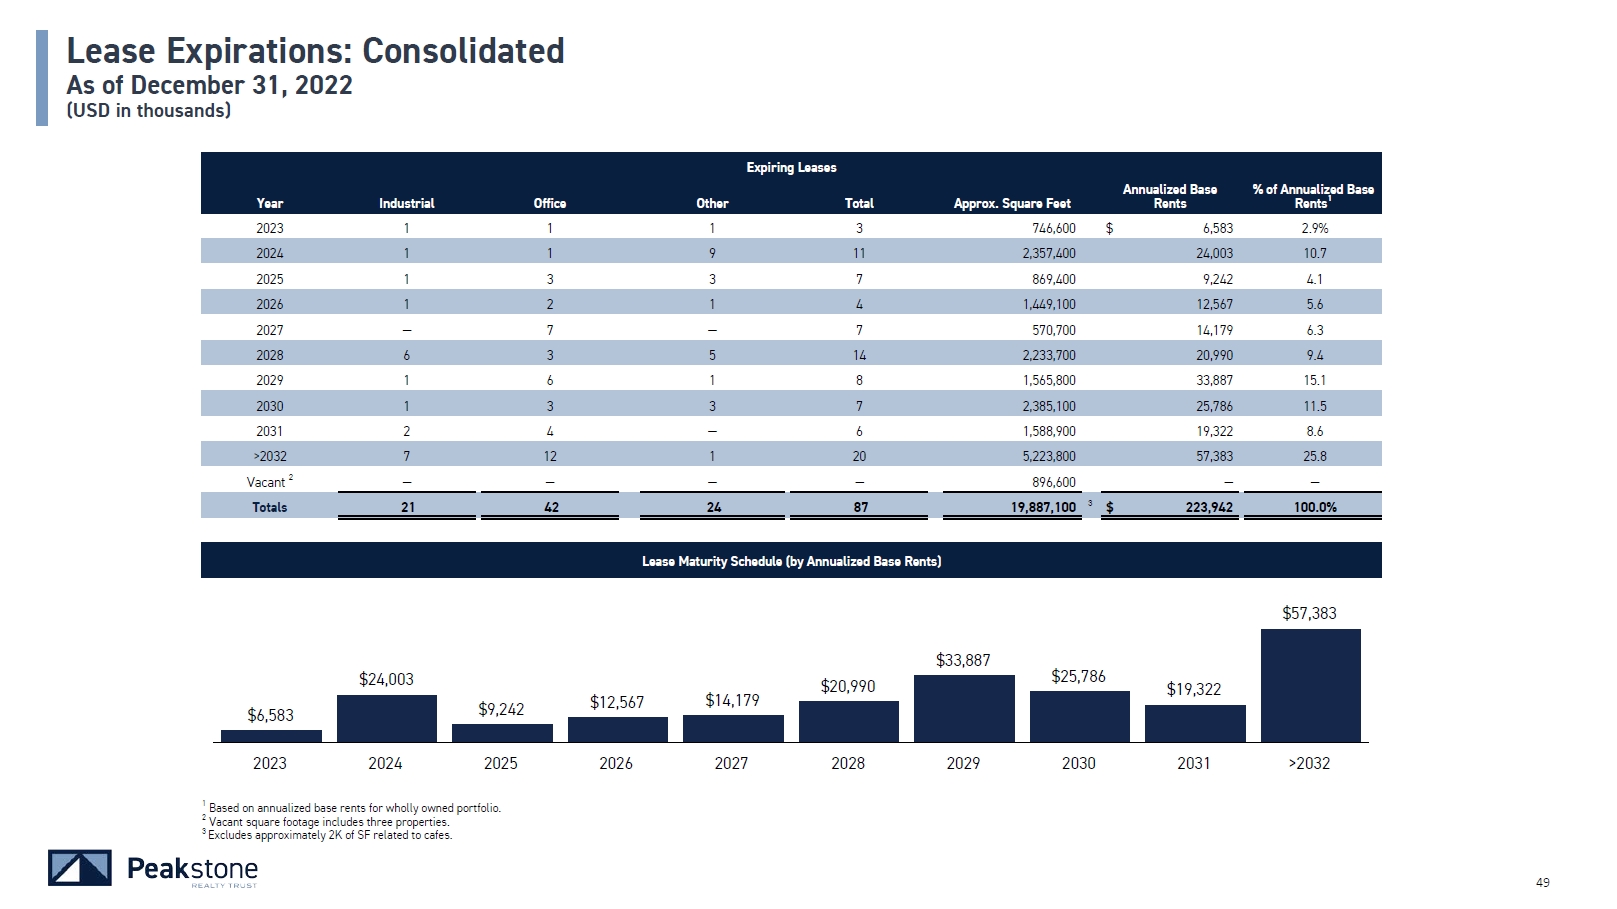
Lease Expirations: Consolidated As of December 31, 2022 (USD in thousands) 1 Based on annualized base rents for wholly owned portfolio. 2 Vacant square footage includes three properties. $24,003 $9,242 $12,567 $14,179 $20,990 $33,887 $25,786 $19,322 $6,583 2023 2024 2025 2026 2027 2028 2029 2030 2031 >2032 >2032 7 12 1 20 5,223,800 57,383 25.8 Vacant 2 — — — — 896,600 — — Totals 21 42 24 87 19,887,100 3 $ 223,942 100.0% Lease Maturity Schedule (by Annualized Base Rents) $57,383 3 Excludes approximately 2K of SF related to cafes. 49 Expiring Leases Year Industrial Office Other Total Approx. Square Feet Annualized Base Rents % of Annualized Base Rents1 2023 1 1 1 3 746,600 $ 6,583 2.9% 2024 1 1 9 11 2,357,400 24,003 10.7 2025 1 3 3 7 869,400 9,242 4.1 2026 1 2 1 4 1,449,100 12,567 5.6 2027 — 7 — 7 570,700 14,179 6.3 2028 6 3 5 14 2,233,700 20,990 9.4 2029 1 6 1 8 1,565,800 33,887 15.1 2030 1 3 3 7 2,385,100 25,786 11.5 2031 2 4 — 6 1,588,900 19,322 8.6
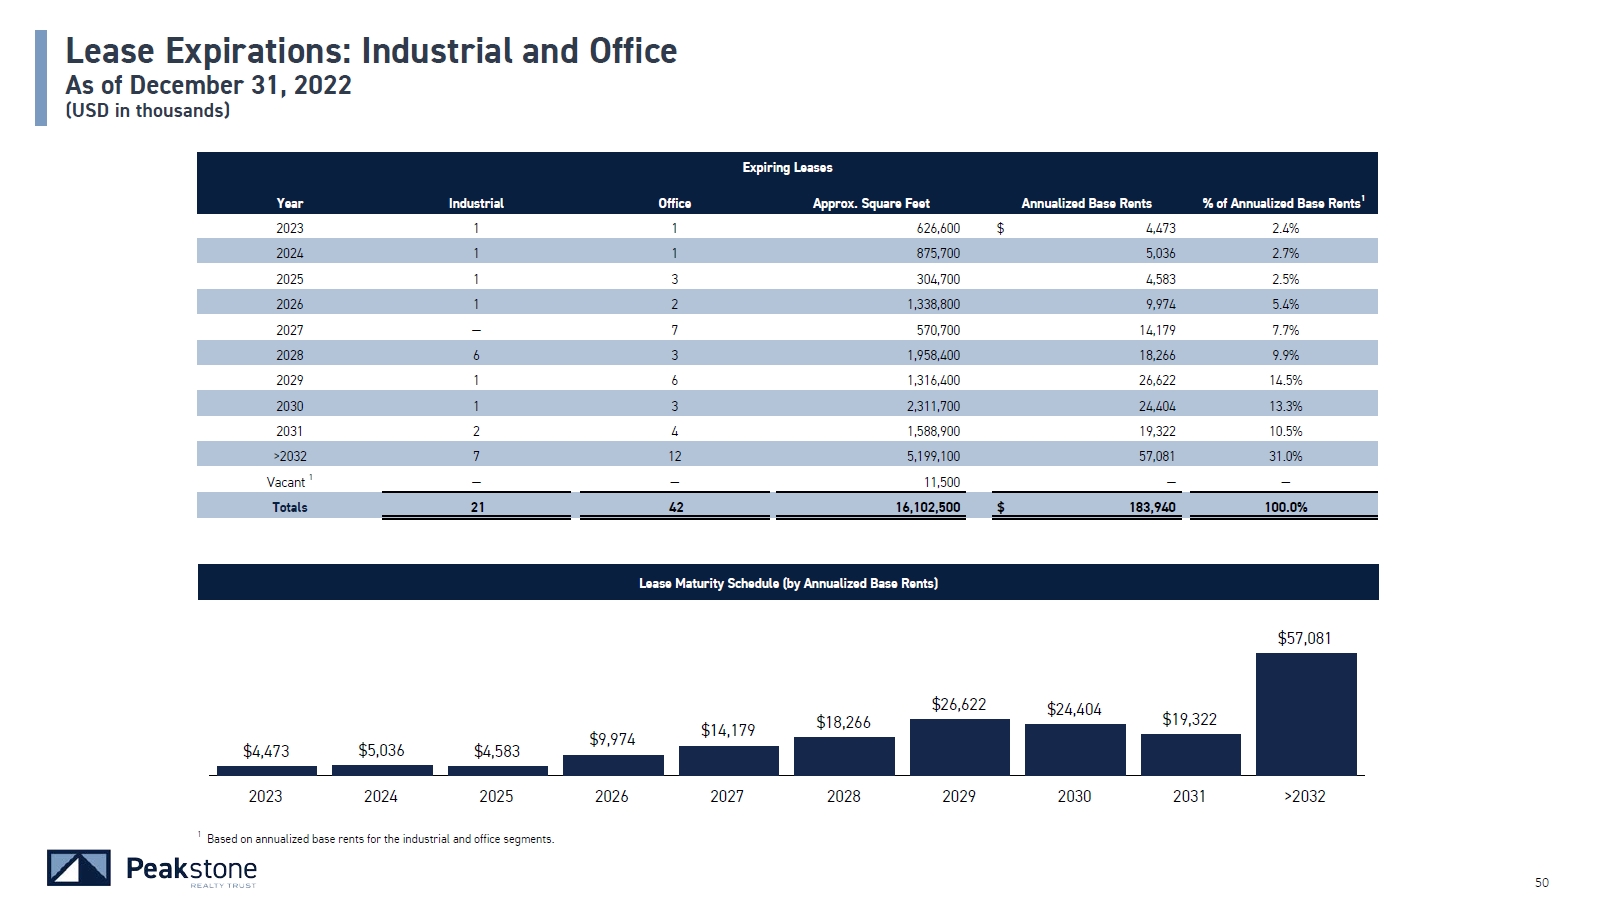
Lease Expirations: Industrial and Office As of December 31, 2022 (USD in thousands) Lease Maturity Schedule (by Annualized Base Rents) $4,473 $5,036 $4,583 $9,974 2023 2024 2025 2026 2027 2028 2029 2030 2031 >2032 1 Based on annualized base rents for the industrial and office segments. 50 $14,179 $18,266 $26,622 $24,404 $19,322 $57,081 Expiring Leases Year Industrial Office Approx. Square Feet Annualized Base Rents % of Annualized Base Rents1 2023 1 1 626,600 $ 4,473 2.4% 2024 1 1 875,700 5,036 2.7% 2025 1 3 304,700 4,583 2.5% 2026 1 2 1,338,800 9,974 5.4% 2027 — 7 570,700 14,179 7.7% 2028 6 3 1,958,400 18,266 9.9% 2029 1 6 1,316,400 26,622 14.5% 2030 1 3 2,311,700 24,404 13.3% 2031 2 4 1,588,900 19,322 10.5% >2032 7 12 5,199,100 57,081 31.0% Vacant 1 — — 11,500 — — Totals 21 42 16,102,500 $ 183,940 100.0%
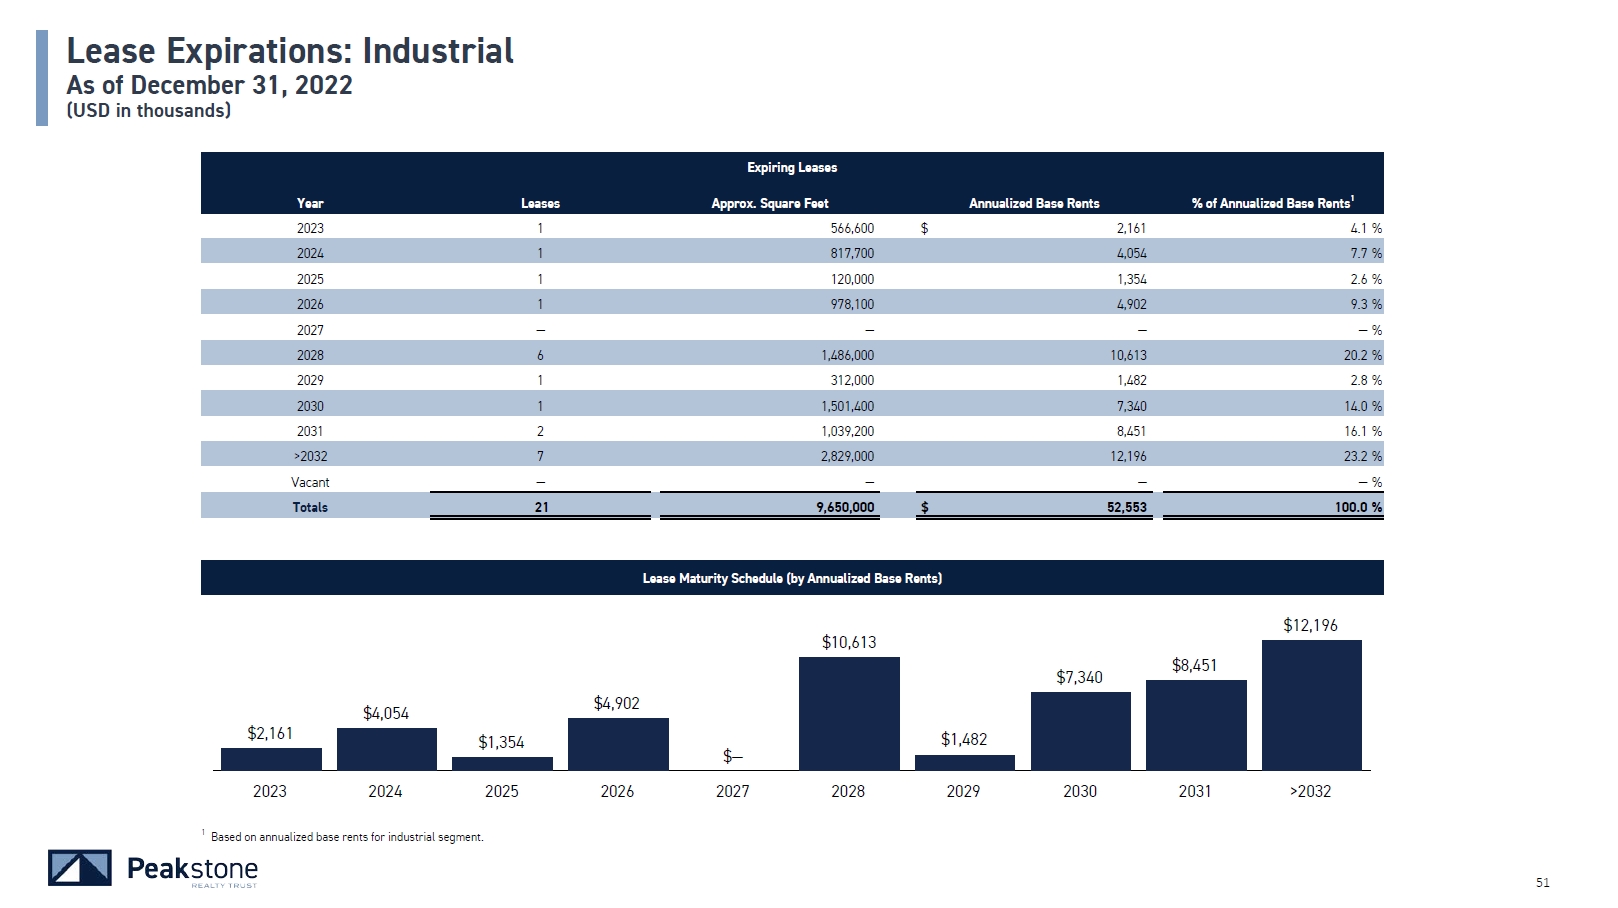
Lease Expirations: Industrial As of December 31, 2022 (USD in thousands) Lease Maturity Schedule (by Annualized Base Rents) $2,161 51 $4,054 $1,354 $4,902 $— $10,613 $1,482 $7,340 $8,451 $12,196 2025 2026 2027 2028 2029 2030 2031 >2032 Expiring Leases Year Leases Approx. Square Feet Annualized Base Rents % of Annualized Base Rents1 2023 1 566,600 $ 2,161 4.1 % 2024 1 817,700 4,054 7.7 % 2025 1 120,000 1,354 2.6 % 2026 1 978,100 4,902 9.3 % 2027 — — —�� — % 2028 6 1,486,000 10,613 20.2 % 2029 1 312,000 1,482 2.8 % 2030 1 1,501,400 7,340 14.0 % 2031 2 1,039,200 8,451 16.1 % >2032 7 2,829,000 12,196 23.2 % Vacant — — — — % Totals 21 9,650,000 $ 52,553 100.0 % 2023 2024 1 Based on annualized base rents for industrial segment.

Lease Expirations: Office As of December 31, 2022 (USD in thousands) Lease Maturity Schedule (by Annualized Base Rents) $2,312 52 $982 $3,229 $5,072 $14,179 $7,653 $25,140 $17,064 $10,871 $44,885 2025 2026 2027 2028 2029 2030 2031 >2032 Expiring Leases Year Leases Approx. Square Feet Annualized Base Rents % of Annualized Base Rents1 2023 1 60,000 $ 2,312 1.8 % 2024 1 58,000 982 0.7 % 2025 3 184,700 3,229 2.5 % 2026 2 360,700 5,072 3.9 % 2027 7 570,700 14,179 10.8 % 2028 3 472,400 7,653 5.8 % 2029 6 1,004,400 25,140 19.1 % 2030 3 810,300 17,064 13.0 % 2031 4 549,700 10,871 8.3 % >2032 12 2,370,100 44,885 34.1 % Vacant — 11,500 — — % Totals 42 6,452,500 $ 131,387 100.0 % 2023 2024 1 Based on annualized base rents for office segment.
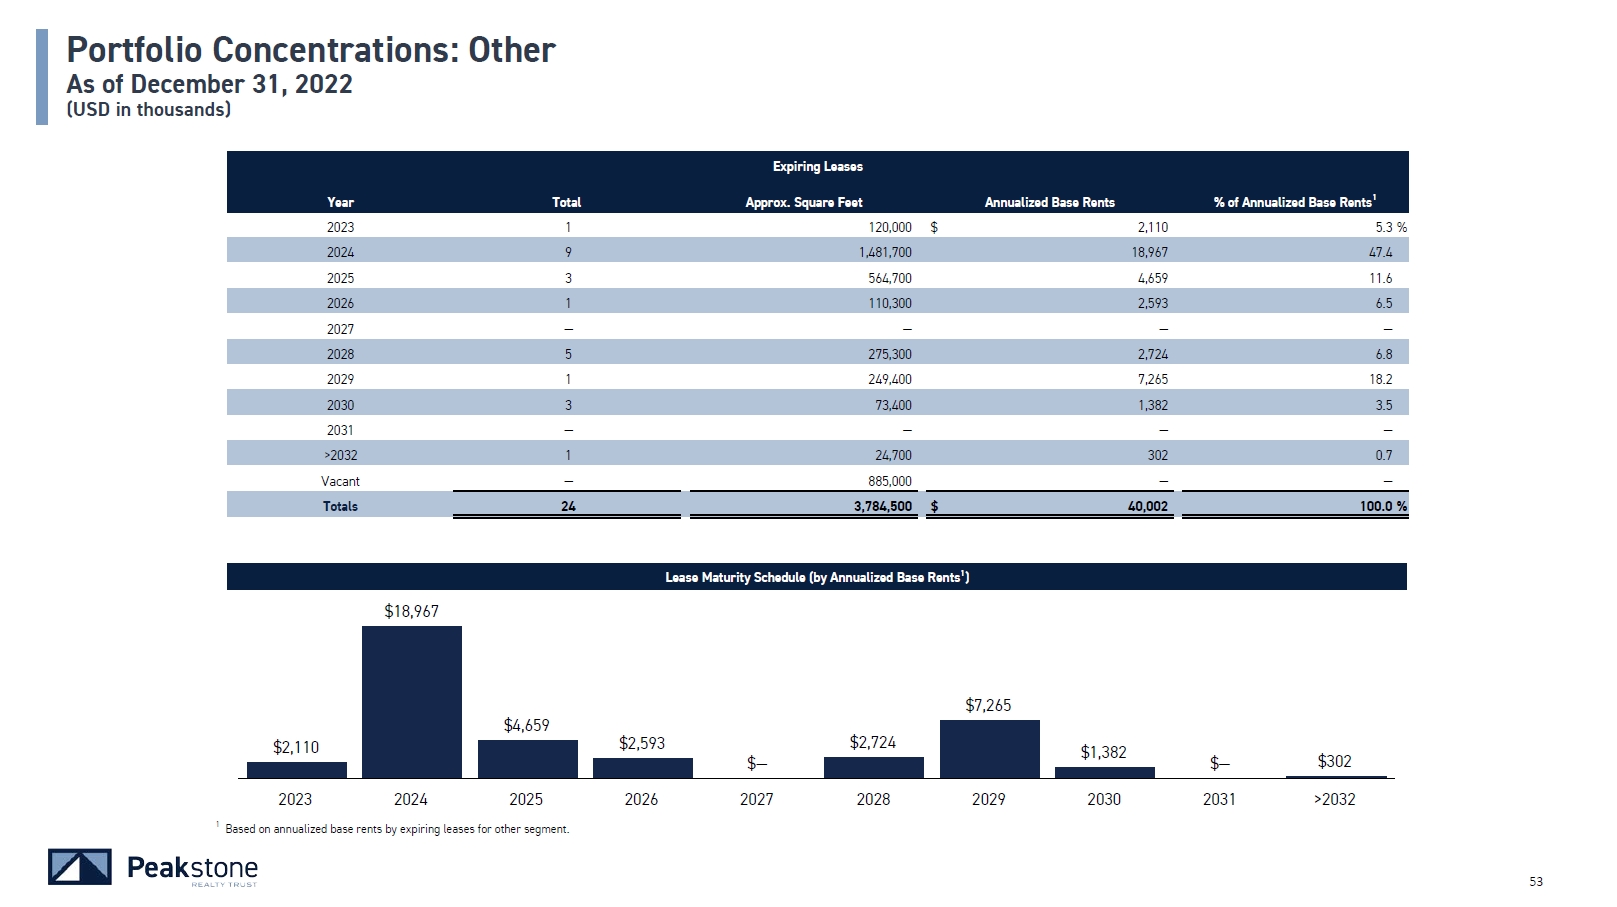
Portfolio Concentrations: Other As of December 31, 2022 (USD in thousands) Lease Maturity Schedule (by Annualized Base Rents1) $18,967 $4,659 $2,593 $— $2,724 $7,265 $1,382 $— $302 2026 2027 2028 2029 2030 2031 >2032 2024 9 1,481,700 18,967 47.4 2025 3 564,700 4,659 11.6 2026 1 110,300 2,593 6.5 2027 — — — — 2028 5 275,300 2,724 6.8 2029 1 249,400 7,265 18.2 2030 3 73,400 1,382 3.5 2031 — — — — >2032 1 24,700 302 0.7 Vacant — 885,000 — — Totals 24 3,784,500 $ 40,002 100.0 % 52 Expiring Leases Year Total Approx. Square Feet Annualized Base Rents % of Annualized Base Rents1 2023 1 120,000 $ 2,110 5.3 % $2,110 2023 2024 2025 1 Based on annualized base rents by expiring leases for other segment.
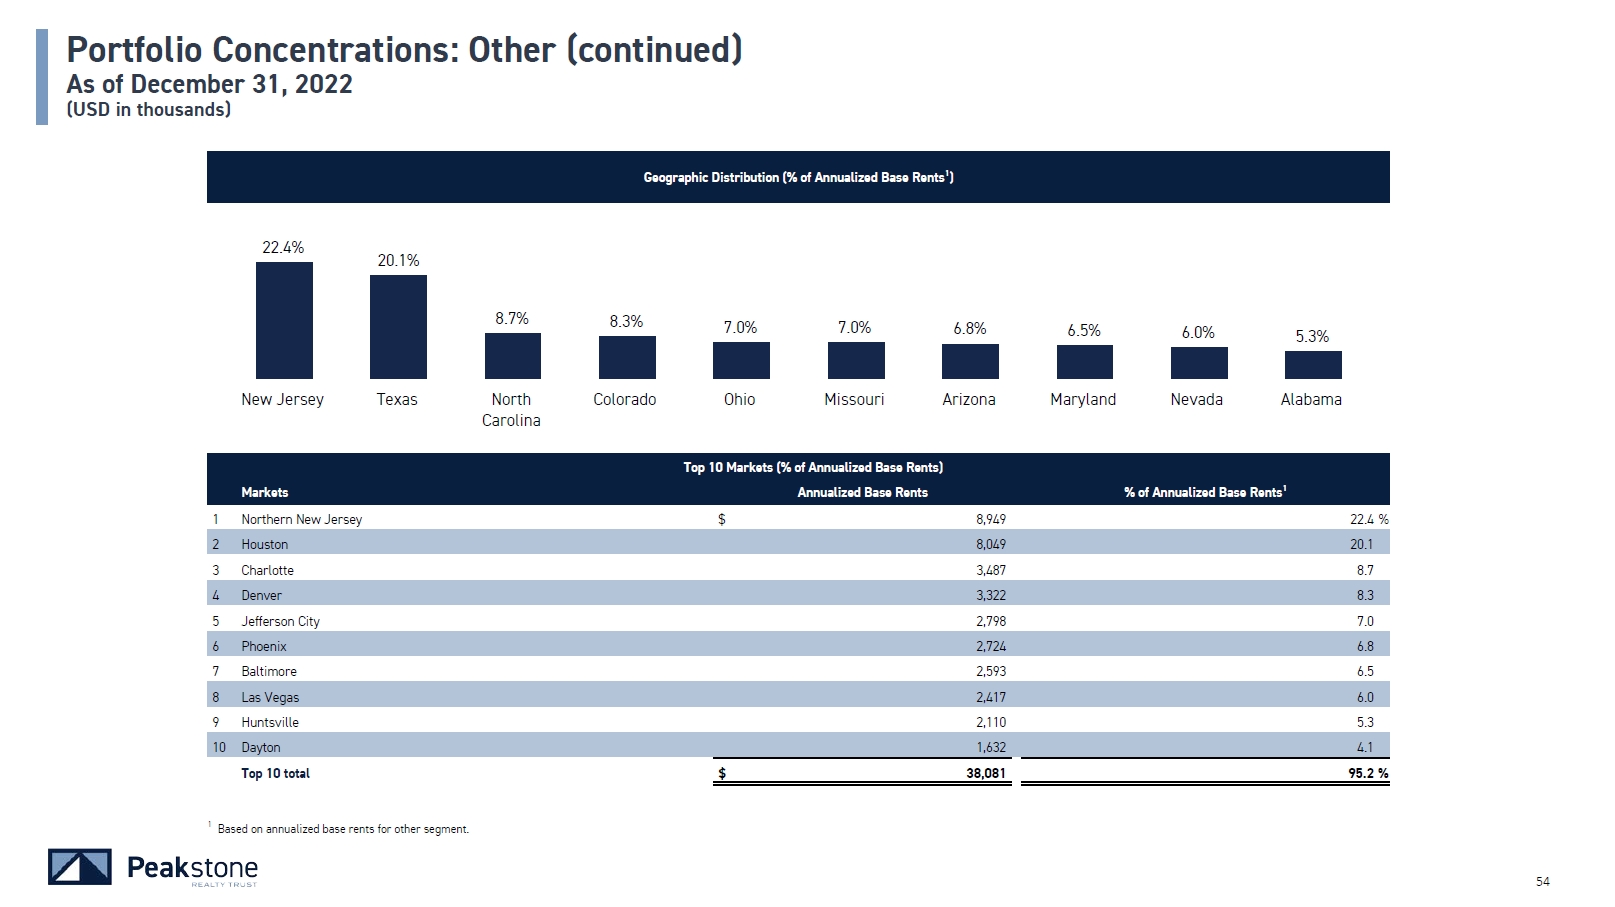
Geographic Distribution (% of Annualized Base Rents1) Portfolio Concentrations: Other (continued) As of December 31, 2022 (USD in thousands) Top 10 Markets (% of Annualized Base Rents) Markets Annualized Base Rents % of Annualized Base Rents1 1 Northern New Jersey $ 8,949 22.4 % 2 Houston 8,049 20.1 3 Charlotte 3,487 8.7 4 Denver 3,322 8.3 5 Jefferson City 2,798 7.0 6 Phoenix 2,724 6.8 7 Baltimore 2,593 6.5 8 Las Vegas 2,417 6.0 9 Huntsville 2,110 5.3 10 Dayton 1,632 4.1 Top 10 total $ 38,081 95.2 % 22.4% 52 20.1% 8.7% 8.3% 7.0% 7.0% 6.8% 6.5% 6.0% 5.3% New Jersey Texas North Carolina Colorado Ohio Missouri Arizona Maryland Nevada Alabama 1 Based on annualized base rents for other segment.

Notes & Definitions
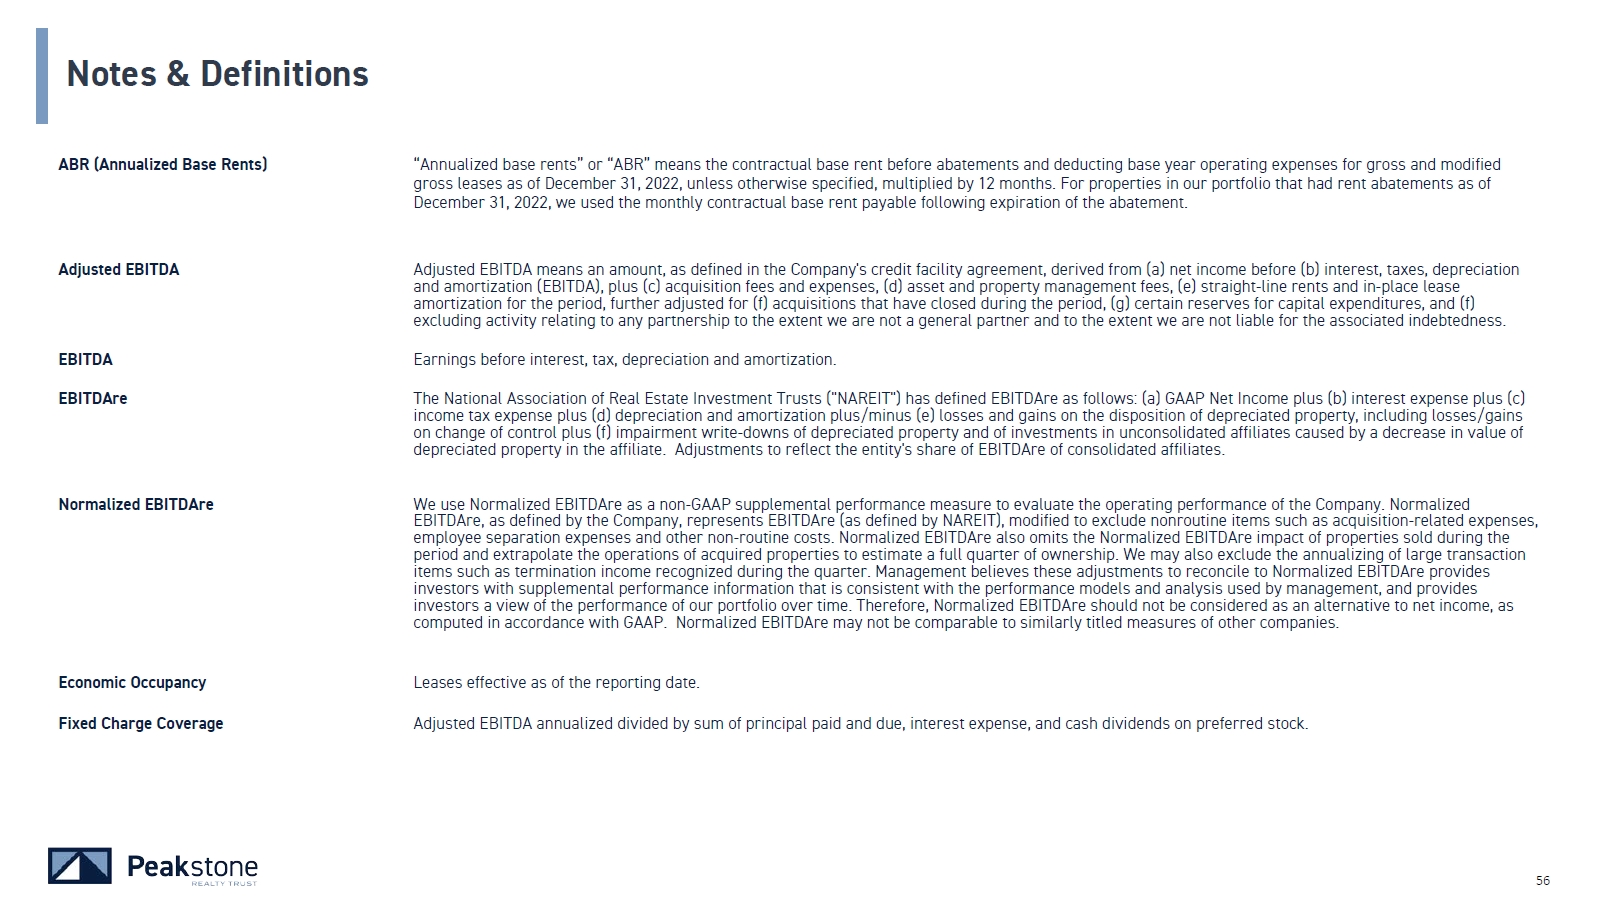
Notes & Definitions ABR (Annualized Base Rents) 56 “Annualized base rents” or “ABR” means the contractual base rent before abatements and deducting base year operating expenses for gross and modified gross leases as of December 31, 2022, unless otherwise specified, multiplied by 12 months. For properties in our portfolio that had rent abatements as of December 31, 2022, we used the monthly contractual base rent payable following expiration of the abatement. Adjusted EBITDA Adjusted EBITDA means an amount, as defined in the Company's credit facility agreement, derived from (a) net income before (b) interest, taxes, depreciation and amortization (EBITDA), plus (c) acquisition fees and expenses, (d) asset and property management fees, (e) straight-line rents and in-place lease amortization for the period, further adjusted for (f) acquisitions that have closed during the period, (g) certain reserves for capital expenditures, and (f) excluding activity relating to any partnership to the extent we are not a general partner and to the extent we are not liable for the associated indebtedness. EBITDA EBITDAre Earnings before interest, tax, depreciation and amortization. The National Association of Real Estate Investment Trusts ("NAREIT") has defined EBITDAre as follows: (a) GAAP Net Income plus (b) interest expense plus (c) income tax expense plus (d) depreciation and amortization plus/minus (e) losses and gains on the disposition of depreciated property, including losses/gains on change of control plus (f) impairment write-downs of depreciated property and of investments in unconsolidated affiliates caused by a decrease in value of depreciated property in the affiliate. Adjustments to reflect the entity's share of EBITDAre of consolidated affiliates. Normalized EBITDAre We use Normalized EBITDAre as a non-GAAP supplemental performance measure to evaluate the operating performance of the Company. Normalized EBITDAre, as defined by the Company, represents EBITDAre (as defined by NAREIT), modified to exclude nonroutine items such as acquisition-related expenses, employee separation expenses and other non-routine costs. Normalized EBITDAre also omits the Normalized EBITDAre impact of properties sold during the period and extrapolate the operations of acquired properties to estimate a full quarter of ownership. We may also exclude the annualizing of large transaction items such as termination income recognized during the quarter. Management believes these adjustments to reconcile to Normalized EBITDAre provides investors with supplemental performance information that is consistent with the performance models and analysis used by management, and provides investors a view of the performance of our portfolio over time. Therefore, Normalized EBITDAre should not be considered as an alternative to net income, as computed in accordance with GAAP. Normalized EBITDAre may not be comparable to similarly titled measures of other companies. Economic Occupancy Leases effective as of the reporting date. Fixed Charge Coverage Adjusted EBITDA annualized divided by sum of principal paid and due, interest expense, and cash dividends on preferred stock.
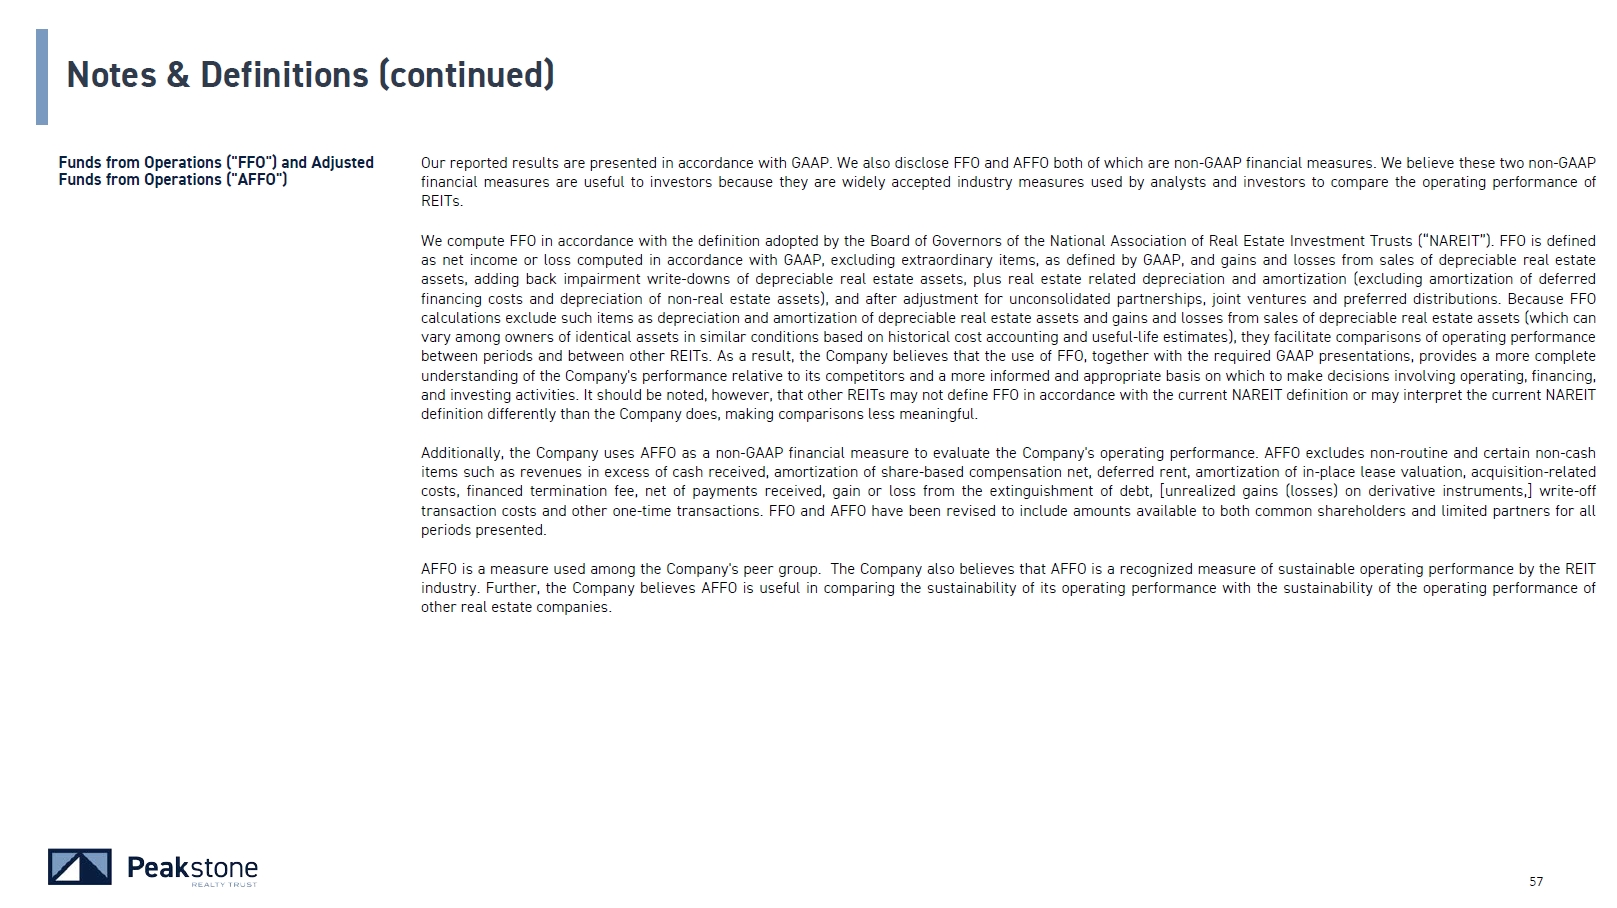
Notes & Definitions (continued) 56 Funds from Operations ("FFO") and Adjusted Funds from Operations ("AFFO") Our reported results are presented in accordance with GAAP. We also disclose FFO and AFFO both of which are non-GAAP financial measures. We believe these two non-GAAP financial measures are useful to investors because they are widely accepted industry measures used by analysts and investors to compare the operating performance of REITs. We compute FFO in accordance with the definition adopted by the Board of Governors of the National Association of Real Estate Investment Trusts (“NAREIT”). FFO is defined as net income or loss computed in accordance with GAAP, excluding extraordinary items, as defined by GAAP, and gains and losses from sales of depreciable real estate assets, adding back impairment write-downs of depreciable real estate assets, plus real estate related depreciation and amortization (excluding amortization of deferred financing costs and depreciation of non-real estate assets), and after adjustment for unconsolidated partnerships, joint ventures and preferred distributions. Because FFO calculations exclude such items as depreciation and amortization of depreciable real estate assets and gains and losses from sales of depreciable real estate assets (which can vary among owners of identical assets in similar conditions based on historical cost accounting and useful-life estimates), they facilitate comparisons of operating performance between periods and between other REITs. As a result, the Company believes that the use of FFO, together with the required GAAP presentations, provides a more complete understanding of the Company's performance relative to its competitors and a more informed and appropriate basis on which to make decisions involving operating, financing, and investing activities. It should be noted, however, that other REITs may not define FFO in accordance with the current NAREIT definition or may interpret the current NAREIT definition differently than the Company does, making comparisons less meaningful. Additionally, the Company uses AFFO as a non-GAAP financial measure to evaluate the Company's operating performance. AFFO excludes non-routine and certain non-cash items such as revenues in excess of cash received, amortization of share-based compensation net, deferred rent, amortization of in-place lease valuation, acquisition-related costs, financed termination fee, net of payments received, gain or loss from the extinguishment of debt, [unrealized gains (losses) on derivative instruments,] write-off transaction costs and other one-time transactions. FFO and AFFO have been revised to include amounts available to both common shareholders and limited partners for all periods presented. AFFO is a measure used among the Company's peer group. The Company also believes that AFFO is a recognized measure of sustainable operating performance by the REIT industry. Further, the Company believes AFFO is useful in comparing the sustainability of its operating performance with the sustainability of the operating performance of other real estate companies.

Notes & Definitions (continued) Funds from Operations ("FFO") and Adjusted Funds from Operations ("AFFO") - cont. 56 Management believes that AFFO is a beneficial indicator of its ongoing portfolio performance and ability to sustain its current distribution level. More specifically, AFFO isolates the financial results of the Company's operations. AFFO, however, is not considered an appropriate measure of historical earnings as it excludes certain significant costs that are otherwise included in reported earnings. Further, since the measure is based on historical financial information, AFFO for the period presented may not be indicative of future results or the Company's future ability to make or sustain distributions. By providing FFO and AFFO, the Company presents information that assists investors in aligning their analysis with management’s analysis of long-term operating activities. For all of these reasons, the Company believes the non-GAAP measures of FFO and AFFO, in addition to net income (loss) are helpful supplemental performance measures and useful to investors in evaluating the performance of the Company's real estate portfolio. However, a material limitation associated with FFO and AFFO is that they are not indicative of the Company's cash available to fund distributions since other uses of cash, such as capital expenditures at the Company's properties and principal payments of debt, are not deducted when calculating FFO and AFFO. The use of AFFO as a measure of long-term operating performance on value is also limited if the Company does not continue to operate under its current business plan as noted above. FFO and AFFO should not be viewed as a more prominent measure of performance than net income (loss) and each should be reviewed in connection with GAAP measurements. Neither the SEC, NAREIT, nor any other applicable regulatory body has opined on the acceptability of the adjustments contemplated to adjust FFO in order to calculate AFFO and its use as a non-GAAP performance measure. In the future, NAREIT may decide to standardize the allowable exclusions across the REIT industry, and the Company may have to adjust the calculation and characterization of this non-GAAP measure. Investment Grade NAV Investment grade companies means companies (e.g., a tenant or a guarantor or non-guarantor parent of a tenant) that have received an investment grade credit rating from a NRSRO approved by the U.S. Securities and Exchange Commission (e.g., Moody’s Investors Service, Inc., S&P Global Ratings and/or Fitch Ratings Inc.) or a company with a non-NRSRO credit rating (e.g., Bloomberg’s default risk rating) that management believes is generally equivalent to an NRSRO investment grade rating; management can provide no assurance as to the comparability of these ratings methodologies or that any particular rating for a company is indicative of the rating that a single NRSRO would provide in the event that it rated all companies for which the Company provides credit ratings; to the extent such companies are rated only by non-NRSRO ratings providers, such ratings providers may use methodologies that are different and less rigorous than those applied by NRSROs; moreover, because PKST provides credit ratings for some companies that are non-guarantor parents of Company's tenants, such credit ratings may not be indicative of the creditworthiness of the relevant tenants. Net asset value. This represents the fair value of our assets less liabilities divided by total shares and OP units outstanding. Net Debt Total debt less cash and cash equivalents (excluding restricted cash). Net Debt (pro rata share) Total debt plus unconsolidated debt (pro rata share), less cash and cash equivalents (excluding restricted cash). Net Rent Net rent is based on (a) the contractual base rental payments assuming the lease requires the tenant to reimburse us for certain operating expenses or the property is self-managed by the tenant and the tenant is responsible for all, or substantially all, of the operating expenses; or (b) contractual rent payments less certain operating expenses that are our responsibility for the 12-month period subsequent to December 31, 2022 and includes assumptions that may not be indicative of the actual future performance of a property, including the assumption that the tenant will perform its obligations under its lease agreement during the next 12 months.

Notes & Definitions (continued) Store Cash NOI Net Operating Income (NOI), Cash NOI, and Same NOI is a non-GAAP measure which includes the revenue and expense directly attributable to our real estate properties. NOI is calculated as total revenue from real estate operations less property expenses, which includes operating property expenses, property tax expenses and management fees. Net operating income on a cash basis (“Cash NOI”) is net operating income adjusted to exclude the effect of straight-line rent and amortization of acquired above- and below- market lease intangibles adjustments required by GAAP. Net operating income on a cash basis for our Same-Store portfolio (“Same-Store Cash NOI”) is Cash NOI for properties held for the entirety of all periods presented. We believe that NOI, Cash NOI and Same-Store Cash NOI are helpful to investors as additional measures of operating performance because we believe they help both investors and management to understand the core operations of our properties excluding corporate and financing-related costs and non-cash depreciation and amortization. NOI, Cash NOI and Same-Store Cash NOI are unlevered operating performance metrics of our properties and allow for a useful comparison of the operating performance of individual assets or groups of assets. These measures thereby provide an operating perspective not immediately apparent from GAAP income from operations or net income. In addition, NOI, Cash NOI and Same-Store Cash NOI are considered by many in the real estate industry to be useful starting points for determining the value of a real estate asset or group of assets. The table below represents a reconciliation of NOI to Cash NOI for the interim periods presented in the "Selected Financial Data" on page 9. 9/30/2022 For the Quarter Ended 6/30/2022 3/31/2022 (Unaudited, USD in thousands) Industrial Office Other Total Portfolio Industrial Office Other Total Portfolio Industrial Office Other Total Portfolio Revenue $ 15,095 $ 72,128 $ 14,107 $ 101,330 $ 14,807 $ 93,494 $ 14,772 $ 123,073 $ 15,500 $ 85,846 $ 14,843 $ 116,189 Operating Property Expense (638) (10,301) (2,777) (13,716) (602) (11,377) (2,356) (14,335) (996) (11,451) (2,596) (15,043) Property Tax Expense (1,005) (1,031) Management Fees (Non-Affiliate) (63) (6,906) (1,826) (9,737) (547) (213) (823) (63) (8,578) (1,873) (11,482) (746) (236) (1,045) (1,028) (7,159) (1,846) (10,033) (63) (743) (233) (1,039) TOTAL NOI 13,389 54,374 9,291 77,054 13,111 72,793 10,307 96,211 13,413 66,493 10,168 90,074 NON-CASH ADJUSTMENTS: Straight Line Rent (456) (2,239) (68) (2,763) (211) (2,666) 245 (2,632) (215) (2,518) 192 (2,541) In-Place Lease Amortization (87) (220) (129) (436) (102) (213) (117) (432) (86) (211) (116) (413) Deferred Termination Income — — (758) (758) — — (758) (758) — — 4 4 Deferred Ground Lease — 490 — 490 — 510 1 511 — 512 (758) (246) Other Intangible Amortization — Inducement Amortization 377 — 377 — — — — — 372 — 372 — 107 — 107 — 368 — 368 — (107) — (107) TOTAL CASH NOI $ 12,846 $ 52,782 $ 8,336 $ 73,964 $ 12,798 $ 70,903 $ 9,678 $ 93,379 $ 13,112 $ 64,537 $ 9,490 $ 87,139 56
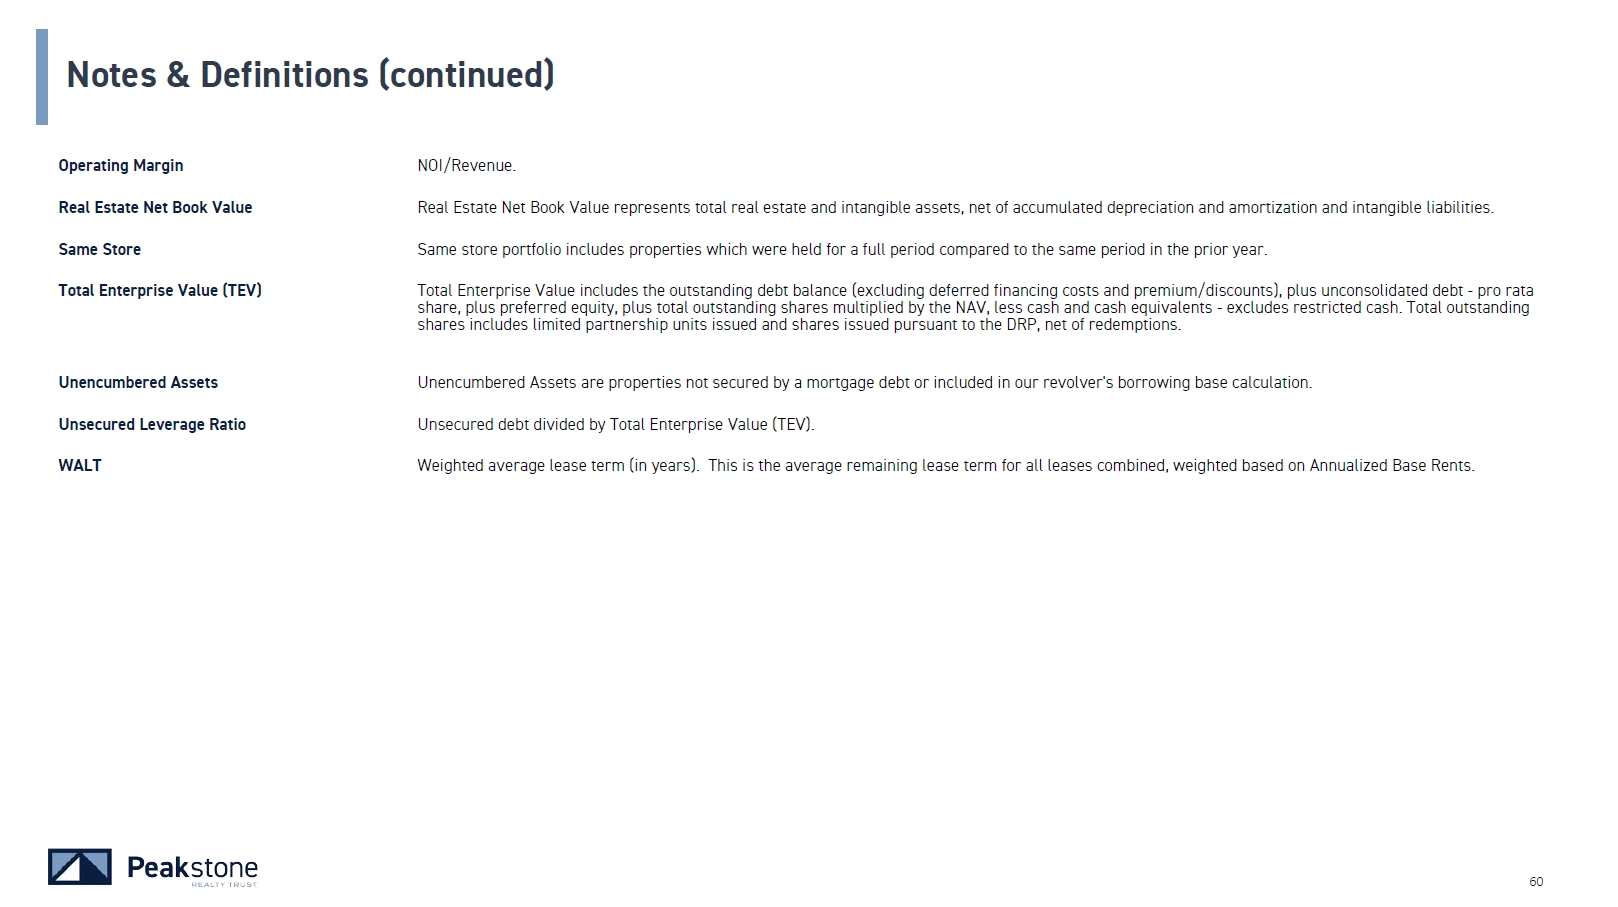
Notes & Definitions (continued) Operating Margin 56 NOI/Revenue. Real Estate Net Book Value Real Estate Net Book Value represents total real estate and intangible assets, net of accumulated depreciation and amortization and intangible liabilities. Same Store Same store portfolio includes properties which were held for a full period compared to the same period in the prior year. Total Enterprise Value (TEV) Total Enterprise Value includes the outstanding debt balance (excluding deferred financing costs and premium/discounts), plus unconsolidated debt - pro rata share, plus preferred equity, plus total outstanding shares multiplied by the NAV, less cash and cash equivalents - excludes restricted cash. Total outstanding shares includes limited partnership units issued and shares issued pursuant to the DRP, net of redemptions. Unencumbered Assets Unencumbered Assets are properties not secured by a mortgage debt or included in our revolver's borrowing base calculation. Unsecured Leverage Ratio Unsecured debt divided by Total Enterprise Value (TEV). WALT Weighted average lease term (in years). This is the average remaining lease term for all leases combined, weighted based on Annualized Base Rents.
Disclaimer 56 Disclaimer on Forward-Looking Statements This document contains statements that constitute forward-looking statements within the meaning of Section 27A of the Securities Act of 1933, as amended (the “Securities Act”), and Section 21E of the Securities Exchange Act of 1934, as amended (the “Exchange Act”). We intend for all such forward-looking statements to be covered by the applicable safe harbor provisions for forward-looking statements contained in Section 27A of the Securities Act and Section 21E of the Exchange Act. Forward-looking statements relate to expectations, beliefs, projections, future plans and strategies, anticipated events or trends and similar expressions concerning matters that are not historical facts. In some cases, you can identify forward-looking statements by the use of forward-looking terminology such as “may,” “will,” “should,” “expects,” “intends,” “plans,” “anticipates,” “believes,” “estimates,” “predicts,” or “potential” or the negative of these words and phrases or similar words or phrases which are predictions of or indicate future events or trends and which do not relate solely to historical matters. You can also identify forward-looking statements by discussions of strategy, plans or intentions. The forward-looking statements contained in this document reflect our current views about future events and are subject to numerous known and unknown risks, uncertainties, assumptions and changes in circumstances that may cause our actual results to differ significantly from those expressed in any forward-looking statement. The following factors, among others, could cause actual results and future events to differ materially from those set forth or contemplated in the forward-looking statements: general economic and financial conditions; market volatility; inflation; any potential recession or threat of recession; interest rates; the impact of the work-from-home trends; recent and ongoing disruption in the debt and banking markets; occupancy, rent deferrals and the financial condition of the Company’s tenants; whether easing of the pandemic, work-from-home trends or other factors will impact the attractiveness of industrial and/or office assets; whether we will be successful in renewing leases as they expire; future financial and operating results, plans, objectives, expectations and intentions; expected sources of financing and the availability and attractiveness of the terms of any such financing; legislative and regulatory changes that could adversely affect our business; our future capital expenditures, operating expenses, net income, operating income, cash flow and developments and trends of the real estate industry; whether a listing of the Company will be completed; whether any such listing will maximize shareholder value; whether we will be successful in the pursuit of our business plan, including any dispositions; whether we will succeed in our investment objectives; any relationship between the trading price of our common shares at listing and our published net asset value; any fluctuation and/or volatility of the trading price of our common shares once listed; risks associated with our dependence on key personnel whose continued service is not guaranteed; risks related to the disruption of management’s attention from ongoing business operations due to pursuit of requirements related to being a listed company; whether we will comply with Sarbanes-Oxley as required of listed companies; and other factors, including those risks disclosed in Part I, Item 1A. “Risk Factors” and Part II, Item 7. “Management’s Discussion and Analysis of Financial Condition and Results of Operations” of the Company’s most recent Annual Report on Form 10-K and Part I, Item 2. “Management’s Discussion and Analysis of Financial Condition and Results of Operations” of the Company’s Quarterly Reports on Form 10-Q filed with the U.S. Securities and Exchange Commission. The Company cautions investors not to place undue reliance on these forward-looking statements and urges you to carefully review the disclosures it makes concerning risks. While forward-looking statements reflect the Company’s good faith beliefs, assumptions and expectations, they are not guarantees of future performance. The forward-looking statements speak only as of the date of this document. Furthermore, the Company disclaims any obligation to publicly update or revise any forward- looking statement to reflect changes in underlying assumptions or factors, of new information, data or methods, future events or other changes.