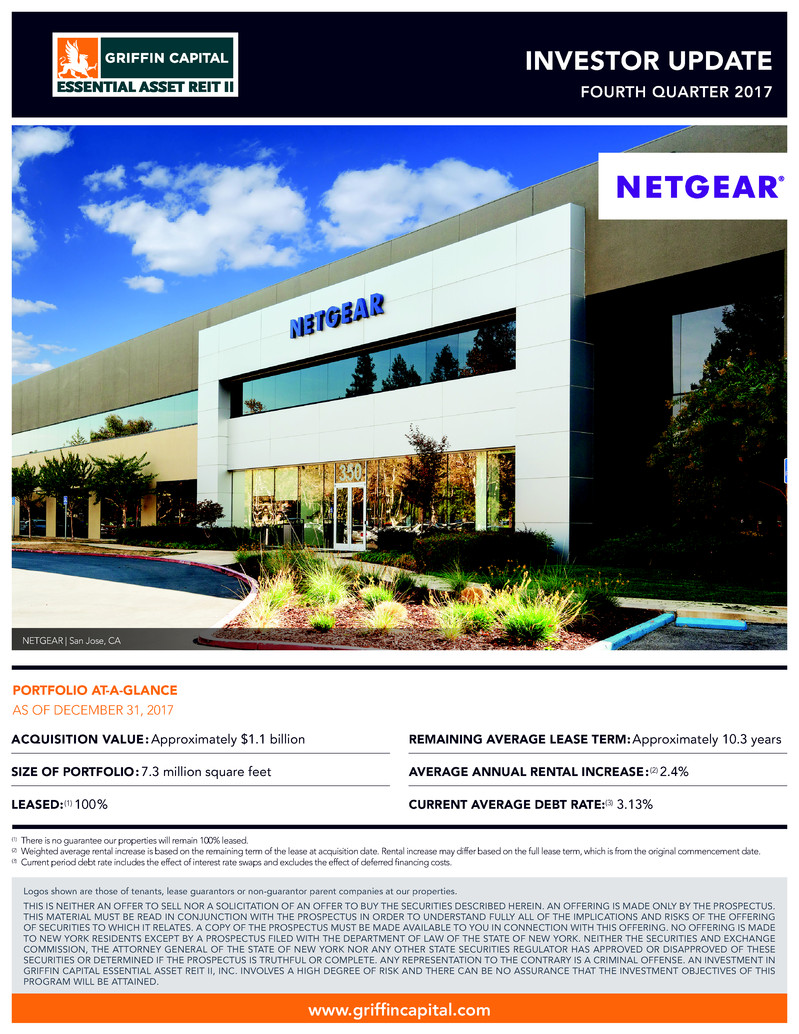
INVESTOR UPDATE FOURTH QUARTER 2017 ACQUISITION VALUE: Approximately $1.1 billion SIZE OF PORTFOLIO: 7.3 million square feet LEASED:(1) 100% REMAINING AVERAGE LEASE TERM: Approximately 10.3 years AVERAGE ANNUAL RENTAL INCREASE: (2) 2.4% CURRENT AVERAGE DEBT RATE:(3) 3.13% PORTFOLIO AT-A-GLANCE AS OF DECEMBER 31, 2017 (1) There is no guarantee our properties will remain 100% leased. (2) Weighted average rental increase is based on the remaining term of the lease at acquisition date. Rental increase may differ based on the full lease term, which is from the original commencement date. (3) Current period debt rate includes the effect of interest rate swaps and excludes the effect of deferred financing costs. NETGEAR | San Jose, CA www.griffincapital.com Logos shown are those of tenants, lease guarantors or non-guarantor parent companies at our properties. THIS IS NEITHER AN OFFER TO SELL NOR A SOLICITATION OF AN OFFER TO BUY THE SECURITIES DESCRIBED HEREIN. AN OFFERING IS MADE ONLY BY THE PROSPECTUS. THIS MATERIAL MUST BE READ IN CONJUNCTION WITH THE PROSPECTUS IN ORDER TO UNDERSTAND FULLY ALL OF THE IMPLICATIONS AND RISKS OF THE OFFERING OF SECURITIES TO WHICH IT RELATES. A COPY OF THE PROSPECTUS MUST BE MADE AVAILABLE TO YOU IN CONNECTION WITH THIS OFFERING. NO OFFERING IS MADE TO NEW YORK RESIDENTS EXCEPT BY A PROSPECTUS FILED WITH THE DEPARTMENT OF LAW OF THE STATE OF NEW YORK. NEITHER THE SECURITIES AND EXCHANGE COMMISSION, THE ATTORNEY GENERAL OF THE STATE OF NEW YORK NOR ANY OTHER STATE SECURITIES REGULATOR HAS APPROVED OR DISAPPROVED OF THESE SECURITIES OR DETERMINED IF THE PROSPECTUS IS TRUTHFUL OR COMPLETE. ANY REPRESENTATION TO THE CONTRARY IS A CRIMINAL OFFENSE. AN INVESTMENT IN GRIFFIN CAPITAL ESSENTIAL ASSET REIT II, INC. INVOLVES A HIGH DEGREE OF RISK AND THERE CAN BE NO ASSURANCE THAT THE INVESTMENT OBJECTIVES OF THIS PROGRAM WILL BE ATTAINED.
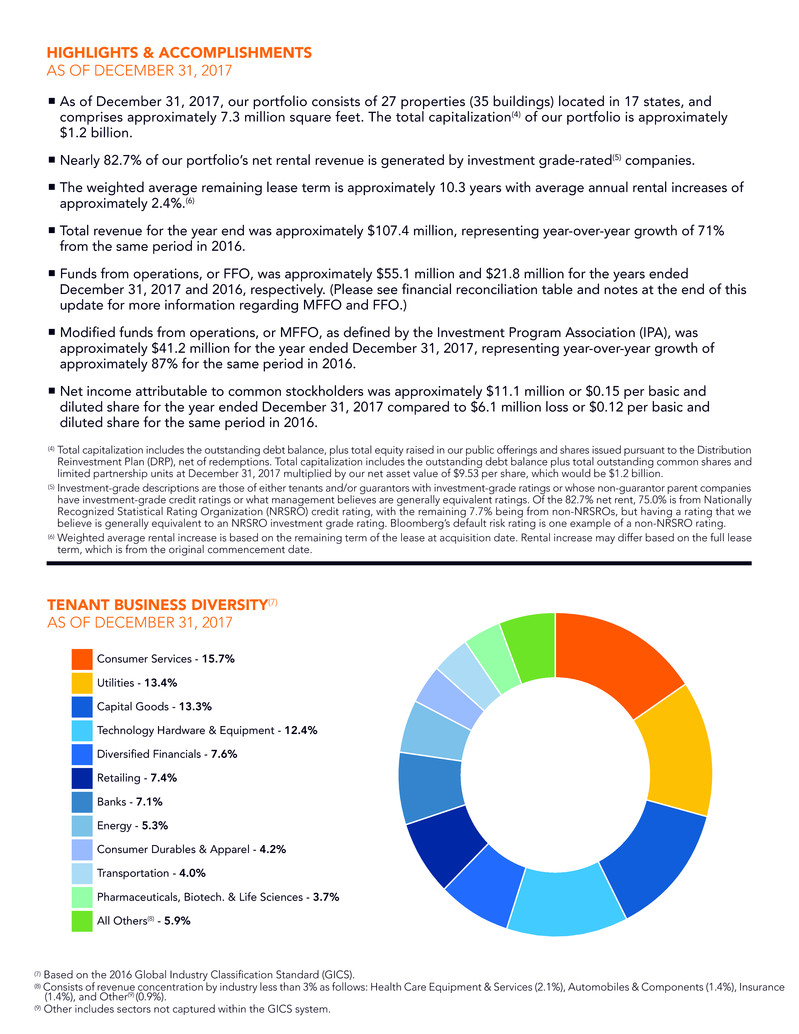
TENANT BUSINESS DIVERSITY(7) AS OF DECEMBER 31, 2017 As of December 31, 2017, our portfolio consists of 27 properties (35 buildings) located in 17 states, and comprises approximately 7.3 million square feet. The total capitalization(4) of our portfolio is approximately $1.2 billion. Nearly 82.7% of our portfolio’s net rental revenue is generated by investment grade-rated(5) companies. The weighted average remaining lease term is approximately 10.3 years with average annual rental increases of approximately 2.4%.(6) Total revenue for the year end was approximately $107.4 million, representing year-over-year growth of 71% from the same period in 2016. Funds from operations, or FFO, was approximately $55.1 million and $21.8 million for the years ended December 31, 2017 and 2016, respectively. (Please see financial reconciliation table and notes at the end of this update for more information regarding MFFO and FFO.) Modified funds from operations, or MFFO, as defined by the Investment Program Association (IPA), was approximately $41.2 million for the year ended December 31, 2017, representing year-over-year growth of approximately 87% for the same period in 2016. Net income attributable to common stockholders was approximately $11.1 million or $0.15 per basic and diluted share for the year ended December 31, 2017 compared to $6.1 million loss or $0.12 per basic and diluted share for the same period in 2016. HIGHLIGHTS & ACCOMPLISHMENTS AS OF DECEMBER 31, 2017 (7) Based on the 2016 Global Industry Classification Standard (GICS). (8) Consists of revenue concentration by industry less than 3% as follows: Health Care Equipment & Services (2.1%), Automobiles & Components (1.4%), Insurance (1.4%), and Other(9) (0.9%). (9) Other includes sectors not captured within the GICS system. (4) Total capitalization includes the outstanding debt balance, plus total equity raised in our public offerings and shares issued pursuant to the Distribution Reinvestment Plan (DRP), net of redemptions. Total capitalization includes the outstanding debt balance plus total outstanding common shares and limited partnership units at December 31, 2017 multiplied by our net asset value of $9.53 per share, which would be $1.2 billion. (5) Investment-grade descriptions are those of either tenants and/or guarantors with investment-grade ratings or whose non-guarantor parent companies have investment-grade credit ratings or what management believes are generally equivalent ratings. Of the 82.7% net rent, 75.0% is from Nationally Recognized Statistical Rating Organization (NRSRO) credit rating, with the remaining 7.7% being from non-NRSROs, but having a rating that we believe is generally equivalent to an NRSRO investment grade rating. Bloomberg’s default risk rating is one example of a non-NRSRO rating. (6) Weighted average rental increase is based on the remaining term of the lease at acquisition date. Rental increase may differ based on the full lease term, which is from the original commencement date. Consumer Services - 15.7% Utilities - 13.4% Capital Goods - 13.3% Technology Hardware & Equipment - 12.4% Diversified Financials - 7.6% Retailing - 7.4% Banks - 7.1% Energy - 5.3% Consumer Durables & Apparel - 4.2% Transportation - 4.0% Pharmaceuticals, Biotech. & Life Sciences - 3.7% All Others(8) - 5.9%

9 10 5 4 2 1 3 8 7 611 12 13 14 PROPERTY MAP AS OF DECEMBER 31, 2017 15 16 17 18 19 20 21 22 27 23 24 25 26 Owens Corning Light Manufacturing Building Concord, NC Acquisition Date: 03.09.15 Wood Group USA Headquarters Houston, TX Acquisition Date: 04.01.15 Administrative Offices of Pennsylvania Courts Admin. Office Building Mechanicsburg, PA Acquisition Date: 04.22.15 American Express Travel Related Services Information & Processing Technical Resource Center Phoenix, AZ Acquisition Date: 05.11.15 Exel Distribution Warehouse Groveport, OH Acquisition Date: 06.30.15 Rapiscan Systems Office/R&D Andover, MA Acquisition Date: 07.01.15 FedEx Freight Regional Hub West Jefferson, OH Acquisition Date: 07.22.15 Aetna Life Insurance Company Workers’ Compensation Headquarters Building Tucson, AZ Acquisition Date: 07.29.15 NETGEAR World Headquarters San Jose, CA Acquisition Date: 05.17.16 Nike, Inc. Evergreen Technology Campus Hillsboro, OR Acquisition Date: 06.16.16 Zebra Technologies Corporate Headquarters Lincolnshire, IL Acquisition Date: 08.01.16 WABCO Assembly & Distribution Facility North Charleston, SC Acquisition Date: 09.14.16 Southern Company Regional Office Birmingham, AL Acquisition Date: 12.22.16 Allstate Insurance Company Regional Office Building Lone Tree, CO Acquisition Date: 1.31.17 Midcontinent Independent System Operator, Inc. (MISO) Headquarters Building Carmel, IN Acquisition Date: 5.15.17 1 2 3 4 9 10 11 12 17 18 19 20 25 26 27
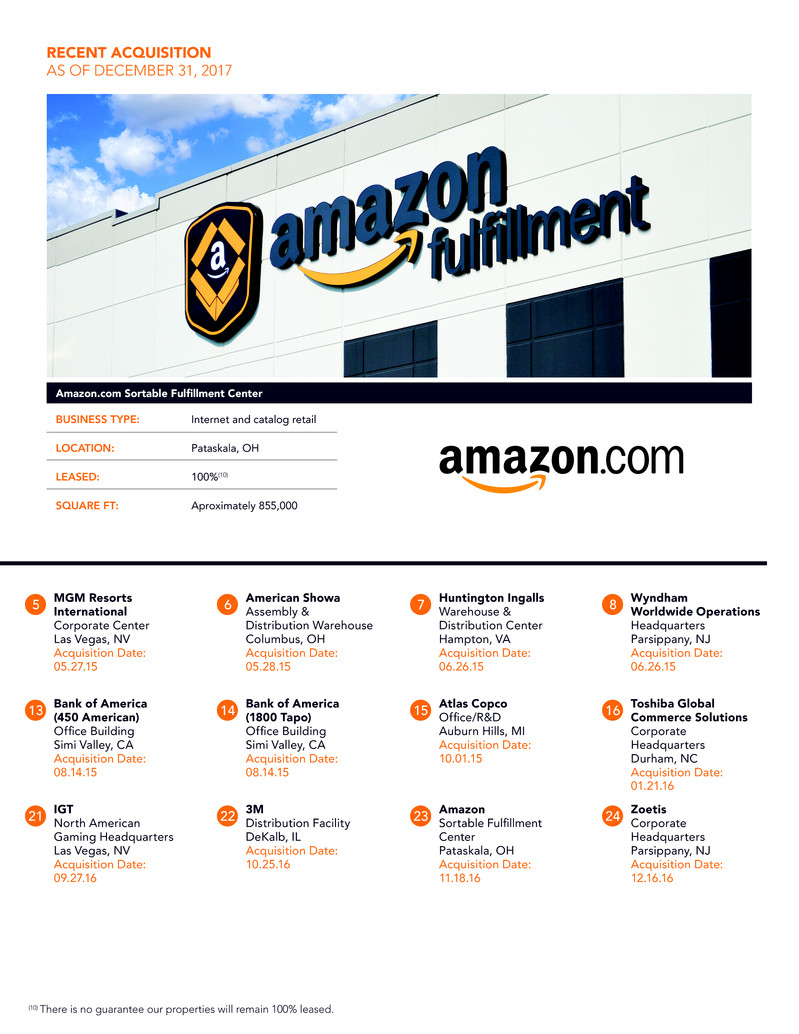
MGM Resorts International Corporate Center Las Vegas, NV Acquisition Date: 05.27.15 American Showa Assembly & Distribution Warehouse Columbus, OH Acquisition Date: 05.28.15 Huntington Ingalls Warehouse & Distribution Center Hampton, VA Acquisition Date: 06.26.15 Wyndham Worldwide Operations Headquarters Parsippany, NJ Acquisition Date: 06.26.15 Bank of America (450 American) Office Building Simi Valley, CA Acquisition Date: 08.14.15 Bank of America (1800 Tapo) Office Building Simi Valley, CA Acquisition Date: 08.14.15 Atlas Copco Office/R&D Auburn Hills, MI Acquisition Date: 10.01.15 Toshiba Global Commerce Solutions Corporate Headquarters Durham, NC Acquisition Date: 01.21.16 IGT North American Gaming Headquarters Las Vegas, NV Acquisition Date: 09.27.16 3M Distribution Facility DeKalb, IL Acquisition Date: 10.25.16 Amazon Sortable Fulfillment Center Pataskala, OH Acquisition Date: 11.18.16 Zoetis Corporate Headquarters Parsippany, NJ Acquisition Date: 12.16.16 5 6 7 8 13 14 15 16 21 22 23 24 (10) There is no guarantee our properties will remain 100% leased. RECENT ACQUISITION AS OF DECEMBER 31, 2017 Amazon.com Sortable Fulfillment Center BUSINESS TYPE: Internet and catalog retail LOCATION: Pataskala, OH LEASED: 100%(10) SQUARE FT: Aproximately 855,000 Owens Corning Light Manufacturing Building Concord, NC Acquisition Date: 03.09.15 Wood Group USA Headquarters Houston, TX Acquisition Date: 04.01.15 Administrative Offices of Pennsylvania Courts Admin. Office Building Mechanicsburg, PA Acquisition Date: 04.22.15 American Express Travel Related Services Information & Processing Technical Resource Center Phoenix, AZ Acquisition Date: 05.11.15 Exel Distribution Warehouse Groveport, OH Acquisition Date: 06.30.15 Rapiscan Systems Office/R&D Andover, MA Acquisition Date: 07.01.15 FedEx Freight Regional Hub West Jefferson, OH Acquisition Date: 07.22.15 Aetna Life Insurance Company Workers’ Compensation Headquarters Building Tucson, AZ Acquisition Date: 07.29.15 NETGEAR World Headquarters San Jose, CA Acquisition Date: 05.17.16 Nike, Inc. Evergreen Technology Campus Hillsboro, OR Acquisition Date: 06.16.16 Zebra Technologies Corporate Headquarters Lincolnshire, IL Acquisition Date: 08.01.16 WABCO Assembly & Distribution Facility North Charleston, SC Acquisition Date: 09.14.16 Southern Company Regional Office Birmingham, AL Acquisition Date: 12.22.16 Allstate Insurance Company Regional Office Building Lone Tree, CO Acquisition Date: 1.31.17 Midcontinent Independent System Operator, Inc. (MISO) Headquarters Building Carmel, IN Acquisition Date: 5.15.17 1 2 3 4 9 10 11 12 17 18 19 20 25 26 27
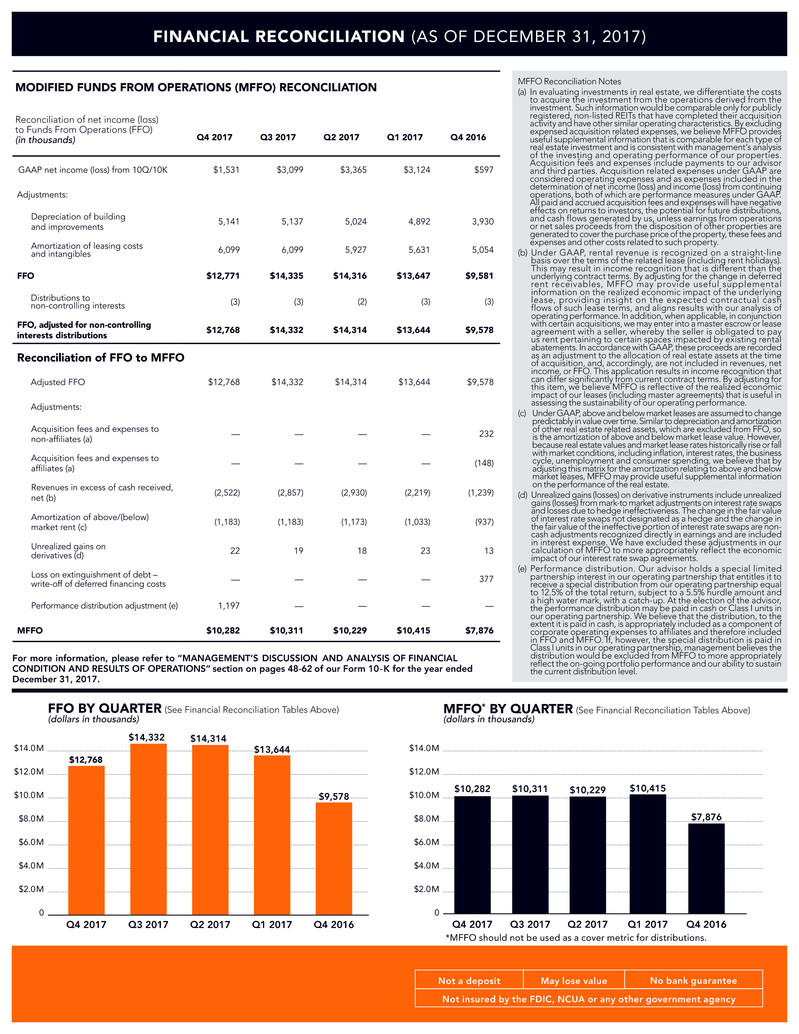
$14.0M $12.0M $10.0M $8.0M $6.0M $4.0M $2.0M 0 $14.0M $12.0M $10.0M $8.0M $6.0M $4.0M $2.0M 0 FINANCIAL RECONCILIATION (AS OF DECEMBER 31, 2017) Not insured by the FDIC, NCUA or any other government agency Not a deposit May lose value No bank guarantee MODIFIED FUNDS FROM OPERATIONS (MFFO) RECONCILIATION Reconciliation of net income (loss) to Funds From Operations (FFO) (in thousands) Q4 2017 Q3 2017 Q2 2017 Q1 2017 Q4 2016 GAAP net income (loss) from 10Q/10K $1,531 $3,099 $3,365 $3,124 $597 Adjustments: Depreciation of building and improvements 5,141 5,137 5,024 4,892 3,930 Amortization of leasing costs and intangibles 6,099 6,099 5,927 5,631 5,054 FFO $12,771 $14,335 $14,316 $13,647 $9,581 Distributions to non-controlling interests (3) (3) (2) (3) (3) FFO, adjusted for non-controlling interests distributions $12,768 $14,332 $14,314 $13,644 $9,578 Reconciliation of FFO to MFFO Adjusted FFO $12,768 $14,332 $14,314 $13,644 $9,578 Adjustments: Acquisition fees and expenses to non-affiliates (a) — — — — 232 Acquisition fees and expenses to affiliates (a) — — — — (148) Revenues in excess of cash received, net (b) (2,522) (2,857) (2,930) (2,219) (1,239) Amortization of above/(below) market rent (c) (1,183) (1,183) (1,173) (1,033) (937) Unrealized gains on derivatives (d) 22 19 18 23 13 Loss on extinguishment of debt – write-off of deferred financing costs — — — — 377 Performance distribution adjustment (e) 1,197 — — — — MFFO $10,282 $10,311 $10,229 $10,415 $7,876 For more information, please refer to “MANAGEMENT’S DISCUSSION AND ANALYSIS OF FINANCIAL CONDITION AND RESULTS OF OPERATIONS” section on pages 48-62 of our Form 10-K for the year ended December 31, 2017. MFFO Reconciliation Notes (a) In evaluating investments in real estate, we differentiate the costs to acquire the investment from the operations derived from the investment. Such information would be comparable only for publicly registered, non-listed REITs that have completed their acquisition activity and have other similar operating characteristics. By excluding expensed acquisition related expenses, we believe MFFO provides useful supplemental information that is comparable for each type of real estate investment and is consistent with management’s analysis of the investing and operating performance of our properties. Acquisition fees and expenses include payments to our advisor and third parties. Acquisition related expenses under GAAP are considered operating expenses and as expenses included in the determination of net income (loss) and income (loss) from continuing operations, both of which are performance measures under GAAP. All paid and accrued acquisition fees and expenses will have negative effects on returns to investors, the potential for future distributions, and cash flows generated by us, unless earnings from operations or net sales proceeds from the disposition of other properties are generated to cover the purchase price of the property, these fees and expenses and other costs related to such property. (b) Under GAAP, rental revenue is recognized on a straight-line basis over the terms of the related lease (including rent holidays). This may result in income recognition that is different than the underlying contract terms. By adjusting for the change in deferred rent receivables, MFFO may provide useful supplemental information on the realized economic impact of the underlying lease, providing insight on the expected contractual cash flows of such lease terms, and aligns results with our analysis of operating performance. In addition, when applicable, in conjunction with certain acquisitions, we may enter into a master escrow or lease agreement with a seller, whereby the seller is obligated to pay us rent pertaining to certain spaces impacted by existing rental abatements. In accordance with GAAP, these proceeds are recorded as an adjustment to the allocation of real estate assets at the time of acquisition, and, accordingly, are not included in revenues, net income, or FFO. This application results in income recognition that can differ significantly from current contract terms. By adjusting for this item, we believe MFFO is reflective of the realized economic impact of our leases (including master agreements) that is useful in assessing the sustainability of our operating performance. (c) Under GAAP, above and below market leases are assumed to change predictably in value over time. Similar to depreciation and amortization of other real estate related assets, which are excluded from FFO, so is the amortization of above and below market lease value. However, because real estate values and market lease rates historically rise or fall with market conditions, including inflation, interest rates, the business cycle, unemployment and consumer spending, we believe that by adjusting this matrix for the amortization relating to above and below market leases, MFFO may provide useful supplemental information on the performance of the real estate. (d) Unrealized gains (losses) on derivative instruments include unrealized gains (losses) from mark-to market adjustments on interest rate swaps and losses due to hedge ineffectiveness. The change in the fair value of interest rate swaps not designated as a hedge and the change in the fair value of the ineffective portion of interest rate swaps are non- cash adjustments recognized directly in earnings and are included in interest expense. We have excluded these adjustments in our calculation of MFFO to more appropriately reflect the economic impact of our interest rate swap agreements. (e) Performance distribution. Our advisor holds a special limited partnership interest in our operating partnership that entitles it to receive a special distribution from our operating partnership equal to 12.5% of the total return, subject to a 5.5% hurdle amount and a high water mark, with a catch-up. At the election of the advisor, the performance distribution may be paid in cash or Class I units in our operating partnership. We believe that the distribution, to the extent it is paid in cash, is appropriately included as a component of corporate operating expenses to affiliates and therefore included in FFO and MFFO. If, however, the special distribution is paid in Class I units in our operating partnership, management believes the distribution would be excluded from MFFO to more appropriately reflect the on-going portfolio performance and our ability to sustain the current distribution level. *MFFO should not be used as a cover metric for distributions. FFO BY QUARTER (See Financial Reconciliation Tables Above) MFFO* BY QUARTER (See Financial Reconciliation Tables Above) Q4 2016 $13,644 $14,314 $9,578 Q4 2016 $7,876 Q1 2017Q2 2017 Q1 2017 $10,415 Q2 2017 $10,229 (dollars in thousands) (dollars in thousands) $14,332 $12,768 Q3 2017Q4 2017 Q3 2017Q4 2017 $10,311$10,282
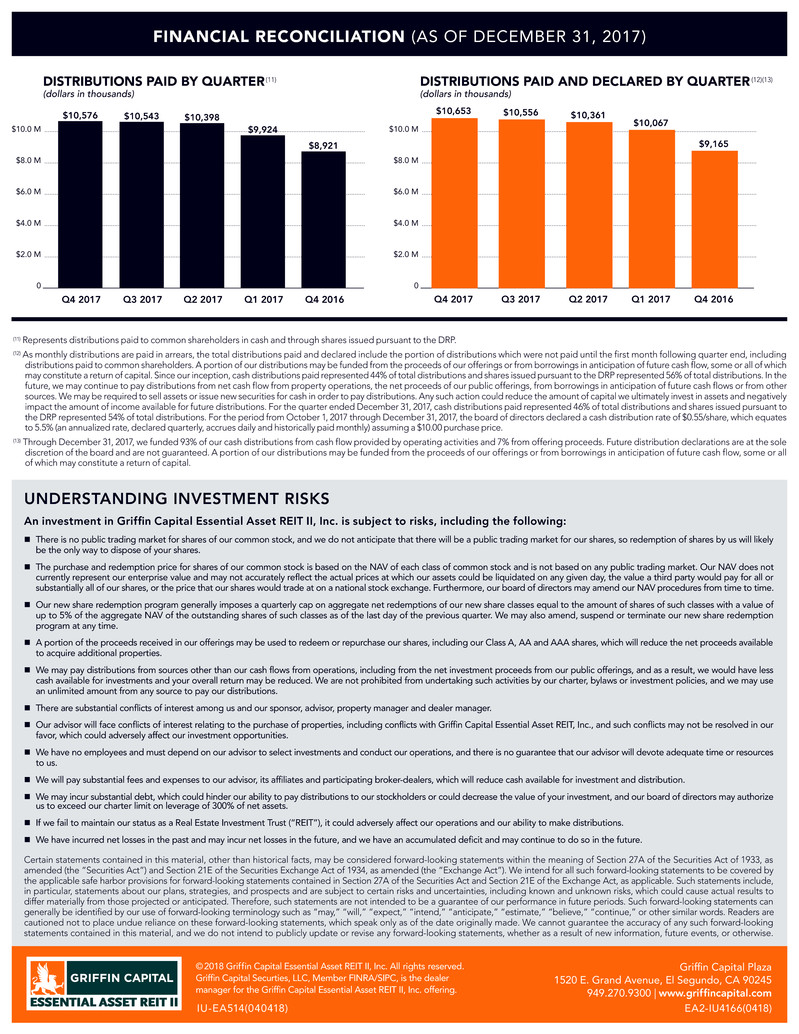
$10.0 M $8.0 M $6.0 M $4.0 M $2.0 M 0 IU-EA514(040418) Griffin Capital Plaza 1520 E. Grand Avenue, El Segundo, CA 90245 949.270.9300 | www.griffincapital.com EA2-IU4166(0418) © 2018 Griffin Capital Essential Asset REIT II, Inc. All rights reserved. Griffin Capital Securties, LLC, Member FINRA/SIPC, is the dealer manager for the Griffin Capital Essential Asset REIT II, Inc. offering. FINANCIAL RECONCILIATION (AS OF DECEMBER 31, 2017) (11) Represents distributions paid to common shareholders in cash and through shares issued pursuant to the DRP. (12) As monthly distributions are paid in arrears, the total distributions paid and declared include the portion of distributions which were not paid until the first month following quarter end, including distributions paid to common shareholders. A portion of our distributions may be funded from the proceeds of our offerings or from borrowings in anticipation of future cash flow, some or all of which may constitute a return of capital. Since our inception, cash distributions paid represented 44% of total distributions and shares issued pursuant to the DRP represented 56% of total distributions. In the future, we may continue to pay distributions from net cash flow from property operations, the net proceeds of our public offerings, from borrowings in anticipation of future cash flows or from other sources. We may be required to sell assets or issue new securities for cash in order to pay distributions. Any such action could reduce the amount of capital we ultimately invest in assets and negatively impact the amount of income available for future distributions. For the quarter ended December 31, 2017, cash distributions paid represented 46% of total distributions and shares issued pursuant to the DRP represented 54% of total distributions. For the period from October 1, 2017 through December 31, 2017, the board of directors declared a cash distribution rate of $0.55/share, which equates to 5.5% (an annualized rate, declared quarterly, accrues daily and historically paid monthly) assuming a $10.00 purchase price. (13) Through December 31, 2017, we funded 93% of our cash distributions from cash flow provided by operating activities and 7% from offering proceeds. Future distribution declarations are at the sole discretion of the board and are not guaranteed. A portion of our distributions may be funded from the proceeds of our offerings or from borrowings in anticipation of future cash flow, some or all of which may constitute a return of capital. UNDERSTANDING INVESTMENT RISKS An investment in Griffin Capital Essential Asset REIT II, Inc. is subject to risks, including the following: n There is no public trading market for shares of our common stock, and we do not anticipate that there will be a public trading market for our shares, so redemption of shares by us will likely be the only way to dispose of your shares. n The purchase and redemption price for shares of our common stock is based on the NAV of each class of common stock and is not based on any public trading market. Our NAV does not currently represent our enterprise value and may not accurately reflect the actual prices at which our assets could be liquidated on any given day, the value a third party would pay for all or substantially all of our shares, or the price that our shares would trade at on a national stock exchange. Furthermore, our board of directors may amend our NAV procedures from time to time. n Our new share redemption program generally imposes a quarterly cap on aggregate net redemptions of our new share classes equal to the amount of shares of such classes with a value of up to 5% of the aggregate NAV of the outstanding shares of such classes as of the last day of the previous quarter. We may also amend, suspend or terminate our new share redemption program at any time. n A portion of the proceeds received in our offerings may be used to redeem or repurchase our shares, including our Class A, AA and AAA shares, which will reduce the net proceeds available to acquire additional properties. n We may pay distributions from sources other than our cash flows from operations, including from the net investment proceeds from our public offerings, and as a result, we would have less cash available for investments and your overall return may be reduced. We are not prohibited from undertaking such activities by our charter, bylaws or investment policies, and we may use an unlimited amount from any source to pay our distributions. n There are substantial conflicts of interest among us and our sponsor, advisor, property manager and dealer manager. n Our advisor will face conflicts of interest relating to the purchase of properties, including conflicts with Griffin Capital Essential Asset REIT, Inc., and such conflicts may not be resolved in our favor, which could adversely affect our investment opportunities. n We have no employees and must depend on our advisor to select investments and conduct our operations, and there is no guarantee that our advisor will devote adequate time or resources to us. n We will pay substantial fees and expenses to our advisor, its affiliates and participating broker-dealers, which will reduce cash available for investment and distribution. n We may incur substantial debt, which could hinder our ability to pay distributions to our stockholders or could decrease the value of your investment, and our board of directors may authorize us to exceed our charter limit on leverage of 300% of net assets. n If we fail to maintain our status as a Real Estate Investment Trust (“REIT”), it could adversely affect our operations and our ability to make distributions. n We have incurred net losses in the past and may incur net losses in the future, and we have an accumulated deficit and may continue to do so in the future. DISTRIBUTIONS PAID AND DECLARED BY QUARTER (12)(13)DISTRIBUTIONS PAID BY QUARTER (11) $10.0 M $8.0 M $6.0 M $4.0 M $2.0 M 0 Certain statements contained in this material, other than historical facts, may be considered forward-looking statements within the meaning of Section 27A of the Securities Act of 1933, as amended (the “Securities Act”) and Section 21E of the Securities Exchange Act of 1934, as amended (the “Exchange Act”). We intend for all such forward-looking statements to be covered by the applicable safe harbor provisions for forward-looking statements contained in Section 27A of the Securities Act and Section 21E of the Exchange Act, as applicable. Such statements include, in particular, statements about our plans, strategies, and prospects and are subject to certain risks and uncertainties, including known and unknown risks, which could cause actual results to differ materially from those projected or anticipated. Therefore, such statements are not intended to be a guarantee of our performance in future periods. Such forward-looking statements can generally be identified by our use of forward-looking terminology such as “may,” “will,” “expect,” “intend,” “anticipate,” “estimate,” “believe,” “continue,” or other similar words. Readers are cautioned not to place undue reliance on these forward-looking statements, which speak only as of the date originally made. We cannot guarantee the accuracy of any such forward-looking statements contained in this material, and we do not intend to publicly update or revise any forward-looking statements, whether as a result of new information, future events, or otherwise. Q3 2017 $10,556 Q4 2017 $10,653 (dollars in thousands) (dollars in thousands) Q3 2017 $10,543 Q4 2017 $10,576 Q2 2017 $10,398 Q4 2016 $8,921 Q1 2017 $9,924 Q2 2017 $10,361 Q4 2016 $9,165 Q1 2017 $10,067


