Exhibit 99.1
Full Year 2015 Earnings PresentationFebruary 29, 2016
This presentation contains forward-looking statements. These forward-looking statements include, but are not limited to, all statements other than statements of historical facts contained in this presentation, including, without limitation, those regarding our future financial position and results of operations, our strategy, plans, objectives, goals and targets, future developments in the markets in which we operate or are seeking to operate or anticipated regulatory changes in the markets in which we operate or intend to operate. In some cases, you can identify forward-looking statements by terminology such as “aim,” “anticipate,” “believe,” “continue,” “could,” “estimate,” “expect,” “forecast,” “guidance,” “intend,” “is likely to,” “may,” “plan,” “potential,” “predict,” “projected,” “should” or “will” or the negative of such terms or other similar expressions or terminology. Such statements reflect the current views of the Company with respect to future events and are subject to risks, uncertainties and assumptions about the Company and its subsidiaries and investments, including, among other things, the development of its business, trends in its operating industry, and future capital expenditures. In light of these risks, uncertainties and assumptions, the events or circumstances referred to in the forward-looking statements may not occur. None of the future projections, expectations, estimates or prospects in this presentation should be taken as forecasts or promises nor should they be taken as implying any indication, assurance or guarantee that the assumptions on which such future projections, expectations, estimates or prospects have been prepared are correct or exhaustive or, in the case of the assumptions, fully stated in the presentation. Abengoa Yield plc undertakes no obligation to update or revise any forward-looking statements, whether as a result of new information, future events or developments or otherwise.Many factors could cause the actual results, performance or achievements of the Company to be materially different from any future results, performance or achievements that may be expressed or implied by such forward-looking statements, including, among others: changes in general economic, political, governmental and business conditions globally and in the countries in which the Company does business; decreases in government expenditure budgets, reductions in government subsidies or adverse changes in laws affecting the Company’s businesses and growth plan; challenges in achieving growth and making acquisitions; inability to identify and/or consummate future acquisitions; legal challenges to regulations, subsidies and incentives that support renewable energy sources; extensive governmental regulation in a number of different jurisdictions; changes in prices, including increases in the cost of energy, natural gas, oil and other operating costs; counterparty credit risk and failure of counterparties to the Company’s offtake agreements to fulfill their obligations; inability to replace expiring or terminated offtake agreements with similar agreements; new technology or changes in industry standards; inability to manage exposure to credit, interest rate, exchange rate, supply and commodity price risks; reliance on third-party contractors and suppliers; failure to maintain safe work environments; insufficient insurance coverage and increases in insurance cost; litigation and other legal proceedings; reputational risk; revocation or termination of the Company’s concession agreements; variations in market electricity prices; unexpected loss of senior management and key personnel; changes to our relationship with Abengoa, S.A.; developments at Abengoa S.A.; weather conditions; failure of newly constructed assets to perform as expected; failure to receive dividends from assets; changes in our tax position; unanticipated outages at our generation facilities; the condition of capital markets generally and our ability to access capital markets; adverse results in current and future litigation and our ability to maintain and grow our quarterly dividends. Furthermore, any dividends are subject to available capital, market conditions, and compliance with associated laws and regulations. These factors should be considered in conjuction with information regarding risks and uncertainties that may affect the Company’s results included in the Company’s filings with the U.S. Securities and Exchange Commission at www.sec.govShould one or more of these risks or uncertainties materialize, or should underlying assumptions prove incorrect, actual results may vary materially from those described herein as anticipated, believed, estimated, expected or targeted.This presentation includes certain non-GAAP (Generally Accepted Accounting Principles) financial measures which have not been subject to a financial audit for any period. We present non-GAAP financial measures because we believe that they and other similar measures are widely used by certain investors, securities analysts and other interested parties as supplemental measures of performance and liquidity. The non-GAAP financial measures may not be comparable to other similarly titled measures of other companies and have limitations as analytical tools and should not be considered in isolation or as a substitute for analysis of our operating results as reported under IFRS as issued by the IASB. Non-GAAP financial measures and ratios are not measurements of our performance or liquidity under IFRS as issued by the IASB and should not be considered as alternatives to operating profit or profit for the year or any other performance measures derived in accordance with IFRS as issued by the IASB or any other generally accepted accounting principles or as alternatives to cash flow from operating, investing or financing activities.The CAFD and other guidance included in this presentation are estimates as of February 29, 2016. These estimates are based on assumptions believed to be reasonable as of that date. Abengoa Yield plc. disclaims any current intention to update such guidance, except as required by law. References in this presentation to Atlantica Yield refer to Abengoa Yield plc. Atlantica Yield is the new brand for Abengoa Yield plc, that expects to change name in the next Shareholders General Meeting in 2016. DISCLAIMER
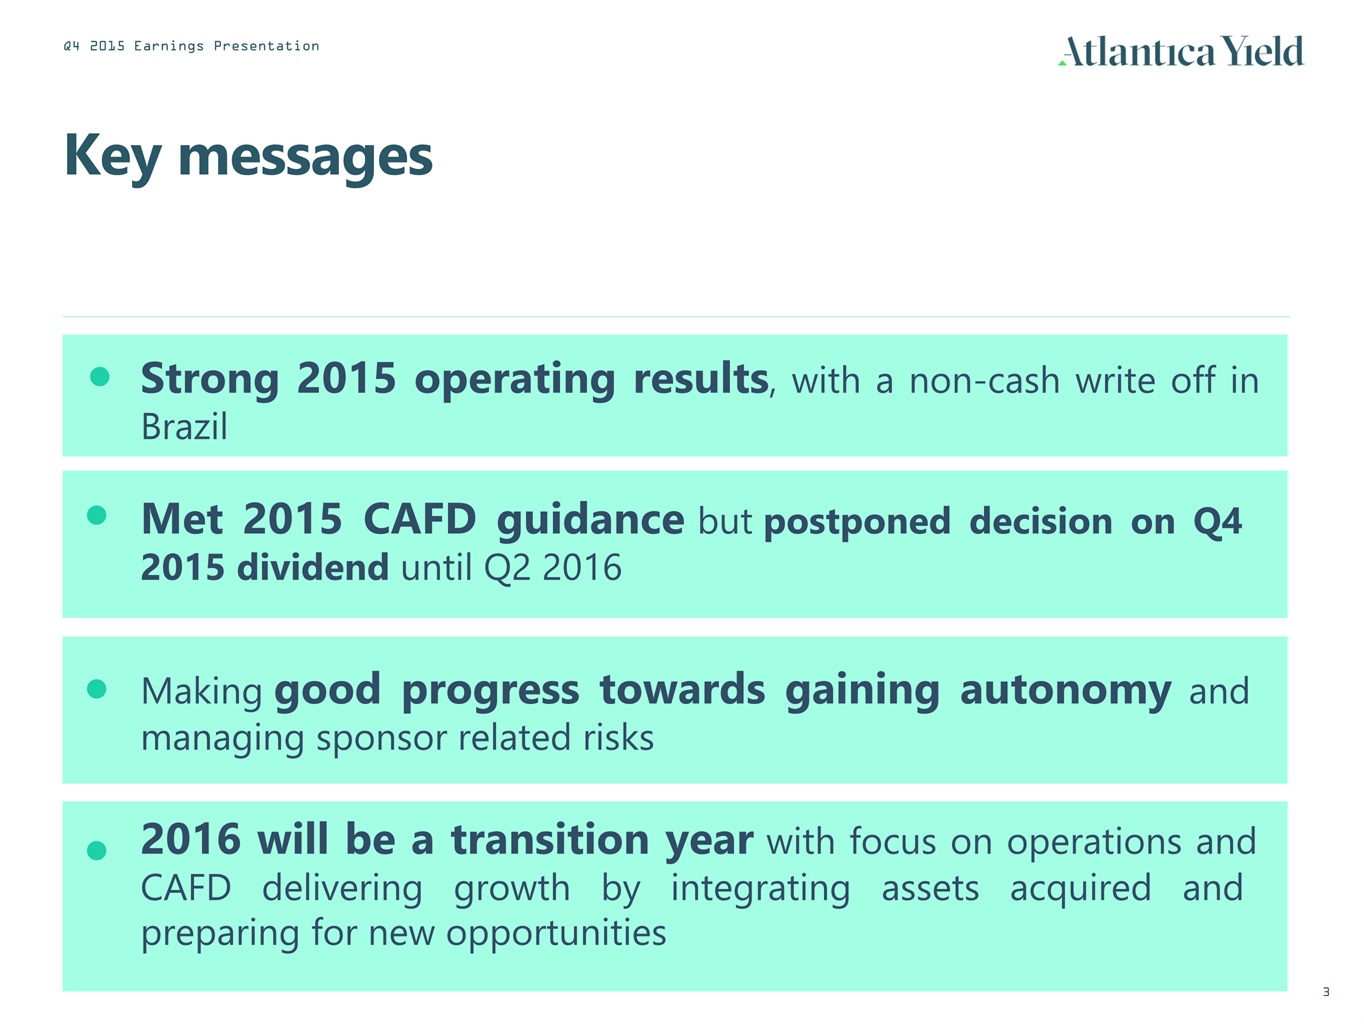
Key messages Strong 2015 operating results, with a non-cash write off in Brazil Met 2015 CAFD guidance but postponed decision on Q4 2015 dividend until Q2 2016 Making good progress towards gaining autonomy and managing sponsor related risks 2016 will be a transition year with focus on operations and CAFD delivering growth by integrating assets acquired and preparing for new opportunities

1. Financial Results 2. Guidance 3. 2016 Strategic Objectives AGENDA 4. Q&A

1. Financial Results
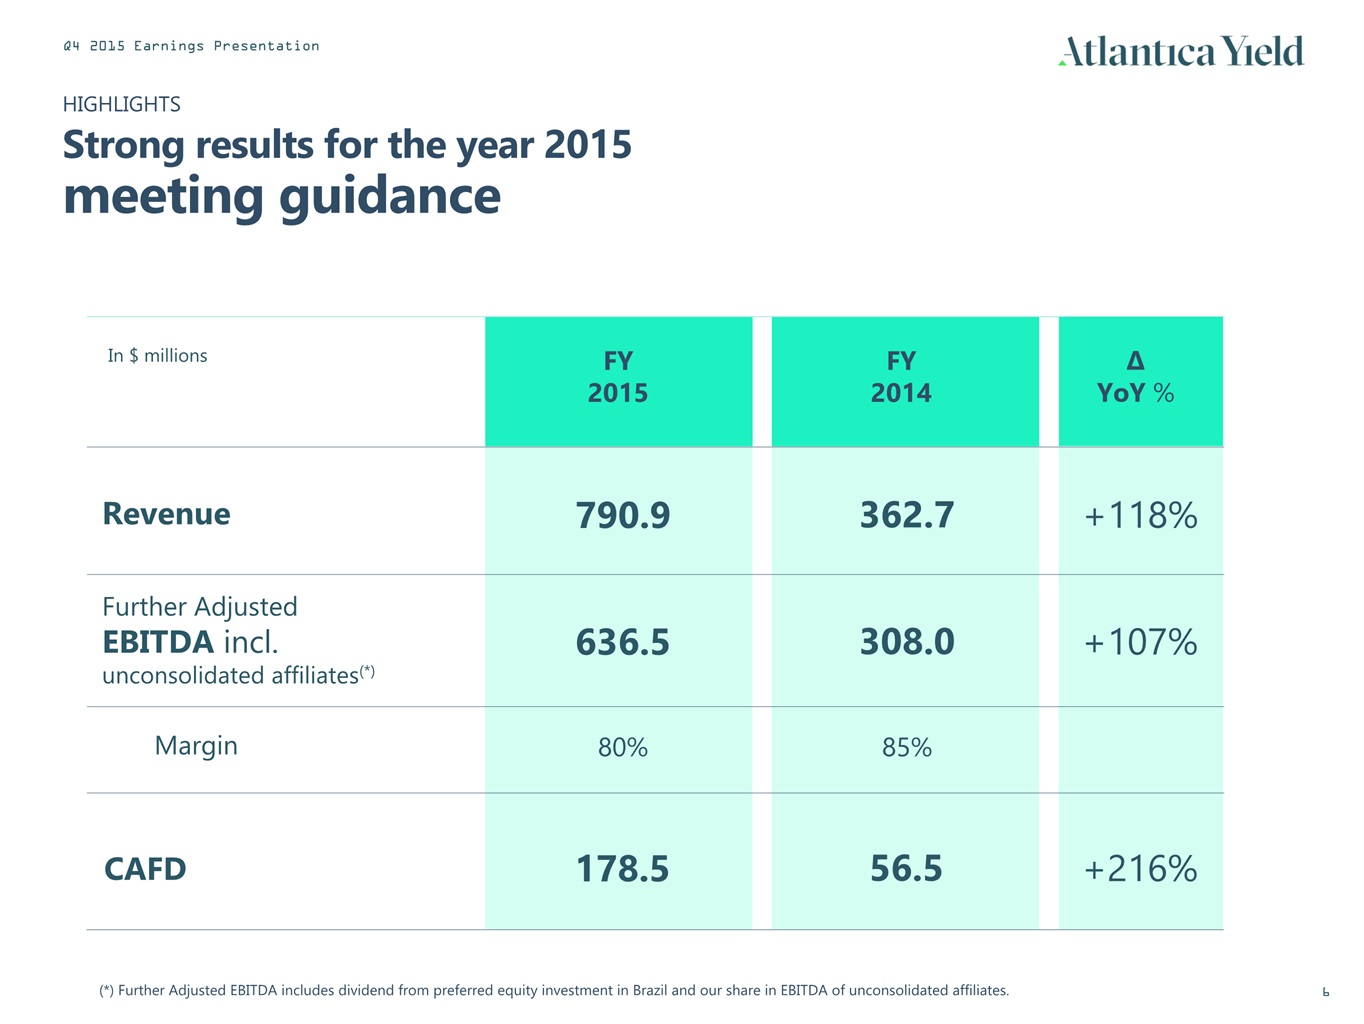
∆YoY % +118% +107% HIGHLIGHTSStrong results for the year 2015meeting guidance In $ millions Revenue Further Adjusted EBITDA incl. unconsolidated affiliates(*) Margin FY2015 790.9 636.5 80% (*) Further Adjusted EBITDA includes dividend from preferred equity investment in Brazil and our share in EBITDA of unconsolidated affiliates. FY2014 362.7 308.0 85% +216% CAFD 178.5 56.5
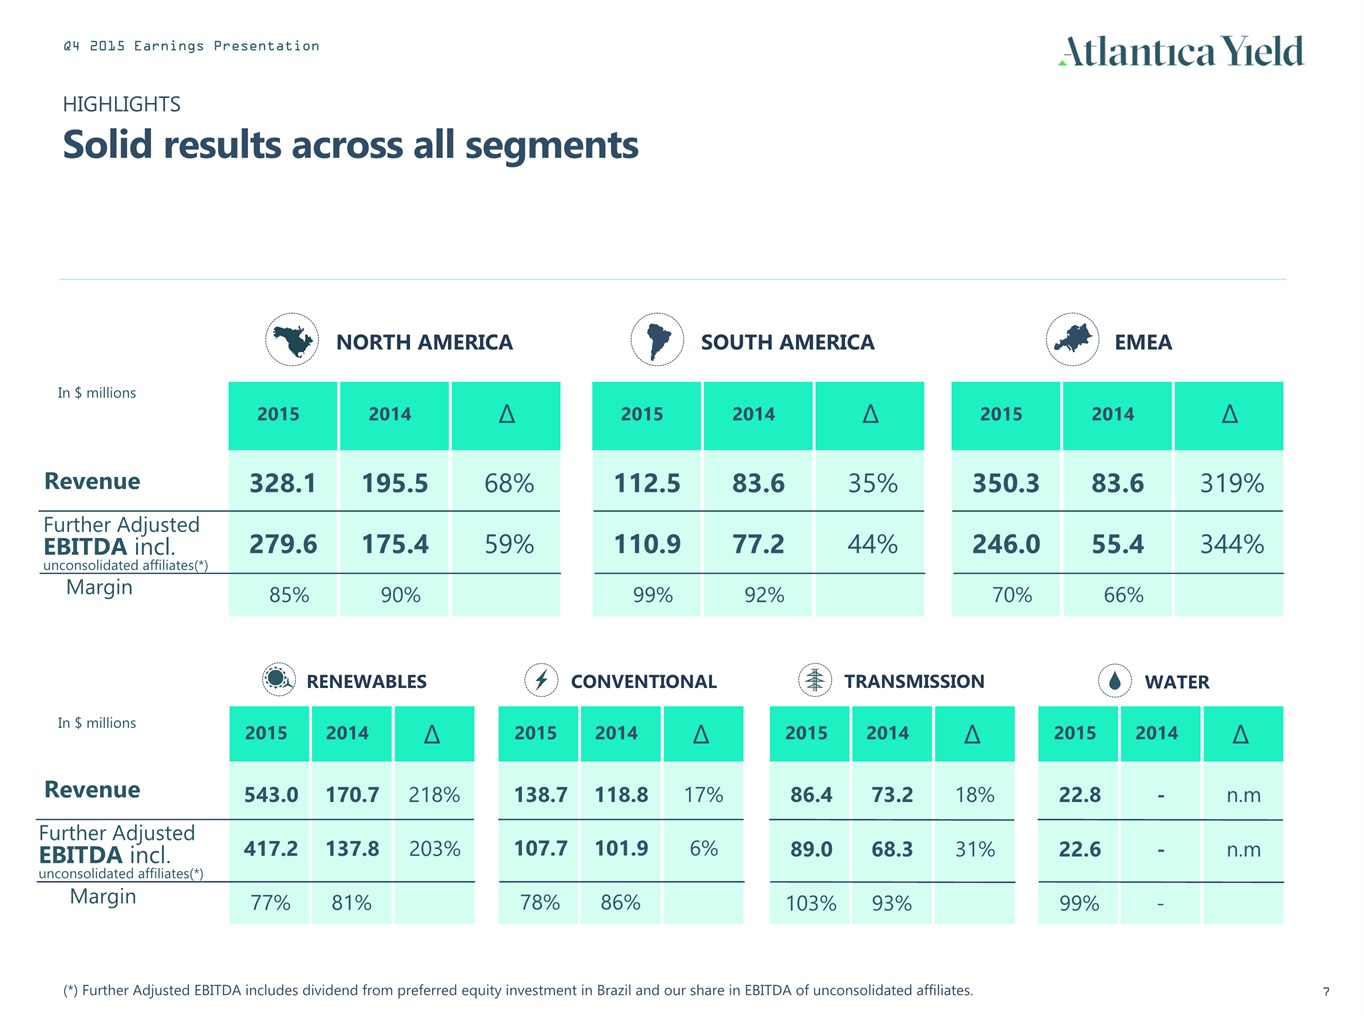
HIGHLIGHTSSolid results across all segments In $ millions Revenue Further Adjusted EBITDA incl. unconsolidated affiliates(*) 2015 328.1 2014 ∆ 195.5 68% 279.6 175.4 59% 543.0 417.2 Revenue 2015 112.5 2014 ∆ 83.6 35% SOUTH AMERICA 110.9 77.2 44% 2015 350.3 2014 ∆ 83.6 319% 246.0 55.4 344% 2015 170.7 137.8 2014 218% 203% ∆ 138.7 107.7 2015 118.8 101.9 2014 17% 6% ∆ 86.4 89.0 2015 73.2 68.3 2014 18% 31% ∆ 22.8 22.6 2015 - - 2014 n.m n.m ∆ EMEA NORTH AMERICA RENEWABLES CONVENTIONAL TRANSMISSION WATER (*) Further Adjusted EBITDA includes dividend from preferred equity investment in Brazil and our share in EBITDA of unconsolidated affiliates. Further Adjusted EBITDA incl. unconsolidated affiliates(*) Margin Margin 85% 90% 99% 92% 70% 66% 77% 81% 78% 86% 103% 93% 99% - In $ millions
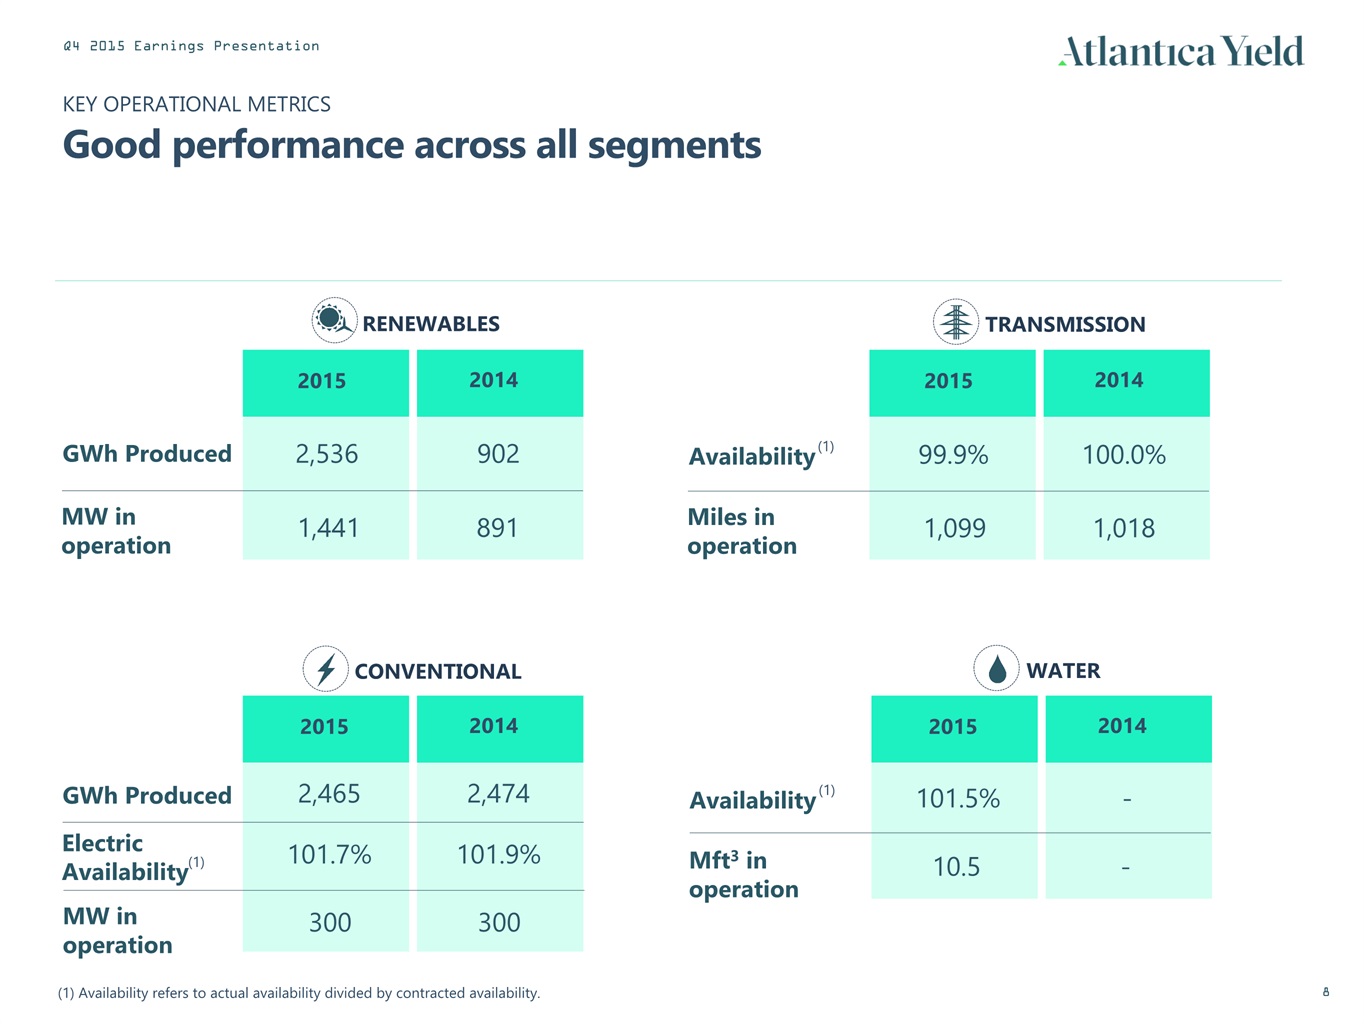
KEY OPERATIONAL METRICSGood performance across all segments GWh Produced 2015 2,536 2014 902 GWh Produced Electric Availability 2015 2,465 2014 2,474 101.7% 101.9% Availability 2015 2014 99.9% 100.0% Availability 2015 101.5% 2014 - RENEWABLES TRANSMISSION WATER CONVENTIONAL MW in operation 300 300 Mft3 in operation 10.5 - Miles in operation 1,099 1,018 MW in operation 1,441 891 (1) Availability refers to actual availability divided by contracted availability. (1) (1) (1)

CASH FLOW$300M Operating Cash Flow generated in the year (1) Includes ABY dividend payment. Net change in cash OPERATING CASH FLOW In $ millions 2015 2014 Further Adjusted EBITDA incl. unconsolidated affiliates - (12.3) Share in EBITDA of unconsolidated affiliates Interest paid Variations in working capital Non monetary adjustments and other INVESTING CASH FLOW FINANCING CASH FLOW (1) 308.0 636.5 (149.5) (312.4) (68.0) 73.1 (46.9) (85.4) 43.6 299.5 (345.2) (929.8) 304.4 810.9 2.8 180.6

CASH FLOW$178.5M CAFD for 2015 meeting Guidance 178.5 Q12015 12 months 2015 Q2 2015 Q32015 Q4 2015 In $ millions 36.8 58.6 44.6 38.5 Guidance for the year achieved
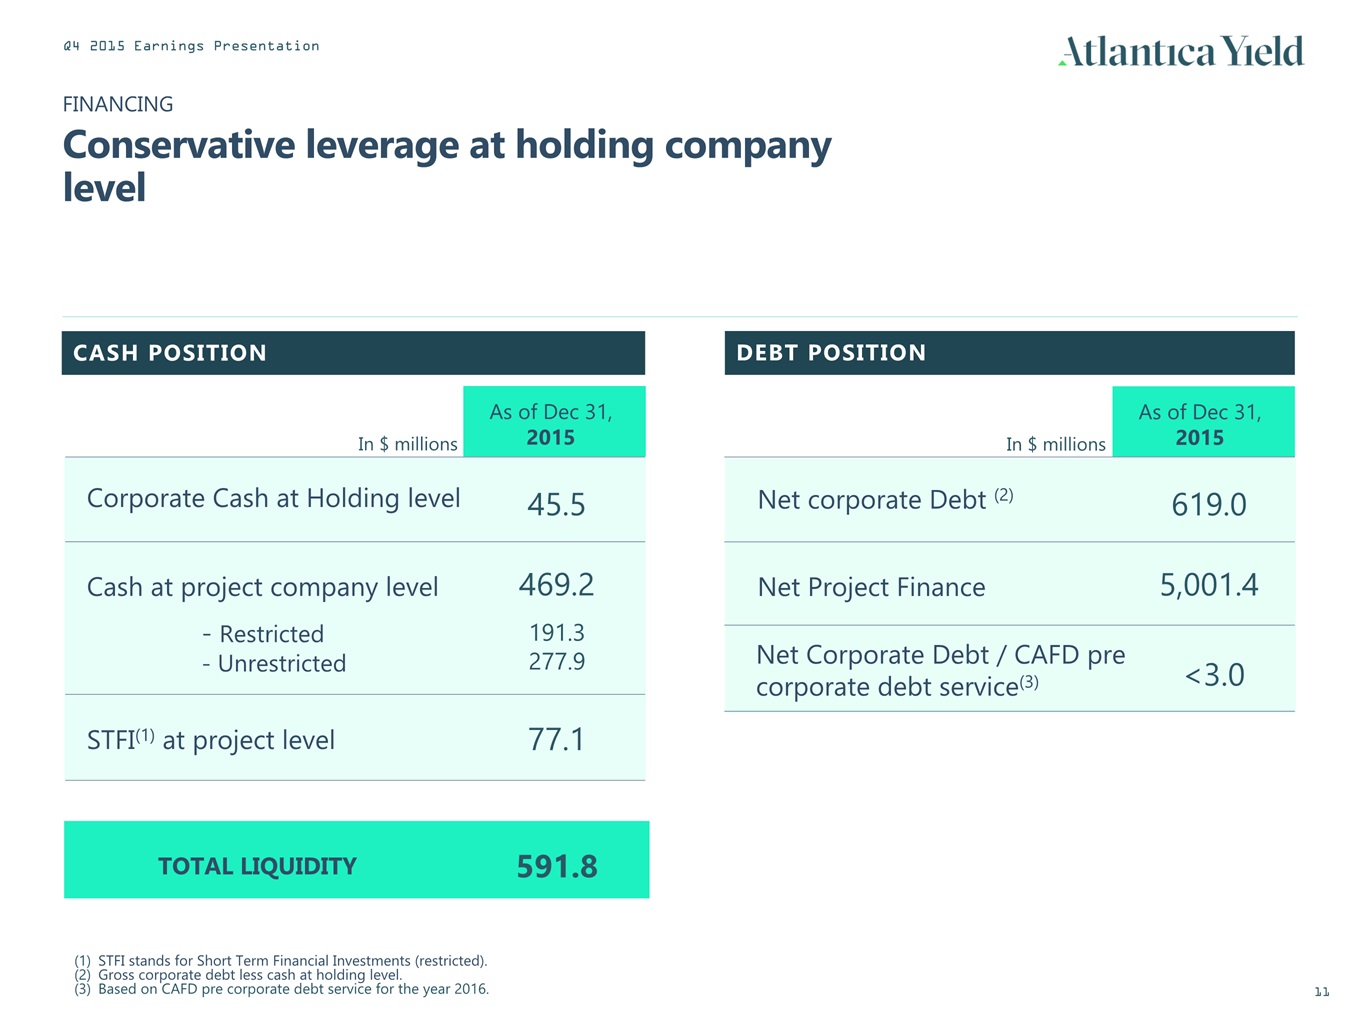
As of Dec 31,2015 FINANCINGConservative leverage at holding company level In $ millions Corporate Cash at Holding level 45.5 Cash at project company level - Restricted - Unrestricted STFI(1) at project level 469.2 191.3277.9 As of Dec 31,2015 77.1 In $ millions Net corporate Debt (2) 619.0 Net Project Finance 5,001.4 TOTAL LIQUIDITY 591.8 Net Corporate Debt / CAFD pre corporate debt service(3) <3.0 STFI stands for Short Term Financial Investments (restricted).Gross corporate debt less cash at holding level.Based on CAFD pre corporate debt service for the year 2016. CASH POSITION DEBT POSITION
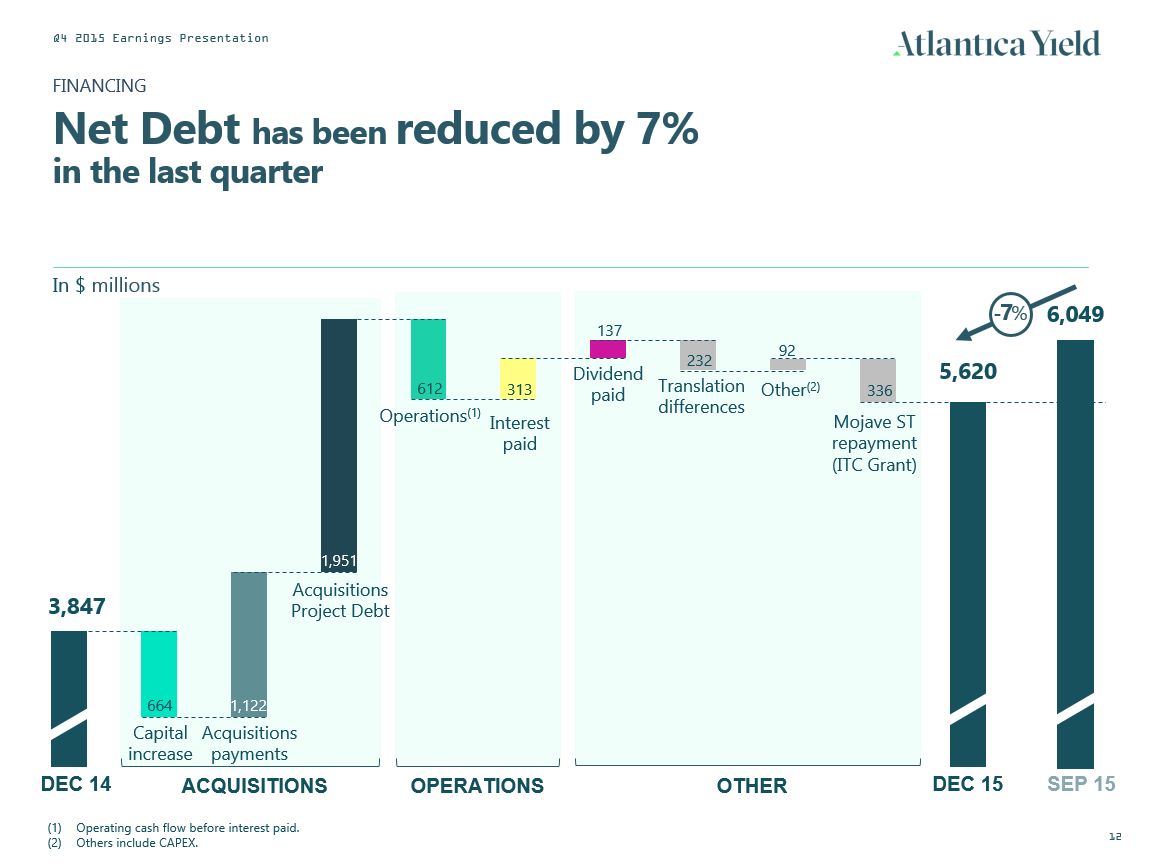
Operating cash flow before interest paid.Others include CAPEX. OPERATIONS OTHER 3,847 5,620 664 1,951 1,122 137 612 313 92 Other(2) Dividend paid Interest paid Acquisitions Project Debt Operations(1) 336 Mojave ST repayment (ITC Grant) Translation differences Acquisitions payments Capital increase In $ millions FINANCINGNet Debt has been reduced by 7% in the last quarter ACQUISITIONS DEC 15 DEC 14 6,049 SEP 15 -7% 232
2. Guidance
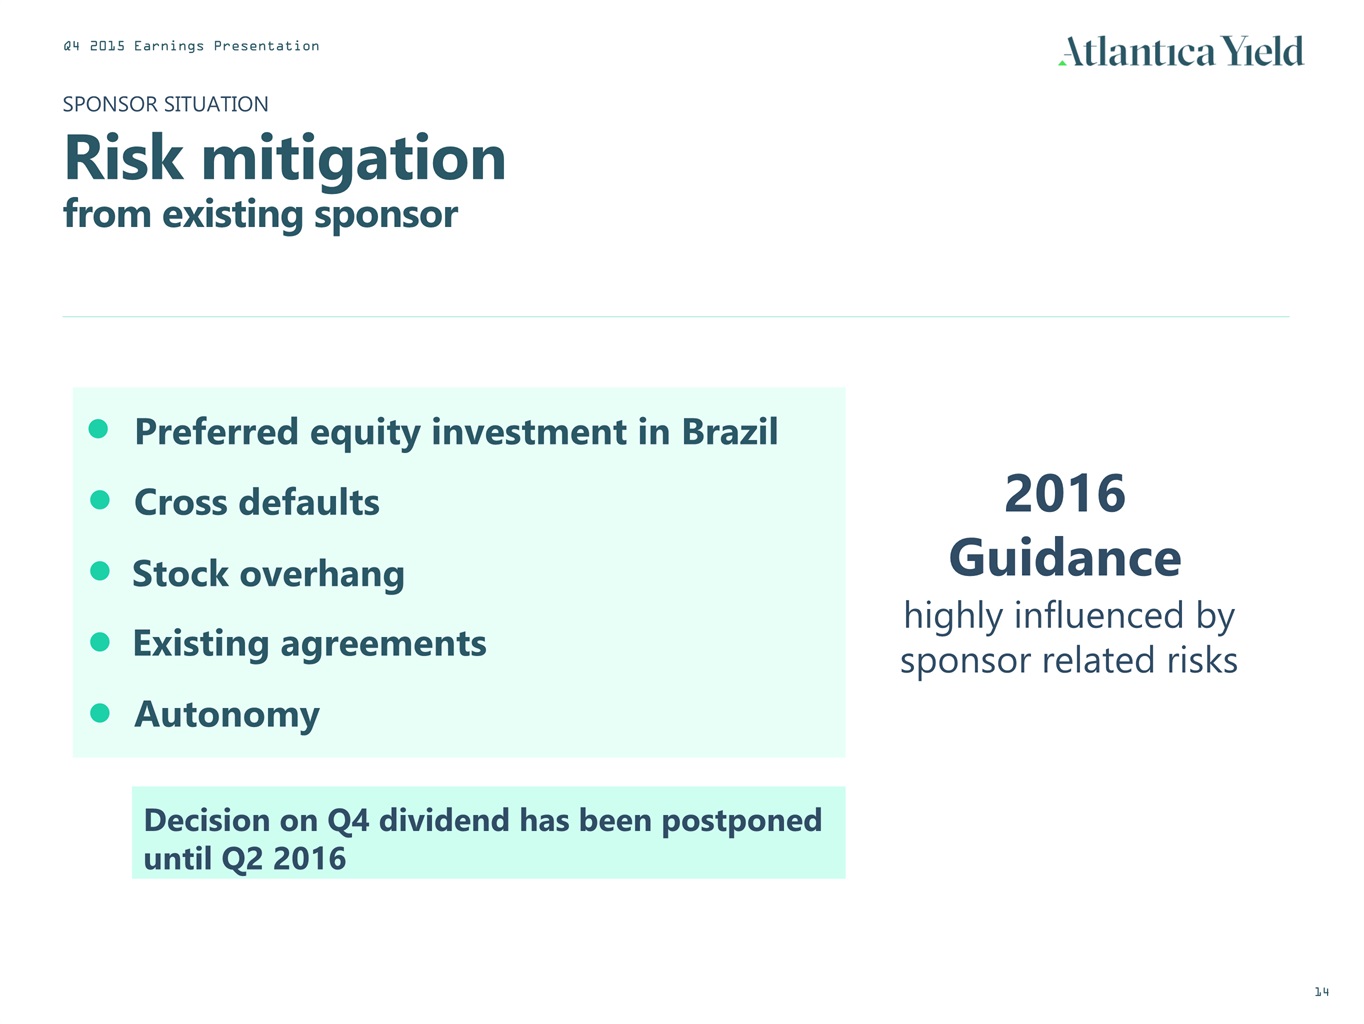
SPONSOR SITUATIONRisk mitigationfrom existing sponsor highly influenced by sponsor related risks 2016 Guidance Existing agreements Cross defaults Preferred equity investment in Brazil Stock overhang Decision on Q4 dividend has been postponed until Q2 2016 Autonomy
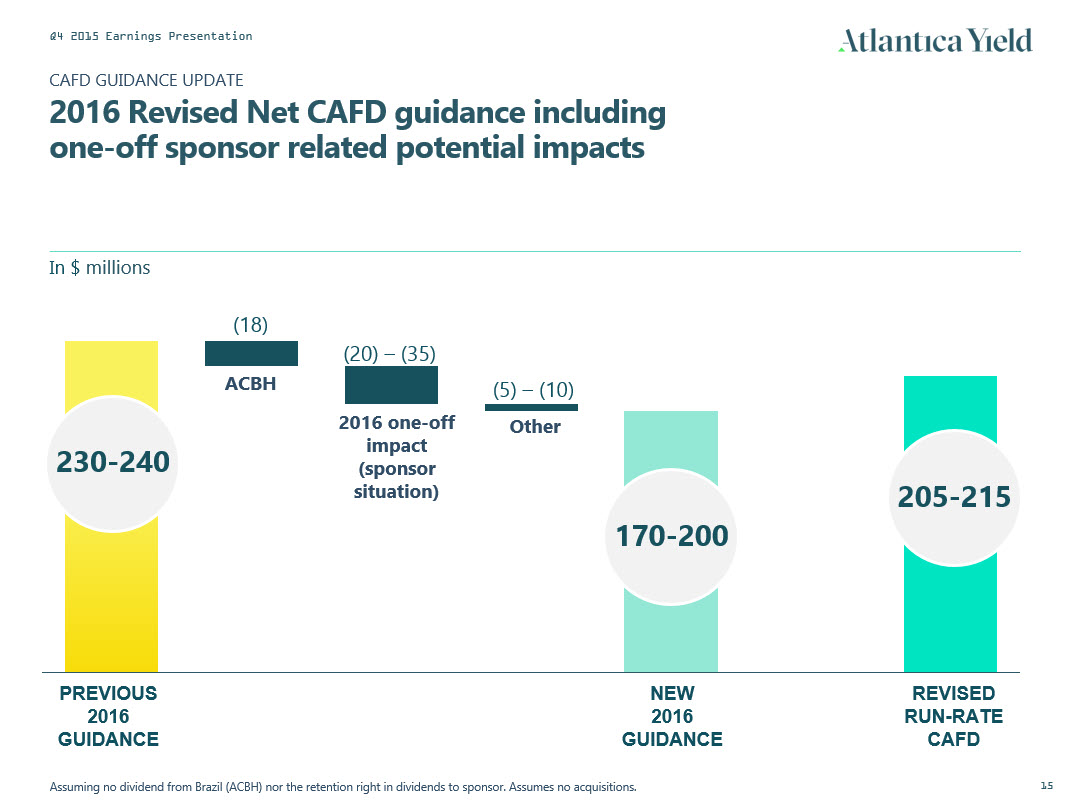
In $ millions CAFD GUIDANCE UPDATE2016 Revised Net CAFD guidance including one-off sponsor related potential impacts PREVIOUS 2016 GUIDANCE ACBH REVISED RUN-RATECAFD NEW 2016GUIDANCE Other 2016 one-off impact (sponsor situation) (18) (20) – (35) (5) – (10) Scenario assuming no dividends from Brazil (ACBH) 230-240 170-200 205-215
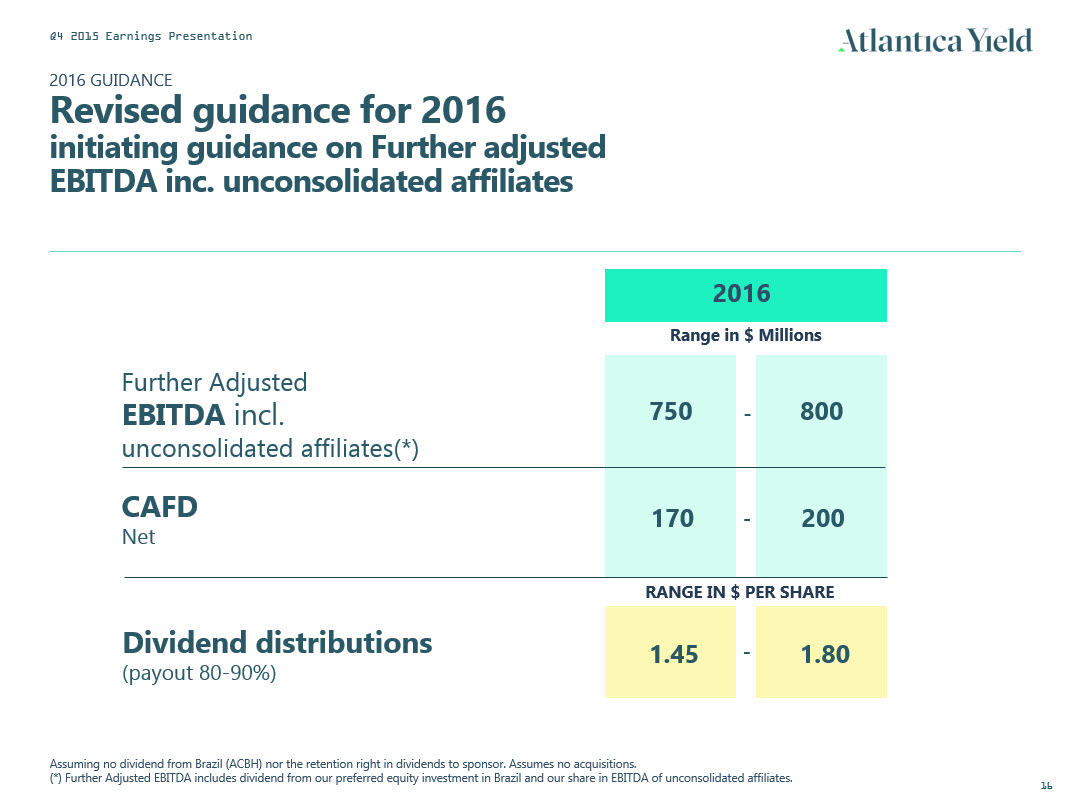
2016 GUIDANCERevised guidance for 2016initiating guidance on Further adjusted EBITDA inc. unconsolidated affiliates 2016 750 Range in $ Millions CAFD Net 170 800 200 Further Adjusted EBITDA incl. unconsolidated affiliates(*) (*) Further Adjusted EBITDA includes dividend from our preferred equity investment in Brazil and our share in EBITDA of unconsolidated affiliates. Dividend distributions(payout 80-90%) 1.45 1.80 - - - RANGE IN $ PER SHARE
3. 2016 Strategic Objectives
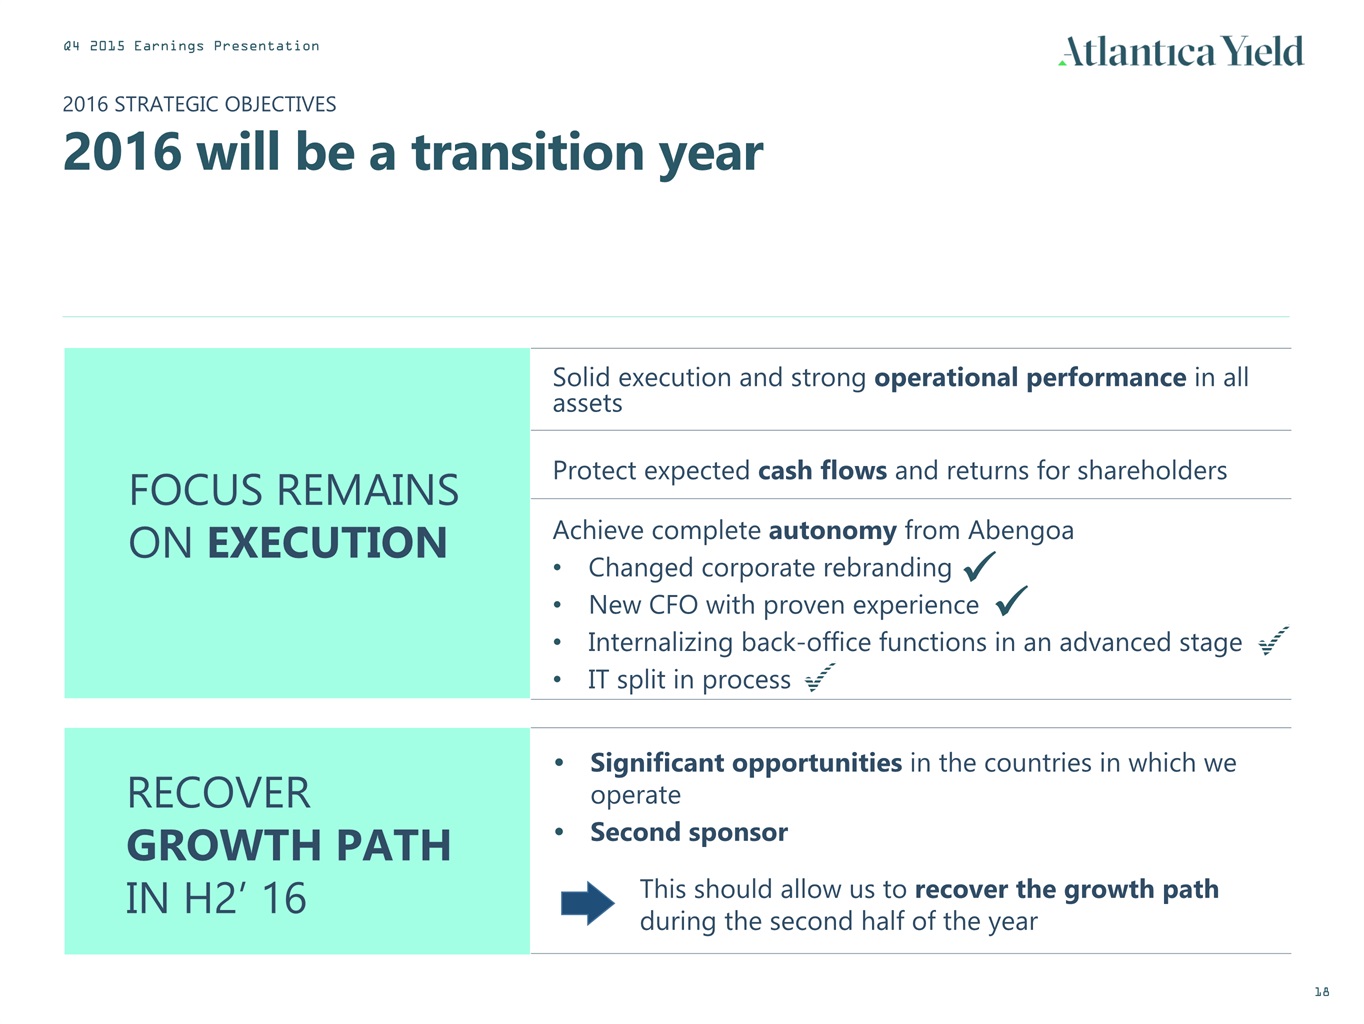
2016 STRATEGIC OBJECTIVES2016 will be a transition year RECOVER GROWTH PATH IN H2’ 16 FOCUS REMAINS ON EXECUTION Solid execution and strong operational performance in all assets Protect expected cash flows and returns for shareholders Achieve complete autonomy from AbengoaChanged corporate rebrandingNew CFO with proven experienceInternalizing back-office functions in an advanced stageIT split in process Significant opportunities in the countries in which we operateSecond sponsorThis should allow us to recover the growth path during the second half of the year
4. Q&A
Appendix
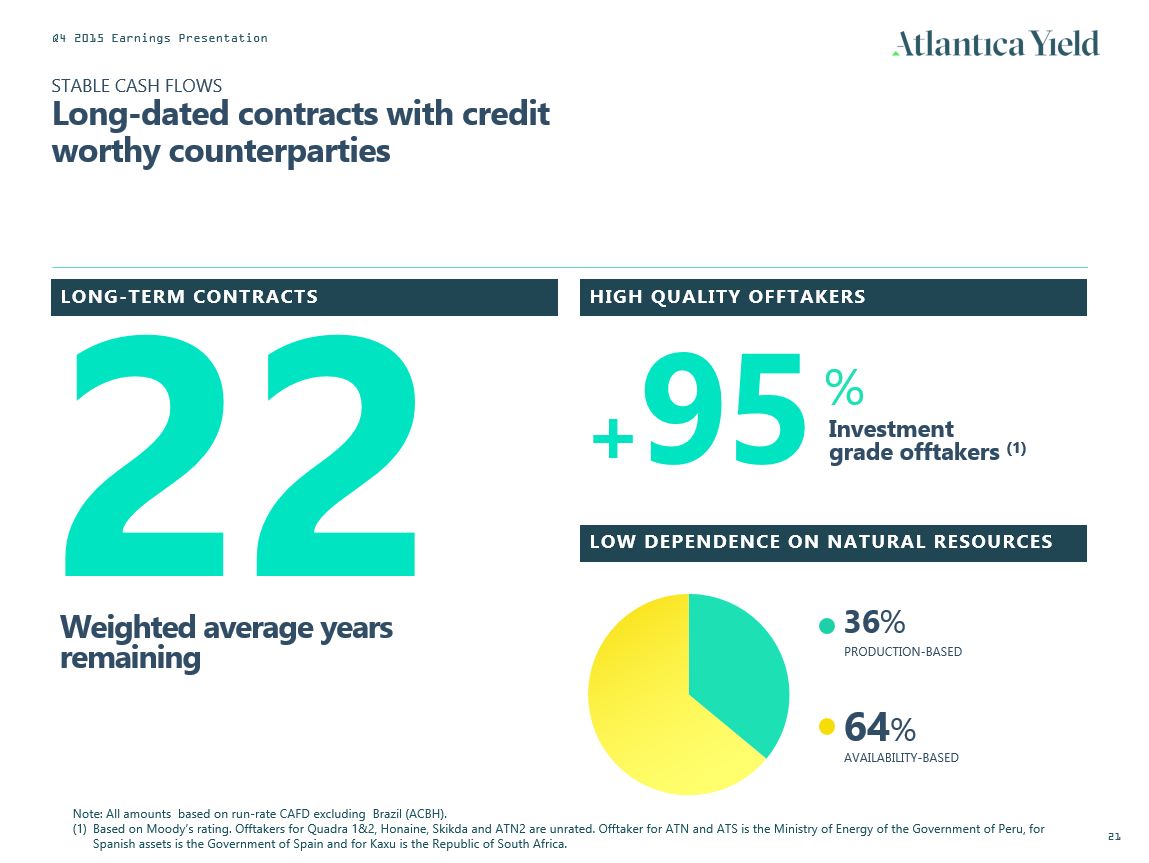
STABLE CASH FLOWSLong-dated contracts with credit worthy counterparties LONG-TERM CONTRACTS HIGH QUALITY OFFTAKERS 22 Weighted average years remaining +95 Investment grade offtakers (1) LOW DEPENDENCE ON NATURAL RESOURCES PRODUCTION-BASED 36% AVAILABILITY-BASED 64% % Note: All amounts based on run-rate CAFD excluding Brazil (ACBH).Based on Moody’s rating. Offtakers for Quadra 1&2, Honaine, Skikda and ATN2 are unrated. Offtaker for ATN and ATS is the Ministry of Energy of the Government of Peru, for Spanish assets is the Government of Spain and for Kaxu is the Republic of South Africa.
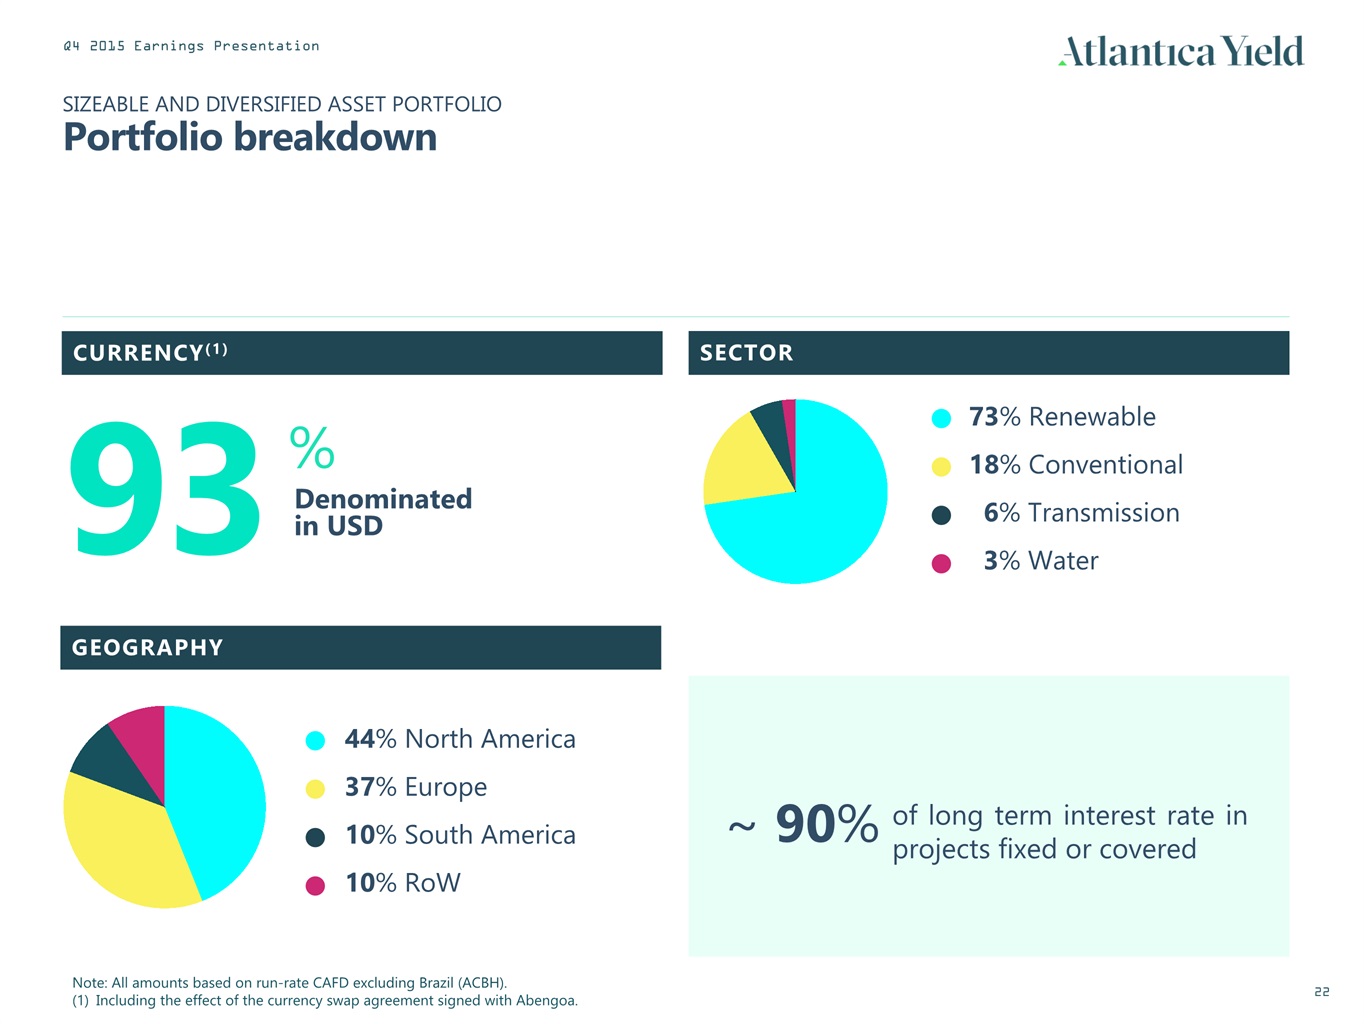
SIZEABLE AND DIVERSIFIED ASSET PORTFOLIOPortfolio breakdown CURRENCY(1) SECTOR GEOGRAPHY Note: All amounts based on run-rate CAFD excluding Brazil (ACBH). Including the effect of the currency swap agreement signed with Abengoa. of long term interest rate in projects fixed or covered ~ 90% 93 Denominatedin USD % 44% North America37% Europe10% South America10% RoW 73% Renewable18% Conventional 6% Transmission 3% Water
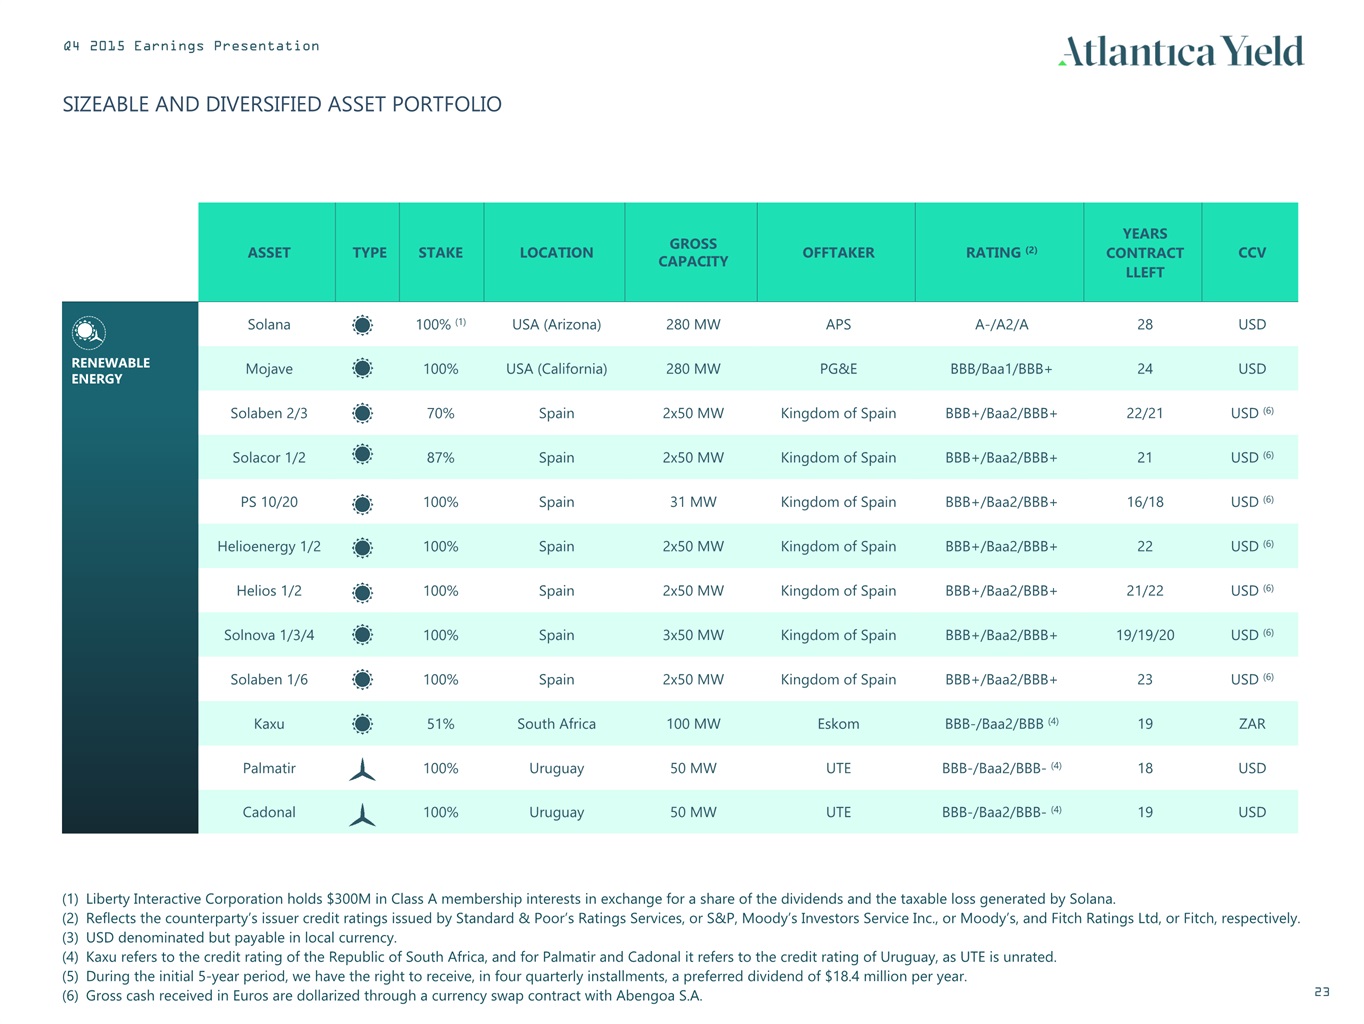
SIZEABLE AND DIVERSIFIED ASSET PORTFOLIO ASSET TYPE STAKE LOCATION GROSSCAPACITY OFFTAKER RATING (2) YEARSCONTRACT LLEFT CCV RENEWABLE ENERGY Solana 100% (1) USA (Arizona) 280 MW APS A-/A2/A 28 USD Mojave 100% USA (California) 280 MW PG&E BBB/Baa1/BBB+ 24 USD Solaben 2/3 70% Spain 2x50 MW Kingdom of Spain BBB+/Baa2/BBB+ 22/21 USD (6) Solacor 1/2 87% Spain 2x50 MW Kingdom of Spain BBB+/Baa2/BBB+ 21 USD (6) PS 10/20 100% Spain 31 MW Kingdom of Spain BBB+/Baa2/BBB+ 16/18 USD (6) Helioenergy 1/2 100% Spain 2x50 MW Kingdom of Spain BBB+/Baa2/BBB+ 22 USD (6) Helios 1/2 100% Spain 2x50 MW Kingdom of Spain BBB+/Baa2/BBB+ 21/22 USD (6) Solnova 1/3/4 100% Spain 3x50 MW Kingdom of Spain BBB+/Baa2/BBB+ 19/19/20 USD (6) Solaben 1/6 100% Spain 2x50 MW Kingdom of Spain BBB+/Baa2/BBB+ 23 USD (6) Kaxu 51% South Africa 100 MW Eskom BBB-/Baa2/BBB (4) 19 ZAR Palmatir 100% Uruguay 50 MW UTE BBB-/Baa2/BBB- (4) 18 USD Cadonal 100% Uruguay 50 MW UTE BBB-/Baa2/BBB- (4) 19 USD Liberty Interactive Corporation holds $300M in Class A membership interests in exchange for a share of the dividends and the taxable loss generated by Solana.Reflects the counterparty’s issuer credit ratings issued by Standard & Poor’s Ratings Services, or S&P, Moody’s Investors Service Inc., or Moody’s, and Fitch Ratings Ltd, or Fitch, respectively.USD denominated but payable in local currency. Kaxu refers to the credit rating of the Republic of South Africa, and for Palmatir and Cadonal it refers to the credit rating of Uruguay, as UTE is unrated. During the initial 5-year period, we have the right to receive, in four quarterly installments, a preferred dividend of $18.4 million per year.Gross cash received in Euros are dollarized through a currency swap contract with Abengoa S.A.
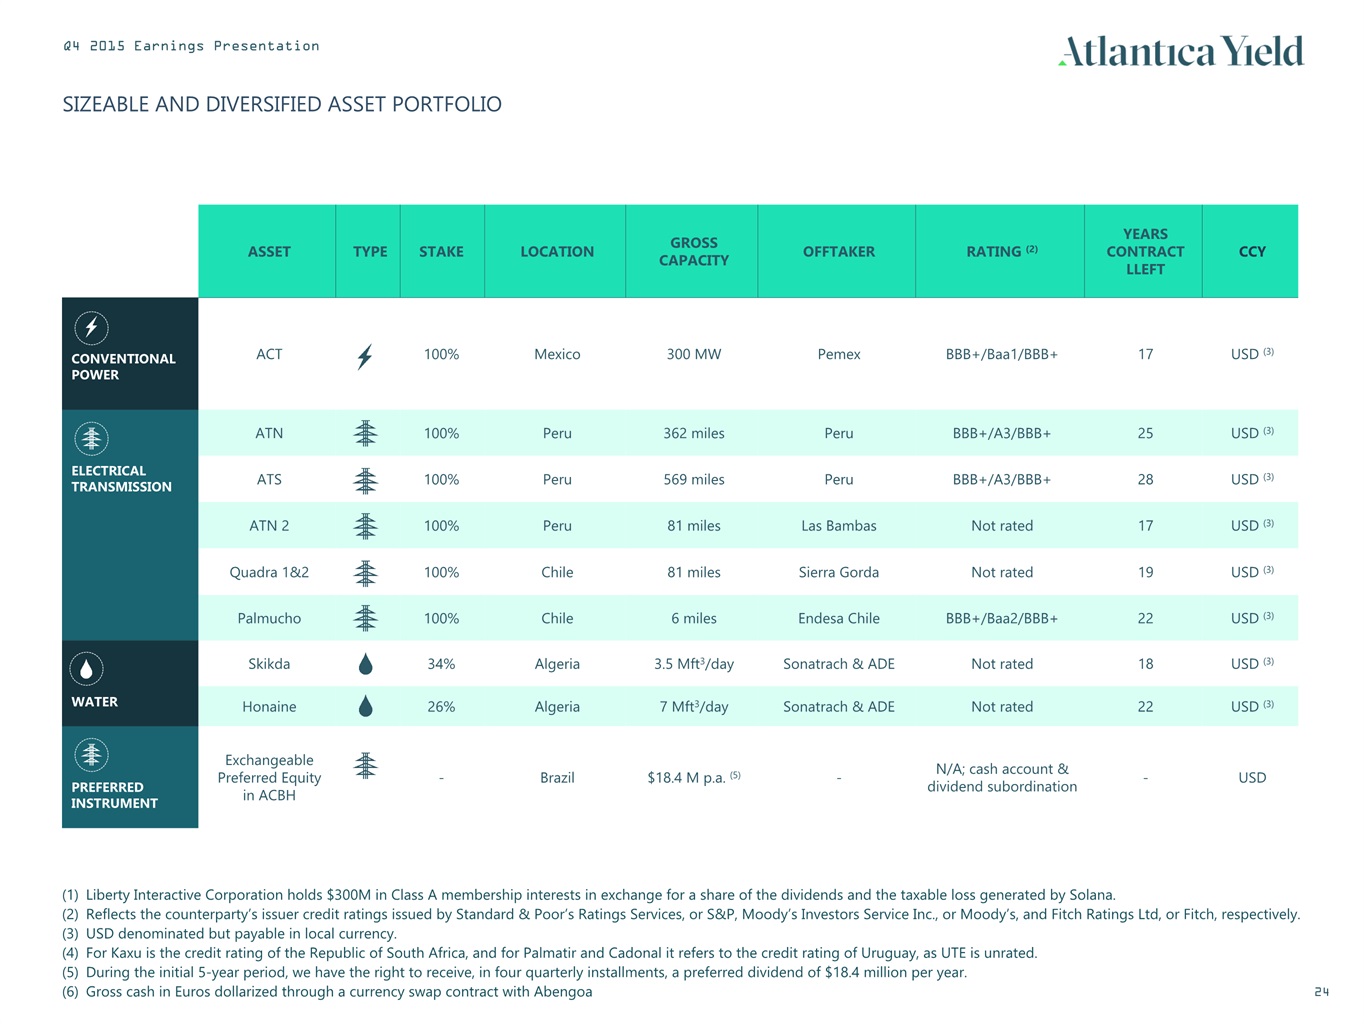
SIZEABLE AND DIVERSIFIED ASSET PORTFOLIO ASSET TYPE STAKE LOCATION GROSSCAPACITY OFFTAKER RATING (2) YEARSCONTRACT LLEFT CCY CONVENTIONALPOWER ACT 100% Mexico 300 MW Pemex BBB+/Baa1/BBB+ 17 USD (3) ELECTRICAL TRANSMISSION ATN 100% Peru 362 miles Peru BBB+/A3/BBB+ 25 USD (3) ATS 100% Peru 569 miles Peru BBB+/A3/BBB+ 28 USD (3) ATN 2 100% Peru 81 miles Las Bambas Not rated 17 USD (3) Quadra 1&2 100% Chile 81 miles Sierra Gorda Not rated 19 USD (3) Palmucho 100% Chile 6 miles Endesa Chile BBB+/Baa2/BBB+ 22 USD (3) WATER Skikda 34% Algeria 3.5 Mft3/day Sonatrach & ADE Not rated 18 USD (3) Honaine 26% Algeria 7 Mft3/day Sonatrach & ADE Not rated 22 USD (3) PREFERRED INSTRUMENT Exchangeable Preferred Equity in ACBH - Brazil $18.4 M p.a. (5) - N/A; cash account & dividend subordination - USD Liberty Interactive Corporation holds $300M in Class A membership interests in exchange for a share of the dividends and the taxable loss generated by Solana.Reflects the counterparty’s issuer credit ratings issued by Standard & Poor’s Ratings Services, or S&P, Moody’s Investors Service Inc., or Moody’s, and Fitch Ratings Ltd, or Fitch, respectively.USD denominated but payable in local currency. For Kaxu is the credit rating of the Republic of South Africa, and for Palmatir and Cadonal it refers to the credit rating of Uruguay, as UTE is unrated. During the initial 5-year period, we have the right to receive, in four quarterly installments, a preferred dividend of $18.4 million per year.Gross cash in Euros dollarized through a currency swap contract with Abengoa
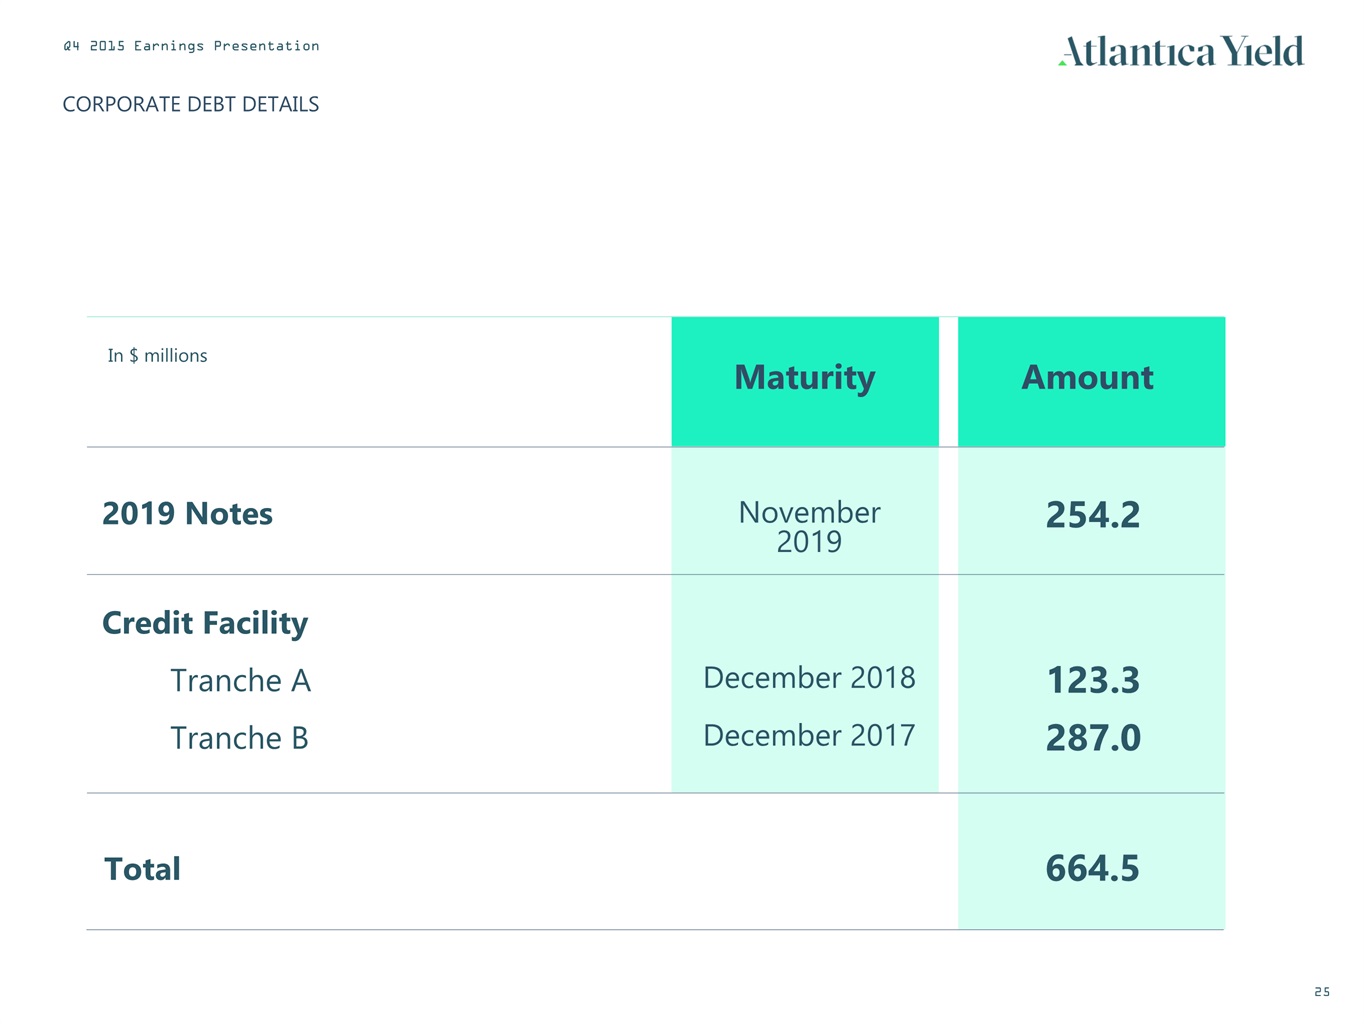
CORPORATE DEBT DETAILS In $ millions 2019 Notes Credit Facility Tranche A Tranche B Maturity November 2019 Amount 254.2 Total 664.5 December 2018 123.3 December 2017 287.0
Great West House, GW1, 17th floor,Great West RoadBrentford TW8 9DFLondon (United Kingdom)