UNITED STATES
SECURITIES AND EXCHANGE COMMISSION
Washington, D.C. 20549
FORM 6-K
REPORT OF FOREIGN PRIVATE ISSUER
PURSUANT TO RULE 13a-16 OR 15d-16
UNDER THE SECURITIES EXCHANGE ACT OF 1934
For the month of November 2016
Commission File Number 001-36487
Atlantica Yield plc
(Exact name of Registrant as Specified in its Charter)
Not Applicable
(Translation of Registrant’s name into English)
Great West House, GW1, 17th floor
Great West Road
Brentford, TW8 9DF
United Kingdom
Tel.: +44 203 499 0465
Indicate by check mark whether the registrant files or will file annual reports under cover of Form 20-F or Form 40-F:
☒ Form 20-F | ☐ Form 40-F |
Indicate by check mark if the registrant is submitting the Form 6-K in paper as permitted by Regulation S-T Rule 101(b)(1): ☐
Indicate by check mark if the registrant is submitting the Form 6-K in paper as permitted by Regulation S-T Rule 101(b)(7): ☐
![](https://capedge.com/proxy/6-K/0001140361-16-086019/form6kslide1.jpg)
Third Quarter 2016 Earnings PresentationNovember 14, 2016
![](https://capedge.com/proxy/6-K/0001140361-16-086019/form6kslide2.jpg)
This presentation contains forward-looking statements. These forward-looking statements include, but are not limited to, all statements other than statements of historical facts contained in this presentation, including, without limitation, those regarding our future financial position and results of operations, our strategy, plans, objectives, goals and targets, future developments in the markets in which we operate or are seeking to operate or anticipated regulatory changes in the markets in which we operate or intend to operate. In some cases, you can identify forward-looking statements by terminology such as “aim,” “anticipate,” “believe,” “continue,” “could,” “estimate,” “expect,” “forecast,” “guidance,” “intend,” “is likely to,” “may,” “plan,” “potential,” “predict,” “projected,” “should” or “will” or the negative of such terms or other similar expressions or terminology. Such statements reflect the current views of the Company with respect to future events and are subject to risks, uncertainties and assumptions about the Company and its subsidiaries and investments, including, among other things, the development of its business, trends in its operating industry, and future capital expenditures. In light of these risks, uncertainties and assumptions, the events or circumstances referred to in the forward-looking statements may not occur. None of the future projections, expectations, estimates or prospects in this presentation should be taken as forecasts or promises nor should they be taken as implying any indication, assurance or guarantee that the assumptions on which such future projections, expectations, estimates or prospects have been prepared are correct or exhaustive or, in the case of the assumptions, fully stated in the presentation. Atlantica Yield plc undertakes no obligation to update or revise any forward-looking statements, whether as a result of new information, future events or developments or otherwise.Many factors could cause the actual results, performance or achievements of the Company to be materially different from any future results, performance or achievements that may be expressed or implied by such forward-looking statements, including, among others: changes in general economic, political, governmental and business conditions globally and in the countries in which the Company does business; decreases in government expenditure budgets, reductions in government subsidies or adverse changes in laws affecting the Company’s businesses and growth plan; challenges in achieving growth and making acquisitions; inability to identify and/or consummate future acquisitions; legal challenges to regulations, subsidies and incentives that support renewable energy sources; extensive governmental regulation in a number of different jurisdictions; changes in prices, including increases in the cost of energy, natural gas, oil and other operating costs; counterparty credit risk and failure of counterparties to the Company’s offtake agreements to fulfill their obligations; inability to replace expiring or terminated offtake agreements with similar agreements; new technology or changes in industry standards; inability to manage exposure to credit, interest rate, exchange rate, supply and commodity price risks; reliance on third-party contractors and suppliers; failure to maintain safe work environments; insufficient insurance coverage and increases in insurance cost; litigation and other legal proceedings; reputational risk; revocation or termination of the Company’s concession agreements; variations in market electricity prices; unexpected loss of senior management and key personnel; changes to our relationship with Abengoa, S.A.; developments at Abengoa S.A.; weather conditions; failure of newly constructed assets to perform as expected; failure to receive dividends from assets; changes in our tax position; unanticipated outages at our generation facilities; the condition of capital markets generally and our ability to access capital markets; adverse results in current and future litigation and our ability to maintain and grow our quarterly dividends. Furthermore, any dividends are subject to available capital, market conditions, and compliance with associated laws and regulations. These factors should be considered in conjunction with information regarding risks and uncertainties that may affect the Company’s results included in the Company’s filings with the U.S. Securities and Exchange Commission at www.sec.govShould one or more of these risks or uncertainties materialize, or should underlying assumptions prove incorrect, actual results may vary materially from those described herein as anticipated, believed, estimated, expected or targeted.This presentation includes certain non-GAAP (Generally Accepted Accounting Principles) financial measures which have not been subject to a financial audit for any period. We present non-GAAP financial measures because we believe that they and other similar measures are widely used by certain investors, securities analysts and other interested parties as supplemental measures of performance and liquidity. The non-GAAP financial measures may not be comparable to other similarly titled measures of other companies and have limitations as analytical tools and should not be considered in isolation or as a substitute for analysis of our operating results as reported under IFRS as issued by the IASB. Non-GAAP financial measures and ratios are not measurements of our performance or liquidity under IFRS as issued by the IASB and should not be considered as alternatives to operating profit or profit for the year or any other performance measures derived in accordance with IFRS as issued by the IASB or any other generally accepted accounting principles or as alternatives to cash flow from operating, investing or financing activities.The CAFD and other guidance included in this presentation are estimates as of November 14, 2016. These estimates are based on assumptions believed to be reasonable as of that date. Atlantica Yield plc. disclaims any current intention to update such guidance, except as required by law. DISCLAIMER
![](https://capedge.com/proxy/6-K/0001140361-16-086019/form6kslide3.jpg)
Key Messages $53.8M of Cash Available For Distribution in the quarter Separation from our sponsor effectively completed Strong operating results for the quarter with Revenues of $295.3 M (+10%) and Further Adjusted EBITDA including unconsolidated affiliates of $264.3 M (+21%) Dividend of $0.163 per share declared Strong Operating Cash Flow of $184.3M in the quarter
![](https://capedge.com/proxy/6-K/0001140361-16-086019/form6kslide4.jpg)
1. Financial Results 2. Strategic Update 3. Q&A AGENDA Appendix
![](https://capedge.com/proxy/6-K/0001140361-16-086019/form6kslide5.jpg)
1. Financial Results
![](https://capedge.com/proxy/6-K/0001140361-16-086019/form6kslide6.jpg)
3 monthsSept 15 267.3 218.6 82% 58.6 ∆ +10% +21% (8%) 9 monthsSept 15 575.9 483.4 84% 141.7 ∆ +32% +30% HIGHLIGHTSExcellent Operating Results for the Third Quarter Revenue Further Adjusted EBITDA incl. unconsolidated affiliates(1) Margin 3 monthsSept 16 295.3 264.3 89% 9 monthsSept 16 763.0 626.8 82% (21%) CAFD(2) 53.8 112.1 US $ in millions (1) Further Adjusted EBITDA including unconsolidated affiliates includes the dividend from our preferred equity investment in Brazil or its compensation ($21.2M for the nine-month period ended September 30, 2016 and $13.8M for the nine-month period ended September 30, 2015) and our share in EBITDA of unconsolidated affiliates ($6.8M related to Honaine for the nine-month period ended September 30, 2016 and $6.0M related to Honaine + $3.2M related to Helioenergy for the nine-month period ended September 30, 2015).(2) CAFD includes $21.2M compensation of preferred equity investment in Brazil in the three-month and nine-month periods ended September 30, 2016 and the impact of a one-time partial refinancing of ATN2 amounting to $14.9M for the nine-month period ended September 30, 2016.
![](https://capedge.com/proxy/6-K/0001140361-16-086019/form6kslide7.jpg)
HIGHLIGHTSGood Results Across all Segments US $ in millions Revenue Further Adjusted EBITDA incl. unconsolidated affiliates(1) 9 months Sept 16 275.3 9 months Sept 15 ∆ 259.8 6% 244.2 232.0 5% 578.3 449.0 Revenue 9 months Sept 16 88.2 9 months Sept 15 ∆ 80.2 10% SOUTH AMERICA 93.6 80.8 16% 9 months Sept 16 399.5 9 months Sept 15 ∆ 235.9 69% 289.0 170.6 69% 9 months Sept 16 397.8 322.1 9 months Sept 15 45% 39% ∆ 94.9 80.1 9 months Sept 16 100.0 80.3 9 months Sept 15 (5%) 0% ∆ 70.8 79.9 9 months Sept 16 61.3 64.7 9 months Sept 15 15% 23% ∆ 19.0 17.8 9 months Sept 16 16.8 16.4 9 months Sept 15 13% 9% ∆ EMEA NORTH AMERICA RENEWABLES CONVENTIONAL TRANSMISSION WATER (1) Further Adjusted EBITDA including unconsolidated affiliates includes the dividend from our preferred equity investment in Brazil or its compensation ($21.2M for the nine-month period ended September 30, 2016 and $13.8M for the nine-month period ended September 30, 2015) and our share in EBITDA of unconsolidated affiliates ($6.8M related to Honaine for the nine-month period ended September 30, 2016 and $6.0M related to Honaine + $3.2M related to Helioenergy for the nine-month period ended September 30, 2015). Further Adjusted EBITDA incl. unconsolidated affiliates(1) Margin Margin 89% 89% 106% 101% 72% 72% 78% 81% 84% 80% 113% 106% 93% 97% US $ in millions
![](https://capedge.com/proxy/6-K/0001140361-16-086019/form6kslide8.jpg)
KEY OPERATIONAL METRICSOperating Performance in line with expectations GWh produced 9 months Sept 16 2,587 9 months Sept 15 2,041 GWh produced Electric availability 9 months Sept 16 1,799 9 months Sept 15 1,845 97.7%(2) 101.8% Availability 9 months Sept 16 9 months Sept 15 99.9% 99.7% Availability 9 months Sept 16 102.3% 9 months Sept 15 101.1% RENEWABLES TRANSMISSION WATER CONVENTIONAL MW in operation 300 300 Mft3 in operation 10.5 10.5 Miles in operation 1,099 1,099 MW in operation 1,442 1,441 Availability refers to actual availability divided by contracted levels.Conventional availability was impacted by a scheduled major maintenance in February 2016, which occurs periodically. (1) (1) (1)
![](https://capedge.com/proxy/6-K/0001140361-16-086019/form6kslide9.jpg)
CASH FLOWStrong Operating Cash-Flow for the 9 months Net change in cash OPERATING CASH FLOW US $ in millions 9 monthsSept 16 9 monthsSept 15 Further Adjusted EBITDA incl. unconsolidated affiliates (9.2) (6.7) Share in EBITDA of unconsolidated affiliates Interest and income tax paid Variations in working capital Non-monetary adjustments and other INVESTING CASH FLOW FINANCING CASH FLOW 483.4 626.8 (178.5) (192.2) 6.7 (65.1) (68.5) 237.3 (849.1) (54.7) 928.4 (101.7) 316.6 145.8 (57.2) 302.2 27% Operating Cash Flow in the three-month period ended September 30, 2016 amounted to $184.3 M
![](https://capedge.com/proxy/6-K/0001140361-16-086019/form6kslide10.jpg)
LIQUIDITYSolid Liquidity Position US $ in millions Corporate cash at Atlantica Yield 85.8 Cash at project companies - Restricted - Unrestricted STFI(1) at project companies 587.6 238.2349.4 As of Sept. 30,2016 95.4 768.8 (1) STFI stands for Short Term Financial Investments (restricted). CASH POSITION TOTAL LIQUIDITY 45.5 469.2 191.3277.9 As of Dec. 31,2015 77.1 591.8
![](https://capedge.com/proxy/6-K/0001140361-16-086019/form6kslide11.jpg)
FINANCINGConservative Leverage at Holding Company Level US $ in millions Net corporate debt (1) 585.8 Net project debt (1) Net corporate debt / CAFD pre corporate debt service(2) 5,025.3 As of Sept. 30,2016 2.7x DEBT POSITION 619.0 5,001.4 As of Dec. 31,2015 2.9x Net debt corresponds to gross debt including accrued interest less cash and cash equivalents.Based for both dates shown on mid-point of guidance for CAFD pre corporate debt service for the year 2016.
![](https://capedge.com/proxy/6-K/0001140361-16-086019/form6kslide12.jpg)
EBITDA-CAFD RECONCILIATIONCash Generated increased by 20% CAFD penalized due to distribution delays ATN2 refinancing CASH GENERATED US $ in millions 9m 2016 9m 2015 (9.2) (6.7) Share in EBITDA of unconsolidated affiliates Interest and income tax paid Change in other assets and liabilities Principal amortization of indebtedness Further Adjusted EBITDA incl. unconsolidated affiliates (1) 483.4 626.8 (178.5) (192.2) 17.7 (61.0) (89.2) (86.9) 140.6 168.7 - 14.9 Deposits in/withdrawals from restricted accounts (16.7) (64.9) (66.4) (42.4) Non-monetary adjustments Change in non-restricted cash at project companies 1.0 (71.5) CAFD (2) 141.6 112.1 4.2 5.0 Dividends from unconsolidated affiliates Dividends paid to non-controlling interest (4.7) (9.0) Includes dividend from our preferred equity investment in Brazil or its compensation ($21.2 M for the nine-month period ended September 30, 2016 and $13.8 M for the nine-month period ended September 30, 2015) (2) CAFD includes $21.2M compensation of preferred equity investment in Brazil and the impact of a one-time partial refinancing of ATN2 amounting to $14.9M for the nine-month period ended September 30, 2016
![](https://capedge.com/proxy/6-K/0001140361-16-086019/form6kslide13.jpg)
2. Strategic Update
![](https://capedge.com/proxy/6-K/0001140361-16-086019/form6kslide14.jpg)
2016 STRATEGIC OBJECTIVESAgreement negotiated with Abengoa on ACBH preferred Compensation of the dividend retained$21.2M of additional Cash Available For Distribution in Q3 2016 1 2 3 Credit recognized on ACBH preferred equity investment Remaining rights under ACBH would be waived subject to ABG’s restructuring completion $333M 30% 70% ABG Equity Restructured Junior Debt Participate in ABG New Money 1 Notes credit subject to restructuring To convert Junior Debt Senior Notes ~$100M of Senior Debt and Equity Value to be determined by trading price.
![](https://capedge.com/proxy/6-K/0001140361-16-086019/form6kslide15.jpg)
2016 STRATEGIC OBJECTIVESProgress on Key Initiatives 1 2 3 Key waivers/forbearances left very advanced Autonomy achieved Ready to restart growth:- Partnerships (Abengoa ROFO, others)- Acquisitions
![](https://capedge.com/proxy/6-K/0001140361-16-086019/form6kslide16.jpg)
DIVIDENDDividend Approved Quarterly dividend of $0.163 per share approvedUntil a majority of waivers and forbearances is achieved, the Board has decided to remain prudent. Same reasoning as last quarter (percentage of assets not requiring waivers) but percentage used increased from 40% to 45%, reflecting the likelihood of securing some key waivers in the short term.Upcoming quarterly dividends expected to be reviewed based on additional waivers and forbearances.
![](https://capedge.com/proxy/6-K/0001140361-16-086019/form6kslide17.jpg)
3. Q&A
![](https://capedge.com/proxy/6-K/0001140361-16-086019/form6kslide18.jpg)
Appendix
![](https://capedge.com/proxy/6-K/0001140361-16-086019/form6kslide19.jpg)
FINANCINGCorporate Cash bridge In $ millions SEPT 16 JUNE 16 84.9 85.8 ACBH dividend compensation 2015 Dividends declared Payments for acquisitions ACBH dividend compensation 2016 9.0 29.1 12.2 45.4 12.8 14.8 Cash distributions from project companies Corporate interest and G&A (1) $53.8 million of CAFD in the quarter Includes split one-offs amounting aprox. $1M.
![](https://capedge.com/proxy/6-K/0001140361-16-086019/form6kslide20.jpg)
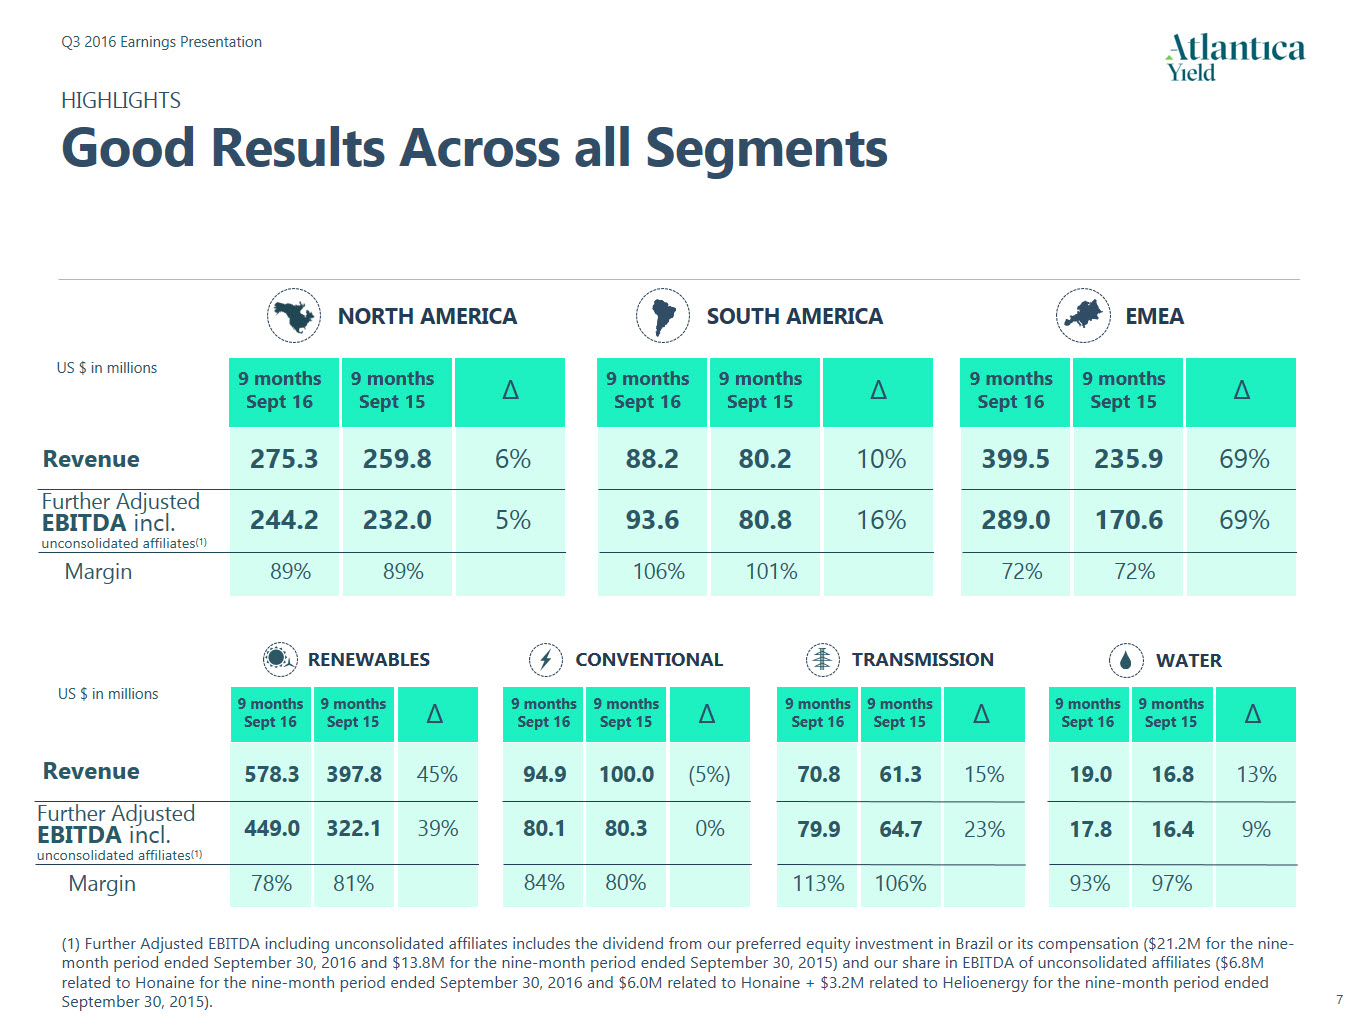
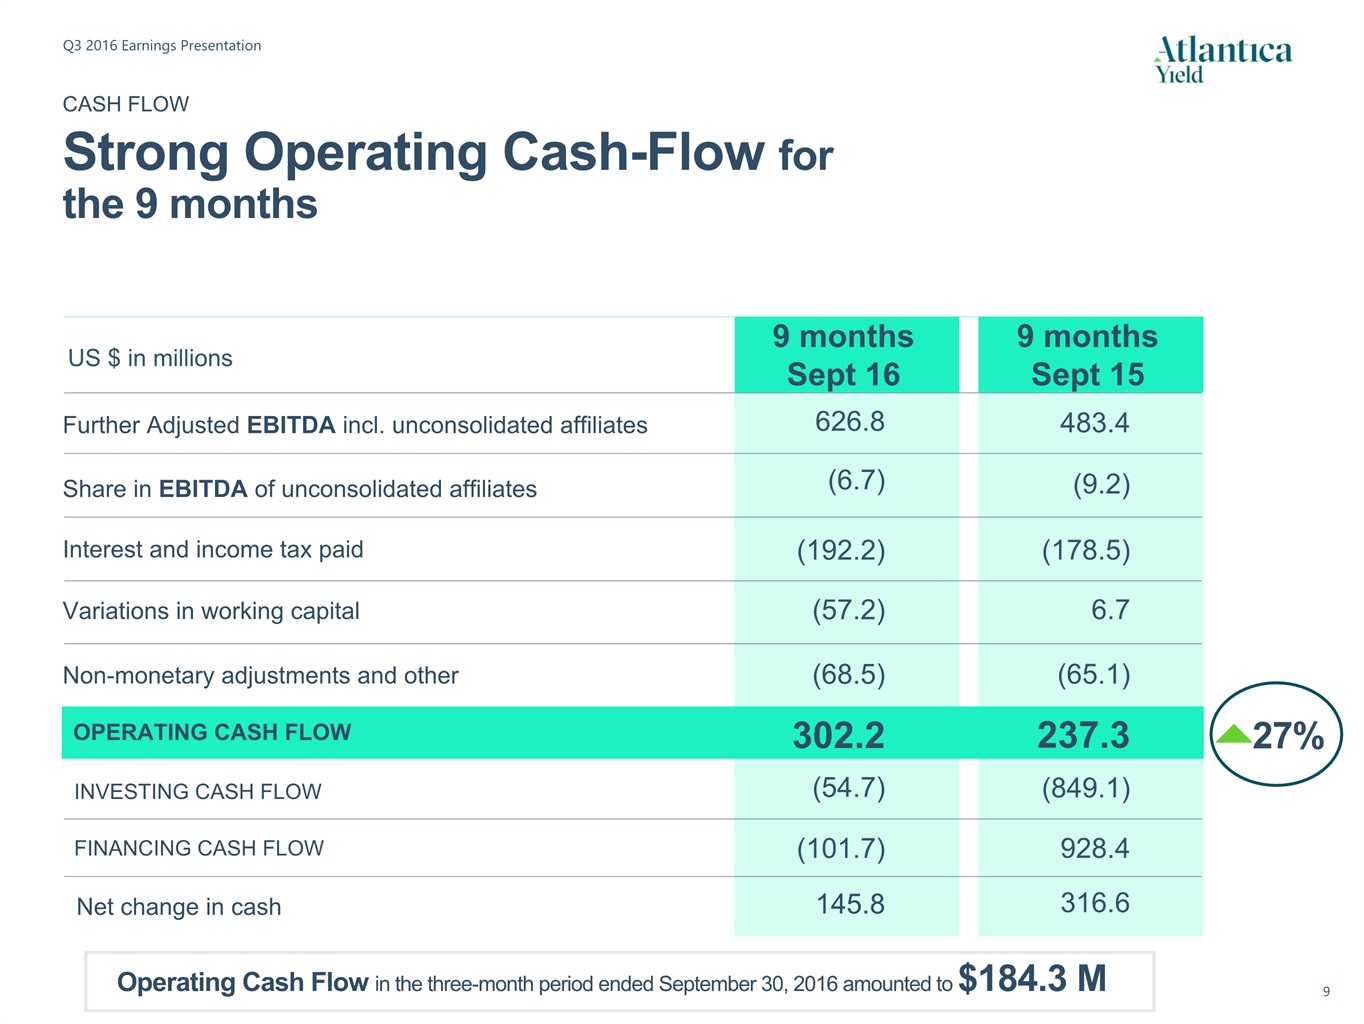
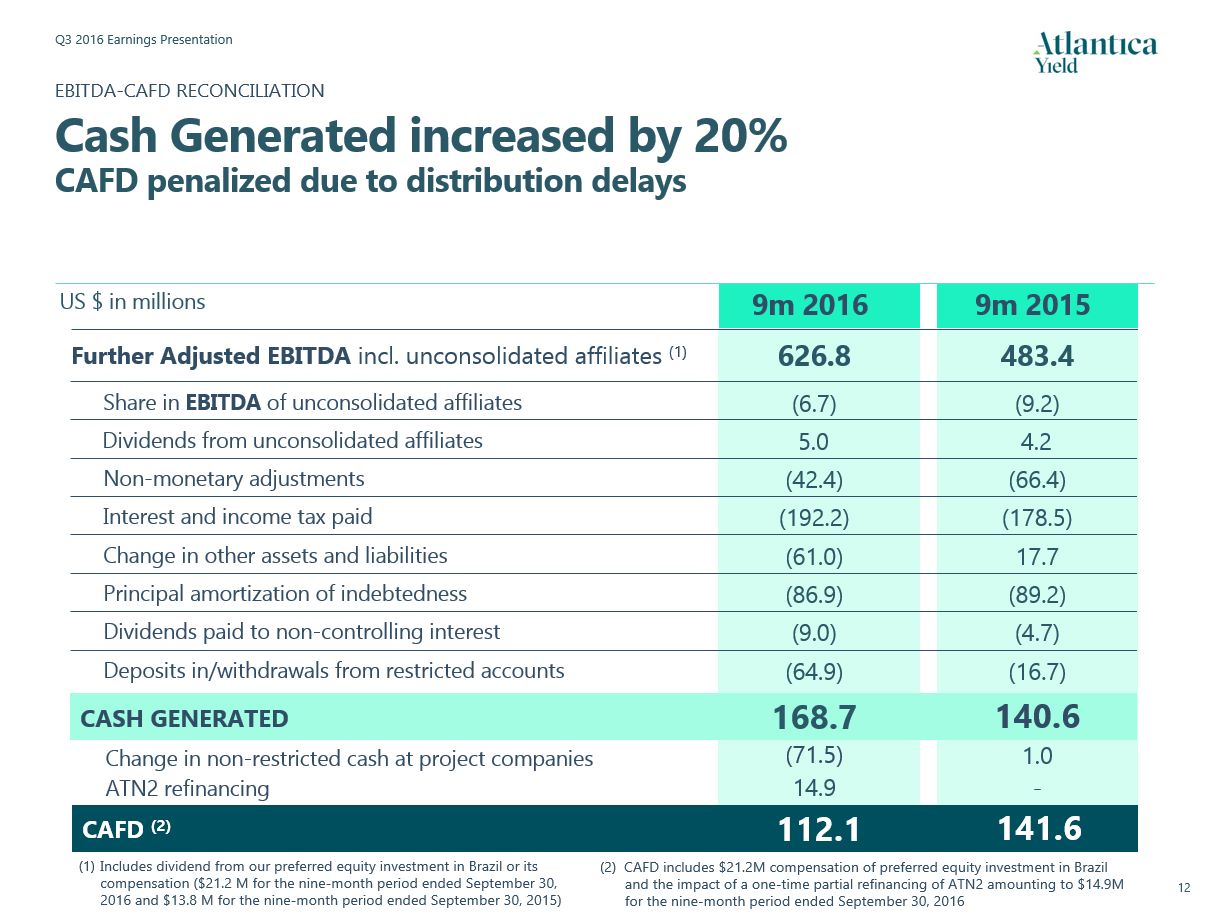
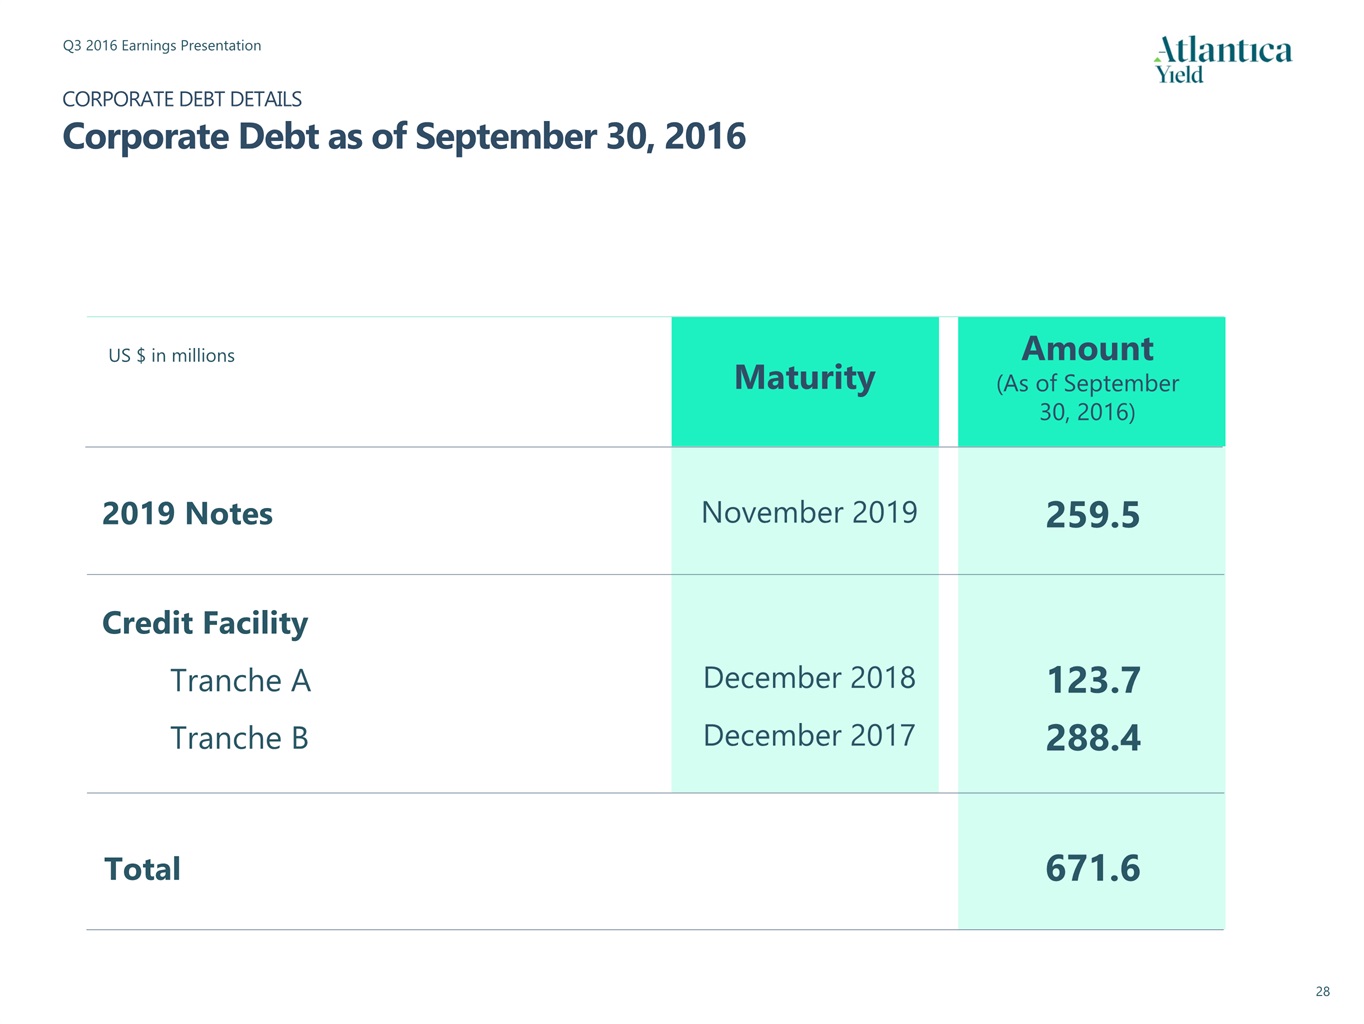
3Q14 4Q14 1Q15 2Q15 3Q15 4Q15 FY 2015 1Q16 2Q16 3Q16 Revenues 99,505 93,380 118,304 190,265 267,345 214,967 790,881 206,376 261,302 295,272 F.A. EBITDA margin (%) 89.7% 87.4% 88.9% 83.9% 81.8% 71.2% 80.5% 75.0% 79.5% 89.5% Further Adj. EBITDA incl. unconsolidated affiliates 89,253 81,598 105,186 159,600 218,650 153,074 636,510 154,879 207,645 264,262 ABY pro-rata share of EBITDA from unconsolidated affiliates - - (5,477) (1,622) (2,121) (3,071) (12,291) (2,332) (2,193) (2,157) Further Adjusted EBITDA 89,253 81,598 99,709 157,978 216,529 150,003 624,219 152,547 205,452 262,105 Dividends from unconsolidated affiliates - - - - 4,163 254 4,417 - 4,984 - Non-monetary items (8,631) (9,748) (21,229) (23,741) (21,447) (24,993) (91,410) (18,356) (12,563) (11,508) Interest and income tax paid (15,078) (67,886) (19,291) (113,023) (46,161) (131,759) (310,234) (27,613) (137,372) (27,183) Principal amortization of indebtedness net of new indebtedness at project level (10,058) (11,556) (8,790) (41,873) (38,573) (86,153) (175,389) (14,254) (53,851) (18,792) Deposits into/withdrawals from debt service accounts (10,572) (884) (211) (6,352) (10,090) (183) (16,837) (34,155) 12,291 (43,027) Change in non-restricted cash at project companies (16,748) 29,139 16,255 47,092 (62,285) 71,155 72,217 (41,090) 59,969 (90,385) Dividends paid to non-controlling interests - - - - (4,665) (3,642) (8,307) - (5,479) (3,473) Changes in other assets and liabilities (38) 7,738 (27,944) 24,516 21,105 62,143 79,821 (13,237) (33,824) (13,957) Asset refinancing - - - - - - - 14,893 - - Cash Available For Distribution (CAFD) 28,127 28,401 38,500 44,595 58,576 36,825 178,496 18,736.. 39,607 53,780 . Dividends declared (1) 23,696 20,736 �� 34,074 40,087 43,093 - 117,254 - 29,063.. 16,335 # of shares at the end of the period 80,000,000 80,000,000 80,000,000 100,217,260 100,217,260 100,217,260 100,217,260 100,217,260 100,217,260 100,217,260 DPS (in $ per share) 0.2962 0.2592 0.3400 0.4000 0.4300 - 1.1700 - 0.2900.. 0.1630 Project debt 2,487.1 3,823.1 3,796.7 5,241.2 6,042.6 5,470.7 5,470.7 5,666.8 5,512.1 5,612.9 Project cash (178.9) (198.8) (182.5) (373.3) (618.9) (469.2) (469.2) (529.4) (469.7) (587.6) Net project debt 2,308.2 3,624.3 3,614.1 4,867.9 5,423.7 5,001.5 5,001.5 5,137.4 5,042.4 5,025.3 Corporate debt - 378.5 376.1 377.1 668.7 664.5 664.5 669.9 666.3 671.6 Corporate cash (86.2) (155.4) (84.9) (154.8) (43.6) (45.5) (45.5) (45.4) (84.9) (85.8) Net corporate debt (86.2) 223.1 291.2 222.3 625.1 619.0 619.0 624.5 581.4 585.8 Total net debt 2,222.0 3,847.4 3,905.3 3,090.2 6,048.8 5,620.5 5,620.5 5,761.9 5,623.8 5,611.2 Net Corporate Debt/CAFD pre corporate interests(2) na 2.2x 1.8x 1.3x 2.2x 2.9x 2.9x 2.9x 2.7x 2.7x Dividends are paid to shareholders in the quarter after they are declared;Ratios presented are the ratios shown on each quarter’s earnings presentations;Includes the impact of a one-time partial refinancing of ATN2. Debt details Key Financials US $ in thousands HISTORICAL FINANCIAL REVIEWKey Financials by Quarter US $ in millions (3) Dividend declared on August 3 2016 is the sum of $0.145 per share corresponding to the first quarter of 2016 and $0.145 per share corresponding to the second quarter of 2016.Includes $21.2M compensation of preferred equity investment in Brazil. (4) (4) (5)
![](https://capedge.com/proxy/6-K/0001140361-16-086019/form6kslide21.jpg)
3Q14 4Q14 1Q15 2Q15 3Q15 4Q15 FY 2015 1Q16 2Q16 3Q16 by Geography NORTH AMERICA 50,040 48,646 55,943 94,214 109,654 68,328 328,139 65,232 100,617 109,491 SOUTH AMERICA 24,322 23,014 24,405 26,227 29,617 32,231 112,480 29,008 28,973 30,183 EMEA 25,143 21,720 37,956 69,824 128,074 114,408 350,262 112,135 131,712 155,598 by Business Sector RENEWABLES 51,599 40,791 63,680 129,747 204,412 145,173 543,012 141,166 201,246 235,844 CONVENTIONAL 28,073 33,556 31,330 34,009 34,676 38,702 138,717 35,179 30,289 29,452 TRANSMISSION 19,833 19,033 19,159 20,079 22,046 25,109 86,393 23,530 23,383 23,822 WATER - - 4,136 6,429 6,211 5,983 22,759 6,501 6,384 6,154 Total Revenue 99,505 93,380 118,304 190,265 267,345 214,967 790,881 206,376 261,302 295,272 3Q14 4Q14 1Q15 2Q15 3Q15 4Q15 FY 2015 1Q16 2Q16 3Q16 by Geography NORTH AMERICA 49,014 42,697 50,941 86,356 94,739 47,523 279,559 51,212 89,959 103,049 97.9% 87.8% 91.1% 91.7% 86.4% 69.6% 85.2% 78.5% 89.4% 94.1% SOUTH AMERICA 24,323 23,399 24,998 26,625 29,171 30,111 110,905 24,062 23,996 45,496(1) 100.0% 101.7% 102.4% 101.5% 98.5% 93.4% 98.6% 82.9% 82.8% 150.7% EMEA 15,916 15,502 29,247 46,619 94,739 75,441 246,046 79,605 93,690 115,718 63.3% 71.4% 77.1% 66.8% 74.0% 65.9% 70.2% 71.0% 71.1% 74.4% by Business Sector RENEWABLES 44,114 33,131 52,760 106,404 162,971 95,022 417,157 102,170 155,253 191,570 85.5% 81.2% 82.9% 82.0% 79.7% 65.5% 76.8% 72.4% 77.1% 81.2% CONVENTIONAL 24,834 28,511 26,961 26,358 26,937 27,415 107,671 27,079 26,655 26,390 88.5% 85.0% 86.1% 77.5% 77.7% 70.8% 77.6% 77.0% 88.0% 89.6% TRANSMISSION 20,305 19,956 20,529 21,326 22,885 24,307 89,047 19,410 19,948 40,551(1) 102.4% 104.8% 107.2% 106.2% 103.8% 96.8% 103.1% 82.5% 85.3% 170.2% WATER - - 4,936 5,512 5,856 6,331 22,635 6,220 5,789 5,751 119.4% 85.7% 94.3% 105.8% 99.5% 95.7% 90.7% 93.5% Total Further Adj. EBITDA incl. unconsolidated affiliates 89,253 81,598 105,186 159,600 218,649 153,075 636,510 154,879 207,645 264,262(1) 89.7% 87.4% 88.9% 83.9% 81.8% 71.2% 80.5% 75.0% 79.5% 89.5% HISTORICAL FINANCIAL REVIEWSegment Financials by Quarter US $ in thousands Revenue Further Adj. EBITDA incl. unconsolidated affiliates (1) Includes $21.2 M compensation of preferred equity investment in Brazil.
![](https://capedge.com/proxy/6-K/0001140361-16-086019/form6kslide22.jpg)
3Q14 4Q14 1Q15 2Q15 3Q15 4Q15 FY 2015 1Q16 2Q16 3Q16 RENEWABLES (MW) 430 891 991 1,241 1,441 1,441 1,441 1,441 1,441 1,442 CONVENTIONAL (electric MW) 300 300 300 300 300 300 300 300 300 300 TRANSMISSION (Miles) 1,018 1,018 1,018 1,099 1,099 1,099 1,099 1,099 1,099 1,099 WATER (Mft3/day) - - 10.5 10.5 10.5 10.5 10.5 10.5 10.5 10.5 RENEWABLES (GWh) 300 184 319 764 958 495 2,536 514 974 1,098 (GWh) 640 629 628 616 601 620 2,465 529 621 649 (availability %) 104.6% 101.0% 101.7% 101.9% 101.7% 101.5% 101.7% 87.5% 102.5% 103.5% TRANSMISSION(2) (availability %) 100.0% 100.0% 99.9% 99.8% 99.3% 100.0% 99.9% 99.9% 99.9% 99.9% WATER(2) (availability %) - - 96.8% 103.2% 101.6% 102.5% 101.5% 101.5% 102.7% 102.9% CONVENTIONAL(1) Capacity in operation(at the end of the period) Production / Availability Conventional availability refers to operational MW over contracted MW with Pemex.Availability for transmission lines is calculated over contracted levels and availability for water refers to availability over target levels. HISTORICAL FINANCIAL REVIEWKey Performance Indicators
![](https://capedge.com/proxy/6-K/0001140361-16-086019/form6kslide23.jpg)
3Q14 4Q14 1Q15 2Q15 3Q15 4Q15 FY 2015 1Q16 2Q16 3Q16 US 28.1% 14.4% 14.3% 33.7% 34.5% 17.1% 24.9% 17.3% 36.4% 33.5% Spain 34.3% 8.1% 15.1% 30.6% 31.3% 8.6% 21.0% 14.2% 27.0% 35.4% Kaxu 26.0% 31.1% 29.3%(2) 42.2% 25.8% 33.2% WIND (Uruguay) 42.8% 38.0% 27.3% 34.4% 41.9% 39.3% 35.8% 31.6% 32.2% 35.9% SOLAR Historical Capacity Factors (1) HISTORICAL FINANCIAL REVIEWCapacity Factors Historical Capacity Factors calculated from the date of entry into operation or the acquisition of each asset. Some capacity factors are not indicative of a full period of operations.Average capacity factor in Kaxu for 2015 calculated from August 1, 2015.
![](https://capedge.com/proxy/6-K/0001140361-16-086019/form6kslide24.jpg)
STABLE CASH FLOWSLong-dated Contracts with CreditWorthy Counterparties LONG-TERM CONTRACTS HIGH QUALITY OFFTAKERS 21 Weighted average years remaining (2) +95 Investment grade offtakers (1) LOW DEPENDENCE ON NATURAL RESOURCES PRODUCTION-BASED 36% AVAILABILITY-BASED 64% % Note: All amounts based on run-rate CAFD excluding Brazil (ACBH) and no acquisitions.Based on Moody’s rating. Offtakers for Quadra 1&2, Honaine, Skikda and ATN2 are unrated. Offtaker for ATN and ATS is the Ministry of Energy of the Government of Peru, for Spanish assets is the Government of Spain and for Kaxu is the Republic of South Africa.Represents weighted average years remaining as of September 30, 2016.
![](https://capedge.com/proxy/6-K/0001140361-16-086019/form6kslide25.jpg)
TAIL PERIODSRemaining Project Life after Debt Amortization PPAs with predefined prices for 21 years on average Additionally, “second life” (merchant or additional PPA) after existing PPA in all assets excluding ATN and ATS PPA expiration year Contract term(1) Project debt term Year (1) Regulation in the case of Spain. 2016
![](https://capedge.com/proxy/6-K/0001140361-16-086019/form6kslide26.jpg)
SIZEABLE AND DIVERSIFIED ASSET PORTFOLIOPortfolio Breakdown CURRENCY(1) SECTOR GEOGRAPHY Note: All amounts based on run-rate CAFD excluding Brazil (ACBH) and no acquisitions. Including the effect of the currency swap agreement signed with Abengoa. of long term interest rate in projects is fixed or hedged ~ 90% 93 Denominatedin USD % 44% North America37% Europe10% South America9% RoW 73% Renewable18% Conventional 6% Transmission 3% Water
![](https://capedge.com/proxy/6-K/0001140361-16-086019/form6kslide27.jpg)
2016 2017 2018 2019 2020 Thereafter Total(1) NORTH AMERICA 52.6 54.3 60.3 70.0 80.2 1,569.8 1,887.2 SOUTH AMERICA 15.5 19.7 21.3 23.8 26.6 771.4 878.3 EMEA 106.9 117.0 128.0 136.1 141.1 2,055.4 2,684.5 Total 175.0 191.0 209.6 229.9 247.9 4,396.6 5,450.0 US $ in millions PROJECT DEBT Repayment Schedule as of December 31, 2015 2016 2017 2018 2019 2020 Thereafter Total(1) RENEWABLES 131.7 146.3 172.4 184.0 192.7 3,268.9 4,096.0 CONVENTIONAL 26.5 26.1 16.8 23.2 30.1 492.4 615.1 TRANSMISSION 12.0 13.6 15.2 17.3 19.5 613.9 691.5 WATER 4.8 5.0 5.2 5.4 5.6 21.4 47.4 Total 175.0 191.0 209.6 229.9 247.9 4,396.6 5,450.0 Does not include $20.7M of accrued interest. Exchange rates as of December 31, 2015: (EUR/USD = 1.0862)
![](https://capedge.com/proxy/6-K/0001140361-16-086019/form6kslide28.jpg)
US $ in millions 2019 Notes Credit Facility Tranche A Tranche B Maturity November 2019 Amount(As of September 30, 2016) 259.5 Total 671.6 December 2018 123.7 December 2017 288.4 CORPORATE DEBT DETAILSCorporate Debt as of September 30, 2016
![](https://capedge.com/proxy/6-K/0001140361-16-086019/form6kslide29.jpg)
3 monthsSept 16 3 monthsSept 15 3.3 2.3 25.9 33.0 16.0 29.8 (1.3) 94.4 98.7 237.3 73.6 78.9 4.6 21.2 2.1 2.2 (1.8) 323.4 Q3 2016 RECONCILIATIONReconciliation of Further Adjusted EBITDA including unconsolidated affiliates to Profit/(loss) for the period US $ in millions 9 monthsSept 16 9 monthsSept 15 Profit/(loss) for the period attributable to the Company 9.1 7.2 Profit attributable to non-controlling interest Income tax Share of loss/(profit) of associates carried under the equity method Financial expense, net 25.2 9.7 22.3 45.9 (4.6) 224.4 306.8 483.4 184.0 234.4 13.8 21.2 9.2 6.7 (5.1) 626.8 264.3 218.6 Further Adjusted EBITDAincl. unconsolidated affiliates 138.3 162.0 Operating Profit 276.4 364.5 Depreciation, amortization, and impairment charges Dividend from exchangeable preferred equity investment in ACBH ABY’s pro-rata share of EBITDA from unconsolidated affiliates Further Adjusted EBITDA 216.5 262.1 474.2 620.1
![](https://capedge.com/proxy/6-K/0001140361-16-086019/form6kslide30.jpg)
SIZEABLE AND DIVERSIFIED ASSET PORTFOLIO ASSET TYPE STAKE LOCATION GROSSCAPACITY OFFTAKER RATING (2) YEARSCONTRACT LEFT CCV RENEWABLE ENERGY Solana 100% (1) USA (Arizona) 280 MW APS A-/A3/BBB+ 28 USD Mojave 100% USA (California) 280 MW PG&E BBB+/Baa1/BBB+ 24 USD Solaben 2/3 70% Spain 2x50 MW Kingdom of Spain BBB+/Baa2/BBB+ 22/21 USD (6) Solacor 1/2 87% Spain 2x50 MW Kingdom of Spain BBB+/Baa2/BBB+ 21 USD (6) PS 10/20 100% Spain 31 MW Kingdom of Spain BBB+/Baa2/BBB+ 16/18 USD (6) Helioenergy 1/2 100% Spain 2x50 MW Kingdom of Spain BBB+/Baa2/BBB+ 22 USD (6) Helios 1/2 100% Spain 2x50 MW Kingdom of Spain BBB+/Baa2/BBB+ 21/22 USD (6) Solnova 1/3/4 100% Spain 3x50 MW Kingdom of Spain BBB+/Baa2/BBB+ 19/19/20 USD (6) Solaben 1/6 100% Spain 2x50 MW Kingdom of Spain BBB+/Baa2/BBB+ 23 USD (6) Seville PV 80% Spain 1 MW Kingdom of Spain BBB+/Baa2/BBB+ 18 EUR Kaxu 51% South Africa 100 MW Eskom BBB-/Baa2/BBB- (4) 19 ZAR Palmatir 100% Uruguay 50 MW UTE BBB/Baa2/BBB- (4) 18 USD Cadonal 100% Uruguay 50 MW UTE BBB/Baa2/BBB- (4) 19 USD Liberty Interactive Corporation holds $300M in Class A membership interests in exchange for a share of the dividends and the taxable loss generated by Solana.Reflects the counterparty’s issuer credit ratings issued by S&P, Moody’s and Fitch, respectively.USD denominated but payable in local currency. For Kaxu is the credit rating of the Republic of South Africa, and for Palmatir and Cadonal it refers to the credit rating of Uruguay, as UTE is unrated. During the initial 5-year period, we have the right to receive, in four quarterly installments, a preferred dividend of $18.4 million per year.Gross cash in Euros dollarized through a currency swap contract with Abengoa
![](https://capedge.com/proxy/6-K/0001140361-16-086019/form6kslide31.jpg)
SIZEABLE AND DIVERSIFIED ASSET PORTFOLIO (Cont’d) ASSET TYPE STAKE LOCATION GROSSCAPACITY OFFTAKER RATING (2) YEARSCONTRACT LEFT CCY CONVENTIONALPOWER ACT 100% Mexico 300 MW Pemex BBB+/Baa3/BBB+ 17 USD (3) ELECTRICAL TRANSMISSION ATN 100% Peru 362 miles Peru BBB+/A3/BBB+ 25 USD (3) ATS 100% Peru 569 miles Peru BBB+/A3/BBB+ 28 USD (3) ATN 2 100% Peru 81 miles Las Bambas Not rated 17 USD (3) Quadra 1&2 100% Chile 81 miles Sierra Gorda Not rated 19 USD (3) Palmucho 100% Chile 6 miles Endesa Chile BBB+/Baa2/BBB+ 22 USD (3) WATER Skikda 34% Algeria 3.5 Mft3/day Sonatrach & ADE Not rated 18 USD (3) Honaine 26% Algeria 7 Mft3/day Sonatrach & ADE Not rated 22 USD (3) PREFERRED INSTRUMENT Exchangeable Preferred Equity in ACBH - Brazil $18.4 M p.a. (5) - N/A; dividend subordination - USD Liberty Interactive Corporation holds $300M in Class A membership interests in exchange for a share of the dividends and the taxable loss generated by Solana.Reflects the counterparty’s issuer credit ratings issued by S&P, Moody’s and Fitch, respectively.USD denominated but payable in local currency. For Kaxu is the credit rating of the Republic of South Africa, and for Palmatir and Cadonal it refers to the credit rating of Uruguay, as UTE is unrated. During the initial 5-year period, we have the right to receive, in four quarterly installments, a preferred dividend of $18.4 million per year.Gross cash in Euros dollarized through a currency swap contract with Abengoa
![](https://capedge.com/proxy/6-K/0001140361-16-086019/form6kslide32.jpg)
Great West House, GW1, 17th floor,Great West RoadBrentford TW8 9DFLondon (United Kingdom)
SIGNATURES
Pursuant to the requirements of the Securities Exchange Act of 1934, the Registrant has duly caused this report to be signed on its behalf by the undersigned, thereunto duly authorized.
ATLANTICA YIELD PLC | ||
Date: November 14, 2014 | By: | /s/ Santiago Seage |
Name: Santiago Seage | ||
Title: Chief Executive Officer |