UNITED STATES
SECURITIES AND EXCHANGE COMMISSION
Washington, D.C. 20549
FORM 6-K
REPORT OF FOREIGN PRIVATE ISSUER
PURSUANT TO RULE 13a-16 OR 15d-16
UNDER THE SECURITIES EXCHANGE ACT OF 1934
For the month of August, 2019
Commission File Number 001-36487
Atlantica Yield plc
(Exact name of Registrant as specified in its charter)
Not applicable
(Translation of Registrant’s name into English)
Great West House, GW1, 17th floor
Great West Road
Brentford, TW8 9DF
United Kingdom
Tel: +44 203 499 0465
Indicate by check mark whether the registrant files or will file annual reports under cover of Form 20-F or Form 40-F:
| ☒ Form 20-F | ☐ Form 40-F |
Indicate by check mark if the registrant is submitting the Form 6-K in paper as permitted by Regulation S-T Rule 101(b)(1): ☐
Indicate by check mark if the registrant is submitting the Form 6-K in paper as permitted by Regulation S-T Rule 101(b)(7): ☐
This Report on Form 6-K is incorporated by reference into the Registration Statement on Form F-3 of the Registrant filed with the Securities and Exchange Commission on August 6, 2018 (File 333-226611).

Q2 2019 Earnings PresentationAugust 7, 2019

DISCLAIMER Forward Looking StatementsThis presentation contains forward-looking statements. These forward-looking statements include, but are not limited to, all statements other than statements of historical facts contained in this presentation, including, without limitation, those regarding our future financial position and results of operations, our strategy, plans, objectives, goals and targets, future developments in the markets in which we operate or are seeking to operate or anticipated regulatory changes in the markets in which we operate or intend to operate. In some cases, you can identify forward-looking statements by terminology such as "aim," "anticipate," "believe," "continue," "could," "estimate," "expect," "forecast," "guidance," "intend," "is likely to," "may," "plan," "potential," "predict," "projected," "should" or "will" or the negative of such terms or other similar expressions or terminology.By their nature, forward-looking statements involve risks and uncertainties because they relate to events and depend on circumstances that may or may not occur in the future. Forward-looking statements speak only as of the date of this presentation and are not guarantees of future performance and are based on numerous assumptions. Our actual results of operations, financial condition and the development of events may differ materially from (and be more negative than) those made in, or suggested by, the forward-looking statements. Except as required by law, we do not undertake any obligation to update any forward-looking statements to reflect events or circumstances after the date hereof or to reflect the occurrence of anticipated or unanticipated events or circumstances.Investors should read the section entitled "Item 3D. Key Information—Risk Factors" and the description of our segments and business sectors in the section entitled "Item 4B. Information on the Company—Business Overview", each in our annual report for the fiscal year ended December 31, 2018 filed on Form 20-F, for a more complete discussion of the risks and factors that could affect us.Forward-looking statements include, but are not limited to, statements relating to: uncertainties in emerging markets where we have international operations; statements related to project growth strategy; commitments to increased DPS and accretive investment opportunities; strategic business alternatives to ensure optimal company value and improve shareholder return; intentions to internalize O&M in our U.S. solar and wind assets in Uruguay; estimated returns and cash available for distribution (“CAFD”) estimates from project debt refinancing; projected future CAFD yield; cash available for distribution estimates made in reliance on asset performance and assets reaching COD by the expected date; fluctuations in the cost of energy and gas; predictions and estimates regarding global water demand, power generation, renewable energy, water desalination markets and related investments; strategies in the event of Mojave distribution delays based on the PG&E default; ESG initiative improvement; the quality of our long-term contracts; self-amortizing project debt structure and related debt reduction; expected U.S. growth, the use of non-GAAP measures as a useful predicting tool for investors; the possibility to extend asset life; and various other factors, including those factors discussed under “Item 3.D—Risk Factors” and “Item 5.A—Operating Results” in our Annual Report for the fiscal year ended December 31, 2018 filed on Form 20-F.For the purposes of the announced transactions, CAFD yield is the annual weighted average of CAFD expected to be generated by the investments over their first 10-year period from 2019, or from COD for those assets which are not yet in operation, divided by the expected acquisition price. CAFD Yield is an internal estimation subject to a high degree of uncertainty and our ability to reach this expected CAFD Yield depends on a variety of factors, including closing of the acquisitions on their expected terms, acquired assets performing as expected, acquired assets making cash distributions to the holding level as expected, and assets reaching COD by the expected date. Furthermore, any dividends are subject to available capital, market conditions, and compliance with associated laws and regulations. These factors should be considered in connection with information regarding risks and uncertainties that may affect our future results included in our filings with the U.S. Securities and Exchange Commission at www.sec.gov. We undertake no obligation to update or revise any forward-looking statements, whether as a result of new information, future events or developments or otherwise. Should one or more of these risks or uncertainties materialize, or should underlying assumptions prove incorrect, actual results may vary materially from those described herein as anticipated, believed, estimated, expected or targeted.The CAFD and other guidance included in this presentation are estimates as of February 28, 2019. These estimates are based on assumptions believed to be reasonable as of the date Atlantica published its FY 2018 Financial Results. Atlantica disclaims any current intention to update such guidance, except as required by law.Non-GAAP Financial Information This presentation also includes certain non-GAAP financial measures, including Further Adjusted EBITDA including unconsolidated affiliates, Further Adjusted EBITDA including unconsolidated affiliates as a percentage of revenues (margin) and CAFD. Non-GAAP financial measures are not measurements of our performance or liquidity under IFRS as issued by IASB and should not be considered alternatives to operating profit or profit for the period or any other performance measures derived in accordance with IFRS as issued by the IASB or any other generally accepted accounting principles or as alternatives to cash flow from operating, investing or financing activities. Please refer to the appendix of this presentation for a reconciliation of the non-GAAP financial measures included in this presentation to the most directly comparable financial measures prepared in accordance with IFRS as well as the reasons why management believes the use of non-GAAP financial measures in this presentation provides useful information.
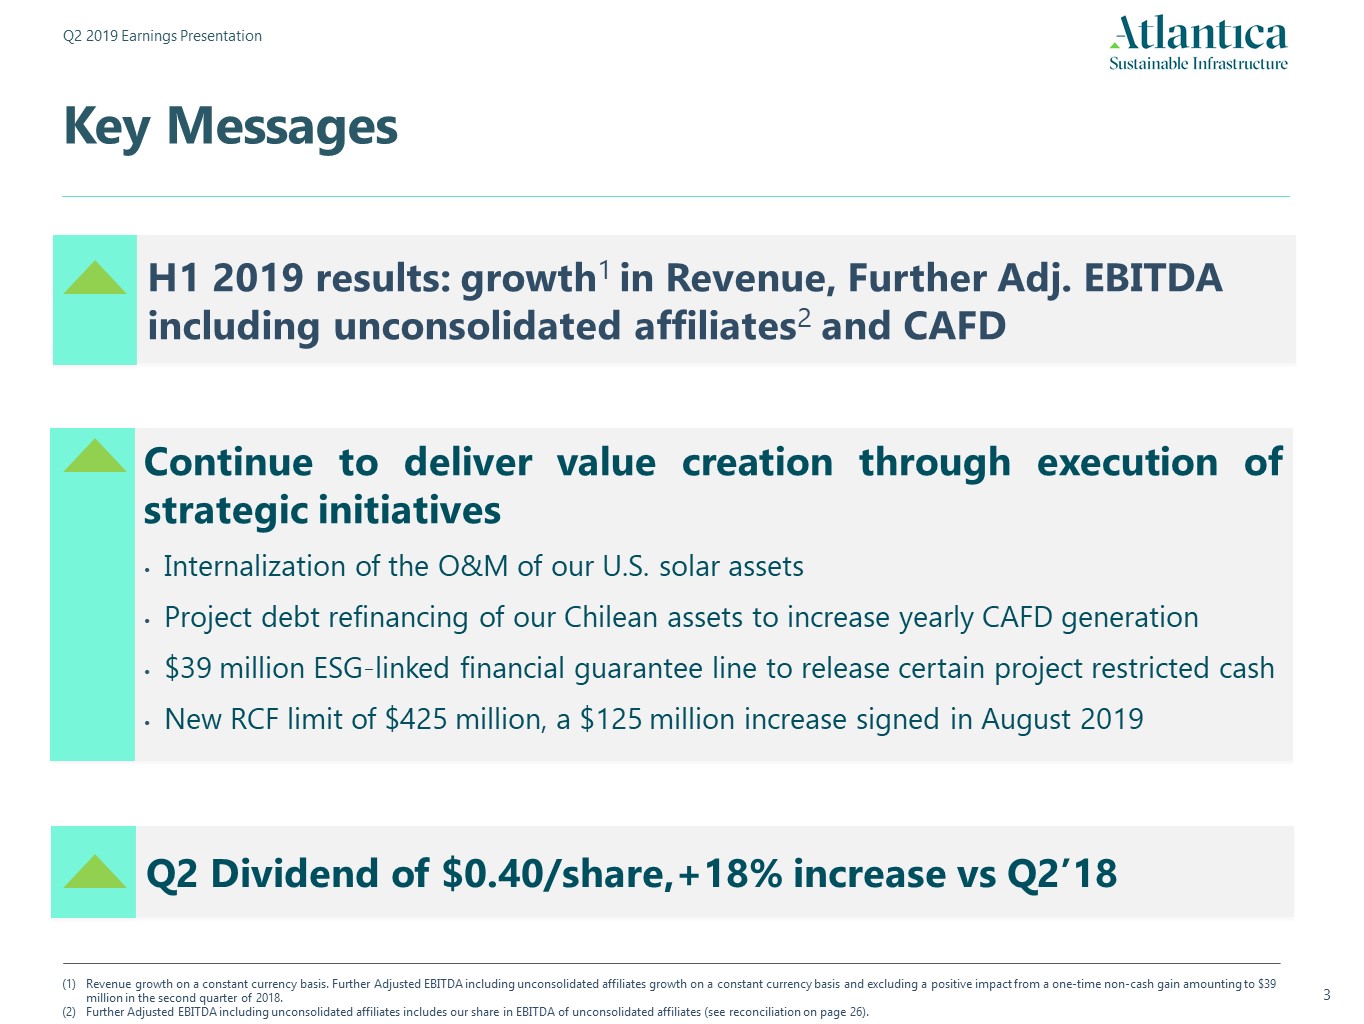
Key Messages Revenue growth on a constant currency basis. Further Adjusted EBITDA including unconsolidated affiliates growth on a constant currency basis and excluding a positive impact from a one-time non-cash gain amounting to $39 million in the second quarter of 2018. Further Adjusted EBITDA including unconsolidated affiliates includes our share in EBITDA of unconsolidated affiliates (see reconciliation on page 26). Q2 Dividend of $0.40/share,+18% increase vs Q2’18 H1 2019 results: growth1 in Revenue, Further Adj. EBITDA including unconsolidated affiliates2 and CAFD Continue to deliver value creation through execution of strategic initiatives Internalization of the O&M of our U.S. solar assetsProject debt refinancing of our Chilean assets to increase yearly CAFD generation$39 million ESG-linked financial guarantee line to release certain project restricted cashNew RCF limit of $425 million, a $125 million increase signed in August 2019 3
Key Messages Revenue growth on a constant currency basis. Further Adjusted EBITDA including unconsolidated affiliates growth on a constant currency basis and excluding a positive impact from a one-time non-cash gain amounting to $39 million in the second quarter of 2018. Further Adjusted EBITDA including unconsolidated affiliates includes our share in EBITDA of unconsolidated affiliates (see reconciliation on page 26). Q2 Dividend of $0.40/share, a +18% increase vs Q2’18 H1 2019 results: growth1 in Revenue, Further Adj. EBITDA including unconsolidated affiliates2 and CAFD Continue to deliver value creation through execution of strategic initiatives Internalization of the O&M of our U.S. solar assets and our wind assetsProject debt refinancing of our Chilean assets to increase yearly CAFD generation$39 million ESG-linked financial guarantee line to release certain project restricted cashNew RCF limit of $425 million: a $125 million increase signed in August 2019

Sustainable Infrastructure 1. Financial Results
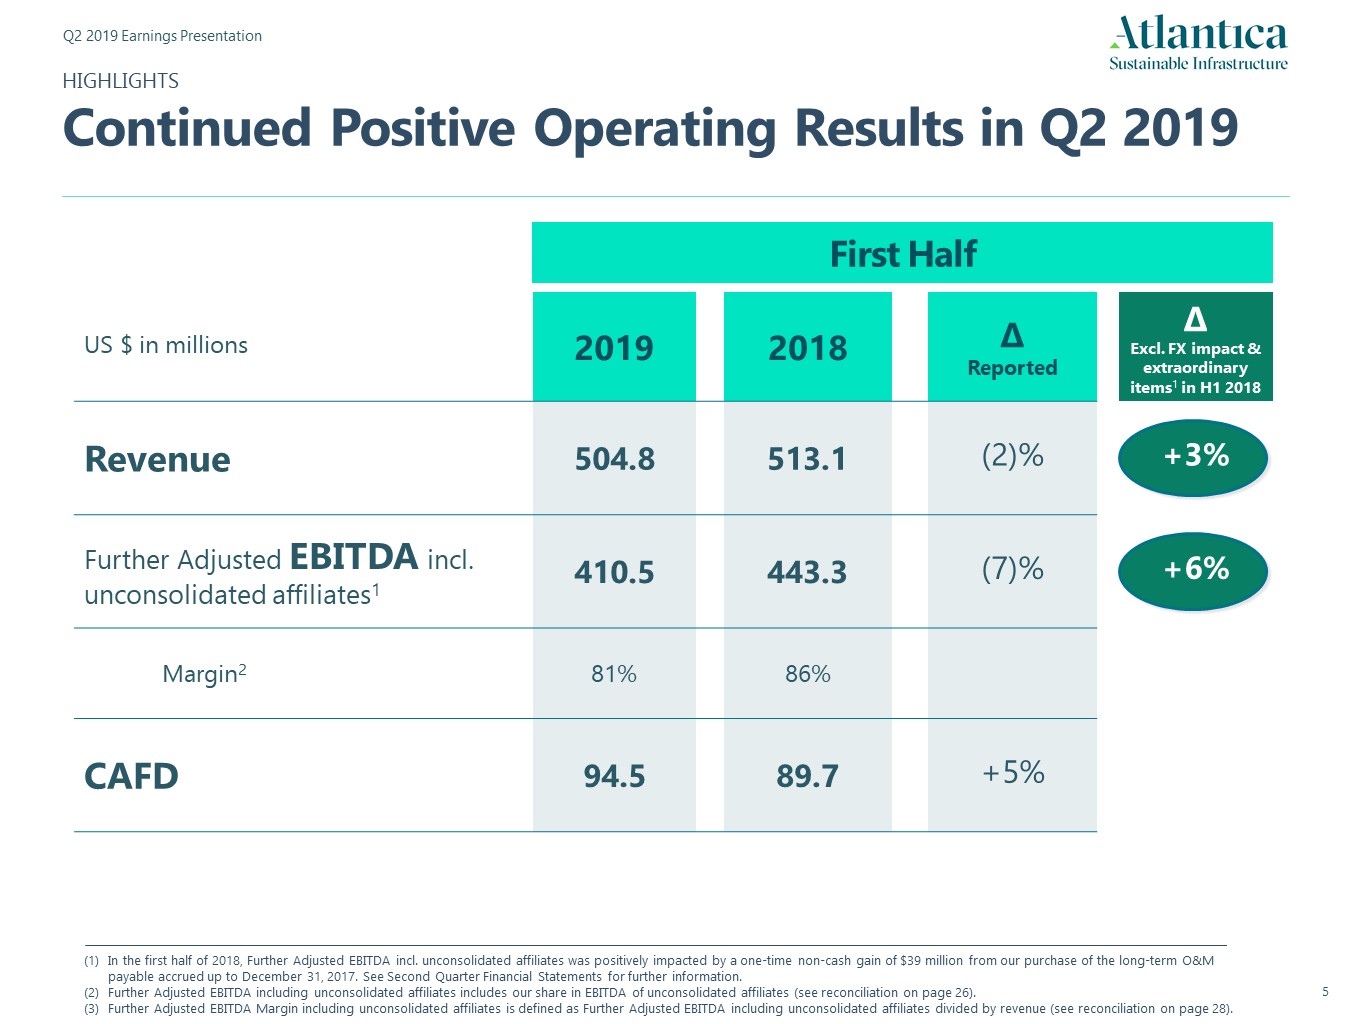
HIGHLIGHTSContinued Positive Operating Results in Q2 2019 In the first half of 2018, Further Adjusted EBITDA incl. unconsolidated affiliates was positively impacted by a one-time non-cash gain of $39 million from our purchase of the long-term O&M payable accrued up to December 31, 2017. See Second Quarter Financial Statements for further information.Further Adjusted EBITDA including unconsolidated affiliates includes our share in EBITDA of unconsolidated affiliates (see reconciliation on page 26).Further Adjusted EBITDA Margin including unconsolidated affiliates is defined as Further Adjusted EBITDA including unconsolidated affiliates divided by revenue (see reconciliation on page 28). First Half US $ in millions 2019 2018 ∆ Reported ∆ Excl. FX impact & extraordinary items1 in H1 2018 Revenue 504.8 513.1 (2)% +3% Further Adjusted EBITDA incl. unconsolidated affiliates1 410.5 443.3 (7)% +6% Margin2 81% 86% CAFD 94.5 89.7 +5%
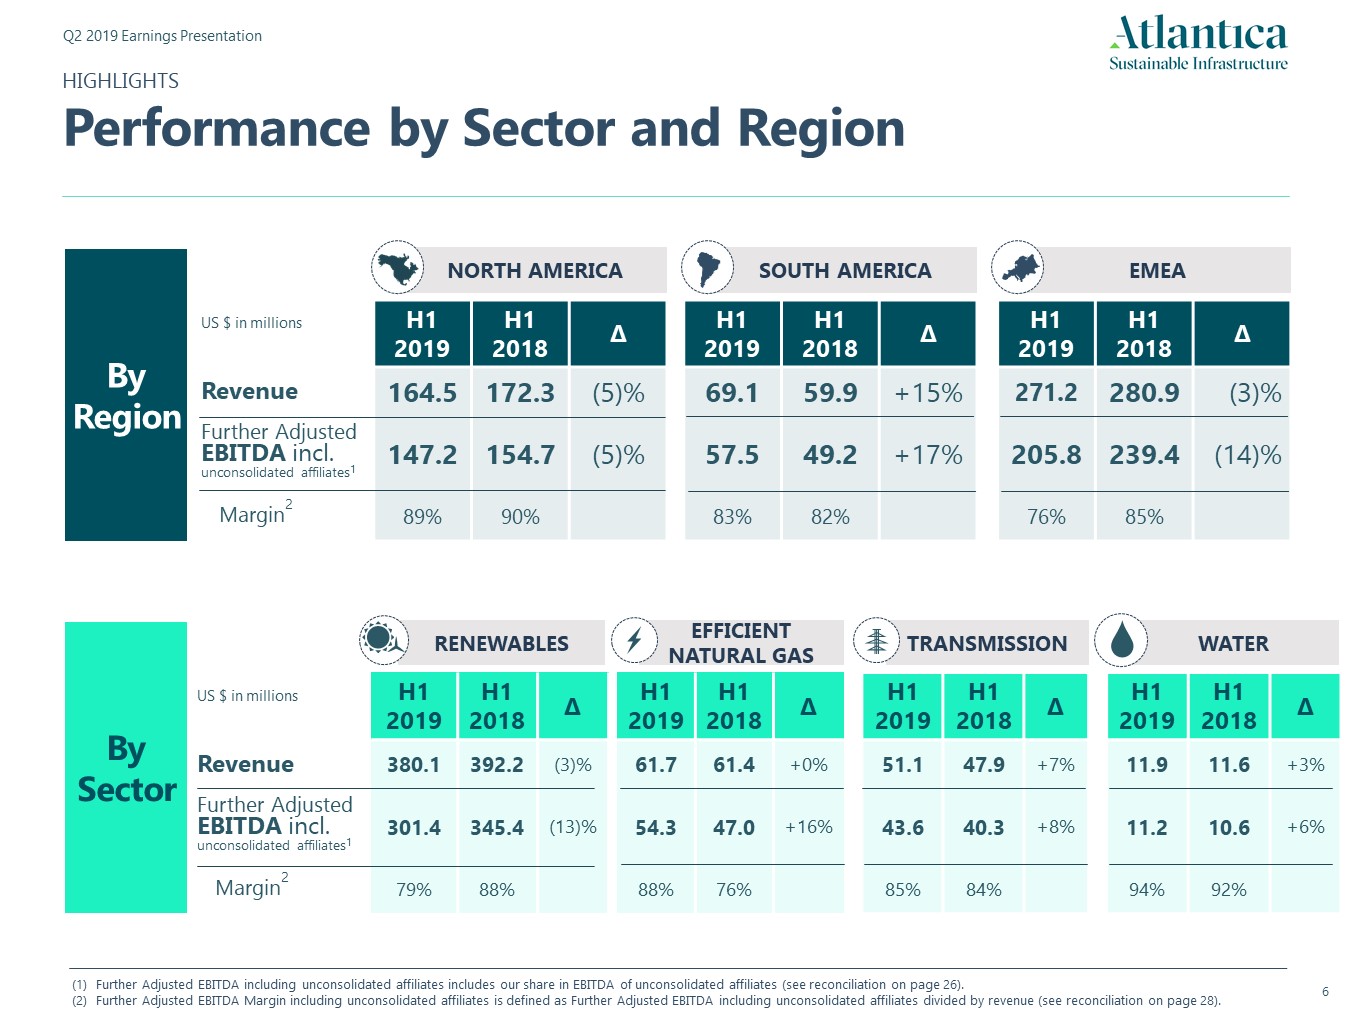
WATER H1 2019 H1 2018 ∆ 11.9 11.6 +3% 11.2 10.6 +6% 94% 92% RENEWABLES H1 2019 H1 2018 ∆ 380.1 392.2 (3)% 301.4 345.4 (13)% 79% 88% EFFICIENT NATURAL GAS H1 2019 H1 2018 ∆ 61.7 61.4 +0% 54.3 47.0 +16% 88% 76% TRANSMISSION H1 2019 H1 2018 ∆ 51.1 47.9 +7% 43.6 40.3 +8% 85% 84% HIGHLIGHTSPerformance by Sector and Region By Sector US $ in millions Revenue Further Adjusted EBITDA incl. unconsolidated affiliates1 Margin2 EMEA NORTH AMERICA H1 2019 H1 2018 ∆ 164.5 172.3 (5)% 147.2 154.7 (5)% 89% 90% SOUTH AMERICA H1 2019 H1 2018 ∆ 271.2 280.9 (3)% 205.8 239.4 (14)% 76% 85% By Region US $ in millions Revenue Further Adjusted EBITDA incl. unconsolidated affiliates1 Margin2 Further Adjusted EBITDA including unconsolidated affiliates includes our share in EBITDA of unconsolidated affiliates (see reconciliation on page 26).Further Adjusted EBITDA Margin including unconsolidated affiliates is defined as Further Adjusted EBITDA including unconsolidated affiliates divided by revenue (see reconciliation on page 28). H1 2019 H1 2018 ∆ 69.1 59.9 +15% 57.5 49.2 +17% 83% 82%

Includes curtailment in wind assets for which we received compensation.Represents total installed capacity in assets owned at the end of the period, regardless of our percentage of ownership in each of the assets.Electric availability refers to operational MW over contracted MW. Major maintenance overhaul held in Q1 and Q2 2019, as scheduled, which reduced production and the electric availability as per the contract.Availability refers to actual availability divided by contracted availability. KEY OPERATIONAL METRICSSteady Operational Performance WATER RENEWABLES TRANSMISSION EFFICIENT NATURAL GAS H1 2019 H1 2018 Availability4 100.6% 100.9% Mft3 in operation2 10.5 10.5 H1 2019 H1 2018 GWh produced1 1,651 1,446 MW in operation2 1,496 1,446 H1 2019 H1 2018 GWh produced3 866 1,101 Electric availability3 88.5% 98.6% MW in operation 300 300 H1 2019 H1 2018 Availability4 100.0% 99.9% Miles in operation 1,152 1,099
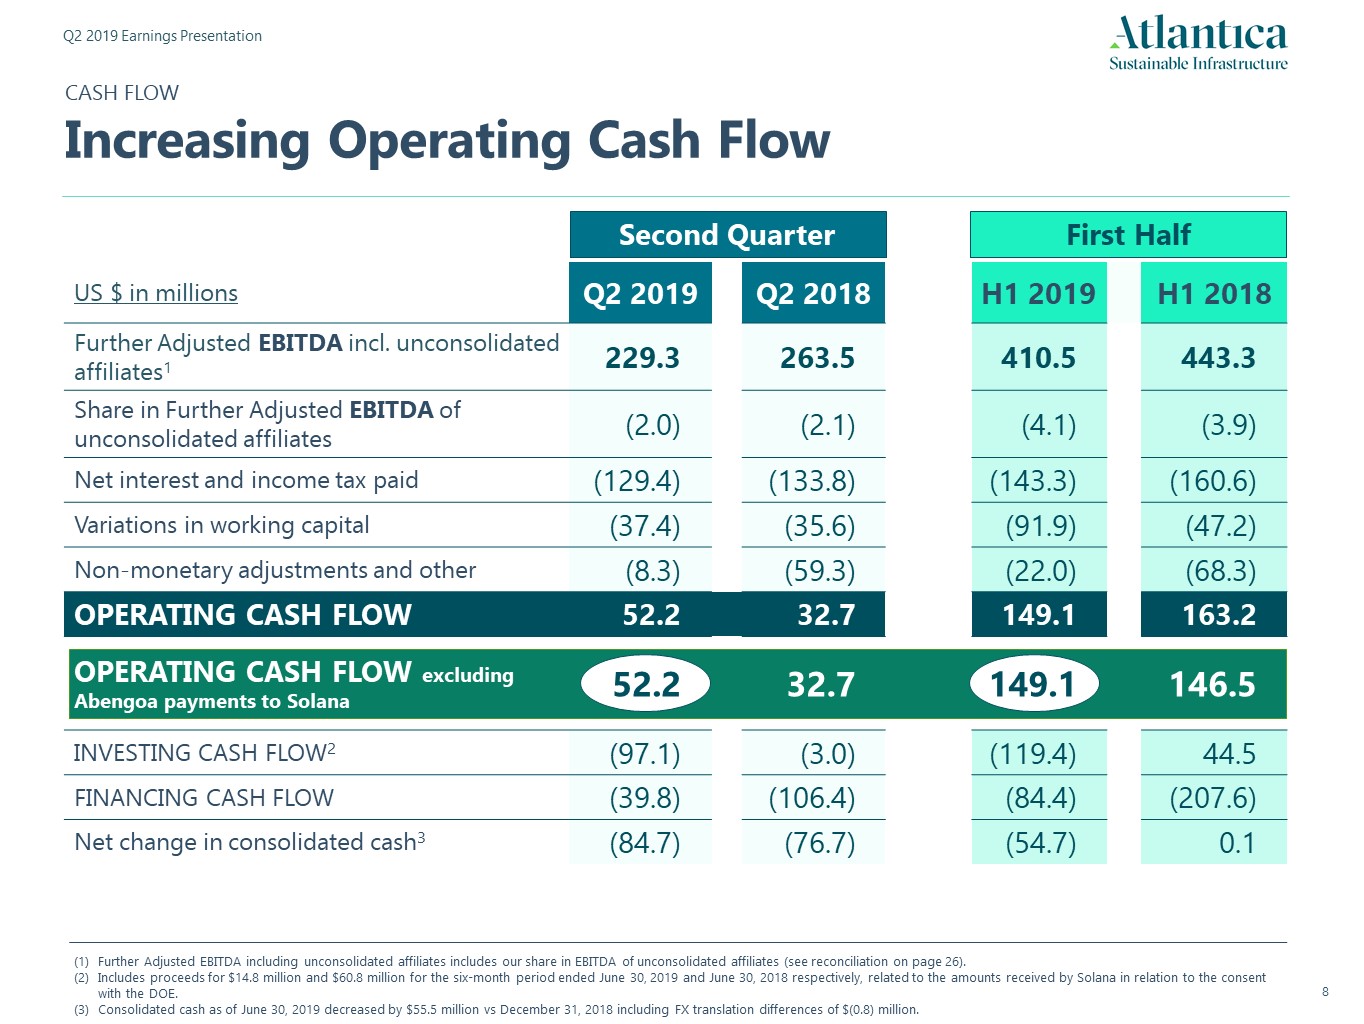
CASH FLOWIncreasing Operating Cash Flow Further Adjusted EBITDA including unconsolidated affiliates includes our share in EBITDA of unconsolidated affiliates (see reconciliation on page 26).Includes proceeds for $14.8 million and $60.8 million for the six-month period ended June 30, 2019 and June 30, 2018 respectively, related to the amounts received by Solana in relation to the consent with the DOE. Consolidated cash as of June 30, 2019 decreased by $55.5 million vs December 31, 2018 including FX translation differences of $(0.8) million. First Half Second Quarter US $ in millions Q2 2019 Q2 2018 H1 2019 H1 2018 Further Adjusted EBITDA incl. unconsolidated affiliates1 229.3 263.5 410.5 443.3 Share in Further Adjusted EBITDA of unconsolidated affiliates (2.0) (2.1) (4.1) (3.9) Net interest and income tax paid (129.4) (133.8) (143.3) (160.6) Variations in working capital (37.4) (35.6) (91.9) (47.2) Non-monetary adjustments and other (8.3) (59.3) (22.0) (68.3) OPERATING CASH FLOW 52.2 32.7 149.1 163.2 OPERATING CASH FLOW excluding Abengoa payments to Solana 52.2 32.7 149.1 146.5 INVESTING CASH FLOW2 (97.1) (3.0) (119.4) 44.5 FINANCING CASH FLOW (39.8) (106.4) (84.4) (207.6) Net change in consolidated cash3 (84.7) (76.7) (54.7) 0.1

NET DEBT POSITION1 Net debt corresponds to gross debt including accrued interest less cash and cash equivalents.Corporate Net Debt defined as indebtedness where Atlantica Yield Plc is the primary obligor minus cash and cash equivalents held at Atlantica Yield plc. Project Net Debt is defined as indebtedness where one of our subsidiaries is the primary obligor minus cash and cash equivalents held by one of our subsidiaries.Net corporate leverage calculated as corporate net debt divided by midpoint 2019 CAFD guidance before corporate debt service. US $ in millions As of Jun. 30,2019 As of Dec. 31,2018 Corporate Net Debt2 582.6 577.4 Project Net Debt3 4,528.4 4,566.3 Corporate net debt / CAFD pre corporate debt service4 2.5x NET DEBTConservative Corporate Leverage
Sustainable Infrastructure 2. Strategic Update Sustainable Infrastructure
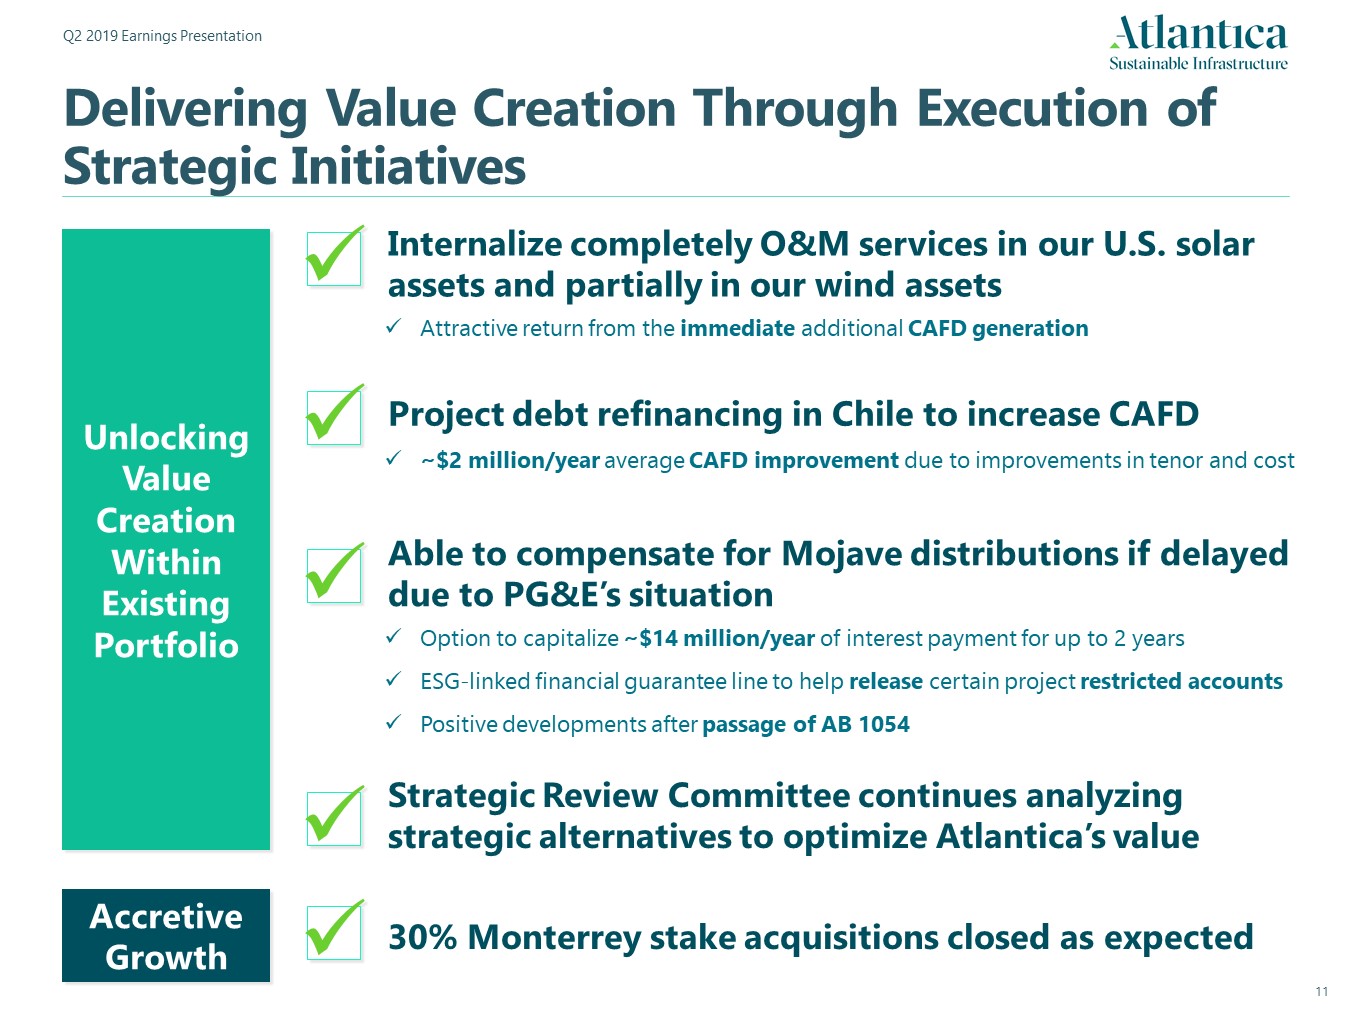
Delivering Value Creation Through Execution of Strategic Initiatives Able to compensate for Mojave distributions if delayed due to PG&E’s situation Option to capitalize ~$14 million/year of interest payment for up to 2 yearsESG-linked financial guarantee line to help release certain project restricted accountsPositive developments after passage of AB 1054 Attractive return from the immediate additional CAFD generation Unlocking Value Creation Within Existing Portfolio Internalize completely O&M services in our U.S. solar assets and partially in our wind assets Project debt refinancing in Chile to increase CAFD ~$2 million/year average CAFD improvement due to improvements in tenor and cost Strategic Review Committee continues analyzing strategic alternatives to optimize Atlantica’s value Accretive Growth 30% Monterrey stake acquisitions closed as expected
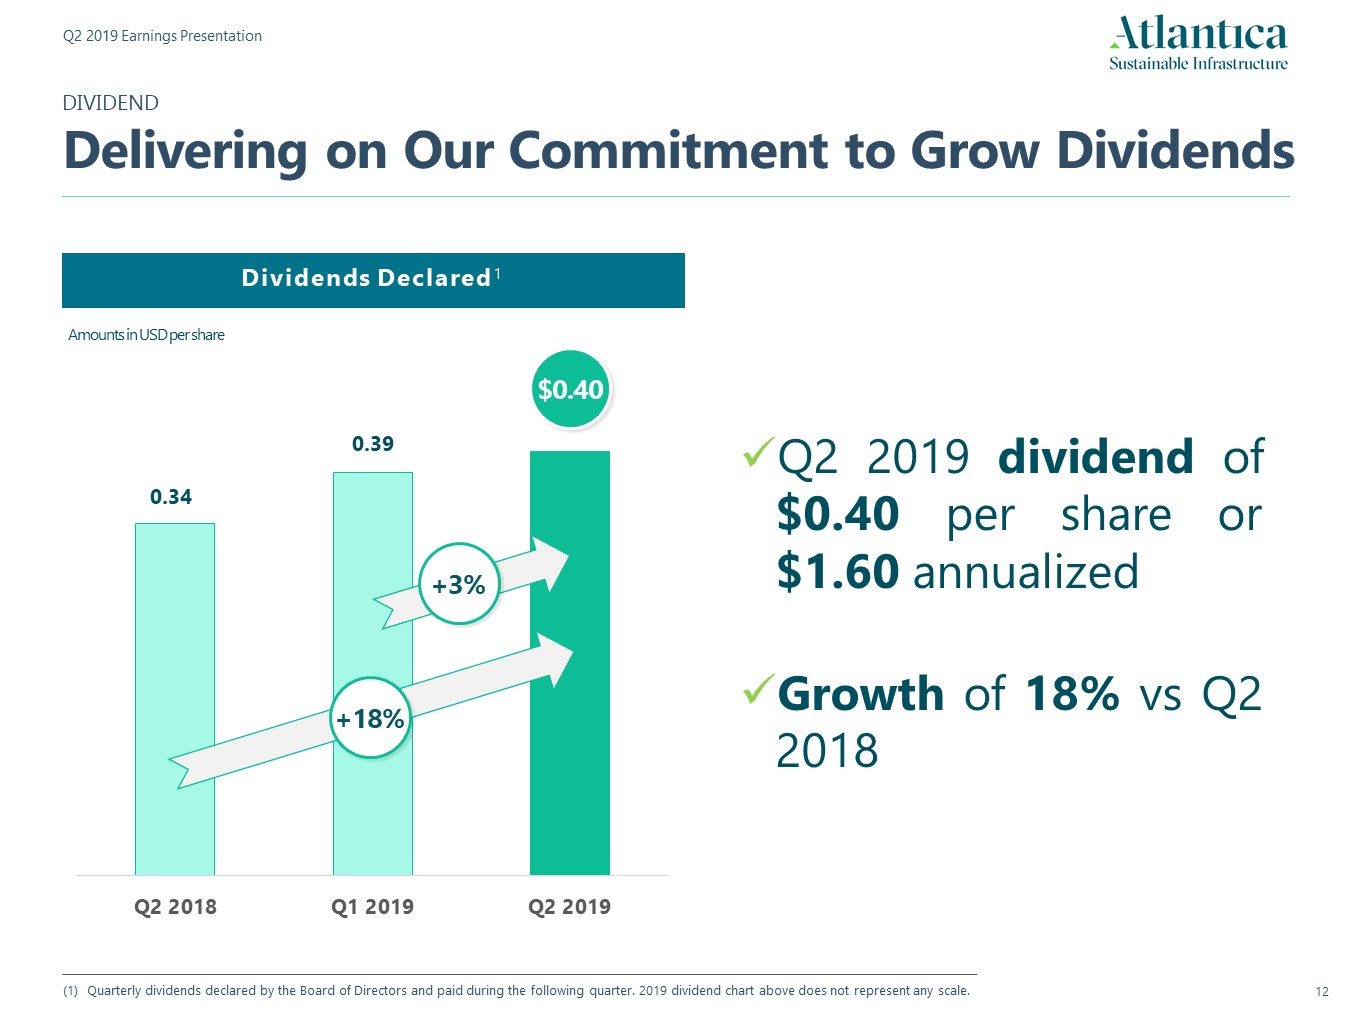
DIVIDEND Delivering on Our Commitment to Grow Dividends Dividends Declared1 Quarterly dividends declared by the Board of Directors and paid during the following quarter. 2019 dividend chart above does not represent any scale. $0.40 Q2 2019 dividend of $0.40 per share or $1.60 annualizedGrowth of 18% vs Q2 2018 Amounts in USD per share +3% +18%
Sustainable Infrastructure 3. Appendix
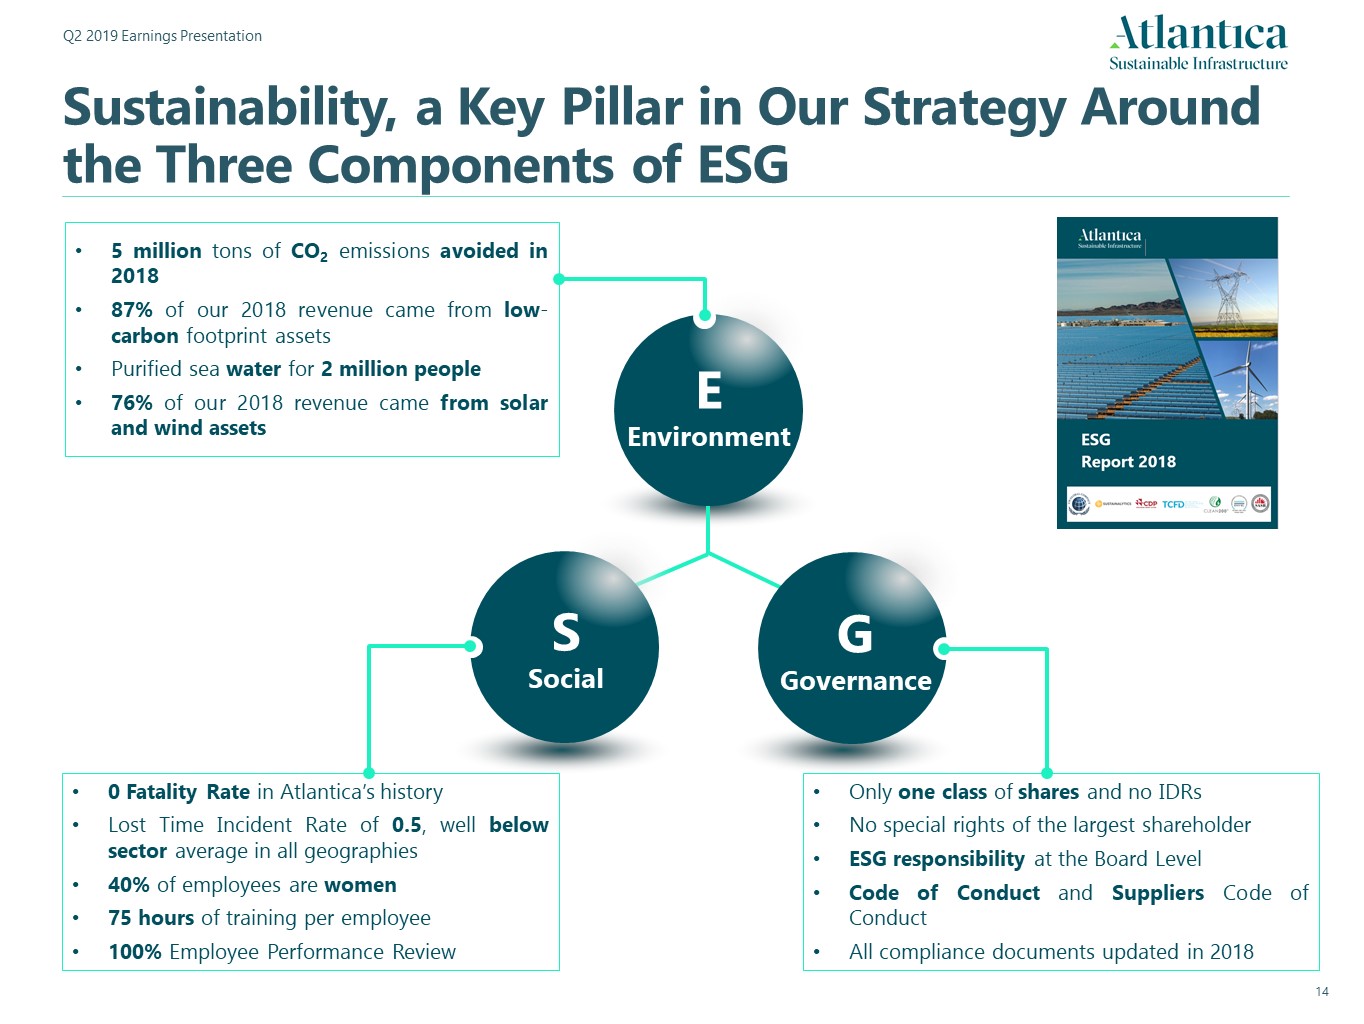
Sustainability, a Key Pillar in Our Strategy Around the Three Components of ESG SSocial G Governance 5 million tons of CO2 emissions avoided in 201887% of our 2018 revenue came from low-carbon footprint assetsPurified sea water for 2 million people76% of our 2018 revenue came from solar and wind assets 0 Fatality Rate in Atlantica’s historyLost Time Incident Rate of 0.5, well below sector average in all geographies40% of employees are women75 hours of training per employee100% Employee Performance Review Only one class of shares and no IDRsNo special rights of the largest shareholderESG responsibility at the Board LevelCode of Conduct and Suppliers Code of ConductAll compliance documents updated in 2018 E Environment
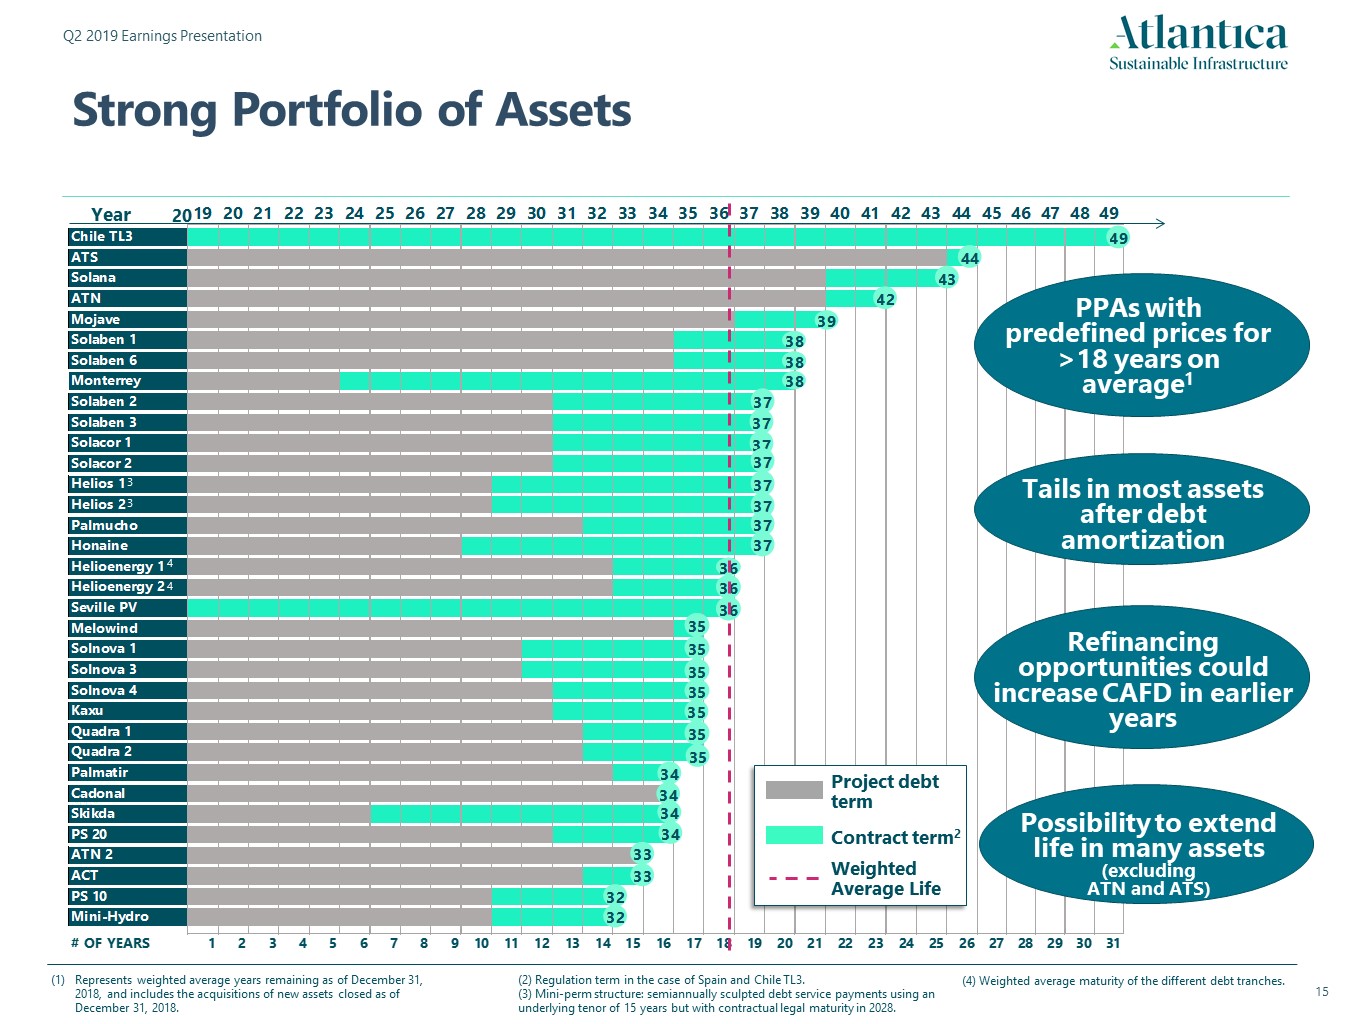
Strong Portfolio of Assets Weighted Average Life Project debt term 20 Represents weighted average years remaining as of December 31, 2018, and includes the acquisitions of new assets closed as of December 31, 2018. (2) Regulation term in the case of Spain and Chile TL3.(3) Mini-perm structure: semiannually sculpted debt service payments using an underlying tenor of 15 years but with contractual legal maturity in 2028. (4) Weighted average maturity of the different debt tranches. 3 3 PPAs with predefined prices for >18 years on average1 Refinancing opportunities could increase CAFD in earlier years Possibility to extend life in many assets (excluding ATN and ATS) Tails in most assets after debt amortization 4 4 Year Contract term2
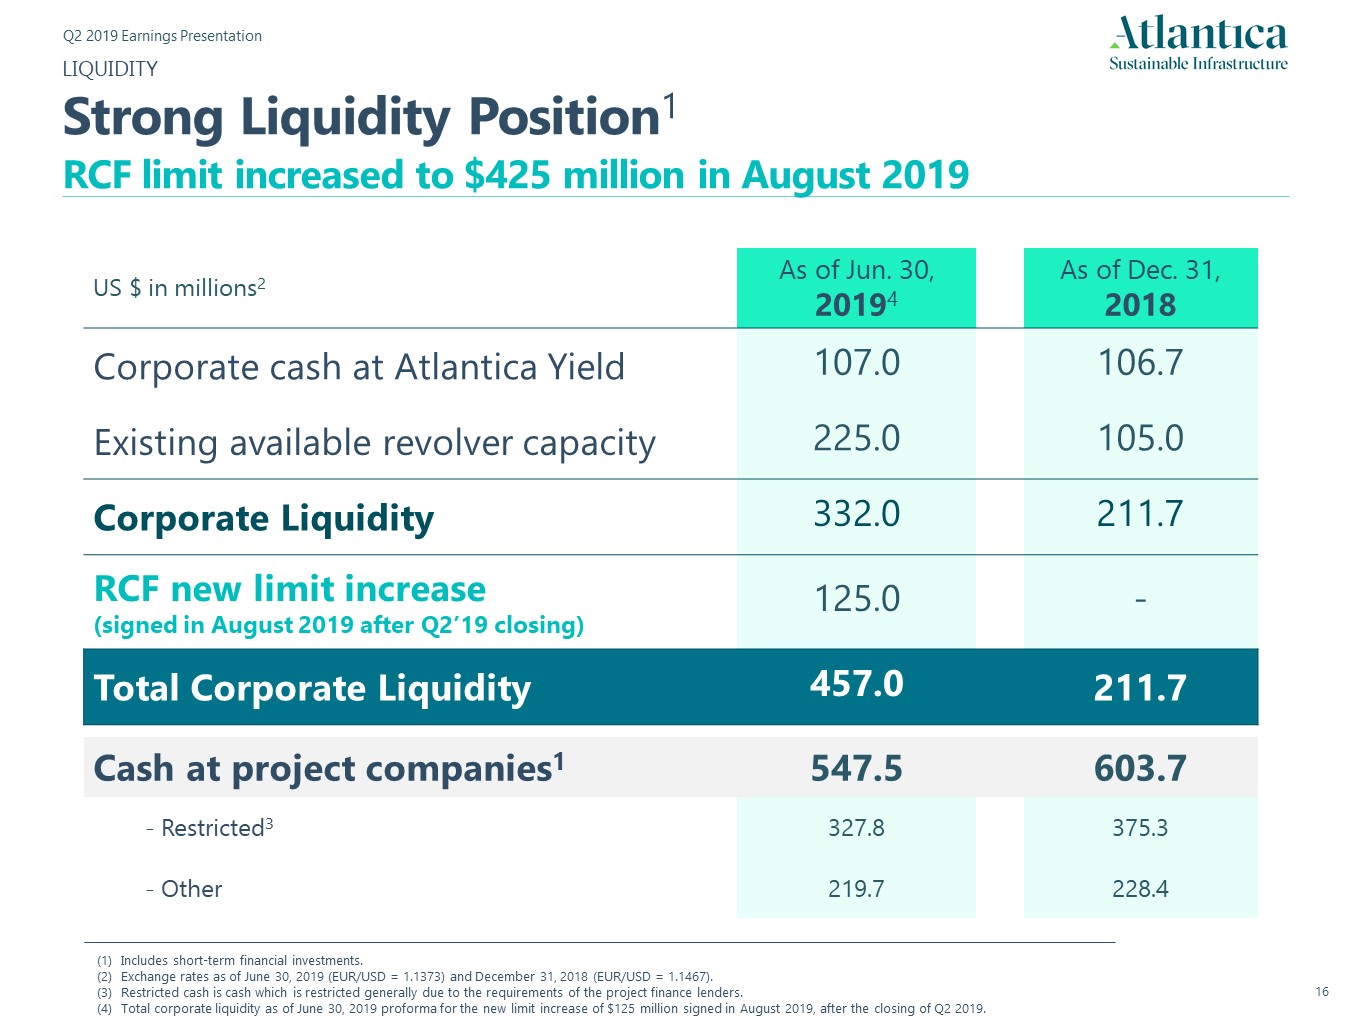
Includes short-term financial investments. Exchange rates as of June 30, 2019 (EUR/USD = 1.1373) and December 31, 2018 (EUR/USD = 1.1467).Restricted cash is cash which is restricted generally due to the requirements of the project finance lenders.Total corporate liquidity as of June 30, 2019 proforma for the new limit increase of $125 million signed in August 2019, after the closing of Q2 2019. US $ in millions2 As of Jun. 30,20194 As of Dec. 31,2018 Corporate cash at Atlantica Yield 107.0 106.7 Existing available revolver capacity 225.0 105.0 Corporate Liquidity 332.0 211.7 RCF new limit increase (signed in August 2019 after Q2’19 closing) 125.0 - Total Corporate Liquidity 457.0 211.7 Cash at project companies1 547.5 603.7 - Restricted3 327.8 375.3 - Other 219.7 228.4 LIQUIDITYStrong Liquidity Position1RCF limit increased to $425 million in August 2019

FINANCINGSelf-Amortizing Project Debt Structure Key principle: non-recourse project financing in ring-fenced subsidiaries100% project debt self-amortizing progressively before the end of the contracted lifeLow interest rate risk, with +90% of interest rates fixed or hedged ~$1.1B planned debt reduction in the next 4 years
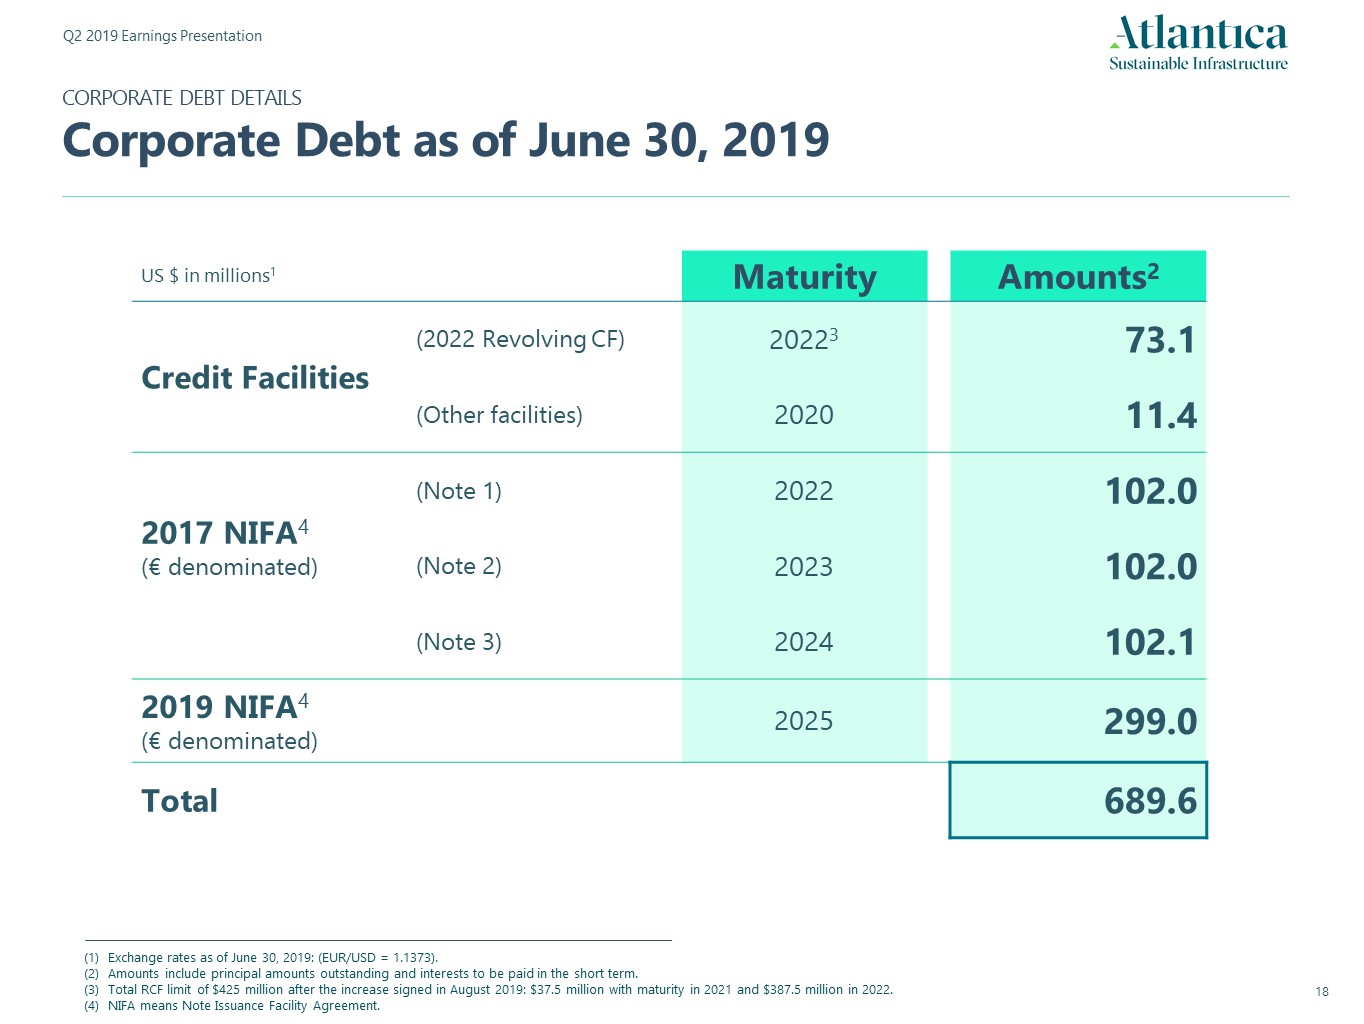
CORPORATE DEBT DETAILSCorporate Debt as of June 30, 2019 Exchange rates as of June 30, 2019: (EUR/USD = 1.1373).Amounts include principal amounts outstanding and interests to be paid in the short term.Total RCF limit of $425 million after the increase signed in August 2019: $37.5 million with maturity in 2021 and $387.5 million in 2022.NIFA means Note Issuance Facility Agreement. US $ in millions1 Maturity Amounts2 Credit Facilities (2022 Revolving CF) 20223 73.1 (Other facilities) 2020 11.4 2017 NIFA4 (€ denominated) (Note 1) 2022 102.0 (Note 2) 2023 102.0 (Note 3) 2024 102.1 2019 NIFA4(€ denominated) 2025 299.0 Total 689.6
CORPORATE DEBT DETAILSCorporate Debt as of June 30, 2019 Exchange rates as of June 30, 2019: (EUR/USD = 1.1373).Amounts include principal amounts outstanding and interests to be paid in the short term.Total RCF limit of $425 million after the increase signed in August 2019: $37.5 in with maturity in 2021 and $387.5 million in 2022.NIFA means Note Issuance Facility Agreement. US $ in millions1 Maturity Amounts2 Credit Facilities (2022 Revolving CF) 20223 73.1 (Other facilities) 2020 11.4 2017 NIFA4 (€ denominated) (Note 1) 2022 102.0 (Note 2) 2023 102.0 (Note 3) 2024 102.1 2019 NIFA4(€ denominated) 2025 299.0 Total 689.6
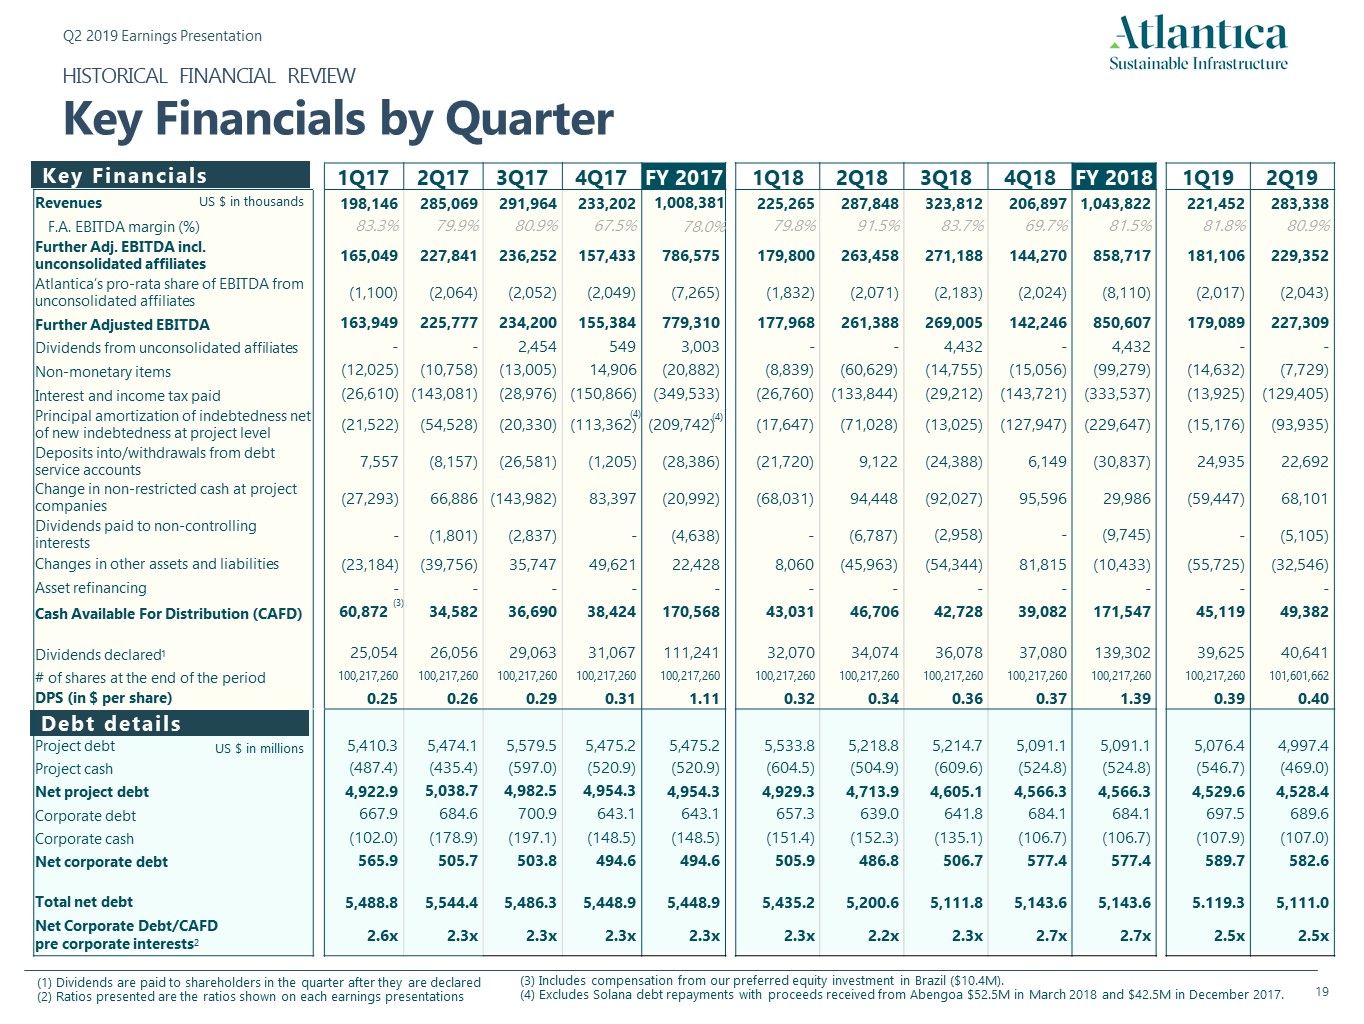
HISTORICAL FINANCIAL REVIEWKey Financials by Quarter Debt details Key Financials US $ in thousands US $ in millions 1Q17 2Q17 3Q17 4Q17 FY 2017 1Q18 2Q18 3Q18 4Q18 FY 2018 1Q19 2Q19 Revenues 198,146 285,069 291,964 233,202 1,008,381 225,265 287,848 323,812 206,897 1,043,822 221,452 283,338 F.A. EBITDA margin (%) 83.3% 79.9% 80.9% 67.5% 78.0% 79.8% 91.5% 83.7% 69.7% 81.5% 81.8% 80.9% Further Adj. EBITDA incl. unconsolidated affiliates 165,049 227,841 236,252 157,433 786,575 179,800 263,458 271,188 144,270 858,717 181,106 229,352 Atlantica’s pro-rata share of EBITDA from unconsolidated affiliates (1,100) (2,064) (2,052) (2,049) (7,265) (1,832) (2,071) (2,183) (2,024) (8,110) (2,017) (2,043) Further Adjusted EBITDA 163,949 225,777 234,200 155,384 779,310 177,968 261,388 269,005 142,246 850,607 179,089 227,309 Dividends from unconsolidated affiliates - - 2,454 549 3,003 - - 4,432 - 4,432 - - Non-monetary items (12,025) (10,758) (13,005) 14,906 (20,882) (8,839) (60,629) (14,755) (15,056) (99,279) (14,632) (7,729) Interest and income tax paid (26,610) (143,081) (28,976) (150,866) (349,533) (26,760) (133,844) (29,212) (143,721) (333,537) (13,925) (129,405) Principal amortization of indebtedness net of new indebtedness at project level (21,522) (54,528) (20,330) (113,362) (209,742) * (17,647) (71,028) (13,025) (127,947) (229,647) (15,176) (93,935) Deposits into/withdrawals from debt service accounts 7,557 (8,157) (26,581) (1,205) (28,386) (21,720) 9,122 (24,388) 6,149 (30,837) 24,935 22,692 Change in non-restricted cash at project companies (27,293) 66,886 (143,982) 83,397 (20,992) (68,031) 94,448 (92,027) 95,596 29,986 (59,447) 68,101 Dividends paid to non-controlling interests - (1,801) (2,837) - (4,638) - (6,787) (2,958) - (9,745) - (5,105) Changes in other assets and liabilities (23,184) (39,756) 35,747 49,621 22,428 8,060 (45,963) (54,344) 81,815 (10,433) (55,725) (32,546) Asset refinancing - - - - - - - - - - - - Cash Available For Distribution (CAFD) 60,872 34,582 36,690 38,424 170,568 43,031 46,706 42,728 39,082 171,547 45,119 49,382 Dividends declared1 25,054 26,056 29,063 31,067 111,241 32,070 34,074 36,078 37,080 139,302 39,625 40,641 # of shares at the end of the period 100,217,260 100,217,260 100,217,260 100,217,260 100,217,260 100,217,260 100,217,260 100,217,260 100,217,260 100,217,260 100,217,260 101,601,662 DPS (in $ per share) 0.25 0.26 0.29 0.31 1.11 0.32 0.34 0.36 0.37 1.39 0.39 0.40 Project debt 5,410.3 5,474.1 5,579.5 5,475.2 5,475.2 5,533.8 5,218.8 5,214.7 5,091.1 5,091.1 5,076.4 4,997.4 Project cash (487.4) (435.4) (597.0) (520.9) (520.9) (604.5) (504.9) (609.6) (524.8) (524.8) (546.7) (469.0) Net project debt 4,922.9 5,038.7 4,982.5 4,954.3 4,954.3 4,929.3 4,713.9 4,605.1 4,566.3 4,566.3 4,529.6 4,528.4 Corporate debt 667.9 684.6 700.9 643.1 643.1 657.3 639.0 641.8 684.1 684.1 697.5 689.6 Corporate cash (102.0) (178.9) (197.1) (148.5) (148.5) (151.4) (152.3) (135.1) (106.7) (106.7) (107.9) (107.0) Net corporate debt 565.9 505.7 503.8 494.6 494.6 505.9 486.8 506.7 577.4 577.4 589.7 582.6 Total net debt 5,488.8 5,544.4 5,486.3 5,448.9 5,448.9 5,435.2 5,200.6 5,111.8 5,143.6 5,143.6 5.119.3 5,111.0 Net Corporate Debt/CAFD pre corporate interests2 2.6x 2.3x 2.3x 2.3x 2.3x 2.3x 2.2x 2.3x 2.7x 2.7x 2.5x 2.5x (4) (3) (4) Dividends are paid to shareholders in the quarter after they are declaredRatios presented are the ratios shown on each earnings presentations (3) Includes compensation from our preferred equity investment in Brazil ($10.4M).(4) Excludes Solana debt repayments with proceeds received from Abengoa $52.5M in March 2018 and $42.5M in December 2017.
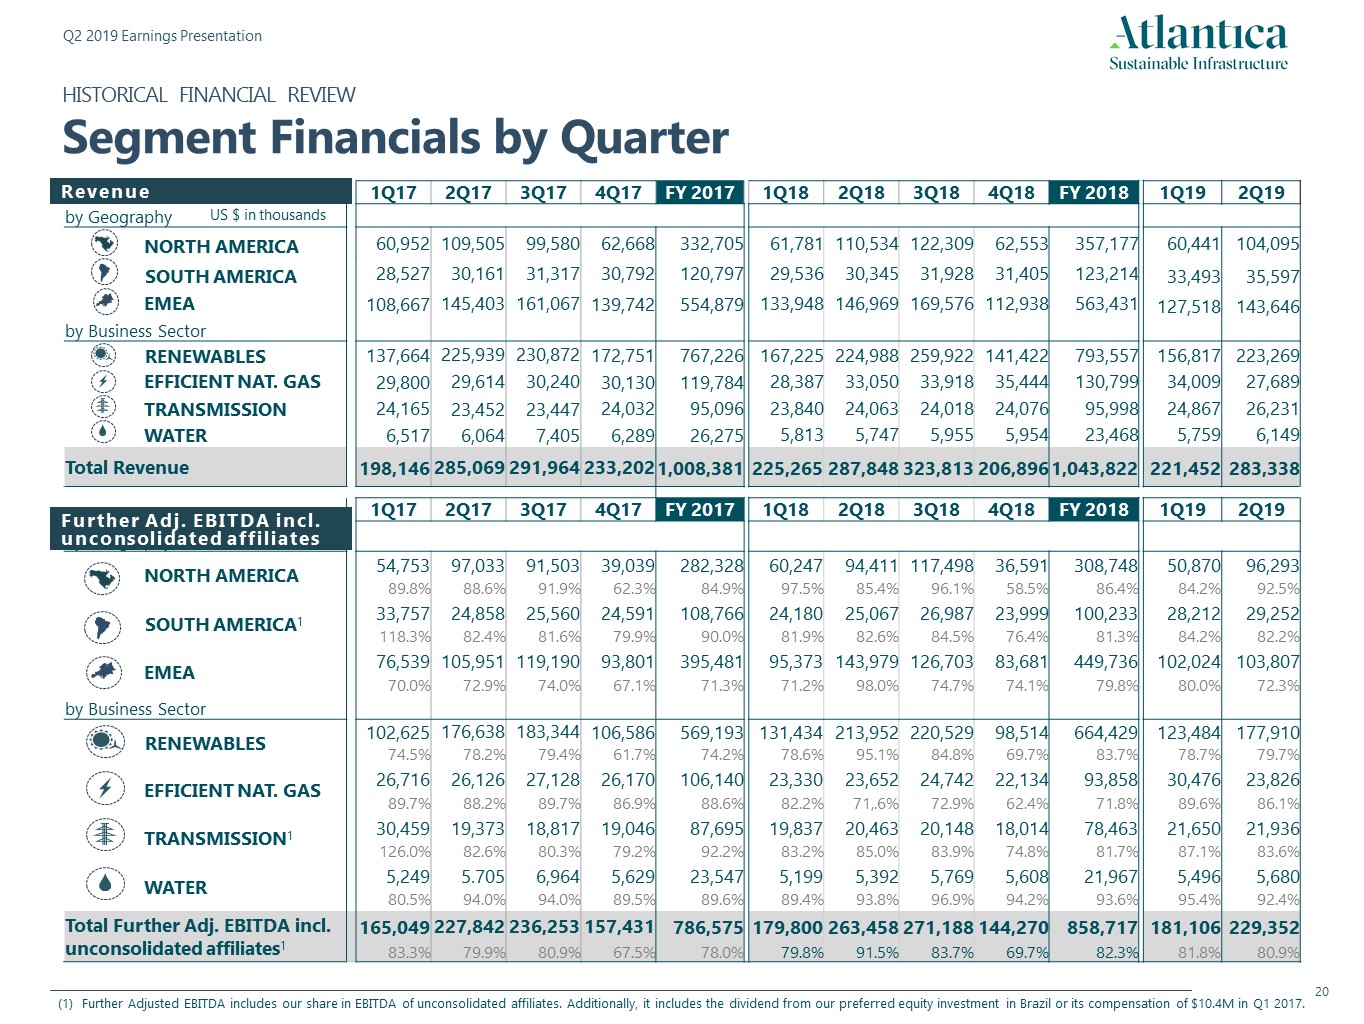
HISTORICAL FINANCIAL REVIEWSegment Financials by Quarter 1Q17 2Q17 3Q17 4Q17 FY 2017 1Q18 2Q18 3Q18 4Q18 FY 2018 1Q19 2Q19 by Geography NORTH AMERICA 60,952 109,505 99,580 62,668 332,705 61,781 110,534 122,309 62,553 357,177 60,441 104,095 SOUTH AMERICA 28,527 30,161 31,317 30,792 120,797 29,536 30,345 31,928 31,405 123,214 33,493 35,597 EMEA 108,667 145,403 161,067 139,742 554,879 133,948 146,969 169,576 112,938 563,431 127,518 143,646 by Business Sector RENEWABLES 137,664 225,939 230,872 172,751 767,226 167,225 224,988 259,922 141,422 793,557 156,817 223,269 EFFICIENT NAT. GAS 29,800 29,614 30,240 30,130 119,784 28,387 33,050 33,918 35,444 130,799 34,009 27,689 TRANSMISSION 24,165 23,452 23,447 24,032 95,096 23,840 24,063 24,018 24,076 95,998 24,867 26,231 WATER 6,517 6,064 7,405 6,289 26,275 5,813 5,747 5,955 5,954 23,468 5,759 6,149 Total Revenue 198,146 285,069 291,964 233,202 1,008,381 225,265 287,848 323,813 206,896 1,043,822 221,452 283,338 1Q17 2Q17 3Q17 4Q17 FY 2017 1Q18 2Q18 3Q18 4Q18 FY 2018 1Q19 2Q19 by Geography NORTH AMERICA 54,753 97,033 91,503 39,039 282,328 60,247 94,411 117,498 36,591 308,748 50,870 96,293 89.8% 88.6% 91.9% 62.3% 84.9% 97.5% 85.4% 96.1% 58.5% 86.4% 84.2% 92.5% SOUTH AMERICA1 33,757 24,858 25,560 24,591 108,766 24,180 25,067 26,987 23,999 100,233 28,212 29,252 118.3% 82.4% 81.6% 79.9% 90.0% 81.9% 82.6% 84.5% 76.4% 81.3% 84.2% 82.2% EMEA 76,539 105,951 119,190 93,801 395,481 95,373 143,979 126,703 83,681 449,736 102,024 103,807 70.0% 72.9% 74.0% 67.1% 71.3% 71.2% 98.0% 74.7% 74.1% 79.8% 80.0% 72.3% by Business Sector RENEWABLES 102,625 176,638 183,344 106,586 569,193 131,434 213,952 220,529 98,514 664,429 123,484 177,910 74.5% 78.2% 79.4% 61.7% 74.2% 78.6% 95.1% 84.8% 69.7% 83.7% 78.7% 79.7% EFFICIENT NAT. GAS 26,716 26,126 27,128 26,170 106,140 23,330 23,652 24,742 22,134 93,858 30,476 23,826 89.7% 88.2% 89.7% 86.9% 88.6% 82.2% 71,.6% 72.9% 62.4% 71.8% 89.6% 86.1% TRANSMISSION1 30,459 19,373 18,817 19,046 87,695 19,837 20,463 20,148 18,014 78,463 21,650 21,936 126.0% 82.6% 80.3% 79.2% 92.2% 83.2% 85.0% 83.9% 74.8% 81.7% 87.1% 83.6% WATER 5,249 5.705 6,964 5,629 23,547 5,199 5,392 5,769 5,608 21,967 5,496 5,680 80.5% 94.0% 94.0% 89.5% 89.6% 89.4% 93.8% 96.9% 94.2% 93.6% 95.4% 92.4% Total Further Adj. EBITDA incl. unconsolidated affiliates1 165,049 227,842 236,253 157,431 786,575 179,800 263,458 271,188 144,270 858,717 181,106 229,352 83.3% 79.9% 80.9% 67.5% 78.0% 79.8% 91.5% 83.7% 69.7% 82.3% 81.8% 80.9% US $ in thousands Revenue Further Adj. EBITDA incl. unconsolidated affiliates Further Adjusted EBITDA includes our share in EBITDA of unconsolidated affiliates. Additionally, it includes the dividend from our preferred equity investment in Brazil or its compensation of $10.4M in Q1 2017.
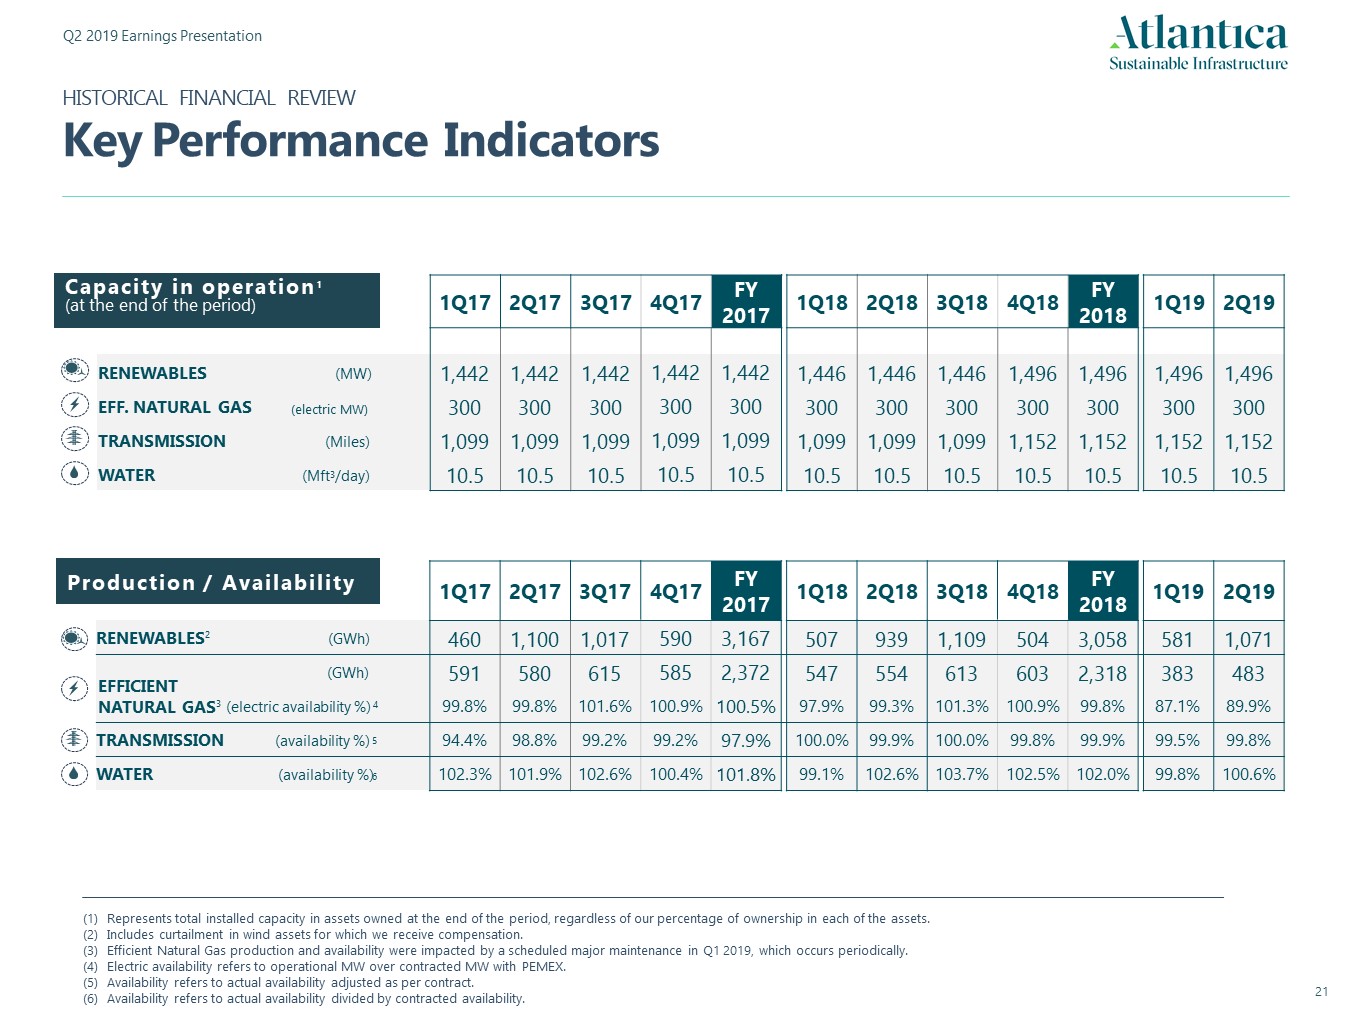
1Q17 2Q17 3Q17 4Q17 FY 2017 1Q18 2Q18 3Q18 4Q18 FY 2018 1Q19 2Q19 RENEWABLES2 (GWh) 460 1,100 1,017 590 3,167 507 939 1,109 504 3,058 581 1,071 (GWh) 591 580 615 585 2,372 547 554 613 603 2,318 383 483 (electric availability %) 99.8% 99.8% 101.6% 100.9% 100.5% 97.9% 99.3% 101.3% 100.9% 99.8% 87.1% 89.9% TRANSMISSION (availability %) 94.4% 98.8% 99.2% 99.2% 97.9% 100.0% 99.9% 100.0% 99.8% 99.9% 99.5% 99.8% WATER (availability %) 102.3% 101.9% 102.6% 100.4% 101.8% 99.1% 102.6% 103.7% 102.5% 102.0% 99.8% 100.6% 1Q17 2Q17 3Q17 4Q17 FY 2017 1Q18 2Q18 3Q18 4Q18 FY 2018 1Q19 2Q19 RENEWABLES (MW) 1,442 1,442 1,442 1,442 1,442 1,446 1,446 1,446 1,496 1,496 1,496 1,496 EFF. NATURAL GAS (electric MW) 300 300 300 300 300 300 300 300 300 300 300 300 TRANSMISSION (Miles) 1,099 1,099 1,099 1,099 1,099 1,099 1,099 1,099 1,152 1,152 1,152 1,152 WATER (Mft3/day) 10.5 10.5 10.5 10.5 10.5 10.5 10.5 10.5 10.5 10.5 10.5 10.5 Capacity in operation1(at the end of the period) Production / Availability HISTORICAL FINANCIAL REVIEWKey Performance Indicators 4 5 6 Represents total installed capacity in assets owned at the end of the period, regardless of our percentage of ownership in each of the assets.Includes curtailment in wind assets for which we receive compensation.Efficient Natural Gas production and availability were impacted by a scheduled major maintenance in Q1 2019, which occurs periodically.Electric availability refers to operational MW over contracted MW with PEMEX. Availability refers to actual availability adjusted as per contract.Availability refers to actual availability divided by contracted availability. EFFICIENT NATURAL GAS3
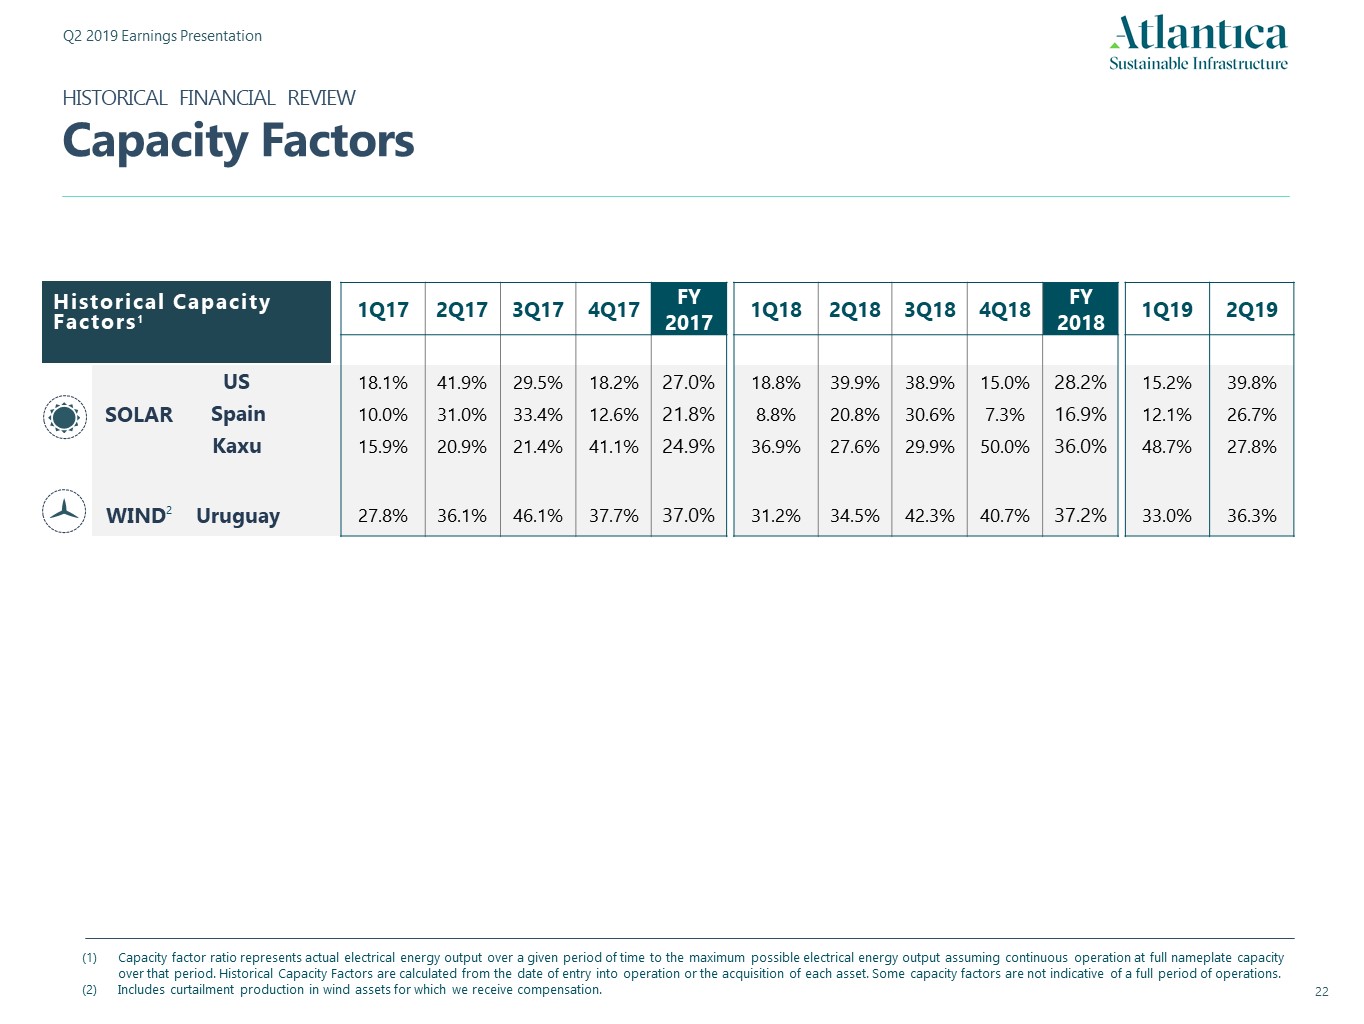
1Q17 2Q17 3Q17 4Q17 FY 2017 1Q18 2Q18 3Q18 4Q18 FY 2018 1Q19 2Q19 US 18.1% 41.9% 29.5% 18.2% 27.0% 18.8% 39.9% 38.9% 15.0% 28.2% 15.2% 39.8% Spain 10.0% 31.0% 33.4% 12.6% 21.8% 8.8% 20.8% 30.6% 7.3% 16.9% 12.1% 26.7% Kaxu 15.9% 20.9% 21.4% 41.1% 24.9% 36.9% 27.6% 29.9% 50.0% 36.0% 48.7% 27.8% WIND2 Uruguay 27.8% 36.1% 46.1% 37.7% 37.0% 31.2% 34.5% ��42.3% 40.7% 37.2% 33.0% 36.3% SOLAR Historical Capacity Factors1 HISTORICAL FINANCIAL REVIEWCapacity Factors Capacity factor ratio represents actual electrical energy output over a given period of time to the maximum possible electrical energy output assuming continuous operation at full nameplate capacity over that period. Historical Capacity Factors are calculated from the date of entry into operation or the acquisition of each asset. Some capacity factors are not indicative of a full period of operations.Includes curtailment production in wind assets for which we receive compensation.
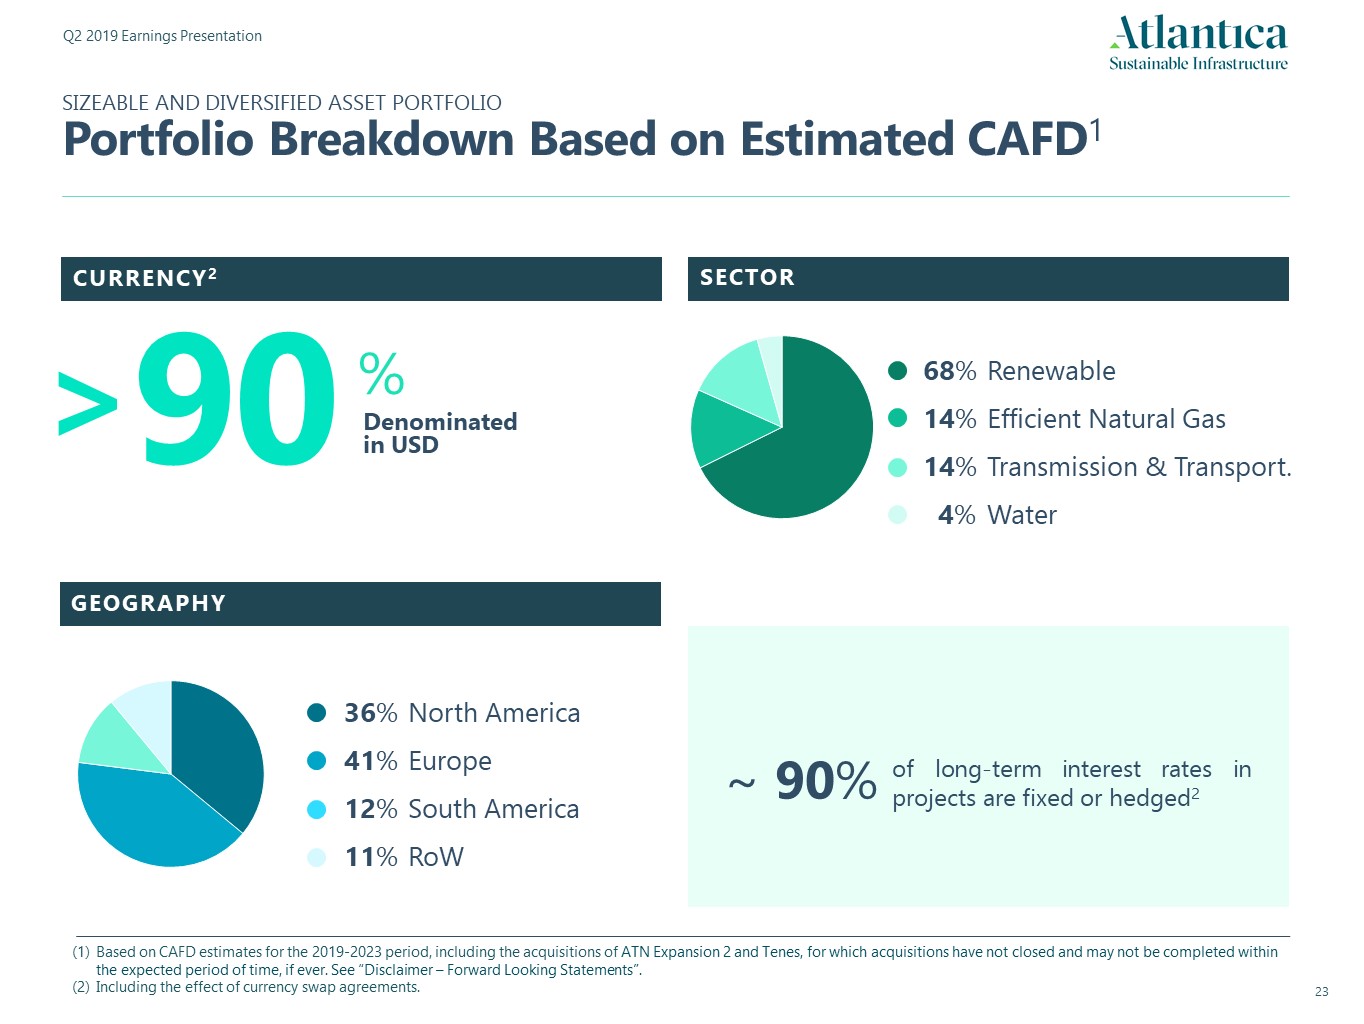
SIZEABLE AND DIVERSIFIED ASSET PORTFOLIOPortfolio Breakdown Based on Estimated CAFD1 CURRENCY2 SECTOR GEOGRAPHY Based on CAFD estimates for the 2019-2023 period, including the acquisitions of ATN Expansion 2 and Tenes, for which acquisitions have not closed and may not be completed within the expected period of time, if ever. See “Disclaimer – Forward Looking Statements”.Including the effect of currency swap agreements. of long-term interest rates in projects are fixed or hedged2 ~ 90% 90 Denominatedin USD % > 68% Renewable14% Efficient Natural Gas14% Transmission & Transport. 4% Water 36% North America41% Europe12% South America11% RoW

AT A GLANCESizeable and Diversified Asset Portfolio As of December 31, 2018 ASSET TYPE STAKE LOCATION GROSSCAPACITY OFFTAKER RATING 1 YEARS INCONTRACT LEFT CURRENCY RENEWABLE ENERGY Solana 100%2 USA (Arizona) 280 MW APS A-/A2/A- 25 USD Mojave 100% USA (California) 280 MW PG&E D/WR/WD 21 USD Solaben 2/3 70% Spain 2x50 MW Kingdom of Spain A-/Baa1/A- 19/18 EUR 4 Solacor 1/2 87% Spain 2x50 MW Kingdom of Spain A-/Baa1/A- 18/18 EUR 4 PS 10/20 100% Spain 31 MW Kingdom of Spain A-/Baa1/A- 13/15 EUR 4 Helioenergy 1/2 100% Spain 2x50 MW Kingdom of Spain A-/Baa1/A- 18/18 EUR 4 Helios 1/2 100% Spain 2x50 MW Kingdom of Spain A-/Baa1/A- 19/19 EUR 4 Solnova 1/3/4 100% Spain 3x50 MW Kingdom of Spain A-/Baa1/A- 16/16/17 EUR 4 Solaben 1/6 100% Spain 2x50 MW Kingdom of Spain A-/Baa1/A- 20/20 EUR 4 Seville PV 80% Spain 1 MW Kingdom of Spain A-/Baa1/A- 17 EUR Kaxu 51% South Africa 100 MW Eskom BB/Baa3/BB+3 16 ZAR Palmatir 100% Uruguay 50 MW UTE BBB/Baa2/BBB-3 15 USD Cadonal 100% Uruguay 50 MW UTE BBB/Baa2/BBB-3 16 USD Melowind 100% Uruguay 50 MW UTE BBB/Baa2/BBB-3 16 USD Mini-Hydro 100% Peru 4 MW Peru BBB+/A3/BBB+ 14 USD EFFICIENT NATURAL GAS ACT 100% Mexico 300 MW Pemex BBB+/Baa3/BB+ 14 USD 5 Monterrey 30% Mexico 142 MW Industrial Customers Not rated 20 USD 5 ELECTRICAL TRANSMISSION ATN 100% Peru 362 miles Peru BBB+/A3/BBB+ 22 USD 5 ATS 100% Peru 569 miles Peru BBB+/A3/BBB+ 25 USD 5 ATN 2 100% Peru 81 miles Minera Las Bambas Not rated 14 USD 5 Quadra 1&2 100% Chile 81 miles Sierra Gorda Not rated 16/16 USD 5 Palmucho 100% Chile 6 miles Enel Generacion Chile BBB+/Baa1 /BBB+ 19 USD 5 Chile TL3 100% Chile 50 miles CNE A+/A1/A Regulated USD 5 WATER Skikda 34% Algeria 3.5 Mft3/day Sonatrach & ADE Not rated 15 USD 5 Honaine 26% Algeria 7 Mft3/day Sonatrach & ADE Not rated 19 USD 5 Reflects the counterparties’ issuer credit ratings issued by S&P, Moody’s and Fitch, respectively, as of April 30, 2018.Liberty Interactive Corporation holds $300M in Class A membership interests in exchange for a share of the dividends and the taxable loss generated by Solana.For Kaxu it refers to the credit rating of the Republic of South Africa, and for Palmatir, Cadonal and Melowind it refers to the credit rating of Uruguay, as UTE is unrated.Gross cash in euros dollarized through currency hedges.USD denominated but payable in local currency.
NON-GAAP FINANCIAL INFORMATIONReconciliation of Non-GAAP Measures Our management believes Further Adjusted EBITDA including unconsolidated affiliates and CAFD are useful to investors and other users of our financial statements in evaluating our operating performance because it provides them with an additional tool to compare business performance across companies and across periods. Further Adjusted EBITDA is widely used by investors to measure a company’s operating performance without regard to items such as interest expense, taxes, depreciation and amortization, which can vary substantially from company to company depending upon accounting methods and book value of assets, capital structure and the method by which assets were acquired. Our management believes CAFD is a relevant supplemental measure of the Company’s ability to earn and distribute cash returns to investors and is useful to investors in evaluating our operating performance because securities analysts and other interested parties use such calculations as a measure of our ability to make quarterly distributions. In addition, CAFD is used by our management team for determining future acquisitions and managing our growth. Further Adjusted EBITDA and CAFD are widely used by other companies in the same industry. Our management uses Further Adjusted EBITDA and CAFD as measures of operating performance to assist in comparing performance from period to period on a consistent basis. They also readily view operating trends, as a measure for planning and forecasting overall expectations, for evaluating actual results against such expectations, and for communicating with our board of directors, shareholders, creditors, analysts and investors concerning our financial performance.We present non-GAAP financial measures because we believe that they and other similar measures are widely used by certain investors, securities analysts and other interested parties as supplemental measures of performance and liquidity. The non-GAAP financial measures may not be comparable to other similarly titled measures employed by other companies and they may have limitations as analytical tools. These measures may not be fit for isolated consideration or as a substitute for analysis of our operating results as reported under IFRS as issued by the IASB. Non-GAAP financial measures and ratios are not measurements of our performance or liquidity under IFRS as issued by the IASB. Thus, they should not be considered as alternatives to operating profit, profit for the period, any other performance measures derived in accordance with IFRS as issued by the IASB, any other generally accepted accounting principles or as alternatives to cash flow from operating, investing or financing activities. Some of the limitations of these non-GAAP measures are:they do not reflect our cash expenditures, future requirements for capital expenditures or contractual commitments; they do not reflect changes in, or cash requirements for, our working capital needs;they may not reflect the significant interest expense, or the cash requirements necessary, to service interest or principal payments, on our debts;although depreciation and amortization are non-cash charges, the assets being depreciated and amortized will often need to be replaced in the future and Further Adjusted EBITDA and CAFD do not reflect any cash requirements that would be required for such replacements;some of the exceptional items that we eliminate in calculating Further Adjusted EBITDA reflect cash payments that were made, or will be made in the future; andthe fact that other companies in our industry may calculate Further Adjusted EBITDA and CAFD differently than we do, which limits their usefulness as comparative measures.
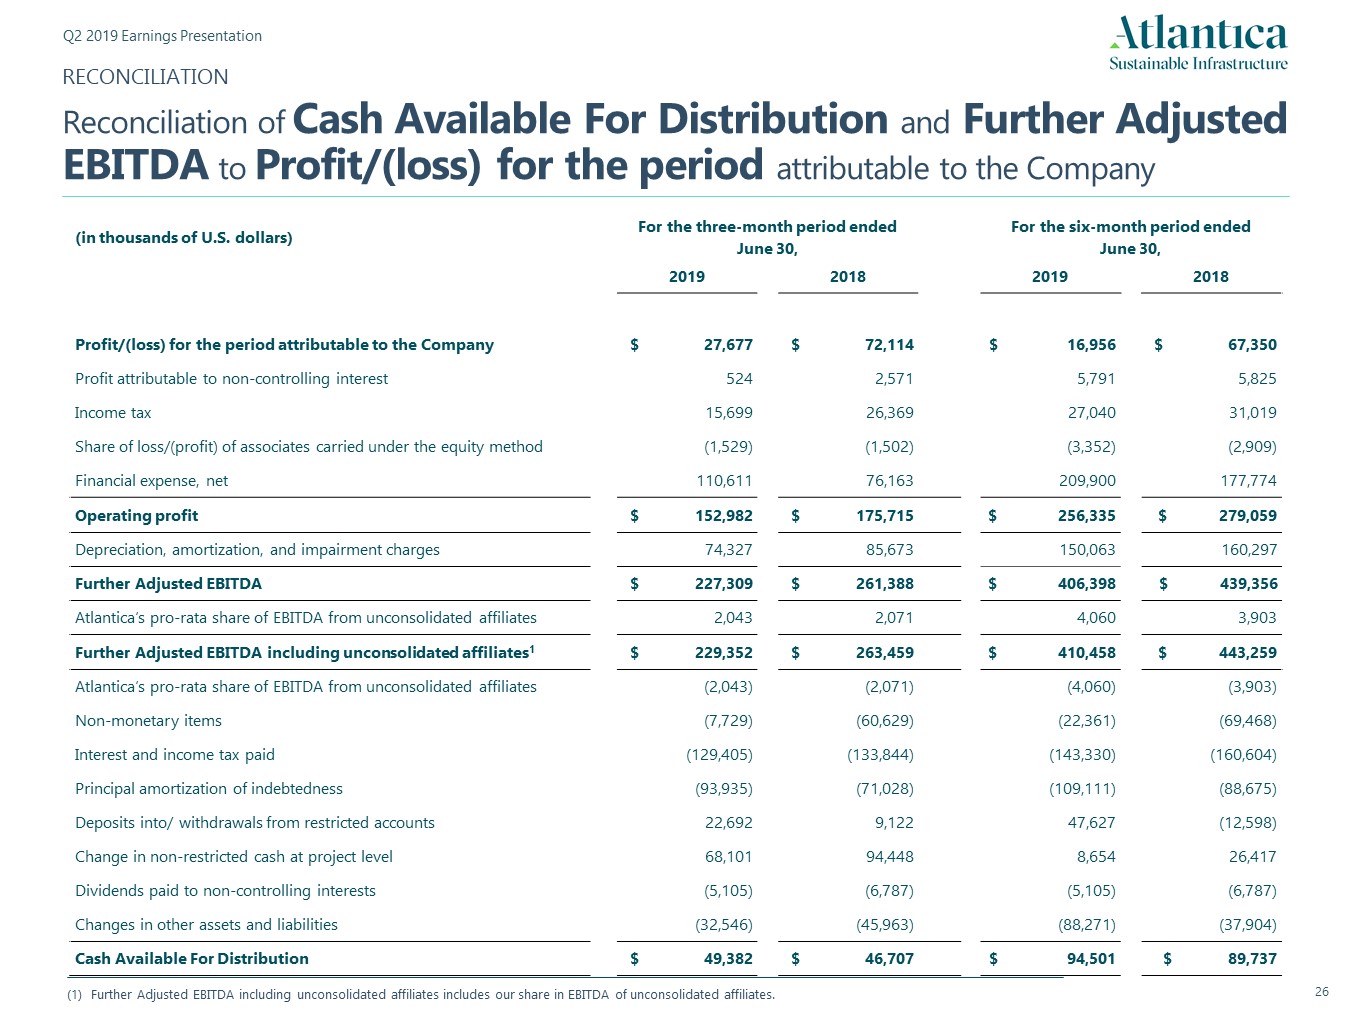
RECONCILIATIONReconciliation of Cash Available For Distribution and Further Adjusted EBITDA to Profit/(loss) for the period attributable to the Company (in thousands of U.S. dollars) For the three-month period ended June 30, For the six-month period ended June 30, 2019 2018 2019 2018 Profit/(loss) for the period attributable to the Company $ 27,677 $ 72,114 $ 16,956 $ 67,350 Profit attributable to non-controlling interest 524 2,571 5,791 5,825 Income tax 15,699 26,369 27,040 31,019 Share of loss/(profit) of associates carried under the equity method (1,529) (1,502) (3,352) (2,909) Financial expense, net 110,611 76,163 209,900 177,774 Operating profit $ 152,982 $ 175,715 $ 256,335 $ 279,059 Depreciation, amortization, and impairment charges 74,327 85,673 150,063 160,297 Further Adjusted EBITDA $ 227,309 $ 261,388 $ 406,398 $ 439,356 Atlantica’s pro-rata share of EBITDA from unconsolidated affiliates 2,043 2,071 4,060 3,903 Further Adjusted EBITDA including unconsolidated affiliates1 $ 229,352 $ 263,459 $ 410,458 $ 443,259 Atlantica’s pro-rata share of EBITDA from unconsolidated affiliates (2,043) (2,071) (4,060) (3,903) Non-monetary items (7,729) (60,629) (22,361) (69,468) Interest and income tax paid (129,405) (133,844) (143,330) (160,604) Principal amortization of indebtedness (93,935) (71,028) (109,111) (88,675) Deposits into/ withdrawals from restricted accounts 22,692 9,122 47,627 (12,598) Change in non-restricted cash at project level 68,101 94,448 8,654 26,417 Dividends paid to non-controlling interests (5,105) (6,787) (5,105) (6,787) Changes in other assets and liabilities (32,546) (45,963) (88,271) (37,904) Cash Available For Distribution $ 49,382 $ 46,707 $ 94,501 $ 89,737 Further Adjusted EBITDA including unconsolidated affiliates includes our share in EBITDA of unconsolidated affiliates.
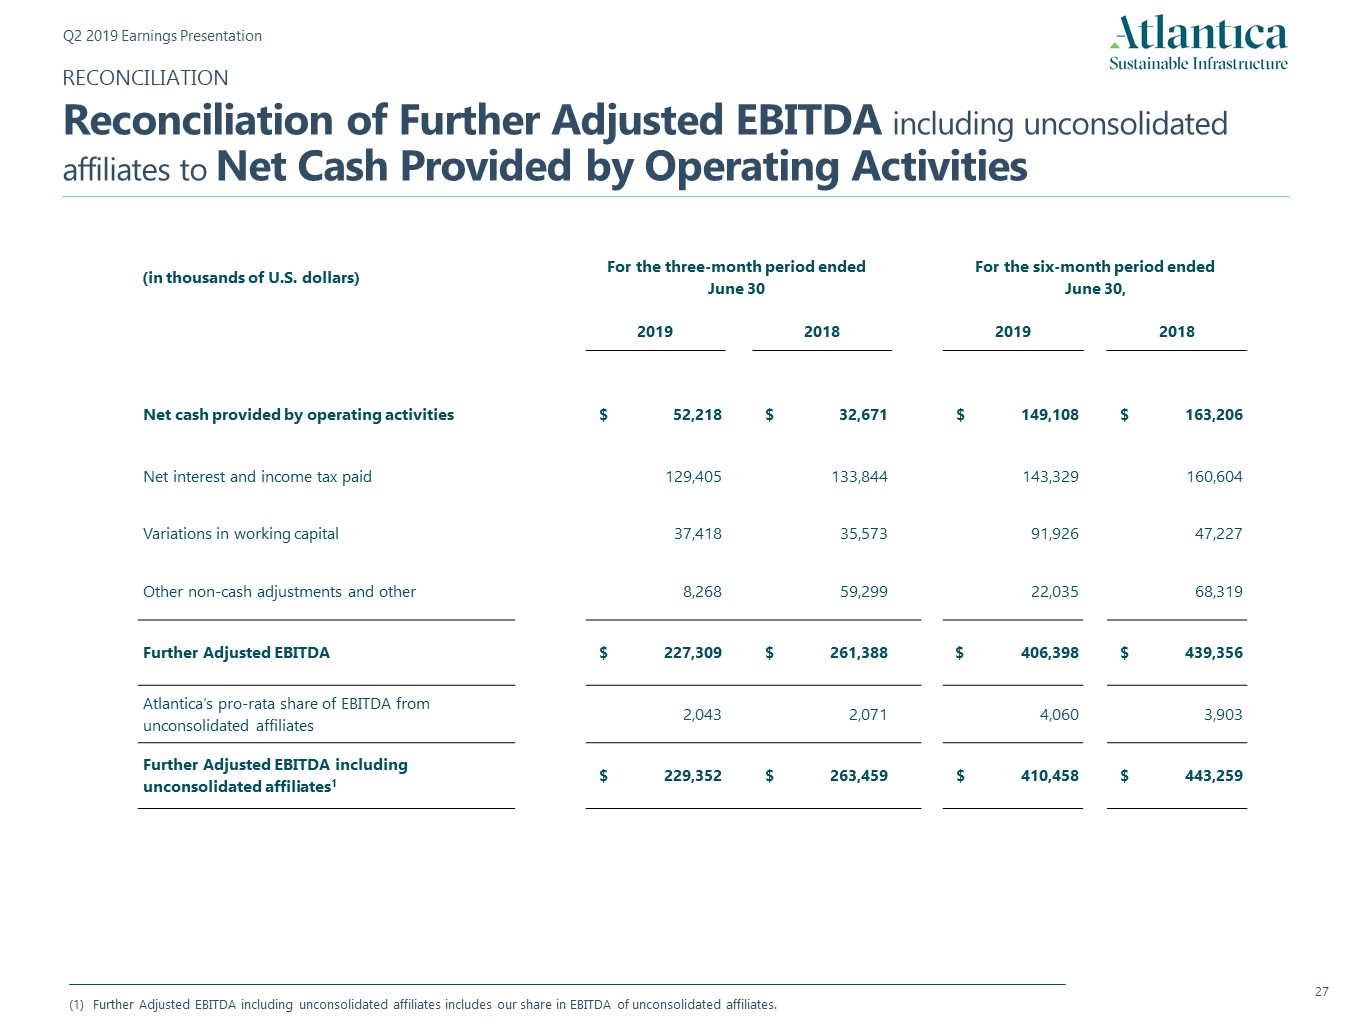
RECONCILIATIONReconciliation of Further Adjusted EBITDA including unconsolidated affiliates to Net Cash Provided by Operating Activities (in thousands of U.S. dollars) For the three-month period ended June 30 For the six-month period ended June 30, 2019 2018 2019 2018 Net cash provided by operating activities $ 52,218 $ 32,671 $ 149,108 $ 163,206 Net interest and income tax paid 129,405 133,844 143,329 160,604 Variations in working capital 37,418 35,573 91,926 47,227 Other non-cash adjustments and other 8,268 59,299 22,035 68,319 Further Adjusted EBITDA $ 227,309 $ 261,388 $ 406,398 $ 439,356 Atlantica’s pro-rata share of EBITDA from unconsolidated affiliates 2,043 2,071 4,060 3,903 Further Adjusted EBITDA including unconsolidated affiliates1 $ 229,352 $ 263,459 $ 410,458 $ 443,259 Further Adjusted EBITDA including unconsolidated affiliates includes our share in EBITDA of unconsolidated affiliates.
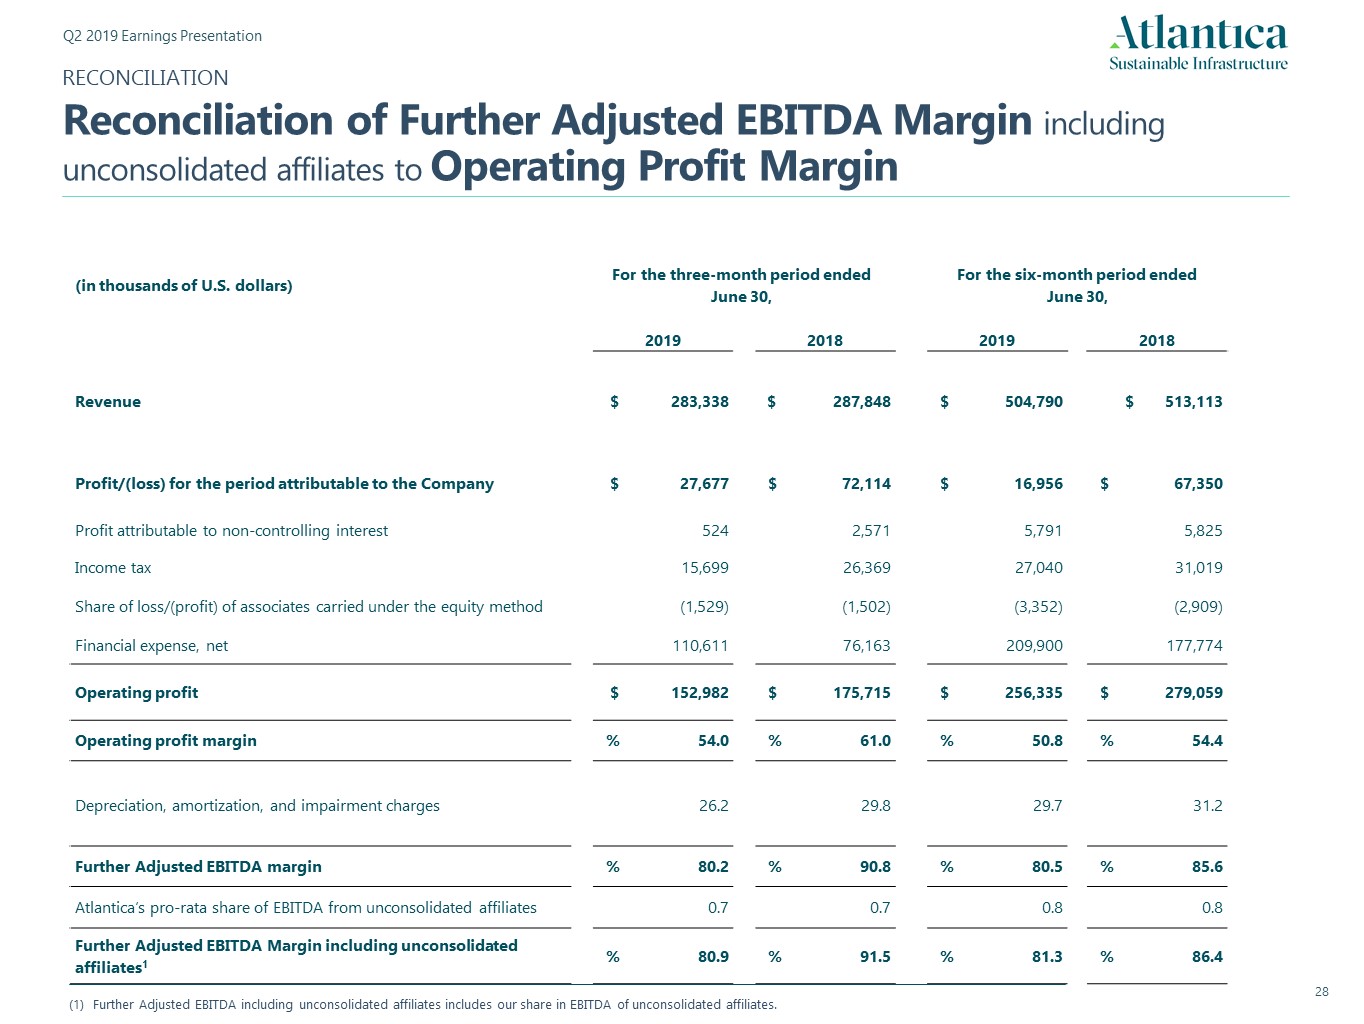
RECONCILIATIONReconciliation of Further Adjusted EBITDA Margin including unconsolidated affiliates to Operating Profit Margin (in thousands of U.S. dollars) For the three-month period ended June 30, For the six-month period ended June 30, 2019 2018 2019 2018 Revenue $ 283,338 $ 287,848 $ 504,790 $ 513,113 Profit/(loss) for the period attributable to the Company $ 27,677 $ 72,114 $ 16,956 $ 67,350 Profit attributable to non-controlling interest 524 2,571 5,791 5,825 Income tax 15,699 26,369 27,040 31,019 Share of loss/(profit) of associates carried under the equity method (1,529) (1,502) (3,352) (2,909) Financial expense, net 110,611 76,163 209,900 177,774 Operating profit $ 152,982 $ 175,715 $ 256,335 $ 279,059 Operating profit margin % 54.0 % 61.0 % 50.8 % 54.4 Depreciation, amortization, and impairment charges 26.2 29.8 29.7 31.2 Further Adjusted EBITDA margin % 80.2 % 90.8 % 80.5 % 85.6 Atlantica’s pro-rata share of EBITDA from unconsolidated affiliates 0.7 0.7 0.8 0.8 Further Adjusted EBITDA Margin including unconsolidated affiliates1 % 80.9 % 91.5 % 81.3 % 86.4 Further Adjusted EBITDA including unconsolidated affiliates includes our share in EBITDA of unconsolidated affiliates.
Great West House, GW1, 17th floor,Great West RoadBrentford TW8 9DFLondon (United Kingdom)
SIGNATURES
Pursuant to the requirements of the Securities Exchange Act of 1934, the Registrant has duly caused this report to be signed on its behalf by the undersigned, thereunto duly authorized.
| ATLANTICA YIELD PLC | ||
| Date: August 7, 2019 | By: | /s/ Santiago Seage |
| Name: Santiago Seage | ||
| Title: Chief Executive Officer | ||