SECURITIES AND EXCHANGE COMMISSION
Washington, D.C. 20549
FORM 6-K
REPORT OF FOREIGN PRIVATE ISSUER
PURSUANT TO RULE 13a-16 OR 15d-16
UNDER THE SECURITIES EXCHANGE ACT OF 1934
For the month of February, 2020
Commission File Number 001-36487
Atlantica Yield plc
(Exact name of Registrant as specified in its charter)
Not applicable
(Translation of Registrant’s name into English)
Great West House, GW1, 17th floor
Great West Road
Brentford, TW8 9DF
United Kingdom
Tel: +44 203 499 0465
Indicate by check mark whether the registrant files or will file annual reports under cover of Form 20-F or Form 40-F:
| ☒ Form 20-F | ☐ Form 40-F |
Indicate by check mark if the registrant is submitting the Form 6-K in paper as permitted by Regulation S-T Rule 101(b)(1): ☐
Indicate by check mark if the registrant is submitting the Form 6-K in paper as permitted by Regulation S-T Rule 101(b)(7): ☐
This Report on Form 6-K is incorporated by reference into the Registration Statement on Form F-3 of the Registrant filed with the Securities and Exchange Commission on August 6, 2018 (File 333-226611).
Q4 2019 Earnings PresentationFebruary 27, 2020
DISCLAIMER Forward Looking StatementsThis presentation contains forward-looking statements. These forward-looking statements include, but are not limited to, all statements other than statements of historical facts contained in this presentation, including, without limitation, those regarding our future financial position and results of operations, our strategy, plans, objectives, goals and targets, future developments in the markets in which we operate or are seeking to operate or anticipated regulatory changes in the markets in which we operate or intend to operate. In some cases, you can identify forward-looking statements by terminology such as "aim," "anticipate," "believe," "continue," "could," "estimate," "expect," "forecast," "guidance," "intend," "is likely to," "may," "plan," "potential," "predict," "projected," "should" or "will" or the negative of such terms or other similar expressions or terminology.By their nature, forward-looking statements involve risks and uncertainties because they relate to events and depend on circumstances that may or may not occur in the future. Forward-looking statements speak only as of the date of this presentation and are not guarantees of future performance and are based on numerous assumptions. Our actual results of operations, financial condition and the development of events may differ materially from (and be more negative than) those made in, or suggested by, the forward-looking statements. Except as required by law, we do not undertake any obligation to update any forward-looking statements to reflect events or circumstances after the date hereof or to reflect the occurrence of anticipated or unanticipated events or circumstances.Investors should read the section entitled "Item 3D. Key Information—Risk Factors" and the description of our segments and business sectors in the section entitled "Item 4B. Information on the Company—Business Overview", each in our annual report for the fiscal year ended December 31, 2019 filed on Form 20-F, for a more complete discussion of the risks and factors that could affect us.Forward-looking statements include, but are not limited to, statements relating to: expected amounts and payment timelines for investments; business synergies from investments; project growth strategy; accretive investment opportunities; strategic business alternatives to ensure optimal company value; estimated returns and cash available for distribution (“CAFD”) estimates, including from project debt refinancing; projected future CAFD yield; ESG initiative improvement; the quality of our long-term contracts; self-amortizing project debt structure and related debt reduction; the use of non-GAAP measures as a useful predicting tool for investors; the possibility to extend asset life; and various other factors, including those factors discussed under “Item 3.D—Risk Factors” and “Item 5.A—Operating Results” in our Annual Report for the fiscal year ended December 31, 2019 filed on Form 20-F.For the purposes of the announced transactions, CAFD yield is the annual weighted average of CAFD expected to be generated by the investments over their first 5-year period from 2020, or from COD for those assets which are not yet in operation, divided by the expected acquisition price. CAFD Yield is an internal estimation subject to a high degree of uncertainty and our ability to reach this expected CAFD Yield depends on a variety of factors, including closing of the acquisitions on their expected terms, acquired assets performing as expected, acquired assets making cash distributions to the holding level as expected, and assets reaching COD by the expected date. Furthermore, any dividends are subject to available capital, market conditions, and compliance with associated laws and regulations. These factors should be considered in connection with information regarding risks and uncertainties that may affect our future results included in our filings with the U.S. Securities and Exchange Commission at www.sec.gov. We undertake no obligation to update or revise any forward-looking statements, whether as a result of new information, future events or developments or otherwise. Should one or more of these risks or uncertainties materialize, or should underlying assumptions prove incorrect, actual results may vary materially from those described herein as anticipated, believed, estimated, expected or targeted.The CAFD and other guidance included in this presentation are estimates as of February 27, 2020. These estimates are based on assumptions believed to be reasonable as of the date Atlantica published its FY 2019 Financial Results. Atlantica disclaims any current intention to update such guidance, except as required by law.Non-GAAP Financial Information This presentation also includes certain non-GAAP financial measures, including Further Adjusted EBITDA including unconsolidated affiliates, Further Adjusted EBITDA including unconsolidated affiliates as a percentage of revenues (margin) and CAFD. Non-GAAP financial measures are not measurements of our performance or liquidity under IFRS as issued by IASB and should not be considered alternatives to operating profit or profit for the period or any other performance measures derived in accordance with IFRS as issued by the IASB or any other generally accepted accounting principles or as alternatives to cash flow from operating, investing or financing activities. Please refer to the appendix of this presentation for a reconciliation of the non-GAAP financial measures included in this presentation to the most directly comparable financial measures prepared in accordance with IFRS as well as the reasons why management believes the use of non-GAAP financial measures in this presentation provides useful information.In our discussion of operating results, we have included foreign exchange impacts in our revenue and Further Adjusted EBITDA including unconsolidated affiliates by providing constant currency growth. The constant currency presentation is not a measure recognized under IFRS and excludes the impact of fluctuations in foreign currency exchange rates. We believe providing constant currency information provides valuable supplemental information regarding our results of operations. We calculate constant currency amounts by converting our current period local currency revenue and Further Adjusted EBITDA using the prior period foreign currency average exchange rates and comparing these adjusted amounts to our prior period reported results. This calculation may differ from similarly titled measures used by others and, accordingly, the constant currency presentation is not meant to substitute for recorded amounts presented in conformity with IFRS as issued by the IASB nor should such amounts be considered in isolation.
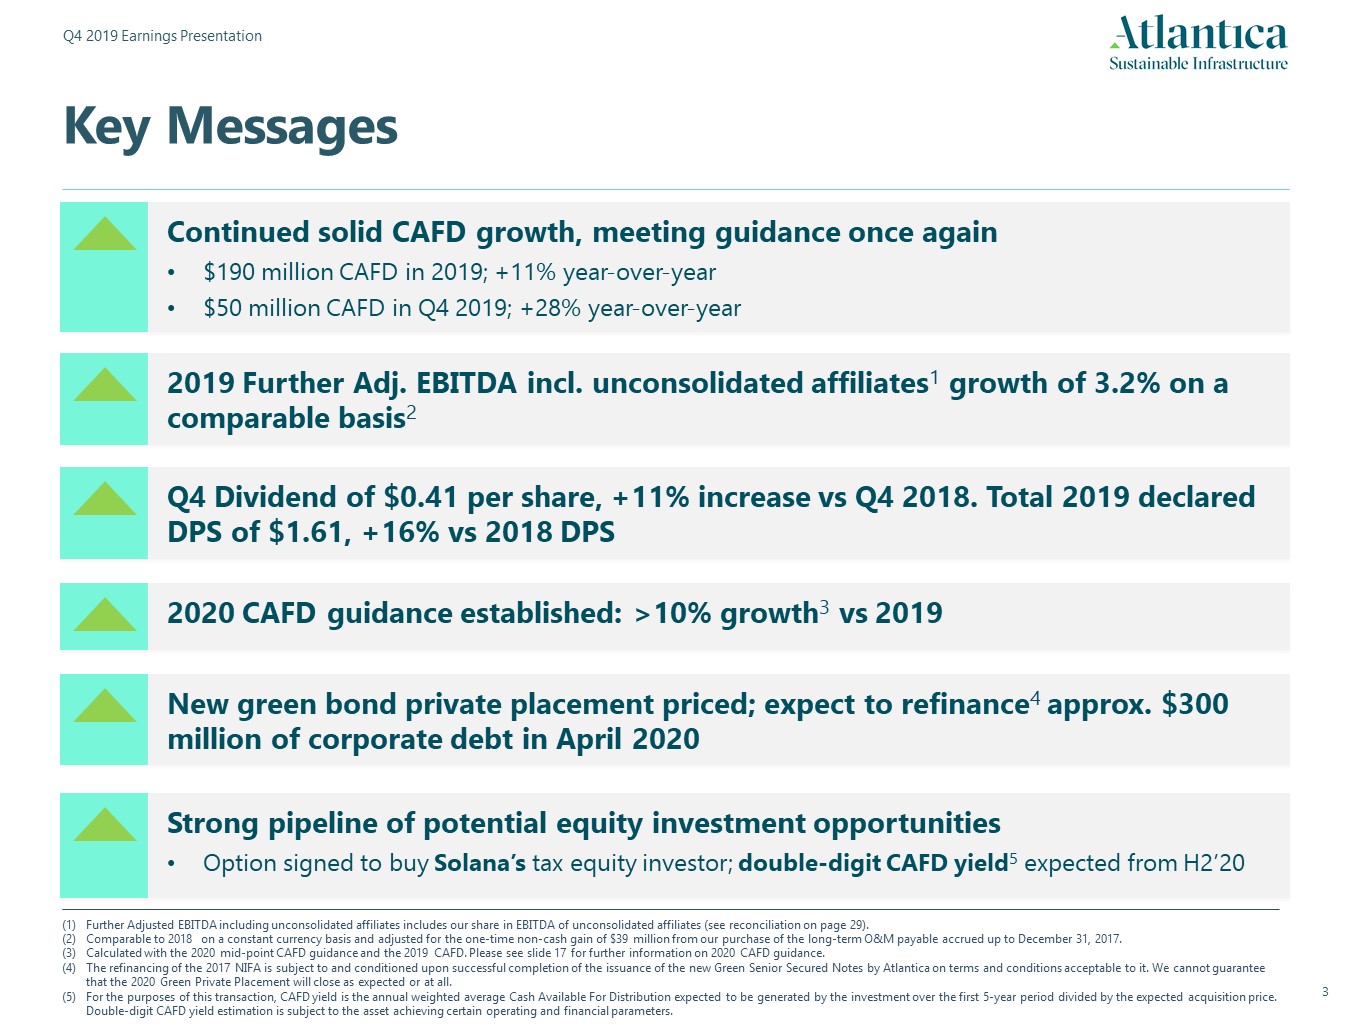
Key Messages Strong pipeline of potential equity investment opportunitiesOption signed to buy Solana’s tax equity investor; double-digit CAFD yield5 expected from H2’20 Further Adjusted EBITDA including unconsolidated affiliates includes our share in EBITDA of unconsolidated affiliates (see reconciliation on page 29).Comparable to 2018 on a constant currency basis and adjusted for the one-time non-cash gain of $39 million from our purchase of the long-term O&M payable accrued up to December 31, 2017.Calculated with the 2020 mid-point CAFD guidance and the 2019 CAFD. Please see slide 17 for further information on 2020 CAFD guidance.The refinancing of the 2017 NIFA is subject to and conditioned upon successful completion of the issuance of the new Green Senior Secured Notes by Atlantica on terms and conditions acceptable to it. We cannot guarantee that the 2020 Green Private Placement will close as expected or at all.For the purposes of this transaction, CAFD yield is the annual weighted average Cash Available For Distribution expected to be generated by the investment over the first 5-year period divided by the expected acquisition price. Double-digit CAFD yield estimation is subject to the asset achieving certain operating and financial parameters. Continued solid CAFD growth, meeting guidance once again$190 million CAFD in 2019; +11% year-over-year$50 million CAFD in Q4 2019; +28% year-over-year 2019 Further Adj. EBITDA incl. unconsolidated affiliates1 growth of 3.2% on a comparable basis2 New green bond private placement priced; expect to refinance4 approx. $300 million of corporate debt in April 2020 Q4 Dividend of $0.41 per share, +11% increase vs Q4 2018. Total 2019 declared DPS of $1.61, +16% vs 2018 DPS 2020 CAFD guidance established: >10% growth3 vs 2019
Sustainable Infrastructure 1. Financial Results
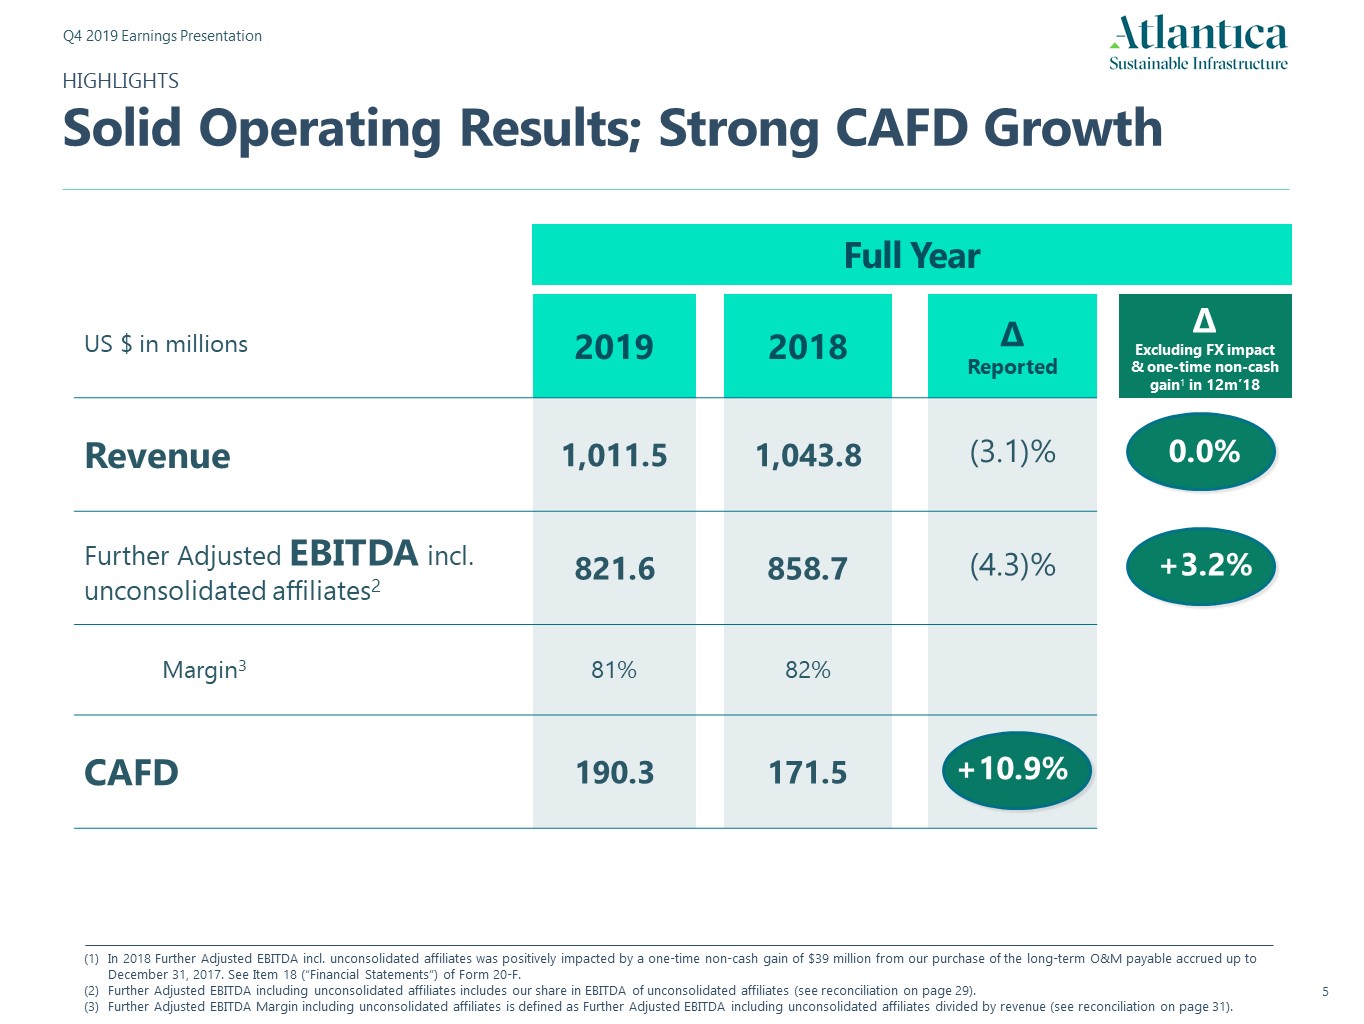
HIGHLIGHTSSolid Operating Results; Strong CAFD Growth In 2018 Further Adjusted EBITDA incl. unconsolidated affiliates was positively impacted by a one-time non-cash gain of $39 million from our purchase of the long-term O&M payable accrued up to December 31, 2017. See Item 18 (“Financial Statements”) of Form 20-F.Further Adjusted EBITDA including unconsolidated affiliates includes our share in EBITDA of unconsolidated affiliates (see reconciliation on page 29).Further Adjusted EBITDA Margin including unconsolidated affiliates is defined as Further Adjusted EBITDA including unconsolidated affiliates divided by revenue (see reconciliation on page 31). Full Year US $ in millions 2019 2018 ∆ Reported ∆ Excluding FX impact & one-time non-cash gain1 in 12m’18 Revenue 1,011.5 1,043.8 (3.1)% 0.0% Further Adjusted EBITDA incl. unconsolidated affiliates2 821.6 858.7 (4.3)% +3.2% Margin3 81% 82% CAFD 190.3 171.5 +10.9%
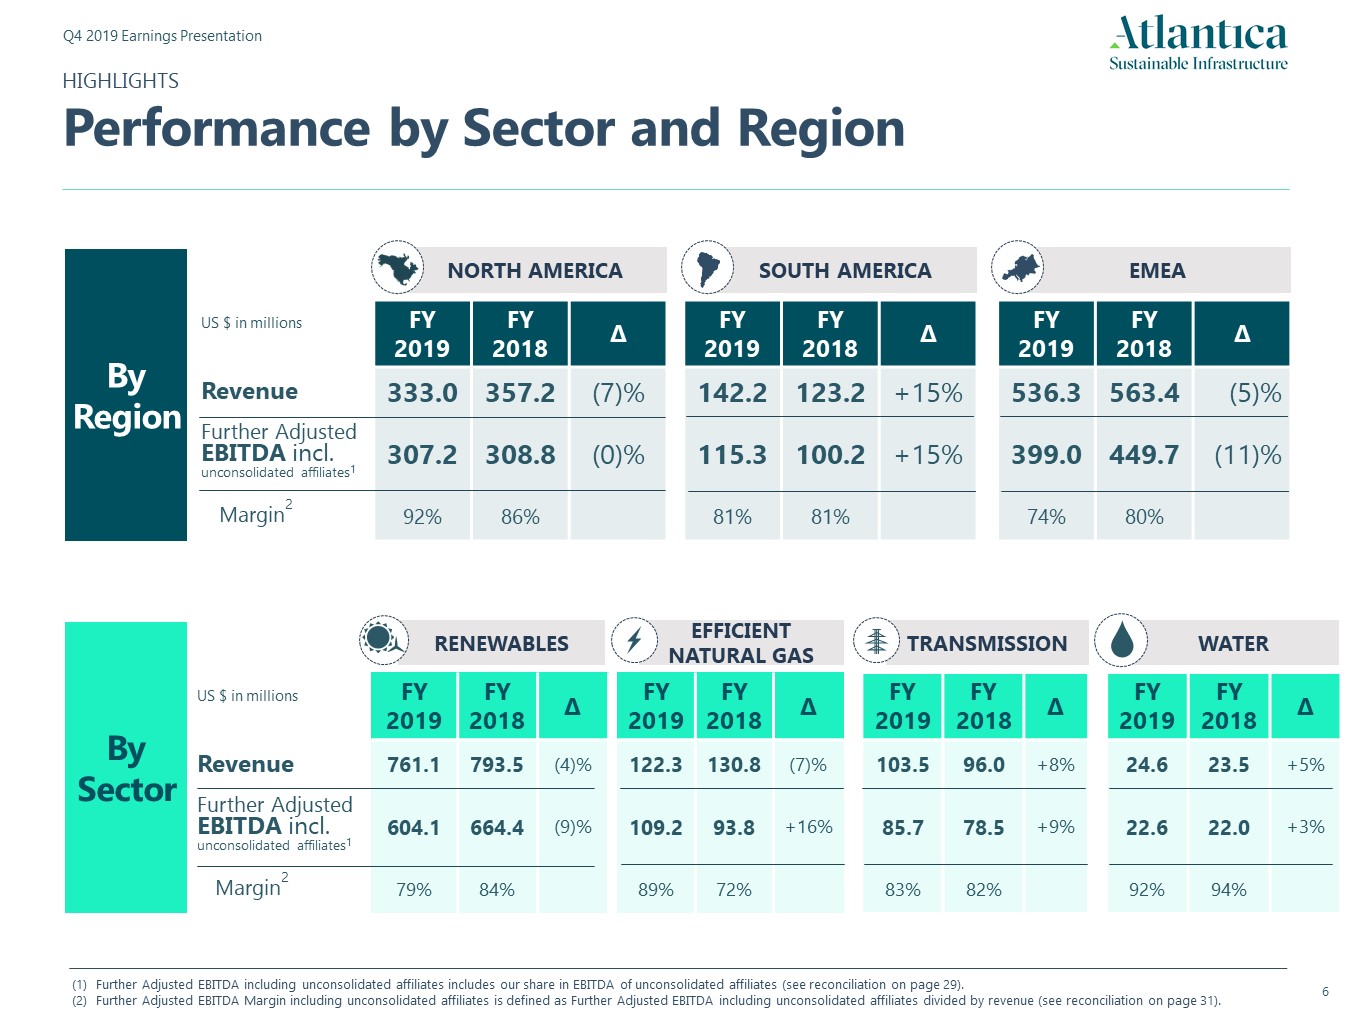
WATER FY 2019 FY 2018 ∆ 24.6 23.5 +5% 22.6 22.0 +3% 92% 94% RENEWABLES FY 2019 FY 2018 ∆ 761.1 793.5 (4)% 604.1 664.4 (9)% 79% 84% EFFICIENT NATURAL GAS FY 2019 FY 2018 ∆ 122.3 130.8 (7)% 109.2 93.8 +16% 89% 72% TRANSMISSION FY 2019 FY 2018 ∆ 103.5 96.0 +8% 85.7 78.5 +9% 83% 82% HIGHLIGHTSPerformance by Sector and Region By Sector US $ in millions Revenue Further Adjusted EBITDA incl. unconsolidated affiliates1 Margin2 EMEA NORTH AMERICA FY 2019 FY 2018 ∆ 333.0 357.2 (7)% 307.2 308.8 (0)% 92% 86% SOUTH AMERICA FY 2019 FY 2018 ∆ 536.3 563.4 (5)% 399.0 449.7 (11)% 74% 80% By Region US $ in millions Revenue Further Adjusted EBITDA incl. unconsolidated affiliates1 Margin2 Further Adjusted EBITDA including unconsolidated affiliates includes our share in EBITDA of unconsolidated affiliates (see reconciliation on page 29).Further Adjusted EBITDA Margin including unconsolidated affiliates is defined as Further Adjusted EBITDA including unconsolidated affiliates divided by revenue (see reconciliation on page 31). FY 2019 FY 2018 ∆ 142.2 123.2 +15% 115.3 100.2 +15% 81% 81%
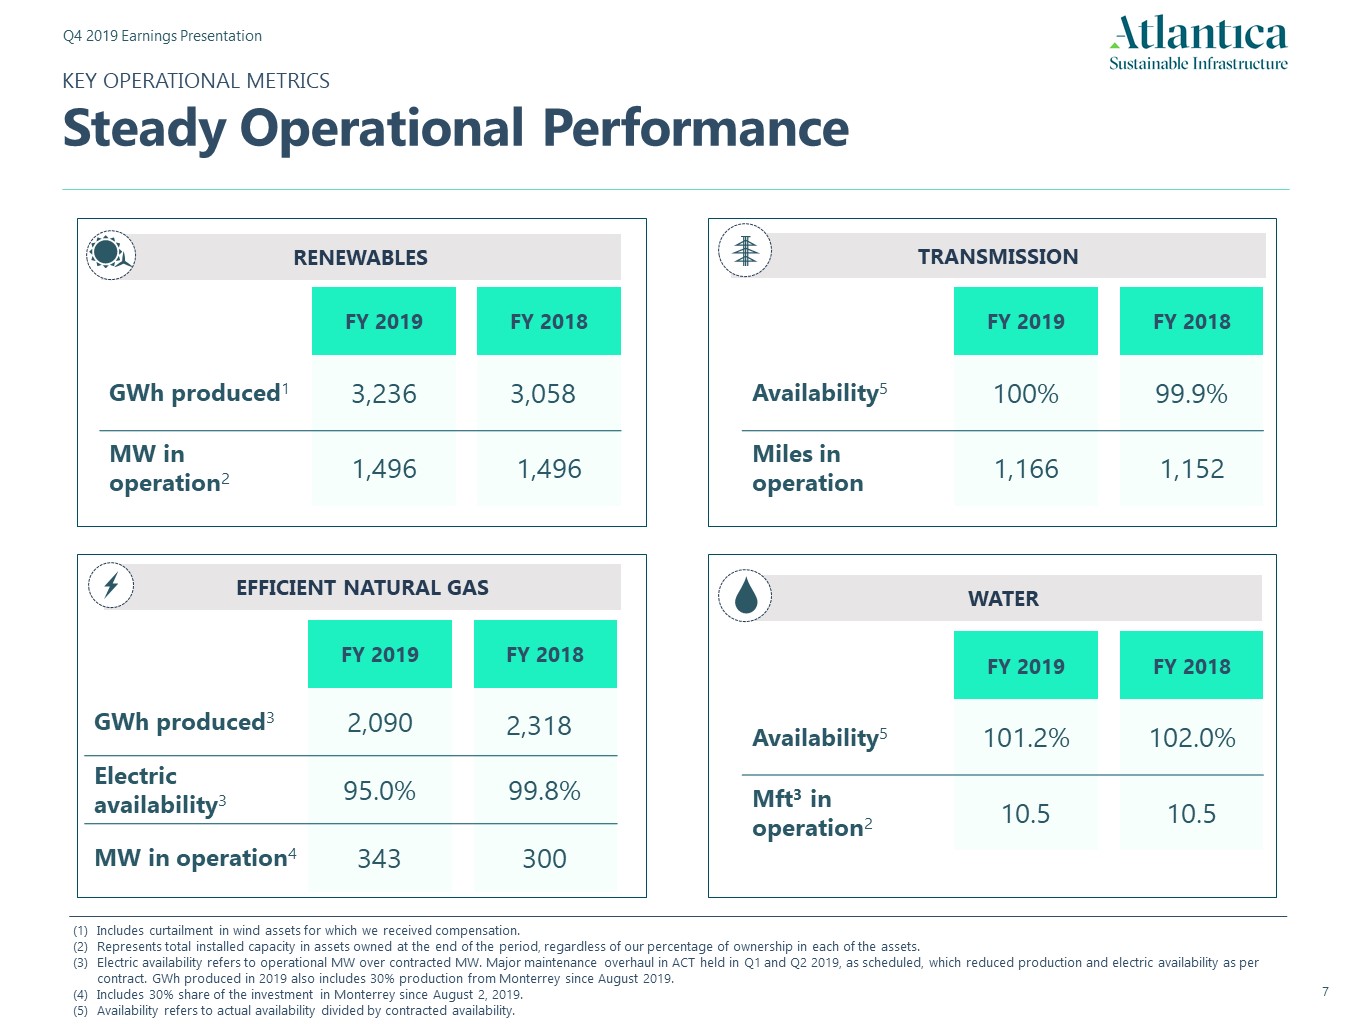
Includes curtailment in wind assets for which we received compensation.Represents total installed capacity in assets owned at the end of the period, regardless of our percentage of ownership in each of the assets.Electric availability refers to operational MW over contracted MW. Major maintenance overhaul in ACT held in Q1 and Q2 2019, as scheduled, which reduced production and electric availability as per contract. GWh produced in 2019 also includes 30% production from Monterrey since August 2019.Includes 30% share of the investment in Monterrey since August 2, 2019.Availability refers to actual availability divided by contracted availability. KEY OPERATIONAL METRICSSteady Operational Performance WATER RENEWABLES TRANSMISSION EFFICIENT NATURAL GAS FY 2019 FY 2018 Availability5 101.2% 102.0% Mft3 in operation2 10.5 10.5 FY 2019 FY 2018 GWh produced1 3,236 MW in operation2 1,496 1,496 FY 2019 FY 2018 GWh produced3 2,090 Electric availability3 95.0% 99.8% MW in operation4 343 300 FY 2019 FY 2018 Availability5 100% 99.9% Miles in operation 1,166 1,152 3,058 2,318
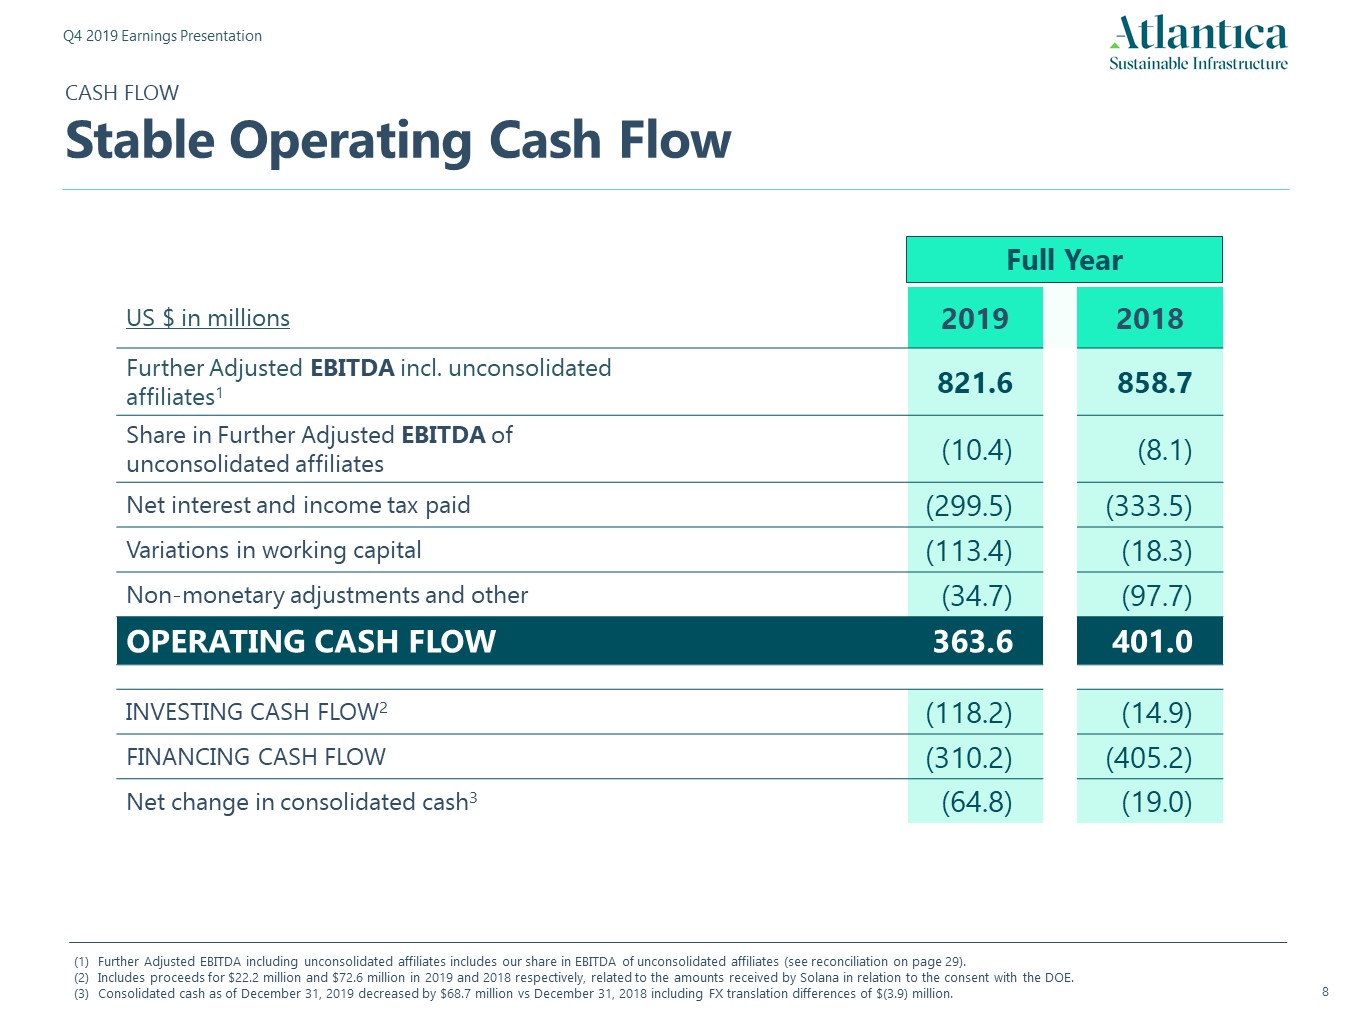
CASH FLOWStable Operating Cash Flow Further Adjusted EBITDA including unconsolidated affiliates includes our share in EBITDA of unconsolidated affiliates (see reconciliation on page 29).Includes proceeds for $22.2 million and $72.6 million in 2019 and 2018 respectively, related to the amounts received by Solana in relation to the consent with the DOE. Consolidated cash as of December 31, 2019 decreased by $68.7 million vs December 31, 2018 including FX translation differences of $(3.9) million. Full Year US $ in millions 2019 2018 Further Adjusted EBITDA incl. unconsolidated affiliates1 821.6 858.7 Share in Further Adjusted EBITDA of unconsolidated affiliates (10.4) (8.1) Net interest and income tax paid (299.5) (333.5) Variations in working capital (113.4) (18.3) Non-monetary adjustments and other (34.7) (97.7) OPERATING CASH FLOW 363.6 401.0 INVESTING CASH FLOW2 (118.2) (14.9) FINANCING CASH FLOW (310.2) (405.2) Net change in consolidated cash3 (64.8) (19.0)
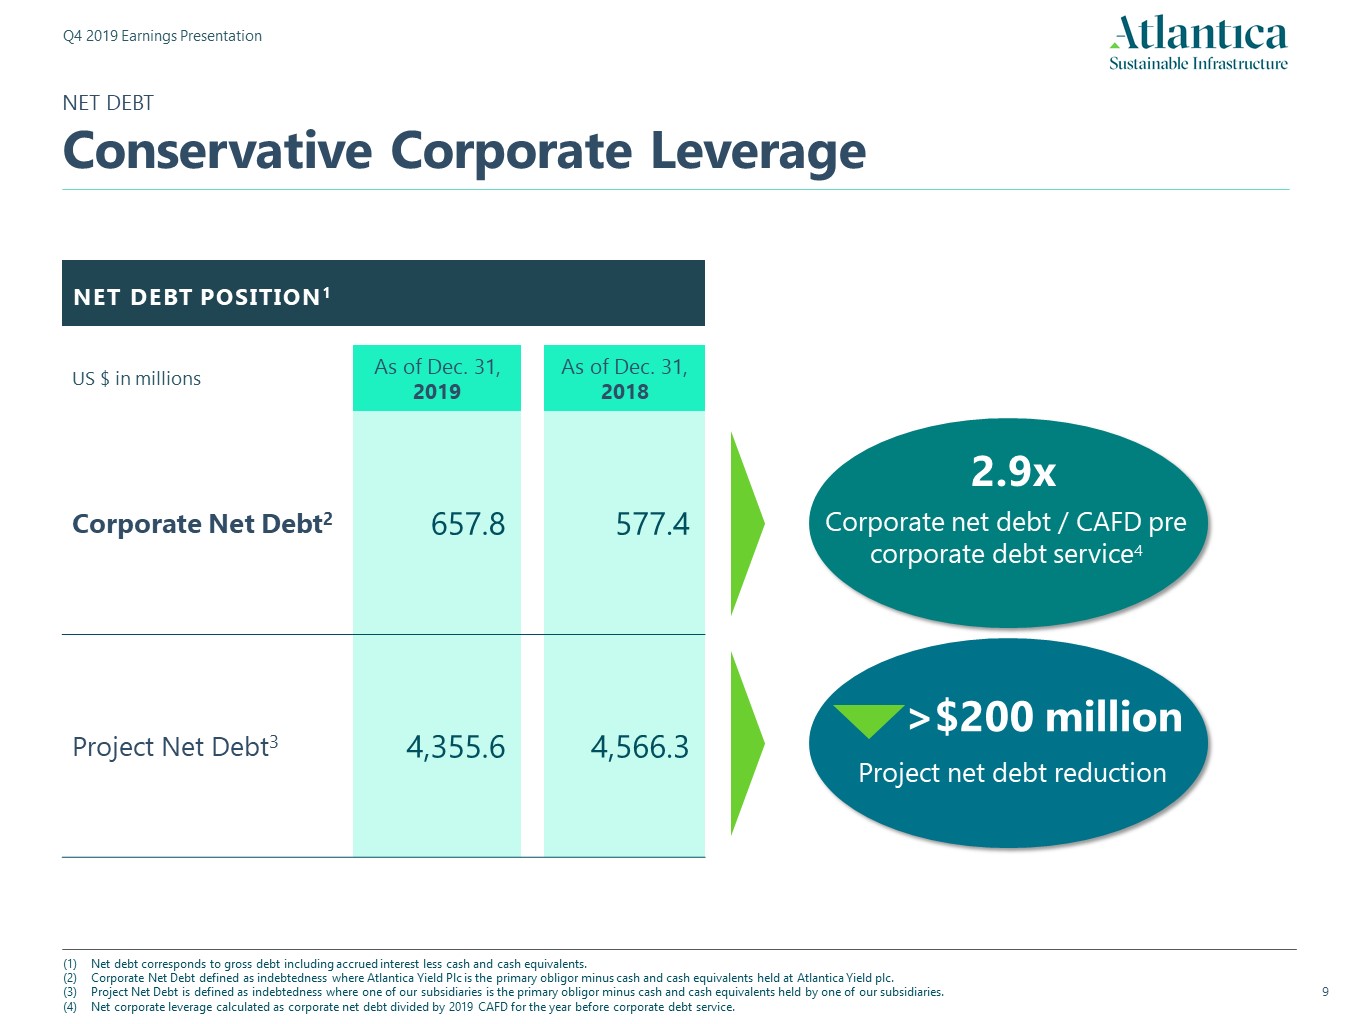
NET DEBT POSITION1 Net debt corresponds to gross debt including accrued interest less cash and cash equivalents.Corporate Net Debt defined as indebtedness where Atlantica Yield Plc is the primary obligor minus cash and cash equivalents held at Atlantica Yield plc. Project Net Debt is defined as indebtedness where one of our subsidiaries is the primary obligor minus cash and cash equivalents held by one of our subsidiaries.Net corporate leverage calculated as corporate net debt divided by 2019 CAFD for the year before corporate debt service. US $ in millions As of Dec. 31,2019 As of Dec. 31,2018 Corporate Net Debt2 657.8 577.4 Project Net Debt3 4,355.6 4,566.3 Project net debt reduction >$200 million NET DEBTConservative Corporate Leverage Corporate net debt / CAFD pre corporate debt service4 2.9x
Sustainable Infrastructure 2. Strategic Update Sustainable Infrastructure
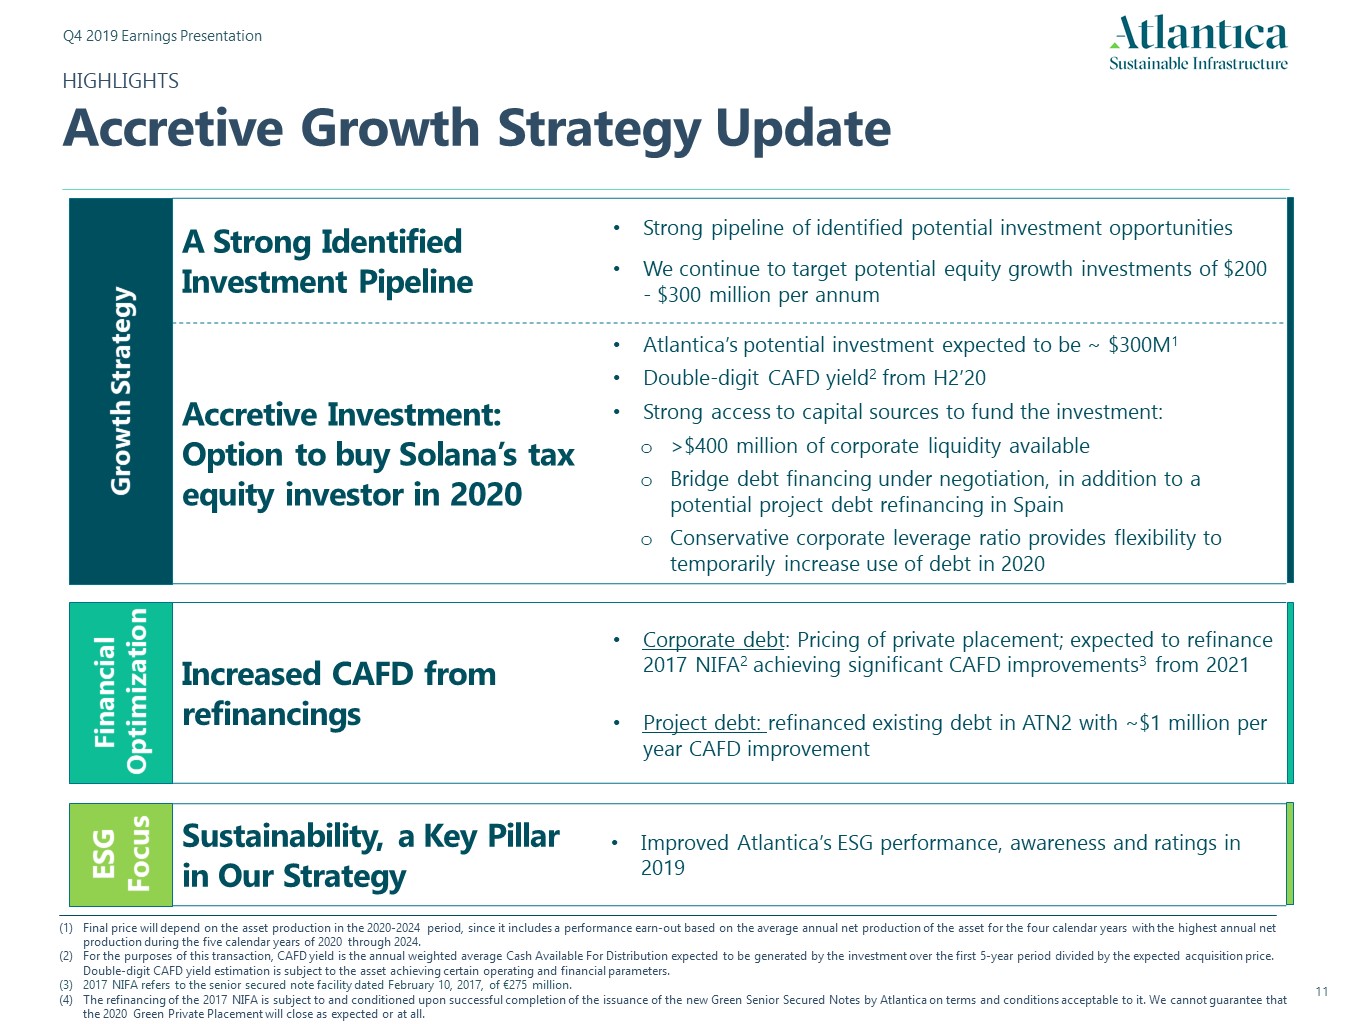
HIGHLIGHTSAccretive Growth Strategy Update A Strong Identified Investment Pipeline Strong pipeline of identified potential investment opportunitiesWe continue to target potential equity growth investments of $200 - $300 million per annum Accretive Investment: Option to buy Solana’s tax equity investor in 2020 Atlantica’s potential investment expected to be ~ $300M1Double-digit CAFD yield2 from H2’20Strong access to capital sources to fund the investment:>$400 million of corporate liquidity availableBridge debt financing under negotiation, in addition to a potential project debt refinancing in SpainConservative corporate leverage ratio provides flexibility to temporarily increase use of debt in 2020 Final price will depend on the asset production in the 2020-2024 period, since it includes a performance earn-out based on the average annual net production of the asset for the four calendar years with the highest annual net production during the five calendar years of 2020 through 2024.For the purposes of this transaction, CAFD yield is the annual weighted average Cash Available For Distribution expected to be generated by the investment over the first 5-year period divided by the expected acquisition price. Double-digit CAFD yield estimation is subject to the asset achieving certain operating and financial parameters.2017 NIFA refers to the senior secured note facility dated February 10, 2017, of €275 million. The refinancing of the 2017 NIFA is subject to and conditioned upon successful completion of the issuance of the new Green Senior Secured Notes by Atlantica on terms and conditions acceptable to it. We cannot guarantee that the 2020 Green Private Placement will close as expected or at all. Sustainability, a Key Pillar in Our Strategy Improved Atlantica’s ESG performance, awareness and ratings in 2019 Increased CAFD from refinancings Corporate debt: Pricing of private placement; expected to refinance 2017 NIFA2 achieving significant CAFD improvements3 from 2021Project debt: refinanced existing debt in ATN2 with ~$1 million per year CAFD improvement Financial Optimization Growth Strategy ESG Focus
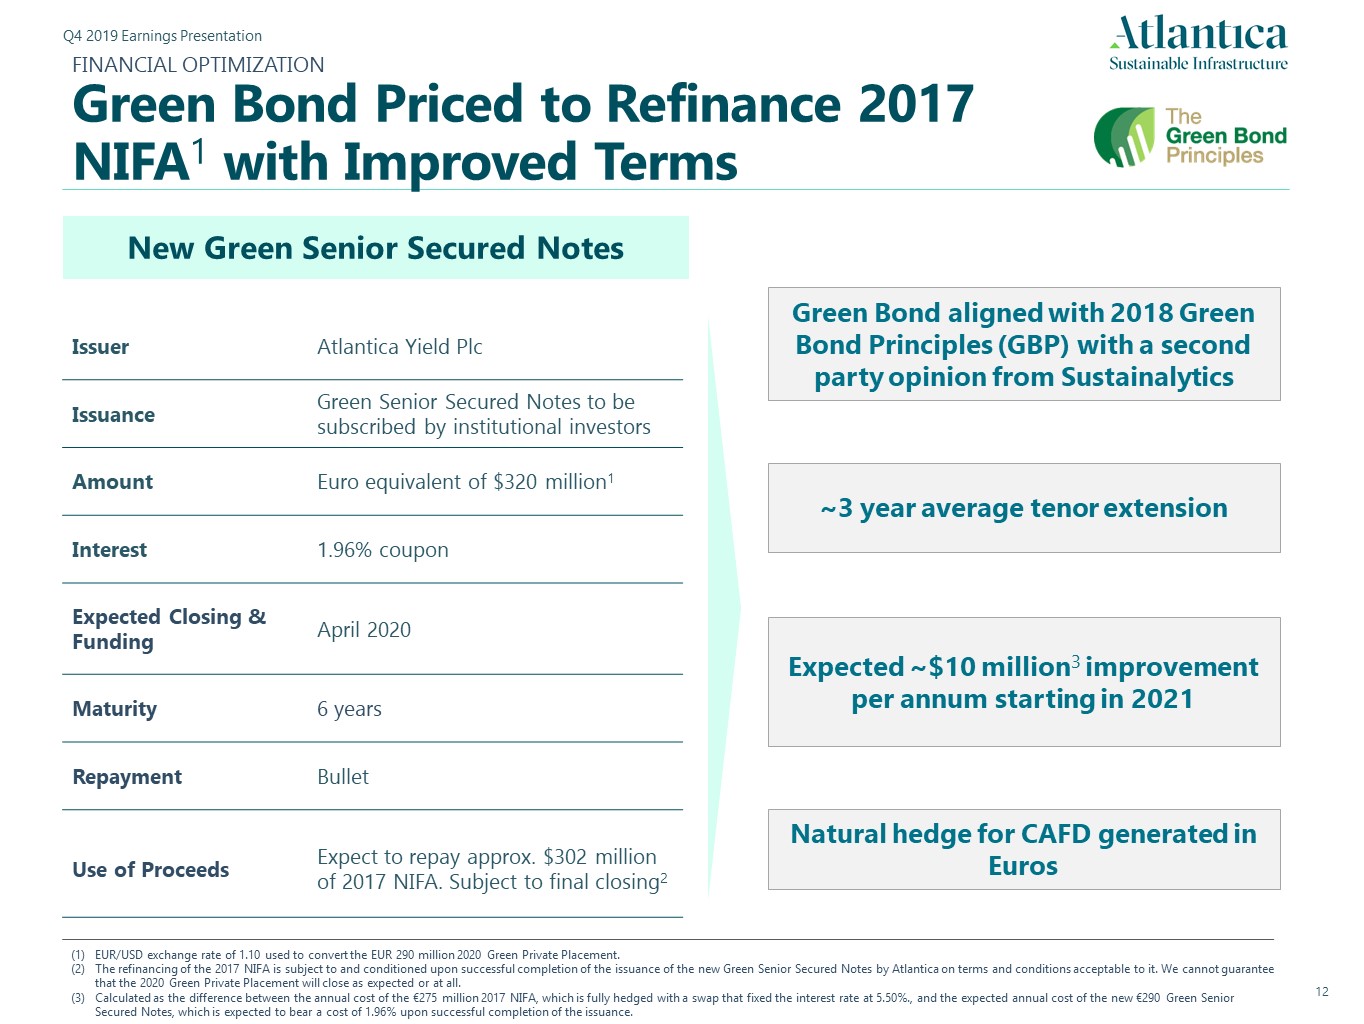
FINANCIAL OPTIMIZATIONGreen Bond Priced to Refinance 2017 NIFA1 with Improved Terms New Green Senior Secured Notes Issuer Atlantica Yield Plc Issuance Green Senior Secured Notes to be subscribed by institutional investors Amount Euro equivalent of $320 million1 Interest 1.96% coupon Expected Closing & Funding April 2020 Maturity 6 years Repayment Bullet Use of Proceeds Expect to repay approx. $302 million of 2017 NIFA. Subject to final closing2 Natural hedge for CAFD generated in Euros Expected ~$10 million3 improvement per annum starting in 2021 EUR/USD exchange rate of 1.10 used to convert the EUR 290 million 2020 Green Private Placement.The refinancing of the 2017 NIFA is subject to and conditioned upon successful completion of the issuance of the new Green Senior Secured Notes by Atlantica on terms and conditions acceptable to it. We cannot guarantee that the 2020 Green Private Placement will close as expected or at all.Calculated as the difference between the annual cost of the €275 million 2017 NIFA, which is fully hedged with a swap that fixed the interest rate at 5.50%., and the expected annual cost of the new €290 Green Senior Secured Notes, which is expected to bear a cost of 1.96% upon successful completion of the issuance. ~3 year average tenor extension Green Bond aligned with 2018 Green Bond Principles (GBP) with a second party opinion from Sustainalytics
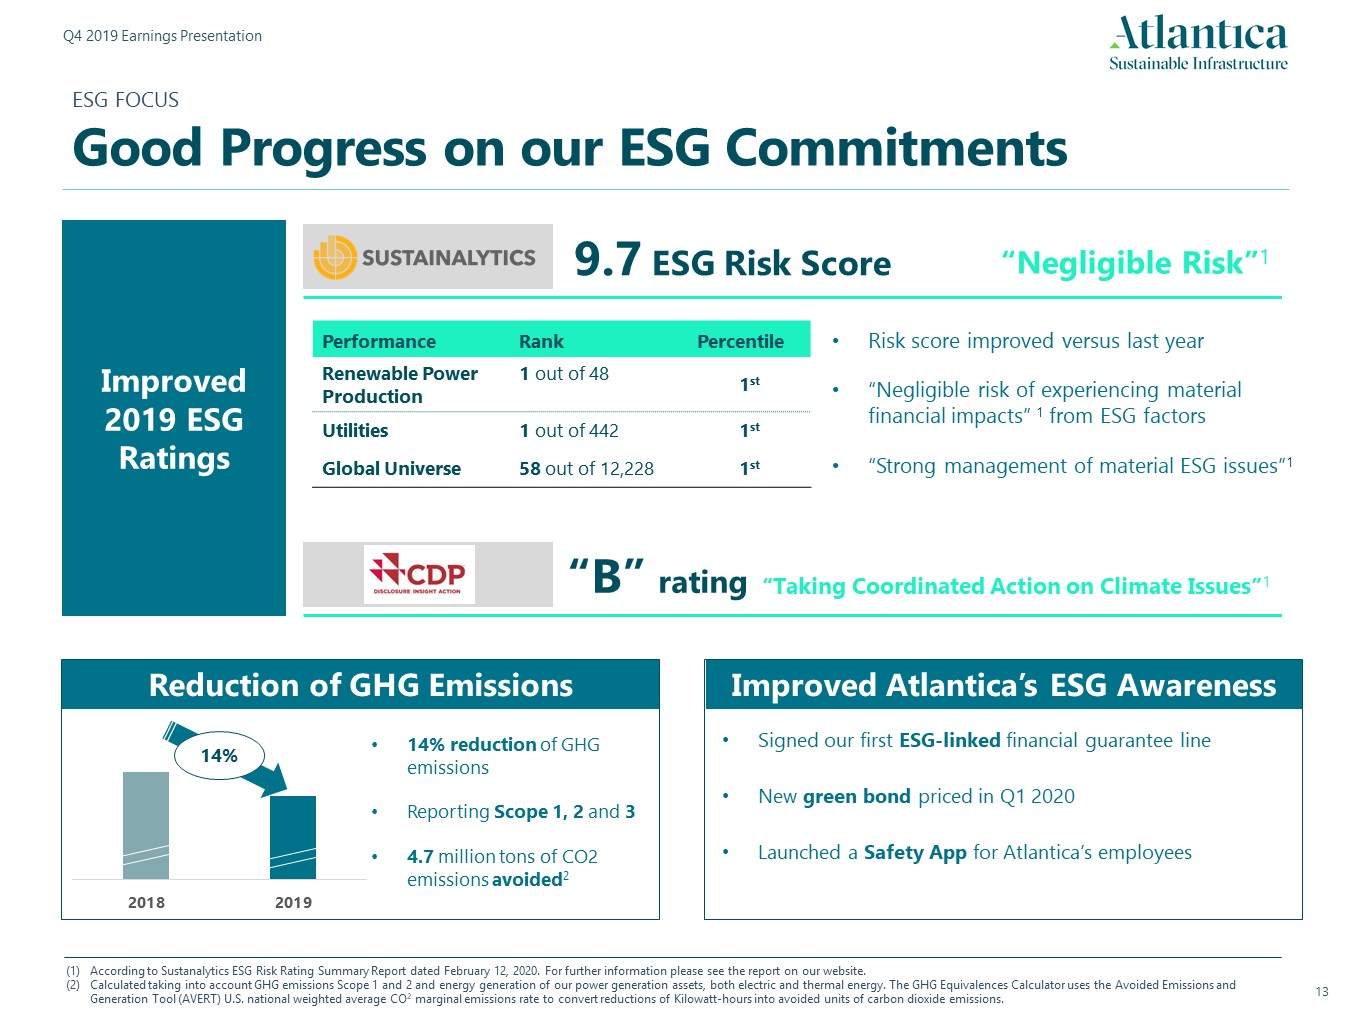
ESG FOCUSGood Progress on our ESG Commitments Improved 2019 ESG Ratings Performance Rank Percentile Renewable Power Production 1 out of 48 1st Utilities 1 out of 442 1st Global Universe 58 out of 12,228 1st Risk score improved versus last year“Negligible risk of experiencing material financial impacts” 1 from ESG factors“Strong management of material ESG issues”1 “Taking Coordinated Action on Climate Issues”1 9.7 ESG Risk Score “Negligible Risk”1 “B” rating Improved Atlantica’s ESG Awareness 14% Reduction of GHG Emissions 14% reduction of GHG emissionsReporting Scope 1, 2 and 34.7 million tons of CO2 emissions avoided2 Signed our first ESG-linked financial guarantee lineNew green bond priced in Q1 2020Launched a Safety App for Atlantica’s employees According to Sustanalytics ESG Risk Rating Summary Report dated February 12, 2020. For further information please see the report on our website.Calculated taking into account GHG emissions Scope 1 and 2 and energy generation of our power generation assets, both electric and thermal energy. The GHG Equivalences Calculator uses the Avoided Emissions and Generation Tool (AVERT) U.S. national weighted average CO2 marginal emissions rate to convert reductions of Kilowatt-hours into avoided units of carbon dioxide emissions.

DIVIDEND +11% DPS Growth Dividends Declared1 - US $ per share Quarterly dividends declared by the Board of Directors and paid during the following quarter. +11% +16% Annualized DPS CAGR Achieved Q4 2019 dividend of $0.41 per share or $1.64 annualizedGrowth of +11% vs Q4 2018 +11% in the last 12 months +15% in the last 24 months +15% CAGR
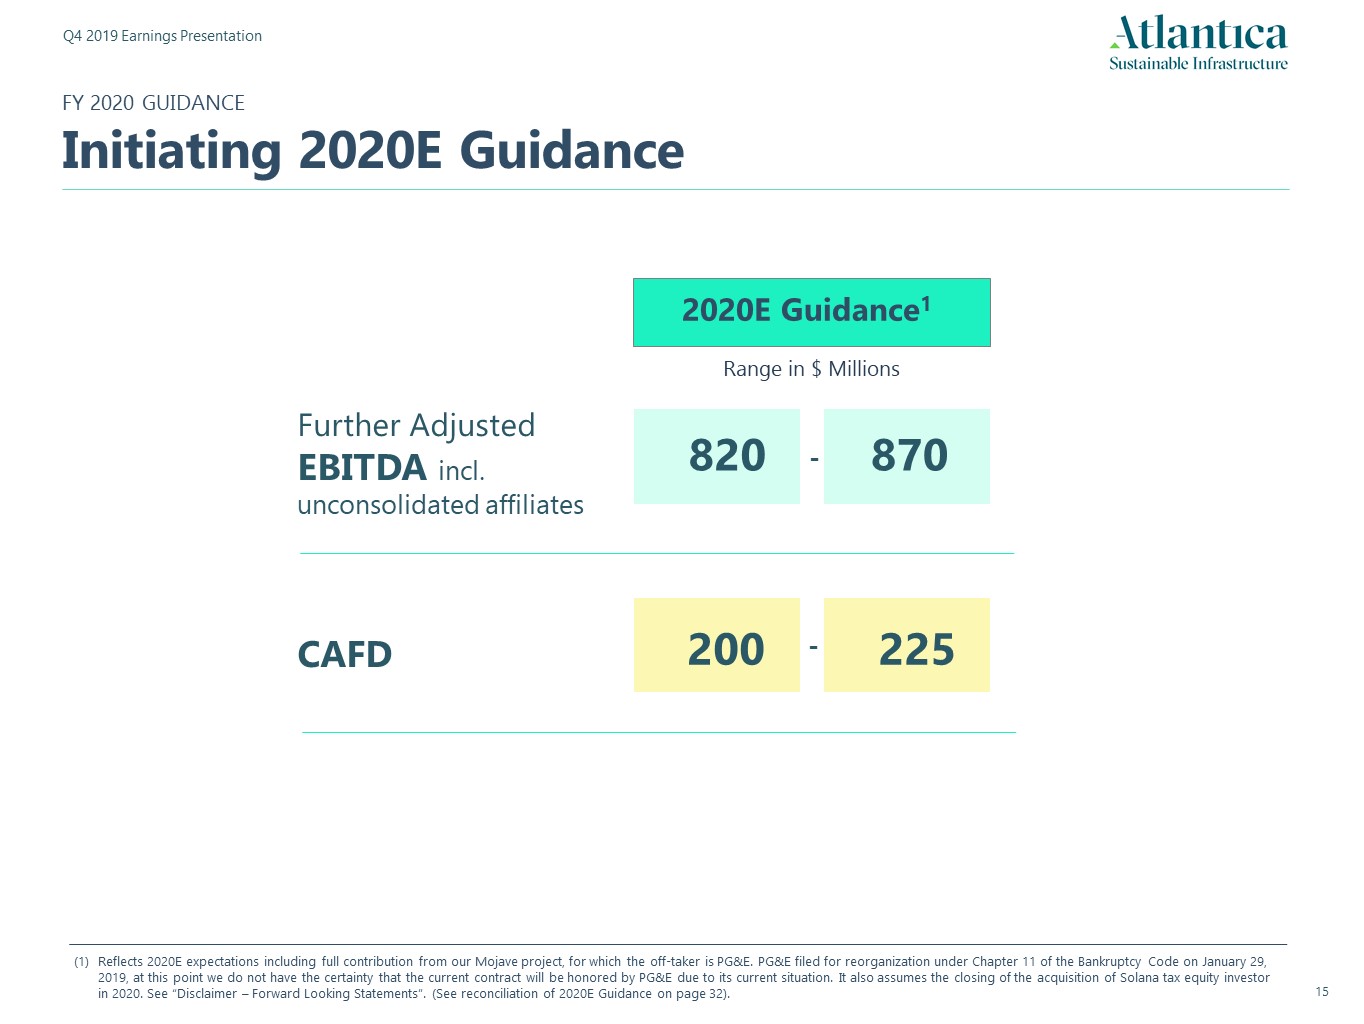
FY 2020 GUIDANCEInitiating 2020E Guidance 2020E Guidance1 820 Range in $ Millions 870 Further Adjusted EBITDA incl. unconsolidated affiliates - Reflects 2020E expectations including full contribution from our Mojave project, for which the off-taker is PG&E. PG&E filed for reorganization under Chapter 11 of the Bankruptcy Code on January 29, 2019, at this point we do not have the certainty that the current contract will be honored by PG&E due to its current situation. It also assumes the closing of the acquisition of Solana tax equity investor in 2020. See “Disclaimer – Forward Looking Statements”. (See reconciliation of 2020E Guidance on page 32). CAFD 200 225 -
Sustainable Infrastructure 3. Appendix

ESG Main Performance IndicatorsSustainability, a Key Pillar in Our Strategy Social KPI’s 2019 2018 Percentage of Women over Total Number of Employees2 % of employees 26% 25% 100 bps increase Women at Management Level % of employees 20% 19% - Training1 # of hours/employee per year 49 57 - Employee Performance Review % of employees 100% 100% - Environmental KPI’s 2019 2018 Change Scope 1 and 2 GHG Emissions Thousands of tons of CO2e1 1,656 1,956 15% reduction Scope 3 GHG Emissions Thousands of tons of CO2e1 719 793 9% reduction Revenue from Low-carbon Footprint Assets USD Million 88% 87% 100 bps increase Health & Safety KPI’s 2019 2018 Change Total Recordable Incident Rate # of total accidents in last 12m per 200k worked hours 1.2 1.5 22% reduction Lost Time Incident Rate # of accidents with leave in last 12m per 200K worked hours 0.3 0.5 39% reduction CO2e stands for carbon dioxide equivalent. Emissions are reported including CO2 and other greenhouse gases, according to the guidelines of the Greenhouse Gas (GHG) Protocol.Proforma 2018 for comparative purposes. It includes the number of employees of the U.S. O&M activities that were internalized in 2019.
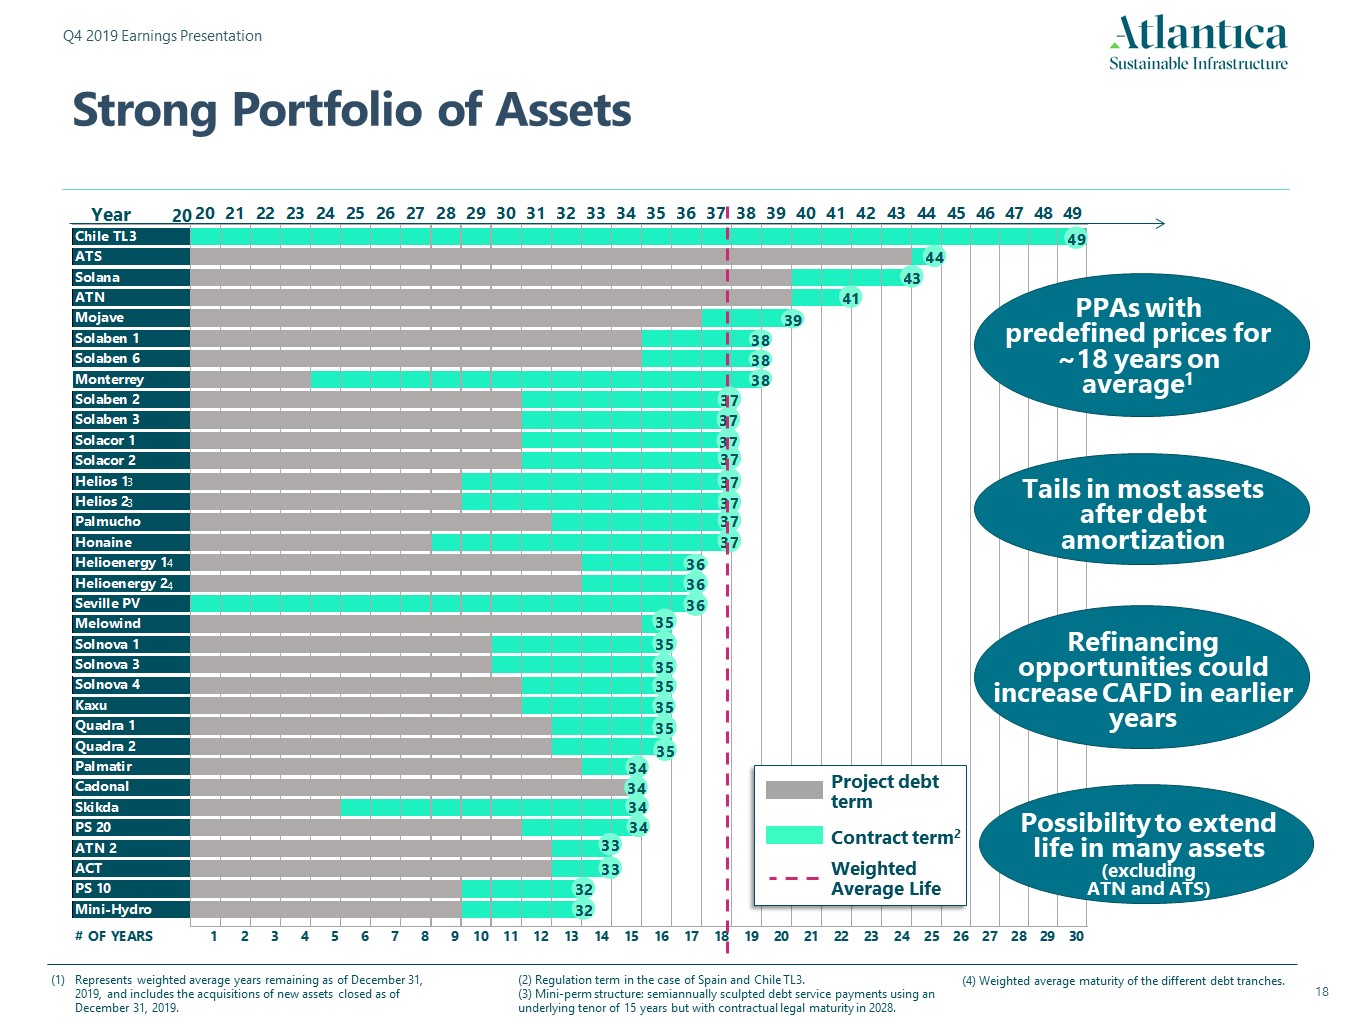
Strong Portfolio of Assets Weighted Average Life Project debt term 20 Represents weighted average years remaining as of December 31, 2019, and includes the acquisitions of new assets closed as of December 31, 2019. (2) Regulation term in the case of Spain and Chile TL3.(3) Mini-perm structure: semiannually sculpted debt service payments using an underlying tenor of 15 years but with contractual legal maturity in 2028. (4) Weighted average maturity of the different debt tranches. 3 3 PPAs with predefined prices for ~18 years on average1 Refinancing opportunities could increase CAFD in earlier years Possibility to extend life in many assets (excluding ATN and ATS) Tails in most assets after debt amortization 4 4 Year Contract term2

FINANCINGSelf-Amortizing Project Debt Structure Key principle: non-recourse project financing in ring-fenced subsidiaries100% project debt self-amortizing progressively before the end of the contracted lifeLow interest rate risk, with +90% of interest rates fixed or hedged >$1.1B planned debt reduction in the next 4 years
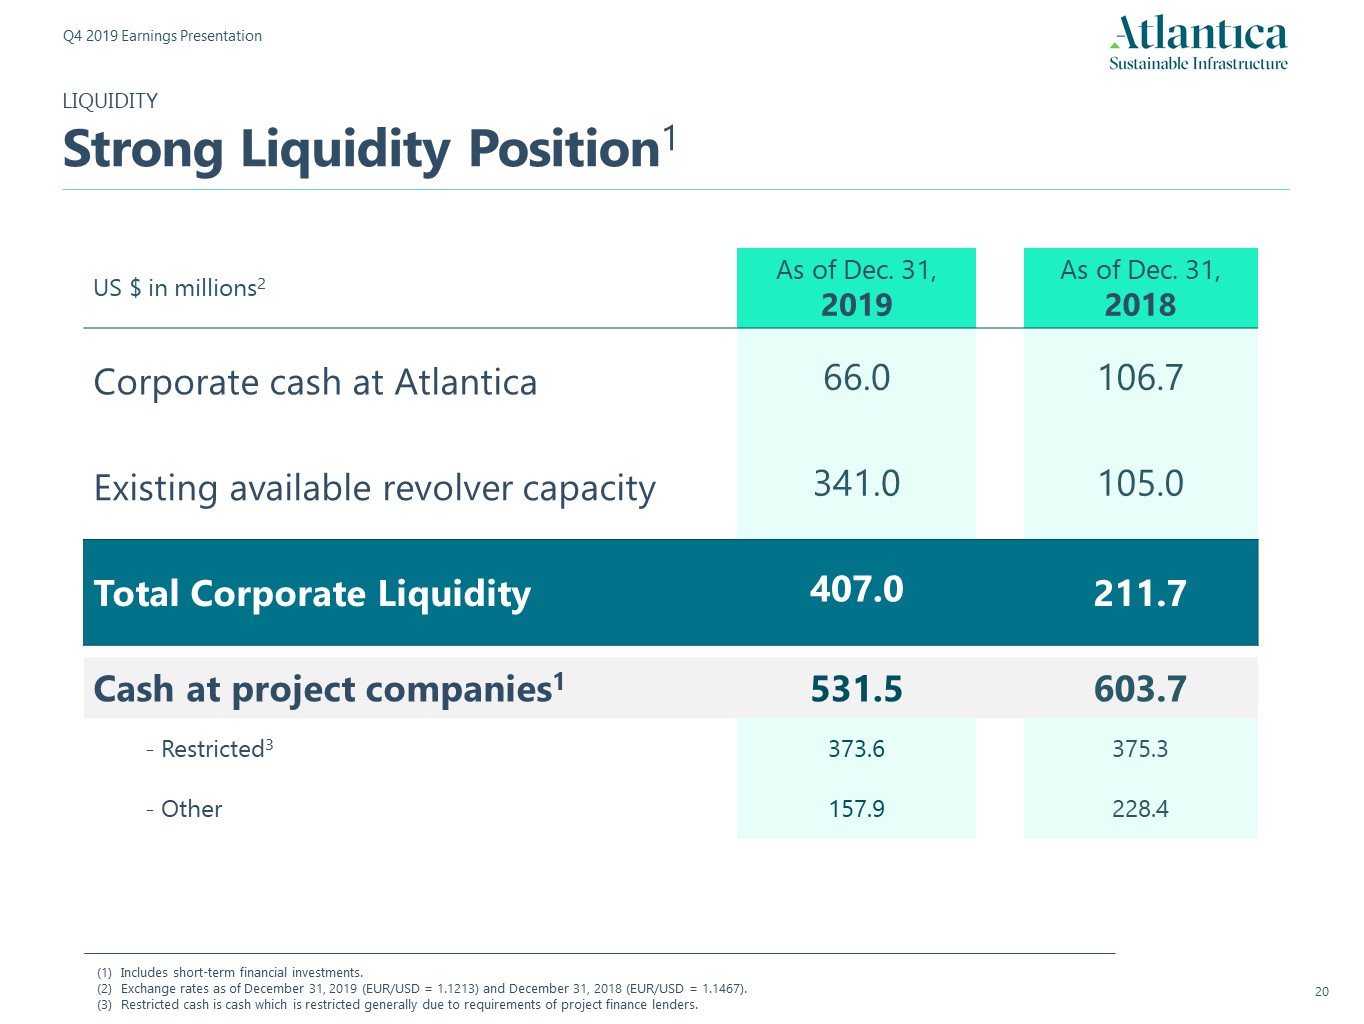
Includes short-term financial investments. Exchange rates as of December 31, 2019 (EUR/USD = 1.1213) and December 31, 2018 (EUR/USD = 1.1467).Restricted cash is cash which is restricted generally due to requirements of project finance lenders. US $ in millions2 As of Dec. 31,2019 As of Dec. 31,2018 Corporate cash at Atlantica 66.0 106.7 Existing available revolver capacity 341.0 105.0 Total Corporate Liquidity 407.0 211.7 Cash at project companies1 531.5 603.7 - Restricted3 373.6 375.3 - Other 157.9 228.4 LIQUIDITYStrong Liquidity Position1
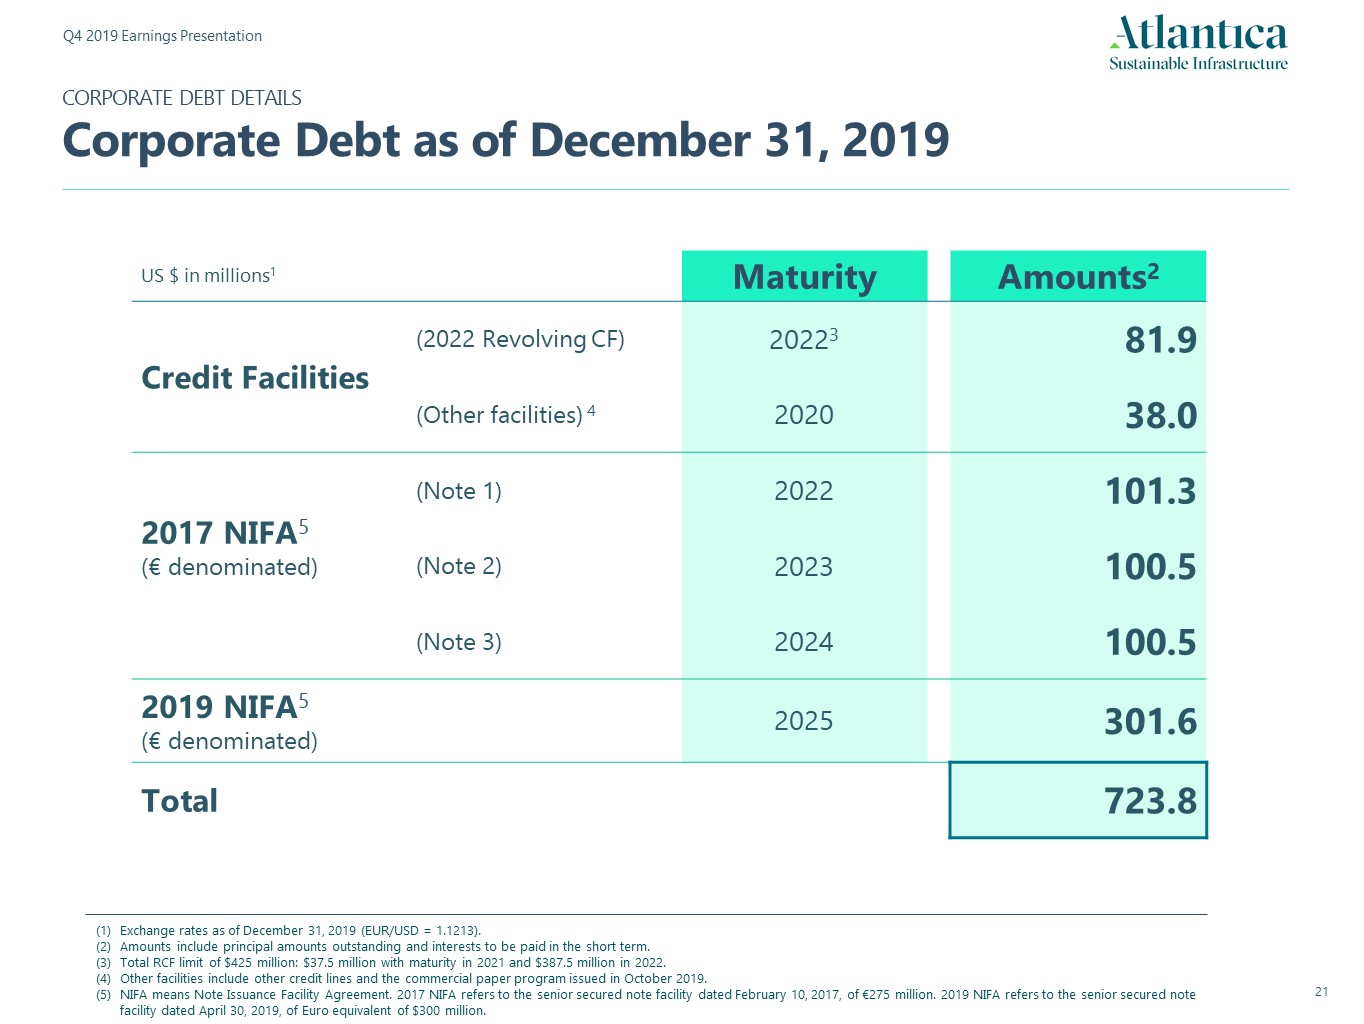
CORPORATE DEBT DETAILSCorporate Debt as of December 31, 2019 Exchange rates as of December 31, 2019 (EUR/USD = 1.1213).Amounts include principal amounts outstanding and interests to be paid in the short term.Total RCF limit of $425 million: $37.5 million with maturity in 2021 and $387.5 million in 2022.Other facilities include other credit lines and the commercial paper program issued in October 2019.NIFA means Note Issuance Facility Agreement. 2017 NIFA refers to the senior secured note facility dated February 10, 2017, of €275 million. 2019 NIFA refers to the senior secured note facility dated April 30, 2019, of Euro equivalent of $300 million. US $ in millions1 Maturity Amounts2 Credit Facilities (2022 Revolving CF) 20223 81.9 (Other facilities) 4 2020 38.0 2017 NIFA5 (€ denominated) (Note 1) 2022 101.3 (Note 2) 2023 100.5 (Note 3) 2024 100.5 2019 NIFA5(€ denominated) 2025 301.6 Total 723.8
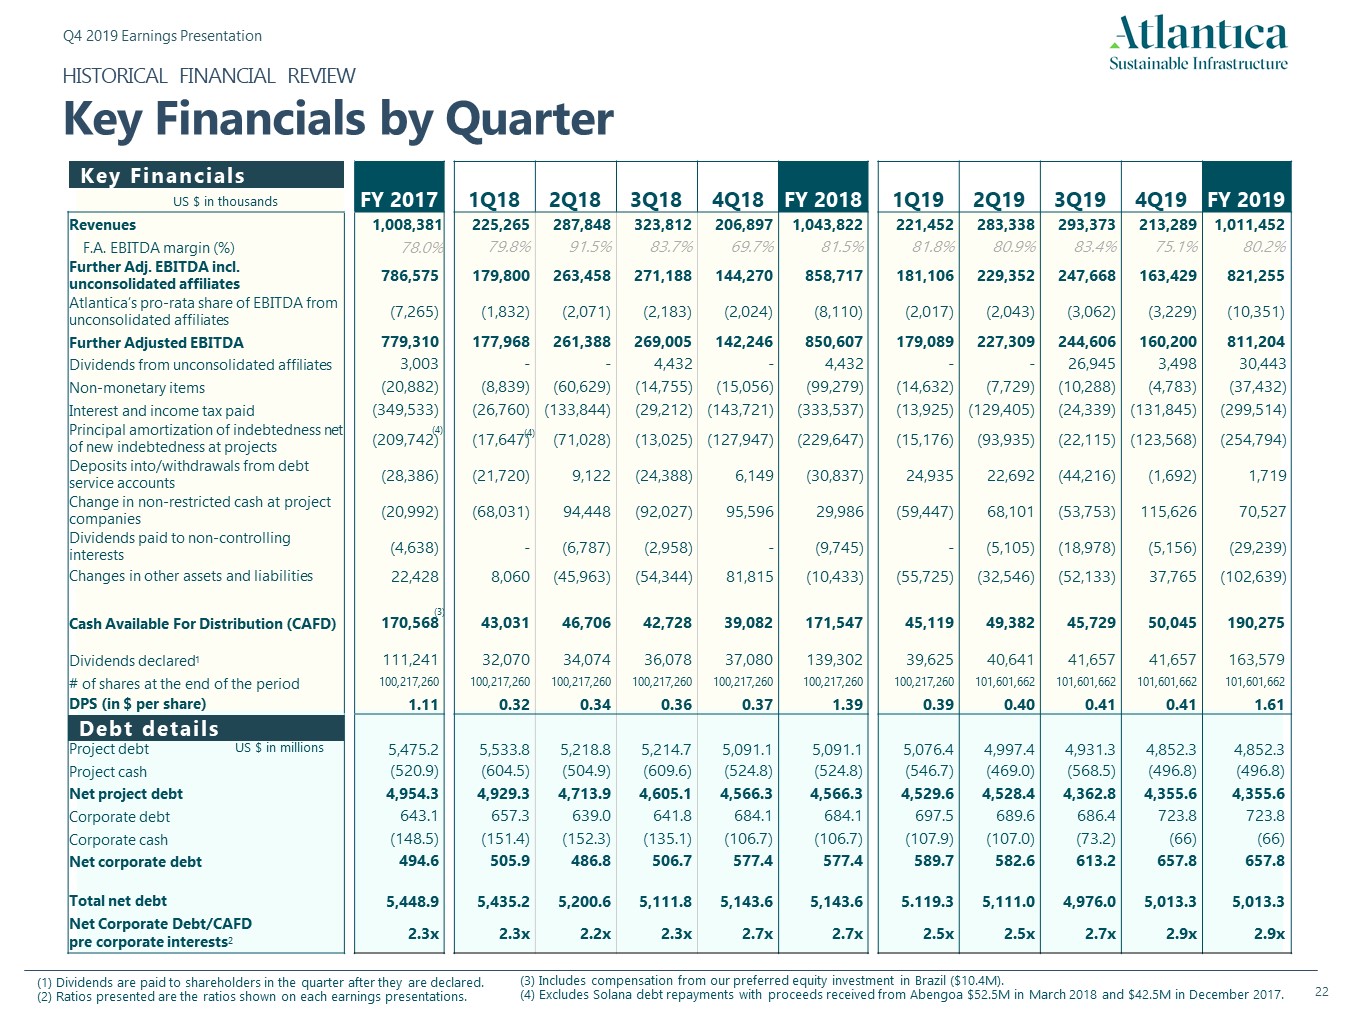
HISTORICAL FINANCIAL REVIEWKey Financials by Quarter Debt details Key Financials US $ in thousands US $ in millions (4) (3) (4) Dividends are paid to shareholders in the quarter after they are declared.Ratios presented are the ratios shown on each earnings presentations. (3) Includes compensation from our preferred equity investment in Brazil ($10.4M).(4) Excludes Solana debt repayments with proceeds received from Abengoa $52.5M in March 2018 and $42.5M in December 2017. FY 2017 1Q18 2Q18 3Q18 4Q18 FY 2018 1Q19 2Q19 3Q19 4Q19 FY 2019 Revenues 1,008,381 225,265 287,848 323,812 206,897 1,043,822 221,452 283,338 293,373 213,289 1,011,452 F.A. EBITDA margin (%) 78.0% 79.8% 91.5% 83.7% 69.7% 81.5% 81.8% 80.9% 83.4% 75.1% 80.2% Further Adj. EBITDA incl. unconsolidated affiliates 786,575 179,800 263,458 271,188 144,270 858,717 181,106 229,352 247,668 163,429 821,255 Atlantica’s pro-rata share of EBITDA from unconsolidated affiliates (7,265) (1,832) (2,071) (2,183) (2,024) (8,110) (2,017) (2,043) (3,062) (3,229) (10,351) Further Adjusted EBITDA 779,310 177,968 261,388 269,005 142,246 850,607 179,089 227,309 244,606 160,200 811,204 Dividends from unconsolidated affiliates 3,003 - - 4,432 - 4,432 - - 26,945 3,498 30,443 Non-monetary items (20,882) (8,839) (60,629) (14,755) (15,056) (99,279) (14,632) (7,729) (10,288) (4,783) (37,432) Interest and income tax paid (349,533) (26,760) (133,844) (29,212) (143,721) (333,537) (13,925) (129,405) (24,339) (131,845) (299,514) Principal amortization of indebtedness net of new indebtedness at projects (209,742) (17,647) (71,028) (13,025) (127,947) (229,647) (15,176) (93,935) (22,115) (123,568) (254,794) Deposits into/withdrawals from debt service accounts (28,386) (21,720) 9,122 (24,388) 6,149 (30,837) 24,935 22,692 (44,216) (1,692) 1,719 Change in non-restricted cash at project companies (20,992) (68,031) 94,448 (92,027) 95,596 29,986 (59,447) 68,101 (53,753) 115,626 70,527 Dividends paid to non-controlling interests (4,638) - (6,787) (2,958) - (9,745) - (5,105) (18,978) (5,156) (29,239) Changes in other assets and liabilities 22,428 8,060 (45,963) (54,344) 81,815 (10,433) (55,725) (32,546) (52,133) 37,765 (102,639) Cash Available For Distribution (CAFD) 170,568 43,031 46,706 42,728 39,082 171,547 45,119 49,382 45,729 50,045 190,275 Dividends declared1 111,241 32,070 34,074 36,078 37,080 139,302 39,625 40,641 41,657 41,657 163,579 # of shares at the end of the period 100,217,260 100,217,260 100,217,260 100,217,260 100,217,260 100,217,260 100,217,260 101,601,662 101,601,662 101,601,662 101,601,662 DPS (in $ per share) 1.11 0.32 0.34 0.36 0.37 1.39 0.39 0.40 0.41 0.41 1.61 Project debt 5,475.2 5,533.8 5,218.8 5,214.7 5,091.1 5,091.1 5,076.4 4,997.4 4,931.3 4,852.3 4,852.3 Project cash (520.9) (604.5) (504.9) (609.6) (524.8) (524.8) (546.7) (469.0) (568.5) (496.8) (496.8) Net project debt 4,954.3 4,929.3 4,713.9 4,605.1 4,566.3 4,566.3 4,529.6 4,528.4 4,362.8 4,355.6 4,355.6 Corporate debt 643.1 657.3 639.0 641.8 684.1 684.1 697.5 689.6 686.4 723.8 723.8 Corporate cash (148.5) (151.4) (152.3) (135.1) (106.7) (106.7) (107.9) (107.0) (73.2) (66) (66) Net corporate debt 494.6 505.9 486.8 506.7 577.4 577.4 589.7 582.6 613.2 657.8 657.8 Total net debt 5,448.9 5,435.2 5,200.6 5,111.8 5,143.6 5,143.6 5.119.3 5,111.0 4,976.0 5,013.3 5,013.3 Net Corporate Debt/CAFD pre corporate interests2 2.3x 2.3x 2.2x 2.3x 2.7x 2.7x 2.5x 2.5x 2.7x 2.9x 2.9x
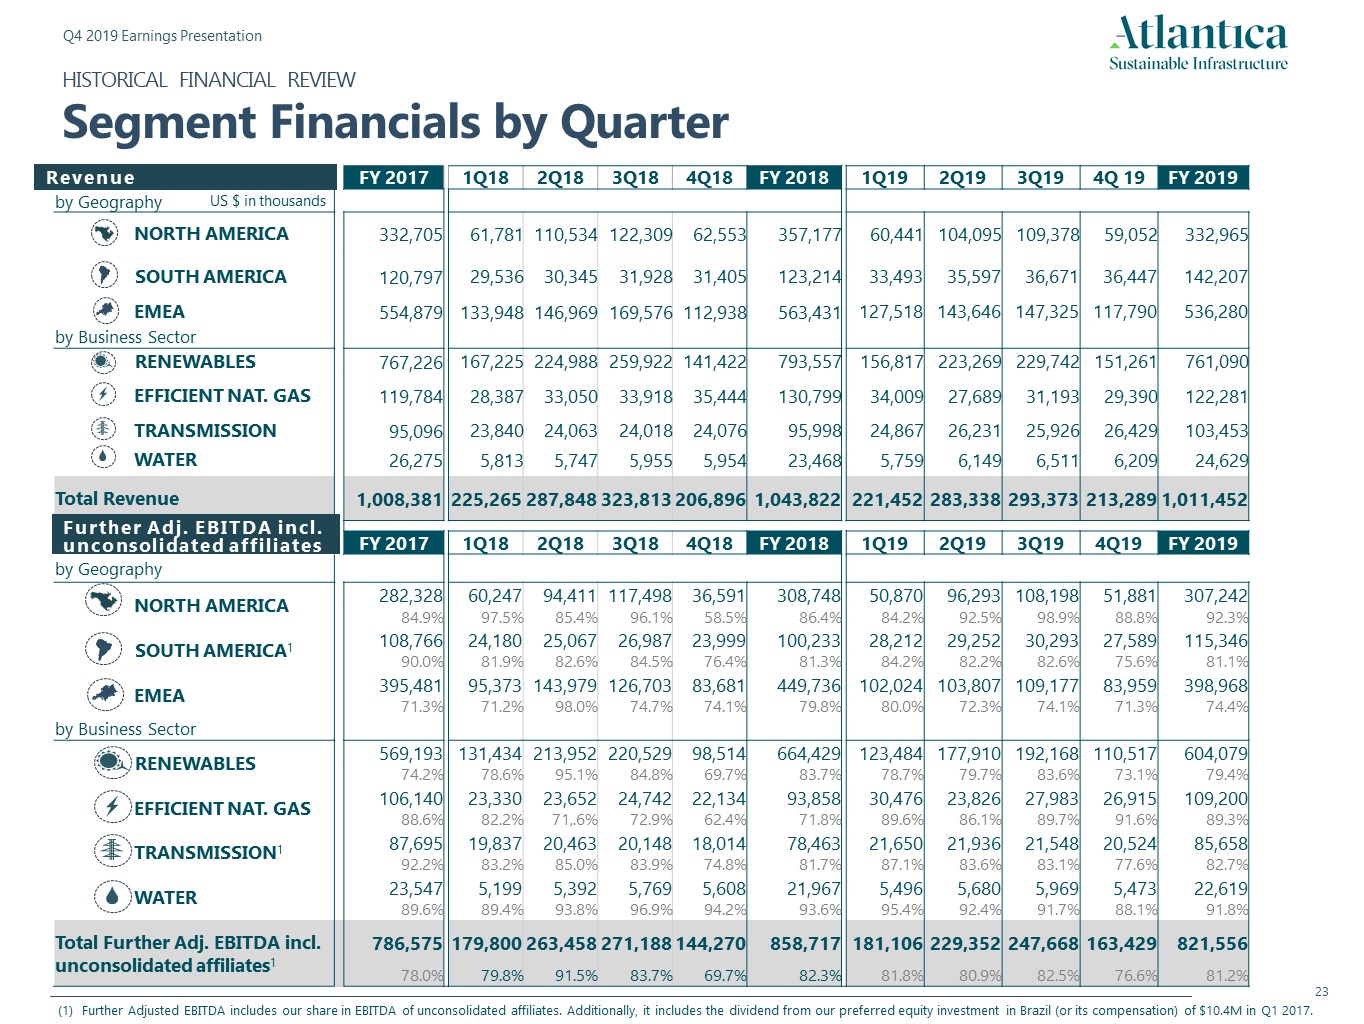
HISTORICAL FINANCIAL REVIEWSegment Financials by Quarter FY 2017 1Q18 2Q18 3Q18 4Q18 FY 2018 1Q19 2Q19 3Q19 4Q 19 FY 2019 by Geography NORTH AMERICA 332,705 61,781 110,534 122,309 62,553 357,177 60,441 104,095 109,378 59,052 332,965 SOUTH AMERICA 120,797 29,536 30,345 31,928 31,405 123,214 33,493 35,597 36,671 36,447 142,207 EMEA 554,879 133,948 146,969 169,576 112,938 563,431 127,518 143,646 147,325 117,790 536,280 by Business Sector RENEWABLES 767,226 167,225 224,988 259,922 141,422 793,557 156,817 223,269 229,742 151,261 761,090 EFFICIENT NAT. GAS 119,784 28,387 33,050 33,918 35,444 130,799 34,009 27,689 31,193 29,390 122,281 TRANSMISSION 95,096 23,840 24,063 24,018 24,076 95,998 24,867 26,231 25,926 26,429 103,453 WATER 26,275 5,813 5,747 5,955 5,954 23,468 5,759 6,149 6,511 6,209 24,629 Total Revenue 1,008,381 225,265 287,848 323,813 206,896 1,043,822 221,452 283,338 293,373 213,289 1,011,452 FY 2017 1Q18 2Q18 3Q18 4Q18 FY 2018 1Q19 2Q19 3Q19 4Q19 FY 2019 by Geography NORTH AMERICA 282,328 60,247 94,411 117,498 36,591 308,748 50,870 96,293 108,198 51,881 307,242 84.9% 97.5% 85.4% 96.1% 58.5% 86.4% 84.2% 92.5% 98.9% 88.8% 92.3% SOUTH AMERICA1 108,766 24,180 25,067 26,987 23,999 100,233 28,212 29,252 30,293 27,589 115,346 90.0% 81.9% 82.6% 84.5% 76.4% 81.3% 84.2% 82.2% 82.6% 75.6% 81.1% EMEA 395,481 95,373 143,979 126,703 83,681 449,736 102,024 103,807 109,177 83,959 398,968 71.3% 71.2% 98.0% 74.7% 74.1% 79.8% 80.0% 72.3% 74.1% 71.3% 74.4% by Business Sector RENEWABLES 569,193 131,434 213,952 220,529 98,514 664,429 123,484 177,910 192,168 110,517 604,079 74.2% 78.6% 95.1% 84.8% 69.7% 83.7% 78.7% 79.7% 83.6% 73.1% 79.4% EFFICIENT NAT. GAS 106,140 23,330 23,652 24,742 22,134 93,858 30,476 23,826 27,983 26,915 109,200 88.6% 82.2% 71,.6% 72.9% 62.4% 71.8% 89.6% 86.1% 89.7% 91.6% 89.3% TRANSMISSION1 87,695 19,837 20,463 20,148 18,014 78,463 21,650 21,936 21,548 20,524 85,658 92.2% 83.2% 85.0% 83.9% 74.8% 81.7% 87.1% 83.6% 83.1% 77.6% 82.7% WATER 23,547 5,199 5,392 5,769 5,608 21,967 5,496 5,680 5,969 5,473 22,619 89.6% 89.4% 93.8% 96.9% 94.2% 93.6% 95.4% 92.4% 91.7% 88.1% 91.8% Total Further Adj. EBITDA incl. unconsolidated affiliates1 786,575 179,800 263,458 271,188 144,270 858,717 181,106 229,352 247,668 163,429 821,556 78.0% 79.8% 91.5% 83.7% 69.7% 82.3% 81.8% 80.9% 82.5% 76.6% 81.2% US $ in thousands Revenue Further Adj. EBITDA incl. unconsolidated affiliates Further Adjusted EBITDA includes our share in EBITDA of unconsolidated affiliates. Additionally, it includes the dividend from our preferred equity investment in Brazil (or its compensation) of $10.4M in Q1 2017.
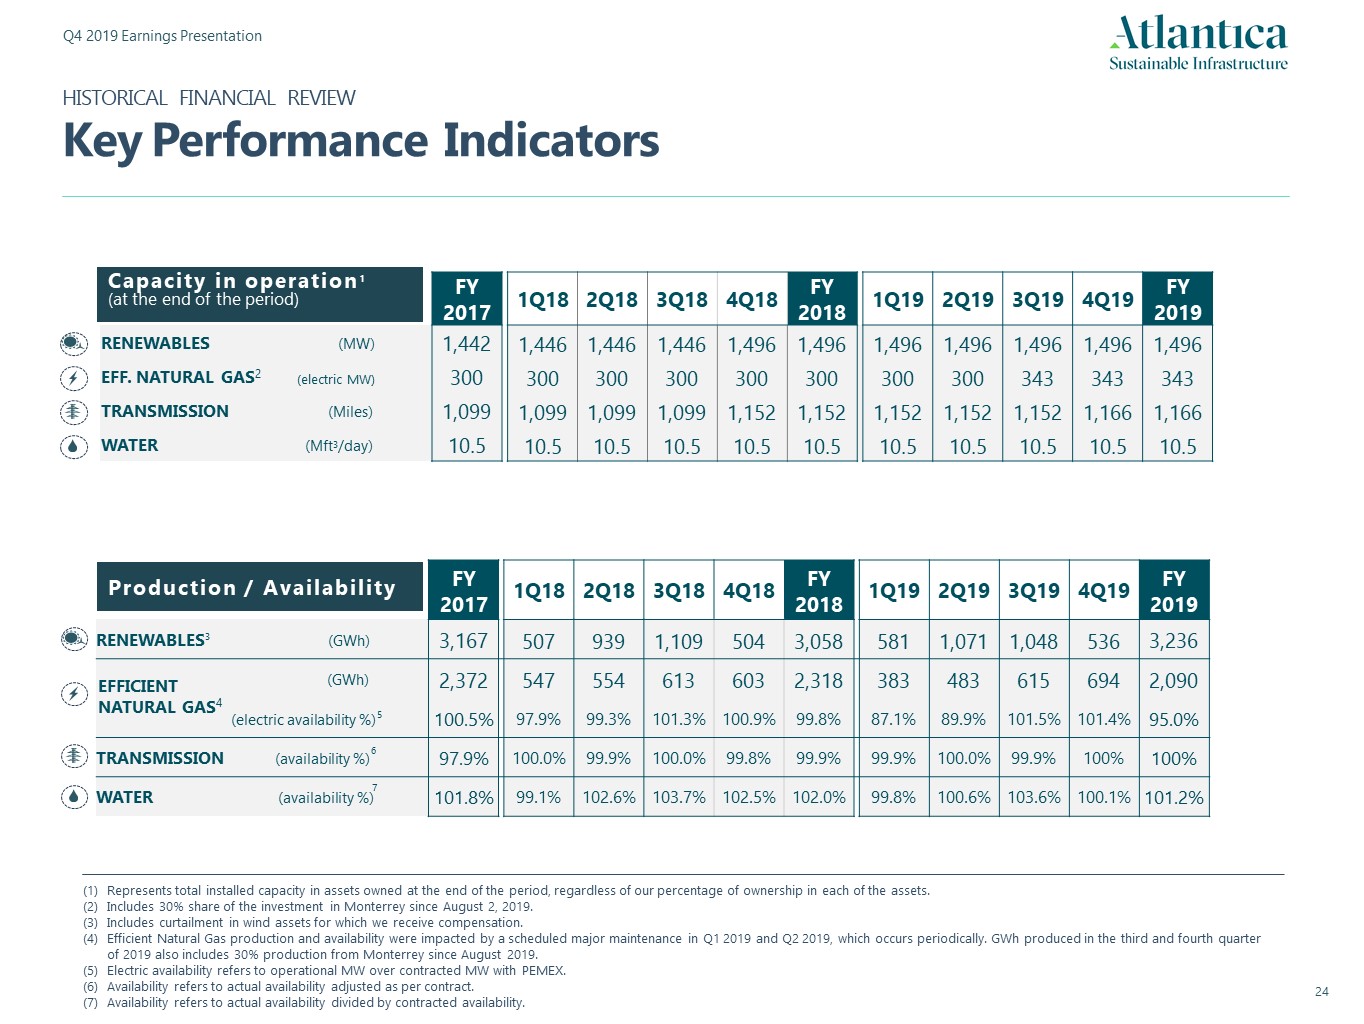
FY 2017 1Q18 2Q18 3Q18 4Q18 FY 2018 1Q19 2Q19 3Q19 4Q19 FY 2019 RENEWABLES3 (GWh) 3,167 507 939 1,109 504 3,058 581 1,071 1,048 536 3,236 (GWh) 2,372 547 554 613 603 2,318 383 483 615 694 2,090 (electric availability %) 100.5% 97.9% 99.3% 101.3% 100.9% 99.8% 87.1% 89.9% 101.5% 101.4% 95.0% TRANSMISSION (availability %) 97.9% 100.0% 99.9% 100.0% 99.8% 99.9% 99.9% 100.0% 99.9% 100% 100% WATER (availability %) 101.8% 99.1% 102.6% 103.7% 102.5% 102.0% 99.8% 100.6% 103.6% 100.1% 101.2% FY 2017 1Q18 2Q18 3Q18 4Q18 FY 2018 1Q19 2Q19 3Q19 4Q19 FY 2019 RENEWABLES (MW) 1,442 1,446 1,446 1,446 1,496 1,496 1,496 1,496 1,496 1,496 1,496 EFF. NATURAL GAS2 (electric MW) 300 300 300 300 300 300 300 300 343 343 343 TRANSMISSION (Miles) 1,099 1,099 1,099 1,099 1,152 1,152 1,152 1,152 1,152 1,166 1,166 WATER (Mft3/day) 10.5 10.5 10.5 10.5 10.5 10.5 10.5 10.5 10.5 10.5 10.5 Capacity in operation1(at the end of the period) Production / Availability HISTORICAL FINANCIAL REVIEWKey Performance Indicators 5 6 7 Represents total installed capacity in assets owned at the end of the period, regardless of our percentage of ownership in each of the assets.Includes 30% share of the investment in Monterrey since August 2, 2019.Includes curtailment in wind assets for which we receive compensation.Efficient Natural Gas production and availability were impacted by a scheduled major maintenance in Q1 2019 and Q2 2019, which occurs periodically. GWh produced in the third and fourth quarter of 2019 also includes 30% production from Monterrey since August 2019.Electric availability refers to operational MW over contracted MW with PEMEX. Availability refers to actual availability adjusted as per contract.Availability refers to actual availability divided by contracted availability. EFFICIENT NATURAL GAS4
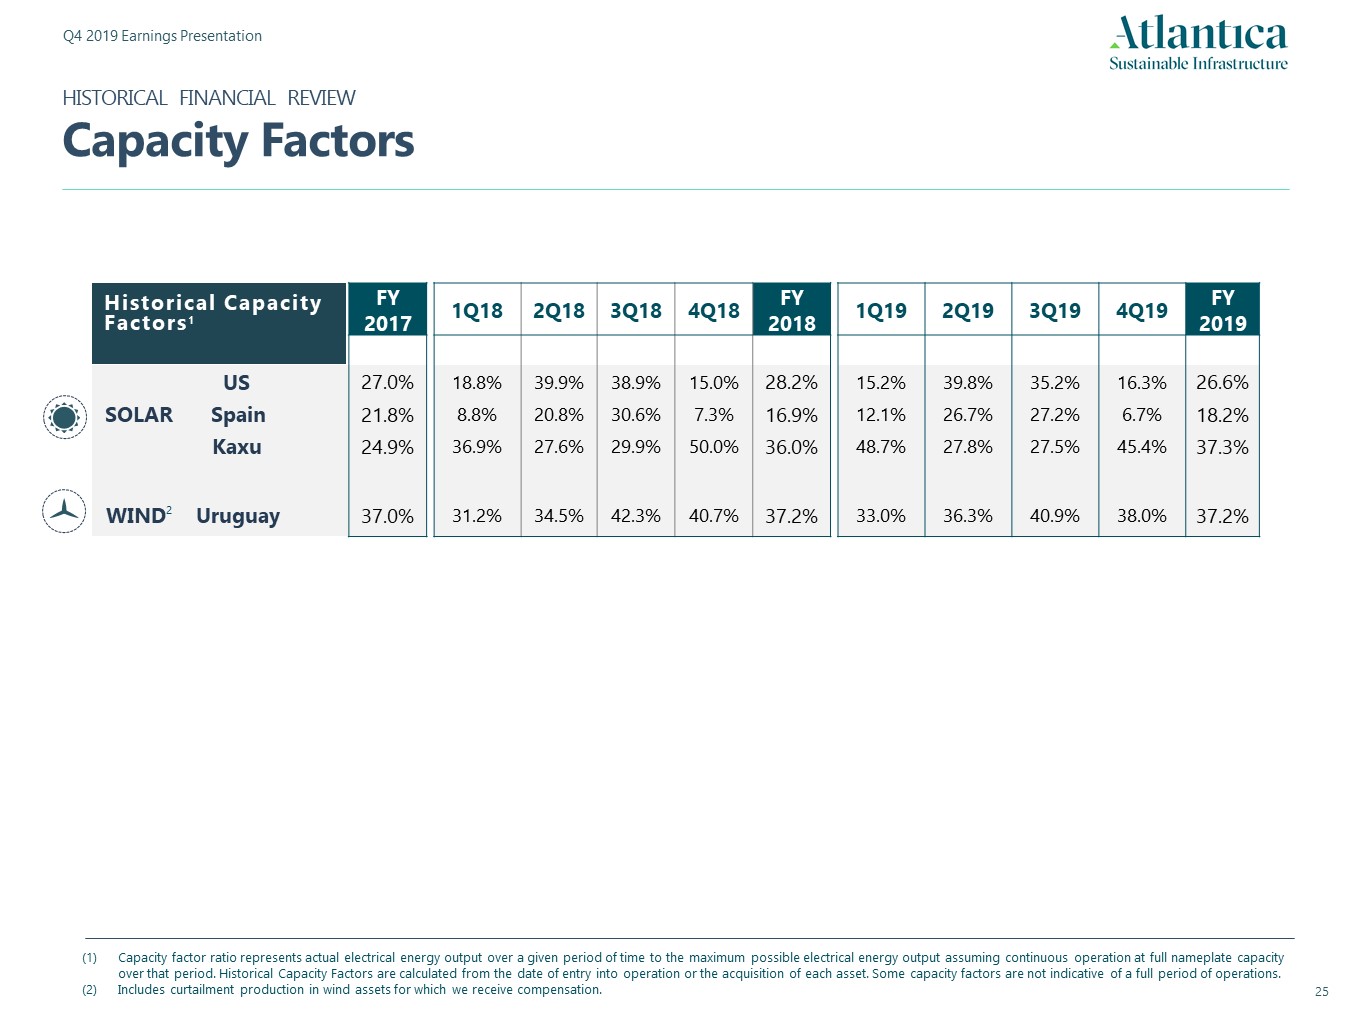
FY 2017 1Q18 2Q18 3Q18 4Q18 FY 2018 1Q19 2Q19 3Q19 4Q19 FY 2019 US 27.0% 18.8% 39.9% 38.9% 15.0% 28.2% 15.2% 39.8% 35.2% 16.3% 26.6% Spain 21.8% 8.8% 20.8% 30.6% 7.3% 16.9% 12.1% 26.7% 27.2% 6.7% 18.2% Kaxu 24.9% 36.9% 27.6% 29.9% 50.0% 36.0% 48.7% 27.8% 27.5% 45.4% 37.3% WIND2 Uruguay 37.0% 31.2% 34.5% 42.3% 40.7% 37.2% 33.0% 36.3% 40.9% 38.0% 37.2% SOLAR Historical Capacity Factors1 HISTORICAL FINANCIAL REVIEWCapacity Factors Capacity factor ratio represents actual electrical energy output over a given period of time to the maximum possible electrical energy output assuming continuous operation at full nameplate capacity over that period. Historical Capacity Factors are calculated from the date of entry into operation or the acquisition of each asset. Some capacity factors are not indicative of a full period of operations.Includes curtailment production in wind assets for which we receive compensation.
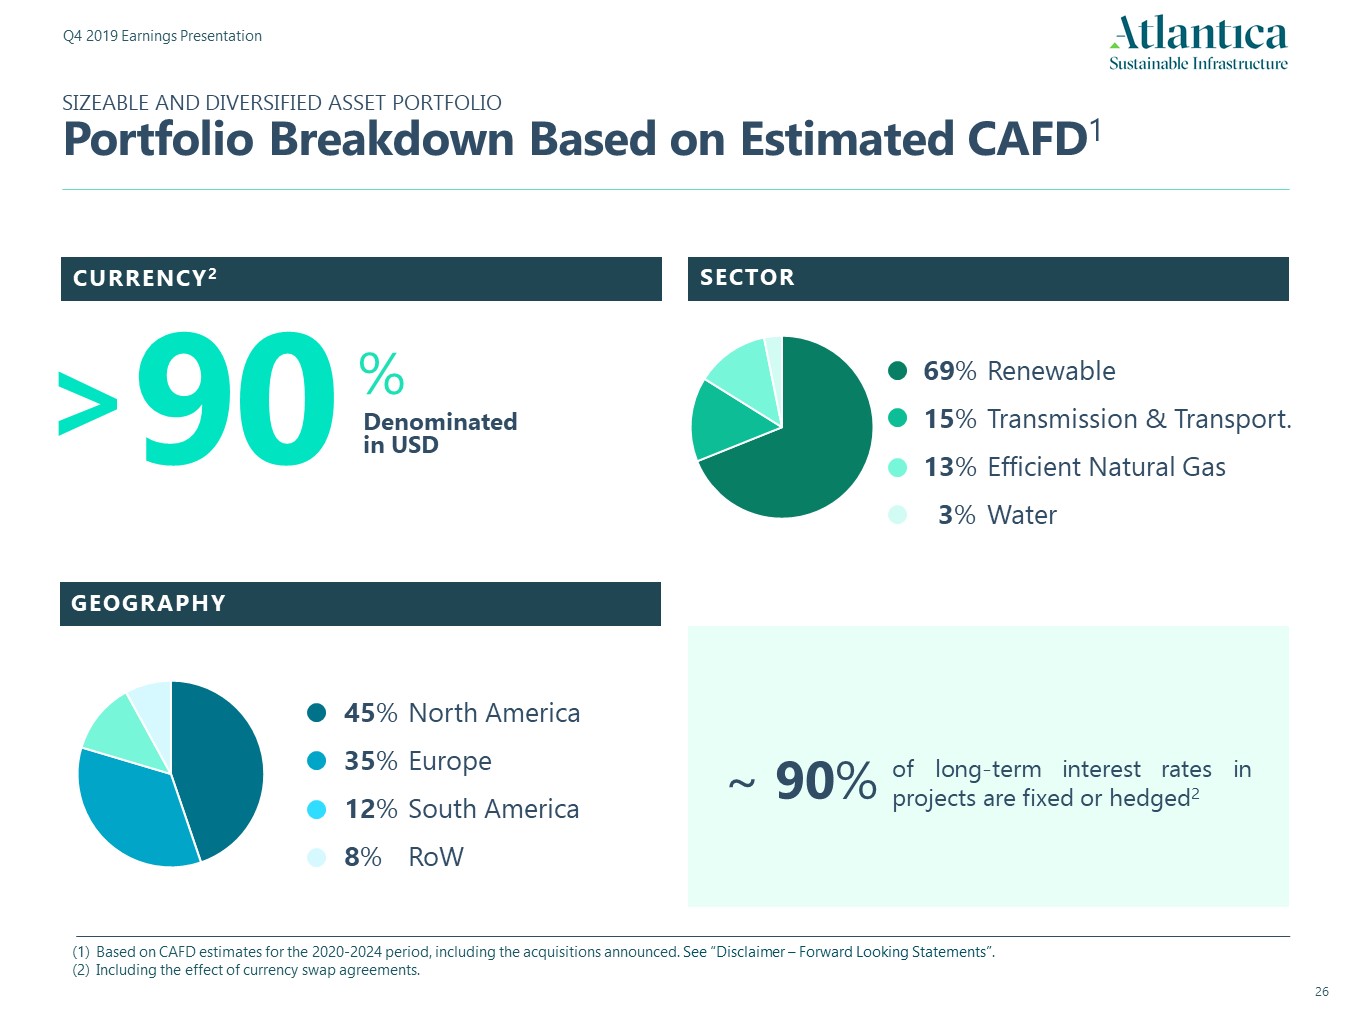
SIZEABLE AND DIVERSIFIED ASSET PORTFOLIOPortfolio Breakdown Based on Estimated CAFD1 CURRENCY2 SECTOR GEOGRAPHY Based on CAFD estimates for the 2020-2024 period, including the acquisitions announced. See “Disclaimer – Forward Looking Statements”.Including the effect of currency swap agreements. of long-term interest rates in projects are fixed or hedged2 ~ 90% 90 Denominatedin USD % > 69% Renewable15% Transmission & Transport.13% Efficient Natural Gas 3% Water 45% North America35% Europe12% South America8% RoW
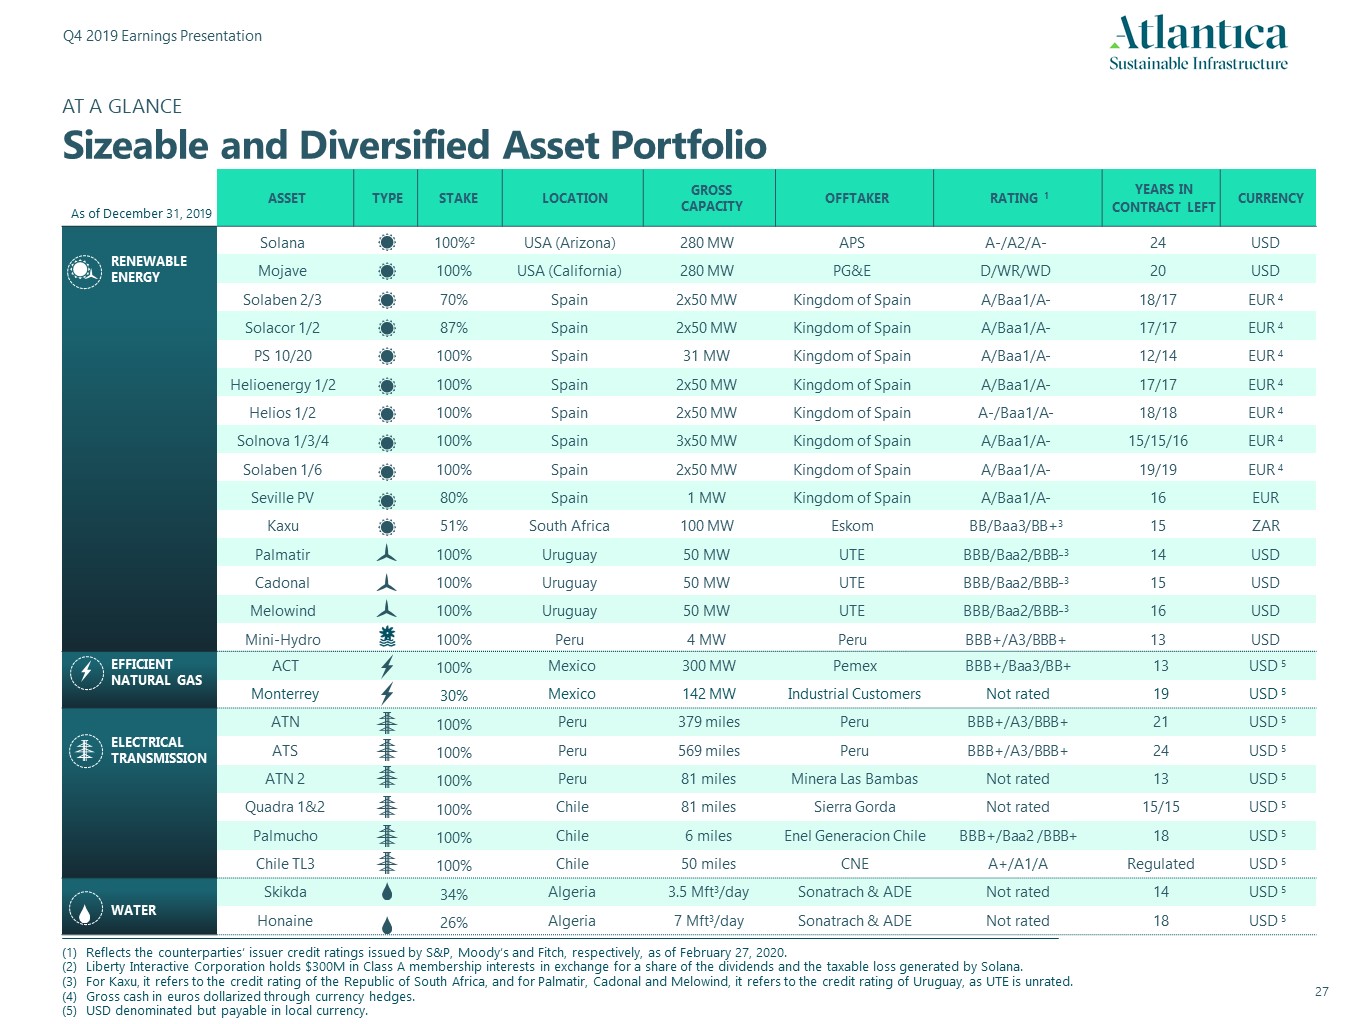
AT A GLANCESizeable and Diversified Asset Portfolio As of December 31, 2019 ASSET TYPE STAKE LOCATION GROSSCAPACITY OFFTAKER RATING 1 YEARS INCONTRACT LEFT CURRENCY RENEWABLE ENERGY Solana 100%2 USA (Arizona) 280 MW APS A-/A2/A- 24 USD Mojave 100% USA (California) 280 MW PG&E D/WR/WD 20 USD Solaben 2/3 70% Spain 2x50 MW Kingdom of Spain A/Baa1/A- 18/17 EUR 4 Solacor 1/2 87% Spain 2x50 MW Kingdom of Spain A/Baa1/A- 17/17 EUR 4 PS 10/20 100% Spain 31 MW Kingdom of Spain A/Baa1/A- 12/14 EUR 4 Helioenergy 1/2 100% Spain 2x50 MW Kingdom of Spain A/Baa1/A- 17/17 EUR 4 Helios 1/2 100% Spain 2x50 MW Kingdom of Spain A-/Baa1/A- 18/18 EUR 4 Solnova 1/3/4 100% Spain 3x50 MW Kingdom of Spain A/Baa1/A- 15/15/16 EUR 4 Solaben 1/6 100% Spain 2x50 MW Kingdom of Spain A/Baa1/A- 19/19 EUR 4 Seville PV 80% Spain 1 MW Kingdom of Spain A/Baa1/A- 16 EUR Kaxu 51% South Africa 100 MW Eskom BB/Baa3/BB+3 15 ZAR Palmatir 100% Uruguay 50 MW UTE BBB/Baa2/BBB-3 14 USD Cadonal 100% Uruguay 50 MW UTE BBB/Baa2/BBB-3 15 USD Melowind 100% Uruguay 50 MW UTE BBB/Baa2/BBB-3 16 USD Mini-Hydro 100% Peru 4 MW Peru BBB+/A3/BBB+ 13 USD EFFICIENT NATURAL GAS ACT 100% Mexico 300 MW Pemex BBB+/Baa3/BB+ 13 USD 5 Monterrey 30% Mexico 142 MW Industrial Customers Not rated 19 USD 5 ELECTRICAL TRANSMISSION ATN 100% Peru 379 miles Peru BBB+/A3/BBB+ 21 USD 5 ATS 100% Peru 569 miles Peru BBB+/A3/BBB+ 24 USD 5 ATN 2 100% Peru 81 miles Minera Las Bambas Not rated 13 USD 5 Quadra 1&2 100% Chile 81 miles Sierra Gorda Not rated 15/15 USD 5 Palmucho 100% Chile 6 miles Enel Generacion Chile BBB+/Baa2 /BBB+ 18 USD 5 Chile TL3 100% Chile 50 miles CNE A+/A1/A Regulated USD 5 WATER Skikda 34% Algeria 3.5 Mft3/day Sonatrach & ADE Not rated 14 USD 5 Honaine 26% Algeria 7 Mft3/day Sonatrach & ADE Not rated 18 USD 5 Reflects the counterparties’ issuer credit ratings issued by S&P, Moody’s and Fitch, respectively, as of February 27, 2020.Liberty Interactive Corporation holds $300M in Class A membership interests in exchange for a share of the dividends and the taxable loss generated by Solana.For Kaxu, it refers to the credit rating of the Republic of South Africa, and for Palmatir, Cadonal and Melowind, it refers to the credit rating of Uruguay, as UTE is unrated.Gross cash in euros dollarized through currency hedges.USD denominated but payable in local currency.
NON-GAAP FINANCIAL INFORMATIONReconciliation of Non-GAAP Measures Our management believes Further Adjusted EBITDA including unconsolidated affiliates and CAFD are useful to investors and other users of our financial statements in evaluating our operating performance because it provides them with an additional tool to compare business performance across companies and across periods. Further Adjusted EBITDA is widely used by investors to measure a company’s operating performance without regard to items such as interest expense, taxes, depreciation and amortization, which can vary substantially from company to company depending upon accounting methods and book value of assets, capital structure and the method by which assets were acquired. Our management believes CAFD is a relevant supplemental measure of the Company’s ability to earn and distribute cash returns to investors and is useful to investors in evaluating our operating performance because securities analysts and other interested parties use such calculations as a measure of our ability to make quarterly distributions. In addition, CAFD is used by our management team for determining future acquisitions and managing our growth. Further Adjusted EBITDA and CAFD are widely used by other companies in the same industry. Our management uses Further Adjusted EBITDA and CAFD as measures of operating performance to assist in comparing performance from period to period on a consistent basis. They also readily view operating trends as a measure for planning and forecasting overall expectations, for evaluating actual results against such expectations, and for communicating with our board of directors, shareholders, creditors, analysts and investors concerning our financial performance.We present non-GAAP financial measures because we believe that they and other similar measures are widely used by certain investors, securities analysts and other interested parties as supplemental measures of performance and liquidity. The non-GAAP financial measures may not be comparable to other similarly titled measures employed by other companies and they may have limitations as analytical tools. These measures may not be fit for isolated consideration or as a substitute for analysis of our operating results as reported under IFRS as issued by the IASB. Non-GAAP financial measures and ratios are not measurements of our performance or liquidity under IFRS as issued by the IASB. Thus, they should not be considered as alternatives to operating profit, profit for the period, any other performance measures derived in accordance with IFRS as issued by the IASB, any other generally accepted accounting principles or as alternatives to cash flow from operating, investing or financing activities. Some of the limitations of these non-GAAP measures are:they do not reflect our cash expenditures, future requirements for capital expenditures or contractual commitments; they do not reflect changes in, or cash requirements for, our working capital needs;they may not reflect the significant interest expense, or the cash requirements necessary, to service interest or principal payments, on our debts;although depreciation and amortization are non-cash charges, the assets being depreciated and amortized will often need to be replaced in the future and Further Adjusted EBITDA and CAFD do not reflect any cash requirements that would be required for such replacements;some of the exceptional items that we eliminate in calculating Further Adjusted EBITDA reflect cash payments that were made, or will be made in the future; andthe fact that other companies in our industry may calculate Further Adjusted EBITDA and CAFD differently than we do, which limits their usefulness as comparative measures.
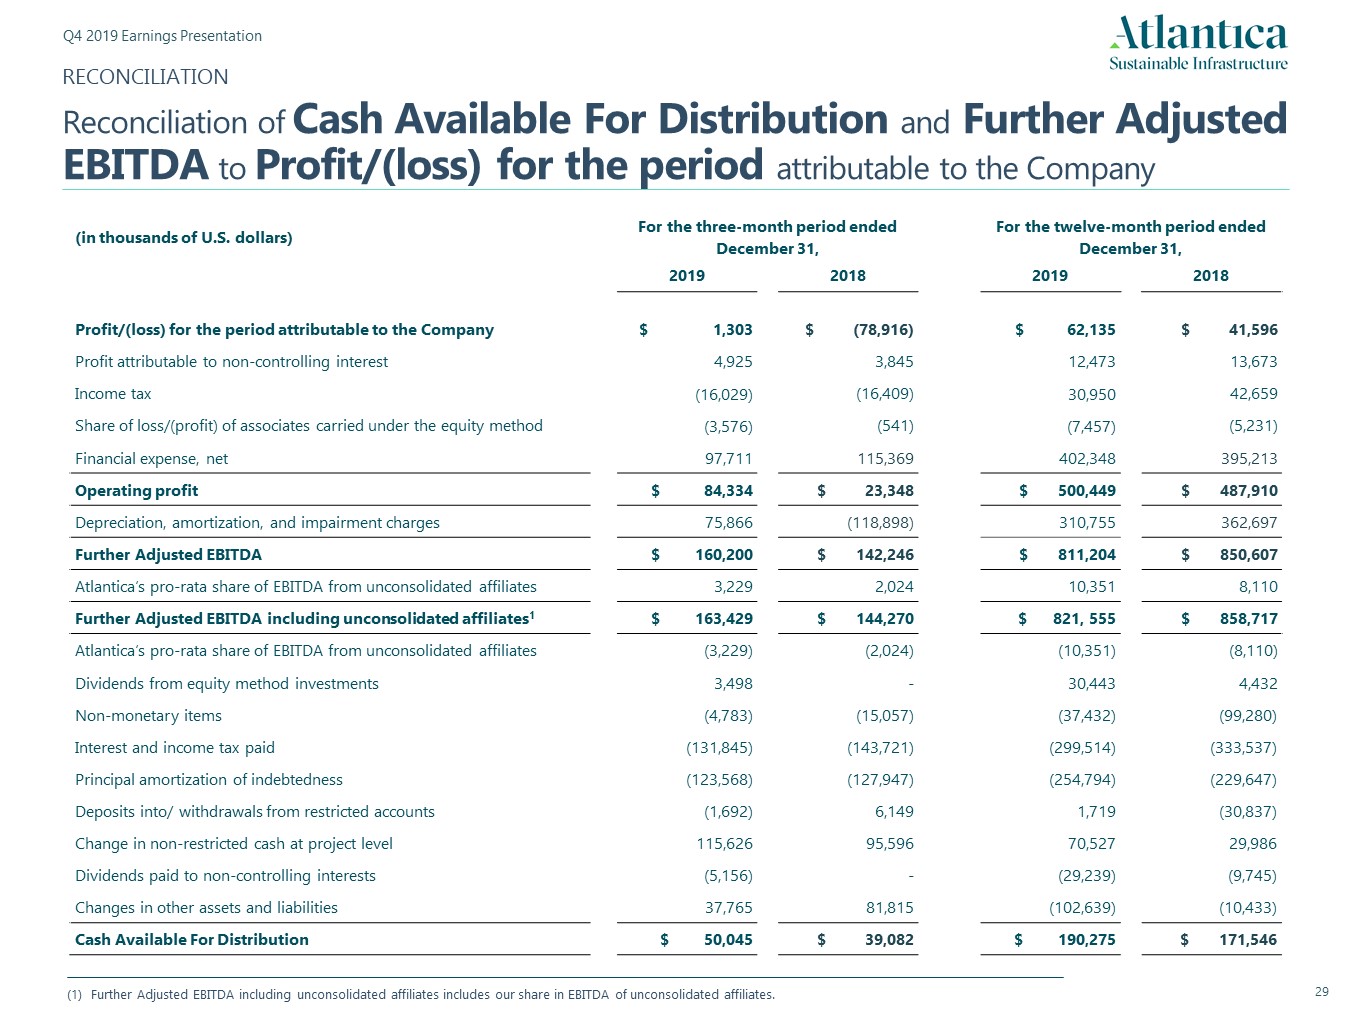
RECONCILIATIONReconciliation of Cash Available For Distribution and Further Adjusted EBITDA to Profit/(loss) for the period attributable to the Company (in thousands of U.S. dollars) For the three-month period ended December 31, For the twelve-month period ended December 31, 2019 2018 2019 2018 Profit/(loss) for the period attributable to the Company $ 1,303 $ (78,916) $ 62,135 $ 41,596 Profit attributable to non-controlling interest 4,925 3,845 12,473 13,673 Income tax (16,029) (16,409) 30,950 42,659 Share of loss/(profit) of associates carried under the equity method (3,576) (541) (7,457) (5,231) Financial expense, net 97,711 115,369 402,348 395,213 Operating profit $ 84,334 $ 23,348 $ 500,449 $ 487,910 Depreciation, amortization, and impairment charges 75,866 (118,898) 310,755 362,697 Further Adjusted EBITDA $ 160,200 $ 142,246 $ 811,204 $ 850,607 Atlantica’s pro-rata share of EBITDA from unconsolidated affiliates 3,229 2,024 10,351 8,110 Further Adjusted EBITDA including unconsolidated affiliates1 $ 163,429 $ 144,270 $ 821, 555 $ 858,717 Atlantica’s pro-rata share of EBITDA from unconsolidated affiliates (3,229) (2,024) (10,351) (8,110) Dividends from equity method investments 3,498 - 30,443 4,432 Non-monetary items (4,783) (15,057) (37,432) (99,280) Interest and income tax paid (131,845) (143,721) (299,514) (333,537) Principal amortization of indebtedness (123,568) (127,947) (254,794) (229,647) Deposits into/ withdrawals from restricted accounts (1,692) 6,149 1,719 (30,837) Change in non-restricted cash at project level 115,626 95,596 70,527 29,986 Dividends paid to non-controlling interests (5,156) - (29,239) (9,745) Changes in other assets and liabilities 37,765 81,815 (102,639) (10,433) Cash Available For Distribution $ 50,045 $ 39,082 $ 190,275 $ 171,546 Further Adjusted EBITDA including unconsolidated affiliates includes our share in EBITDA of unconsolidated affiliates.
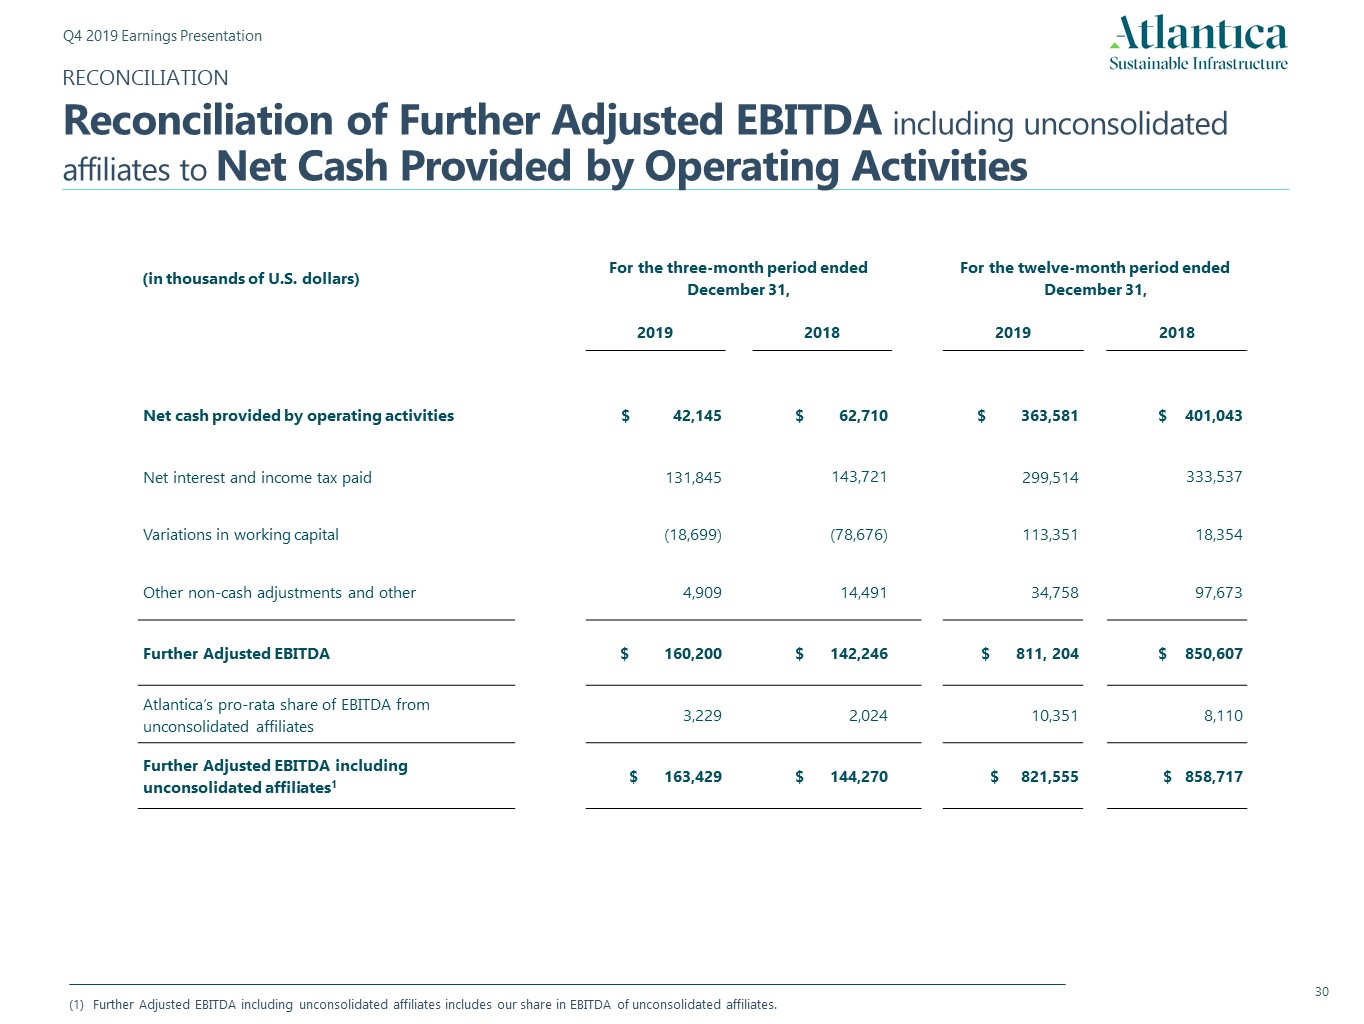
RECONCILIATIONReconciliation of Further Adjusted EBITDA including unconsolidated affiliates to Net Cash Provided by Operating Activities (in thousands of U.S. dollars) For the three-month period ended December 31, For the twelve-month period ended December 31, 2019 2018 2019 2018 Net cash provided by operating activities $ 42,145 $ 62,710 $ 363,581 $ 401,043 Net interest and income tax paid 131,845 143,721 299,514 333,537 Variations in working capital (18,699) (78,676) 113,351 18,354 Other non-cash adjustments and other 4,909 14,491 34,758 97,673 Further Adjusted EBITDA $ 160,200 $ 142,246 $ 811, 204 $ 850,607 Atlantica’s pro-rata share of EBITDA from unconsolidated affiliates 3,229 2,024 10,351 8,110 Further Adjusted EBITDA including unconsolidated affiliates1 $ 163,429 $ 144,270 $ 821,555 $ 858,717 Further Adjusted EBITDA including unconsolidated affiliates includes our share in EBITDA of unconsolidated affiliates.
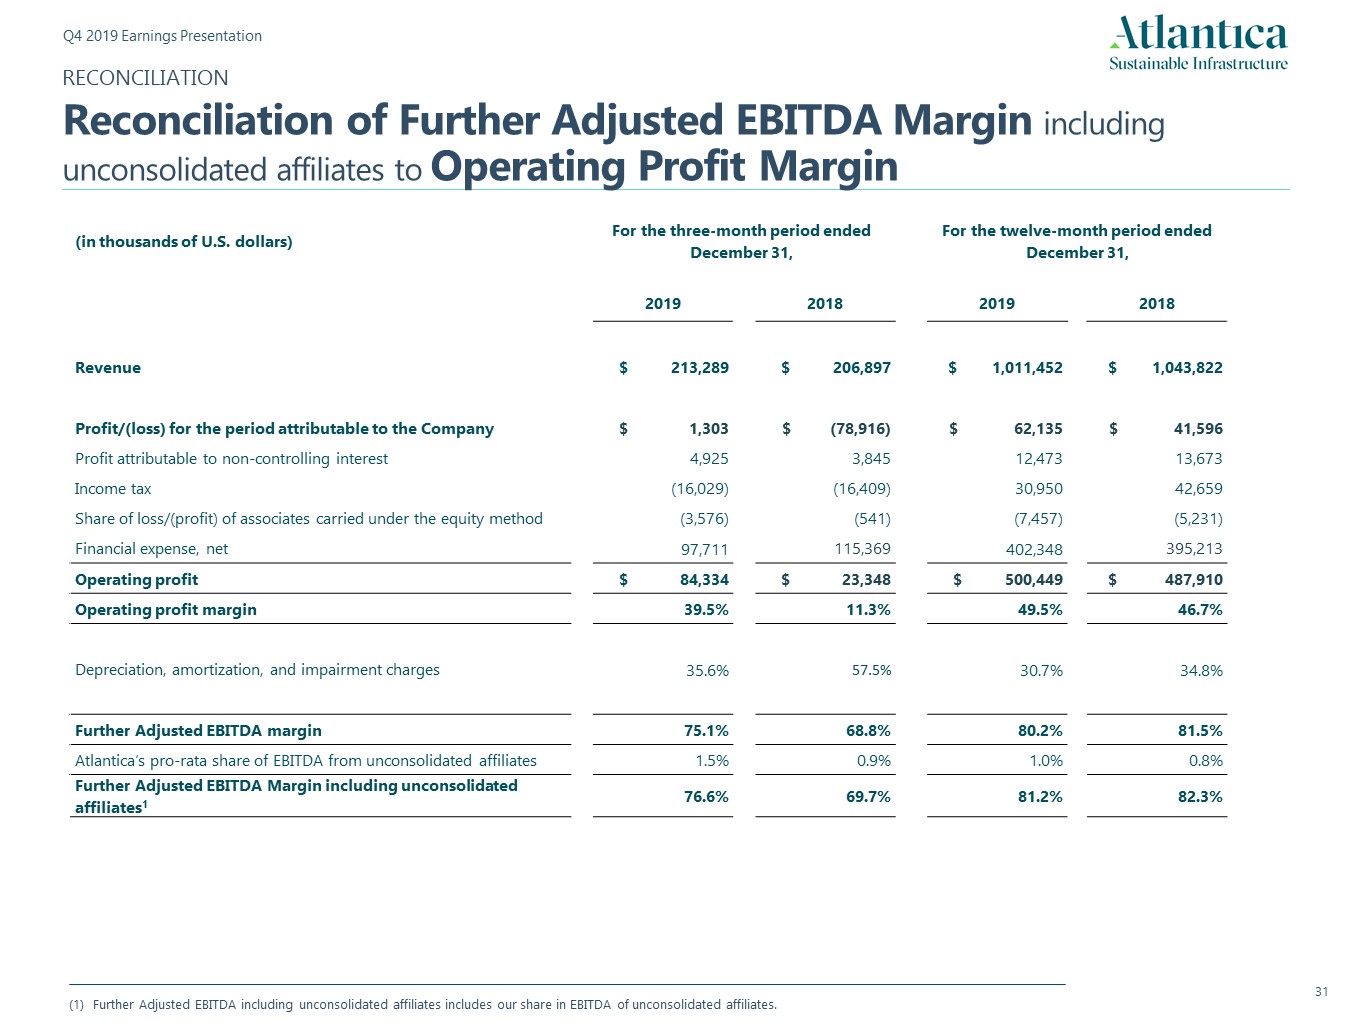
RECONCILIATIONReconciliation of Further Adjusted EBITDA Margin including unconsolidated affiliates to Operating Profit Margin (in thousands of U.S. dollars) For the three-month period ended December 31, For the twelve-month period ended December 31, 2019 2018 2019 2018 Revenue $ 213,289 $ 206,897 $ 1,011,452 $ 1,043,822 Profit/(loss) for the period attributable to the Company $ 1,303 $ (78,916) $ 62,135 $ 41,596 Profit attributable to non-controlling interest 4,925 3,845 12,473 13,673 Income tax (16,029) (16,409) 30,950 42,659 Share of loss/(profit) of associates carried under the equity method (3,576) (541) (7,457) (5,231) Financial expense, net 97,711 115,369 402,348 395,213 Operating profit $ 84,334 $ 23,348 $ 500,449 $ 487,910 Operating profit margin 39.5% 11.3% 49.5% 46.7% Depreciation, amortization, and impairment charges 35.6% 57.5% 30.7% 34.8% Further Adjusted EBITDA margin 75.1% 68.8% 80.2% 81.5% Atlantica’s pro-rata share of EBITDA from unconsolidated affiliates 1.5% 0.9% 1.0% 0.8% Further Adjusted EBITDA Margin including unconsolidated affiliates1 76.6% 69.7% 81.2% 82.3% Further Adjusted EBITDA including unconsolidated affiliates includes our share in EBITDA of unconsolidated affiliates.
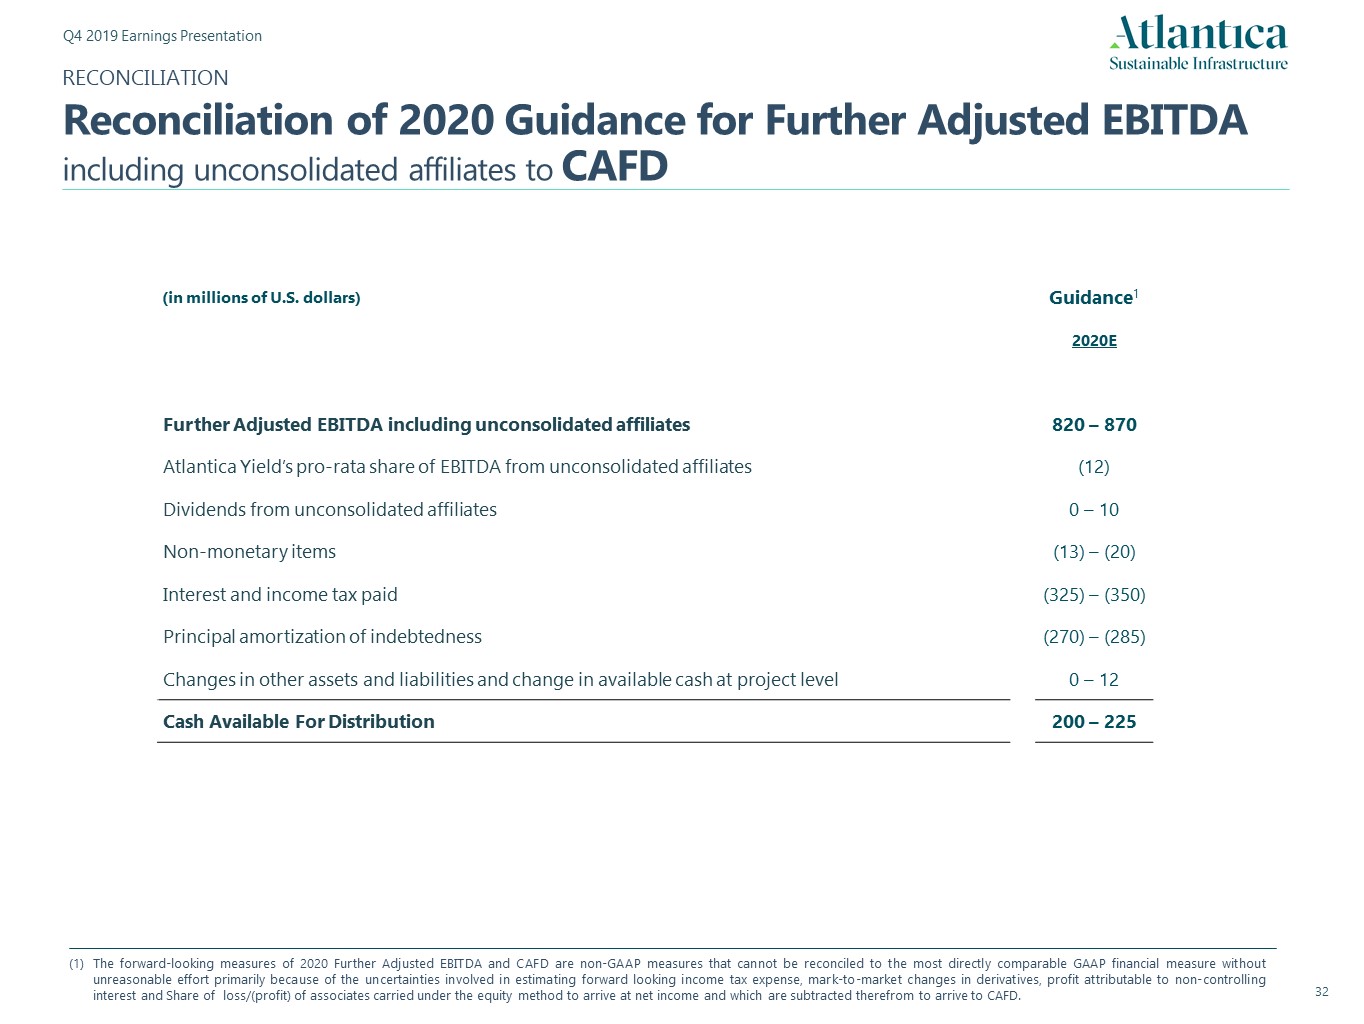
RECONCILIATIONReconciliation of 2020 Guidance for Further Adjusted EBITDA including unconsolidated affiliates to CAFD (in millions of U.S. dollars) Guidance1 2020E Further Adjusted EBITDA including unconsolidated affiliates 820 – 870 Atlantica Yield’s pro-rata share of EBITDA from unconsolidated affiliates (12) Dividends from unconsolidated affiliates 0 – 10 Non-monetary items (13) – (20) Interest and income tax paid (325) – (350) Principal amortization of indebtedness (270) – (285) Changes in other assets and liabilities and change in available cash at project level 0 – 12 Cash Available For Distribution 200 – 225 The forward-looking measures of 2020 Further Adjusted EBITDA and CAFD are non-GAAP measures that cannot be reconciled to the most directly comparable GAAP financial measure without unreasonable effort primarily because of the uncertainties involved in estimating forward looking income tax expense, mark-to-market changes in derivatives, profit attributable to non-controlling interest and Share of loss/(profit) of associates carried under the equity method to arrive at net income and which are subtracted therefrom to arrive to CAFD.
Great West House, GW1, 17th floor,Great West RoadBrentford TW8 9DFLondon (United Kingdom)