UNITED STATES
SECURITIES AND EXCHANGE COMMISSION
Washington, D.C. 20549
FORM 6-K
REPORT OF FOREIGN PRIVATE ISSUER
PURSUANT TO RULE 13a-16 OR 15d-16
UNDER THE SECURITIES EXCHANGE ACT OF 1934
For the month of November, 2020
Commission File Number 001-36487
Atlantica Sustainable Infrastructure plc
(Exact name of Registrant as specified in its charter)
Not applicable
(Translation of Registrant’s name into English)
Great West House, GW1, 17th floor
Great West Road
Brentford, TW8 9DF
United Kingdom
Tel: +44 203 499 0465
Indicate by check mark whether the registrant files or will file annual reports under cover of Form 20-F or Form 40-F:
| ☒ Form 20-F | ☐ Form 40-F |
Indicate by check mark if the registrant is submitting the Form 6-K in paper as permitted by Regulation S-T Rule 101(b)(1): ☐
Indicate by check mark if the registrant is submitting the Form 6-K in paper as permitted by Regulation S-T Rule 101(b)(7): ☐
This Report on Form 6-K is incorporated by reference into the Registration Statement on Form F-3 of the Registrant filed with the Securities and Exchange Commission on August 6, 2018 (File 333-226611).
Q3 2020 Earnings PresentationNovember 6, 2020
DISCLAIMER Forward Looking StatementsThis presentation contains forward-looking statements. These forward-looking statements include, but are not limited to, all statements other than statements of historical facts contained in this presentation, including, without limitation, those regarding our future financial position and results of operations, our strategy, plans, objectives, goals and targets, future developments in the markets in which we operate or are seeking to operate or anticipated regulatory changes in the markets in which we operate or intend to operate. In some cases, you can identify forward-looking statements by terminology such as "aim," "anticipate," "believe," "continue," "could," "estimate," "expect," "forecast," "guidance," "intend," "is likely to," "may," "plan," "potential," "predict," "projected," "should" or "will" or the negative of such terms or other similar expressions or terminology.By their nature, forward-looking statements involve risks and uncertainties because they relate to events and depend on circumstances that may or may not occur in the future. Forward-looking statements speak only as of the date of this presentation and are not guarantees of future performance and are based on numerous assumptions. Our actual results of operations, financial condition and the development of events may differ materially from (and be more negative than) those made in, or suggested by, the forward-looking statements. Except as required by law, we do not undertake any obligation to update any forward-looking statements to reflect events or circumstances after the date hereof or to reflect the occurrence of anticipated or unanticipated events or circumstances.Investors should read the section entitled "Item 3D. Key Information—Risk Factors" and the description of our segments and business sectors in the section entitled "Item 4B. Information on the Company—Business Overview", each in our annual report for the fiscal year ended December 31, 2019 filed on Form 20-F, for a more complete discussion of the risks and factors that could affect us.Forward-looking statements include, but are not limited to, statements relating to: expected amounts, payments and closing timelines for investments; business synergies from investments; equity investment and project growth strategy; accretive investment opportunities; strategic business alternatives to ensure optimal company value; estimated returns and cash available for distribution (“CAFD”) estimates, including from project debt refinancing; net corporate leverage based on CAFD estimates; debt refinancing; ESG initiative improvement; the quality of our long-term contracts; self-amortizing project debt structure and related debt reduction; the use of non-GAAP measures as a useful predicting tool for investors; the possibility to extend asset life; cost improvements from debt refinancing; the impact of COVID-19 and the ongoing economic crisis; dividends; and various other factors, including those factors discussed under “Item 1.A—“Risk Factors” in our Quarterly Report for the nine-month period ended September 30, 2020 furnished on Form 6-K on the date hereof and “Item 3.D—Risk Factors” and “Item 5.A—Operating Results” in our Annual Report for the fiscal year ended December 31, 2019 filed on Form 20-F.The CAFD and other guidance incorporated into this presentation are estimates as of February 27, 2020. These estimates are based on assumptions believed to be reasonable as of the date Atlantica published its FY 2019 Financial Results. Atlantica disclaims any current intention to update such guidance, except as required by law. Non-GAAP Financial Information This presentation also includes certain non-GAAP financial measures, including Adjusted EBITDA including unconsolidated affiliates, Adjusted EBITDA including unconsolidated affiliates as a percentage of revenues (margin) and CAFD. Non-GAAP financial measures are not measurements of our performance or liquidity under IFRS as issued by IASB and should not be considered alternatives to operating profit or profit for the period or any other performance measures derived in accordance with IFRS as issued by the IASB or any other generally accepted accounting principles or as alternatives to cash flow from operating, investing or financing activities. Please refer to the appendix of this presentation for a reconciliation of the non-GAAP financial measures included in this presentation to the most directly comparable financial measures prepared in accordance with IFRS as well as the reasons why management believes the use of non-GAAP financial measures (including CAFD and Adjusted EBITDA) in this presentation provides useful information to investors.In our discussion of operating results, we have included foreign exchange impacts in our revenue and Adjusted EBITDA including unconsolidated affiliates by providing constant currency growth. The constant currency presentation is not a measure recognized under IFRS and excludes the impact of fluctuations in foreign currency exchange rates. We believe providing constant currency information provides valuable supplemental information regarding our results of operations. We calculate constant currency amounts by converting our current period local currency revenue and Adjusted EBITDA using the prior period foreign currency average exchange rates and comparing these adjusted amounts to our prior period reported results. This calculation may differ from similarly titled measures used by others and, accordingly, the constant currency presentation is not meant to substitute for recorded amounts presented in conformity with IFRS as issued by the IASB nor should such amounts be considered in isolation.
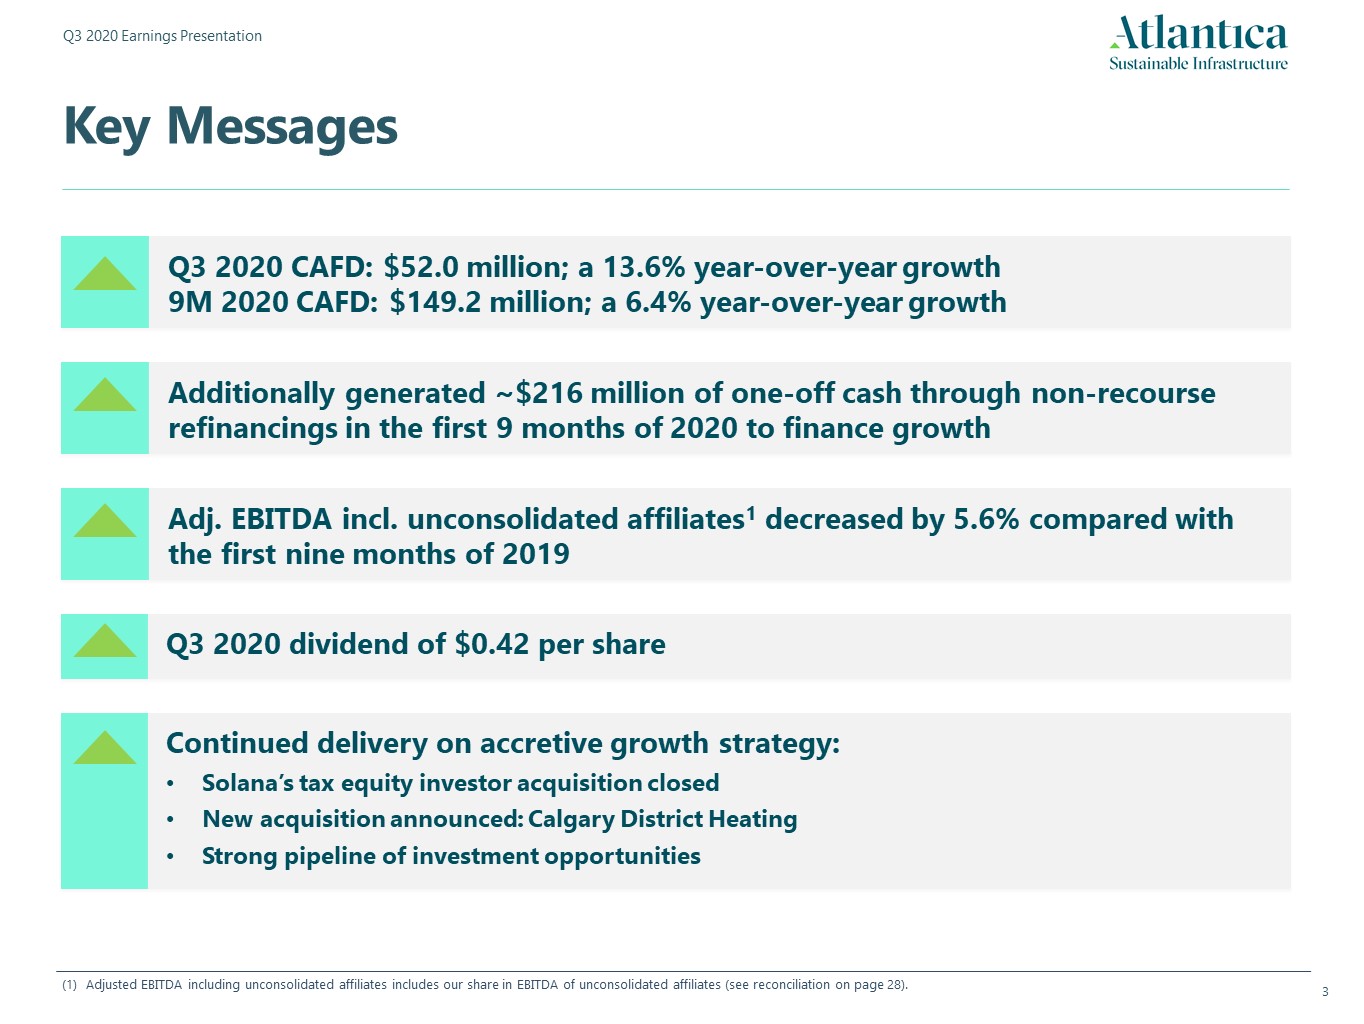
Key Messages Adjusted EBITDA including unconsolidated affiliates includes our share in EBITDA of unconsolidated affiliates (see reconciliation on page 28). Q3 2020 dividend of $0.42 per share Additionally generated ~$216 million of one-off cash through non-recourse refinancings in the first 9 months of 2020 to finance growth Q3 2020 CAFD: $52.0 million; a 13.6% year-over-year growth 9M 2020 CAFD: $149.2 million; a 6.4% year-over-year growth Adj. EBITDA incl. unconsolidated affiliates1 decreased by 5.6% compared with the first nine months of 2019 Continued delivery on accretive growth strategy:Solana’s tax equity investor acquisition closedNew acquisition announced: Calgary District HeatingStrong pipeline of investment opportunities
1. Financial Results Sustainable Infrastructure
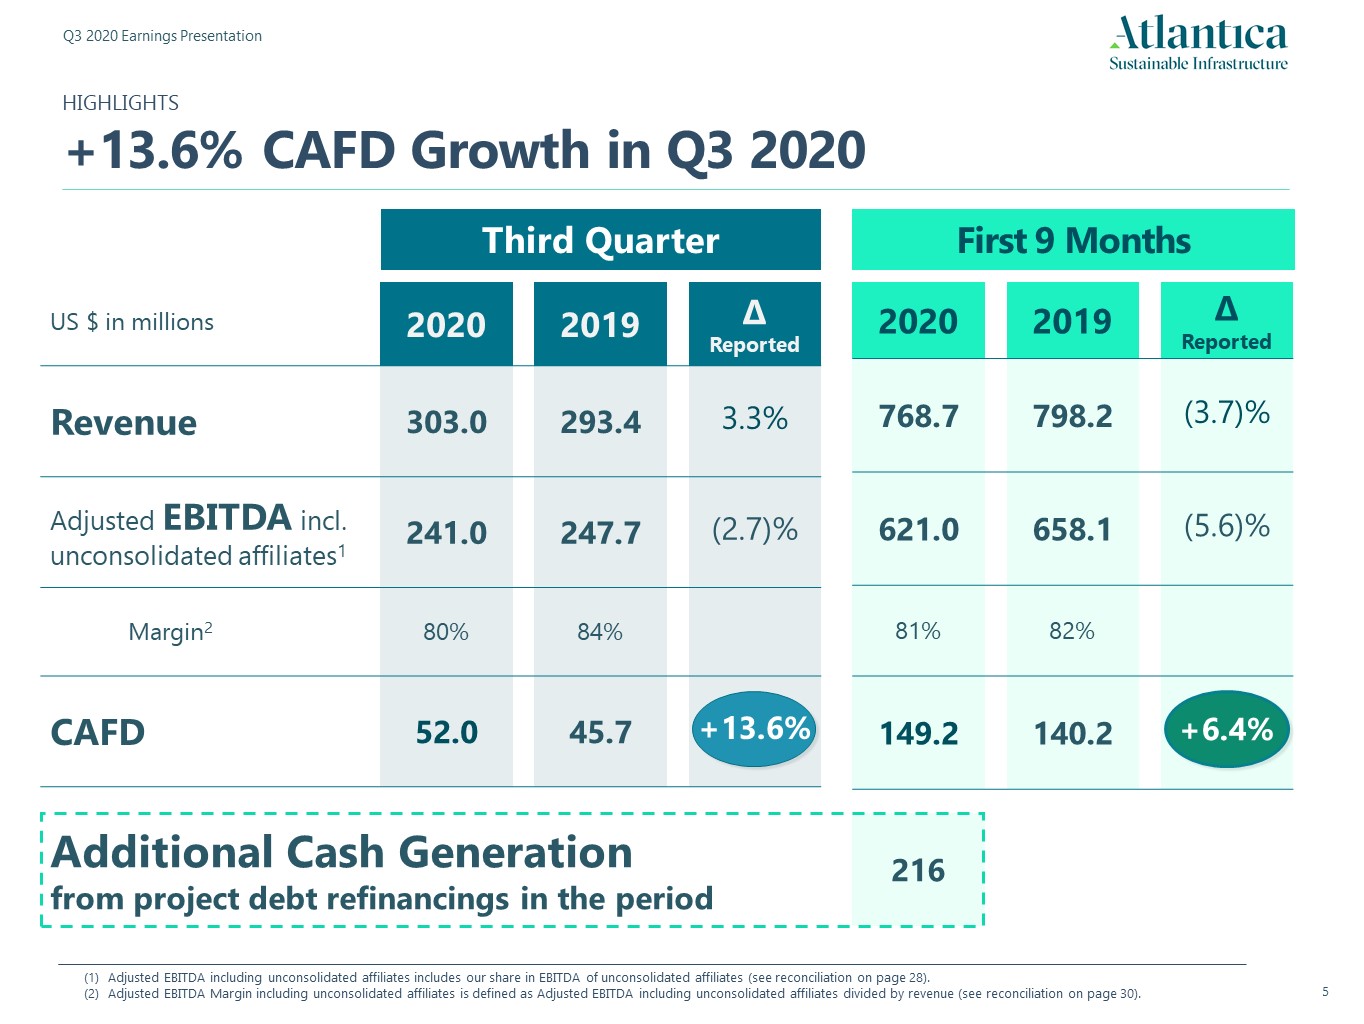
2020 2019 ∆ Reported 768.7 798.2 (3.7)% 621.0 658.1 (5.6)% 81% 82% 149.2 140.2 +6.4% 216 Third Quarter HIGHLIGHTS+13.6% CAFD Growth in Q3 2020 Adjusted EBITDA including unconsolidated affiliates includes our share in EBITDA of unconsolidated affiliates (see reconciliation on page 28).Adjusted EBITDA Margin including unconsolidated affiliates is defined as Adjusted EBITDA including unconsolidated affiliates divided by revenue (see reconciliation on page 30). First 9 Months Additional Cash Generation from project debt refinancings in the period US $ in millions 2020 2019 ∆ Reported Revenue 303.0 293.4 3.3% Adjusted EBITDA incl. unconsolidated affiliates1 241.0 247.7 (2.7)% Margin2 80% 84% CAFD 52.0 45.7 +13.6%
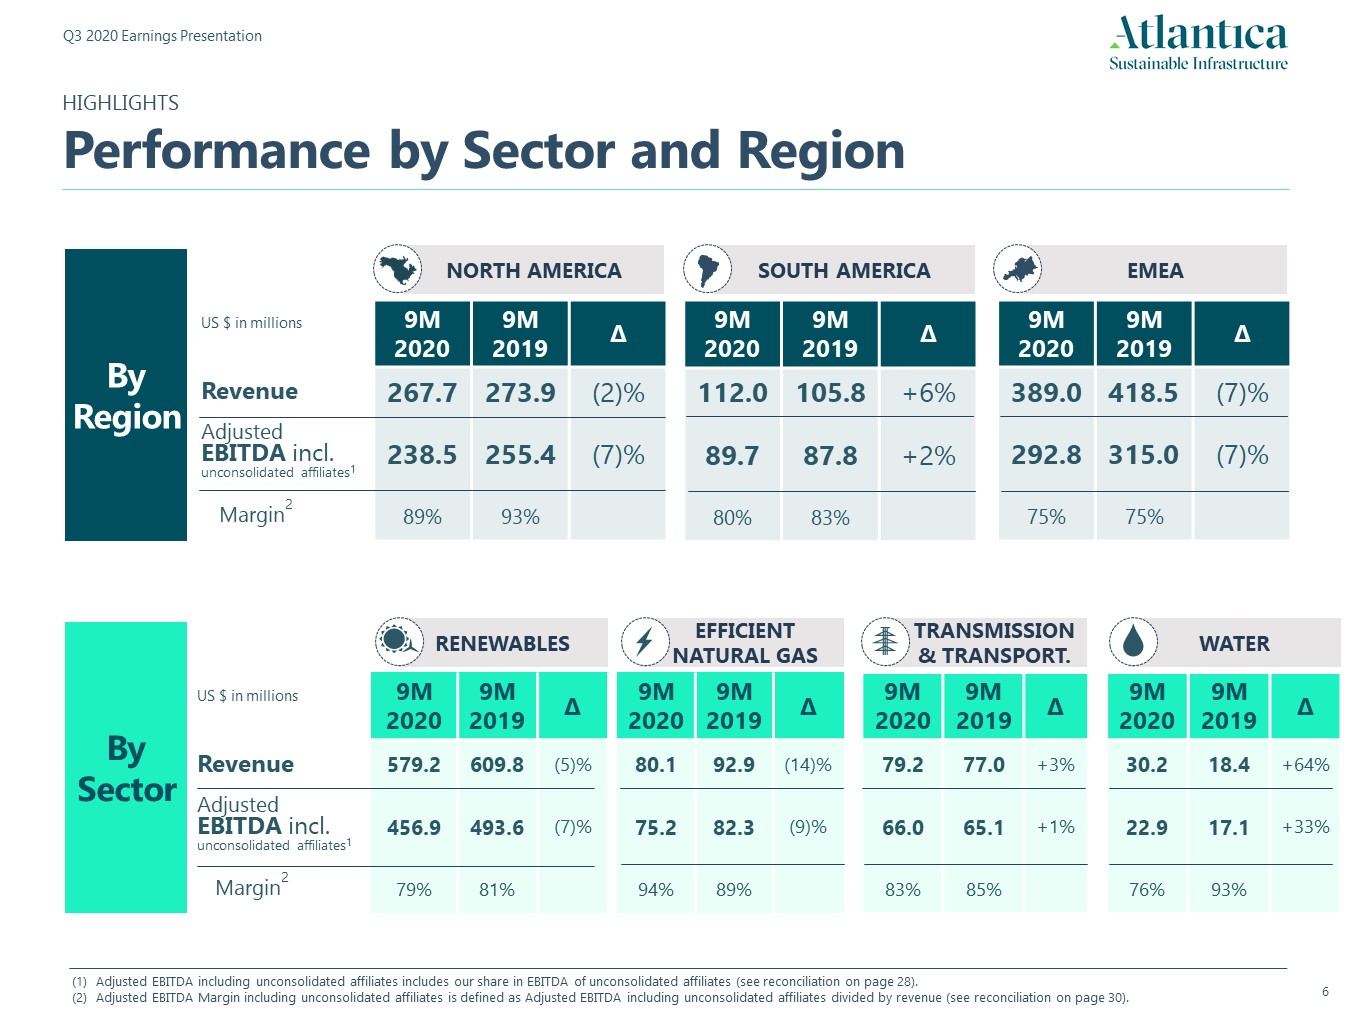
WATER 9M2020 9M 2019 ∆ 30.2 18.4 +64% 22.9 17.1 +33% 76% 93% RENEWABLES 9M2020 9M 2019 ∆ 579.2 609.8 (5)% 456.9 493.6 (7)% 79% 81% EFFICIENT NATURAL GAS 9M2020 9M 2019 ∆ 80.1 92.9 (14)% 75.2 82.3 (9)% 94% 89% TRANSMISSION& TRANSPORT. 9M2020 9M 2019 ∆ 79.2 77.0 +3% 66.0 65.1 +1% 83% 85% By Sector US $ in millions Revenue Adjusted EBITDA incl. unconsolidated affiliates1 Margin2 EMEA NORTH AMERICA 9M2020 9M 2019 ∆ 267.7 273.9 (2)% 238.5 255.4 (7)% 89% 93% SOUTH AMERICA 9M2020 9M 2019 ∆ 389.0 418.5 (7)% 292.8 315.0 (7)% 75% 75% By Region US $ in millions Revenue Adjusted EBITDA incl. unconsolidated affiliates1 Margin2 Adjusted EBITDA including unconsolidated affiliates includes our share in EBITDA of unconsolidated affiliates (see reconciliation on page 28).Adjusted EBITDA Margin including unconsolidated affiliates is defined as Adjusted EBITDA including unconsolidated affiliates divided by revenue (see reconciliation on page 30). 9M2020 9M 2019 ∆ 112.0 105.8 +6% 89.7 87.8 +2% 80% 83% HIGHLIGHTSPerformance by Sector and Region
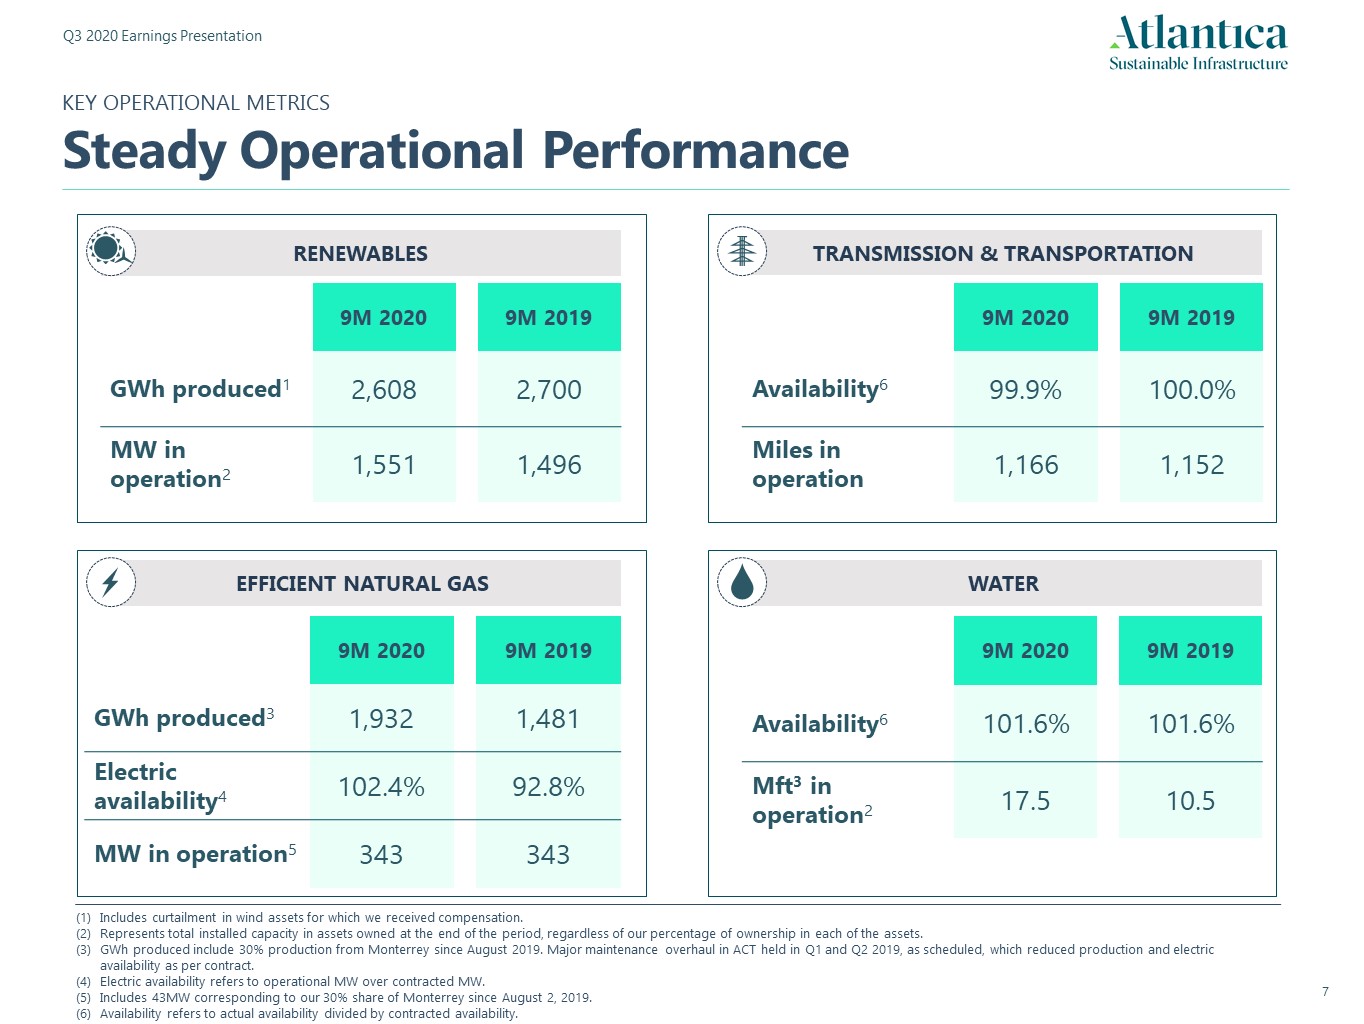
Includes curtailment in wind assets for which we received compensation.Represents total installed capacity in assets owned at the end of the period, regardless of our percentage of ownership in each of the assets.GWh produced include 30% production from Monterrey since August 2019. Major maintenance overhaul in ACT held in Q1 and Q2 2019, as scheduled, which reduced production and electric availability as per contract. Electric availability refers to operational MW over contracted MW.Includes 43MW corresponding to our 30% share of Monterrey since August 2, 2019.Availability refers to actual availability divided by contracted availability. WATER RENEWABLES TRANSMISSION & TRANSPORTATION EFFICIENT NATURAL GAS 9M 2020 9M 2019 Availability6 101.6% 101.6% Mft3 in operation2 17.5 10.5 9M 2020 9M 2019 GWh produced1 2,608 2,700 MW in operation2 1,551 1,496 9M 2020 9M 2019 GWh produced3 1,932 1,481 Electric availability4 102.4% 92.8% MW in operation5 343 343 9M 2020 9M 2019 Availability6 99.9% 100.0% Miles in operation 1,166 1,152 KEY OPERATIONAL METRICSSteady Operational Performance

Adjusted EBITDA including unconsolidated affiliates includes our share in EBITDA of unconsolidated affiliates (see reconciliation on page 28).Includes proceeds for $7.4 million and $14.8 million for the nine-month period ended September 30, 2020 and September 30, 2019 respectively, related to the amounts received by Solana in relation to the consent with the DOE. Consolidated cash as of September 30, 2020 increased by $226.0 million vs December 31, 2019 including FX translation differences of $0.1 million. First 9 Months US $ in millions 2020 2019 Adjusted EBITDA incl. unconsolidated affiliates1 621.0 658.1 Share in Adjusted EBITDA of unconsolidated affiliates (11.5) (7.1) Net interest and income tax paid (162.6) (167.7) Variations in working capital (128.9) (132.0) Non-monetary adjustments and other (14.8) (29.9) OPERATING CASH FLOW 303.2 321.4 INVESTING CASH FLOW2 18.6 (147.5) FINANCING CASH FLOW (95.8) (148.6) Net change in consolidated cash3 226.0 25.4 CASH FLOWOperating Cash Flow
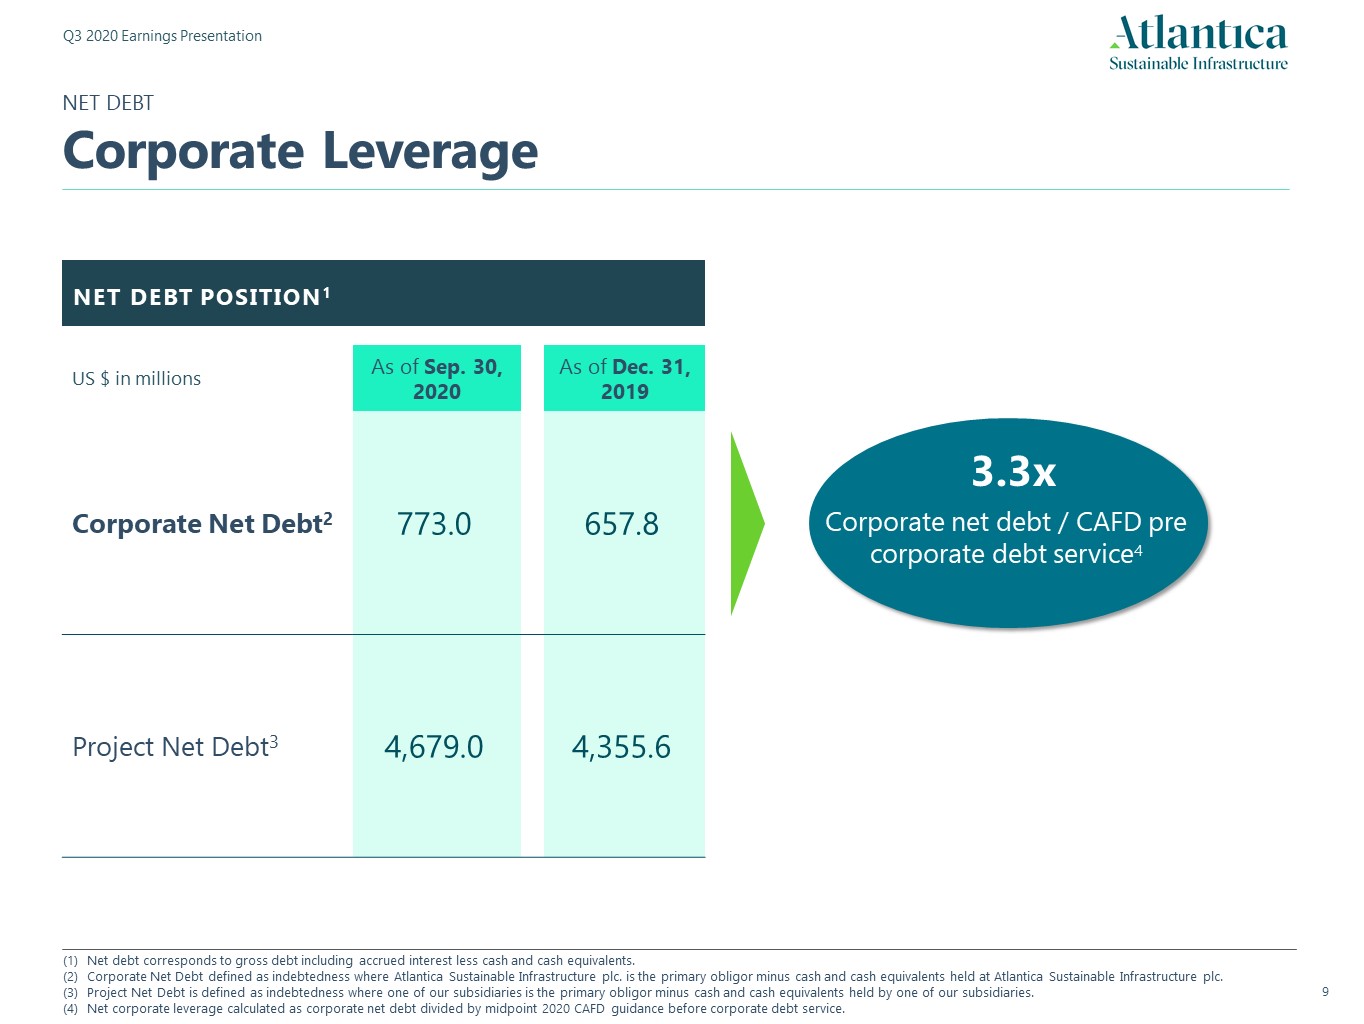
NET DEBT POSITION1 Net debt corresponds to gross debt including accrued interest less cash and cash equivalents.Corporate Net Debt defined as indebtedness where Atlantica Sustainable Infrastructure plc. is the primary obligor minus cash and cash equivalents held at Atlantica Sustainable Infrastructure plc. Project Net Debt is defined as indebtedness where one of our subsidiaries is the primary obligor minus cash and cash equivalents held by one of our subsidiaries.Net corporate leverage calculated as corporate net debt divided by midpoint 2020 CAFD guidance before corporate debt service. US $ in millions As of Sep. 30,2020 As of Dec. 31,2019 Corporate Net Debt2 773.0 657.8 Project Net Debt3 4,679.0 4,355.6 NET DEBTCorporate Leverage Corporate net debt / CAFD pre corporate debt service4 3.3x
2. Strategic Update Sustainable Infrastructure
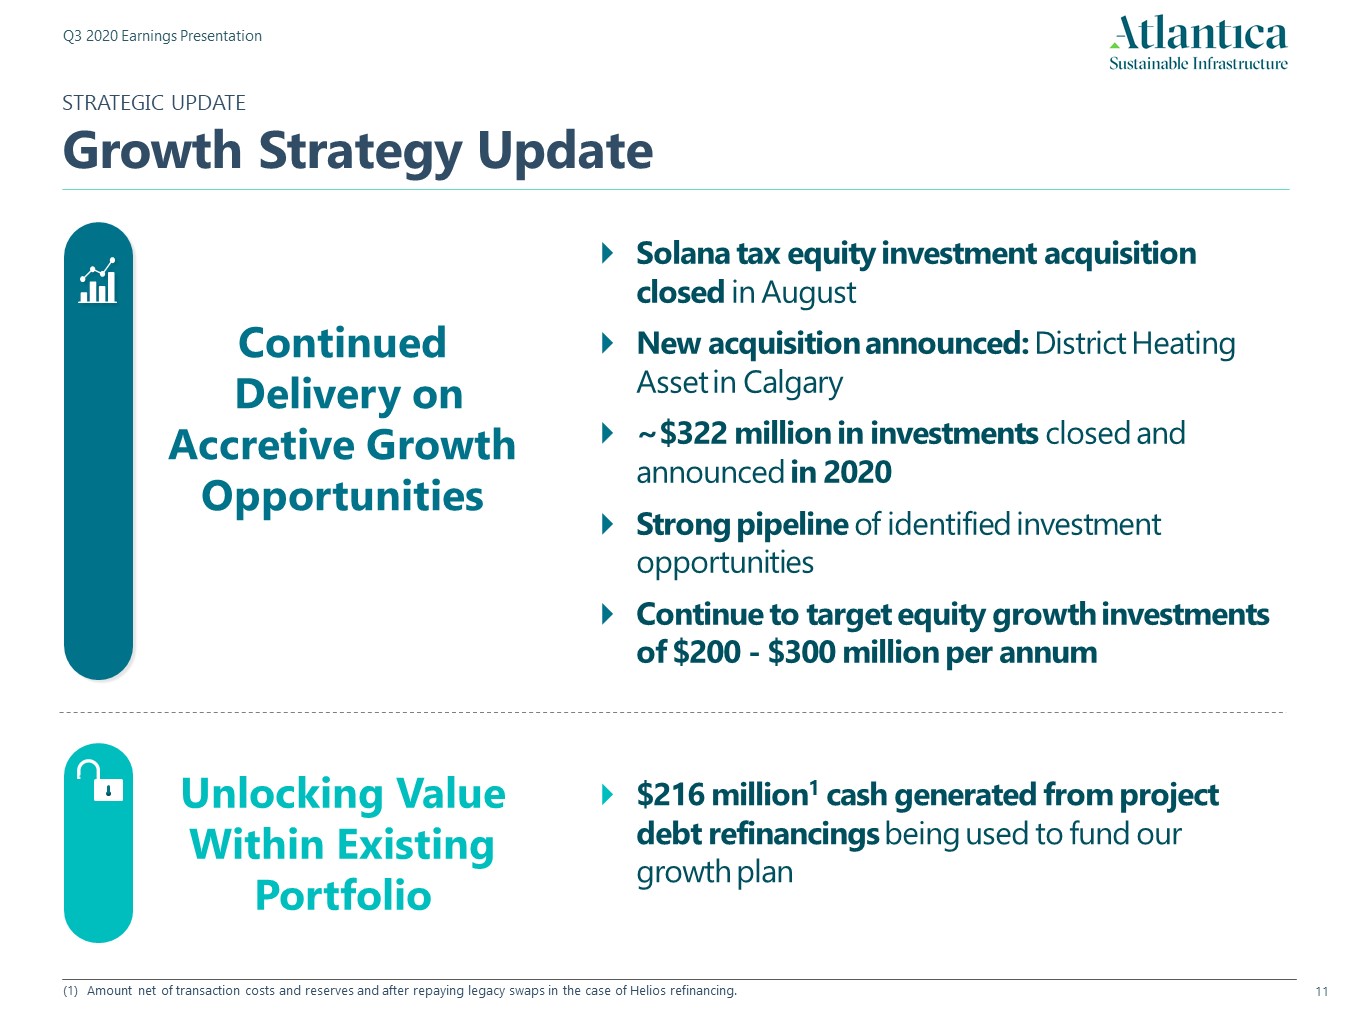
STRATEGIC UPDATEGrowth Strategy Update Continued Delivery on Accretive Growth Opportunities Solana tax equity investment acquisition closed in AugustNew acquisition announced: District Heating Asset in Calgary ~$322 million in investments closed and announced in 2020Strong pipeline of identified investment opportunitiesContinue to target equity growth investments of $200 - $300 million per annum Unlocking Value Within Existing Portfolio $216 million1 cash generated from project debt refinancings being used to fund our growth plan Amount net of transaction costs and reserves and after repaying legacy swaps in the case of Helios refinancing.
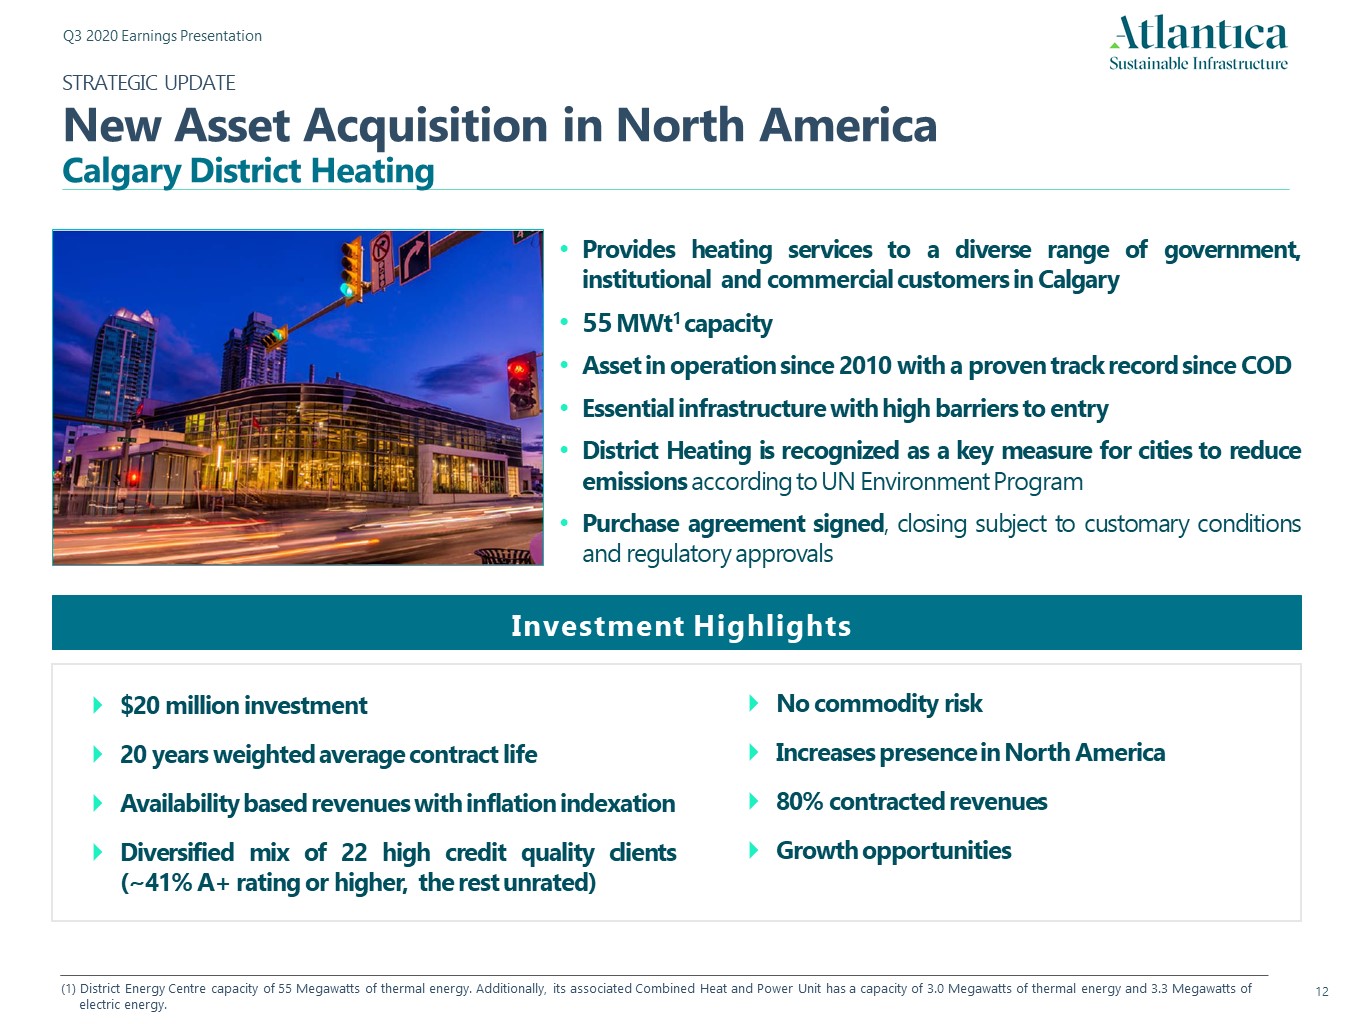
(1) District Energy Centre capacity of 55 Megawatts of thermal energy. Additionally, its associated Combined Heat and Power Unit has a capacity of 3.0 Megawatts of thermal energy and 3.3 Megawatts of electric energy. Provides heating services to a diverse range of government, institutional and commercial customers in Calgary55 MWt1 capacityAsset in operation since 2010 with a proven track record since CODEssential infrastructure with high barriers to entryDistrict Heating is recognized as a key measure for cities to reduce emissions according to UN Environment ProgramPurchase agreement signed, closing subject to customary conditions and regulatory approvals $20 million investment 20 years weighted average contract life Availability based revenues with inflation indexationDiversified mix of 22 high credit quality clients (~41% A+ rating or higher, the rest unrated) Investment Highlights No commodity riskIncreases presence in North America80% contracted revenuesGrowth opportunities STRATEGIC UPDATENew Asset Acquisition in North AmericaCalgary District Heating
DIVIDEND Q3 2020 Dividend1 of $0.42 per share Quarterly dividends declared by the Board of Directors and paid during the following quarter. On November 3, 2020, the Board of Directors declared a dividend of $0.42 per share corresponding to the third quarter of 2020 The dividend is expected to be paid on December 15, 2020, to shareholders of record as of November 30, 2020
3. Appendix Sustainable Infrastructure
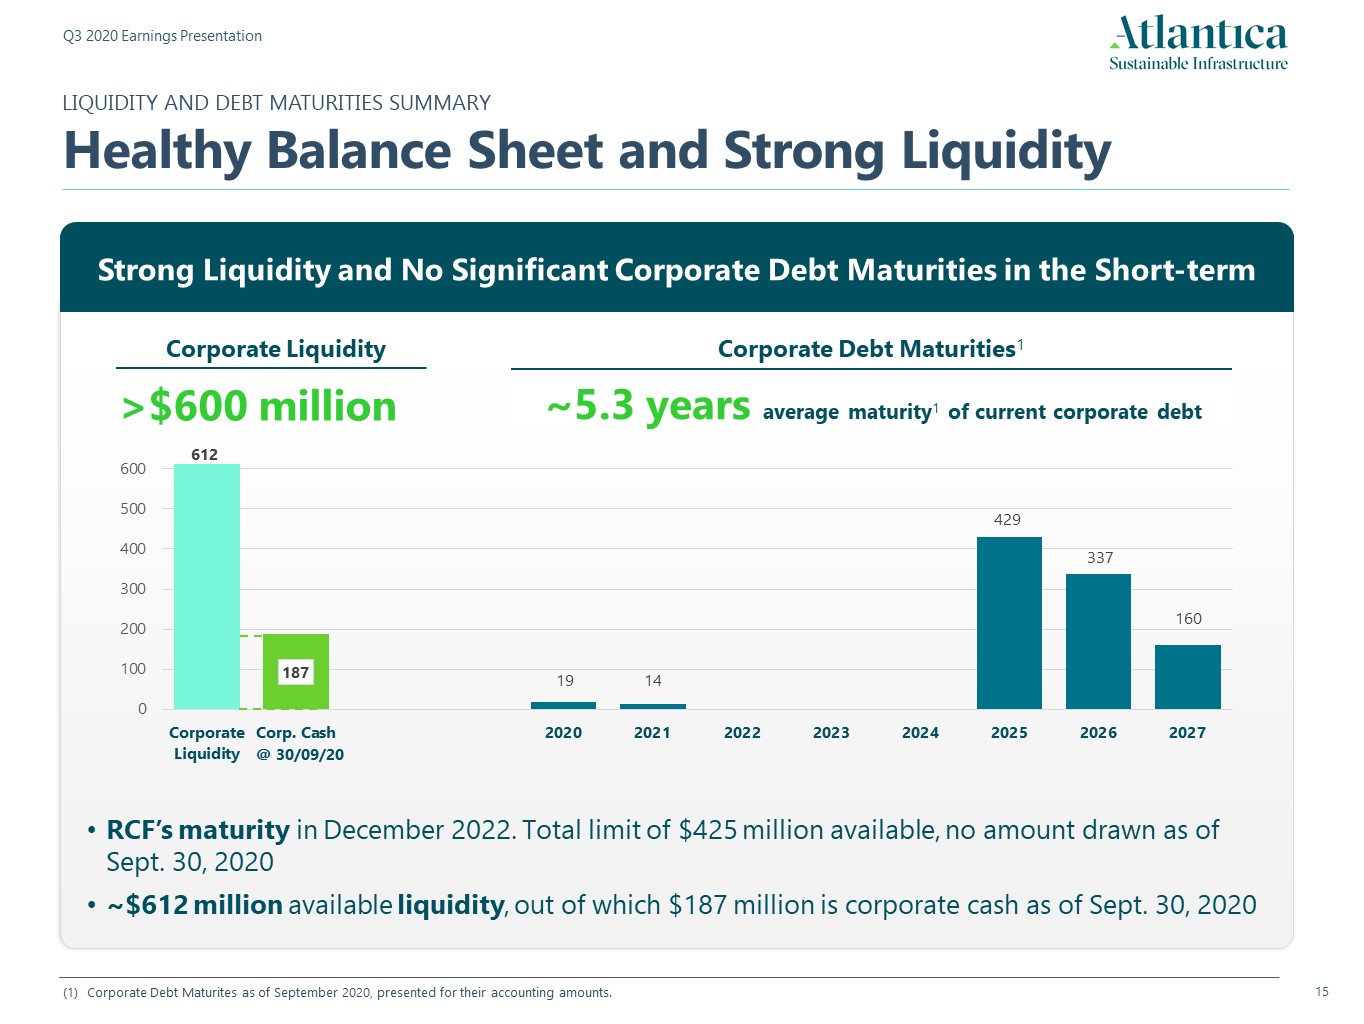
LIQUIDITY AND DEBT MATURITIES SUMMARYHealthy Balance Sheet and Strong Liquidity Strong Liquidity and No Significant Corporate Debt Maturities in the Short-term >$600 million @ 30/09/20 Corporate Liquidity ~5.3 years average maturity1 of current corporate debt RCF’s maturity in December 2022. Total limit of $425 million available, no amount drawn as of Sept. 30, 2020~$612 million available liquidity, out of which $187 million is corporate cash as of Sept. 30, 2020 Corporate Debt Maturities1 Corporate Debt Maturites as of September 2020, presented for their accounting amounts.

CORPORATE DEBT DETAILSCorporate Debt as of September 30, 2020No significant maturities in the short term Exchange rates as of September 30, 2020 (EUR/USD = 1.1721).Amounts include principal amounts outstanding and interests to be paid in the short term.As of September 30, 2020, there was no amount drawn down from our RCF. Total RCF limit of $425 million.Other facilities include other credit lines and notes under the commercial paper program. US $ in millions1 Maturity Amounts2 Credit Facilities (Revolving CF) 3 2022 - (Other facilities)4 2020 / 2021 33.5 2019 NIFA5(€ denominated) 2025 326.4 Green Exchangeable Bond6 2025 103.1 Green Senior Secured Notes 2026 336.8 2020 NIFA7 (€ denominated) 2027 159.9 Total 959.7 (5) 2019 NIFA means Note Issuance Facility Agreement. 2019 NIFA refers to the senior secured note facility dated April 30, 2019, of Euro equivalent of $300 million.(6) Senior unsecured notes dated July 17, 2020, exchangeable into ordinary shares of Atlantica, cash, or a combination of both, at Atlantica’s election.(7) 2020 NIFA refers to the senior unsecured note financing dated July 8, 2020, of €140 million (~$164 million).
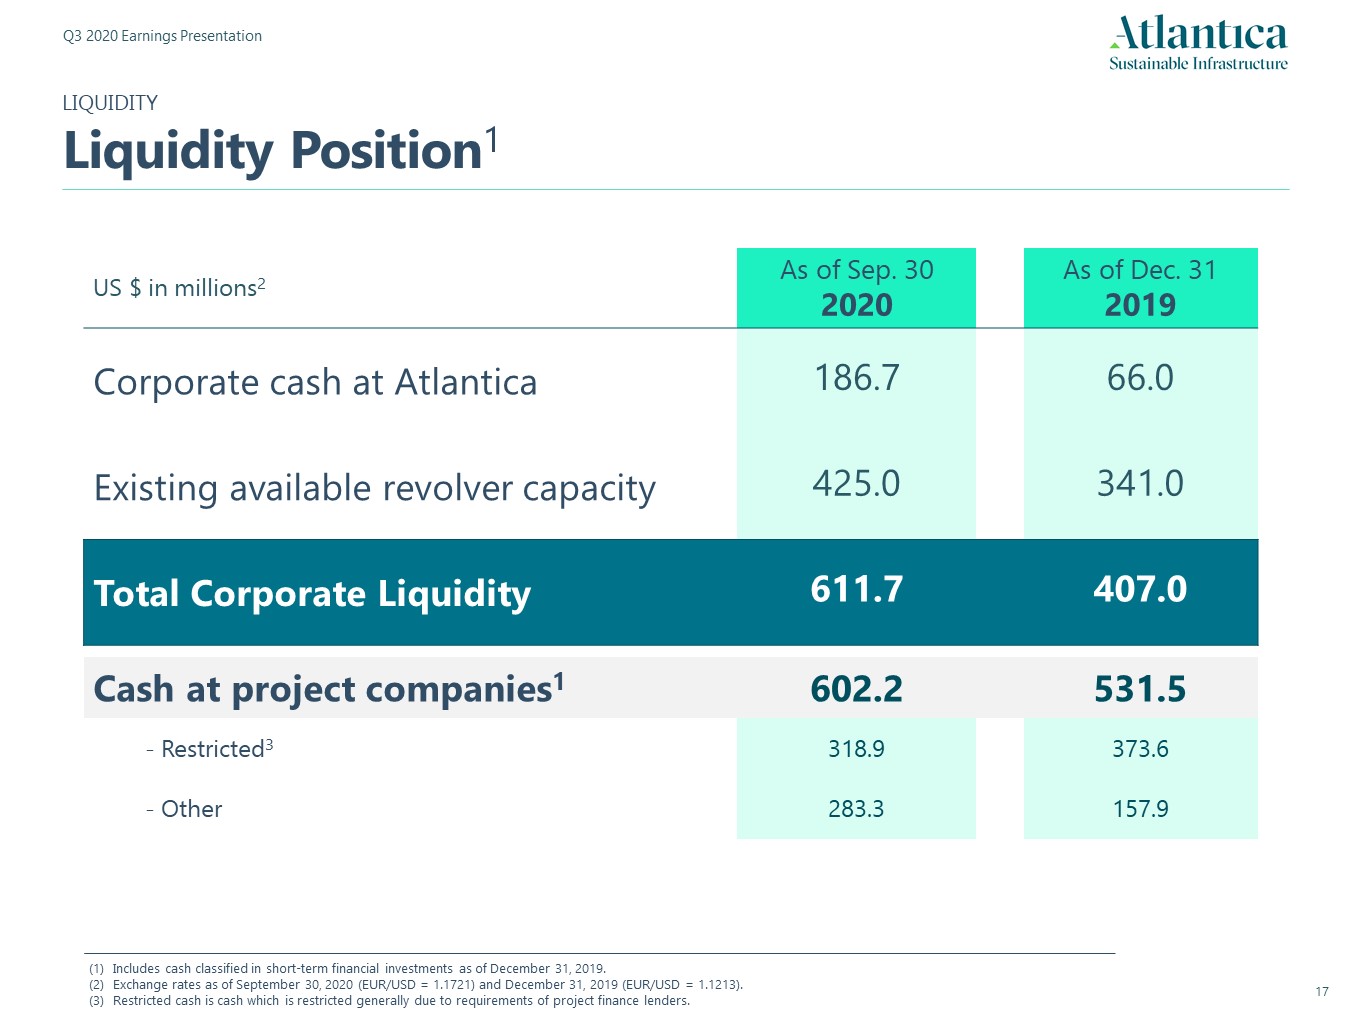
Includes cash classified in short-term financial investments as of December 31, 2019. Exchange rates as of September 30, 2020 (EUR/USD = 1.1721) and December 31, 2019 (EUR/USD = 1.1213).Restricted cash is cash which is restricted generally due to requirements of project finance lenders. US $ in millions2 As of Sep. 302020 As of Dec. 312019 Corporate cash at Atlantica 186.7 66.0 Existing available revolver capacity 425.0 341.0 Total Corporate Liquidity 611.7 407.0 Cash at project companies1 602.2 531.5 - Restricted3 318.9 373.6 - Other 283.3 157.9 LIQUIDITYLiquidity Position1
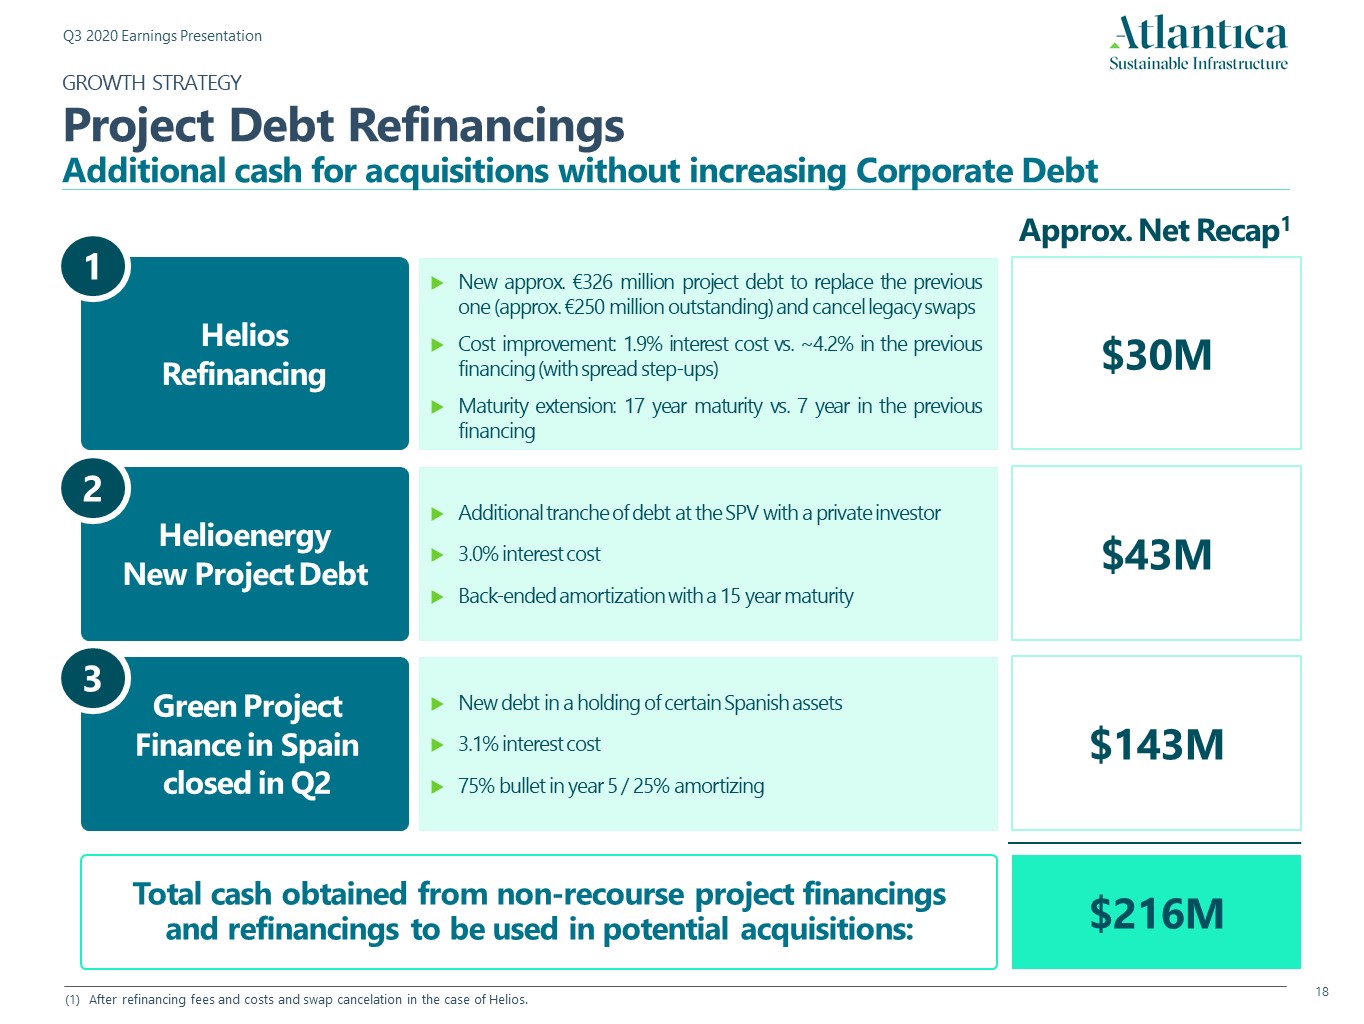
Total cash obtained from non-recourse project financings and refinancings to be used in potential acquisitions: Additional tranche of debt at the SPV with a private investor3.0% interest costBack-ended amortization with a 15 year maturity Helioenergy New Project Debt 2 $43M New debt in a holding of certain Spanish assets3.1% interest cost75% bullet in year 5 / 25% amortizing Green Project Finance in Spain closed in Q2 3 $143M Approx. Net Recap1 $216M New approx. €326 million project debt to replace the previous one (approx. €250 million outstanding) and cancel legacy swapsCost improvement: 1.9% interest cost vs. ~4.2% in the previous financing (with spread step-ups)Maturity extension: 17 year maturity vs. 7 year in the previous financing $30M Helios Refinancing After refinancing fees and costs and swap cancelation in the case of Helios. GROWTH STRATEGYProject Debt RefinancingsAdditional cash for acquisitions without increasing Corporate Debt 1
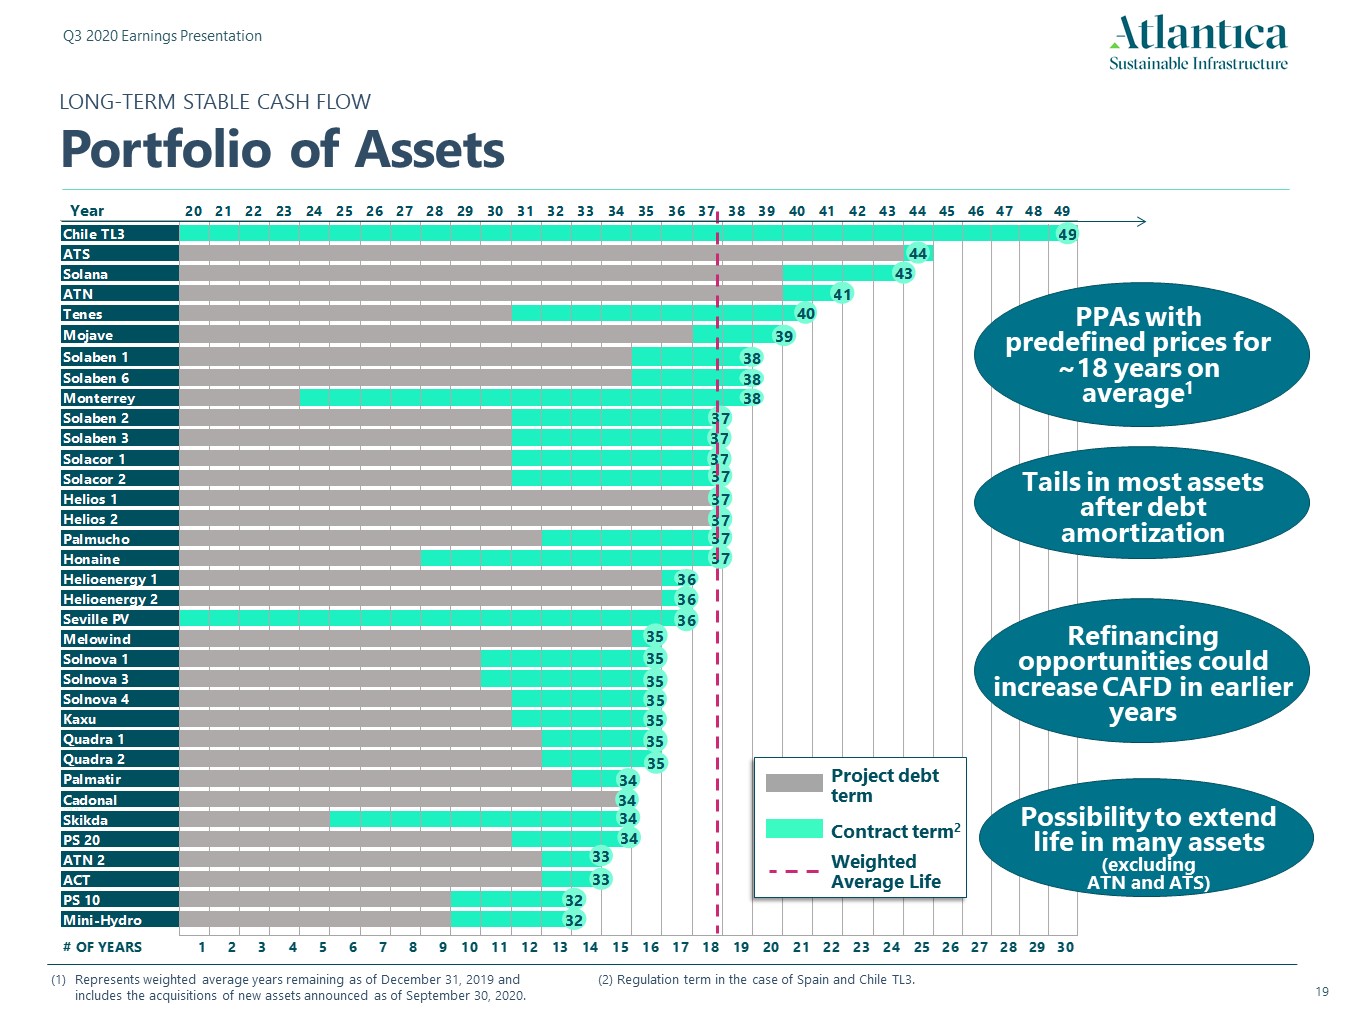
Weighted Average Life Project debt term Represents weighted average years remaining as of December 31, 2019 and includes the acquisitions of new assets announced as of September 30, 2020. (2) Regulation term in the case of Spain and Chile TL3. PPAs with predefined prices for ~18 years on average1 Refinancing opportunities could increase CAFD in earlier years Possibility to extend life in many assets (excluding ATN and ATS) Tails in most assets after debt amortization Contract term2 LONG-TERM STABLE CASH FLOWPortfolio of Assets Year
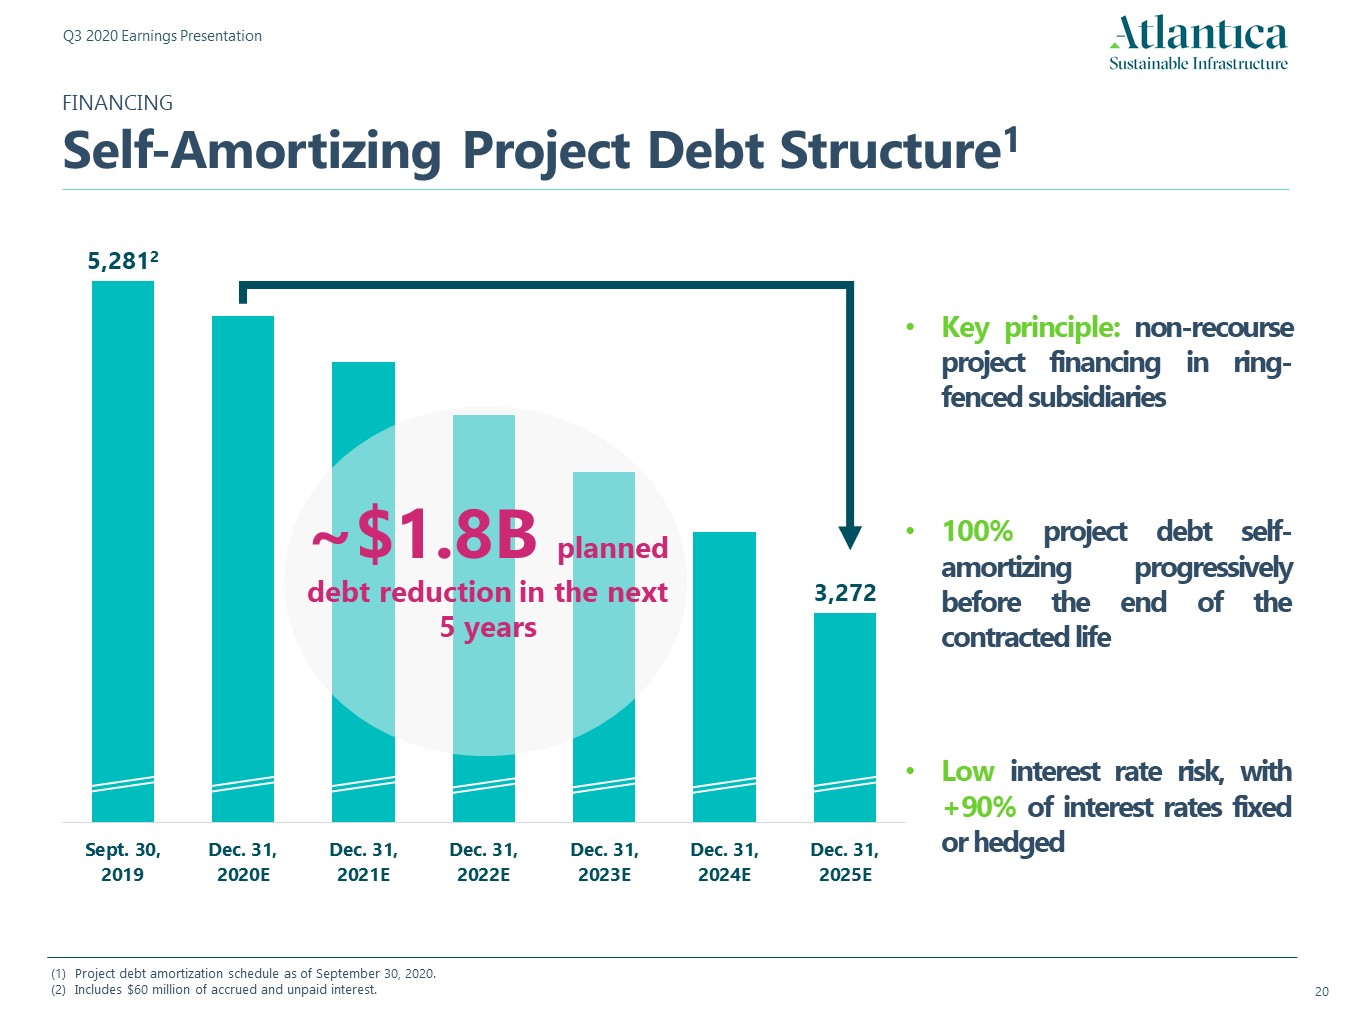
Key principle: non-recourse project financing in ring-fenced subsidiaries100% project debt self-amortizing progressively before the end of the contracted lifeLow interest rate risk, with +90% of interest rates fixed or hedged ~$1.8B planned debt reduction in the next 5 years FINANCING Self-Amortizing Project Debt Structure1 Project debt amortization schedule as of September 30, 2020.Includes $60 million of accrued and unpaid interest.
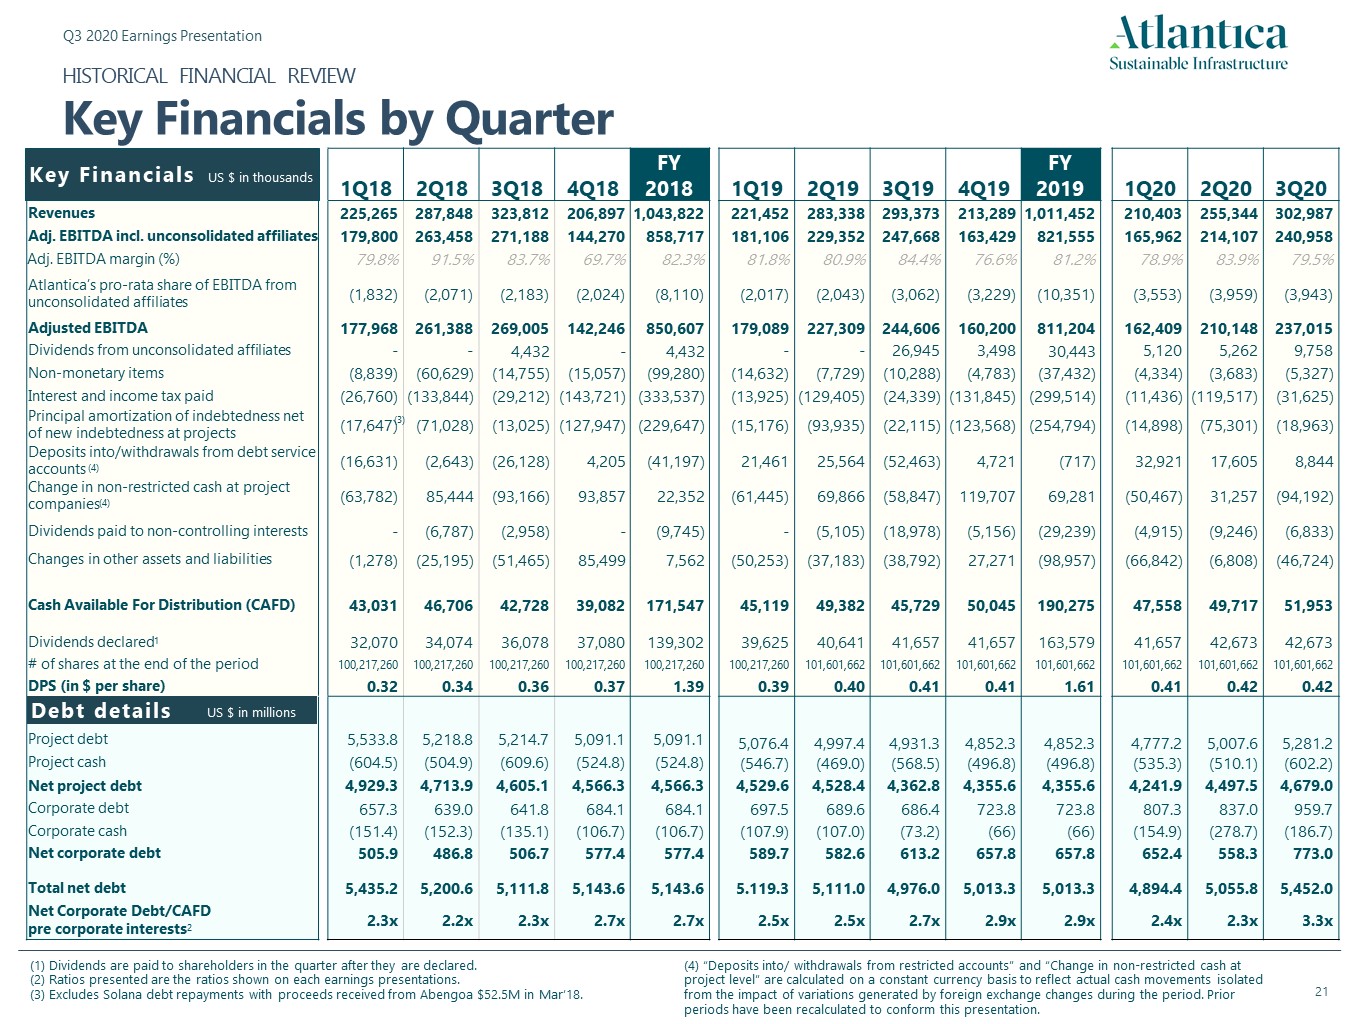
1Q18 2Q18 3Q18 4Q18 FY 2018 1Q19 2Q19 3Q19 4Q19 FY 2019 1Q20 2Q20 3Q20 Revenues 225,265 287,848 323,812 206,897 1,043,822 221,452 283,338 293,373 213,289 1,011,452 210,403 255,344 302,987 Adj. EBITDA incl. unconsolidated affiliates 179,800 263,458 271,188 144,270 858,717 181,106 229,352 247,668 163,429 821,555 165,962 214,107 240,958 Adj. EBITDA margin (%) 79.8% 91.5% 83.7% 69.7% 82.3% 81.8% 80.9% 84.4% 76.6% 81.2% 78.9% 83.9% 79.5% Atlantica’s pro-rata share of EBITDA from unconsolidated affiliates (1,832) (2,071) (2,183) (2,024) (8,110) (2,017) (2,043) (3,062) (3,229) (10,351) (3,553) (3,959) (3,943) Adjusted EBITDA 177,968 261,388 269,005 142,246 850,607 179,089 227,309 244,606 160,200 811,204 162,409 210,148 237,015 Dividends from unconsolidated affiliates - - 4,432 - 4,432 - - 26,945 3,498 30,443 5,120 5,262 9,758 Non-monetary items (8,839) (60,629) (14,755) (15,057) (99,280) (14,632) (7,729) (10,288) (4,783) (37,432) (4,334) (3,683) (5,327) Interest and income tax paid (26,760) (133,844) (29,212) (143,721) (333,537) (13,925) (129,405) (24,339) (131,845) (299,514) (11,436) (119,517) (31,625) Principal amortization of indebtedness net of new indebtedness at projects (17,647) (71,028) (13,025) (127,947) (229,647) (15,176) (93,935) (22,115) (123,568) (254,794) (14,898) (75,301) (18,963) Deposits into/withdrawals from debt service accounts (16,631) (2,643) (26,128) 4,205 (41,197) 21,461 25,564 (52,463) 4,721 (717) 32,921 17,605 8,844 Change in non-restricted cash at project companies (63,782) 85,444 (93,166) 93,857 22,352 (61,445) 69,866 (58,847) 119,707 69,281 (50,467) 31,257 (94,192) Dividends paid to non-controlling interests - (6,787) (2,958) - (9,745) - (5,105) (18,978) (5,156) (29,239) (4,915) (9,246) (6,833) Changes in other assets and liabilities (1,278) (25,195) (51,465) 85,499 7,562 (50,253) (37,183) (38,792) 27,271 (98,957) (66,842) (6,808) (46,724) Cash Available For Distribution (CAFD) 43,031 46,706 42,728 39,082 171,547 45,119 49,382 45,729 50,045 190,275 47,558 49,717 51,953 Dividends declared1 32,070 34,074 36,078 37,080 139,302 39,625 40,641 41,657 41,657 163,579 41,657 42,673 42,673 # of shares at the end of the period 100,217,260 100,217,260 100,217,260 100,217,260 100,217,260 100,217,260 101,601,662 101,601,662 101,601,662 101,601,662 101,601,662 101,601,662 101,601,662 DPS (in $ per share) 0.32 0.34 0.36 0.37 1.39 0.39 0.40 0.41 0.41 1.61 0.41 0.42 0.42 Project debt 5,533.8 5,218.8 5,214.7 5,091.1 5,091.1 5,076.4 4,997.4 4,931.3 4,852.3 4,852.3 4,777.2 5,007.6 5,281.2 Project cash (604.5) (504.9) (609.6) (524.8) (524.8) Project cash (604.5) (504.9) (609.6) (524.8) (524.8) (546.7) (469.0) (568.5) (496.8) (496.8) (535.3) (510.1) (602.2) Net project debt 4,929.3 4,713.9 4,605.1 4,566.3 4,566.3 4,529.6 4,528.4 4,362.8 4,355.6 4,355.6 4,241.9 4,497.5 4,679.0 Corporate debt 657.3 639.0 641.8 684.1 684.1 697.5 689.6 686.4 723.8 723.8 807.3 837.0 959.7 Corporate cash (151.4) (152.3) (135.1) (106.7) (106.7) (107.9) (107.0) (73.2) (66) (66) (154.9) (278.7) (186.7) Net corporate debt 505.9 486.8 506.7 577.4 577.4 589.7 582.6 613.2 657.8 657.8 652.4 558.3 773.0 Total net debt 5,435.2 5,200.6 5,111.8 5,143.6 5,143.6 5.119.3 5,111.0 4,976.0 5,013.3 5,013.3 4,894.4 5,055.8 5,452.0 Net Corporate Debt/CAFD pre corporate interests2 2.3x 2.2x 2.3x 2.7x 2.7x 2.5x 2.5x 2.7x 2.9x 2.9x 2.4x 2.3x 3.3x HISTORICAL FINANCIAL REVIEWKey Financials by Quarter Debt details Key Financials US $ in thousands (3) Dividends are paid to shareholders in the quarter after they are declared.Ratios presented are the ratios shown on each earnings presentations.(3) Excludes Solana debt repayments with proceeds received from Abengoa $52.5M in Mar’18. (4) “Deposits into/ withdrawals from restricted accounts” and “Change in non-restricted cash at project level” are calculated on a constant currency basis to reflect actual cash movements isolated from the impact of variations generated by foreign exchange changes during the period. Prior periods have been recalculated to conform this presentation. (4) (4) US $ in millions
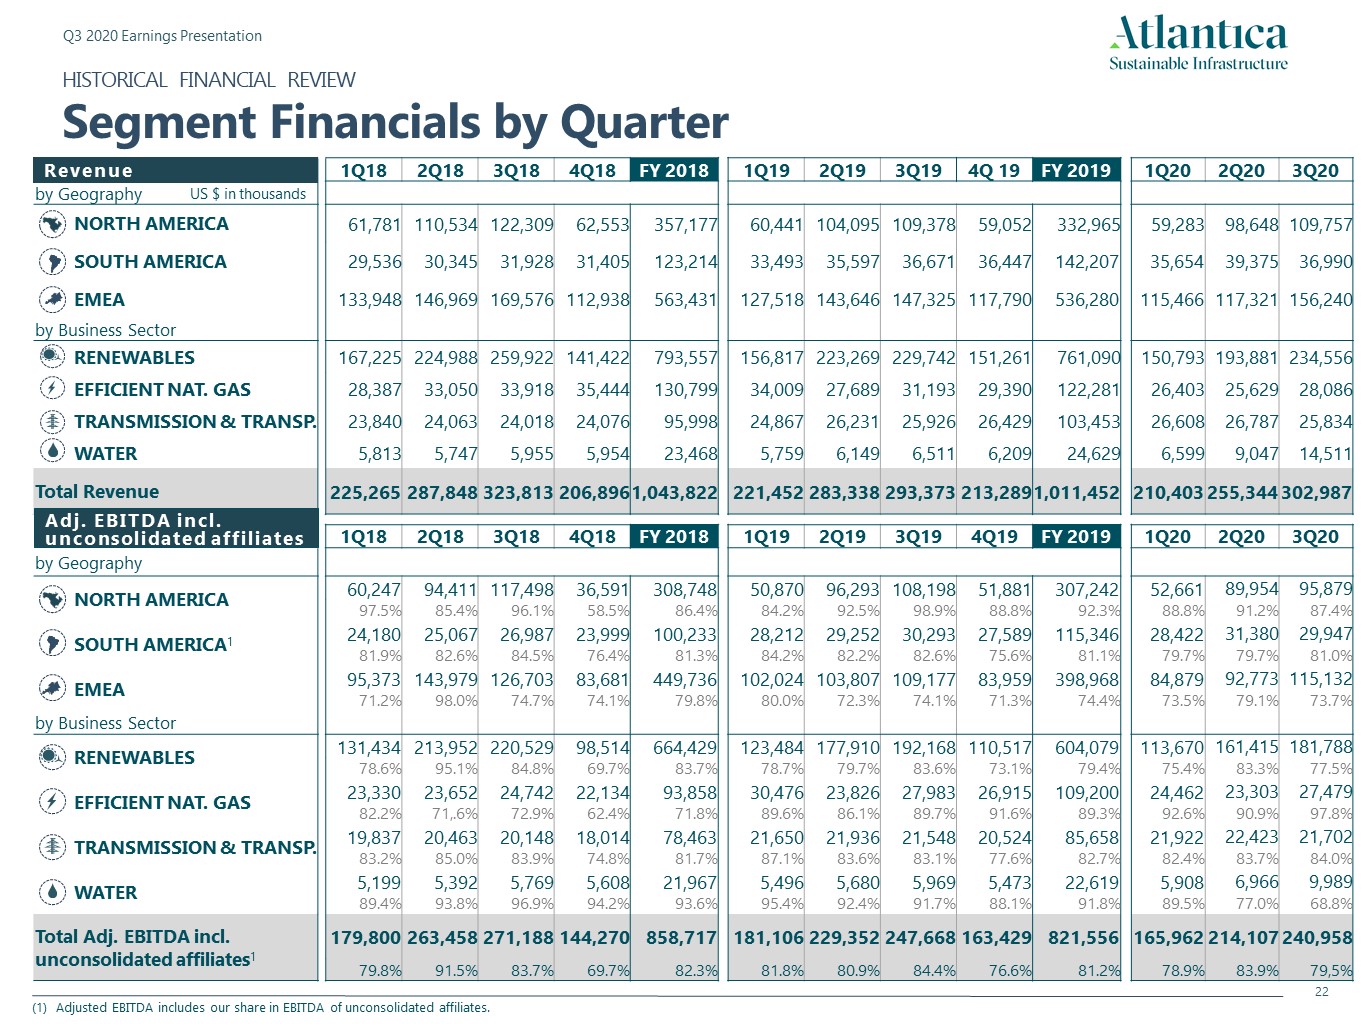
HISTORICAL FINANCIAL REVIEWSegment Financials by Quarter 2 1Q18 2Q18 3Q18 4Q18 FY 2018 1Q19 2Q19 3Q19 4Q 19 FY 2019 1Q20 2Q20 3Q20 by Geography NORTH AMERICA 61,781 110,534 122,309 62,553 357,177 60,441 104,095 109,378 59,052 332,965 59,283 98,648 109,757 SOUTH AMERICA 29,536 30,345 31,928 31,405 123,214 33,493 35,597 36,671 36,447 142,207 35,654 39,375 36,990 EMEA 133,948 146,969 169,576 112,938 563,431 127,518 143,646 147,325 117,790 536,280 115,466 117,321 156,240 by Business Sector RENEWABLES 167,225 224,988 259,922 141,422 793,557 156,817 223,269 229,742 151,261 761,090 150,793 193,881 234,556 EFFICIENT NAT. GAS 28,387 33,050 33,918 35,444 130,799 34,009 27,689 31,193 29,390 122,281 26,403 25,629 28,086 TRANSMISSION & TRANSP. 23,840 24,063 24,018 24,076 95,998 24,867 26,231 25,926 26,429 103,453 26,608 26,787 25,834 WATER 5,813 5,747 5,955 5,954 23,468 5,759 6,149 6,511 6,209 24,629 6,599 9,047 14,511 Total Revenue 225,265 287,848 323,813 206,896 1,043,822 221,452 283,338 293,373 213,289 1,011,452 210,403 255,344 302,987 1Q18 2Q18 3Q18 4Q18 FY 2018 1Q19 2Q19 3Q19 4Q19 FY 2019 1Q20 2Q20 3Q20 by Geography NORTH AMERICA 60,247 94,411 117,498 36,591 308,748 50,870 96,293 108,198 51,881 307,242 52,661 89,954 95,879 97.5% 85.4% 96.1% 58.5% 86.4% 84.2% 92.5% 98.9% 88.8% 92.3% 88.8% 91.2% 87.4% SOUTH AMERICA1 24,180 25,067 26,987 23,999 100,233 28,212 29,252 30,293 27,589 115,346 28,422 31,380 29,947 81.9% 82.6% 84.5% 76.4% 81.3% 84.2% 82.2% 82.6% 75.6% 81.1% 79.7% 79.7% 81.0% EMEA 95,373 143,979 126,703 83,681 449,736 102,024 103,807 109,177 83,959 398,968 84,879 92,773 115,132 71.2% 98.0% 74.7% 74.1% 79.8% 80.0% 72.3% 74.1% 71.3% 74.4% 73.5% 79.1% 73.7% by Business Sector RENEWABLES 131,434 213,952 220,529 98,514 664,429 123,484 177,910 192,168 110,517 604,079 113,670 161,415 181,788 78.6% 95.1% 84.8% 69.7% 83.7% 78.7% 79.7% 83.6% 73.1% 79.4% 75.4% 83.3% 77.5% EFFICIENT NAT. GAS 23,330 23,652 24,742 22,134 93,858 30,476 23,826 27,983 26,915 109,200 24,462 23,303 27,479 82.2% 71,.6% 72.9% 62.4% 71.8% 89.6% 86.1% 89.7% 91.6% 89.3% 92.6% 90.9% 97.8% TRANSMISSION & TRANSP. 19,837 20,463 20,148 18,014 78,463 21,650 21,936 21,548 20,524 85,658 21,922 22,423 21,702 83.2% 85.0% 83.9% 74.8% 81.7% 87.1% 83.6% 83.1% 77.6% 82.7% 82.4% 83.7% 84.0% WATER 5,199 5,392 5,769 5,608 21,967 5,496 5,680 5,969 5,473 22,619 5,908 6,966 9,989 89.4% 93.8% 96.9% 94.2% 93.6% 95.4% 92.4% 91.7% 88.1% 91.8% 89.5% 77.0% 68.8% Total Adj. EBITDA incl. unconsolidated affiliates1 179,800 263,458 271,188 144,270 858,717 181,106 229,352 247,668 163,429 821,556 165,962 214,107 240,958 79.8% 91.5% 83.7% 69.7% 82.3% 81.8% 80.9% 84.4% 76.6% 81.2% 78.9% 83.9% 79,5% US $ in thousands Revenue Adj. EBITDA incl. unconsolidated affiliates Adjusted EBITDA includes our share in EBITDA of unconsolidated affiliates.
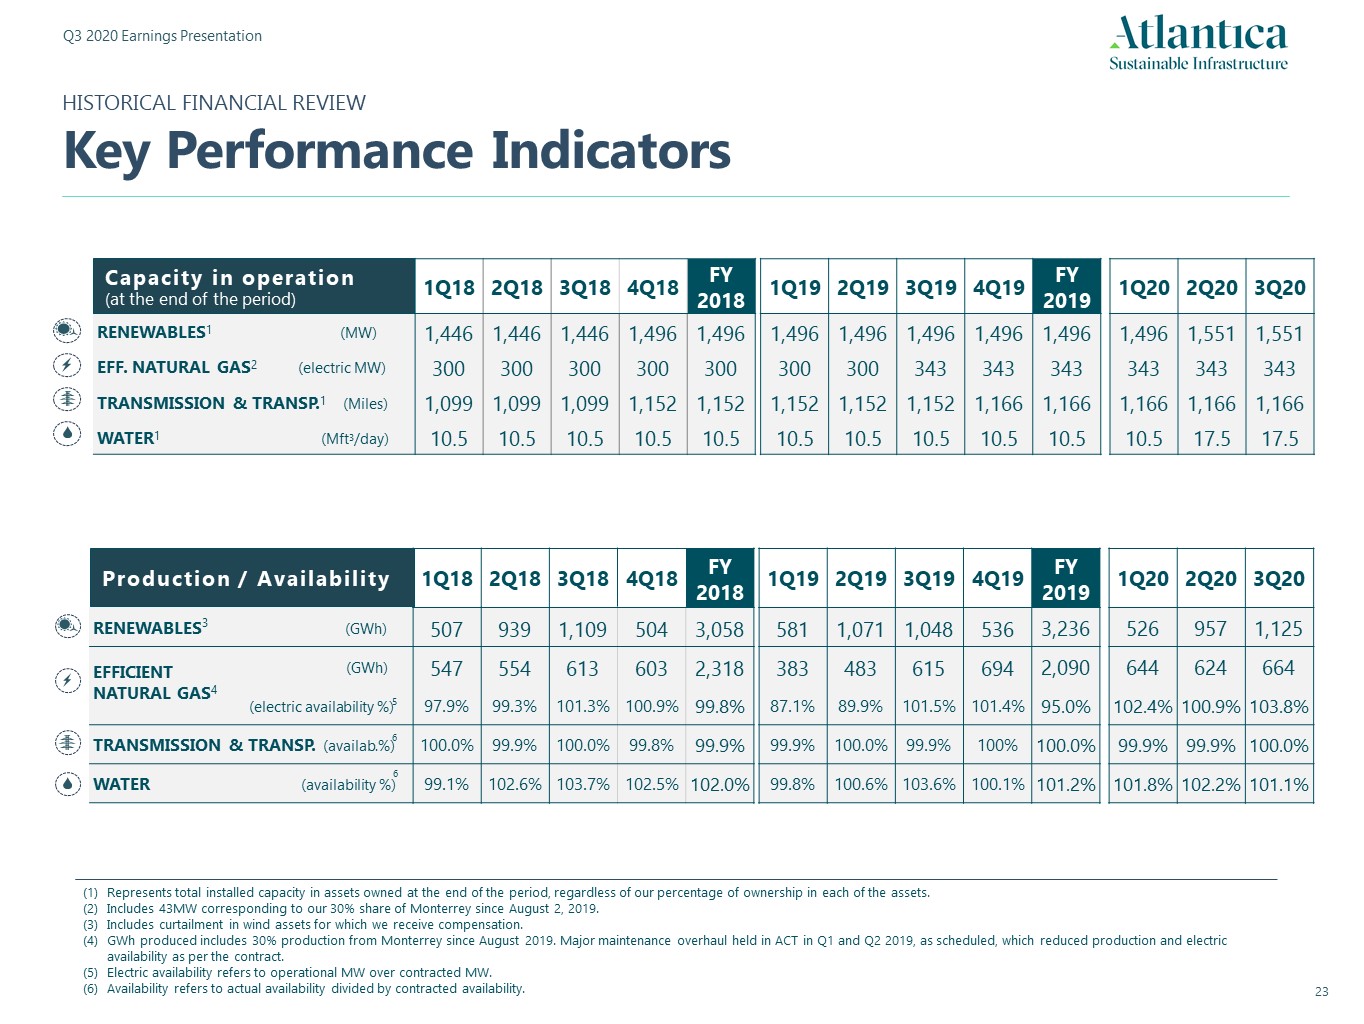
1Q18 2Q18 3Q18 4Q18 FY 2018 1Q19 2Q19 3Q19 4Q19 FY 2019 1Q20 2Q20 3Q20 RENEWABLES3 (GWh) 507 939 1,109 504 3,058 581 1,071 1,048 536 3,236 526 957 1,125 (GWh) 547 554 613 603 2,318 383 483 615 694 2,090 644 624 664 (electric availability %) 97.9% 99.3% 101.3% 100.9% 99.8% 87.1% 89.9% 101.5% 101.4% 95.0% 102.4% 100.9% 103.8% TRANSMISSION & TRANSP. (availab.%) 100.0% 99.9% 100.0% 99.8% 99.9% 99.9% 100.0% 99.9% 100% 100.0% 99.9% 99.9% 100.0% WATER (availability %) 99.1% 102.6% 103.7% 102.5% 102.0% 99.8% 100.6% 103.6% 100.1% 101.2% 101.8% 102.2% 101.1% 1Q18 2Q18 3Q18 4Q18 FY 2018 1Q19 2Q19 3Q19 4Q19 FY 2019 1Q20 2Q20 3Q20 RENEWABLES1 (MW) 1,446 1,446 1,446 1,496 1,496 1,496 1,496 1,496 1,496 1,496 1,496 1,551 1,551 EFF. NATURAL GAS2 (electric MW) 300 300 300 300 300 300 300 343 343 343 343 343 343 TRANSMISSION & TRANSP.1 (Miles) 1,099 1,099 1,099 1,152 1,152 1,152 1,152 1,152 1,166 1,166 1,166 1,166 1,166 WATER1 (Mft3/day) 10.5 10.5 10.5 10.5 10.5 10.5 10.5 10.5 10.5 10.5 10.5 17.5 17.5 Capacity in operation(at the end of the period) Production / Availability 5 6 6 Represents total installed capacity in assets owned at the end of the period, regardless of our percentage of ownership in each of the assets.Includes 43MW corresponding to our 30% share of Monterrey since August 2, 2019.Includes curtailment in wind assets for which we receive compensation.GWh produced includes 30% production from Monterrey since August 2019. Major maintenance overhaul held in ACT in Q1 and Q2 2019, as scheduled, which reduced production and electric availability as per the contract.Electric availability refers to operational MW over contracted MW. Availability refers to actual availability divided by contracted availability. EFFICIENT NATURAL GAS4 HISTORICAL FINANCIAL REVIEWKey Performance Indicators
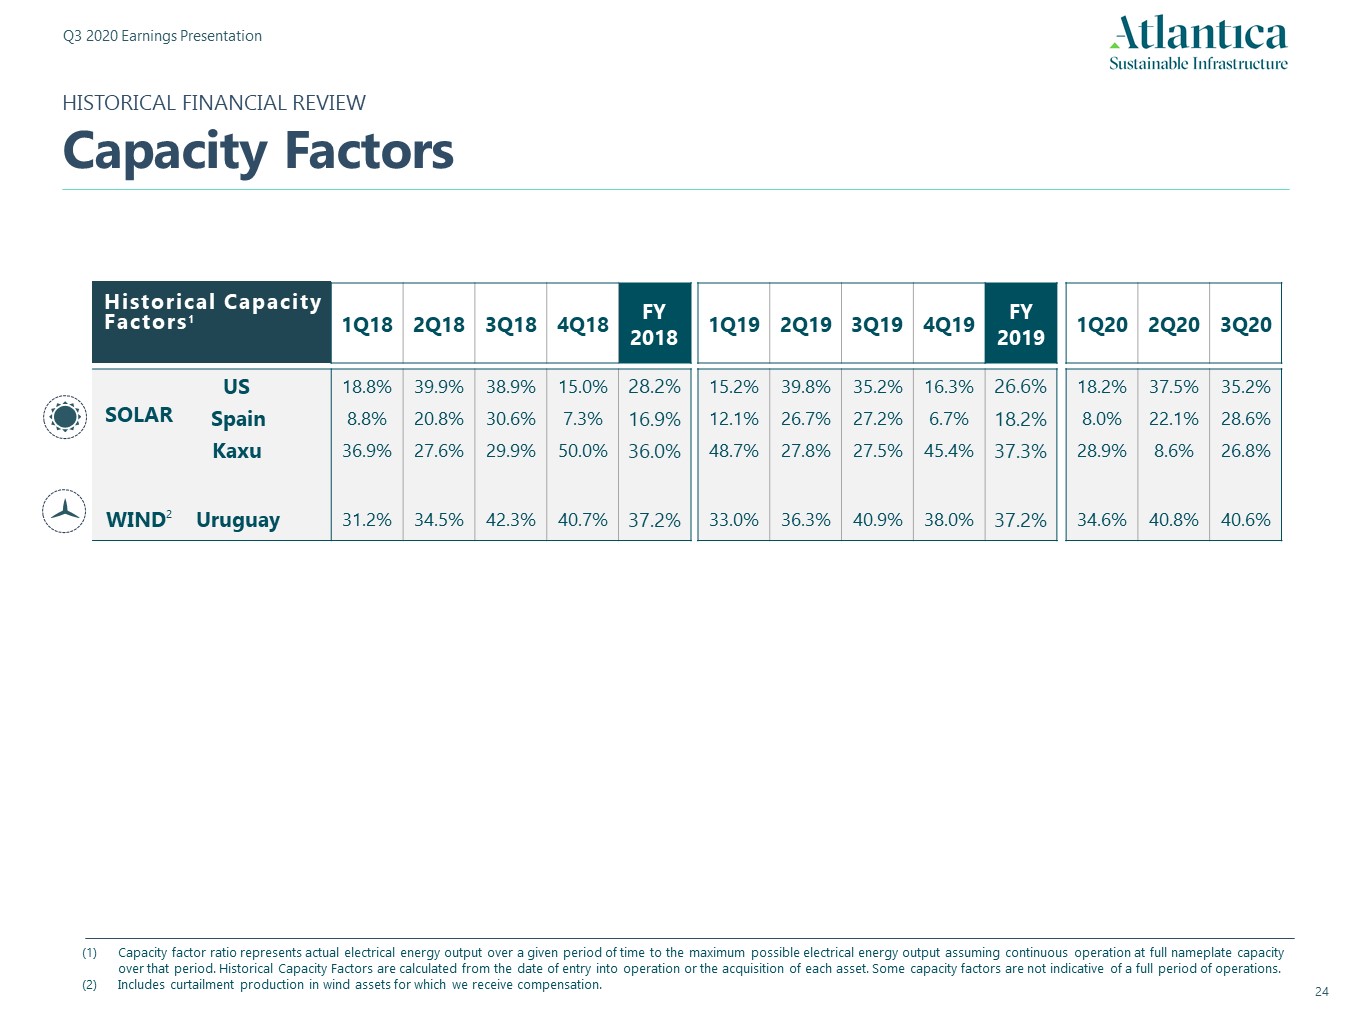
1Q18 2Q18 3Q18 4Q18 FY 2018 1Q19 2Q19 3Q19 4Q19 FY 2019 1Q20 2Q20 3Q20 US 18.8% 39.9% 38.9% 15.0% 28.2% 15.2% 39.8% 35.2% 16.3% 26.6% 18.2% 37.5% 35.2% Spain 8.8% 20.8% 30.6% 7.3% 16.9% 12.1% 26.7% 27.2% 6.7% 18.2% 8.0% 22.1% 28.6% Kaxu 36.9% 27.6% 29.9% 50.0% 36.0% 48.7% 27.8% 27.5% 45.4% 37.3% 28.9% 8.6% 26.8% WIND2 Uruguay 31.2% 34.5% 42.3% 40.7% 37.2% 33.0% 36.3% 40.9% 38.0% 37.2% 34.6% 40.8% 40.6% SOLAR Historical Capacity Factors1 Capacity factor ratio represents actual electrical energy output over a given period of time to the maximum possible electrical energy output assuming continuous operation at full nameplate capacity over that period. Historical Capacity Factors are calculated from the date of entry into operation or the acquisition of each asset. Some capacity factors are not indicative of a full period of operations.Includes curtailment production in wind assets for which we receive compensation. HISTORICAL FINANCIAL REVIEWCapacity Factors
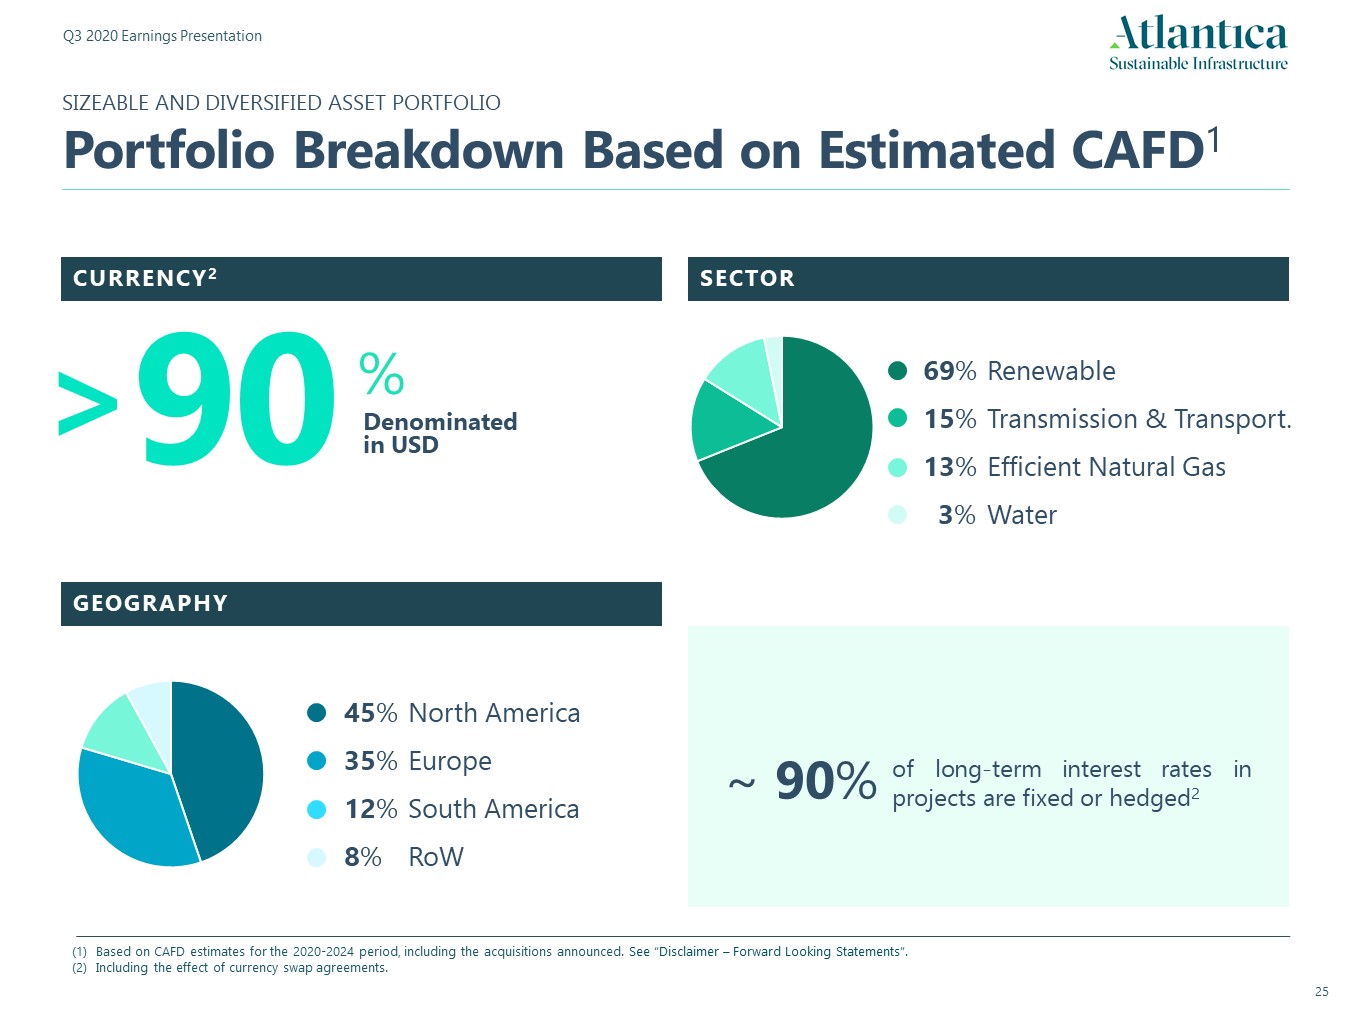
CURRENCY2 SECTOR GEOGRAPHY Based on CAFD estimates for the 2020-2024 period, including the acquisitions announced. See “Disclaimer – Forward Looking Statements”.Including the effect of currency swap agreements. of long-term interest rates in projects are fixed or hedged2 ~ 90% 90 Denominatedin USD % > 69% Renewable15% Transmission & Transport.13% Efficient Natural Gas 3% Water 45% North America35% Europe12% South America8% RoW SIZEABLE AND DIVERSIFIED ASSET PORTFOLIOPortfolio Breakdown Based on Estimated CAFD1
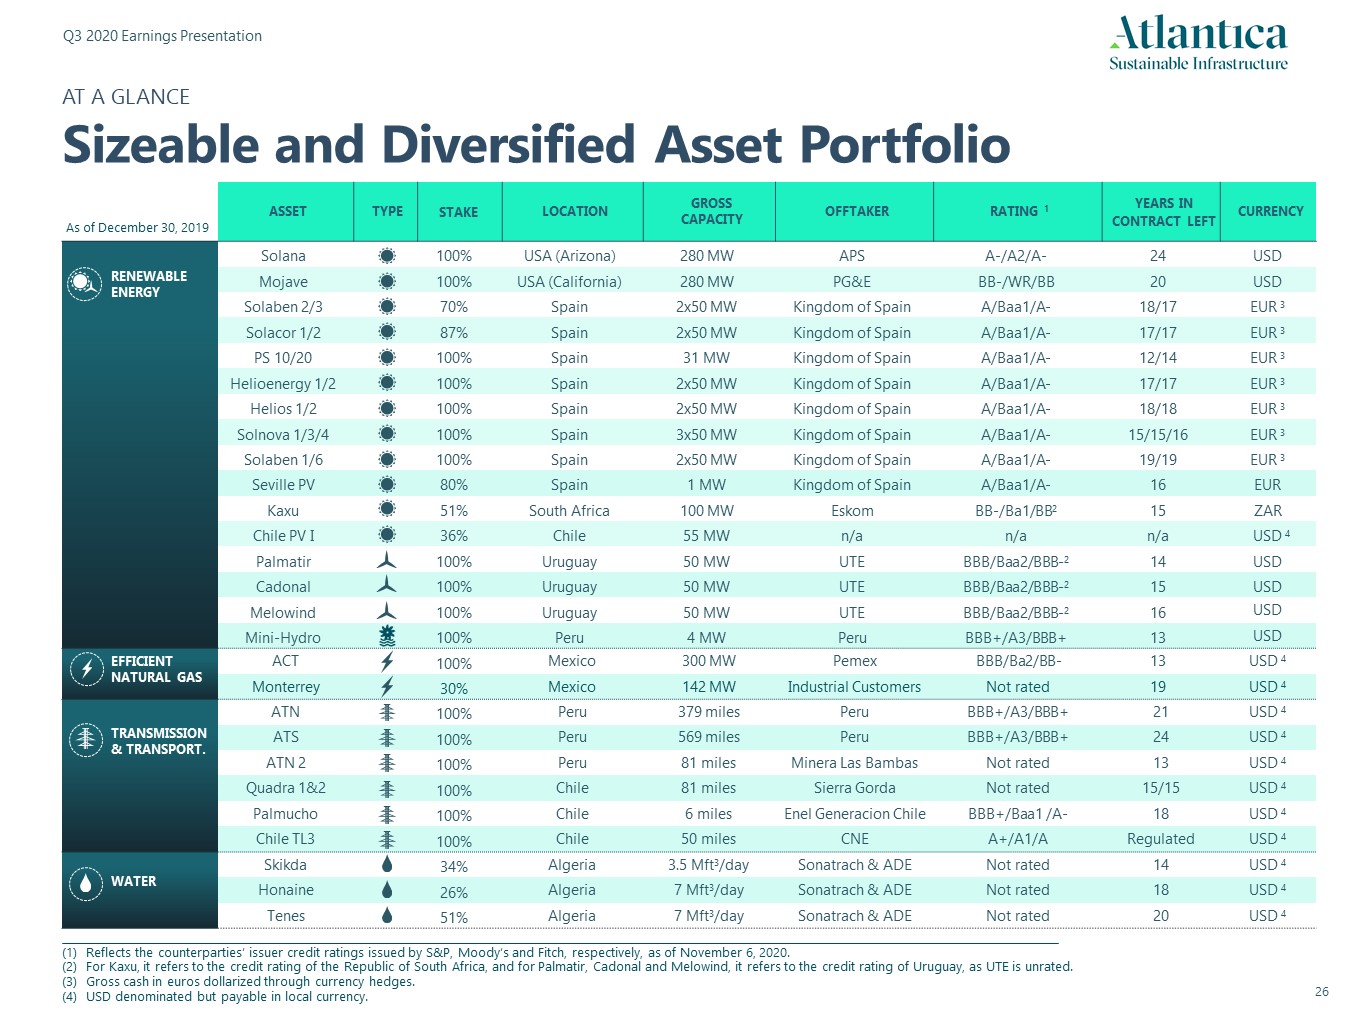
As of December 30, 2019 ASSET TYPE STAKE LOCATION GROSSCAPACITY OFFTAKER RATING 1 YEARS INCONTRACT LEFT CURRENCY RENEWABLE ENERGY Solana 100% USA (Arizona) 280 MW APS A-/A2/A- 24 USD Mojave 100% USA (California) 280 MW PG&E BB-/WR/BB 20 USD Solaben 2/3 70% Spain 2x50 MW Kingdom of Spain A/Baa1/A- 18/17 EUR 3 Solacor 1/2 87% Spain 2x50 MW Kingdom of Spain A/Baa1/A- 17/17 EUR 3 PS 10/20 100% Spain 31 MW Kingdom of Spain A/Baa1/A- 12/14 EUR 3 Helioenergy 1/2 100% Spain 2x50 MW Kingdom of Spain A/Baa1/A- 17/17 EUR 3 Helios 1/2 100% Spain 2x50 MW Kingdom of Spain A/Baa1/A- 18/18 EUR 3 Solnova 1/3/4 100% Spain 3x50 MW Kingdom of Spain A/Baa1/A- 15/15/16 EUR 3 Solaben 1/6 100% Spain 2x50 MW Kingdom of Spain A/Baa1/A- 19/19 EUR 3 Seville PV 80% Spain 1 MW Kingdom of Spain A/Baa1/A- 16 EUR Kaxu 51% South Africa 100 MW Eskom BB-/Ba1/BB2 15 ZAR Chile PV I 36% Chile 55 MW n/a n/a n/a USD 4 Palmatir 100% Uruguay 50 MW UTE BBB/Baa2/BBB-2 14 USD Cadonal 100% Uruguay 50 MW UTE BBB/Baa2/BBB-2 15 USD Melowind 100% Uruguay 50 MW UTE BBB/Baa2/BBB-2 16 USD Mini-Hydro 100% Peru 4 MW Peru BBB+/A3/BBB+ 13 USD EFFICIENT NATURAL GAS ACT 100% Mexico 300 MW Pemex BBB/Ba2/BB- 13 USD 4 Monterrey 30% Mexico 142 MW Industrial Customers Not rated 19 USD 4 TRANSMISSION & TRANSPORT. ATN 100% Peru 379 miles Peru BBB+/A3/BBB+ 21 USD 4 ATS 100% Peru 569 miles Peru BBB+/A3/BBB+ 24 USD 4 ATN 2 100% Peru 81 miles Minera Las Bambas Not rated 13 USD 4 Quadra 1&2 100% Chile 81 miles Sierra Gorda Not rated 15/15 USD 4 Palmucho 100% Chile 6 miles Enel Generacion Chile BBB+/Baa1 /A- 18 USD 4 Chile TL3 100% Chile 50 miles CNE A+/A1/A Regulated USD 4 WATER Skikda 34% Algeria 3.5 Mft3/day Sonatrach & ADE Not rated 14 USD 4 Honaine 26% Algeria 7 Mft3/day Sonatrach & ADE Not rated 18 USD 4 Tenes 51% Algeria 7 Mft3/day Sonatrach & ADE Not rated 20 USD 4 Reflects the counterparties’ issuer credit ratings issued by S&P, Moody’s and Fitch, respectively, as of November 6, 2020.For Kaxu, it refers to the credit rating of the Republic of South Africa, and for Palmatir, Cadonal and Melowind, it refers to the credit rating of Uruguay, as UTE is unrated.Gross cash in euros dollarized through currency hedges.USD denominated but payable in local currency. AT A GLANCESizeable and Diversified Asset Portfolio
NON-GAAP FINANCIAL INFORMATIONReconciliation of Non-GAAP Measures Our management believes Adjusted EBITDA including unconsolidated affiliates and CAFD are useful to investors and other users of our financial statements in evaluating our operating performance because it provides them with an additional tool to compare business performance across companies and across periods. Adjusted EBITDA is widely used by investors to measure a company’s operating performance without regard to items such as interest expense, taxes, depreciation and amortization, which can vary substantially from company to company depending upon accounting methods and book value of assets, capital structure and the method by which assets were acquired. Our management believes CAFD is a relevant supplemental measure of the Company’s ability to earn and distribute cash returns to investors and is useful to investors in evaluating our operating performance because securities analysts and other interested parties use such calculations as a measure of our ability to make quarterly distributions. In addition, CAFD is used by our management team for determining future acquisitions and managing our growth. Adjusted EBITDA and CAFD are widely used by other companies in the same industry. Our management uses Adjusted EBITDA and CAFD as measures of operating performance to assist in comparing performance from period to period on a consistent basis. They also readily view operating trends as a measure for planning and forecasting overall expectations, for evaluating actual results against such expectations, and for communicating with our board of directors, shareholders, creditors, analysts and investors concerning our financial performance.We present non-GAAP financial measures because we believe that they and other similar measures are widely used by certain investors, securities analysts and other interested parties as supplemental measures of performance and liquidity. The non-GAAP financial measures may not be comparable to other similarly titled measures employed by other companies and they may have limitations as analytical tools. These measures may not be fit for isolated consideration or as a substitute for analysis of our operating results as reported under IFRS as issued by the IASB. Non-GAAP financial measures and ratios are not measurements of our performance or liquidity under IFRS as issued by the IASB. Thus, they should not be considered as alternatives to operating profit, profit for the period, any other performance measures derived in accordance with IFRS as issued by the IASB, any other generally accepted accounting principles or as alternatives to cash flow from operating, investing or financing activities. Some of the limitations of these non-GAAP measures are:they do not reflect our cash expenditures, future requirements for capital expenditures or contractual commitments; they do not reflect changes in, or cash requirements for, our working capital needs;they may not reflect the significant interest expense, or the cash requirements necessary, to service interest or principal payments, on our debts;although depreciation and amortization are non-cash charges, the assets being depreciated and amortized will often need to be replaced in the future and Adjusted EBITDA and CAFD do not reflect any cash requirements that would be required for such replacements;some of the exceptional items that we eliminate in calculating Adjusted EBITDA reflect cash payments that were made, or will be made in the future; andthe fact that other companies in our industry may calculate Adjusted EBITDA and CAFD differently than we do, which limits their usefulness as comparative measures.
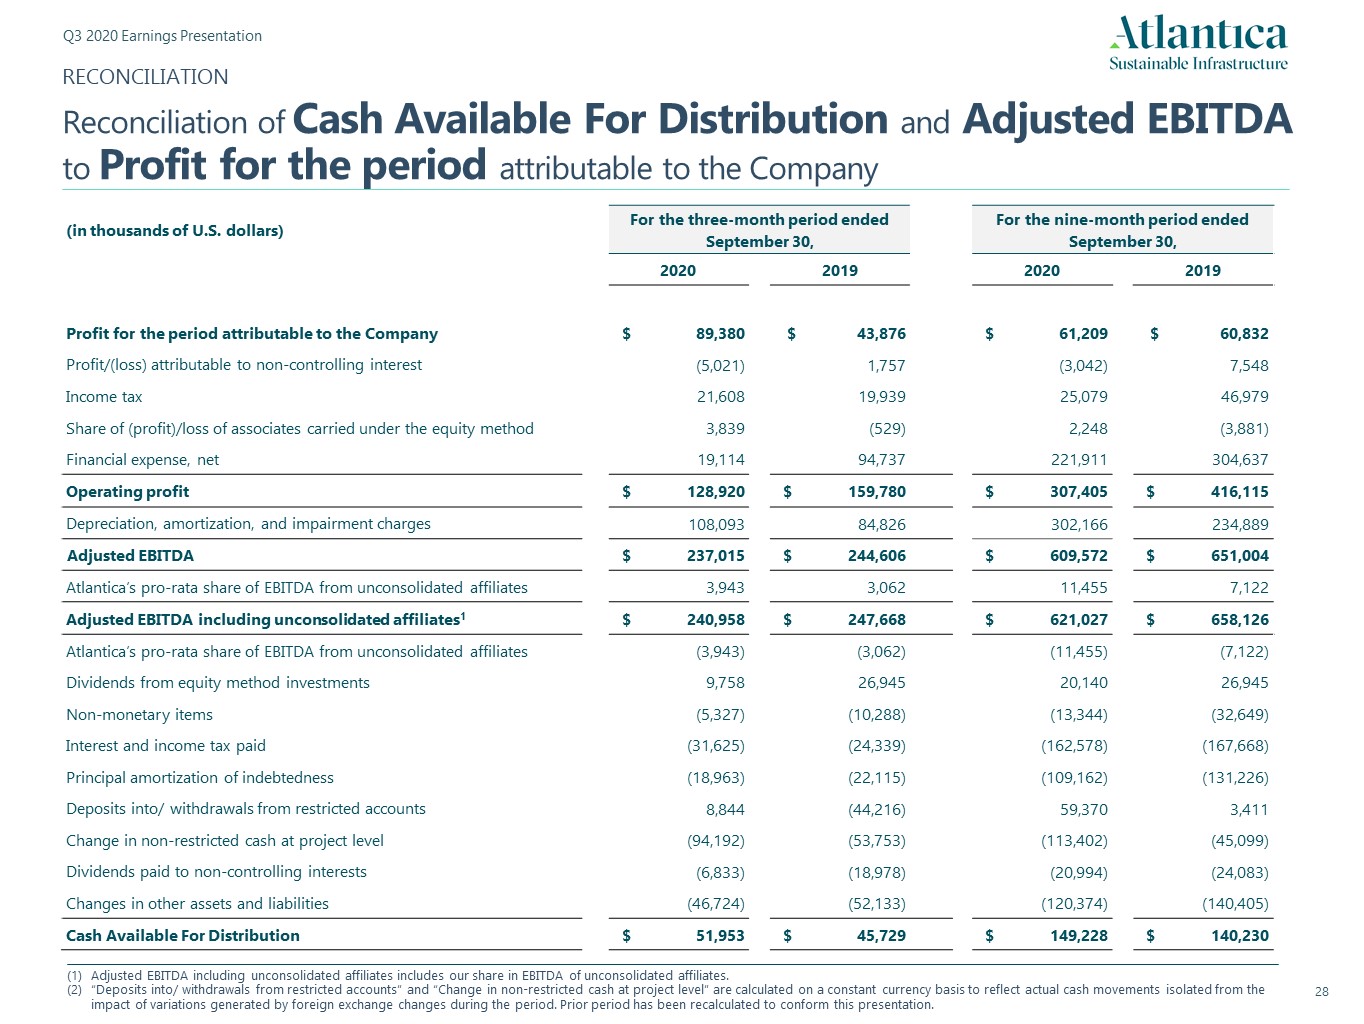
RECONCILIATIONReconciliation of Cash Available For Distribution and Adjusted EBITDA to Profit for the period attributable to the Company Adjusted EBITDA including unconsolidated affiliates includes our share in EBITDA of unconsolidated affiliates.“Deposits into/ withdrawals from restricted accounts” and “Change in non-restricted cash at project level” are calculated on a constant currency basis to reflect actual cash movements isolated from the impact of variations generated by foreign exchange changes during the period. Prior period has been recalculated to conform this presentation. (in thousands of U.S. dollars) For the three-month period ended September 30, For the nine-month period ended September 30, 2020 2019 2020 2019 Profit for the period attributable to the Company $ 89,380 $ 43,876 $ 61,209 $ 60,832 Profit/(loss) attributable to non-controlling interest (5,021) 1,757 (3,042) 7,548 Income tax 21,608 19,939 25,079 46,979 Share of (profit)/loss of associates carried under the equity method 3,839 (529) 2,248 (3,881) Financial expense, net 19,114 94,737 221,911 304,637 Operating profit $ 128,920 $ 159,780 $ 307,405 $ 416,115 Depreciation, amortization, and impairment charges 108,093 84,826 302,166 234,889 Adjusted EBITDA $ 237,015 $ 244,606 $ 609,572 $ 651,004 Atlantica’s pro-rata share of EBITDA from unconsolidated affiliates 3,943 3,062 11,455 7,122 Adjusted EBITDA including unconsolidated affiliates1 $ 240,958 $ 247,668 $ 621,027 $ 658,126 Atlantica’s pro-rata share of EBITDA from unconsolidated affiliates (3,943) (3,062) (11,455) (7,122) Dividends from equity method investments 9,758 26,945 20,140 26,945 Non-monetary items (5,327) (10,288) (13,344) (32,649) Interest and income tax paid (31,625) (24,339) (162,578) (167,668) Principal amortization of indebtedness (18,963) (22,115) (109,162) (131,226) Deposits into/ withdrawals from restricted accounts 8,844 (44,216) 59,370 3,411 Change in non-restricted cash at project level (94,192) (53,753) (113,402) (45,099) Dividends paid to non-controlling interests (6,833) (18,978) (20,994) (24,083) Changes in other assets and liabilities (46,724) (52,133) (120,374) (140,405) Cash Available For Distribution $ 51,953 $ 45,729 $ 149,228 $ 140,230

RECONCILIATIONReconciliation of Adjusted EBITDA including unconsolidated affiliates to Net Cash Provided by Operating Activities Adjusted EBITDA including unconsolidated affiliates includes our share in EBITDA of unconsolidated affiliates. (in thousands of U.S. dollars) For the three-month period ended September 30, For the nine-month period ended September 30, 2020 2019 2020 2019 Net cash provided by operating activities $ 154,835 $ 172,329 $ 303,242 $ 321,436 Net interest and income tax paid 31,625 24,339 162,578 167,668 Variations in working capital 44,921 40,124 128,926 132,051 Other non-cash adjustments and other 5,634 7,814 14,826 29,849 Adjusted EBITDA $ 237,015 $ 244,606 $ 609,572 $ 651,004 Atlantica’s pro-rata share of EBITDA from unconsolidated affiliates 3,943 3,062 11,455 7,122 Adjusted EBITDA including unconsolidated affiliates1 $ 240,958 $ 247,668 $ 621,027 $ 658,126
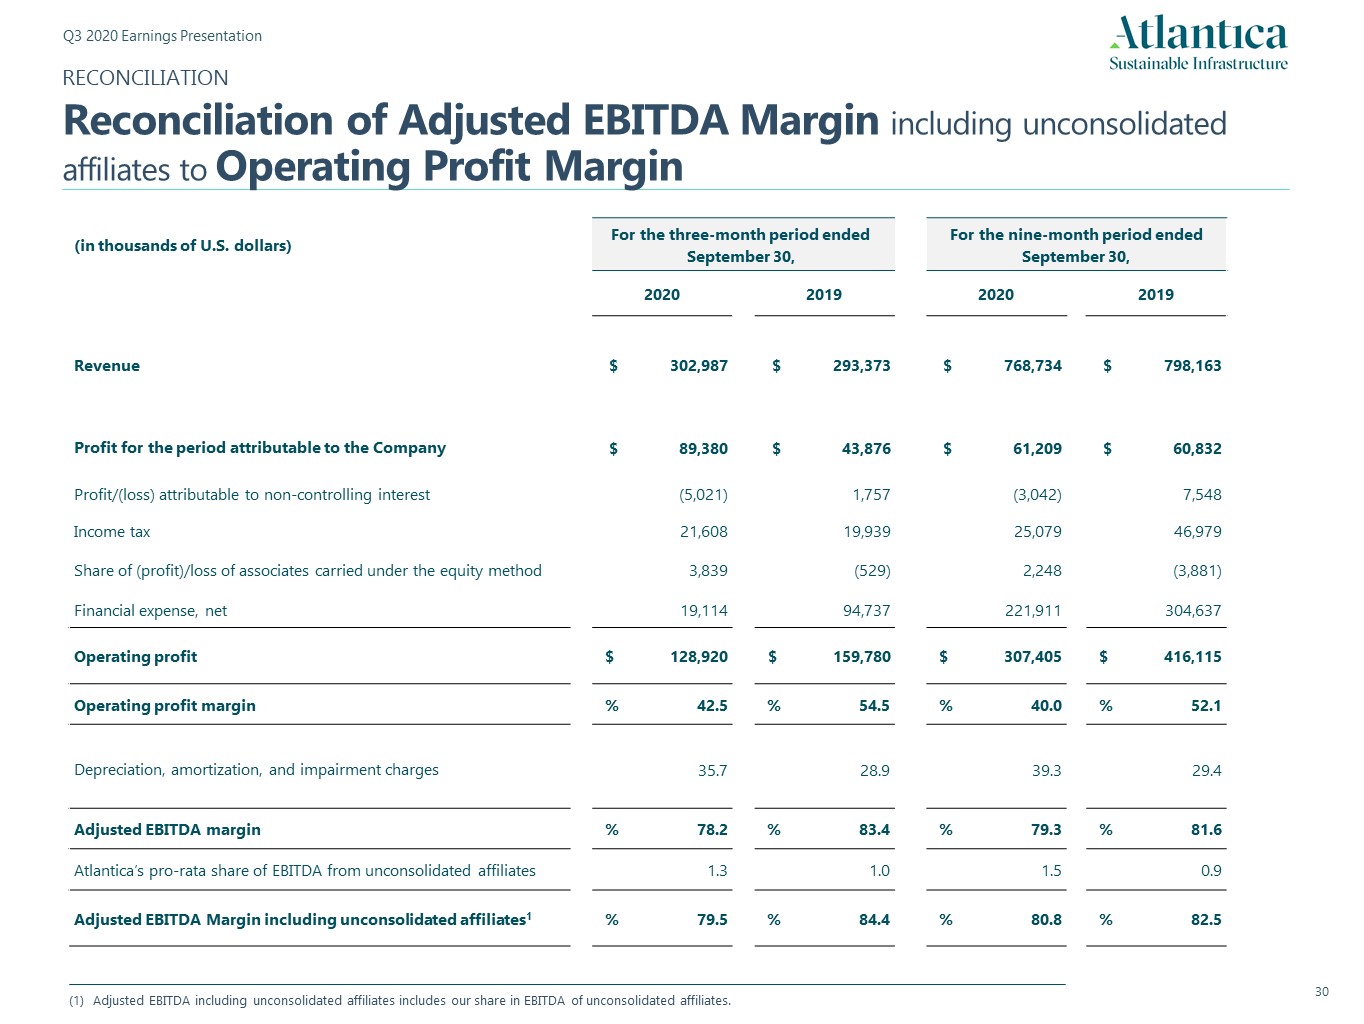
RECONCILIATIONReconciliation of Adjusted EBITDA Margin including unconsolidated affiliates to Operating Profit Margin Adjusted EBITDA including unconsolidated affiliates includes our share in EBITDA of unconsolidated affiliates. (in thousands of U.S. dollars) For the three-month period ended September 30, For the nine-month period ended September 30, 2020 2019 2020 2019 Revenue $ 302,987 $ 293,373 $ 768,734 $ 798,163 Profit for the period attributable to the Company $ 89,380 $ 43,876 $ 61,209 $ 60,832 Profit/(loss) attributable to non-controlling interest (5,021) 1,757 (3,042) 7,548 Income tax 21,608 19,939 25,079 46,979 Share of (profit)/loss of associates carried under the equity method 3,839 (529) 2,248 (3,881) Financial expense, net 19,114 94,737 221,911 304,637 Operating profit $ 128,920 $ 159,780 $ 307,405 $ 416,115 Operating profit margin % 42.5 % 54.5 % 40.0 % 52.1 Depreciation, amortization, and impairment charges 35.7 28.9 39.3 29.4 Adjusted EBITDA margin % 78.2 % 83.4 % 79.3 % 81.6 Atlantica’s pro-rata share of EBITDA from unconsolidated affiliates 1.3 1.0 1.5 0.9 Adjusted EBITDA Margin including unconsolidated affiliates1 % 79.5 % 84.4 % 80.8 % 82.5
Great West House, GW1, 17th floor,Great West RoadBrentford TW8 9DFLondon (United Kingdom)
SIGNATURES
Pursuant to the requirements of the Securities Exchange Act of 1934, the Registrant has duly caused this report to be signed on its behalf by the undersigned, thereunto duly authorized.
Atlantica Sustainable Infrastructure plc | |||
Date: November 6, 2020 | By: | /s/ Santiago Seage | |
Name: | Santiago Seage | ||
Title: | Chief Executive Officer | ||